Article

Study on Process Optimization of Sprayable Powders and Deposition Performance of Amorphous Al2O3–YAG Coatings

1
The Key Laboratory of Inorganic Coating Materials CAS, Shanghai Institute of Ceramics, Chinese Academy of Science, Shanghai 201899, China
2
School of Chemistry and Materials Science, Shanghai Normal University, Shanghai 200234, China
*
Author to whom correspondence should be addressed.
Coatings 2020, 10(12), 1158; https://doi.org/10.3390/coatings10121158
Submission received: 9 November 2020 / Revised: 21 November 2020 / Accepted: 25 November 2020 / Published: 27 November 2020

Abstract

:
In this study, the process optimization of sprayed powders and deposition performance for amorphous Al2O3–Y3Al5O12 (YAG) coatings was investigated. The solid-state reaction mechanism of the nano-sized Al2O3 and Y2O3 powders with eutectic molar ratio was studied by multiple step-by-step heating cycle calcination processes. The calcination process could be adjusted according the dominant control factors like chemical reaction rate or ion diffusion rate. Finally, the actual deposition performance of the calcined powders (Al2O3/YAG) was examined by atmospheric plasma spraying (APS). XRD, SEM and DTA were used to characterize the powders and the as-sprayed coatings. The results showed that the reaction of Al2O3–Y2O3 system is a high temperature solid reaction dominated by Al3+ diffusion, the initial reaction process was usually belong to chemical kinetic range, then the reaction will be transformed from chemical kinetic range to diffusion dynamic range with the temperature increasing. The process optimization of powders was very effective, and the deposition effect of coating was effective.

1. Introduction

Y3Al5O12 (YAG) with garnet structure formed by the reaction of Al2O3 and Y2O3 is a kind of composite oxide, which is mainly used to prepare phosphors, laser crystals, etc. It is also widely applied in the field of military, industrial and medical industries [1,2,3,4]. In previous studies [5,6,7,8], the atmospheric plasma spraying with high enthalpy and rapid cooling rate was used to prepare Al2O3–YAG amorphous ceramic coatings. The as-sprayed coatings are mainly composed of amorphous phases, and some crystalline grains were distributed in the coating. This kind of coating has excellent thermo-mechanical performance. The YAG phase has excellent high temperature creep resistance [8,9,10], and similar linear expansion coefficient with α-Al2O3 [11]. The initial crystallization temperature of the amorphous coating is as high as 876.3 °C, which is much higher than that of the commonly used amorphous alloy coatings [12,13,14], such as Fe-based, Co-based and Ni-based amorphous coatings. The Al2O3–YAG coating has good structural stability in a wide temperature range. At the same time, due to the unique amorphous structure in the coatings, it is predicted that the coatings may have significant potential application under wear and corrosion resistance conditions by controlling the content of amorphous phase. At present, this system of coatings is very novel, with less related research. In order to improve the properties of Al2O3–YAG amorphous ceramic coatings, the first goal is to produce sprayable powders, which is as important as the selection of spray parameters.
This study mainly investigated the process optimization of Al2O3/YAG powders and deposition performance of coatings. On basis of existing research, the preparation methods of YAG powders mainly include the coprecipitation method, the sol-gel method and the solid-state reaction method, etc. [15,16,17,18]. The reaction mechanism of the first two methods has been explored in detail. However, the mechanism of solid-state reaction for YAG powder is rarely reported. Although requiring a higher temperature for YAG phase formation, solid-phase-reacted powders have an advantage in process scalability and a lower cost than the powders prepared by the coprecipitation and sol-gel methods. Most studies have reported the relationship between phase composition and phase selection of the solid reaction in Al2O3–Y2O3 system [19,20,21,22]. Nevertheless, the solid-state reaction process of Al2O3–Y2O3 is complex, and it is difficult to determine the kinetic parameters. For this reason, there is not yet a clear explanation of the solid-state reaction mechanism of Al2O3–Y2O3 system. In any case, it is certain that the reaction between Al2O3 and Y2O3 is not a one-step process to form YAG, and intermediate products also exist in the reaction process. The sequence of the products is as follows: Y4Al2O9 (YAM, monoclinic system), YAlO3 (YAP, orthorhombic system) and Y3Al5O12 (YAG, cubic system) [23,24].
In this paper, the nano-sized Al2O3 and Y2O3 powders were used as the raw materials. The solid reaction mechanism of Al2O3–Y2O3 system was studied by a multiple step-by-step heating cycle calcination process. According to the actual control factors of the process, the calcination process was optimized to obtain the sprayable Al2O3/YAG composite powders for producing amorphous ceramic coatings.

2. Materials and Methods

2.1. Materials and Preparation

In this study, nano-sized Al2O3 (D50 = 76.4 nm, Wuxi Tuoboda Titanium dioxide products Co., Ltd., Wuxi, China) and Y2O3 powders (D50 = 74.2 nm, Ganzhou Jiayuan New material Co., Ltd., Ganzhou, China) were used as raw materials. The nano-sized powders are light in weight and easy to agglomerate, so the fluidity of the powders is poor in the gas-solid two-phase flow of atmospheric plasma spraying. Therefore, the powders need to be pre-treated by spray granulation. The nano-sized powders were mixed according to eutectic molar ratio of Al2O3/Y2O3, which was equal to 82:18. The alumina grinding balls were used to grind the mixture according to the ratio of grinding ball: materials: deionized water = 4:1:2 (mass ratio) for 10 h. After that, the dispersant (oleic acid, 1 vol.%) and the binder (polyvinyl alcohol, 5 vol.%) were also added to the mixture, to obtain a uniformly distributed suspension. Then spray granulation was carried out (LDZ-25 type spray dryer, Wuxi Dongsheng spray granulation drying machine factory, Wuxi, China). The conveying pressure of suspension was 2 MPa and the feeding rate of suspension was 1–1.2 kg/h. The air inlet temperature was 220–240 °C, and the outlet temperature was 120–130 °C. The morphologies of spray granulation powders is shown in Figure 1. In order to prepare pure Al2O3–YAG amorphous ceramic coatings, the granulation powders were gradually heated and calcined for many times at different temperatures, to ensure the finial powders were Al2O3 and YAG. The high temperature furnace (DLH17/20 Shanghai Degong Industrial Co., Ltd., Shanghai, China) was used to prepare the calcination process. Multiple step-by-step heating cycle calcination process were utilized to calcine powders. The initial calcined process steps of the powders are as follows:
(1)
The powders were heated from room temperature to 400 °C and kept for 4 h, and then cooled with the furnace in order to remove the binder in the powders;
(2)
Heating the powders from step (1) to T1 temperature, the calcination time was t, then cooling along with the furnace, observing whether sintered blocks existed, and ground manually (T1 = 900 °C, t = 2 h);
(3)
Repeating step (2) at least N−1 times for the obtained calcined powders, the calcination temperature for the Nth calcination treatment set to TN, and TN = TN−1 + 100 °C until TN is 1500 °C (N ≥ 2). Finally, the powders were sieved to obtain the Al2O3–YAG composite powders with particle sizes ranging from 25 to 48 μm.
After being calcined, the powders at different temperatures were characterized. Simultaneously, the solid-state reaction mechanism of powders was investigated. In the light of mechanism, the calcination process was optimized. The resulting powders were deposited by the Multi-Coat atmospheric plasma spraying system equipped with an F4MB-XL gun (Sulzer Metco AG, Wohlen, Switzerland). The spraying parameters are shown in Table 1. Prior to spraying, the stainless-steel substrates (1Cr18Ni9Ti) with dimensions of 30 × 15 × 1.25 mm3 were sandblasted with corundum (Ra = 6–8 μm), to establish good interfacial bonding between the substrates and the coatings. NiCr bond coatings were sprayed to reduce thermal mismatch between the substrates and the ceramic coatings.

2.2. Specimens Characterization

The morphologies of powders and coatings were analyzed by SEM (TM3000, HITACH, Tokyo, Japan) with EDS. The phase compositions of the powders and coatings were determined by XRD (D/Max-2550, Rigaku, Tokyo, Japan) using Cu Kα radiation (40 kV, 40 mA) in the 2θ range of 10°–100°, the scanning speed was 2°/min. The amorphous content of coatings was calculated by Equation (1) as a reference for comparison. Thermal analysis of granulation powders was performed by thermal analysis-mass spectrometry-infrared spectroscopy (Thermo Fisher/STA449F3 + QMS403D + NicoletiS50, Netzsch, Bavaria, Germany). DTA tests were carried out on the granulated powders for three times in air atmosphere. The heating rates were 5, 10 and 15 °C/min, respectively. Vickers microhardness measurements were performed on the polished cross-section of coating using an Wilson-Wolpert Tukon 2100B Hardness Tester (Instron, New York, NY, USA) under the load of 200 g with a dwell time 10 s, the coatings microhardness represented the average value of 10 indentations. The porosity of the coatings was estimated by Image analysis method, and the value was the average porosity values of 20 morphologies (×1.0 k).
Amorphous   content   =   1     The   integral   area   of   the   crystallization   peak Total   area   of   integration

3. Results

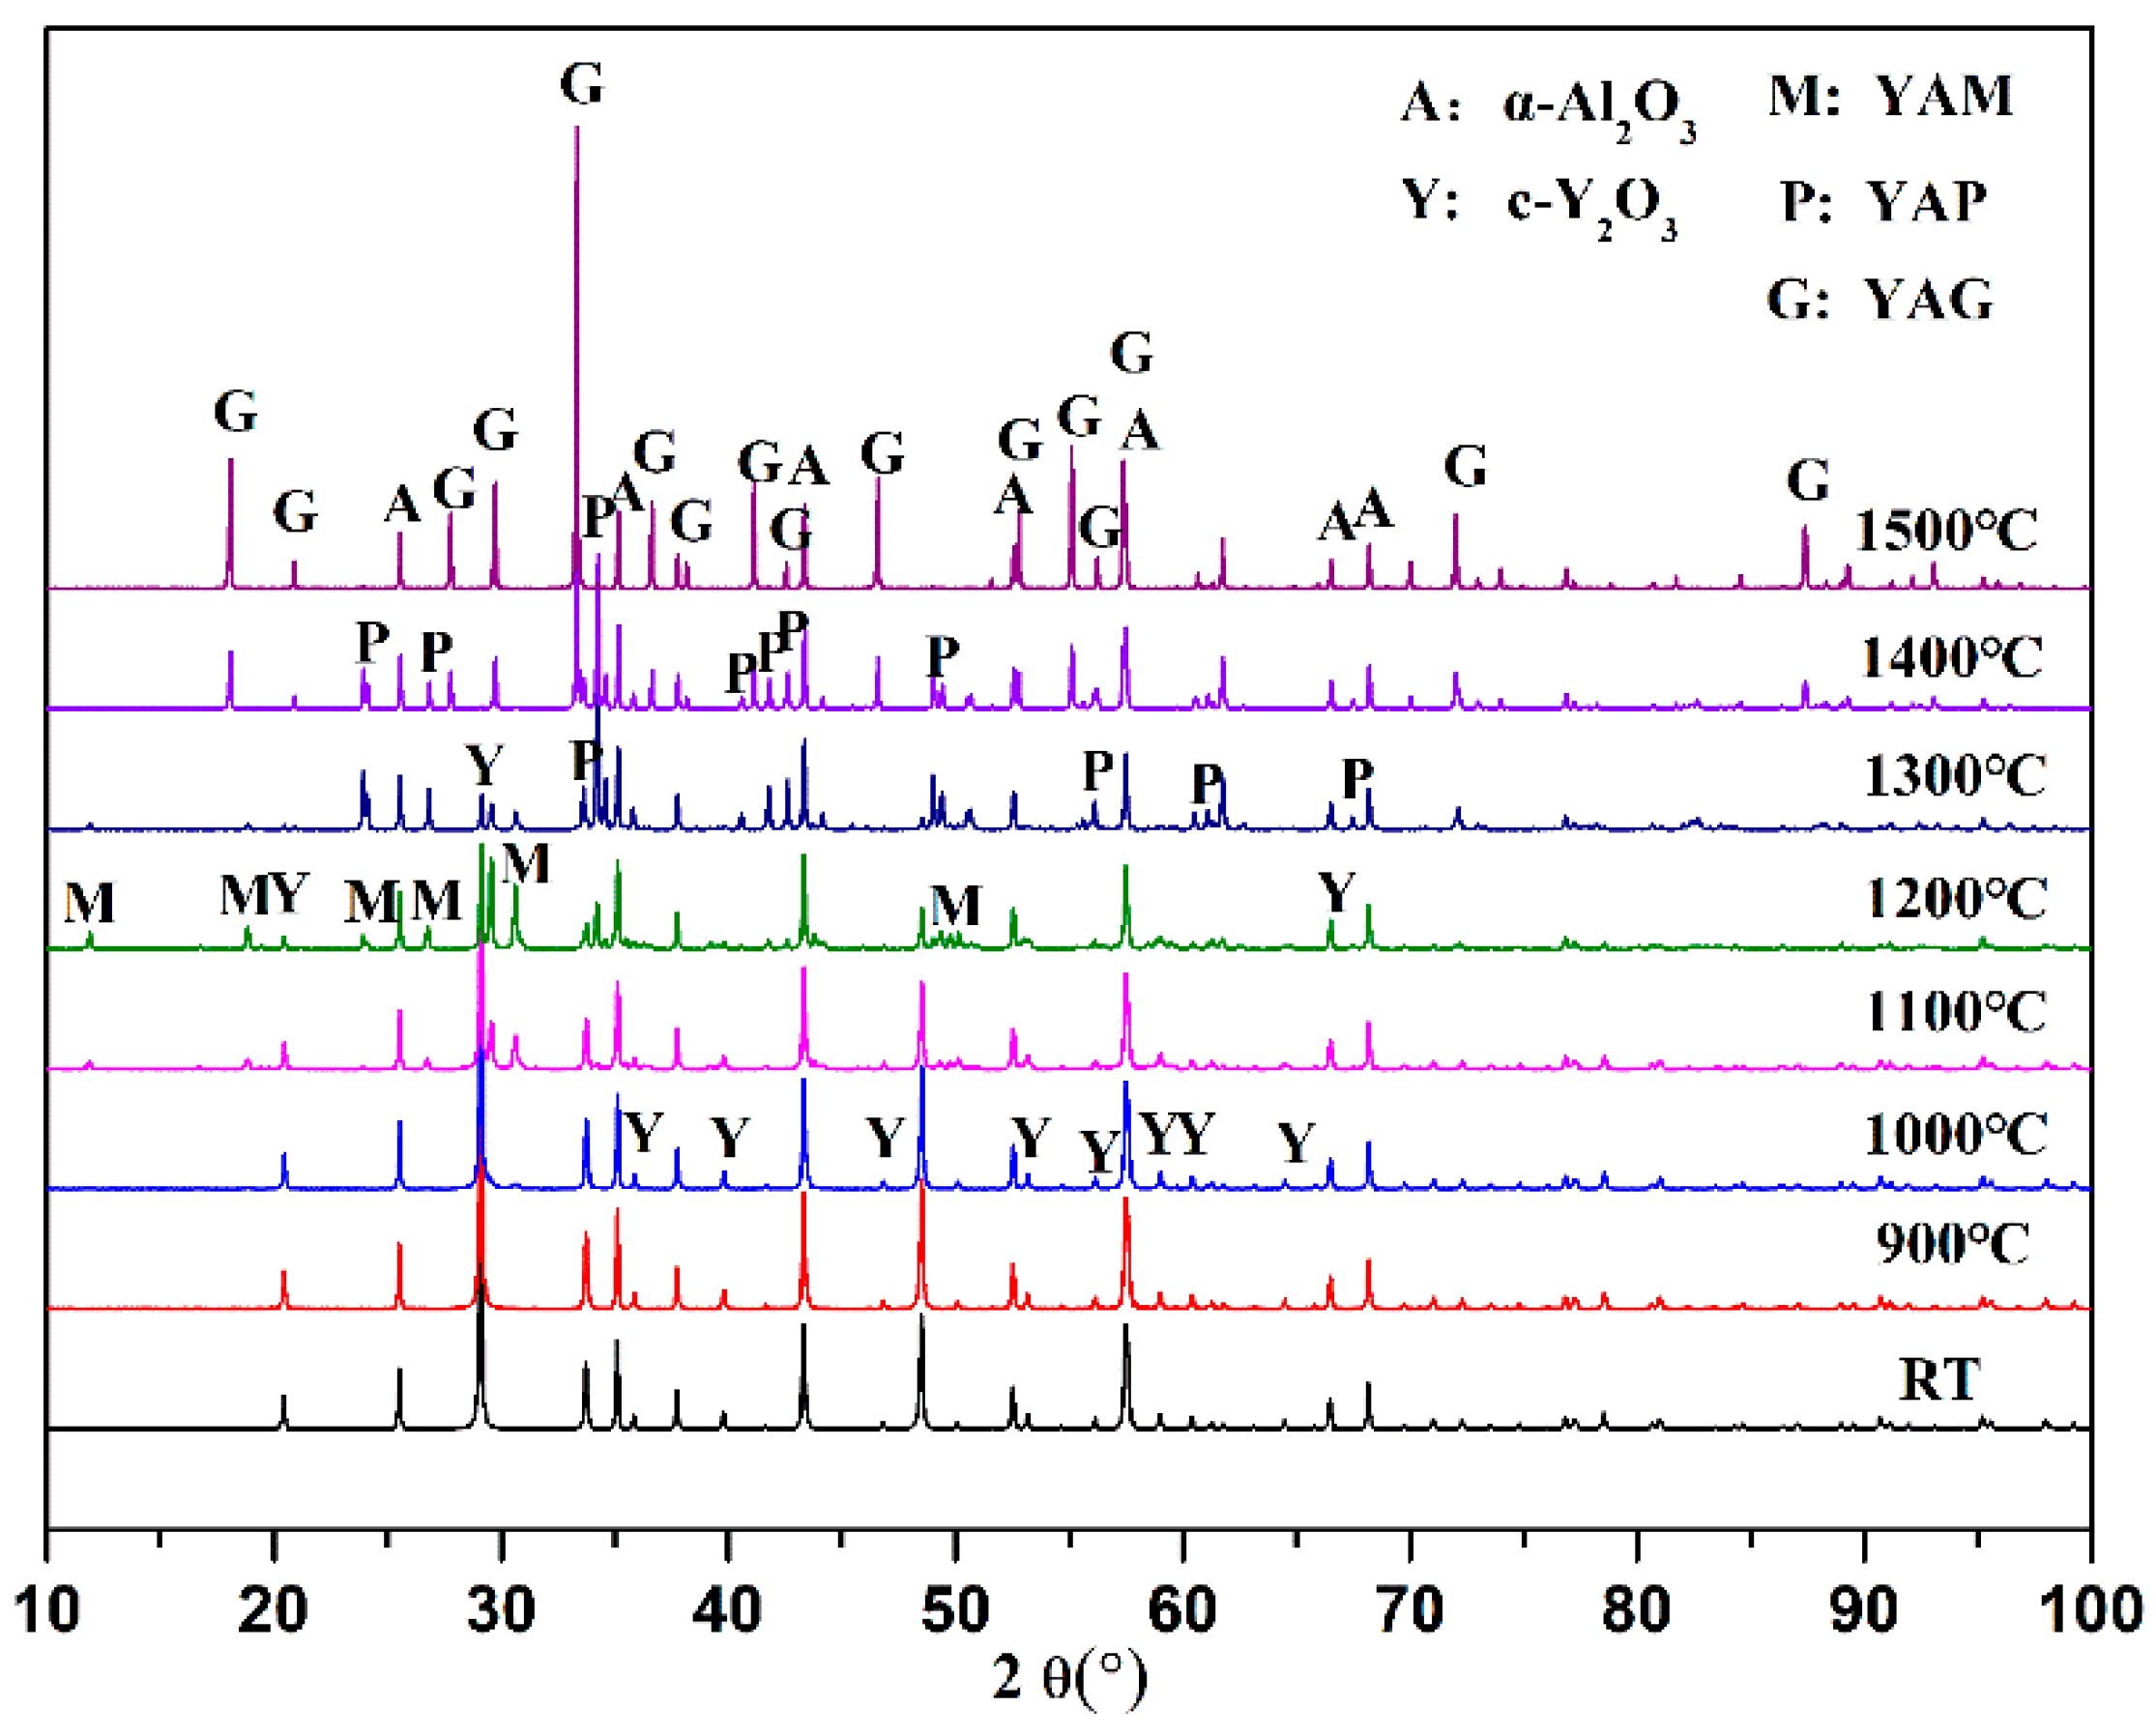
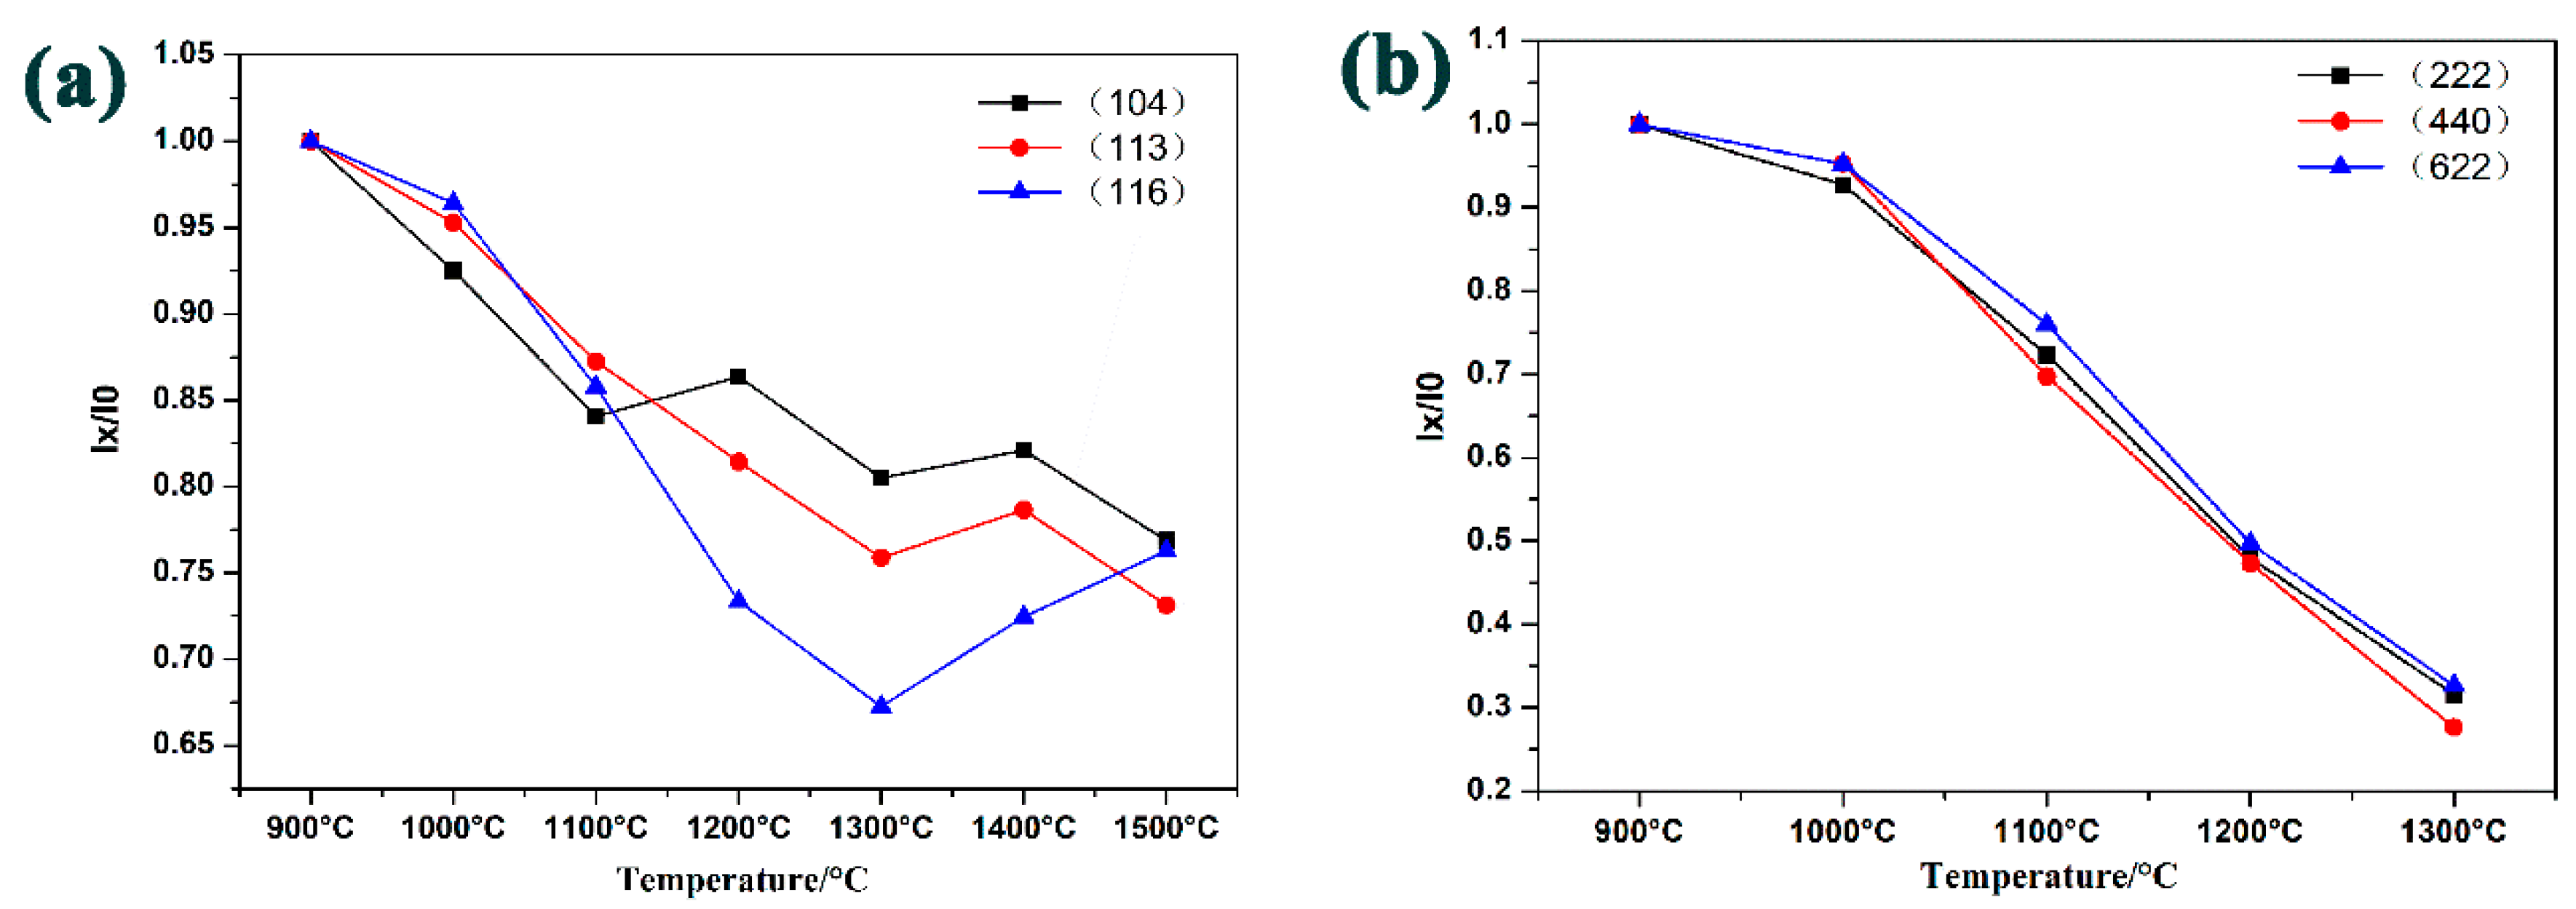
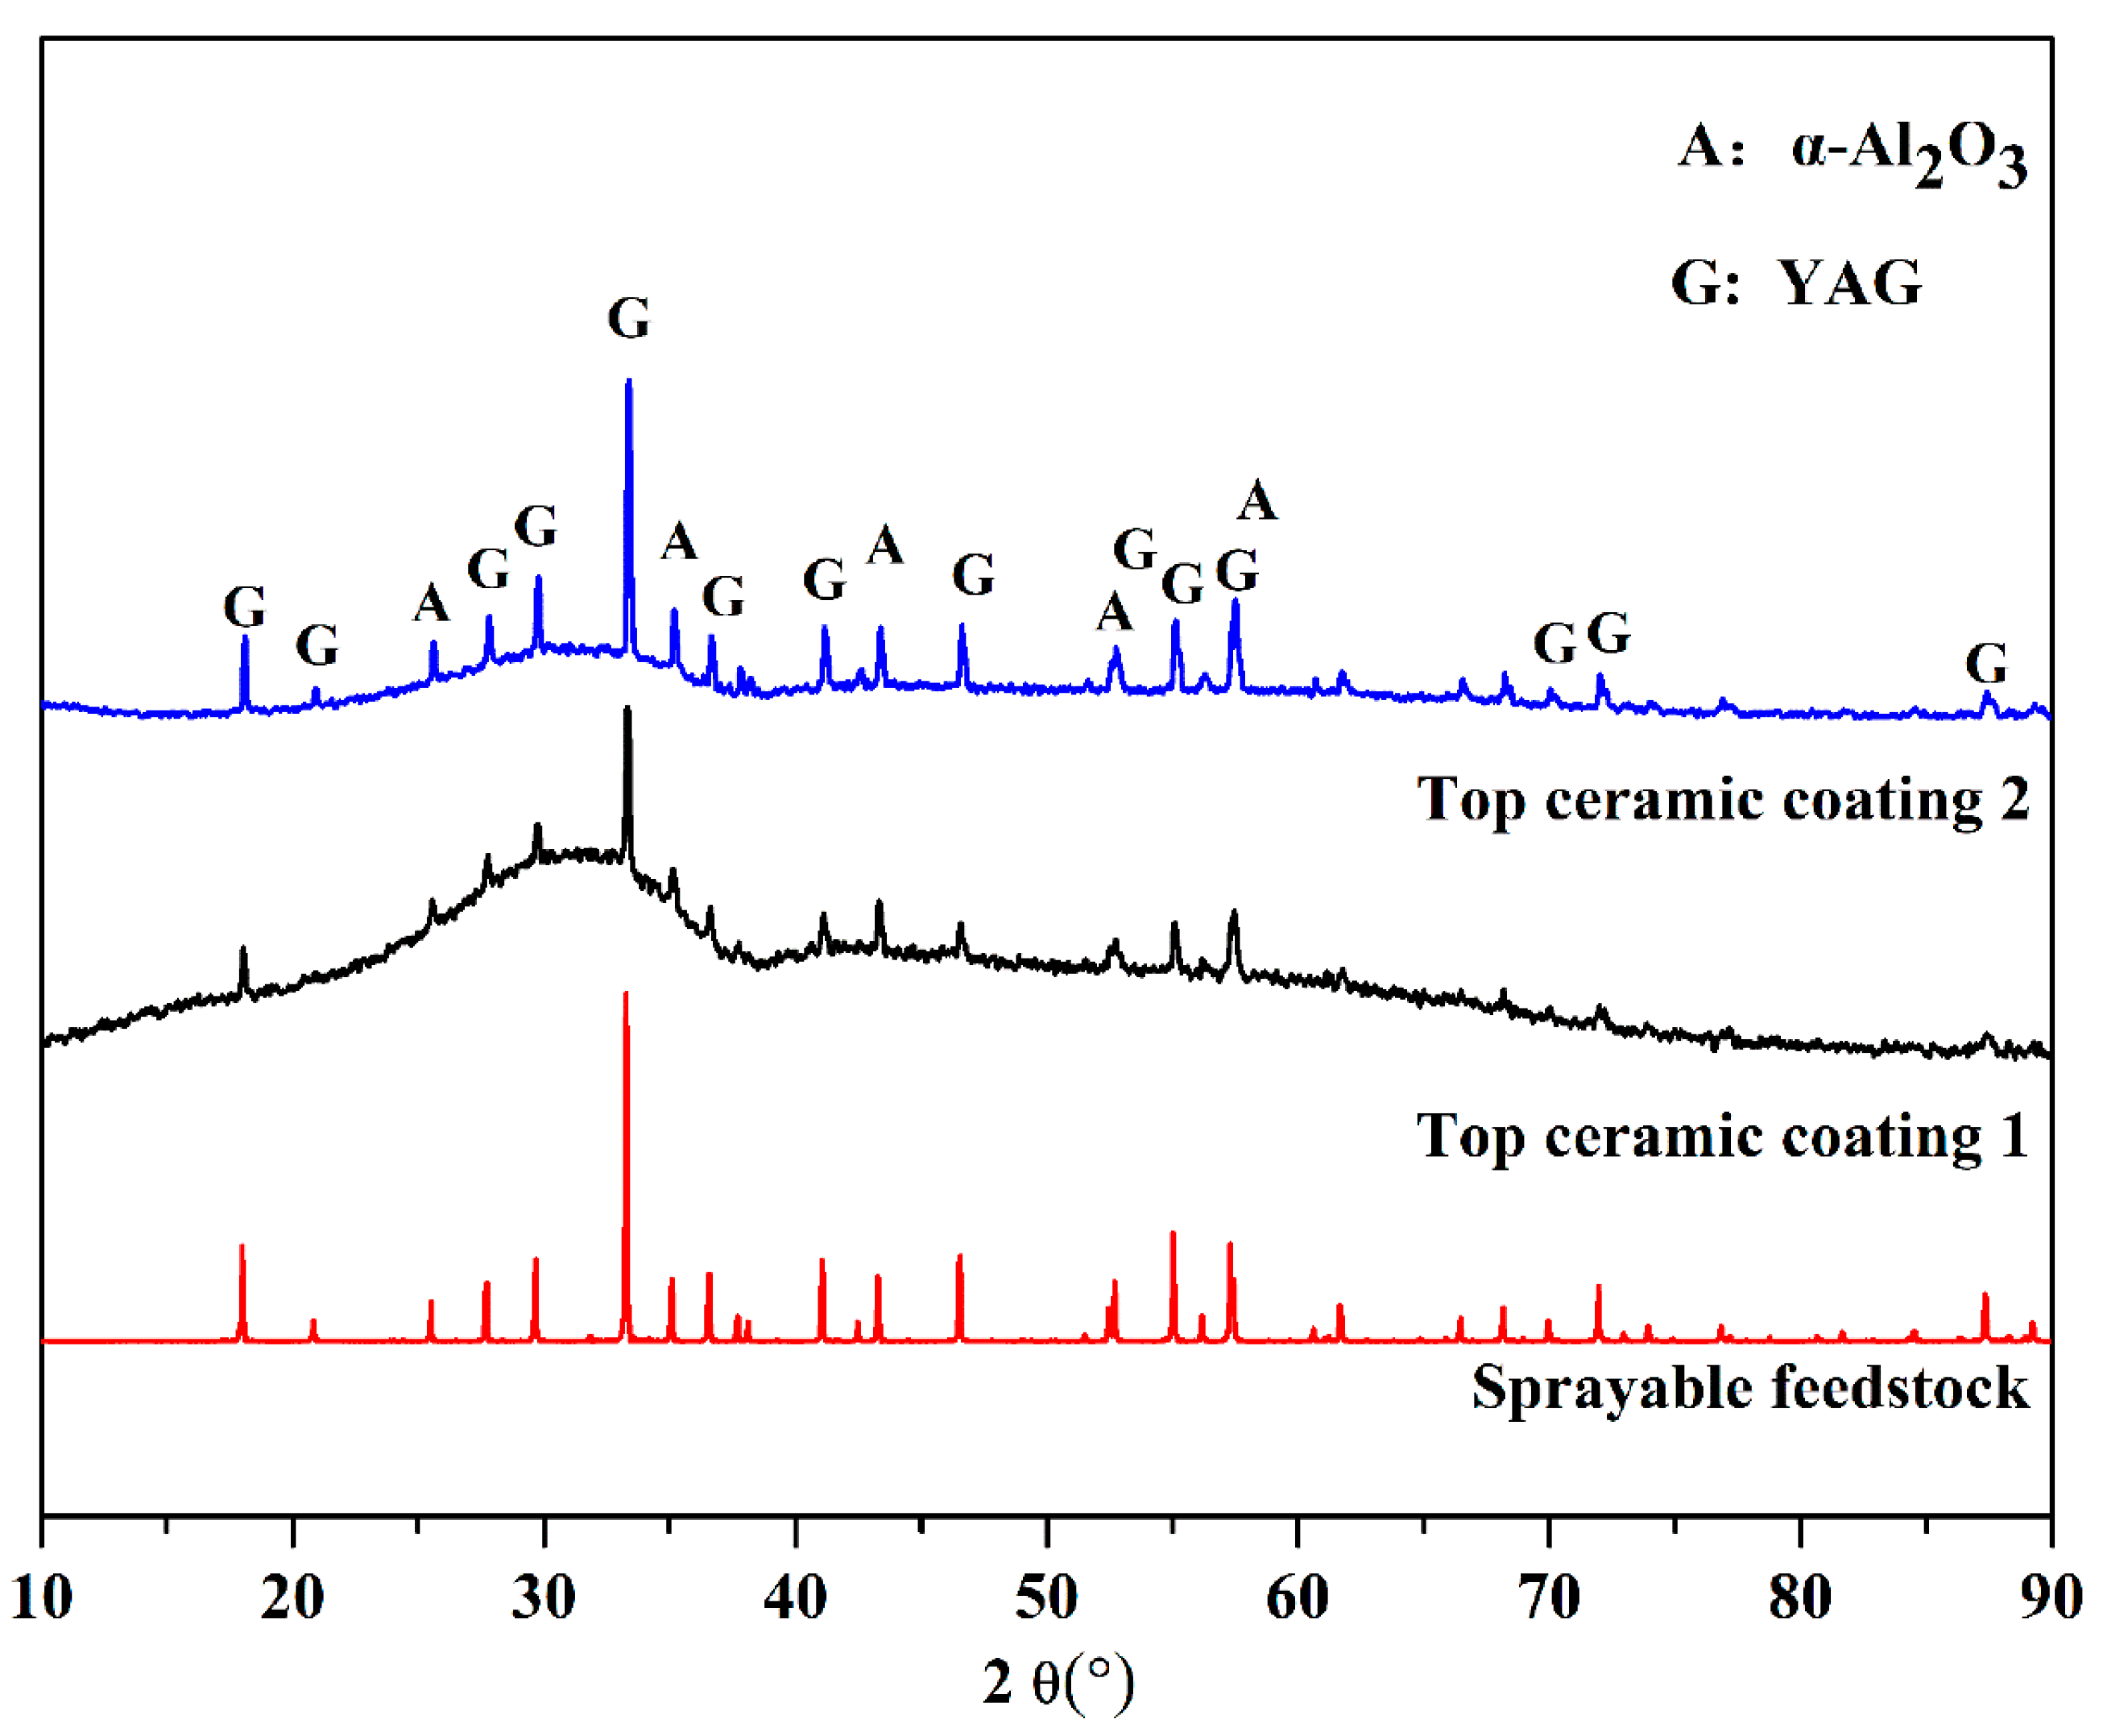
3.1. Phase Composition Analysis

Figure 2 shows the XRD patterns of spray granulation Al2O3–Y2O3 powders and calcinated powders at different temperatures for 2 h. There are five kinds of phases in the whole calcined treatment process. In addition to the initial α-Al2O3 and c-Y2O3, there were three new phases, namely YAM (PDF:14-0475) in the monoclinic system, YAP (PDF:33-0041) in the orthorhombic system and YAG (PDF:33-0040) in the cubic system. The YAM phase was observed in 1000–1200 °C, the YAP phase occurred at 1200–1400 °C, and the YAG phase appeared above 1400 °C. Among them, YAM become the major new phase at 1200 °C, YAP grew the major new phase at 1300 °C, and YAG transformed the major new phase at 1500 °C. Each newly formed phase has a specific temperature range. This phenomenon indicates that the temperature dominates the solid phase reaction process. The solid-state reaction of the whole calcined treatment process can be summarized as follows:
Al 2 O 3   +   2 Y 2 O 3   1000 ° C 1200 ° C   YAM
Al 2 O 3   +   YAM   1200 ° C 1400 ° C   4 YAP
Al 2 O 3   +   3 YAP   1400 ° C   YAG
In addition, it can be seen from Figure 3 that the diffraction intensity of the three strong peaks of α-Al2O3 and c-Y2O3 phases obviously reduced with the increase of temperature. Especially the three strong peaks of α-Al2O3 diffraction show non-synchronous attenuation. This phenomenon may be caused by the low symmetry of α-Al2O3 in rhombohedral system. α-Al2O3 had obvious characteristics of diffusion along the crystal orientations at high temperature, and possessed a faster diffusion rate on the (116) crystal-plane in 1100–1300 °C. Hence the interforce of (116) crystal-plane may be smaller than that of other crystal planes in Figure 3a. The c-Y2O3 of cubic crystal system has high symmetry, so the diffusion rate of c-Y2O3 was not obvious different in various crystal orientations. As is known, the intensity of different peaks is formed by the interference of X-rays on all crystal planes of the sample, which is related to the number of crystal planes. Therefore, the major diffusion ions of solid-state reaction can be roughly quantitatively analyzed by calculating the decrement of each crystal plane (D) according to the Equation (5):
D   =   M x   *   ( 1     I y I 900   )
where Mx represents the molar of reactant Al2O3/Y2O3, I is the intensity of crystal plane, y is the calcination temperature (1000, 1100, 1200 and 1300 °C).
Table 2 reveals the decrement of each crystal plane in terms to Equation (5). Combined with the stoichiometric ratio of the main new phases Al2Y4O9 (YAM) and AlYO3(YAP) produced in the powders below 1300 °C, it can be found that the amount of Al atoms needed for the reaction were far less than that produced by the breakage of α-Al2O3 lattice. For example, when the reaction temperature was 1200 °C, the YAM phase mainly exists (Al/Y = 1/2), but the amount of α-Al2O3 crystal plane breaking was about 11.18(104), and c-Y2O3 was approximately 9.06(622). When the reaction temperature reached 1300 °C, the YAP phase mainly exists (Al/Y = 1), but the crystal plane breaking of α-Al2O3 was around 15.99(104) and c-Y2O3 was probably 12.13(622). Consequently, Al ions were obviously excessive in the early stage of solid-state reaction, and a large number of ionic defects may exist in the powders at this time. Beyond that, because the radius of Al3+ was smaller, Al3+ was easier to diffuse compared with Y3+. When the temperature exceeds 1300 °C, the increase of the diffraction intensity in Figure 3a was due to the reduction of the interface energy and the increased number of crystal plane, caused by the sintering of Al2O3. In addition, because the normal force of crystal direction (116) may be relatively small compared with other crystal planes, the diffusion ions along this crystal plane are larger than the diffusion ions needed for the actual solid-state reaction. Therefore, excess Al ions would to re-form α-Al2O3.

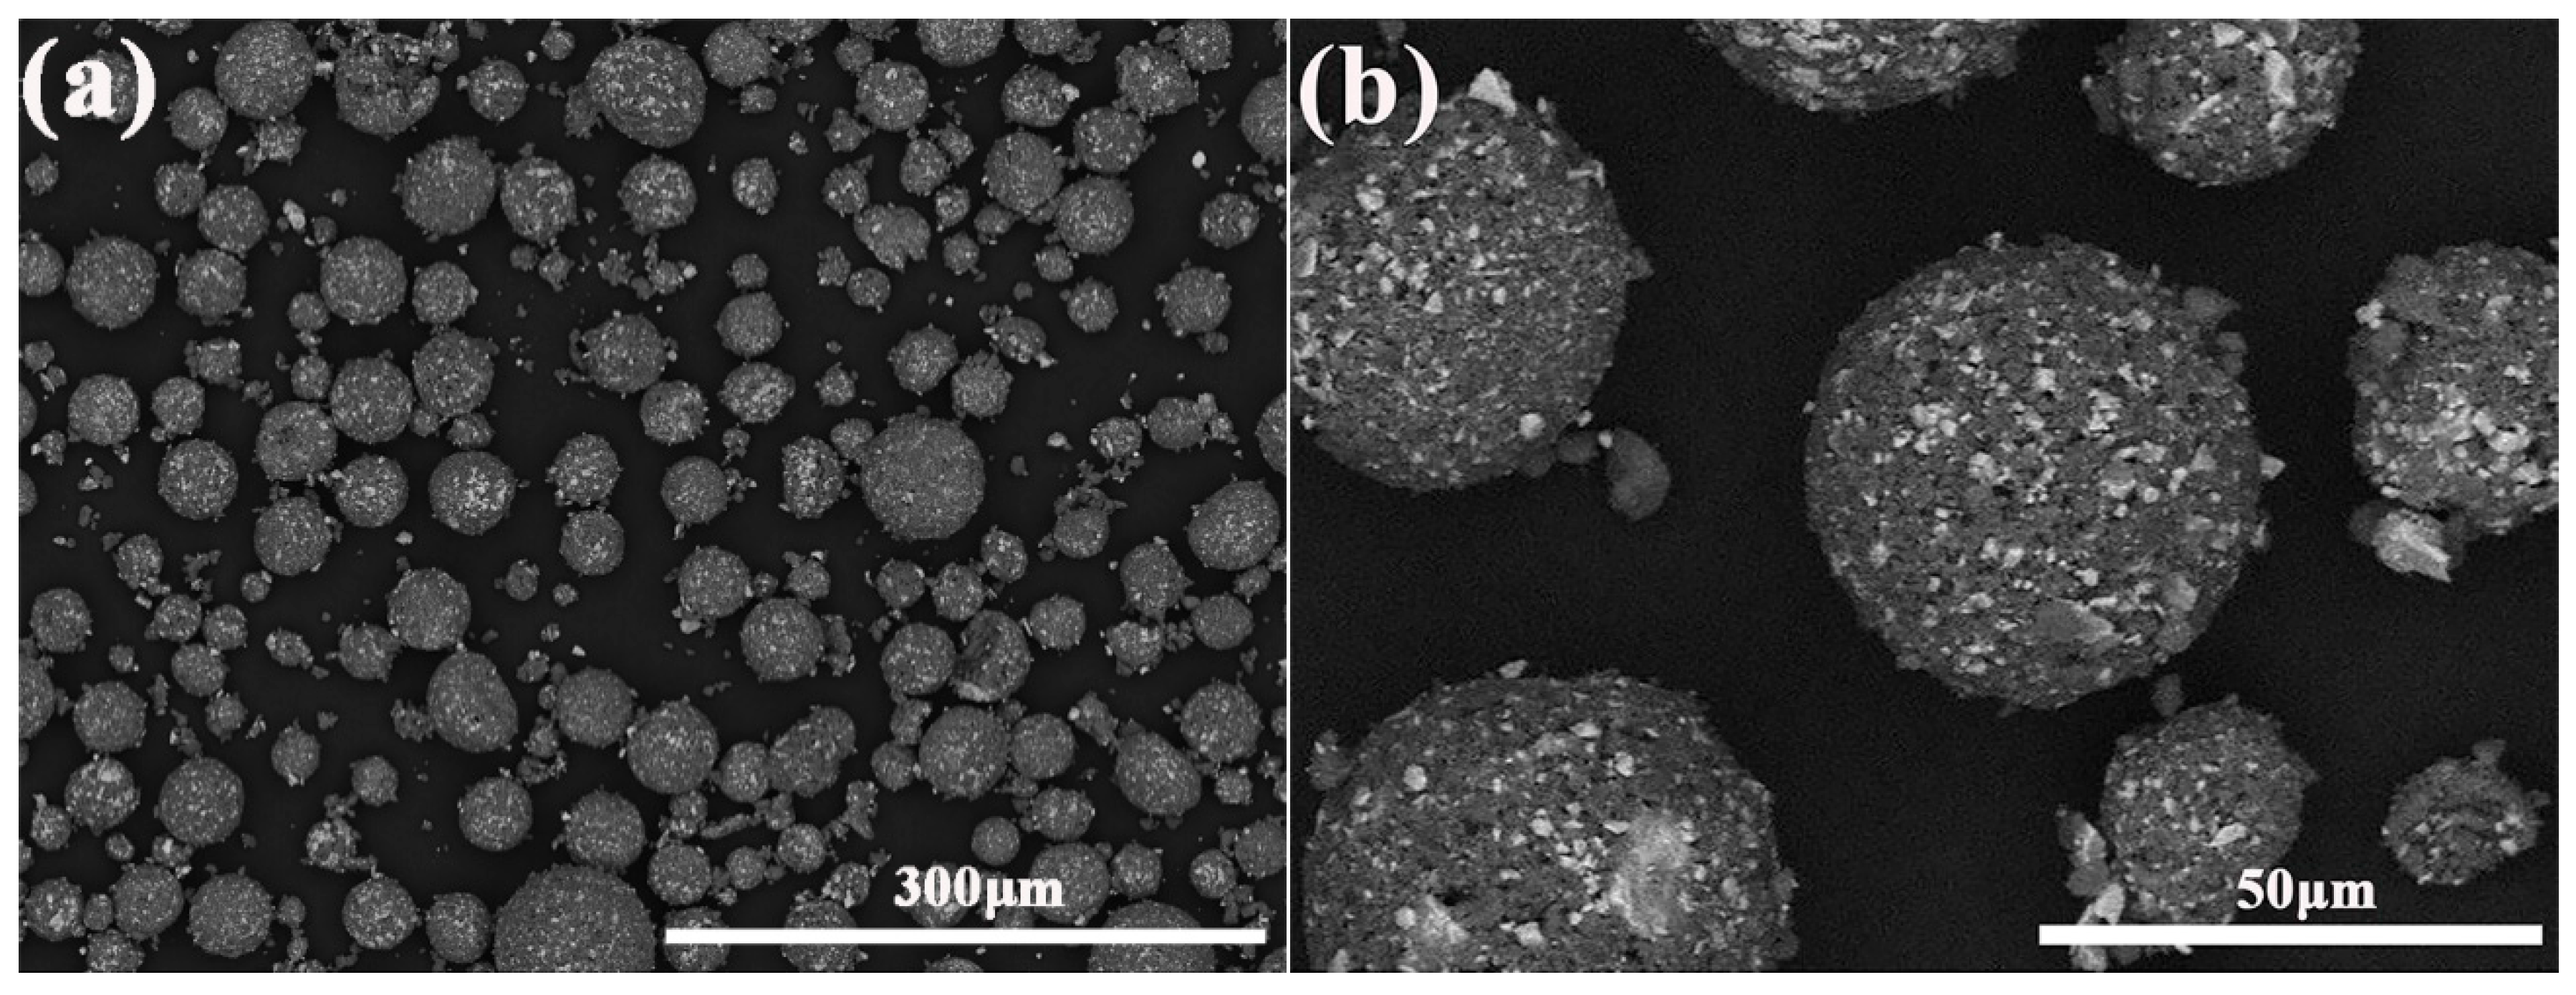
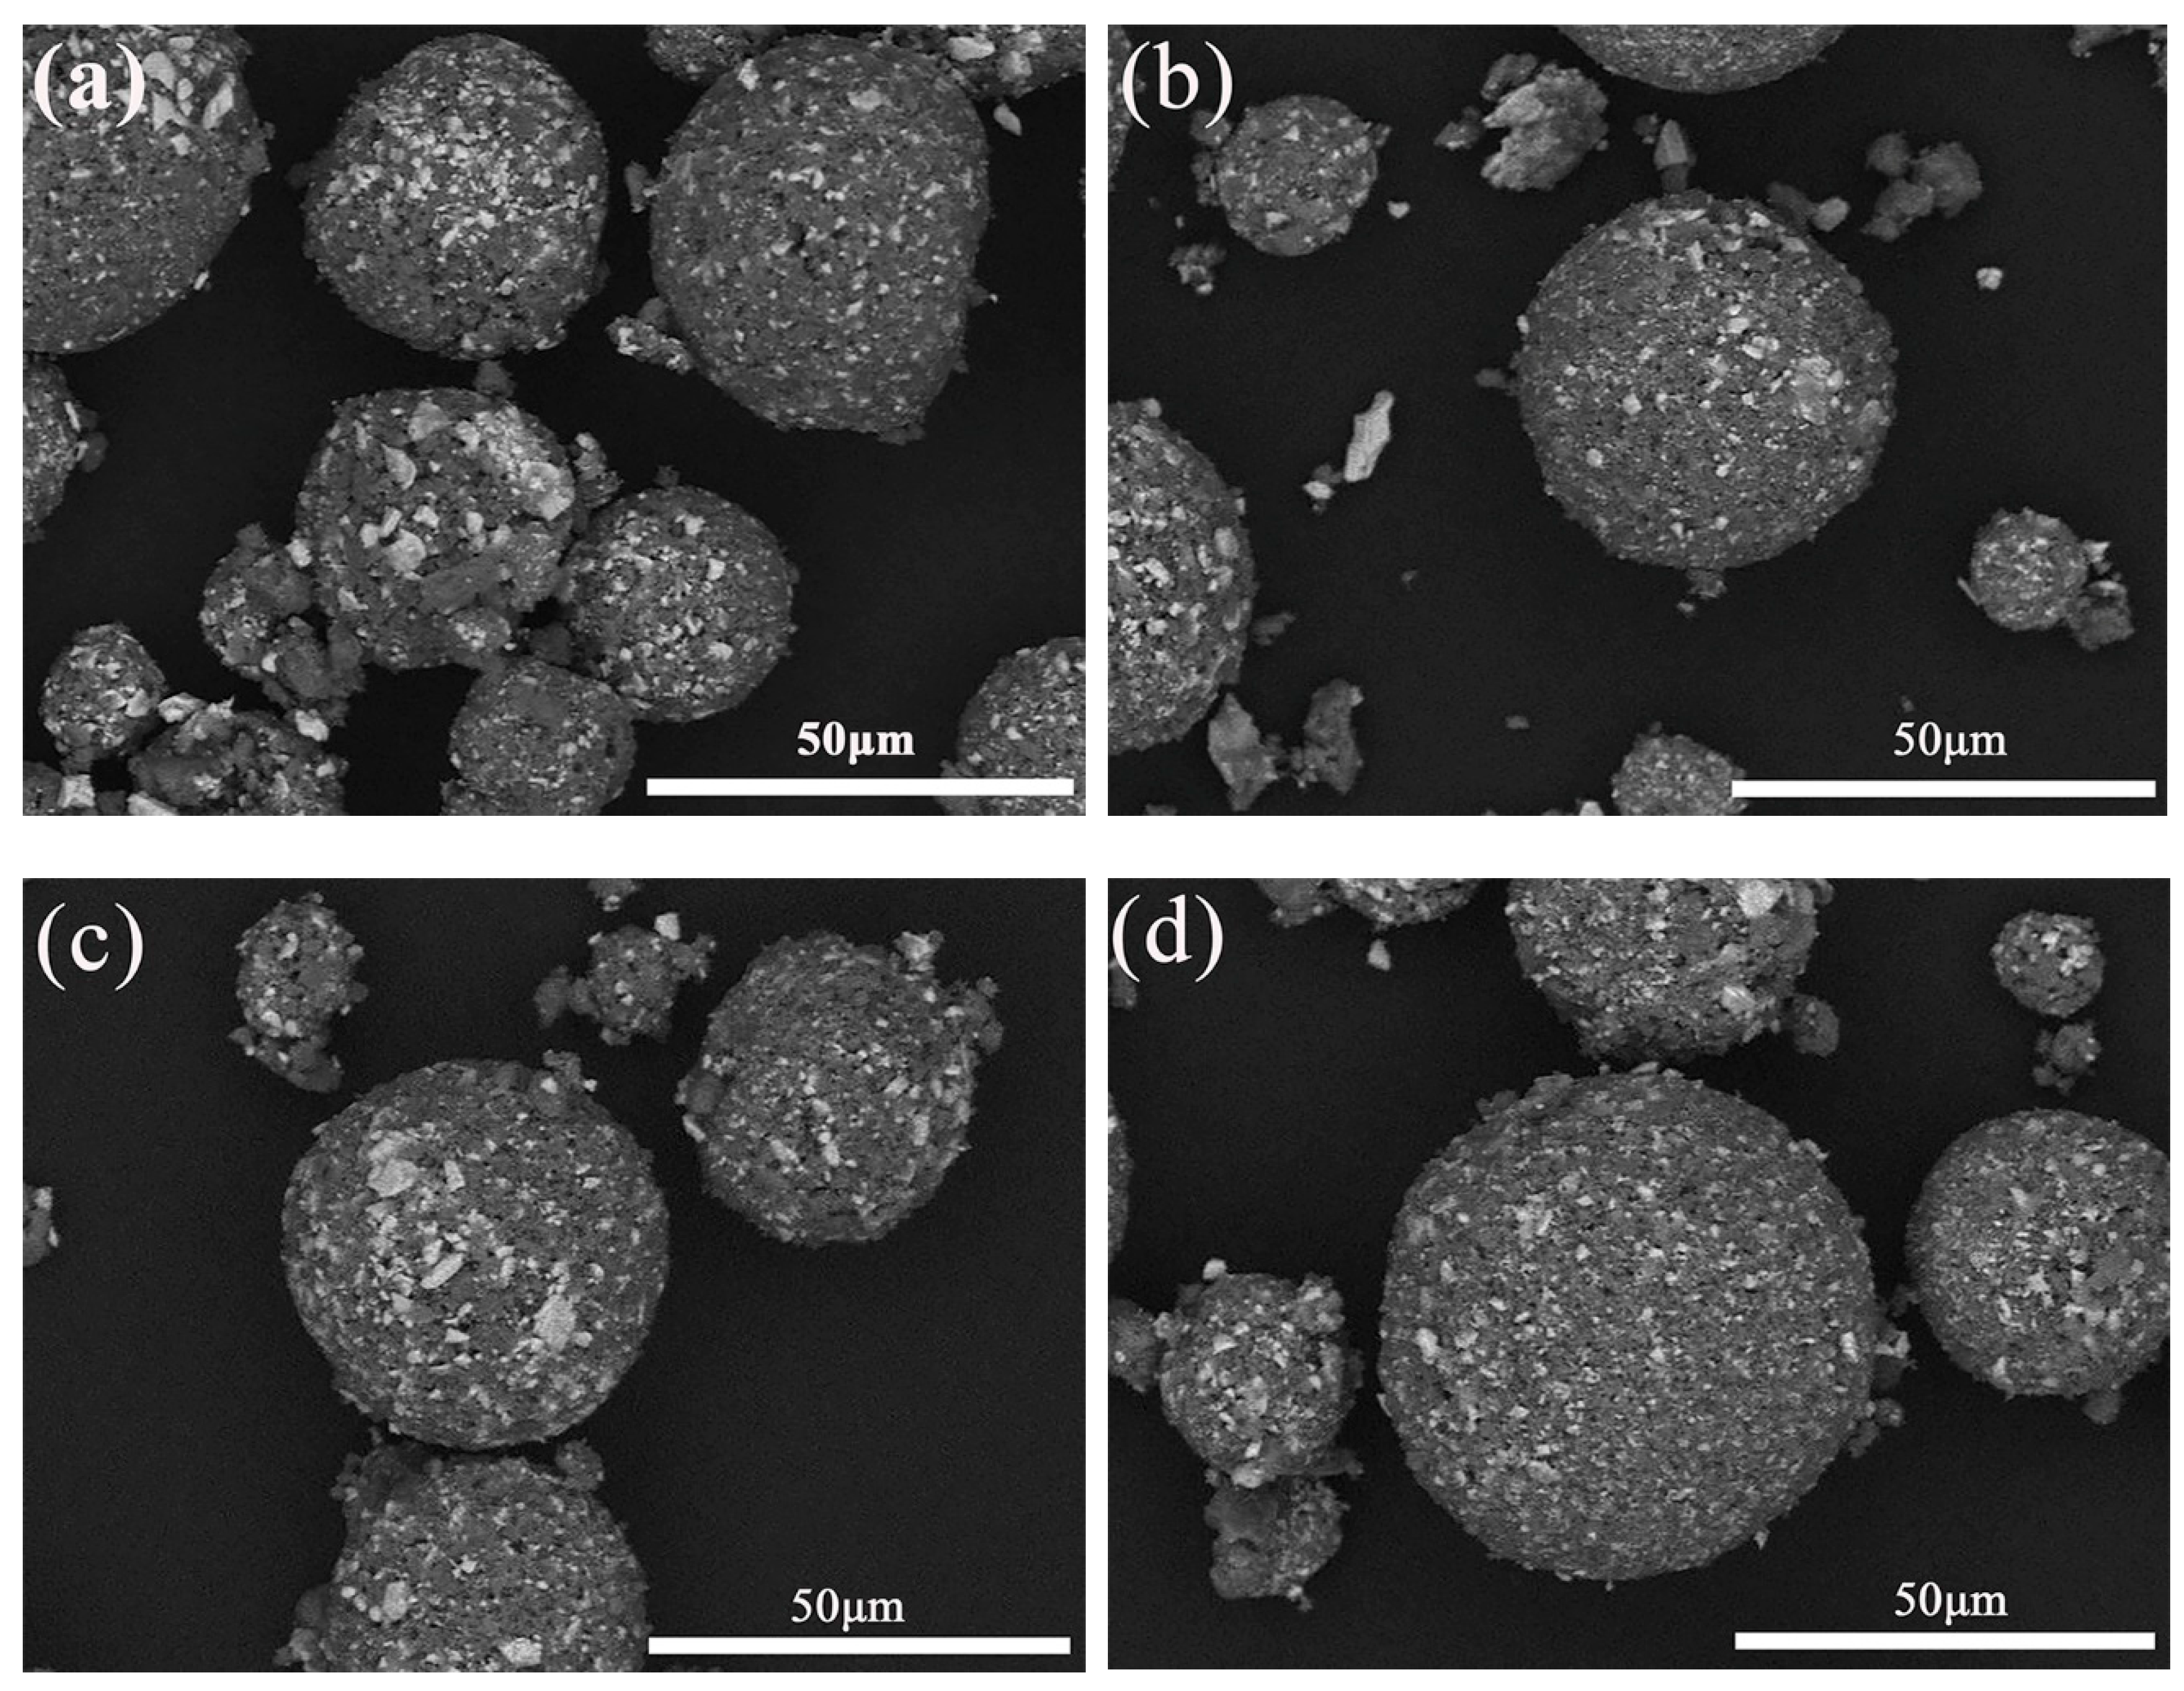
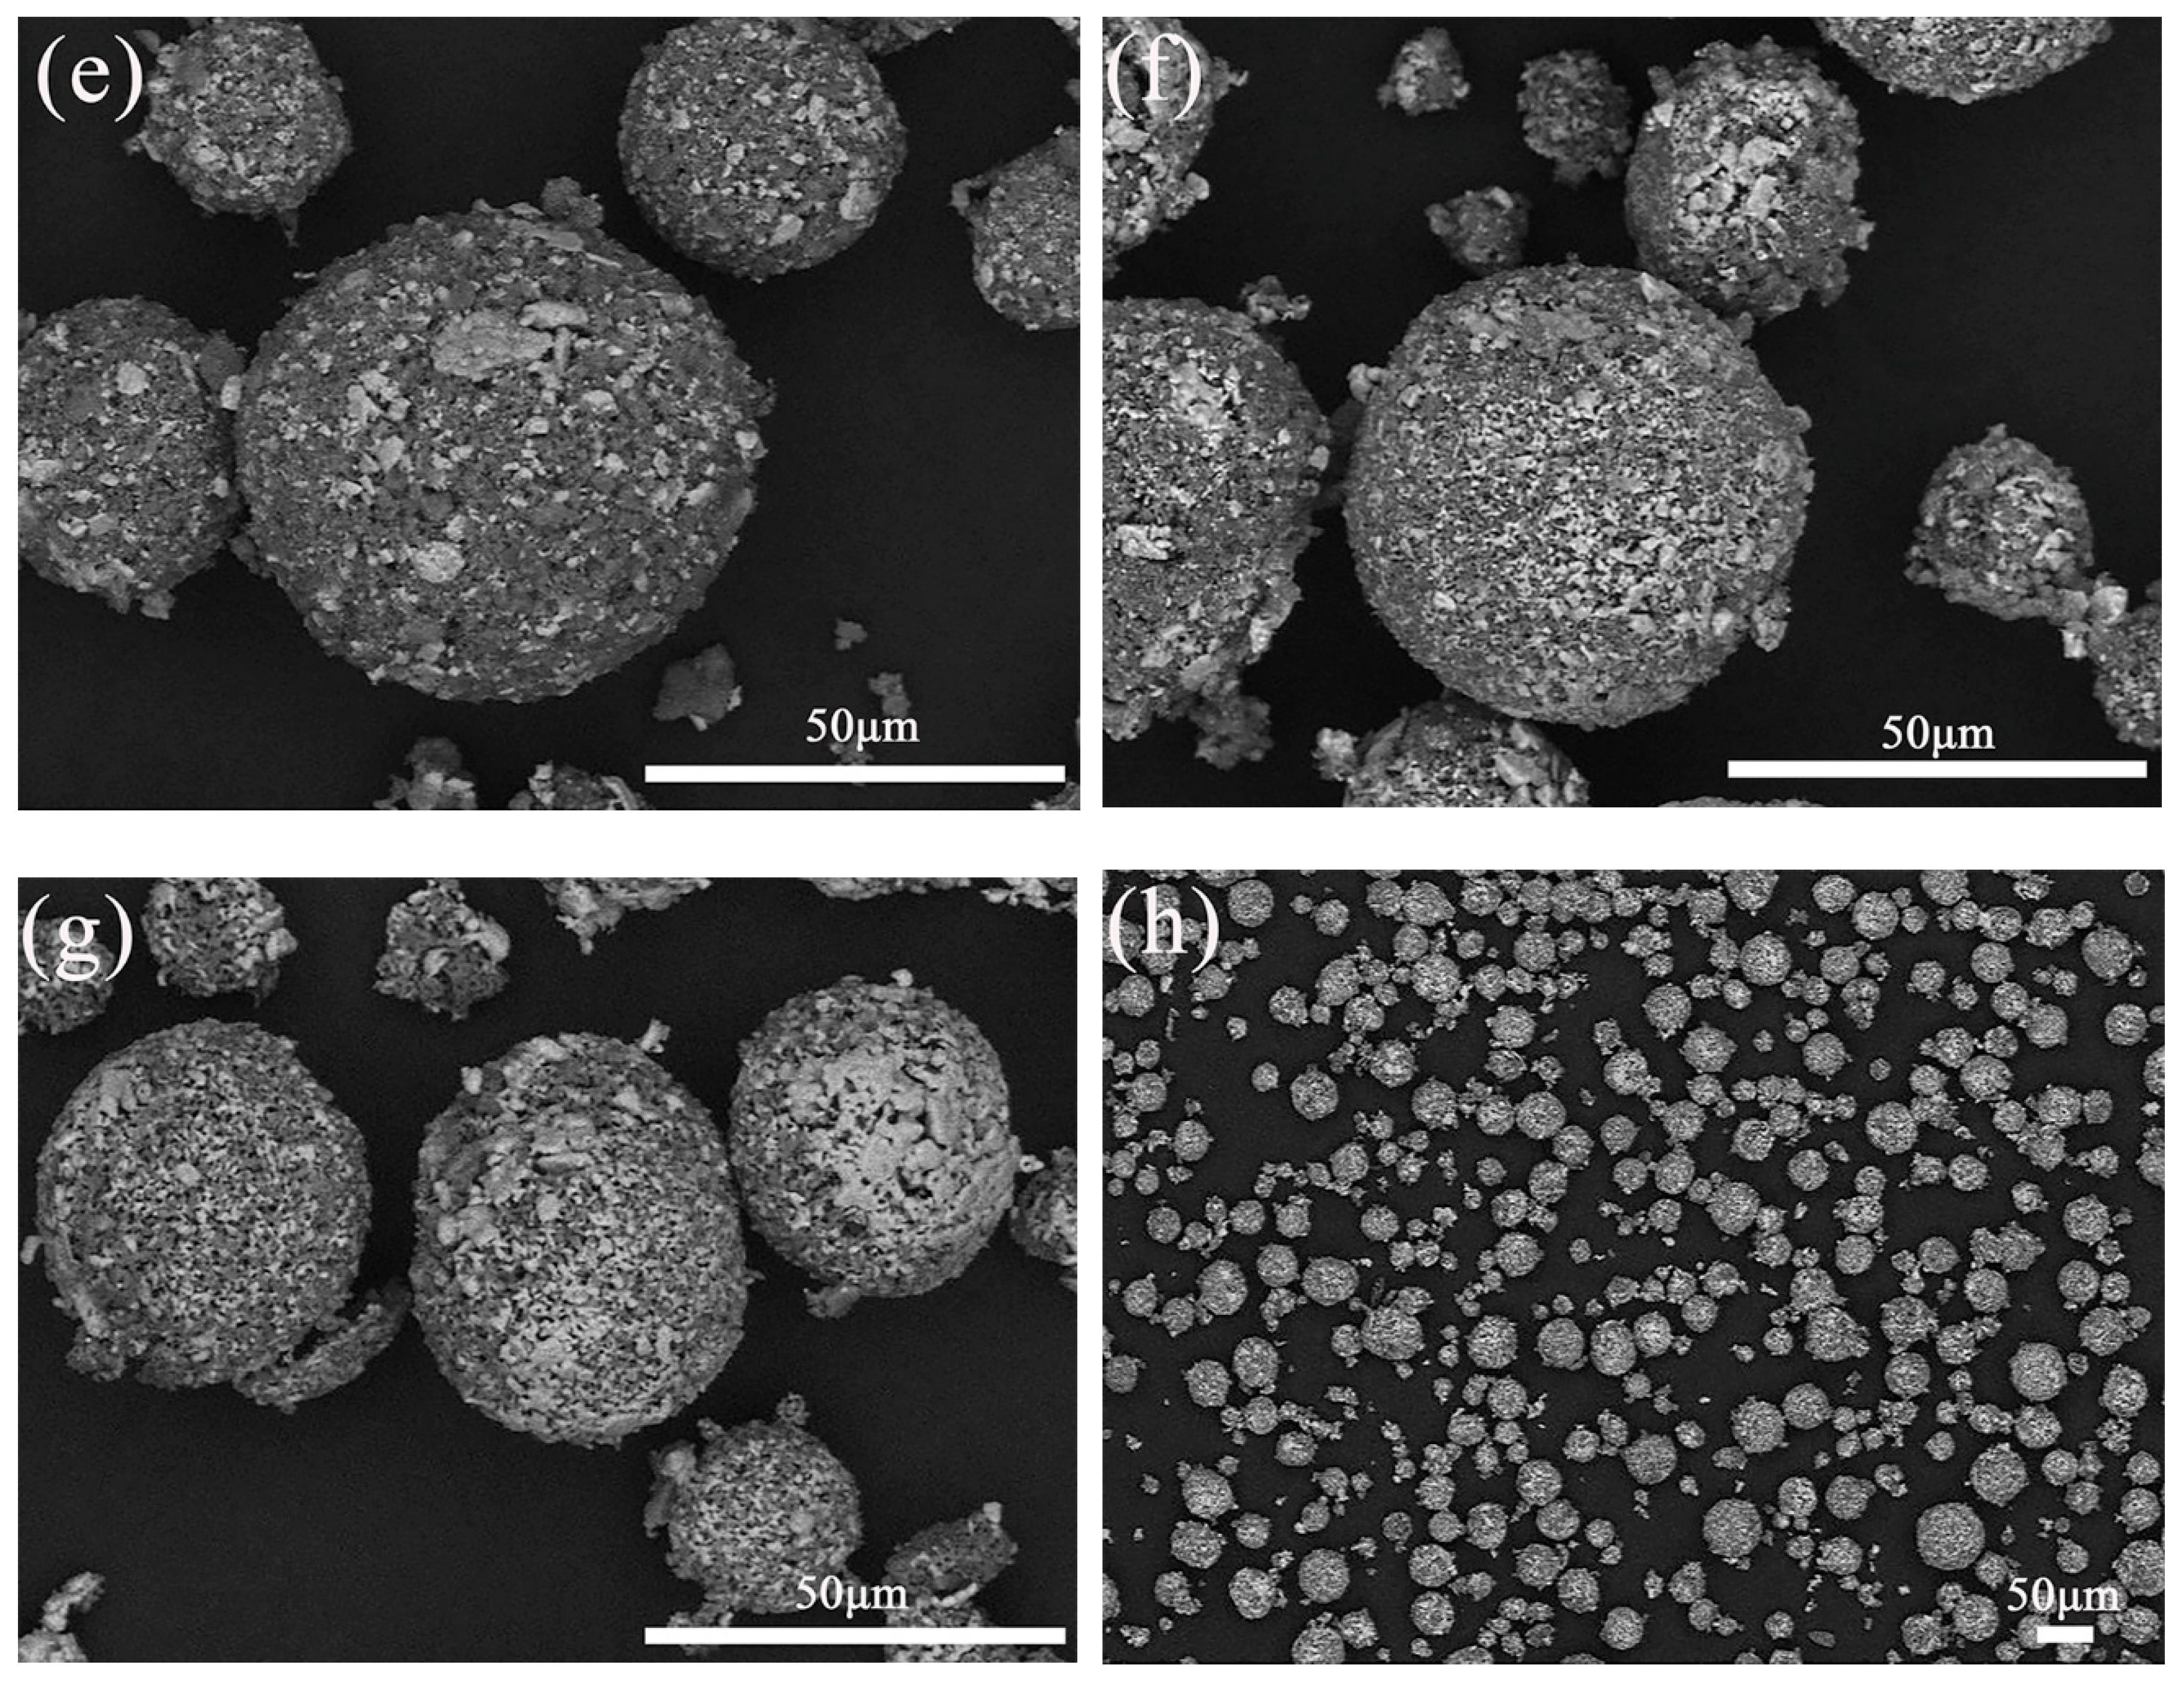
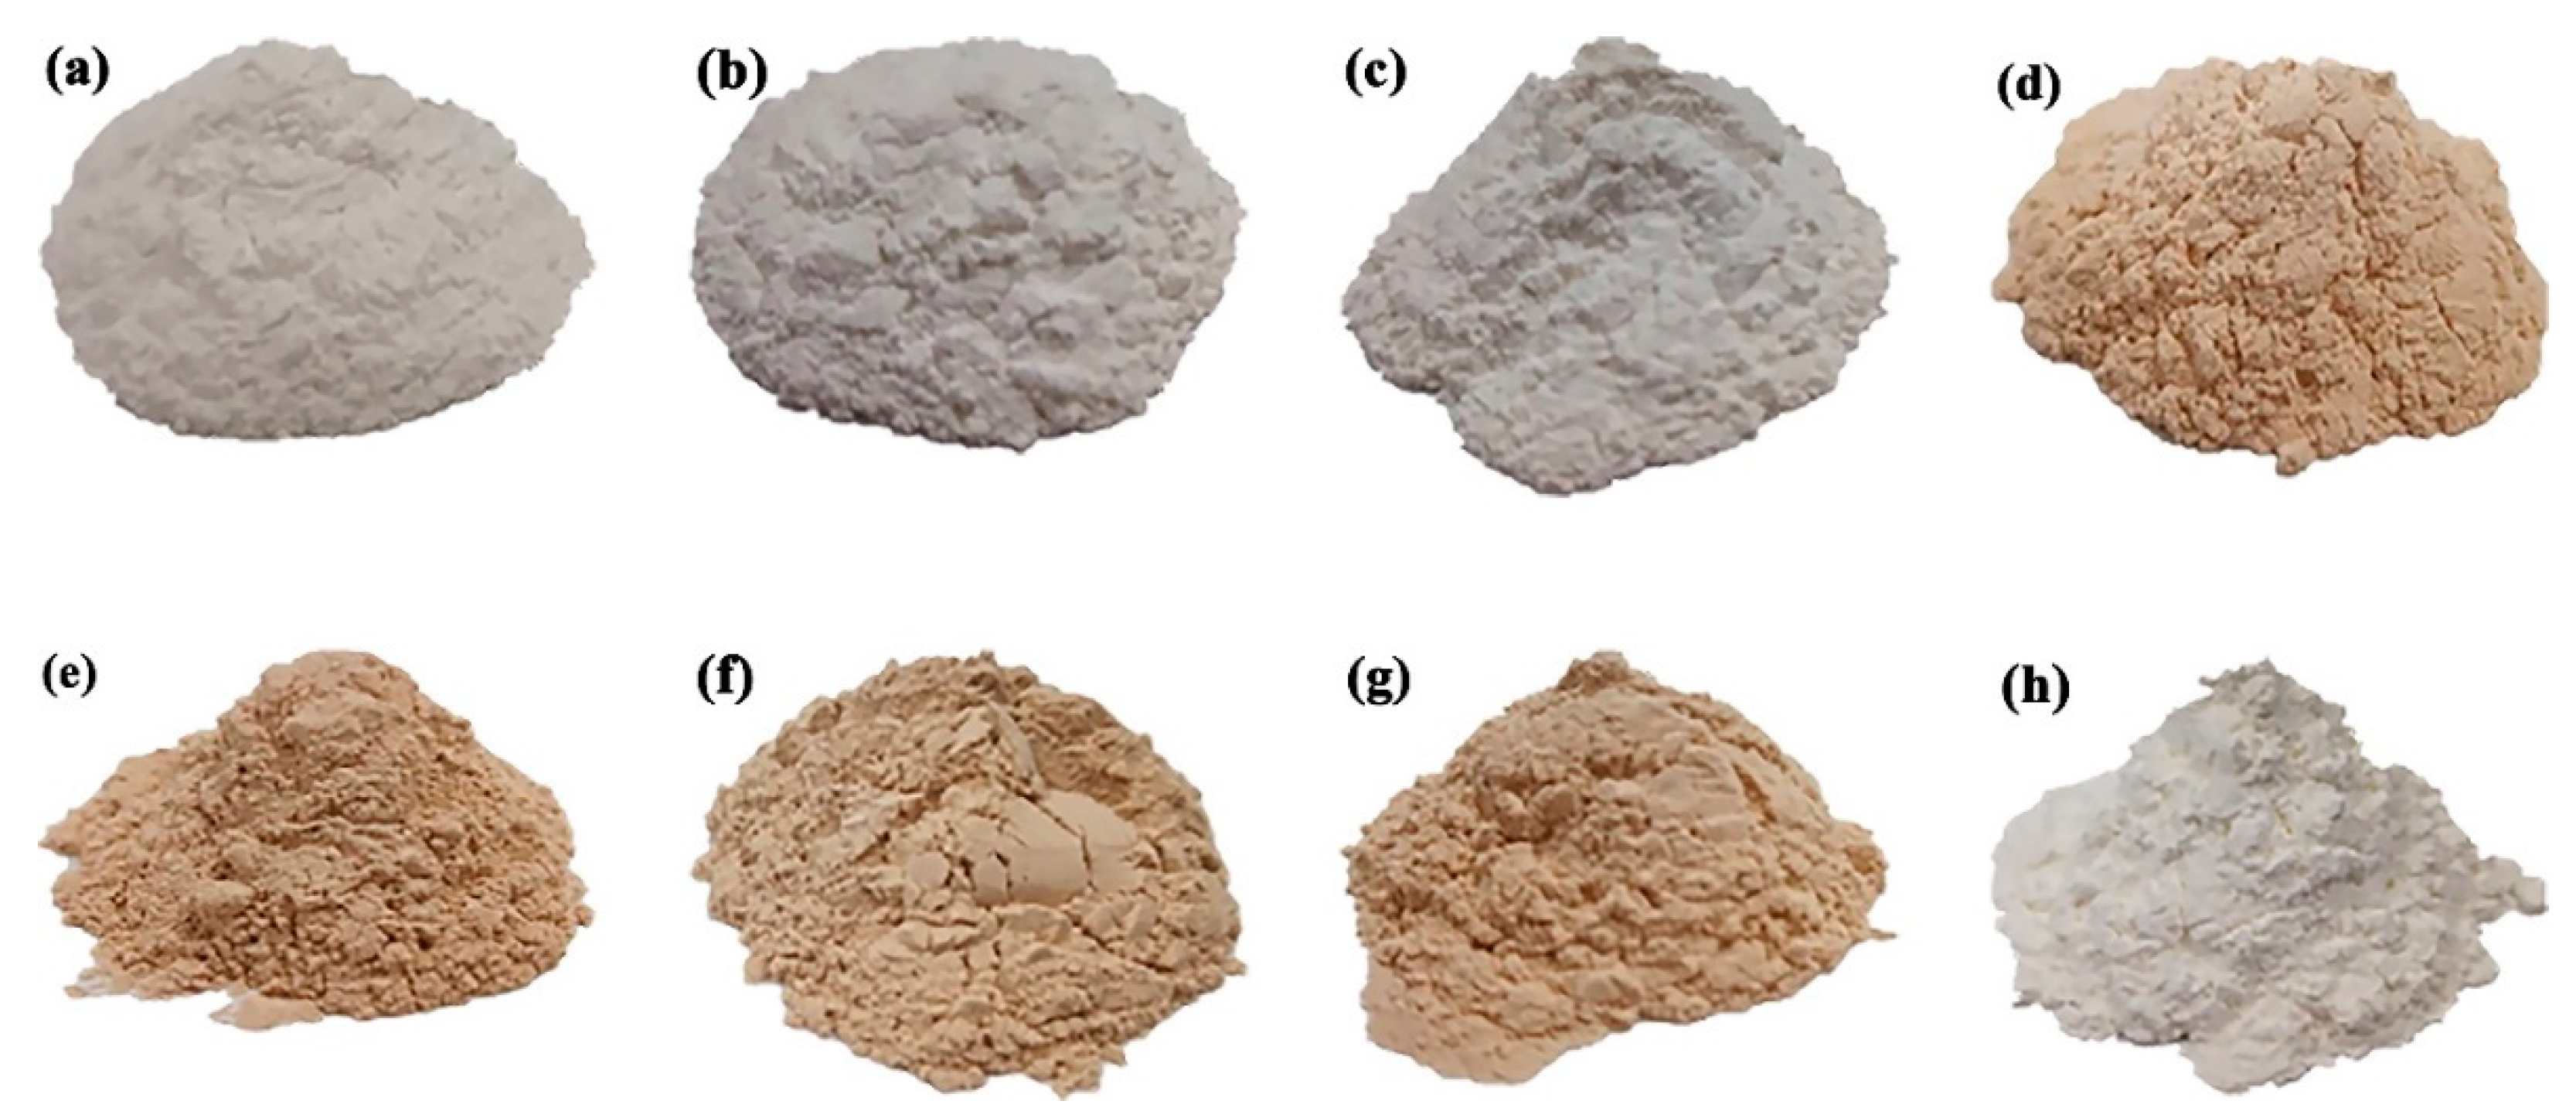
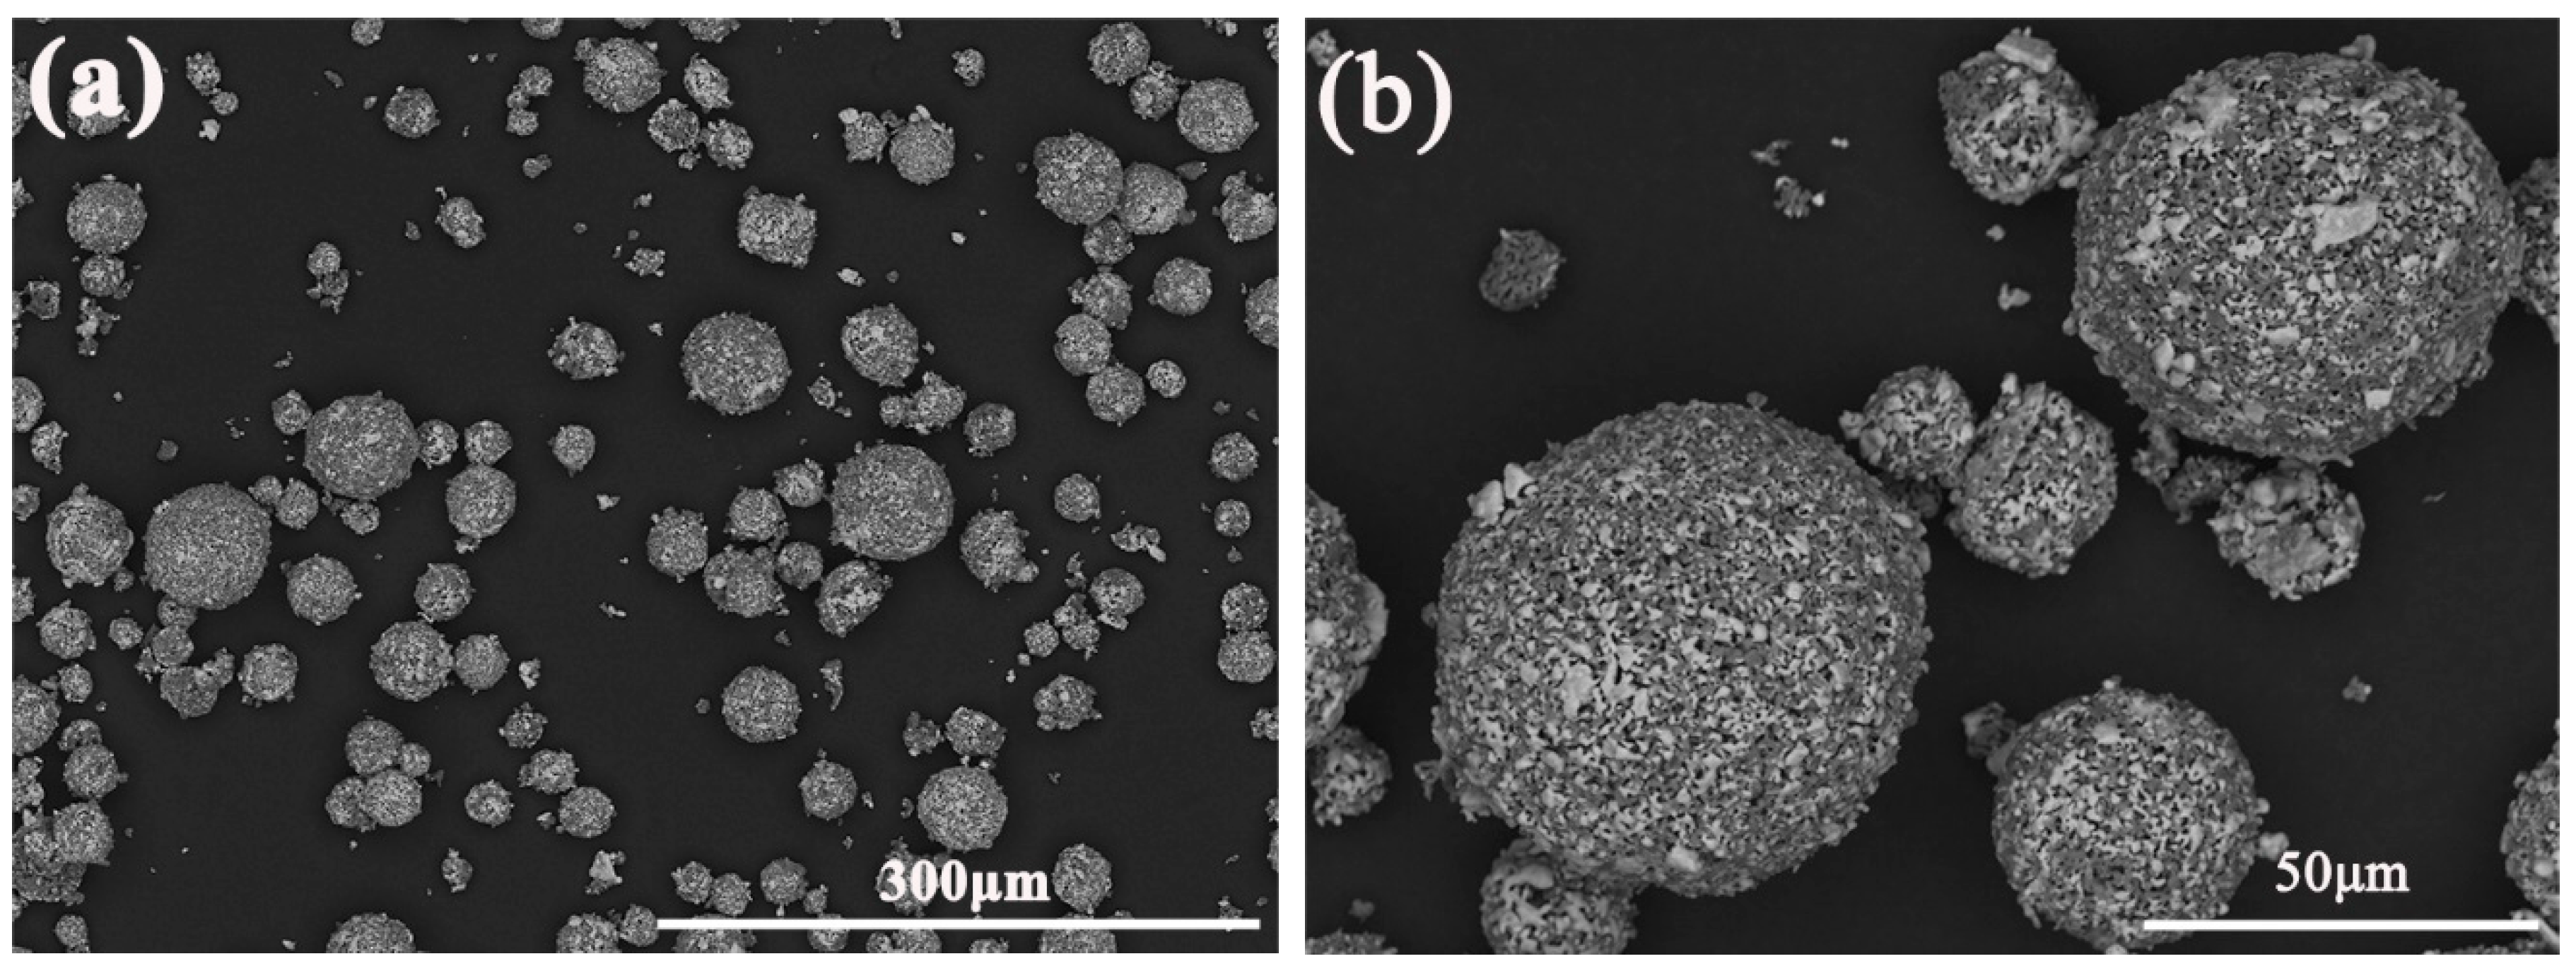
3.2. Morphology Analysis

Figure 4 demonstrates the morphologies of granulation powders at different temperatures. After being calcined, the bonds were formed at the phase interfaces of different phases in the granulation large particles, which facilitated the gradual compacting of the granulation large particles. Then, a dense network structure was formed inside the particles. The area of the white phase gradually accumulated and increased. This phenomenon is beneficial to improving the strength of the powders, so the powders would not be broken under the strong powders feeding flow in plasma spraying. However, due to the excessive accumulation of white phase, it may affect the uniformity of the internal components in the coatings after spraying. The appearance of white phase gradually spread out in Figure 4f–g, which also indirectly proves that the diffusion of solid-state reaction process is mainly by Al3+, and it is easy to form large aggregated new phase. Figure 4h shows the microscopic morphology (×200) of the powders after calcination at 1500 °C for 2 h.
Figure 5 displays the macroscopic morphologies of granulation powders calcined for 2 h at different temperatures. It is a remarkable fact that the color of the calcined powders deepened gradually with the increase of the calcination temperature. Especially when the calcination temperature reached 1100 °C, the color of the powders changes obviously. Combined with the results of the XRD phase analysis, Al2O3 + 2Y2O3   1000 ° C 1200 ° C   YAM and Al2O3 + YAM   1200 ° C 1400 ° C     4YAP, the reason for the color change may be due to the increase of the intermediate products YAM and YAP in the powders. Further calcination, the color became lighter with the appearance of YAG phase, and the powders became white when YAP was reacted completely. The change of color can macroscopically judge the degree of calcined treatment of powders.

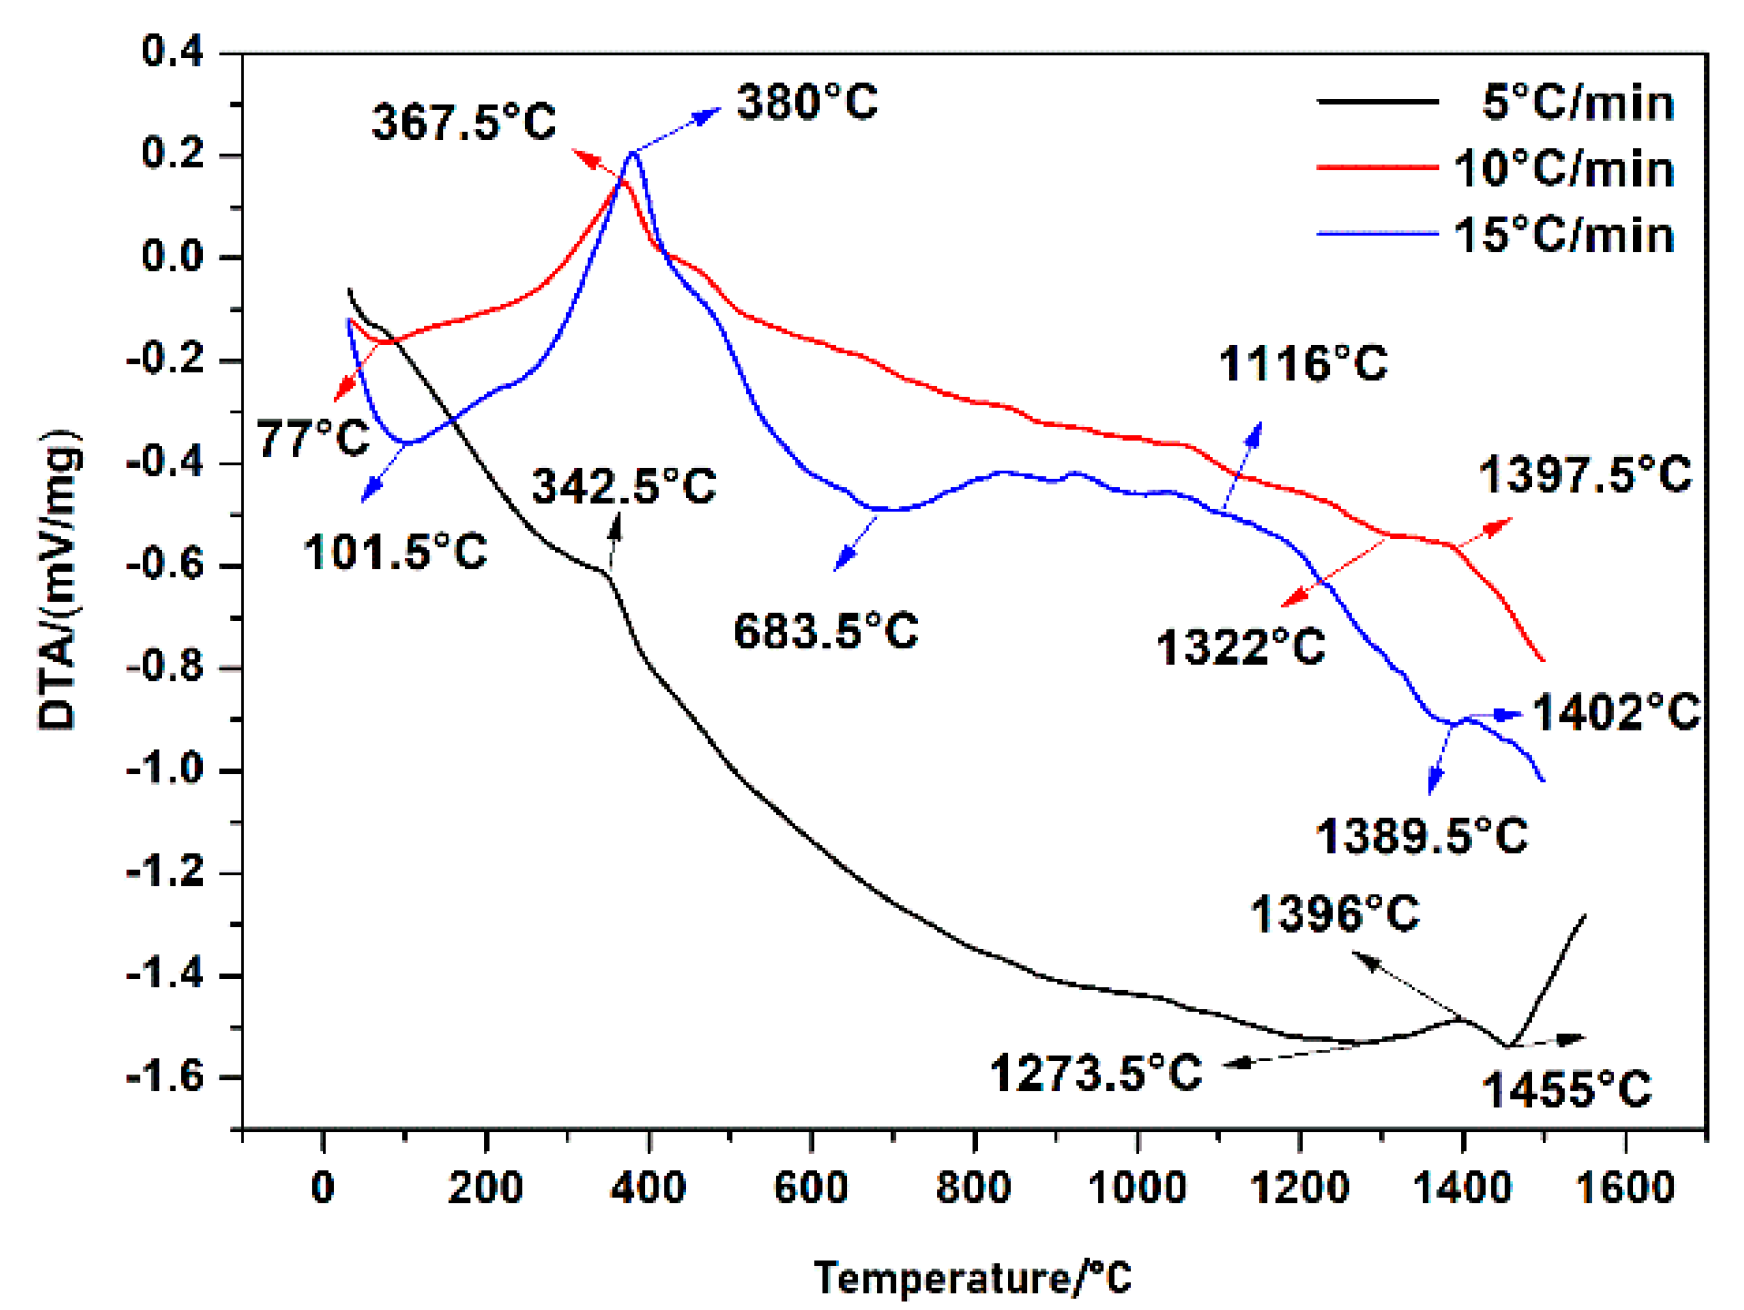
3.3. DTA Curve Analysis

Figure 6 shows the DTA curves of spray granulation powders at various heating rates. Generally, the lattice vibration in the powders is enhanced during the heating process. When the temperature is close to the endothermic peak, the vibration of the ions in the ionic crystal is enough to get rid of the bondage of the lattice. This phenomenon makes the ions migration and diffusion. The curve on the right side of the endothermic peak is exothermic, and it is often the case that the diffuse ions react and form a new phase, in order to achieve a new thermodynamically stable structure in the process of diffusion. In general, the solid-state reaction is mainly controlled by the chemical reaction rate on the phase interfaces and the ion diffusion rate in the solid phase, so the slope information of each point measured by the DTA curve could be used to judge the dominant control factors of the solid phase reaction. If the endothermic peak is obvious, the curve on the left side of the endothermic peak indicates that the diffusion rate is higher than the reaction rate, namely the reaction is controlled by the reaction rate at the phase interfaces. In this study, the endothermic and exothermic peaks before 400 °C were caused by the volatilization of polyvinyl alcohol in the granulated powders. Based on the accuracy of the experimental results, the DTA curve of 5 °C/min heating rate is mainly for analysis. Before 1273 °C, the Al2O3–Y2O3 system had been absorbing heat, namely the ion diffuse rate was higher than the chemical reaction rate, thus, the reaction was mainly controlled by the chemical reaction rate at the phase interface. This means that the formation of YAM occurred in the chemical kinetic range. There was no obvious change in DTA curve between 1273.5–1396 °C, indicating that the formation of YAP was controlled by both ion diffusion rate and reaction rate, so this stage was a transitory range. When the temperature reached 1455 °C, the whole system exothermic violently. Hence, the formation of YAG was controlled by the ion diffusion rate in the solid phase, which was belong to diffusion dynamic range. However, due to the huge temperature difference in the specific time range, the actual chemical reaction rate was different at the same temperature point of the different curves, while the heating rate increases. As the heating rate was fast enough, the reaction rate of the curve at this temperature point was faster, and the peak position lagged more obviously.
Based on the test results of three DTA curves and XRD, the following conclusions could be drawn: (1) the reaction temperature of YAM phase was 683–1204 °C, and the significant reaction range was 1000–1204 °C, the reaction temperature of YAP phase was 1273–1396 °C and the reaction temperature of YAG phase was above 1455 °C; (2) the solid state reaction of the Al2O3–Y2O3 system was mainly controlled by the chemical reaction rate at the phase interfaces and the ion diffusion rate in the solid phase, and the main controlling factors were determined by temperature. With the increasing of temperature, the diffusion control became more obvious.

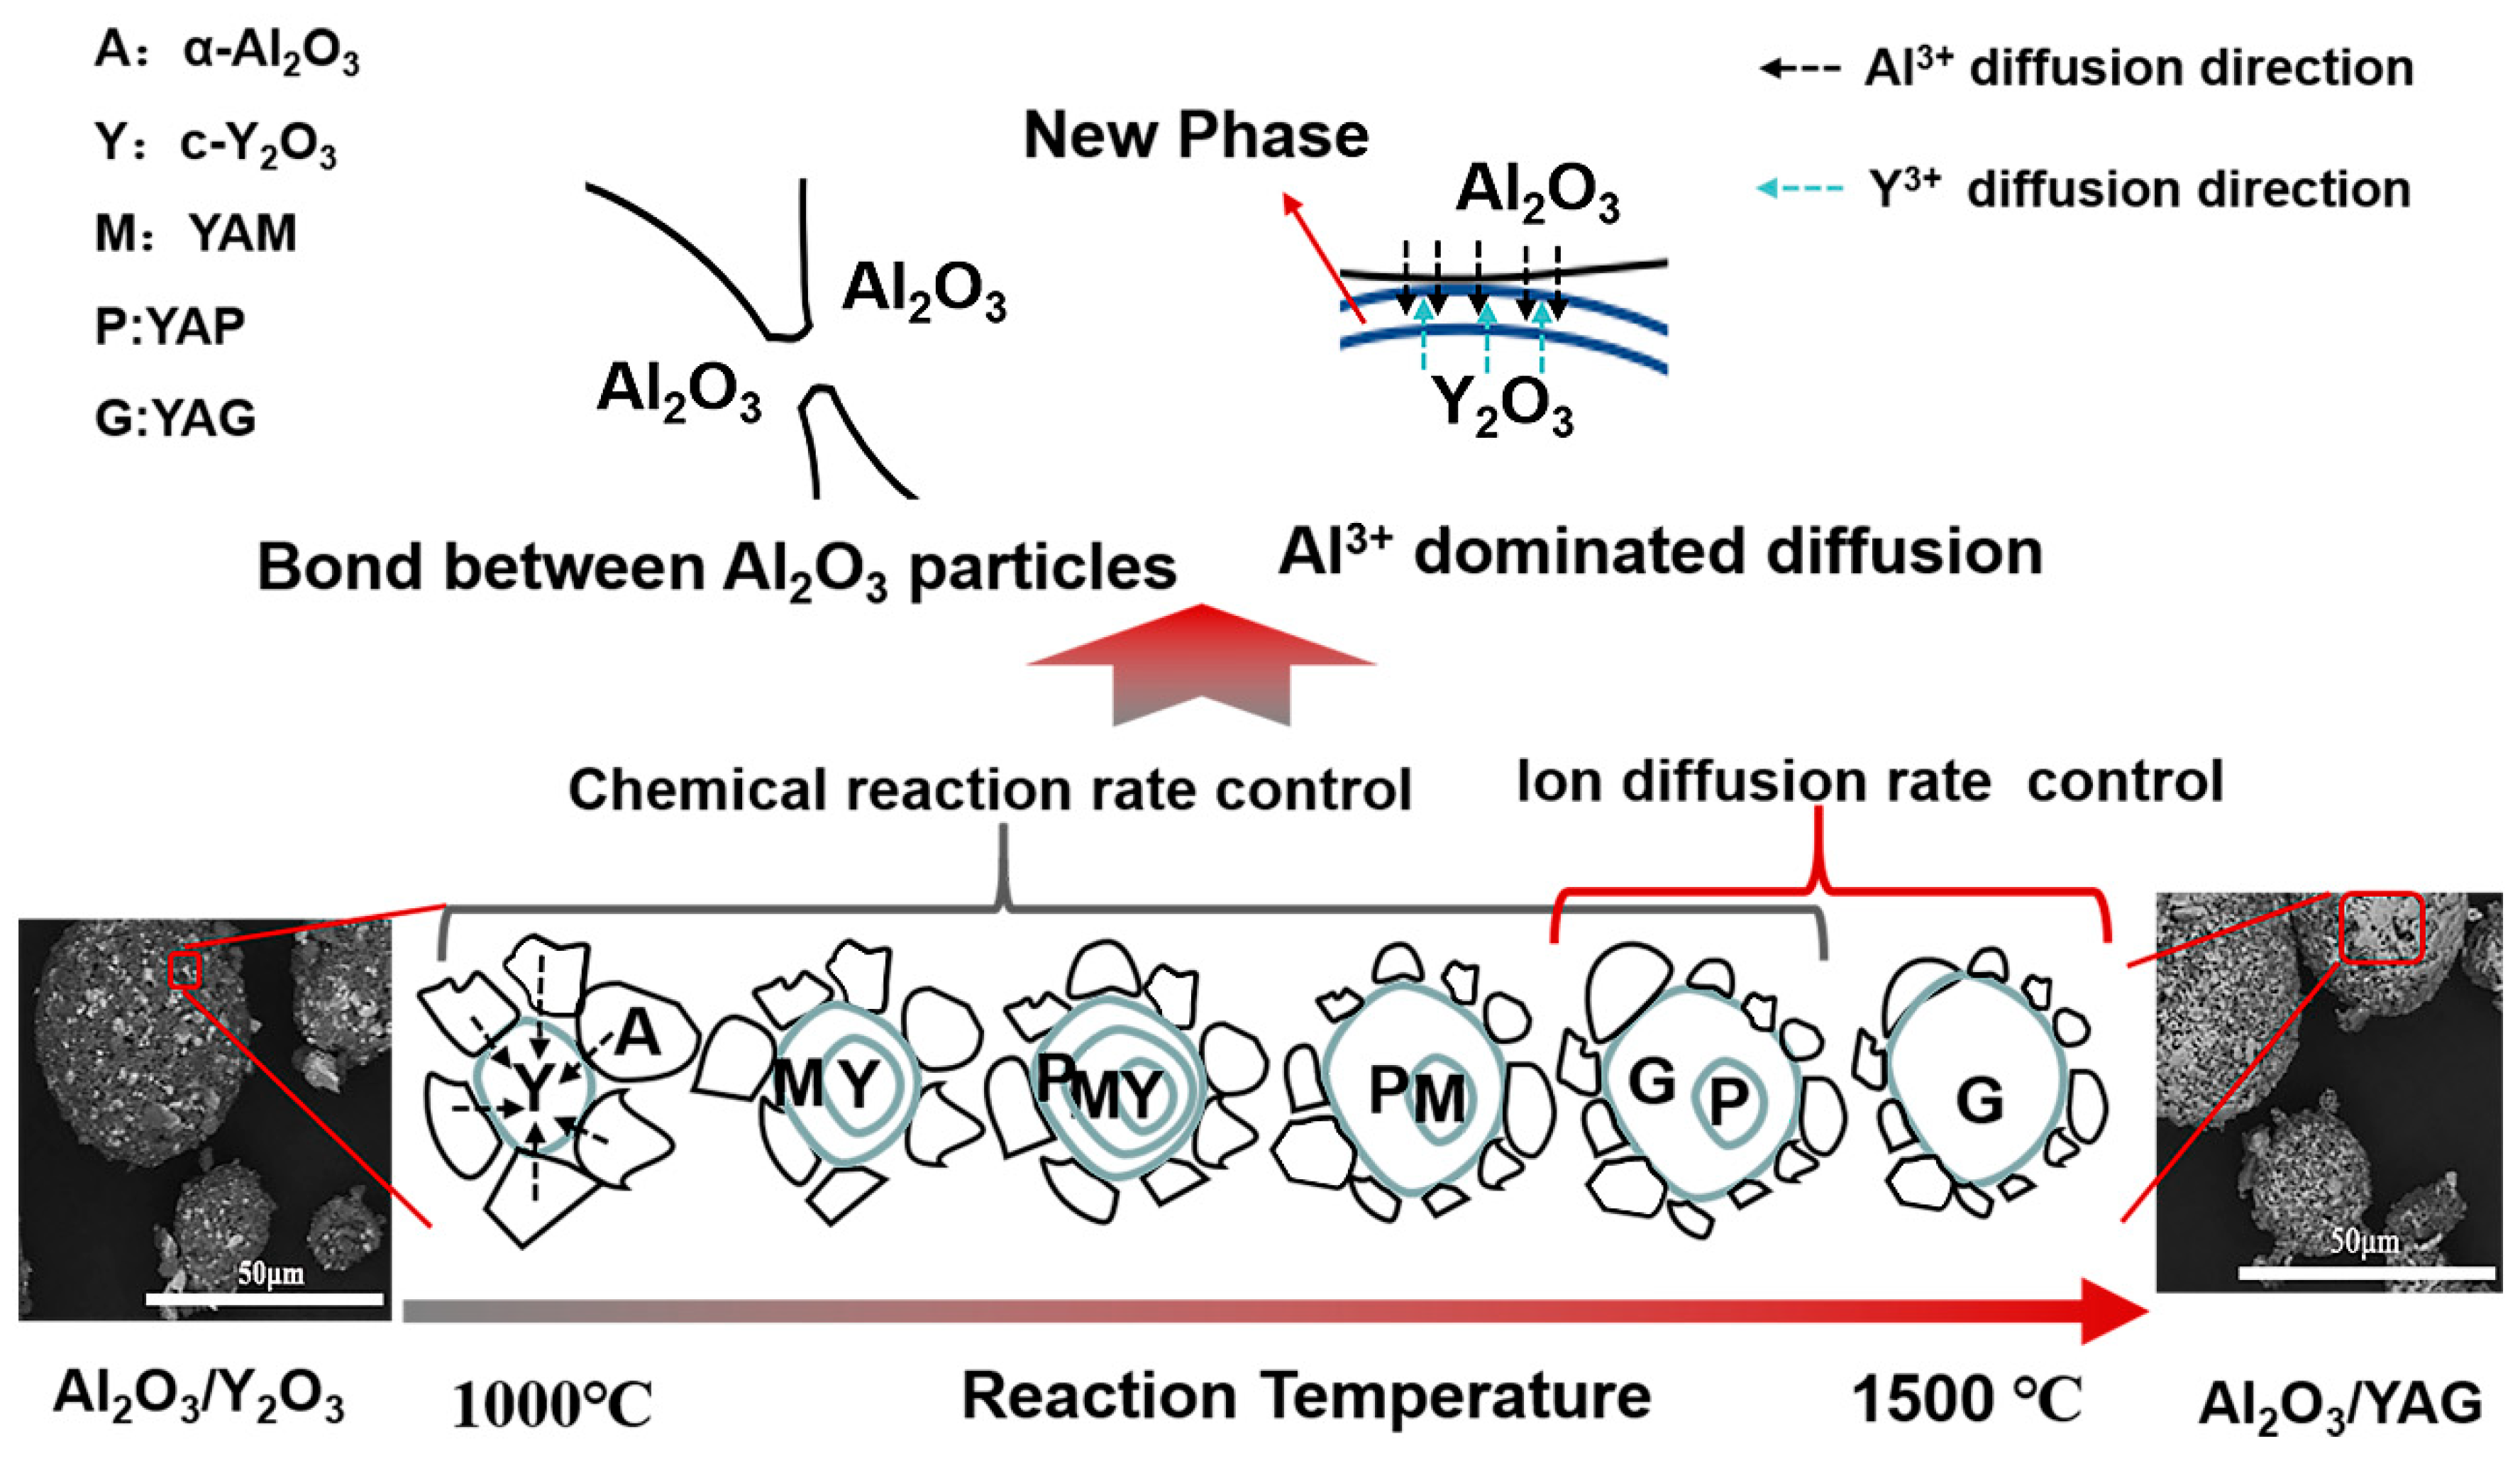
3.4. Solid-State Reaction Mechanism

The solid-state reaction dynamic of Al2O3–Y2O3 system is a complicated process, and the reaction process was affected by many factors. The dominant factor of solid-state reaction is significantly affected by temperature, and other factors like reactant particle size, ion size and diffusion rate of ions through intermediates can also have effects [24,25]. The temperature affect the reaction mainly though the diffusion rate and reaction rate of reactants, and the solid-state reaction of Al2O3 and Y2O3 to YAG is mainly controlled by both chemical reaction at the phase interfaces and ion diffusion rate in the solid phase. Beyond that, due to the different particle sizes of Al2O3 and Y2O3 particles, the effective contact area between the particles is also different, and the intermedium-thickness and the ions diffusion rate in different mediums under different temperatures were also different, and those considerations also play an important role in solid-state reaction.
The reaction mechanisms were also quite different with different temperature, including chemical kinetic control, diffusion dynamic control and both mechanism cooperative control. The initial reaction mechanisms of Al2O3–Y2O3 system usually belong to the chemical kinetic range, so the reaction will transform from the chemical kinetic range to the diffusion dynamic range with the rising temperature. This process will make difficult to determine the dynamic parameters. Due to relatively low reaction rate, the formation temperature of the intermediate is non-fixed. For instance, the initial generation temperature of the YAM phase is 683 °C in this study, and this temperature is basically consistent with the other research [26]. However, the YAM phase apparently exists at a temperature of 1000 °C, and there is a latent temperature difference between them. However, as the temperature increases, the reaction rate at the interfaces increases gradually. From 1273.5–1455 °C, the solid-phase reaction of Al2O3–Y2O3 system is controlled by the chemical reaction rate at the phase interfaces, and the ion diffusion rate in the solid phase, hence, the agglomeration phenomenon of intermedium and final products are easy. When the temperature is beyond 1455 °C, the rate of ion diffusion in the solid phase controls the reaction process, and an obvious agglomeration phenomenon of YAG phase appears. Figure 7 shows the schematic illustration of solid-state reaction process of Al2O3–Y2O3 system. It summarizes the formation mechanism of YAG and explains the aggregation process of YAG. It should be noted that the uniformity of powders composition is problematic.

3.5. Optimization of Calcination Process

According to the above analysis of solid-state reaction mechanism and DTA curves, the calcination process of powders was optimized. The temperature plays a leading role in the process of solid-state reaction, so the calcination temperature TN and calcination time t in multiple step-by-step heating cycle calcination process were adjusted (50 °C ≤ TNTN−1 ≤ 200 °C, t = 1~4 h). As the chemical reaction rate control the process (T ≤ 1200 °C), the value of TNTN−1 can be larger and the calcination time can be longer. For the ion diffusion rate control the process (T ≥ 1400 °C), both the value of TNTN−1 and the calcination time t should be smaller, due to the faster chemical reaction. Hence, the growth of the intermediate and final products YAG can be regulated, and the new phase formed by the diffusion process of ion reaction will not agglomerate excessively. The distribution of components in the particles can be uniform. At the same time, the regulation of calcination time can increase the rate of YAG production in Al2O3/YAG composite powders. The morphology of final powders after process optimization is shown in Figure 8. A dense network structure was formed inside the particles. Compared with the Figure 4g, the agglomeration phenomenon of the white phase was decreased significantly.

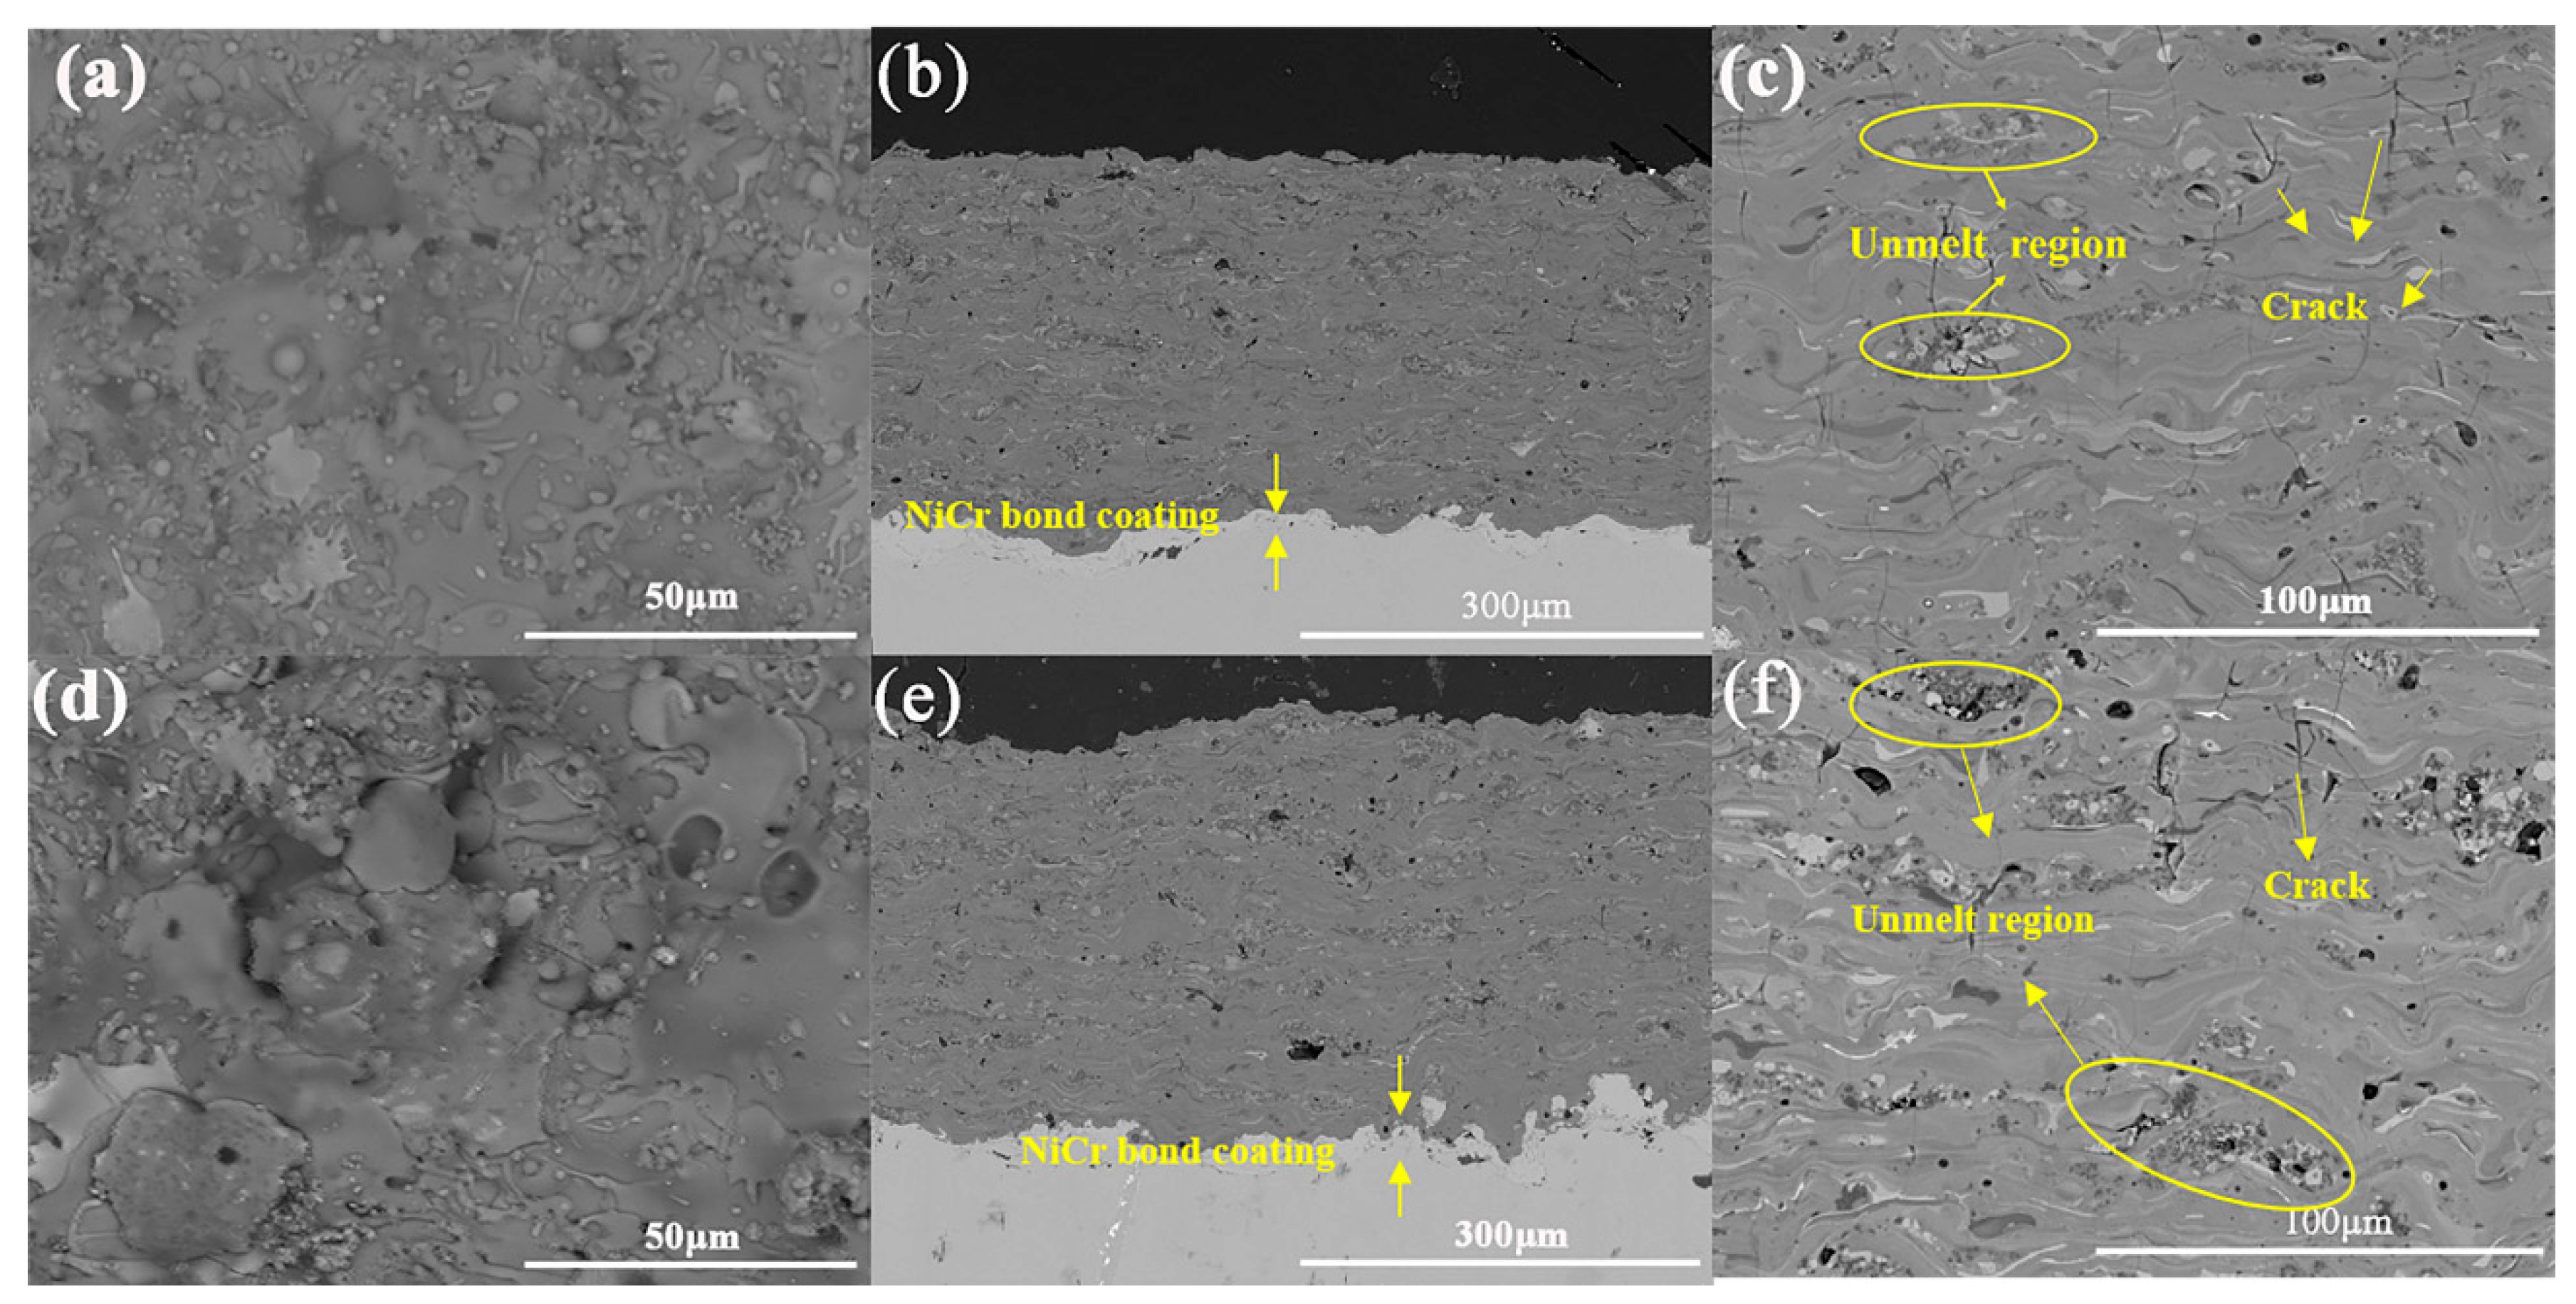
3.6. The Deposition Performance of Al2O3–YAG Coatings

To ensure the deposition performance of the Al2O3–YAG coating and make the prepared coating amorphous, the molten droplets of the powders need a great degree of undercooling during spreading and rapid solidification. Accordingly, forced cooling should be carried out in the spraying process to increase the undercooling of the solid-liquid interface, so the “deep eutectic” could be realized as far as possible in the spraying process, and the amorphous phase could be formed to the maximum extent. There were two types of plasma spraying parameters for ceramic coating preparation in this study. In Figure 9, the diffraction peaks of coatings widened significantly, and a steamed bun peak appeared, which indicates that amorphous/nanocrystalline appeared in the coating, the amorphous phases dominates in the coating and the crystal phases in the coatings were mainly Al2O3 and YAG. The content of amorphous phase in ceramic coating 1 and ceramic coating 2 exceeded 95% and 80%, respectively. The cross-section and surface morphologies of the ceramic coating 1 and ceramic coating 2 are shown in Figure 10. The thickness of coatings was about 300 μm, and there was some “stripe” distributed in the coatings. Both coatings had unfused regions, and the deposition of coating 2 was not as well as coating 1. With faster carrier gas and lower powders feeding rate, coating 2 was not as dense as coating 1, the unfused region of coating 2 was larger than coating 1, so the amorphous phase content of coating 2 was less than coating 1. Moreover, the hardness of the coating 2 (5.86 ± 0.11 GPa) was also smaller than coating 1 (6.61 ± 0.12 GPa). In general, the hardness of Al2O3–YAG coatings were not very high, due to the existence of the amorphous phase, but when the coatings experienced thermal treatment, the Vickers hardness of coating can exceed 15 GPa, and this coating may be more suitable for more severe PV values condition (P contact pressure; V friction velocity) [6,8]. The cross-section morphologies of ceramic coatings had some pores, the porosity of the coating 1 and coating 2 were calculated by the image analysis method, and the values were 1.21 ± 0.33% and 1.52 ± 0.29%, respectively. Furthermore, both coatings have some longitudinal micro-cracks, the formation of cracks may be ascribed to the molten particles after impacting the substrate surface, releasing a large amount of thermal stress during the cooling process. However, overall, the process optimization of powders is effective, and the coatings deposition effect is well, which is related to the plasma spraying parameters.

4. Conclusions

In summary, this paper investigated the process optimization of sprayed powders for amorphous Al2O3–YAG coatings and deposition performance of coatings. According to the current investigation results, the reaction of Al2O3–Y2O3 system is a high temperature solid reaction dominated by aluminum ion diffusion, which is mainly controlled by the chemical reaction rate at the phase interfaces and the ion diffusion rate in the solid phase. The main controlling factors are determined by temperature. In the early stage of the solid phase reaction is mostly controlled by the chemical reaction rate (T ≤ 1200 °C). When the temperature is high enough (T ≥ 1400 °C), the chemical reaction rate increases, and the reaction is controlled by the ion diffusion rate. Therefore, the reaction experiences from chemical kinetic range to diffusion dynamic range. According to the solid-state reaction mechanism, the multiple step-by-step heating cycle calcination process was optimized. After being sprayed, the amorphous phases dominate in the coating, the amorphous content can exceed 95% at most. From the cross-section and surface morphologies of coating, the optimization process of powders is effective, and the coatings deposition performance is good. The hardness of coating 1 is 6.61 ± 0.12 GPa, and the porosity is 1.21 ± 0.33%.

Author Contributions

Conceptualization, Z.Z. and K.Y.; Data Curation, Z.Z., J.R., Y.Z., J.S., X.Z., and C.D.; Formal Analysis, Z.Z., Y.A., and K.Y.; Writing—Original Draft Preparation, Z.Z.; Writing—Review & Editing, K.Y. and H.Y. All authors have read and agreed to the published version of the manuscript.

Funding

This study is jointly supported by National Nature Science Foundation of China (51772311), Shanghai Nature Science Fund Project (17ZR1434700) and Youth Innovation Promotion Association, Chinese Academy of Sciences (2016230).

Conflicts of Interest

The authors declare no conflict of interest.

References

  1. Pereira, P.F.; Matos, M.G.; Avila, L.R.; Nassor, E.C.; Cestari, A.; Ciuffi, K.J.; Calefi, P.S.; Nassar, E.J. Red, green and blue (RGB) emission doped Y3Al5O12 (YAG) phosphors prepared by non-hydrolytic sol-gel route. J. Lumin. 2010, 130, 488–493. [Google Scholar] [CrossRef]
  2. Lin, Z.; Lin, H.; Xu, J.; Huang, F.; Chen, H.; Wang, B.; Wang, Y. Highly thermal-stable warm w-LED based on Ce:YAG PiG stacked with a red phosphor layer. J. Alloys Compd. 2015, 649, 661–665. [Google Scholar] [CrossRef]
  3. Ge, L.; Li, J.; Zhou, Z.; Qu, H.; Dong, M.; Zhu, Y.; Xie, T.; Li, W.; Chen, M.; Kou, H.; et al. Fabrication of composite YAG/Nd:YAG/YAG transparent ceramics for planar waveguide laser. Opt. Mater. Express 2014, 4, 1042–1049. [Google Scholar] [CrossRef]
  4. Chen, J.; Li, J.; Xu, J.; Liu, W.; Bo, Y.; Feng, X.; Xu, Y.; Jiang, D.; Chen, Z.; Pan, Y.; et al. 4350W quasi-continuous-wave operation of a diode face-pumped ceramic Nd:YAG slab laser. Opt. Laser Technol. 2014, 63, 50–53. [Google Scholar] [CrossRef]
  5. Rong, J.; Yang, K.; Zhuang, Y.; Zhong, X.; Zhao, H.; Ni, J.; Tao, S.; Wang, L.; Ding, C. Non-isothermal crystallization kinetics of Al2O3–YAG amorphous ceramic coating deposited via plasma spraying. J. Am. Ceram. Soc. 2018, 101, 2888–2900. [Google Scholar] [CrossRef]
  6. Yang, K.; Rong, J.; Feng, J.; Zhuang, Y.; Tao, S.; Ding, C. In-situ fabrication of amorphous/eutectic Al2O3–YAG ceramic composite coating via atmospheric plasma spraying. J. Eur. Ceram. Soc. 2016, 36, 4261–4267. [Google Scholar] [CrossRef]
  7. Yang, K.; Rong, J.; Feng, J.; Zhuang, Y.; Zhao, H.; Wang, L.; Ni, J.; Tao, S.; Shao, F.; Ding, C. Excellent wear resistance of plasma-sprayed amorphous Al2O3–Y3Al5O12 ceramic coating. Surf. Coat. Technol. 2017, 326, 96–102. [Google Scholar] [CrossRef]
  8. Yang, K.; Rong, J.; Zhuang, Y.; Ni, J.; Yang, J.; Tao, S.; Shao, F.; Ding, C. Microstructure and high PV wear behavior of novel amorphous Al2O3–YAG ceramic coating fabricated by atmospheric plasma spraying. J. Therm. Spray Technol. 2019, 28, 803–825. [Google Scholar] [CrossRef]
  9. Parthasarathy, T.A.; Mah, T.-I.; Keller, K. Creep mechanism of polycrystalline yttrium aluminum garnet. J. Am. Ceram. Soc. 1992, 75, 1756–1759. [Google Scholar] [CrossRef]
  10. Liu, Y.; Zhang, Z.-F.; King, B.; Halloran, J.; Laine, R.M. Synthesis of yttrium aluminum garnet from yttrium and aluminum isobutyrate precursors. J. Am. Ceram. Soc. 1996, 79, 385–394. [Google Scholar] [CrossRef] [Green Version]
  11. Sakaguchi, I.; Haneda, H.; Tanaka, J.; Yanagitani, T. Effect of composition on the oxygen tracer diffusion in transparent yttrium aluminium garnet (YAG) ceramics. J. Am. Ceram. Soc. 1996, 79, 1627–1632. [Google Scholar] [CrossRef]
  12. Chen, Y.-T.; Lin, S.H.; Hsieh, W.H. Differential scanning calorimetric determination of the thermal properties of amorphous Co60Fe20B20 and Co40Fe40B20 thin films. Appl. Phys. Lett. 2013, 102, 051905. [Google Scholar] [CrossRef]
  13. Zhang, Y.; Chen, J.; Chen, G.L.; Liu, X.J. Glass formation mechanism of minor yttrium addition in CuZrAl alloys. Appl. Phys. Lett. 2006, 89, 131901–131904. [Google Scholar] [CrossRef]
  14. Lu, Y.; Huang, Y.; Wei, X.; Shen, J. Close correlation between transport properties and glass-forming ability of an FeCoCrMoCBY alloy system. Intermetallics 2012, 30, 144–147. [Google Scholar] [CrossRef]
  15. Wang, H.; Gao, L.; Niihara, K. Synthesis of nanoscaled yttrium aluminum garnet powder by the co-precipitation method. Mater. Sci. Eng. A 2000, 288, 1–4. [Google Scholar] [CrossRef]
  16. Tong, S.; Lu, T.; Guo, W. Synthesis of YAG powder by alcohol–water co-precipitation method. Mater. Lett. 2007, 61, 4287–4289. [Google Scholar] [CrossRef]
  17. Hassanzadeh-Tabrizi, S.A.; Taheri-Nassaj, E.; Sarpoolaky, H. Synthesis of an alumina–YAG nanopowder via sol–gel method. J. Alloys Compd. 2008, 456, 282–285. [Google Scholar] [CrossRef]
  18. Chen, D.; Jordan, E.H.; Gell, M. Sol-gel combustion synthesis of nanocrystalline YAG powder from metal-organic precursors. J. Am. Ceram. Soc. 2008, 91, 2759–2762. [Google Scholar] [CrossRef]
  19. Gandhi, A.S.; Levi, C.G. Phase selection in precursor-derived yttrium aluminum garnet and related Al2O3–Y2O3 compositions. J. Mater. Res. 2005, 20, 1017–1025. [Google Scholar] [CrossRef]
  20. Mizutani, Y.; Yasuda, H.; Ohnaka, I.; Waku, Y. Phase selection of the Al2O3–Y2O3 system controlled by nucleation. Mater. Trans. JIM 2001, 42, 238–244. [Google Scholar] [CrossRef] [Green Version]
  21. Fabrichnaya, O.; Seifert, H.J.; Ludwig, T.; Aldinger, F.; Navrotsky, A. The assessment of thermodynamic parameters in the Al2O3–Y2O3 system and phase relations in the Y–Al–O system. Scand. J. Metall. 2002, 30, 175–183. [Google Scholar] [CrossRef]
  22. Florian, P.; Gervais, M.; Douy, A.; Massiot, D.; Coutures, J.P. A multinuclear multiple-field nuclear magnetic resonance study of the Y2O3–Al2O3 phase diagram. J. Phys. Chem. B 2001, 105, 379–391. [Google Scholar] [CrossRef]
  23. Medraj, M.; Hammond, R.; Parvez, M.A.; Drew, R.A.L.; Thompson, W.T. High temperature neutron diffraction study of the Al2O3–Y2O3 system. J. Eur. Ceram. Soc. 2006, 26, 3515–3524. [Google Scholar] [CrossRef]
  24. Kupp, E.R.; Kochawattana, S.; Lee, S.H.; Misture, S.; Messing, G.L. Particle size effects on yttrium aluminum garnet (YAG) phase formation by solid-state reaction. J. Mater. Res. 2014, 29, 2303–2311. [Google Scholar] [CrossRef]
  25. Hung, C.-T.; Lai, C.-Y.; Yen, F.-S. Size ratio induced yttrium aluminum garnet formation characteristics in nano-scaled Y2O3–Al2O3 powder systems via fast firing processes. Mater. Chem. Phys. 2011, 129, 534–539. [Google Scholar] [CrossRef]
  26. Li, J.; Liu, J.; Liu, B.; Liu, W.; Zeng, Y.; Ba, X.; Xie, T.; Jiang, B.; Liu, Q.; Pan, Y.; et al. Influence of heat treatment of powder mixture on the microstructure and optical transmission of Nd:YAG transparent ceramics. J. Eur. Ceram. Soc. 2014, 34, 2497–2507. [Google Scholar] [CrossRef]
Figure 1. Morphologies of spray granulation powders: (a) ×300; (b) ×1500.
Coatings 10 01158 g001
Figure 2. XRD patterns of spray granulation Al2O3–Y2O3 powder and powder calcinated at different temperatures for 2 h.
Coatings 10 01158 g002
Figure 3. The ratio of diffraction intensity at different temperatures to 900 °C: (a) α-Al2O3 (b) c-Y2O3.
Coatings 10 01158 g003
Figure 4. Microscopic morphologies of granulated powders calcined for 2 h at different temperatures: (a) 900 °C; (b) 1000 °C; (c) 1100 °C; (d) 1200 °C; (e) 1300 °C; (f) 1400 °C; (g) 1500 °C; (h) 1500 °C (×200).
Coatings 10 01158 g004aCoatings 10 01158 g004b
Figure 5. Macroscopic morphologies of granulated powders calcined for 2 h at different temperatures: (a) RT; (b) 900 °C; (c) 1000 °C; (d) 1100 °C; (e) 1200°C; (f) 1300 °C; (g) 1400 °C; (h) 1500 °C.
Coatings 10 01158 g005
Figure 6. DTA curve of granulation powders under different heating rates.
Coatings 10 01158 g006
Figure 7. Schematic illustration of solid-state reaction process of Al2O3–Y2O3 system.
Coatings 10 01158 g007
Figure 8. The morphology of powders after process optimization. (a) ×300; (b) ×1500.
Coatings 10 01158 g008
Figure 9. XRD patterns of sprayed feedstock and corresponding ceramic coatings.
Coatings 10 01158 g009
Figure 10. The cross-section and surface morphologies of the ceramic coatings (ac) coating 1; (df) coating 2.
Coatings 10 01158 g010
Table 1. Plasma spraying parameters operated in this study.
ParametersNiCr Bond CoatingCeramic Coatings 1Ceramic Coatings 2
Arc current,A600670670
Primary plasma gas (Ar), slpm555050
Secondary plasma gas (H2), slpm81010
Carrier gas (Ar), slpm3.534
Powder feed rate, g/min204030
Relatively speed between torch and substrate, mm/s6.46.46.4
Stand-off distance,mm110120120
Table 2. Rough quantitative comparison of crushing amount of different crystal planes of α-Al2O3 and c-Y2O3 based on molar ratio Al2O3:Y2O3 = 82:18.
PhaseMolar Amount Per 100 molCrystal Plane1000 °C1100 °C1200 °C1300 °C
Al2O382(104)6.1413.0611.1815.99
(113)3.8610.4515.2219.78
(116)2.9411.6621.8626.84
Y2O318(222)1.304.989.3712.31
(440)0.865.449.4813.03
(622)0.854.329.0612.13
Publisher’s Note: MDPI stays neutral with regard to jurisdictional claims in published maps and institutional affiliations.

