
Microbial Communities in Model Seawater-Compensated Fuel Ballast Tanks: Biodegradation and Biocorrosion Stimulated by Marine Sediments
 , ,
, ,
Abstract
:1. Introduction
2. Materials and Methods
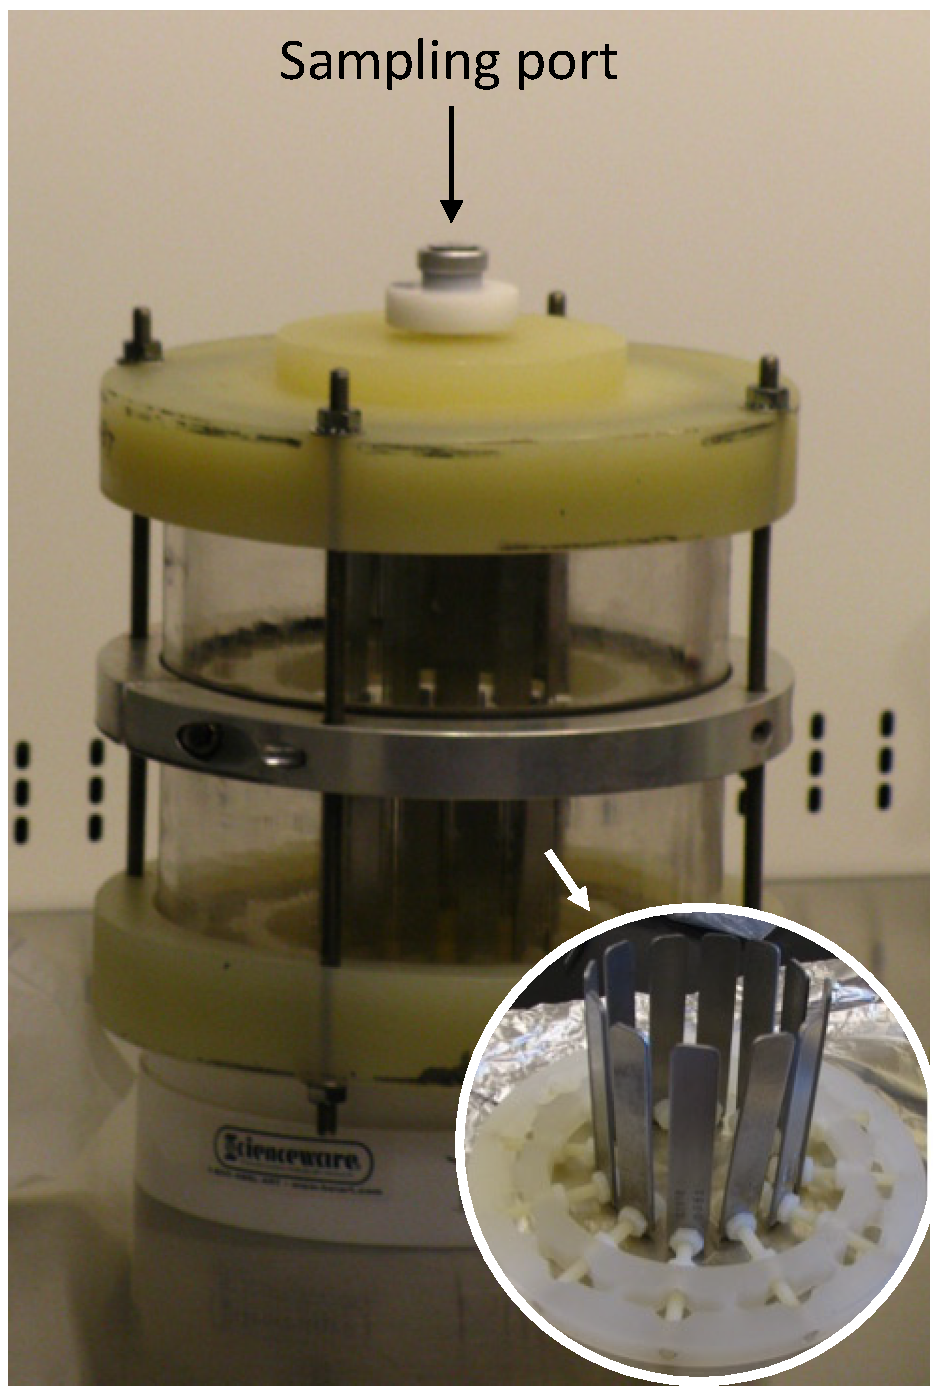
2.1. Reactor Design
2.2. Chemical Analyses
2.3. Scanning Electron Microscopy (SEM) and Energy Dispersive X-ray (EDX) Methodology
2.4. Sulfate Reduction Assay
2.5. Sample Collection and DNA Extraction
2.6. Quantification of 16S rRNA by Quantitative PCR
2.7. Construction and Analysis of 16S rRNA Amplicon Libraries
2.8. Statistical Analysis
3. Results
3.1. Chemical Analyses
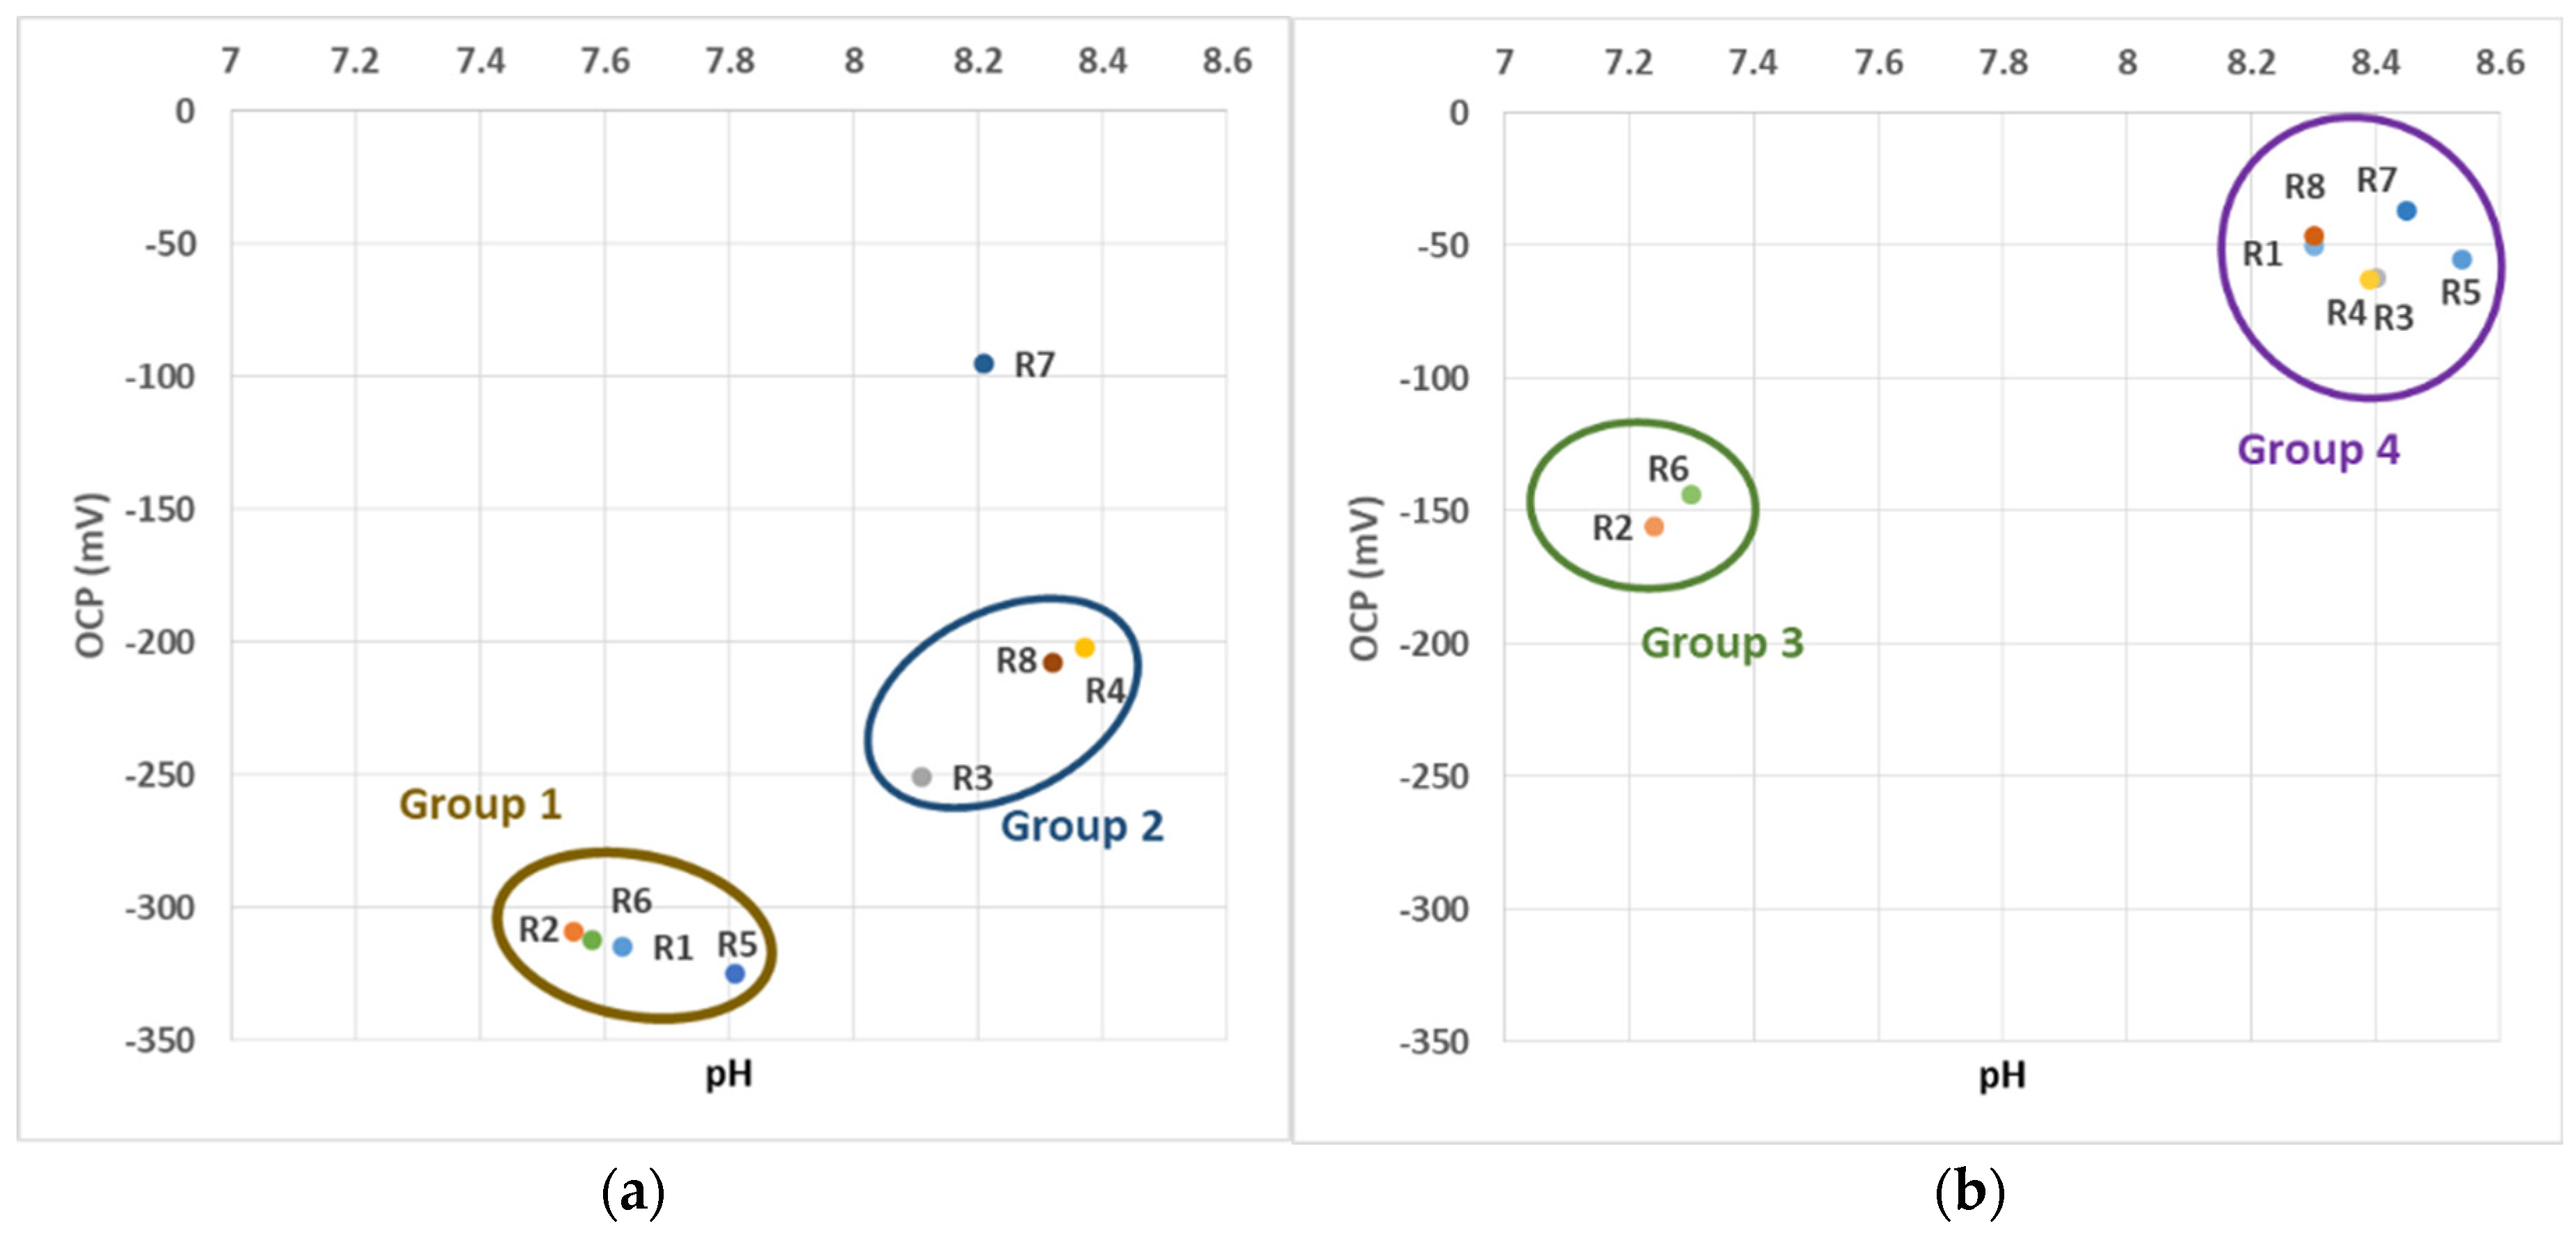
3.1.1. OCP and pH
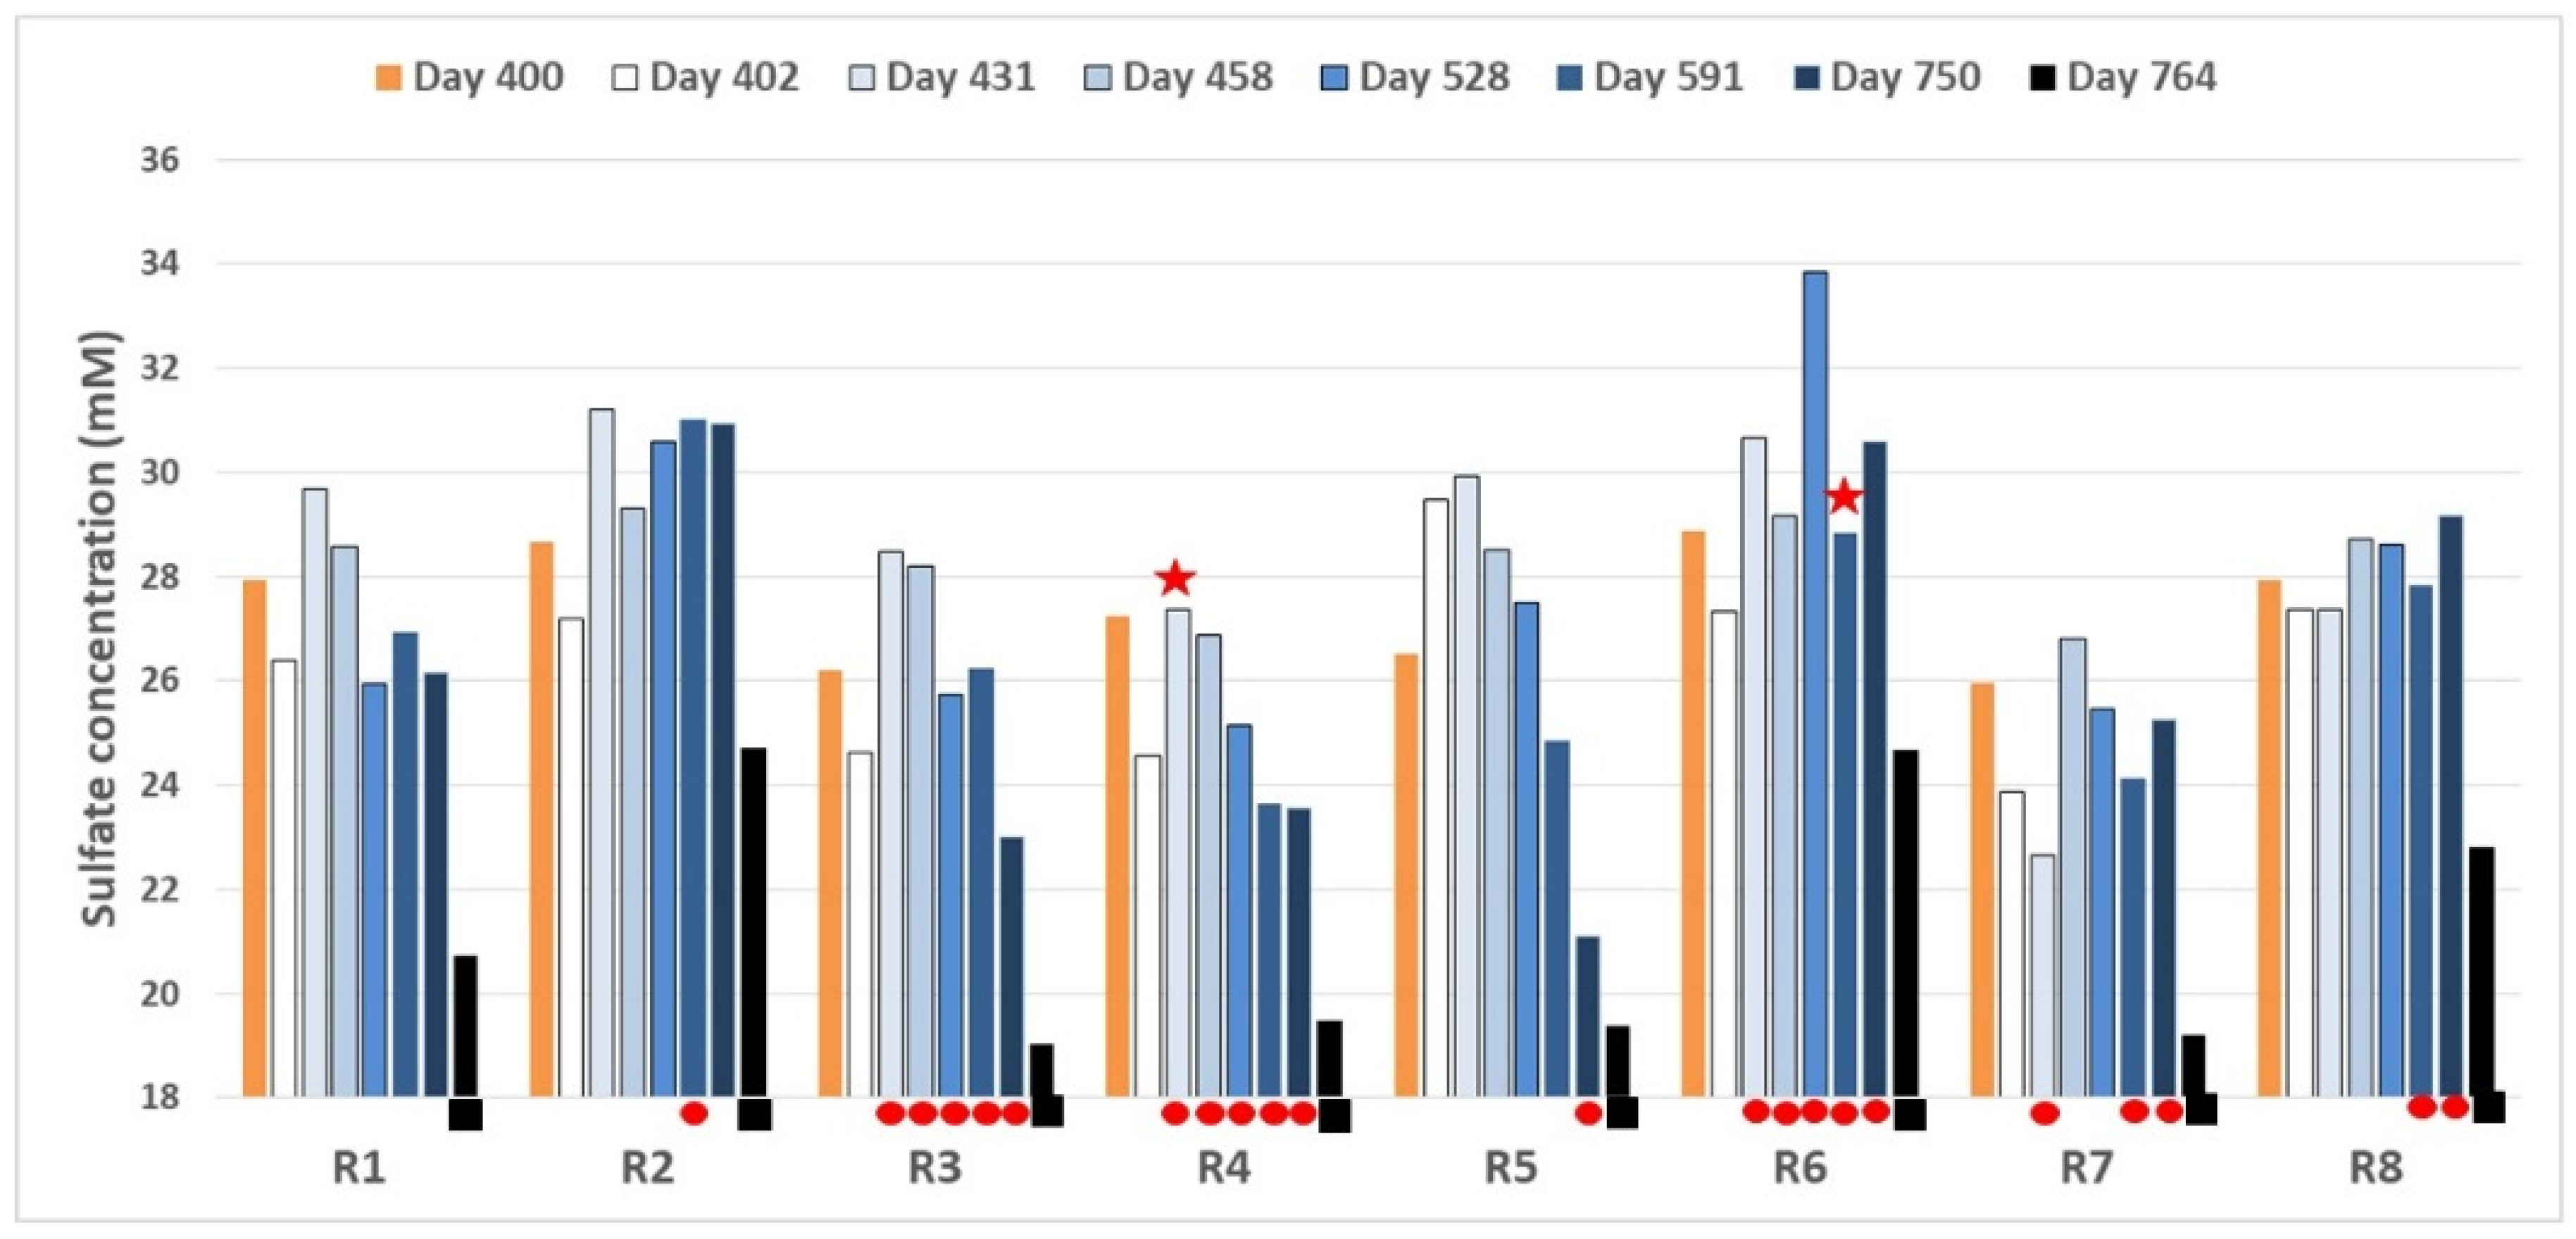
3.1.2. Sulfur Species
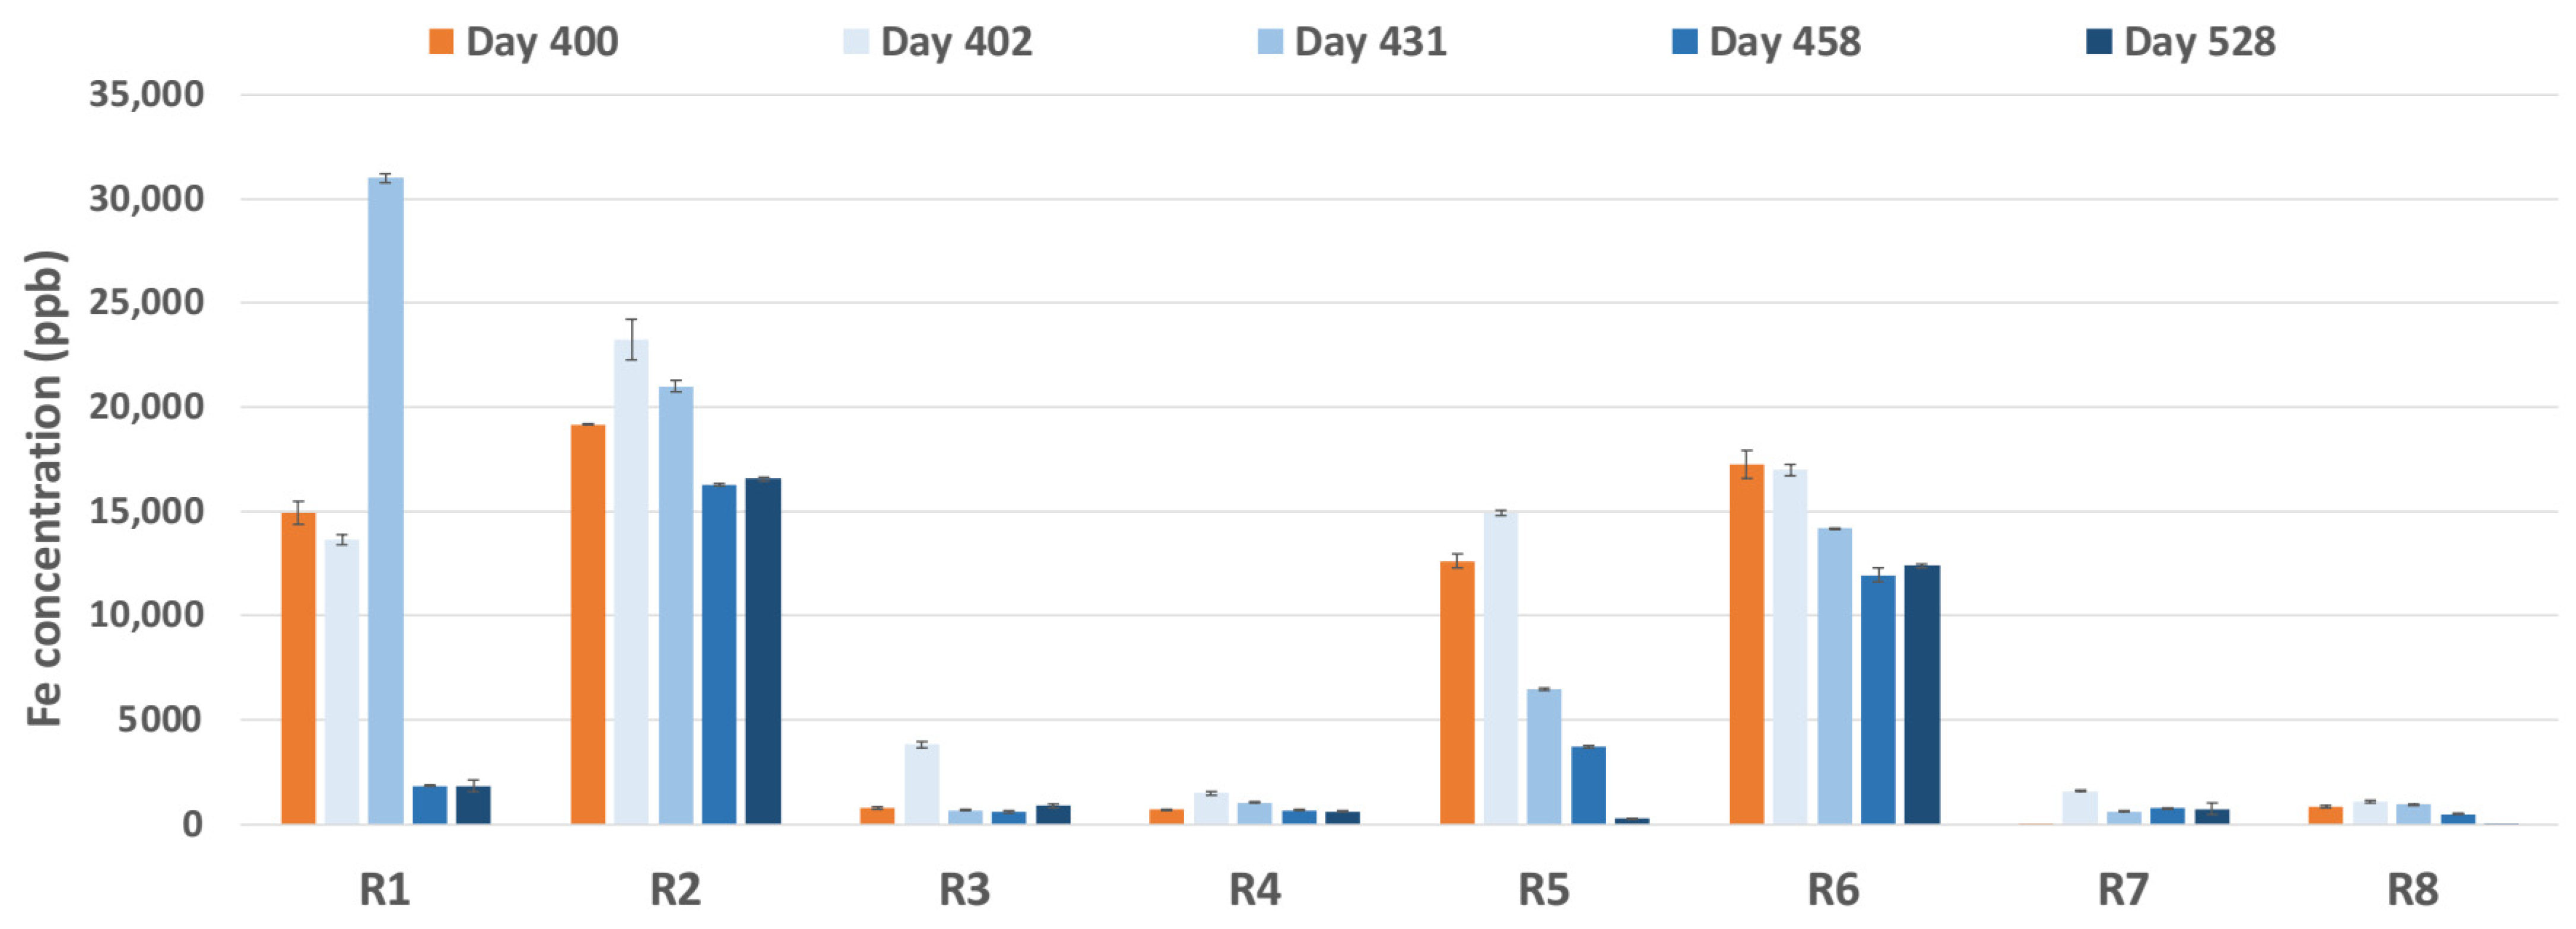
3.1.3. Dissolved Fe
3.2. Analysis of Coupon Surfaces
3.2.1. EDX
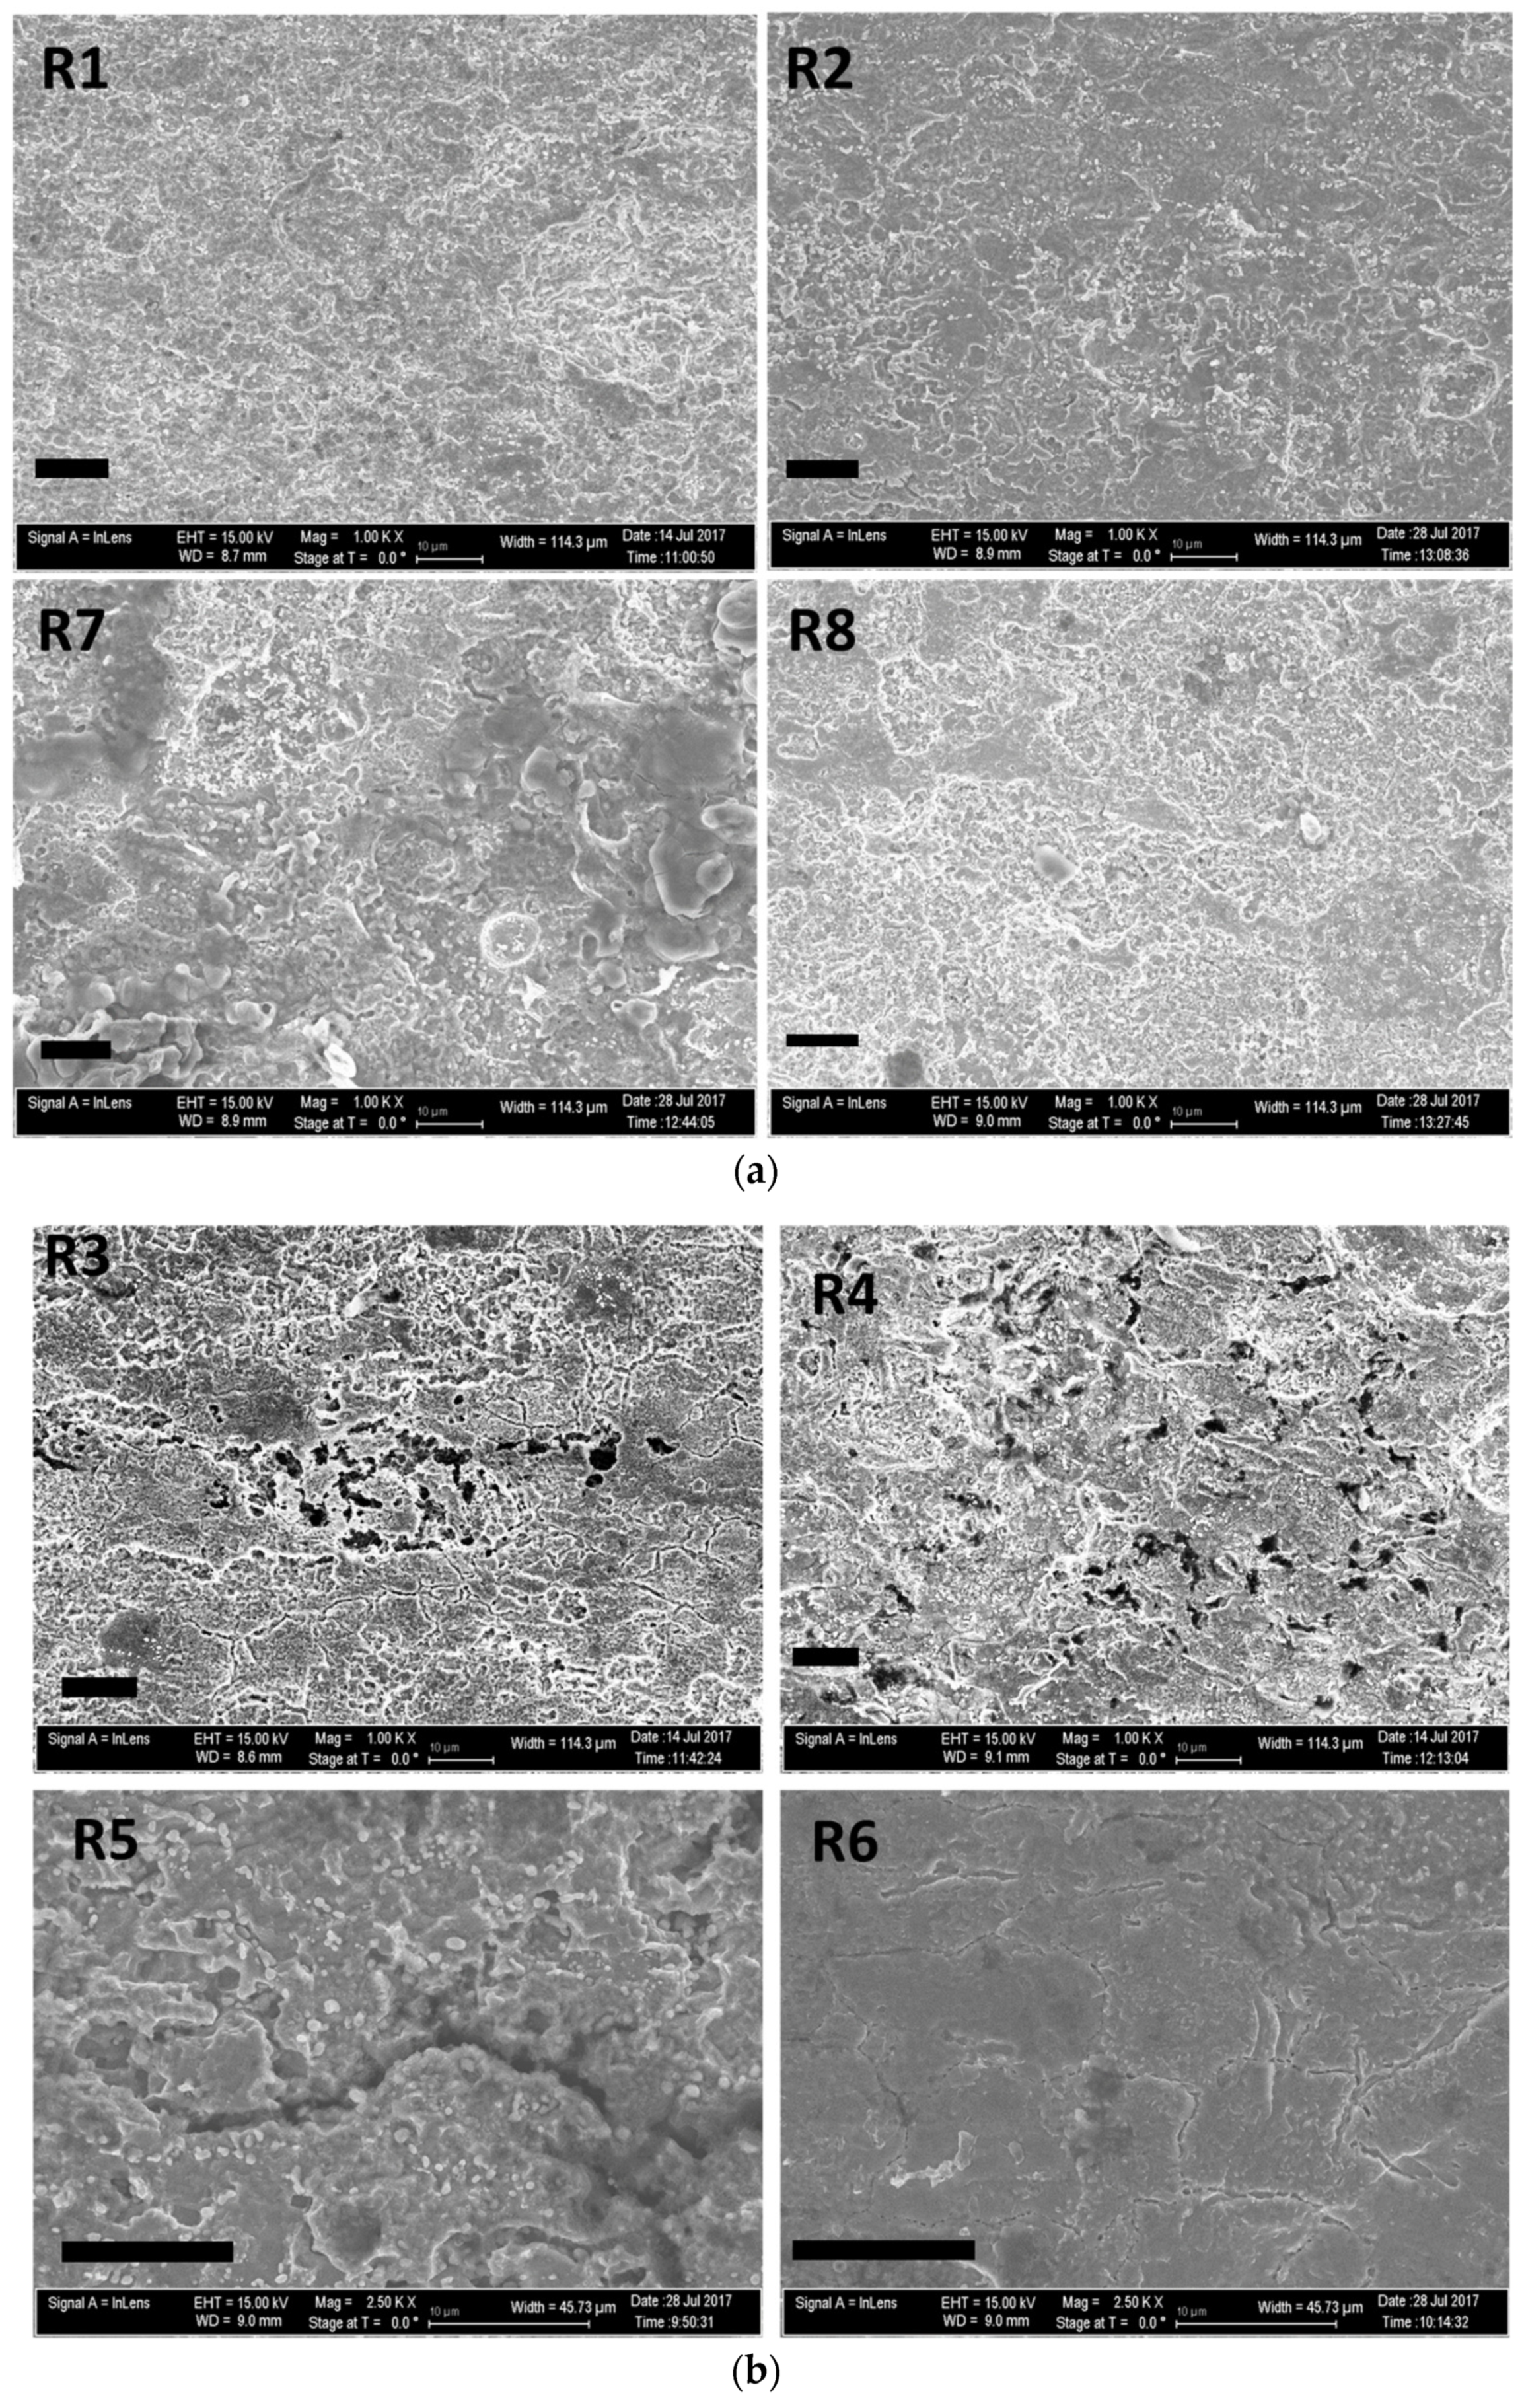
3.2.2. SEM
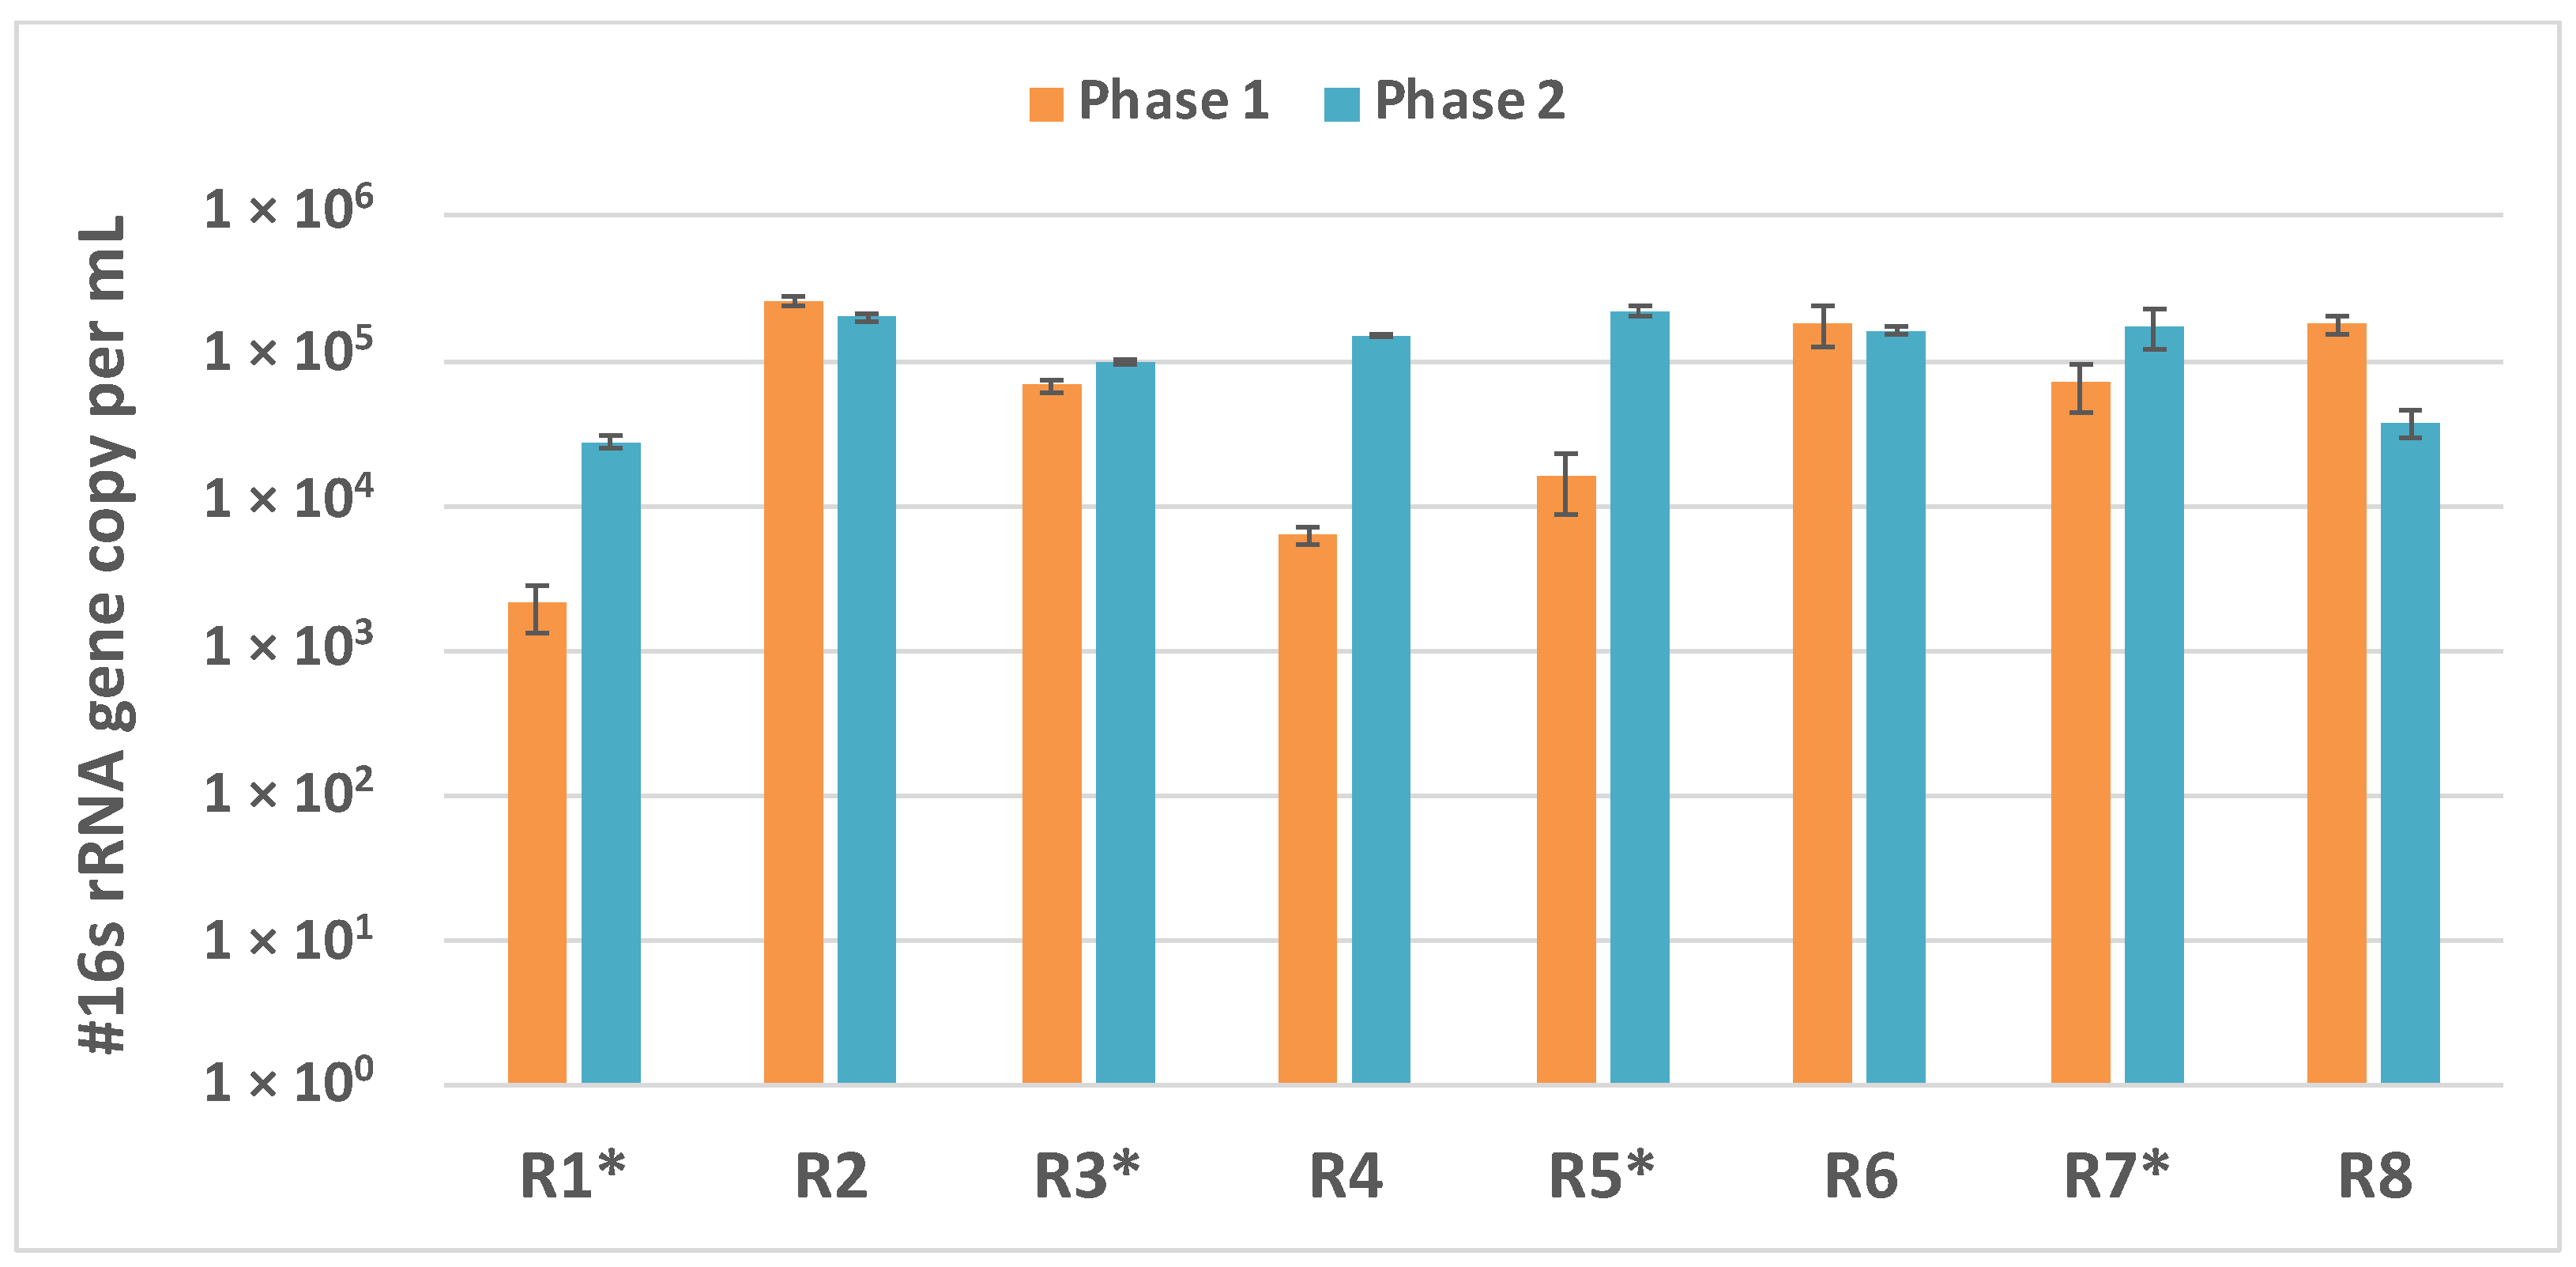
3.3. Microbial Enumeration: qPCR Estimates of # 16S rRNA Gene Copies
3.4. Microbial Community Analysis: 16S rRNA Amplicon Libraries
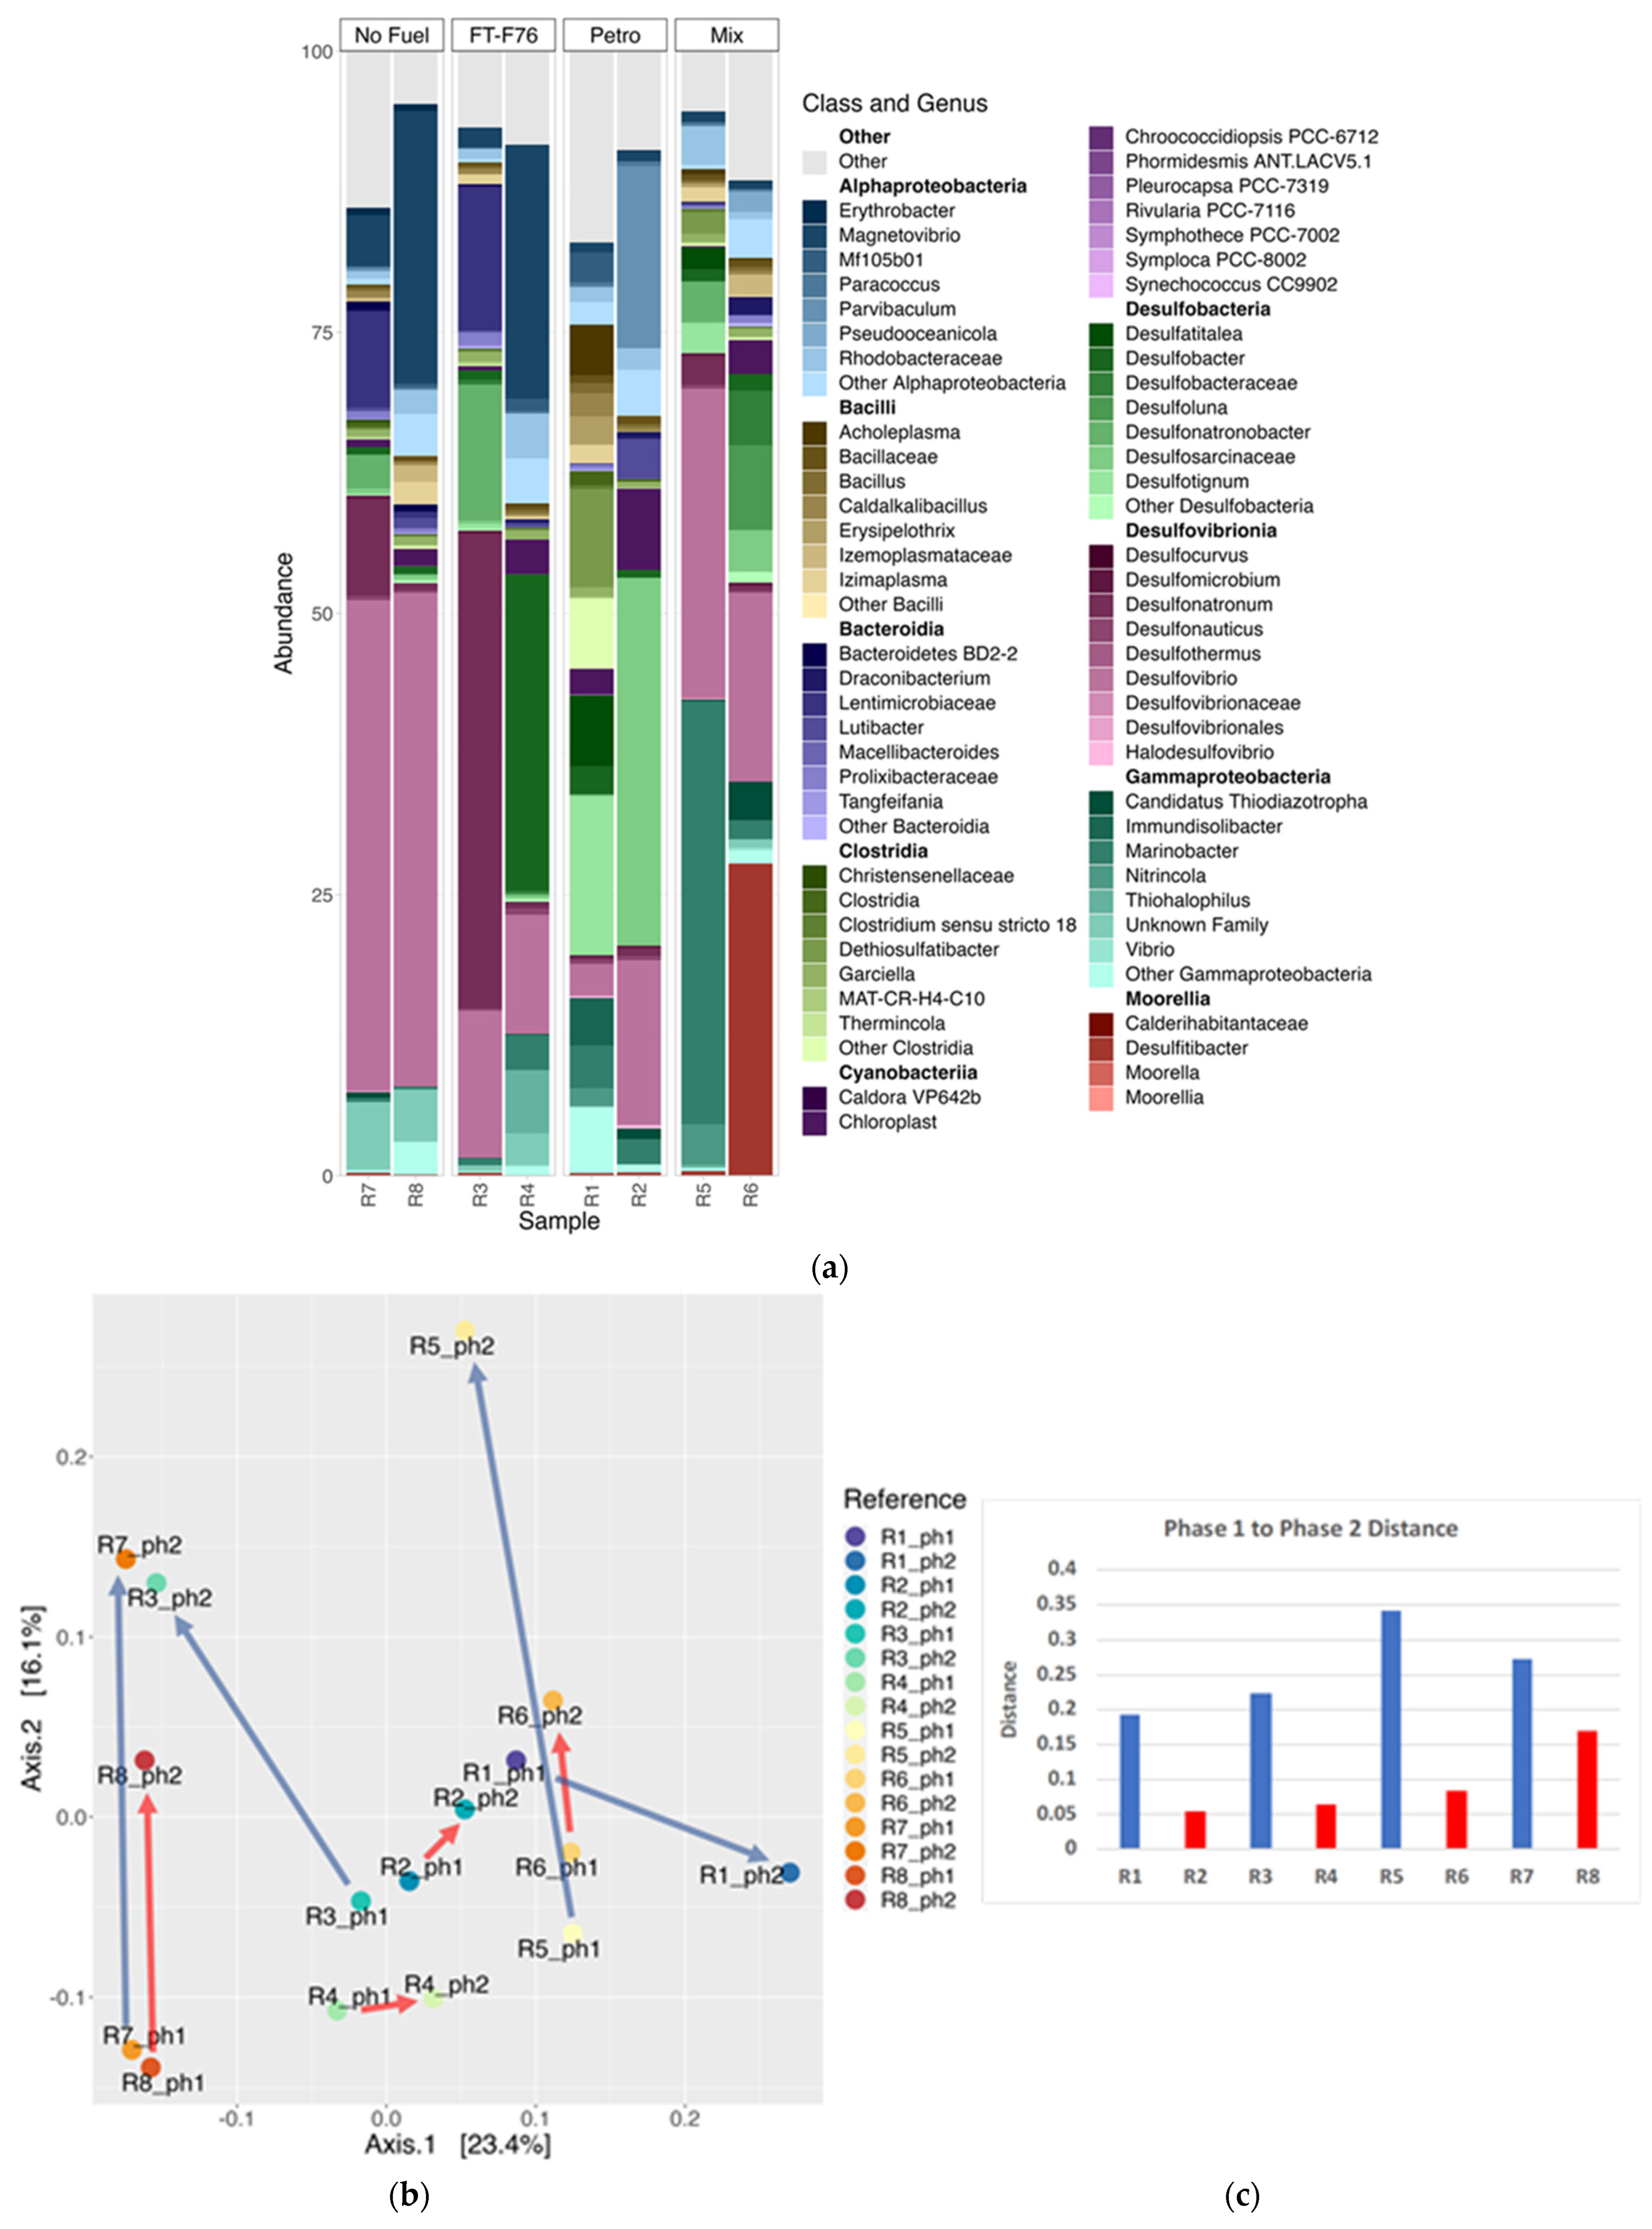
3.4.1. Phase 2 Water Samples
3.4.2. Comparison of Microbial Communities from Phase 1 and Phase 2 Water Samples
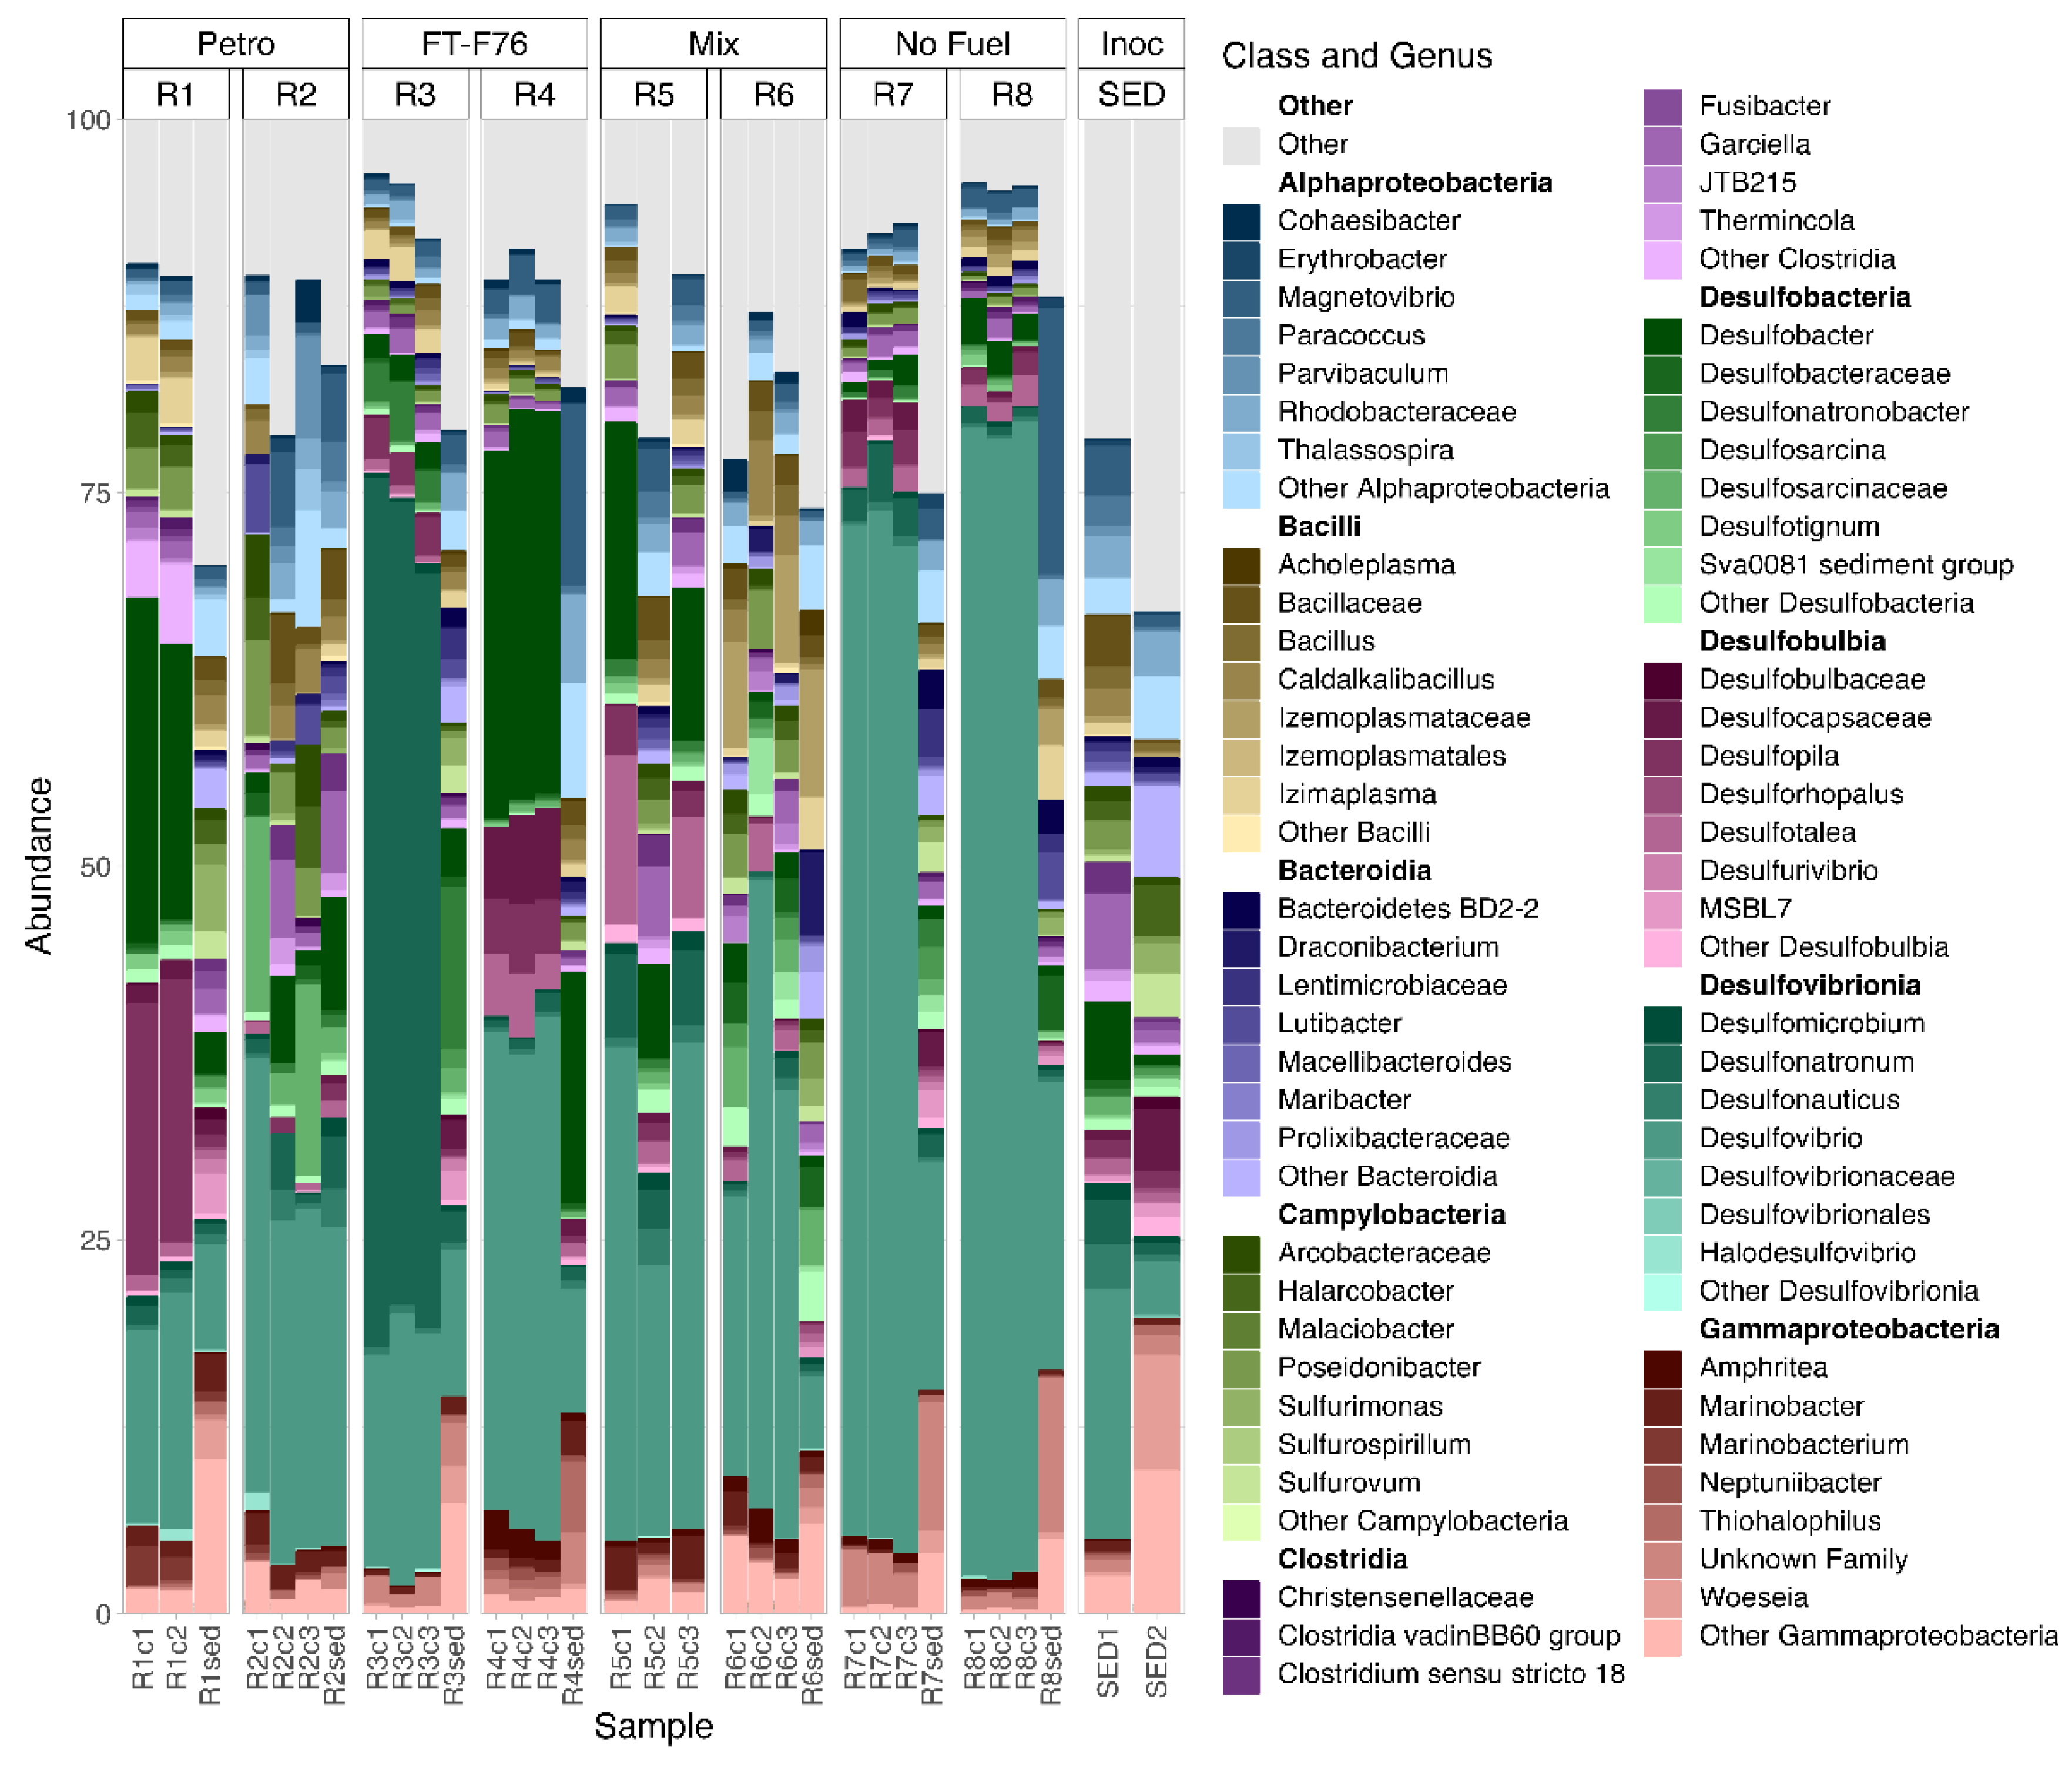
3.5. Microbial Communities in Reactor Sediment Samples and on Coupon Surfaces
3.5.1. Coupon Communities Associated with Different Fuel Types
3.5.2. Coupon Communities Associated with Pitting Corrosion
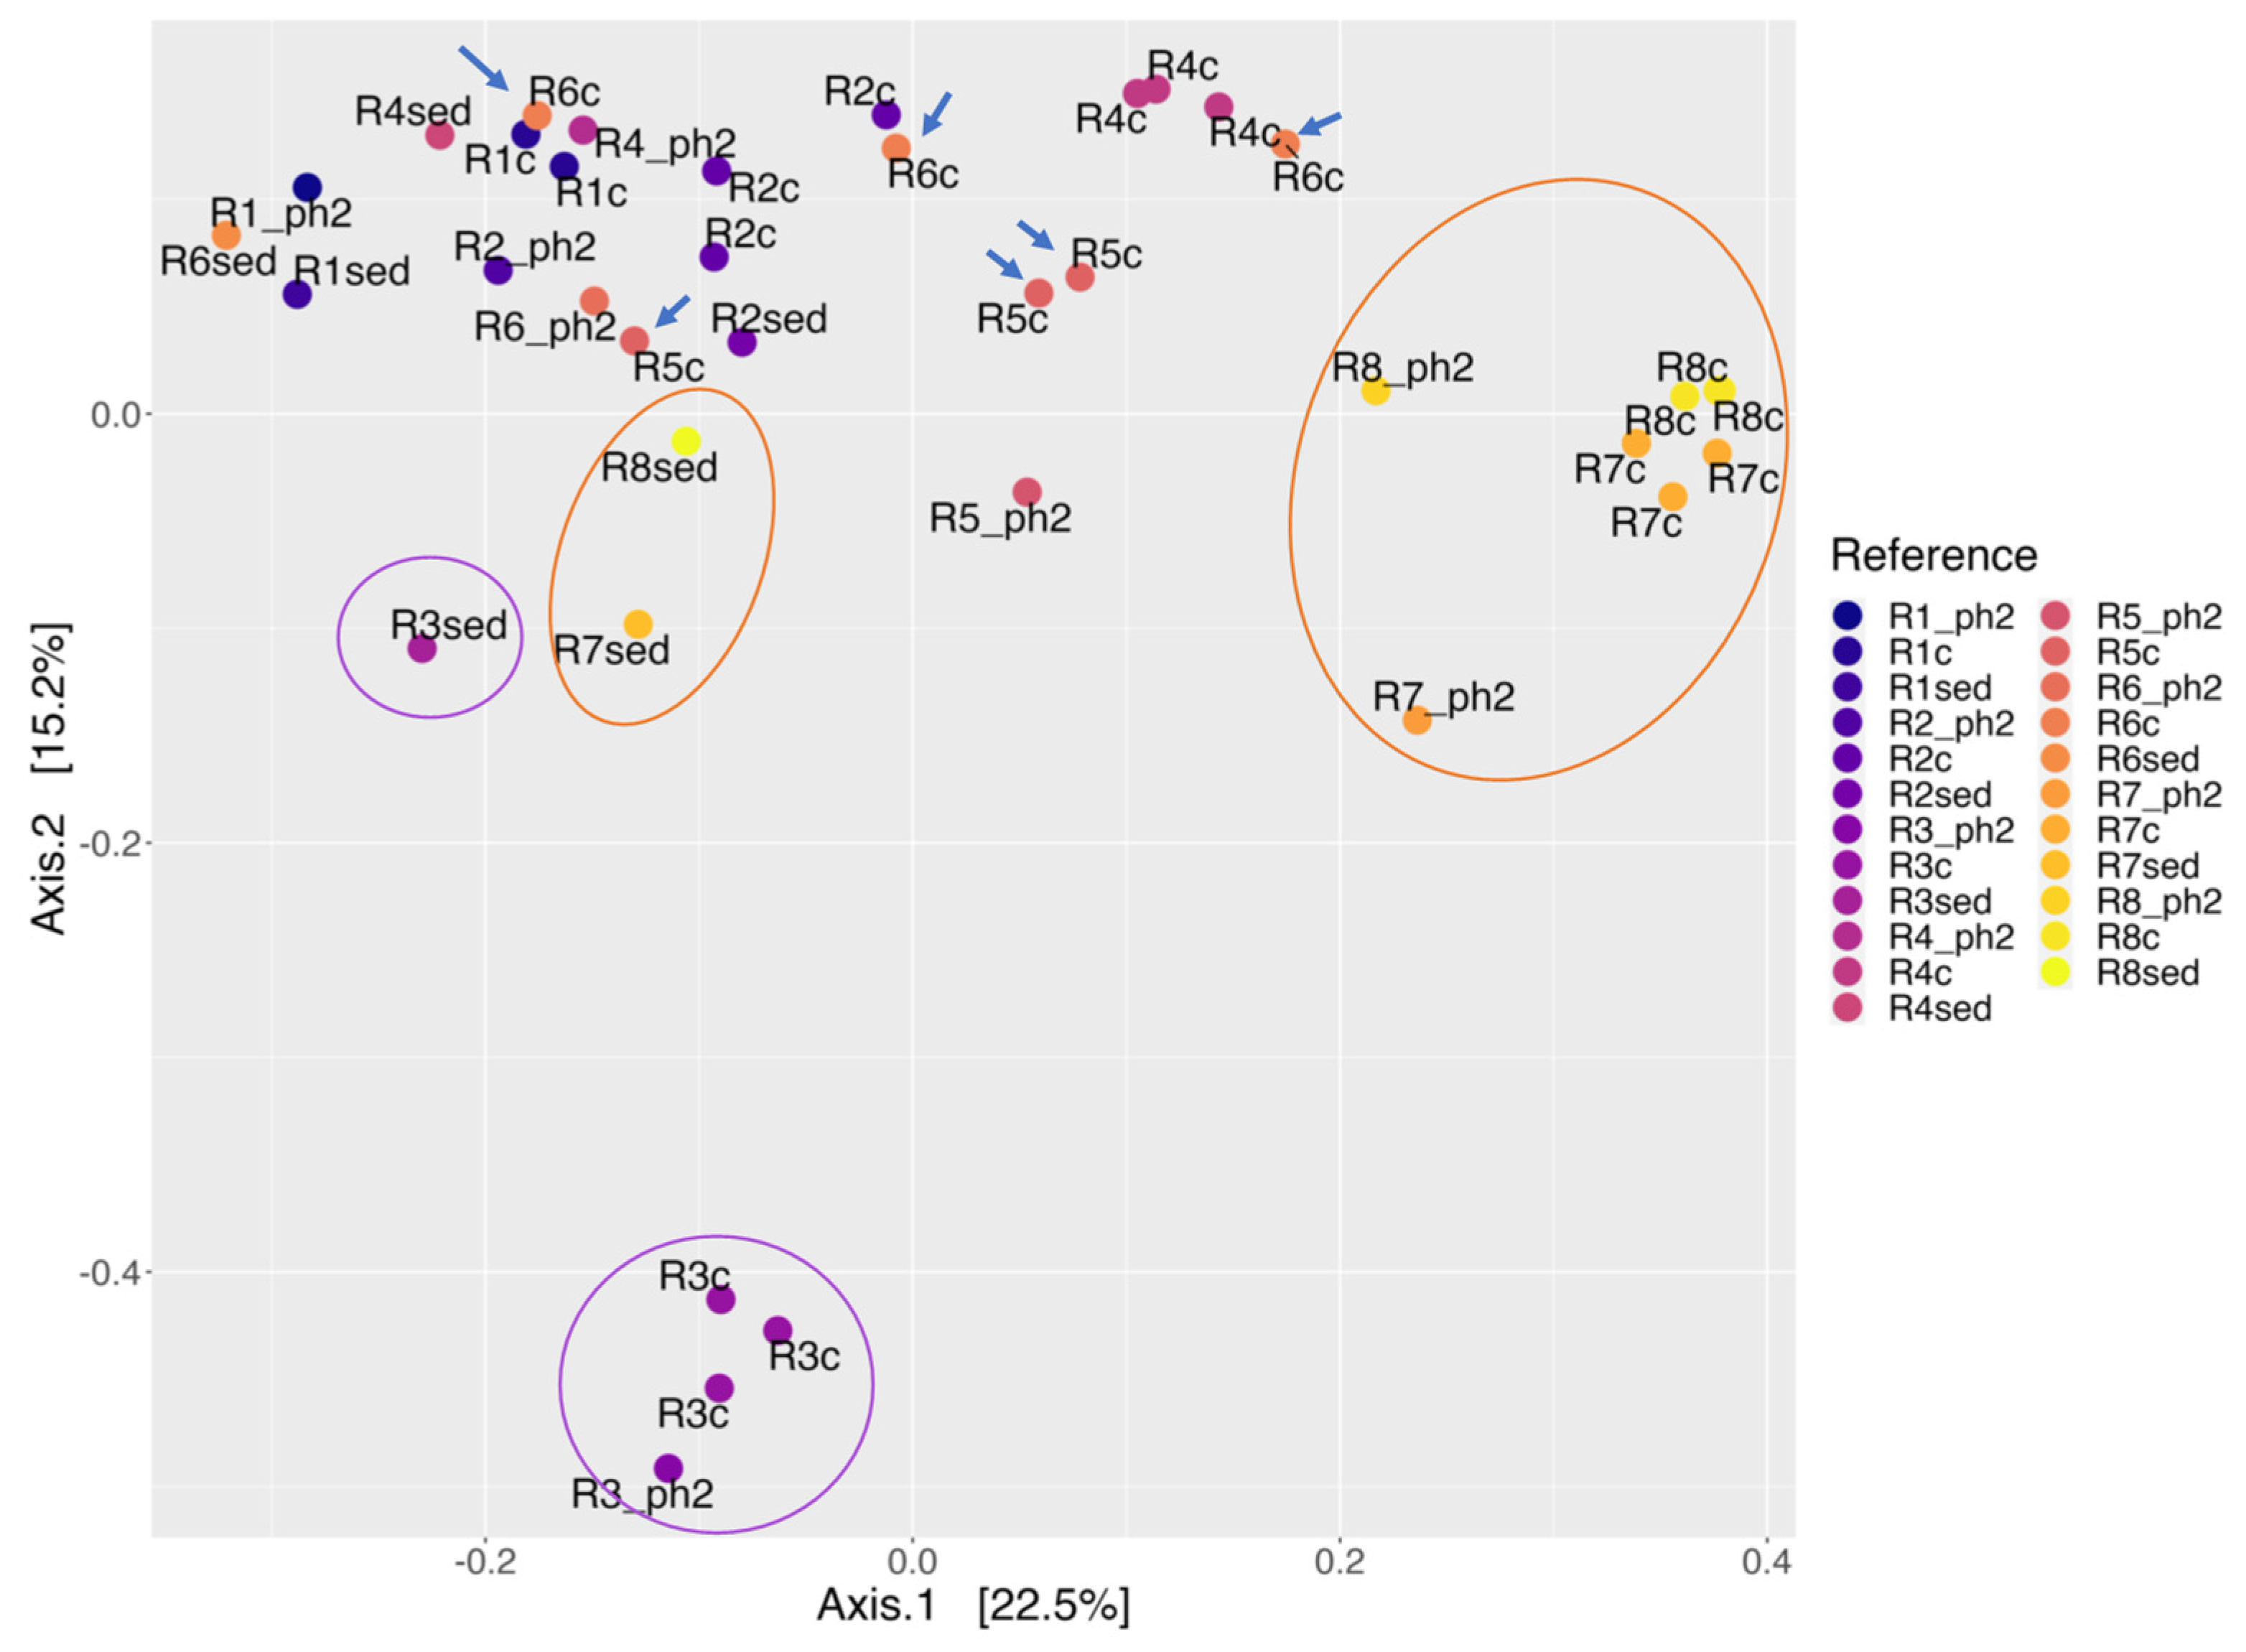
3.6. Comparison of Water, Sediment and Coupon Samples
4. Discussion
4.1. Effects of Adding Marine Sediments to Ballast Tanks
4.2. Biodegradation and Biocorrosion Triggered by Addition of Marine Sediments to Fuel-Compensated Ballast Tanks
4.2.1. Effect of Dissolved Iron on Aerobic Hydrocarbon Degradation
4.2.2. Differential Toxicity of Various Fuel Components to Microorganisms
4.2.3. Effect of Fuel Composition on Biodegradability and Corrosion
5. Conclusions and Recommendations
Supplementary Materials
Author Contributions
Funding
Data Availability Statement
Acknowledgments
Conflicts of Interest
References
- Ruiz, G.M.; Rawlings, T.K.; Dobbs, F.C.; Drake, L.A.; Mullady, T.; Huq, A.; Colwell, R.R. Global spread of microorganisms by ships. Nature 2000, 408, 49–50. [Google Scholar] [CrossRef] [PubMed]
- Drake, L.A.; Doblin, M.A.; Dobbs, F.C. Potential microbial bioinvasions via ships’ ballast water, sediment, and biofilm. Mar. Pollut. Bull. 2007, 55, 333–341. [Google Scholar] [CrossRef] [PubMed]
- Burkholder, J.M.; Hallegraeff, G.M.; Melia, G.; Cohen, A.; Bowers, H.A.; Oldach, D.W.; Parrow, M.W.; Sullivan, M.J.; Zimba, P.V.; Allen, E.H.; et al. Phytoplankton and bacterial assemblages in ballast water of U.S. military ships as a function of port of origin, voyage time, and ocean exchange practices. Harmful Algae 2007, 6, 486–518. [Google Scholar] [CrossRef]
- Xue, Z.; Tian, W.; Han, Y.; Feng, Z.; Wang, Y.; Zhang, W. The hidden diversity of microbes in ballast water and sediments revealed by metagenomic sequencing. Sci. Total Environ. 2023, 882, 163666. [Google Scholar] [CrossRef] [PubMed]
- Heyer, A.; D’Souza, F.; Morales, C.F.L.; Ferrari, G.; Mol, J.M.C.; De Wit, J.H.W. Ship ballast tanks a review from microbial corrosion and electrochemical point of view. Ocean Eng. 2013, 70, 188–200. [Google Scholar] [CrossRef]
- Güney, C.B.; Danışman, D.B.; Bozkurtoğlu, S.N.E. Reduction of ballast tank sediment: Evaluating the effect of minor structural changes and developing a pneumatic cleaning system. Ocean Eng. 2020, 203, 107204. [Google Scholar] [CrossRef]
- Marks, C.R.; Duncan, K.E.; Nanny, M.A.; Harriman, B.H.; Avci, R.; Oldham, A.L.; Suflita, J.M. An integrated metagenomic and metabolite profiling study of hydrocarbon biodegradation and corrosion in navy ships. NPJ Mater. Degrad. 2021, 5, 60. [Google Scholar] [CrossRef]
- Maglić, L.; Frančić, V.; Zec, D.; David, M. Ballast water sediment management in ports. Mar. Pollut. Bull. 2019, 147, 237–244. [Google Scholar] [CrossRef]
- Feng, D.; Chen, X.; Tian, W.; Qian, Q.; Shen, H.; Liao, D.; Lv, B. Pollution characteristics and ecological risk of heavy metals in ballast tank sediment. Environ. Sci. Pollut. Res. 2017, 24, 3951–3958. [Google Scholar] [CrossRef]
- Hamer, J.P. Ballast Tank Sediments. In Invasive Aquatic Species of Europe. Distribution, Impacts and Management; Leppäkoski, E., Gollasch, S., Olenin, S., Eds.; Kluwer Academic Publishers: Dordrecht, The Netherlands, 2002; pp. 232–234. [Google Scholar]
- Lv, B.; Cui, Y.; Tian, W.; Feng, D. Composition and influencing factors of bacterial communities in ballast tank sediments: Implications for ballast water and sediment management. Mar. Environ. Res. 2017, 132, 14–22. [Google Scholar] [CrossRef]
- Lv, B.; Shi, J.; Li, T.; Ren, L.; Tian, W.; Lu, X.; Han, Y.; Cui, Y.; Jiang, T. Deciphering the characterization, ecological function and assembly processes of bacterial communities in ship ballast water and sediments. Sci. Total Environ. 2022, 816, 152721. [Google Scholar] [CrossRef] [PubMed]
- Cleland, J.H. Corrosion risks in ships´ ballast tanks and the IMO pathogen guidelines. Eng. Failure Anal. 1995, 2, 79–84. [Google Scholar] [CrossRef]
- Van Hamme, J.D.; Singh, A.; Ward, O.P. Recent advances in petroleum microbiology. Microbiol. Mol. Biol. Rev. 2003, 67, 503–549. [Google Scholar] [CrossRef] [PubMed]
- Kostka, J.E.; Teske, A.P.; Joye, S.B.; Head, I.M. The metabolic pathways and environmental controls of hydrocarbon biodegradation in marine ecosystems. Front. Microbiol. 2014, 5, 471. [Google Scholar] [CrossRef] [PubMed]
- Davidova, I.A.; Marks, C.R.; Suflita, J.M. Anaerobic Hydrocarbon-Degrading Deltaproteobacteria. In Taxonomy, Genomics and Ecophysiology of Hydrocarbon-Degrading Microbes. Handbook of Hydrocarbon and Lipid Microbiology; McGenity, T., Ed.; Springer: Cham, Switzerland, 2018. [Google Scholar] [CrossRef]
- Rabus, R.; Boll, M.; Heider, J.; Meckenstock, R.U.; Buckel, W.; Einsle, O.; Ermler, U.; Golding, B.T.; Gunsalus, R.P.; Kroneck, P.M.; et al. Anaerobic Microbial Degradation of Hydrocarbons: From Enzymatic Reactions to the Environment. J. Mol. Microbiol. Biotechnol. 2016, 26, 5–28. [Google Scholar] [CrossRef] [PubMed]
- Dominici, L.E.; Duncan, K.E.; Nanny, M.A.; Davidova, I.A.; Harriman, B.H.; Suflita, J.M. Microbial Communities Associated with Alternative Fuels in Model Seawater-Compensated Fuel Ballast Tanks. Corros. Mater. Degrad. 2023, 4, 382–397. [Google Scholar] [CrossRef]
- Stamper, D.M.; Lee, G.L. The Explicit and Implicit Qualities of Alternative Fuels: Issues to Consider for Their Use in Marine Diesel Engines; Technical Report NSWCCD-61-TR–2008/15; Naval Surface Warfare Center: West Bethesda, MD, USA, 2008. [Google Scholar]
- Leckel, D. Diesel production from Fischer-Tropsch: The past, the present, and new concepts. Energy Fuels 2009, 23, 2342–2358. [Google Scholar] [CrossRef]
- Liang, R.; Aktas, D.F.; Aydin, E.; Bonifay, V.; Sunner, J.; Suflita, J.M. Anaerobic Biodegradation of Alternative Fuels and Associated Biocorrosion of Carbon Steel in Marine Environments. Environ. Sci. Technol. 2016, 50, 4844–4853. [Google Scholar] [CrossRef]
- Atlas, R.M. Microbial degradation of petroleum hydrocarbons: An environmental perspective. Microbiol. Rev. 1981, 45, 180–209. [Google Scholar] [CrossRef]
- Xue, J.; Yu, Y.; Bai, Y.; Wang, L.; Wu, Y. Marine Oil-Degrading Microorganisms and Biodegradation Process of Petroleum Hydrocarbon in Marine Environments: A Review. Curr. Microbiol. 2015, 71, 220–228. [Google Scholar] [CrossRef]
- Liang, R.; Grizzle, R.S.; Duncan, K.E.; McInerney, M.J.; Suflita, J.M. Roles of thermophilic thiosulfate-reducing bacteria and methanogenic archaea in the biocorrosion of oil pipelines. Front. Microbiol. 2014, 5, 89. [Google Scholar] [CrossRef] [PubMed]
- Vigneron, A.; Alsop, E.B.; Chambers, B.; Lomans, B.P.; Head, I.M.; Tsesmetzis, N. Complementary Microorganisms in Highly Corrosive Biofilms from an Offshore Oil Production Facility. Appl. Environ. Microbiol. 2016, 82, 2545–2554. [Google Scholar] [CrossRef] [PubMed]
- Lee, J.S.; Little, B.J. Diagnosing microbiologically influenced corrosion. In Microbiologically Influenced Corrosion in the Upstream Oil and Gas Industry, 1st ed.; Enning, D., Jason, L., Skovhus, T.L., Eds.; CRC Press: Boca Raton, FL, USA, 2017. [Google Scholar]
- Little, B.J.; Hinks, J.; Blackwood, D.J. Microbially influenced corrosion: Towards an interdisciplinary perspective on mechanisms. Int. Biodeterior. Biodegrad. 2020, 154, 105062. [Google Scholar] [CrossRef]
- Knisz, J.; Eckert, R.; Gieg, L.M.; Koerdt, A.; Lee, J.S.; Silva, E.R.; Skovhus, T.L.; An Stepec, B.A.; Wade, S.A. Microbiologically influenced corrosion-more than just microorganisms. FEMS Microbiol. Rev. 2023, 47, fuad041. [Google Scholar] [CrossRef] [PubMed]
- Ulrich, G.A.; Krumholz, L.R.; Suflita, J.M. A rapid and simple method for estimating sulfate reduction activity and quantifying inorganic sulfides. Appl. Environ. Microbiol. 1997, 63, 1627–1630. [Google Scholar] [CrossRef] [PubMed]
- Refait, P.; Grolleau, A.-M.; Jeannin, M.; Rémazeilles, C.; Sabot, R. Corrosion of carbon steel in marine environments: Role of the corrosion product layer. Corros. Mater. Degrad. 2020, 1, 198–218. [Google Scholar] [CrossRef]
- Rémazeilles, C.; Lévêque, F.; Conforto, E.; Refait, P. Long-term alteration processes of iron fasteners extracted from archaeological shipwrecks aged in biologically active waterlogged media. Corros. Sci. 2021, 181, 109231. [Google Scholar] [CrossRef]
- Braunschweig, J.; Bosch, J.; Meckenstock, R.U. Iron oxide nanoparticles in geomicrobiology: From biogeochemistry to bioremediation. New Biotechnol. 2013, 30, 793–802. [Google Scholar] [CrossRef]
- Xia, D.-H.; Deng, C.-M.; Macdonald, D.; Jamali, S.; Mills, D.; Luo, J.-L.; Strebl, M.G.; Amiri, M.; Jin, W.; Song, S.; et al. Electrochemical measurements used for assessment of corrosion and protection of metallic materials in the field: A critical review. J. Mater. Sci. Technol. 2022, 112, 151–183. [Google Scholar] [CrossRef]
- Ferris, F.G.; Jack, T.R.; Bramhill, B.J. Corrosion products associated with attached bacteria at an oil field water injection plant. Can. J. Microbiol. 1992, 38, 1320–1324. [Google Scholar] [CrossRef]
- Lovley, D.R. Dissimilatory Fe(III) and Mn(IV) reduction. Microbiol. Rev. 1991, 55, 259–287. [Google Scholar] [CrossRef] [PubMed]
- Fortin, D.; Langley, S. Formation and occurrence of biogenic iron-rich minerals. Earth-Sci. Rev. 2005, 72, 1–19. [Google Scholar] [CrossRef]
- Fan, D.; Lan, Y.; Paul, G.; Tratnyek, P.G.; Johnson, R.L.; Filip, J.; O’Carroll, D.M.; Garcia, A.N.; Agrawal, A. Sulfidation of iron-based materials: A review of processes and implications for water treatment and remediation. Environ. Sci. Technol. 2017, 51, 13070–13085. [Google Scholar] [CrossRef] [PubMed]
- Etique, M.; Jorand, F.P.; Ruby, C. Magnetite as a precursor for green rust through the hydrogenotrophic activity of the iron-reducing bacteria Shewanella putrefaciens. Geobiology 2016, 14, 237–254. [Google Scholar] [CrossRef]
- Pineau, S.; Sabot, R.; Quillet, L.; Jeannin, M.; Caplat, C.H.; Dupont-Morral, I.; Refait, P.H. Formation of the Fe(II-III) hydroxysulphate green rust during marine corrosion of steel associated to molecular detection of dissimilatory sulphite-reductase. Corros. Sci. 2008, 50, 1099–1111. [Google Scholar] [CrossRef]
- Lu, Z.; Imlay, J.A. When anaerobes encounter oxygen: Mechanisms of oxygen toxicity, tolerance and defence. Nat. Rev. Microbiol. 2021, 19, 774–785. [Google Scholar] [CrossRef] [PubMed]
- Muyzer, G.; Kuenen, G.; Robertson, L.A. Colorless Sulfur Bacteria. In The Prokaryotes: Prokaryotic Physiology and Biochemistry, 4th ed.; Rosenberg, E., DeLong, E.F., Lory, S., Stackebrandt, E., Thompson, F., Eds.; Springer: Berlin/Heidelberg, Germany, 2013; pp. 555–588. [Google Scholar] [CrossRef]
- Deng, S.; Wang, B.; Su, S.; Sun, S.; She, Y.; Zhang, F. Dynamics of Microbial Community and Removal of Hydrogen Sulfide (H2S) Using a Bio-Inhibitor and Its Application under the Oil Reservoir Condition. Energy Fuels 2022, 36, 14128–14135. [Google Scholar] [CrossRef]
- Baltar, F.; Gutiérrez-Rodríguez, A.; Meyer, M.; Skudelny, I.; Sander, S.; Thomson, B.; Nodder, S.; Middag, R.; Morales, S.E. Specific Effect of Trace Metals on Marine Heterotrophic Microbial Activity and Diversity: Key Role of Iron and Zinc and Hydrocarbon-Degrading Bacteria. Front. Microbiol. 2018, 9, 3190. [Google Scholar] [CrossRef]
- Denaro, R.; Crisafi, F.; Russo, D.; Genovese, M.; Messina, E.; Genovese, L.; Carbone, M.; Ciavatta, M.L.; Ferrer, M.; Golyshin, P.; et al. Alcanivorax borkumensis produces an extracellular siderophore in iron-limitation condition maintaining the hydrocarbon-degradation efficiency. Mar. Genomics 2014, 17, 43–52. [Google Scholar] [CrossRef]
- Aktas, D.F.; Lee, J.S.; Little, B.J.; Duncan, K.E.; Perez-Ibarra, B.M.; Suflita, J.M. Effects of oxygen on biodegradation of fuels in a corroding environment. Int. Biodeterior. Biodegrad. 2012, 81, 114–126. [Google Scholar] [CrossRef]
- Zhang, Y.; Zhai, X.; Guan, F.; Dong, X.; Sun, J.; Zhang, R.; Duan, J.; Zhang, B.; Hou, B. Microbiologically influenced corrosion of steel in coastal surface seawater contaminated by crude oil. npj Mater. Degrad. 2022, 6, 35. [Google Scholar] [CrossRef]
- Duldhardt, I.; Nijenhuis, I.; Schauer, F.; Heipieper, H.J. Anaerobically grown Thauera aromatica, Desulfococcus multivorans, Geobacter sulfurreducens are more sensitive towards organic solvents than aerobic bacteria. Appl. Microbiol. Biotechnol. 2007, 3, 705–711. [Google Scholar] [CrossRef] [PubMed]
- Duldhardt, I.; Gaebel, J.; Chrzanowski, L.; Nijenhuis, I.; Härtig, C.; Schauer, F.; Heipieper, H.J. Adaptation of anaerobically grown Thauera aromatica, Geobacter sulfurreducens and Desulfococcus multivorans to organic solvents on the level of membrane fatty acid composition. Microb. Biotechnol. 2010, 3, 201–209. [Google Scholar] [CrossRef] [PubMed]
- Stern, S.A.; Fried, J.R. Permeability of Polymers to Gases and Vapors. In Physical Properties of Polymers Handbook, 2nd ed.; Marks, J.E., Ed.; Springer Science: New York, NY, USA, 2007; pp. 1033–1050. [Google Scholar]
- Liang, R.; Suflita, J.M. Protocol for Evaluating the Biological Stability of Fuel Formulations and Their Relationship to Carbon Steel Biocorrosion. In Hydrocarbon and Lipid Microbiology Protocols; McGenity, T., Timmis, K., Nogales, B., Eds.; Springer: Berlin/Heidelberg, Germany, 2015; pp. 211–226. [Google Scholar] [CrossRef]
- Nordstrom, D.K.; Wilde, F.D. Reduction-oxidation potential (electrode method). In Techniques of Water-Resources Investigations; U.S. Geological Survey: Reston, VA, USA, 2005. [Google Scholar] [CrossRef]
- Klindworth, A.; Pruesse, E.; Schweer, T.; Peplies, J.; Quast, C.; Horn, M.; Glöckner, F.O. Evaluation of general 16S ribosomal RNA gene PCR primers for classical and next-generation sequencing-based diversity studies. Nucleic Acids Res. 2013, 41, e1. [Google Scholar] [CrossRef] [PubMed]
- Oldham, A.L.; Sandifer, V.; Duncan, K.E. Effects of sample preservation on marine microbial diversity analysis. J. Microbiol. Methods 2019, 158, 6–13. [Google Scholar] [CrossRef] [PubMed]
- Hamady, M.; Walker, J.; Harris, J.; Gold, N.J.; Knight, R. Error-correcting barcoded primers for pyrosequencing hundreds of samples in multiplex. Nat. Methods 2008, 5, 235–237. [Google Scholar] [CrossRef] [PubMed]
- Callahan, B.J.; McMurdie, P.J.; Rosen, M.J.; Han, A.W.; Johnson, A.J.A.; Holmes, S.P. DADA2: High-resolution sample inference from Illumina amplicon data. Nat. Methods 2016, 13, 581–583. [Google Scholar] [CrossRef]
- R Core Team. R: A Language and Environment for Statistical Computing; Version 4.2.1; R Foundation for Statistical Computing: Vienna, Austria, 2022; Available online: https://www.R-project.org/ (accessed on 23 June 2022).
- Hill, M.O. Diversity and Evenness: A Unifying Notation and Its Consequences. Ecology 1973, 54, 427–432. [Google Scholar] [CrossRef]
- McMurdie, P.J.; Holmes, S. Phyloseq: An R package for reproducible interactive analysis and graphics of microbiome census data. PLoS ONE 2013, 8, e61217. [Google Scholar] [CrossRef]
- Enning, D.; Garrelfs, J. Corrosion of iron by sulfate-reducing bacteria: New views of an old problem. Appl. Environ. Microbiol. 2014, 80, 1226–1236. [Google Scholar] [CrossRef]
- Bazylinski, D.A.; Williams, T.J.; Lefèvre, C.T.; Trubitsyn, D.; Fang, J.; Beveridge, T.J.; Moskowitz, B.M.; Ward, B.; Schübbe, S.; Dubbels, B.L.; et al. Magnetovibrio blakemorei gen. nov., sp. nov., a magnetotactic bacterium (Alphaproteobacteria: Rhodospirillaceae) isolated from a salt marsh. Int. J. Syst. Evol. Microbiol. 2013, 63, 1824–1833. [Google Scholar] [CrossRef] [PubMed]
- Lien, T.; Beeder, J. Desulfobacter vibrioformis sp. nov., a sulfate reducer from a water-oil separation system. Int. J. Syst. Bacteriol. 1997, 47, 1124–1128. [Google Scholar] [CrossRef] [PubMed]
- Tarpgaard, I.H.; Boetius, A.; Finster, K. Desulfobacter psychrotolerans sp. nov., a new psychrotolerant sulfate-reducing bacterium and descriptions of its physiological response to temperature changes. Antonie Van Leeuwenhoek 2006, 89, 109–124. [Google Scholar] [CrossRef] [PubMed]
- Sorokin, D.Y.; Tourova, T.P.; Muyzer, G. Isolation and characterization of two novel alkalitolerant sulfidogens from a Thiopaq bioreactor, Desulfonatronum alkalitolerans sp. nov., and Sulfurospirillum alkalitolerans sp. nov. Extremophiles 2013, 17, 535–543. [Google Scholar] [CrossRef] [PubMed]
- Sorokin, D.Y.; Tourova, T.P.; Panteleeva, A.N.; Muyzer, G. Desulfonatronobacter acidivorans gen. nov., sp. nov. and Desulfobulbus alkaliphilus sp. nov., haloalkaliphilic heterotrophic sulfate-reducing bacteria from soda lakes. Int. J. Syst. Evol. Microbiol. 2012, 62, 2107–2113. [Google Scholar] [CrossRef] [PubMed]
- Ryzhmanova, Y.; Nepomnyashchaya, Y.; Abashina, T.; Ariskina, E.; Troshina, O.; Vainshtein, M.; Shcherbakova, V. New sulfate-reducing bacteria isolated from Buryatian alkaline brackish lakes: Description of Desulfonatronum buryatense sp. nov. Extremophiles 2013, 17, 851–859. [Google Scholar] [CrossRef] [PubMed]
- Corteselli, E.M.; Aitken, M.D.; Singleton, D.R. Description of Immundisolibacter cernigliae gen. nov., sp. nov., a high-molecular-weight polycyclic aromatic hydrocarbon-degrading bacterium within the class Gammaproteobacteria, and proposal of Immundisolibacterales ord. nov. and Immundisolibacteraceae fam. nov. Int. J. Syst. Evol. Microbiol. 2017, 67, 925–931. [Google Scholar] [CrossRef]
- Dubinsky, E.A.; Conrad, M.E.; Chakraborty, R.; Bill, M.; Borglin, S.E.; Hollibaugh, J.T.; Mason, O.U.; Piceno, M.Y.; Reid, F.C.; Stringfellow, W.T.; et al. Succession of hydrocarbon-degrading bacteria in the aftermath of the deepwater horizon oil spill in the gulf of Mexico. Environ. Sci. Technol. 2013, 47, 10860–10867. [Google Scholar] [CrossRef]
- Handley, K.M.; Lloyd, J.R. Biogeochemical implications of the ubiquitous colonization of marine habitats and redox gradients by Marinobacter species. Front. Microbiol. 2013, 4, 136. [Google Scholar] [CrossRef]
- King, G.M.; Kostka, J.E.; Hazen, T.C.; Sobecky, P.A. Microbial responses to the Deepwater Horizon oil spill: From coastal wetlands to the deep sea. Ann. Rev. Mar. Sci. 2015, 7, 377–401. [Google Scholar] [CrossRef]
- Nielsen, M.B.; Kjeldsen, K.U.; Ingvorsen, K. Desulfitibacter alkalitolerans gen. nov., sp. nov., an anaerobic, alkalitolerant, sulfite-reducing bacterium isolated from a district heating plant. Int. J. Syst. Evol. Microbiol. 2006, 56, 2831–2836. [Google Scholar] [CrossRef] [PubMed]
- Chen, S.C.; Ji, J.; Popp, D.; Jaekel, U.; Richnow, H.H.; Sievert, S.M.; Musat, F. Genome and proteome analyses show the gaseous alkane degrader Desulfosarcina sp. strain BuS5 as an extreme metabolic specialist. Environ. Microbiol. 2022, 24, 1964–1976. [Google Scholar] [CrossRef] [PubMed]
- Kleindienst, S.; Herbst, F.A.; Stagars, M.; von Netzer, F.; von Bergen, M.; Seifert, J.; Peplies, J.; Amann, R.; Musat, F.; Lueders, T.; et al. Diverse sulfate-reducing bacteria of the Desulfosarcina/Desulfococcus clade are the key alkane degraders at marine seeps. ISME J. 2014, 8, 2029–2044. [Google Scholar] [CrossRef] [PubMed]
- Watanabe, M.; Higashioka, Y.; Kojima, H.; Fukui, M. Desulfosarcina widdelii sp. nov. and Desulfosarcina alkanivorans sp. nov., hydrocarbon-degrading sulfate-reducing bacteria isolated from marine sediment and emended description of the genus Desulfosarcina. Int. J. Syst. Evol. Microbiol. 2017, 67, 2994–2997. [Google Scholar] [CrossRef] [PubMed]
- Rosario-Passapera, R.; Keddis, R.; Wong, R.; Lutz, R.A.; Starovoytov, V.; Vetriani, C. Parvibaculum hydrocarboniclasticum sp. nov., a mesophilic, alkane-oxidizing alphaproteobacterium isolated from a deep-sea hydrothermal vent on the East Pacific Rise. Int. J. Syst. Evol. Microbiol. 2012, 62, 2921–2926. [Google Scholar] [CrossRef] [PubMed]
- Burdige, D.J. The biogeochemistry of manganese and iron reduction in marine sediments. Earth-Sci. Rev. 1993, 35, 249–284. [Google Scholar] [CrossRef]
- Jørgensen, B.B.; Findlay, A.J.; Pellerin, A. The Biogeochemical Sulfur Cycle of Marine Sediments. Front. Microbiol. 2019, 10, 849. [Google Scholar] [CrossRef]
- Schmidt, J.M.; Royalty, T.M.; Lloyd, K.G.; Steen, A.D. Potential Activities and Long Lifetimes of Organic Carbon-Degrading Extracellular Enzymes in Deep Subsurface Sediments of the Baltic Sea. Front. Microbiol. 2021, 12, 702015. [Google Scholar] [CrossRef]
- Cravo-Laureau, C.; Duran, R. Marine coastal sediments microbial hydrocarbon degradation processes: Contribution of experimental ecology in the omics’era. Front. Microbiol. 2014, 5, 39. [Google Scholar] [CrossRef]
- Otte, J.M.; Blackwell, N.; Soos, V.; Rughöft, S.; Maisch, M.; Kappler, A.; Kleindienst, S.; Schmidt, C. Sterilization impacts on marine sediment—Are we able to inactivate microorganisms in environmental samples? FEMS Microbiol. Ecol. 2018, 94, fiy189. [Google Scholar] [CrossRef]
- Zhang, C.; Meckenstock, R.U.; Weng, S.; Wei, G.; Hubert, C.R.J.; Wang, J.H.; Dong, X. Marine sediments harbor diverse archaea and bacteria with the potential for anaerobic hydrocarbon degradation via fumarate addition. FEMS Microbiol. Ecol. 2021, 97, fiab045. [Google Scholar] [CrossRef] [PubMed]
- Stransky, C.; Swiderski, M.; Stolzenbach, K.; Isham, B.; Schottle, R.; Rudolph, J.; Tait, K.; Holman, K.; Burruss, A.; Kolb, R.; et al. San Diego Regional Harbor Monitoring Program Final Report. Wood Project No.: 1715100804; San Diego, CA, USA, 2018. Available online: https://pantheonstorage.blob.core.windows.net/environment/Regional-Harbor-Monitoring-Program-2018-Final-Report.pdf (accessed on 23 June 2022).
- Coates, J.D.; Lonergan, D.J.; Philips, E.J.; Jenter, H.; Lovley, D.R. Desulfuromonas palmitatis sp. nov., a marine dissimilatory Fe(III) reducer that can oxidize long-chain fatty acids. Arch. Microbiol. 1995, 164, 406–413. [Google Scholar] [CrossRef] [PubMed]
- Davidova, I.A.; Duncan, K.E.; Choi, O.K.; Suflita, J.M. Desulfoglaeba alkanexedens gen. nov., sp. nov., an n-alkane-degrading, sulfate-reducing bacterium. Int. J. Syst. Evol. Microbiol. 2006, 56, 2737–2742. [Google Scholar] [CrossRef] [PubMed]
- Davidova, I.A.; Gieg, L.M.; Duncan, K.E.; Suflita, J.M. Anaerobic phenanthrene mineralization by a carboxylating sulfate-reducing bacterial enrichment. ISME J. 2007, 1, 436–442. [Google Scholar] [CrossRef] [PubMed]
- Davidova, I.A.; Duncan, K.E.; Wiley, G.; Najar, F.Z. Desulfoferrobacter suflitae gen. nov., sp. nov., a novel sulphate-reducing bacterium in the Deltaproteobacteria capable of autotrophic growth with hydrogen or elemental iron. Int. J. Syst. Evol. Microbiol. 2022, 72, 005483. [Google Scholar] [CrossRef] [PubMed]
- Yakimov, M.M.; Timmis, K.N.; Golyshin, P.N. Obligate oil-degrading marine bacteria. Curr. Opin. Biotechnol. 2007, 18, 257–266. [Google Scholar] [CrossRef]
- Skovhus, T.L.; Lee, J.S.; Little, B.J. Predominant MIC mechanisms in the oil and gas industry. In Microbiologically Influenced Corrosion in the Upstream Oil and Gas Industry; Skovhus, T.L., Enning, E., Lee, J.S., Eds.; CRC Press: Boca Raton, FL, USA, 2017; pp. 75–86. [Google Scholar] [CrossRef]
- Knoblauch, C.; Sahm, K.; Jørgensen, B.B. Psychrophilic sulfate-reducing bacteria isolated from permanently cold arctic marine sediments: Description of Desulfofrigus oceanense gen. nov., sp. nov., Desulfofrigus fragile sp. nov., Desulfofaba gelida gen. nov., sp. nov., Desulfotalea psychrophila gen. nov., sp. nov. and Desulfotalea arctica sp. nov. Int. J. Syst. Bacteriol. 1999, 49, 1631–1643. [Google Scholar] [CrossRef]
- Castro, A.R.; Martins, G.; Salvador, A.F.; Cavaleiro, A.J. Iron Compounds in Anaerobic Degradation of Petroleum Hydrocarbons: A Review. Microorganisms 2022, 10, 2142. [Google Scholar] [CrossRef]
- Tagliabue, A.; Bowie, A.R.; Boyd, P.W.; Buck, K.N.; Johnson, K.S.; Saito, M.A. The integral role of iron in ocean biogeochemistry. Nature 2017, 543, 51–59. [Google Scholar] [CrossRef]
- Tortell, P.D.; Maldonado, M.T.; Granger, J.; Price, N.M. Marine bacteria and biogeochemical cycling of iron in the oceans. FEMS Microbiol. Ecol. 1999, 29, 1–11. [Google Scholar] [CrossRef]
- Debeljak, P.; Toulza, E.; Beier, S.; Blain, S.; Obernosterer, I. Microbial iron metabolism as revealed by gene expression profiles in contrasted Southern Ocean regimes. Environ. Microbiol. 2019, 21, 2360–2374. [Google Scholar] [CrossRef] [PubMed]
- Dinkla, I.J.; Gabor, E.M.; Janssen, D.B. Effects of iron limitation on the degradation of toluene by Pseudomonas strains carrying the tol (pWWO) plasmid. Appl. Environ. Microbiol. 2001, 67, 3406–3412. [Google Scholar] [CrossRef] [PubMed]
- Heipieper, H.J.; Neumann, G.; Cornelissen, S.; Meinhardt, F. Solvent-tolerant bacteria for biotransformations in two-phase fermentation systems. Appl. Microbiol. Biotechnol. 2007, 74, 961–973. [Google Scholar] [CrossRef] [PubMed]
- Sikkema, J.; de Bont, J.A.; Poolman, B. Mechanisms of membrane toxicity of hydrocarbons. Microbiol. Rev. 1995, 59, 201–222. [Google Scholar] [CrossRef] [PubMed]
- Coates, J.D.; Anderson, R.T.; Lovley, D.R. Oxidation of Polycyclic Aromatic Hydrocarbons under Sulfate-Reducing Conditions. Appl. Environ. Microbiol. 1996, 62, 1099–1101. [Google Scholar] [CrossRef] [PubMed]
- Coates, J.D.; Woodward, J.; Allen, J.; Philp, P.; Lovley, D.R. Anaerobic degradation of polycyclic aromatic hydrocarbons and alkanes in petroleum-contaminated marine harbor sediments. Appl. Environ. Microbiol. 1997, 63, 3589–3593. [Google Scholar] [CrossRef] [PubMed]
- Davidova, I.A.; Boris, W.; Callaghan, A.V.; Duncan, K.E.; Marks, C.R.; Suflita, J.M. Dethiosulfatarculus sandiegensis, sp. nov. gen. nov., isolated from a methanogenic paraffin-degrading enrichment culture and emended description of Desulfarculaceae Family. Int. J. Syst. Evol. Microbiol. 2016, 66, 1242–1248. [Google Scholar] [CrossRef]
- Chen, J.; Liu, Y.F.; Zhou, L.; Mbadinga, S.M.; Yang, T.; Zhou, J.; Liu, J.F.; Yang, S.Z.; Gu, J.D.; Mu, B.Z. Methanogenic degradation of branched alkanes in enrichment cultures of production water from a high-temperature petroleum reservoir. Appl. Microbiol. Biotechnol. 2019, 103, 2391–2401. [Google Scholar] [CrossRef]
- Mohamad Shahimin, M.F.; Foght, J.M.; Siddique, T. Methanogenic Biodegradation of iso-Alkanes by Indigenous Microbes from Two Different Oil Sands Tailings Ponds. Microorganisms 2021, 9, 1569. [Google Scholar] [CrossRef]
- Martins, C.C.; de Abreu-Mota, M.A.; do Nascimento, M.G.; Dauner, A.L.L.; Lourenço, R.A.; Bícego, M.C.; Montone, R.C. Sources and depositional changes of aliphatic hydrocarbons recorded in sedimentary cores from Admiralty Bay, South Shetland Archipelago, Antarctica during last decades. Sci. Total Environ. 2021, 795, 148881. [Google Scholar] [CrossRef]
- Avigan, J.; Blumer, M. On the origin of pristane in marine organisms. J. Lipid Res. 1968, 9, 350–352. [Google Scholar] [CrossRef] [PubMed]
- Rocha, C.A.; Pedregosa, A.M.; Laborda, F. Biosurfactant-mediated biodegradation of straight and methyl-branched alkanes by Pseudomonas aeruginosa ATCC 55925. AMB Express 2011, 1, 9. [Google Scholar] [CrossRef] [PubMed]
- Li, C.; Zhou, Z.X.; Jia, X.Q.; Chen, Y.; Liu, J.; Wen, J.P. Biodegradation of crude oil by a newly isolated strain Rhodococcus sp. JZX-01. Appl. Biochem. Biotechnol 2013, 171, 1715–1725. [Google Scholar] [CrossRef] [PubMed]
- Cox, R.E.; Maxwell, J.R.; Myers, R.N. Monocarboxylic acids from oxidation of acyclic isoprenoid alkanes by Mycobacterium fortuitum. Lipids 1976, 11, 72–76. [Google Scholar] [CrossRef]
- Dawson, K.; Schaperdoth, I.; Freeman, K.H.; Macalady, J.L. Anaerobic biodegradation of the isoprenoid biomarkers pristane and phytane. Org. Geochem. 2013, 65, 118–126. [Google Scholar] [CrossRef]
- Caldwell, M.E.; Garrett, R.M.; Prince, R.C.; Suflita, J.M. Anaerobic biodegradation of long-chain n-alkanes under sulfate-reducing conditions. Environ. Sci. Technol. 1998, 32, 2191–2195. [Google Scholar] [CrossRef]
- Hara, A.; Syutsubo, K.; Harayama, S. Alcanivorax which prevails in oil-contaminated seawater exhibits broad substrate specificity for alkane degradation. Environ. Microbiol. 2003, 5, 746–753. [Google Scholar] [CrossRef]
- Gregson, B.H.; Metodieva, G.; Metodiev, M.V.; McKew, B.A. Differential protein expression during growth on linear versus branched alkanes in the obligate marine hydrocarbon-degrading bacterium Alcanivorax borkumensis SK2T. Environ. Microbiol. 2019, 21, 2347–2359. [Google Scholar] [CrossRef]


| Reactor | Fuel Type | Sediment Treatment |
|---|---|---|
| R1 | Petro-F76 | NS |
| R2 | Petro-F76 | HT |
| R3 | FT-F76 | NS |
| R4 | FT-F76 | HT |
| R5 | Petro- and FT-F76 | NS |
| R6 | Petro- and FT-F76 | HT |
| R7 | No fuel | NS |
| R8 | No fuel | HT |
Disclaimer/Publisher’s Note: The statements, opinions and data contained in all publications are solely those of the individual author(s) and contributor(s) and not of MDPI and/or the editor(s). MDPI and/or the editor(s) disclaim responsibility for any injury to people or property resulting from any ideas, methods, instructions or products referred to in the content. |
© 2024 by the authors. Licensee MDPI, Basel, Switzerland. This article is an open access article distributed under the terms and conditions of the Creative Commons Attribution (CC BY) license (https://creativecommons.org/licenses/by/4.0/).
Share and Cite
Duncan, K.E.; Dominici, L.E.; Nanny, M.A.; Davidova, I.A.; Harriman, B.H.; Suflita, J.M. Microbial Communities in Model Seawater-Compensated Fuel Ballast Tanks: Biodegradation and Biocorrosion Stimulated by Marine Sediments. Corros. Mater. Degrad. 2024, 5, 1-26. https://doi.org/10.3390/cmd5010001
Duncan KE, Dominici LE, Nanny MA, Davidova IA, Harriman BH, Suflita JM. Microbial Communities in Model Seawater-Compensated Fuel Ballast Tanks: Biodegradation and Biocorrosion Stimulated by Marine Sediments. Corrosion and Materials Degradation. 2024; 5(1):1-26. https://doi.org/10.3390/cmd5010001
Chicago/Turabian StyleDuncan, Kathleen E., Lina E. Dominici, Mark A. Nanny, Irene A. Davidova, Brian H. Harriman, and Joseph M. Suflita. 2024. "Microbial Communities in Model Seawater-Compensated Fuel Ballast Tanks: Biodegradation and Biocorrosion Stimulated by Marine Sediments" Corrosion and Materials Degradation 5, no. 1: 1-26. https://doi.org/10.3390/cmd5010001