
Analysis of Hydrometeorological Characteristics and Water Demand in Semi-Arid Mediterranean Catchments under Water Deficit Conditions

Laboratory of Mountainous Water Management and Control, School of Forestry and Natural Environment, Aristotle University of Thessaloniki, 54124 Thessaloniki, Greece
*
Author to whom correspondence should be addressed.
Climate 2023, 11(7), 137; https://doi.org/10.3390/cli11070137
Submission received: 13 May 2023
/
Revised: 20 June 2023
/
Accepted: 25 June 2023
/
Published: 27 June 2023
(This article belongs to the Special Issue Coping with Flooding and Drought)
Abstract
:Drought is one of the most complex and poorly understood catastrophes on the planet. Between the Greek mainland and Turkey, there is an area of Greece known as the South Aegean Islands, that experiences water supply issues. As a result, there are issues related to the socioeconomic growth of some of these islands, and the need for water transportation by water vessels. Water transportation by ships to the Cyclades and Dodecanese areas from the mainland or other adjacent islands to satisfy urgent demands, on the other hand, is exceptionally expensive. The situation deteriorates during the summer, when drinking water needs can reach five times the norm, due to the heavy tourist season. Given these conditions, the aim of this research is to estimate hydrometeorological conditions, calculate the water balance, and determine water needs in three southern Aegean islands (Mykonos, Naxos, and Kos), where there is a water shortage, particularly during the summer months when tourism activity is at its peak. The modified Thornthwaite–Mather monthly hydrological balance model was applied to determine the water balance. Various water use datasets (drinking water, irrigation, water transportation) were employed to quantify the water demands in the three islands. According to the results, the available water (runoff + infiltration) seems to be more than sufficient to meet the needs of the islands of Naxos and Kos, since it far exceeds the increased needs of the islands. Yet, it appears that in Mykonos, where the water resources have been nearly entirely utilized, the available water, is just enough to meet the water needs. It is evident that all three islands present significant sources of available water, which could meet the growing needs of the residents. However, the absence of the necessary water exploitation projects, mainly concerning the surface runoff, has contributed to the intense water supply problems of the islands. The importance of the water harvesting projects becomes even more urgent under the conditions of climate change, with the decrease in annual rainfall likely to be a highly possible scenario, especially in arid and semi-arid regions.
1. Introduction
Drought is one of the most complicated and least understood natural disasters globally [1,2,3,4,5]. It constitutes a severe meteorological and climatic phenomenon of unpredictable occurrence in terms of place, frequency, and duration that is driven by natural causes. According to studies implemented over the past few decades, there is a considerable increase in the frequency of droughts occurring globally, which has huge economic, social and environmental consequences [6,7,8,9]. Between the mainland of Greece and Turkey, there is a region of Greece known as the South Aegean Islands, which includes 385 islands. At least 29 of these islands struggle with water supply problems [10]. The limited water resources in the South Aegean Islands are attributed to their typically dry Mediterranean climate [10,11]. Furthermore, the inflow of seawater into the aquifer makes it even more challenging to source drinkable water and results in a lack of water resources necessary to fulfill the population’s demands, as well as issues with water distribution [12,13,14]. Increasing water demand, the necessity for irrigation, declining rainfall amounts, and excessive groundwater pumping each serve as underlying reasons for the South Aegean Islands’ water shortage issues [15,16]. The near complete dependence on groundwater in order to meet the rising demands for irrigation and drinking water resulted in its rapid depletion. As a result, there are issues with the socioeconomic growth of these islands, because of the long distances between the islands and the mainland of Greece and the need for water transportation by water vessels, which is frequently proven to be insufficient in practice.
Water transportation from the mainland or other nearby islands to the Cyclades and Dodecanese areas using ships to fulfil urgent demands, is extremely costly [10]. The General Secretariat of the Aegean, which is in charge of water transportation, spent more than 5 million euros on this purpose already in 2014. Additional evidence of the high water demands is the leasing of water vessels for the transport of drinking water from mainland Greece to the islands until 2019 for the entire duration of the year, with an average annual cost of approximately 8.2 €/m3 [17]. The problem becomes even worse during the summer, when drinking water demands rise up to five times above the average, owing to the high numbers of tourists [18].
Forecasting the potential negative consequences of drought on both the environment and humans is essential, since it enables the estimation of how dangerous a drought episode might be [19]. Depending on the extent of the region they cover, the effects of drought and therefore of water shortage, are categorized into economic, social, and environmental aspects [19].
The water balance of a watershed constitutes an expression of the relationship between the components of the hydrological cycle. Water balance components are random time series of variables with a random spatial distribution. Precipitation is the independent variable that is transformed in the hydrological system into dependent variables of evaporation, runoff and changes in soil moisture [20]. After applying the appropriate simplifications, it is possible to predict the key hydrological variables mathematically [21].
A crucial element for the rational management of a region’s water potential is the determination of the water balance of its catchments [15,20,22,23,24,25]. For the hydrologic simulation of watersheds, many empirical water balance calculation models have been created, due to the numerous factors that influence the hydrologic cycle processes [26].
Given these circumstances, the aim of the study is to estimate the hydrometeorological conditions, calculate the water balance, and determine the water needs in three southern Aegean islands (Mykonos, Naxos and Kos), where there is a water shortage, particularly during the summer months, when tourism activity is at its peak. An analysis of hydrometeorological conditions was carried out, in order to calculate precipitation, water losses (evapotranspiration, infiltration), surface runoff and annual water needs (domestic water, irrigation), with the goal of estimating the amount of water required to meet the islands’ increased water demands. Additionally, based on the analysis of water needs and the available amount of water, works and potential solutions are proposed that could help to mitigate the water deficit during the dry period of the year.
2. Materials and Methods
2.1. Research Area
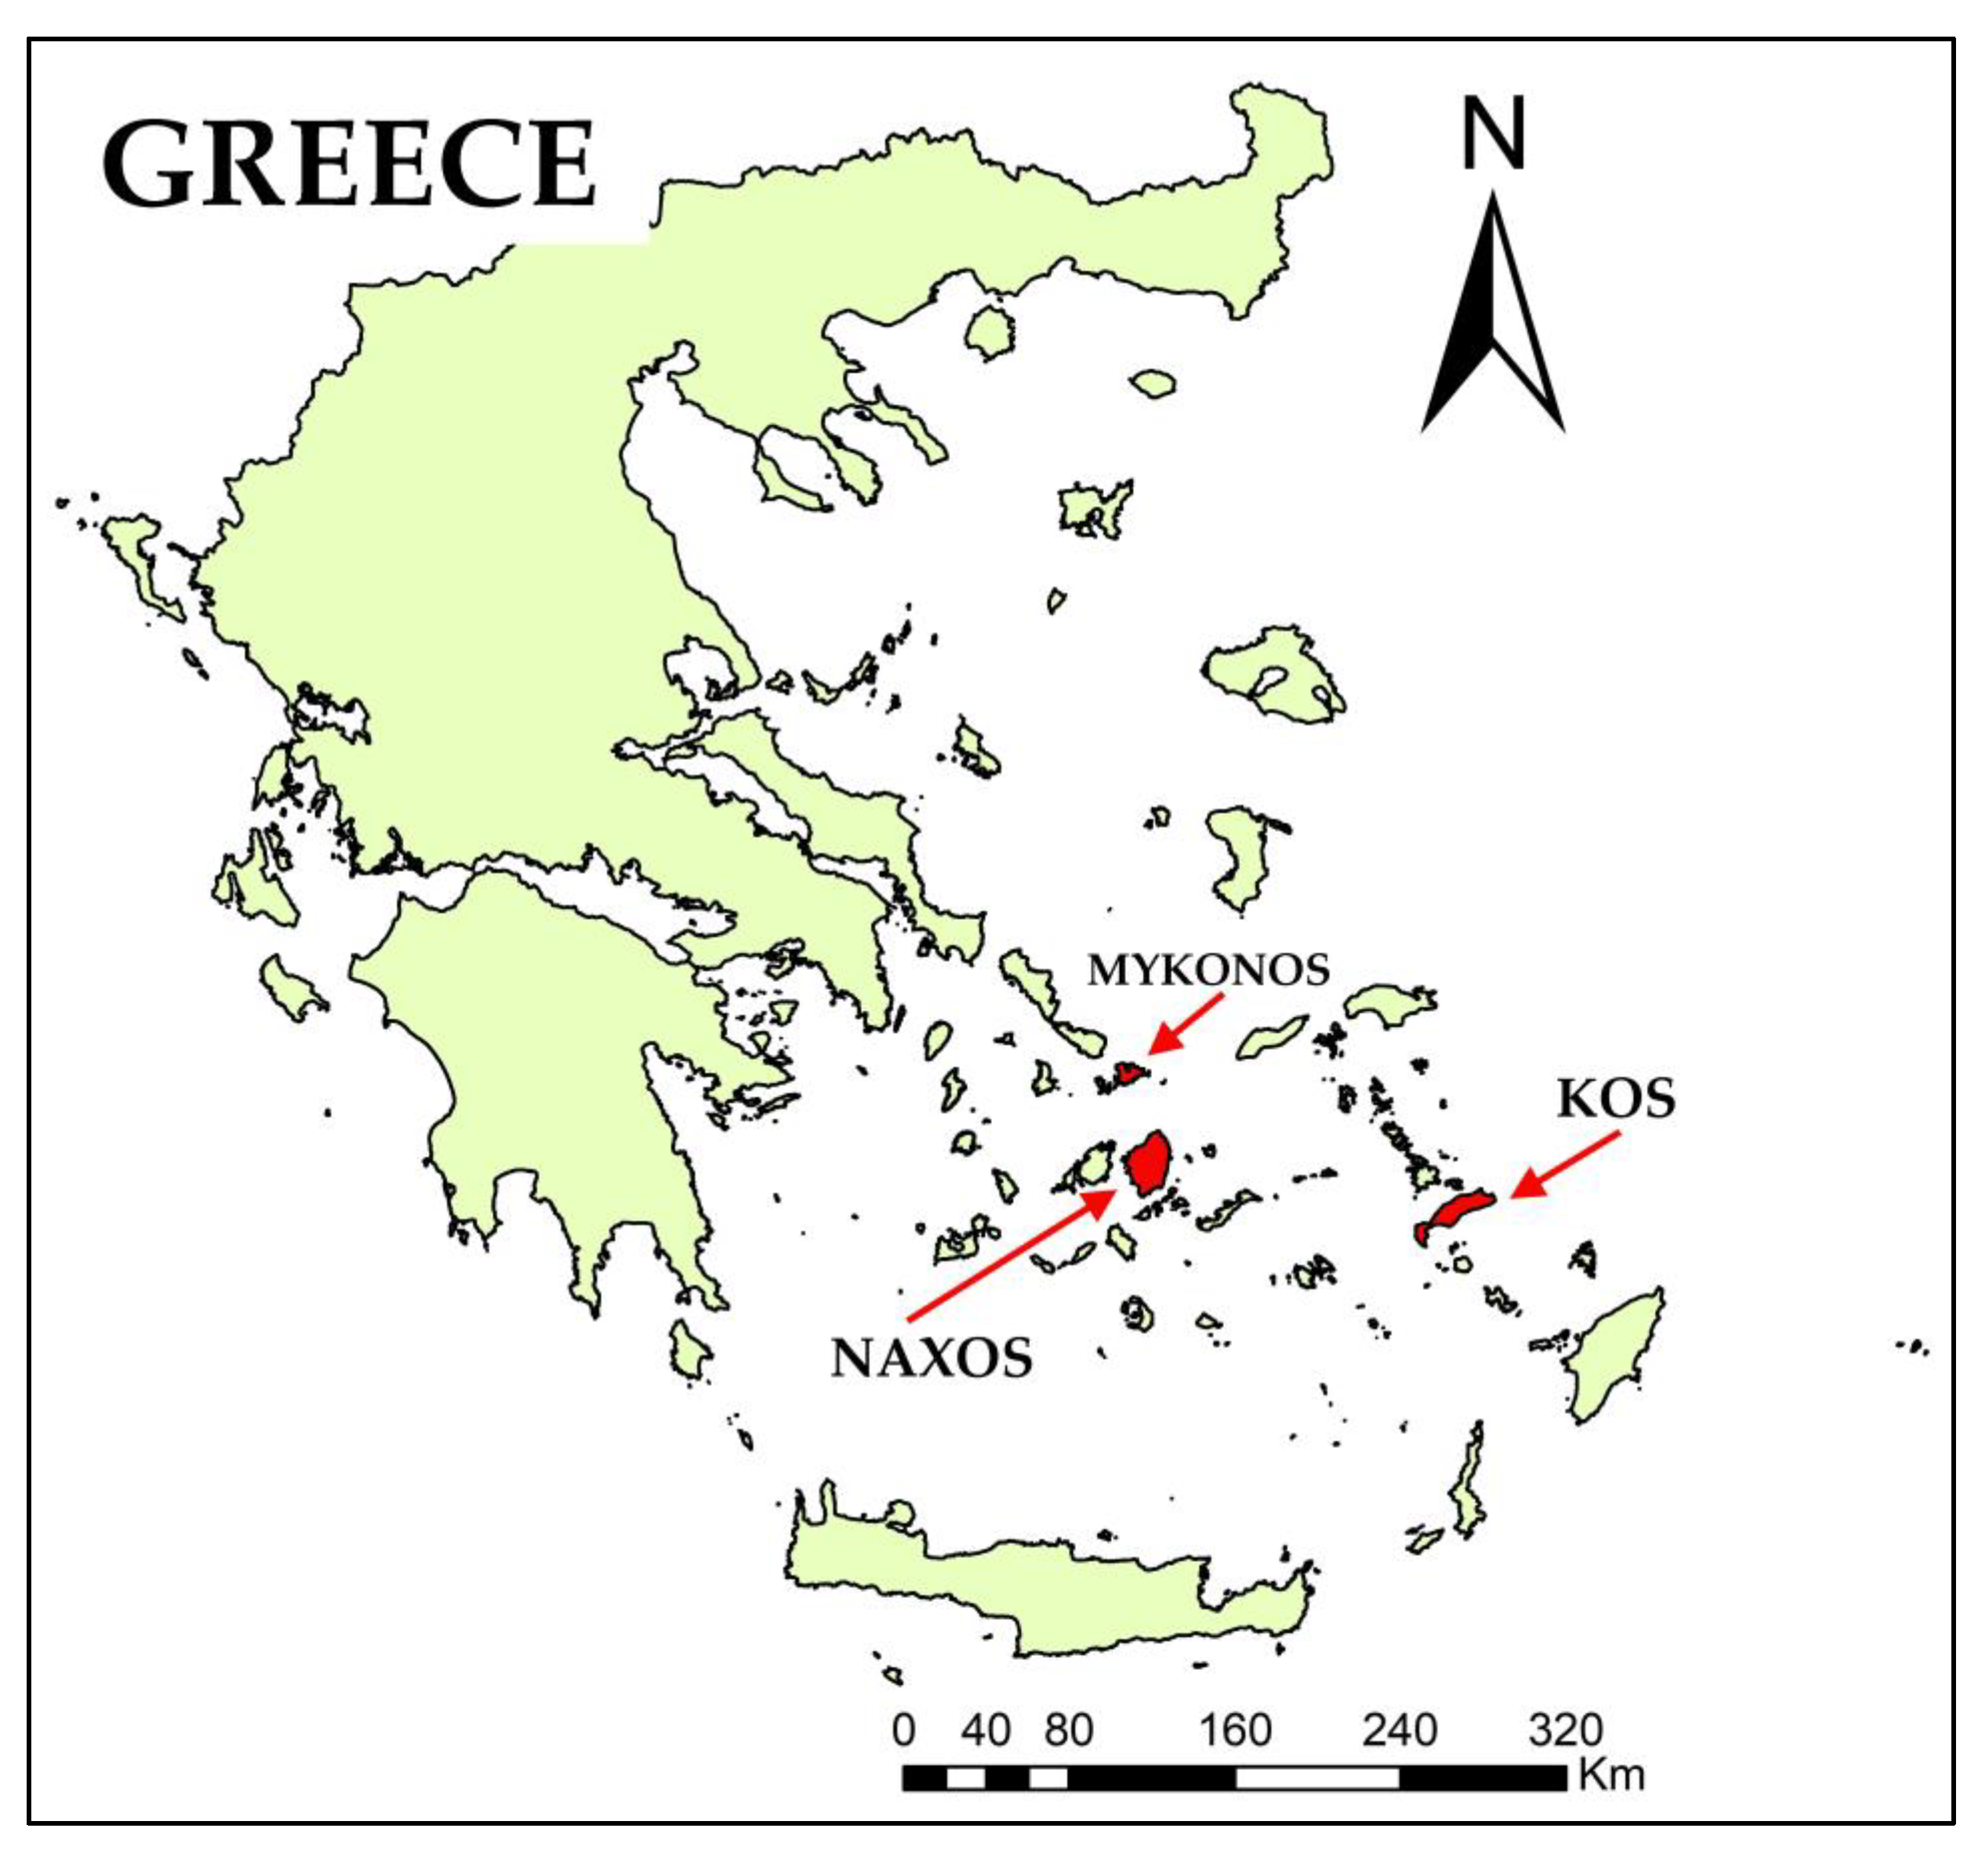
The study area consists of three islands of the South Aegean, namely Mykonos, Naxos and Kos (Figure 1). The island of Mykonos is located in the central part of the Cyclades island complex and has an area of 85.5 km2 (10,962 residents, 2021 census of Greece). Mykonos is the island with the mildest topography in the research area (maximum altitude 365 m a.s.l., mean altitude 100 m a.s.l.). Additionally, it is almost exclusively lowland, while only a small part could be considered as hilly. There are no forested areas in Mykonos, and most area is covered by agricultural crops (43.54%) and pastures (37.64%) and a smaller percentage by settlements (16.99%) [27]. The dominant geological formation is igneous (65.23%), while there are alluvial depositions (25.16%) and schist formations (9.08%).
Naxos is the largest and most fertile island of Cyclades with an area of 430 km2 and is located south of Mykonos (24,098 residents, 2021 census of Greece). The topography of Naxos is formed by Mount Zas, a low mountain range that crosses it from north to south, with the highest peak being Naxos Dias or Za (989 m a.s.l.), while the mean altitude is 263 m a.s.l. Most of the island is characterized as hilly, while there are several plains and some semi-mountainous areas. There are no forested areas and most areas are covered by pastures and shrublands (64.15%) and agricultural crops (34.98%) [27]. In Naxos, the limestone (48.11%) and igneous rock formations (43.88%) are dominant.
The island of Kos, with a total area of 282.5 km2 (35,829 residents, 2021 census of Greece), has a particularly elongated shape, consisting of a long and densely populated lowland zone in the north, and a steep uninhabited mountainous axis in the south. The mountain range of this section is arranged along the southern coast and the highest peak is Mount Dikaios (840 m a.s.l.), while the mean altitude is 127 m a.s.l. Kos is the only island of the research area, where there are some forested areas (6.11%), with most of the watersheds covered by pastures and shrublands (48.89%), agricultural crops (40.89%) and also a small percentage covered by settlements [27]. In Kos, igneous formations dominate (61.58%), followed by sedimentary formations (25.12%), while the schist (7.34%) and limestone formations (5.83%) are also found in smaller percentages.
According to Koppen climate classification, the climate of the area is Mediterranean, characterized by long dry summers and mild winters, while strong winds occur throughout the year [15]. Three meteorological stations (MS) (Mykonos, Naxos and Kos) are being operated by the Hellenic National Meteorological Service (HNMS), providing a long time-series, while in the last decade there have also been meteorological stations of the National Observatory of Athens (NOA) [28]. In Table 1, the names and details of the stations (altitude, observations duration etc.) are provided. In the current research, the longest time-series were further analyzed. The data of precipitation and temperature were analyzed in monthly time steps, based on the modified Thornthwaite–Mather monthly hydrological balance model, which was applied in this study. Due to the ephemeral nature of the streams in the study area, there are no runoff data in the study area. More details about the analysis of the climate, geomorphology and land uses at a catchment level, are available in the respective thesis link [29].
2.2. Water Balance Analysis
The modified Thornthwaite–Mather monthly hydrological balance model was used to determine the water balance [15,20,22,23,24,25,30,31,32,33,34,35]. Penman’s method [36] is preferable in terms of accuracy [37], and that is why multinational organizations frequently employ it in this way [2,38,39]. However, since some of the meteorological parameters necessary for the Penman calculation (humidity, wind speed, solar radiation) are in many cases missing in many parts of the world, as well as in the current work, the calculation is usually performed using the simpler Thornthwaite approach [40,41,42]. It has been proved that in Greek climate conditions the modified Thornthwaite–Mather model could provide acceptable water balance values, and the accuracy is similar to Penman’s method [43]. On the other hand, Turc’s method [44] demonstrates satisfactory results mainly for a high annual rainfall index (higher than 700 mm), while in Greece it did not prove to be applicable in all cases, as well as for the present study area [45]. The analysis was performed at a catchment level and then summarized for each island separately. The spatial distribution of precipitation and temperature was performed using Thiessen polygons and the methodology proposed by Mimikou et al. [46] was applied to incorporate the influence of altitude.
The Thornthwaite–Mather model uses the maximum soil capacity (K) as a parameter and combining the precipitation and potential evapotranspiration as inputs, provides the results of runoff and actual evapotranspiration. The mathematical description of the monthly model is presented below [20]:
where:
ΔS = Ρ − ΕΤ − Q
ΔS = change in stored water
Ρ = rainfall (mm)
ΕΤ = evapotranspiration (mm)
Q = excess water (infiltration and surface runoff) (mm)
The corresponding equation of the monthly water balance is as follows:
where:
ETα = (Sn−1 − Sn) + Pn − Qn = Pn − ΔSn − QAn − Dn
ΔS = Sn−1 − Sn
QAn = a·(Qn + QAn−1)
if Pn > ETp then Sn = min(Sn–1 + Pn − ETp, K) and Qn = max(Sn−1 + Pn − ETp − K, 0)
if Pn < ETp then and Qn = 0
n = month
Pn = mean monthly precipitation
ΕΤp = mean potential evapotranspiration
ΕΤα = mean monthly actual evapotranspiration
Sn = stored water in the soil
Qn = excess water in the soil
QAn = surface runoff
Dn = filtered water
α = surface runoff coefficient
Potential evapotranspiration
where:
α = 0.016·J + 0.5
ΕΤp = mean monthly potential evapotranspiration (mm)
tn = mean monthly temperature (°C)
J = annual heat index
Ld = correction factor calculated through meteorological tables in terms of month and latitude
α = empirical parameter
The modified Thornthwaite–Mather monthly hydrological balance model assumes that the water that is stored in the soil near the surface (root zone) could be used by the plants [47]. Therefore, this amount of water is considered part of evapotranspiration (ETr). According to the model, surface runoff and infiltration movement to the aquifer are calculated when the stored water in the soil exceeds the maximum soil moisture capacity (Κ).
2.2.1. Maximum Soil Moisture Capacity (Κ)
This represents the potential maximum moisture (K) that the soil can hold and is expressed by the following equation:
where:
CN = the Curve Number runoff factor that depends on the soil characteristics and land uses of each watershed.
2.2.2. Runoff Coefficient CN (Curve Number)
In cases where there are no simultaneous measurements of rain and runoff for the calculation of infiltration, the estimation of runoff is implemented using the CN (Curve Number) runoff coefficient introduced by the Soil Conservation Service [48]. This factor depends on the soil characteristics and land uses that prevail in each catchment area. In addition, in the estimation of the CN, the hydrological behavior of the various forms of land use is taken into account, i.e., the percentage of vegetation coverage or canopy density.
The Soil Conservation Service (SCS) has developed tables with the soil classification system consisting of four hydrologic soil groups, designated by the letters A, B, C and D [49]. Additionally, in order to determine the CN parameter for areas with olive groves, the results of surveys from Mediterranean areas were taken into account [50,51,52,53]. Based on the above tables, raster files were created in a GIS environment, in order to spatially analyze the combinations of land uses and soil types.
2.2.3. Hydrological Model Calculation Parameters
After running the water balance model for the hydrological basins of the research area, it is possible to export the results in the form of tables. The results include the calculation of various parameters for each main hydrological basin. The parameters calculated by the hydrological model are the following [20]:
where:
P = E + R + I
P: Precipitation height (mm).
Ε: Actual evapotranspiration (mm).
R: Surface runoff (mm) and
I: Infiltration (mm)
2.2.4. Infiltration
Infiltration is the process by which water enters the surface layers of the soil and then moves to the deeper layers. This amount of water primarily supplements the soil moisture deficit, while the excess moves deeper and feeds the underground aquifer.
Factors affecting infiltration are mainly the soil moisture, rainfall intensity and distribution, geological formations and vegetation. In an area (or catchment), where various geological formations occur, the mean (or uniform) infiltration rate is calculated based on the relationship [20]:
where:
Ιμ = the mean infiltration rate of the catchment
Ε1. Ε2. … Εn = the surface area of individual geological formations
Ι1. Ι2. …. Ιn = the corresponding infiltration coefficients
Εsum = the total surface area of the catchment.
2.3. Water Demand
The demand for water was estimated based on the consumers’ needs. The data of the actual water availability from the network of the respective Municipal Water Supply and Sewerage Service (MWSSS) was also used with caution, as it became clear from the data collected that there is not complete recording and monitoring of the quantities used (given the existence of illegal drilling, network losses. etc.) in the study area.
2.3.1. Water Supply
The estimation of the current water needs for the water supply of the residents can be calculated either based on the water consumption data of the MWSSS, or based on the actual population. The calculation of water supply through the measured consumption values, provided by the MWSSS, presents significant problems. For this reason, the water supply for domestic use was calculated based on the population data recorded by the Hellenic Statistical Authority and specifically, the actual population of the latest census. For the agricultural processing units (small industries) and large hotel facilities, the MWSSS data was used.
The current mean daily water consumption in Municipalities with a population similar to that of the majority of the Aegean islands is estimated to range from 100 to 150 lt/cap/day. This estimation is based on many recent water supply studies and on consumptions calculated by the various MWSSS of the area. Water supply studies often use as a basis, mean daily water consumptions of 200–250 lt/cap/day [13,18]. The use of these increased consumptions is usually conducted with the aim of avoiding the possibility of underestimating the water supply network capabilities (in particular the main pipelines’ dimensions).
The network losses resulting from poor construction are in the range of 5% to 10%. For each Municipal District, network losses were approximated both for the existing condition and for the future requirements, taking into account on a case-by-case basis the information available from the MWSSS on any particular characteristic of the respective local network.
To calculate the water supply needs of the seasonal population, the data of overnight stays provided by the Institute of the Association of Greek Tourist Companies [54], were used, as well as daily water consumption coefficients per vacationer. For the calculation of the total water demand of the seasonal population, visitors to the islands who do not use hotel accommodation for their stay, as well as those who stay in rooms that are not certified by the Institute of the Association of Greek Tourist Companies, were also taken into account (a 10% increase in overnight visitors of the islands is regarded). Five months from May to September, is the period widely accepted as the tourism season’s duration.
2.3.2. Irrigation
The Blaney–Griddle method [55] was used to calculate the amount of water required for crop irrigation. This methodology has been applied to all the Agricultural Technical studies that have been drawn up for the Aegean islands by the Ministry of Agriculture. It is adapted to a satisfactory degree to the conditions that prevail in Greece and it closely approximates the actual water needs of the crops [56].
To calculate the amount of water required by the crops, the recently approved plant coefficients by the Ministry of Agriculture were used. In the calculations, the North Geographical Latitude was used, which corresponds to approximately the center of each island, which is considered sufficient, given that the percentages of daylight hours available are given per entire degree. Unfortunately, in this work it was not possible to determine irrigation water demand using the more precise generalized Penman [36] approach, since most islands lack data of solar radiation and wind speed.
The main method of irrigation in the study area is the drip irrigation. The drip irrigation is applied to a part of the soil and specifically, to the area of the plants root system. The water supply from the drippers is very low, 2–3 lt/h, and as a result, most of the water volume is filtered into the ground and does not runoff on the surface. Since irrigation is repeated daily for 2–3 h to cover the evaporated water, there is no water loss resulting from deep seepage.
The irrigation season is defined by the meteorological data and the water demand of the crops. For all kinds of crops, the period between March 15 and October 15 is determined as the irrigation period. Finally, it should be noted that despite the use of methods that have resulted from many years of experience in the implementation of Greek Agricultural Technical studies, and which are generally accepted by the Ministry of Agriculture, the calculated total consumptions are usually higher than those measured by the organized irrigation services. This is evident for the reasons listed below: (a) the planned or recorded irrigated areas are not irrigated every year, and (b) olive trees and grapevines could use winter rainfall or runoff instead of summer irrigation with a relatively slight decrease in productivity.
3. Results and Discussion
3.1. Results of the Water Balance Model
Precipitation height (P), actual evapotranspiration (E), surface runoff (R), and infiltration (I) were calculated for each major hydrologic catchment. The calculation of all the above parameters, both at the level of mean monthly value and mean annual value, was carried out by applying the model for the three islands separately.
3.1.1. Precipitation
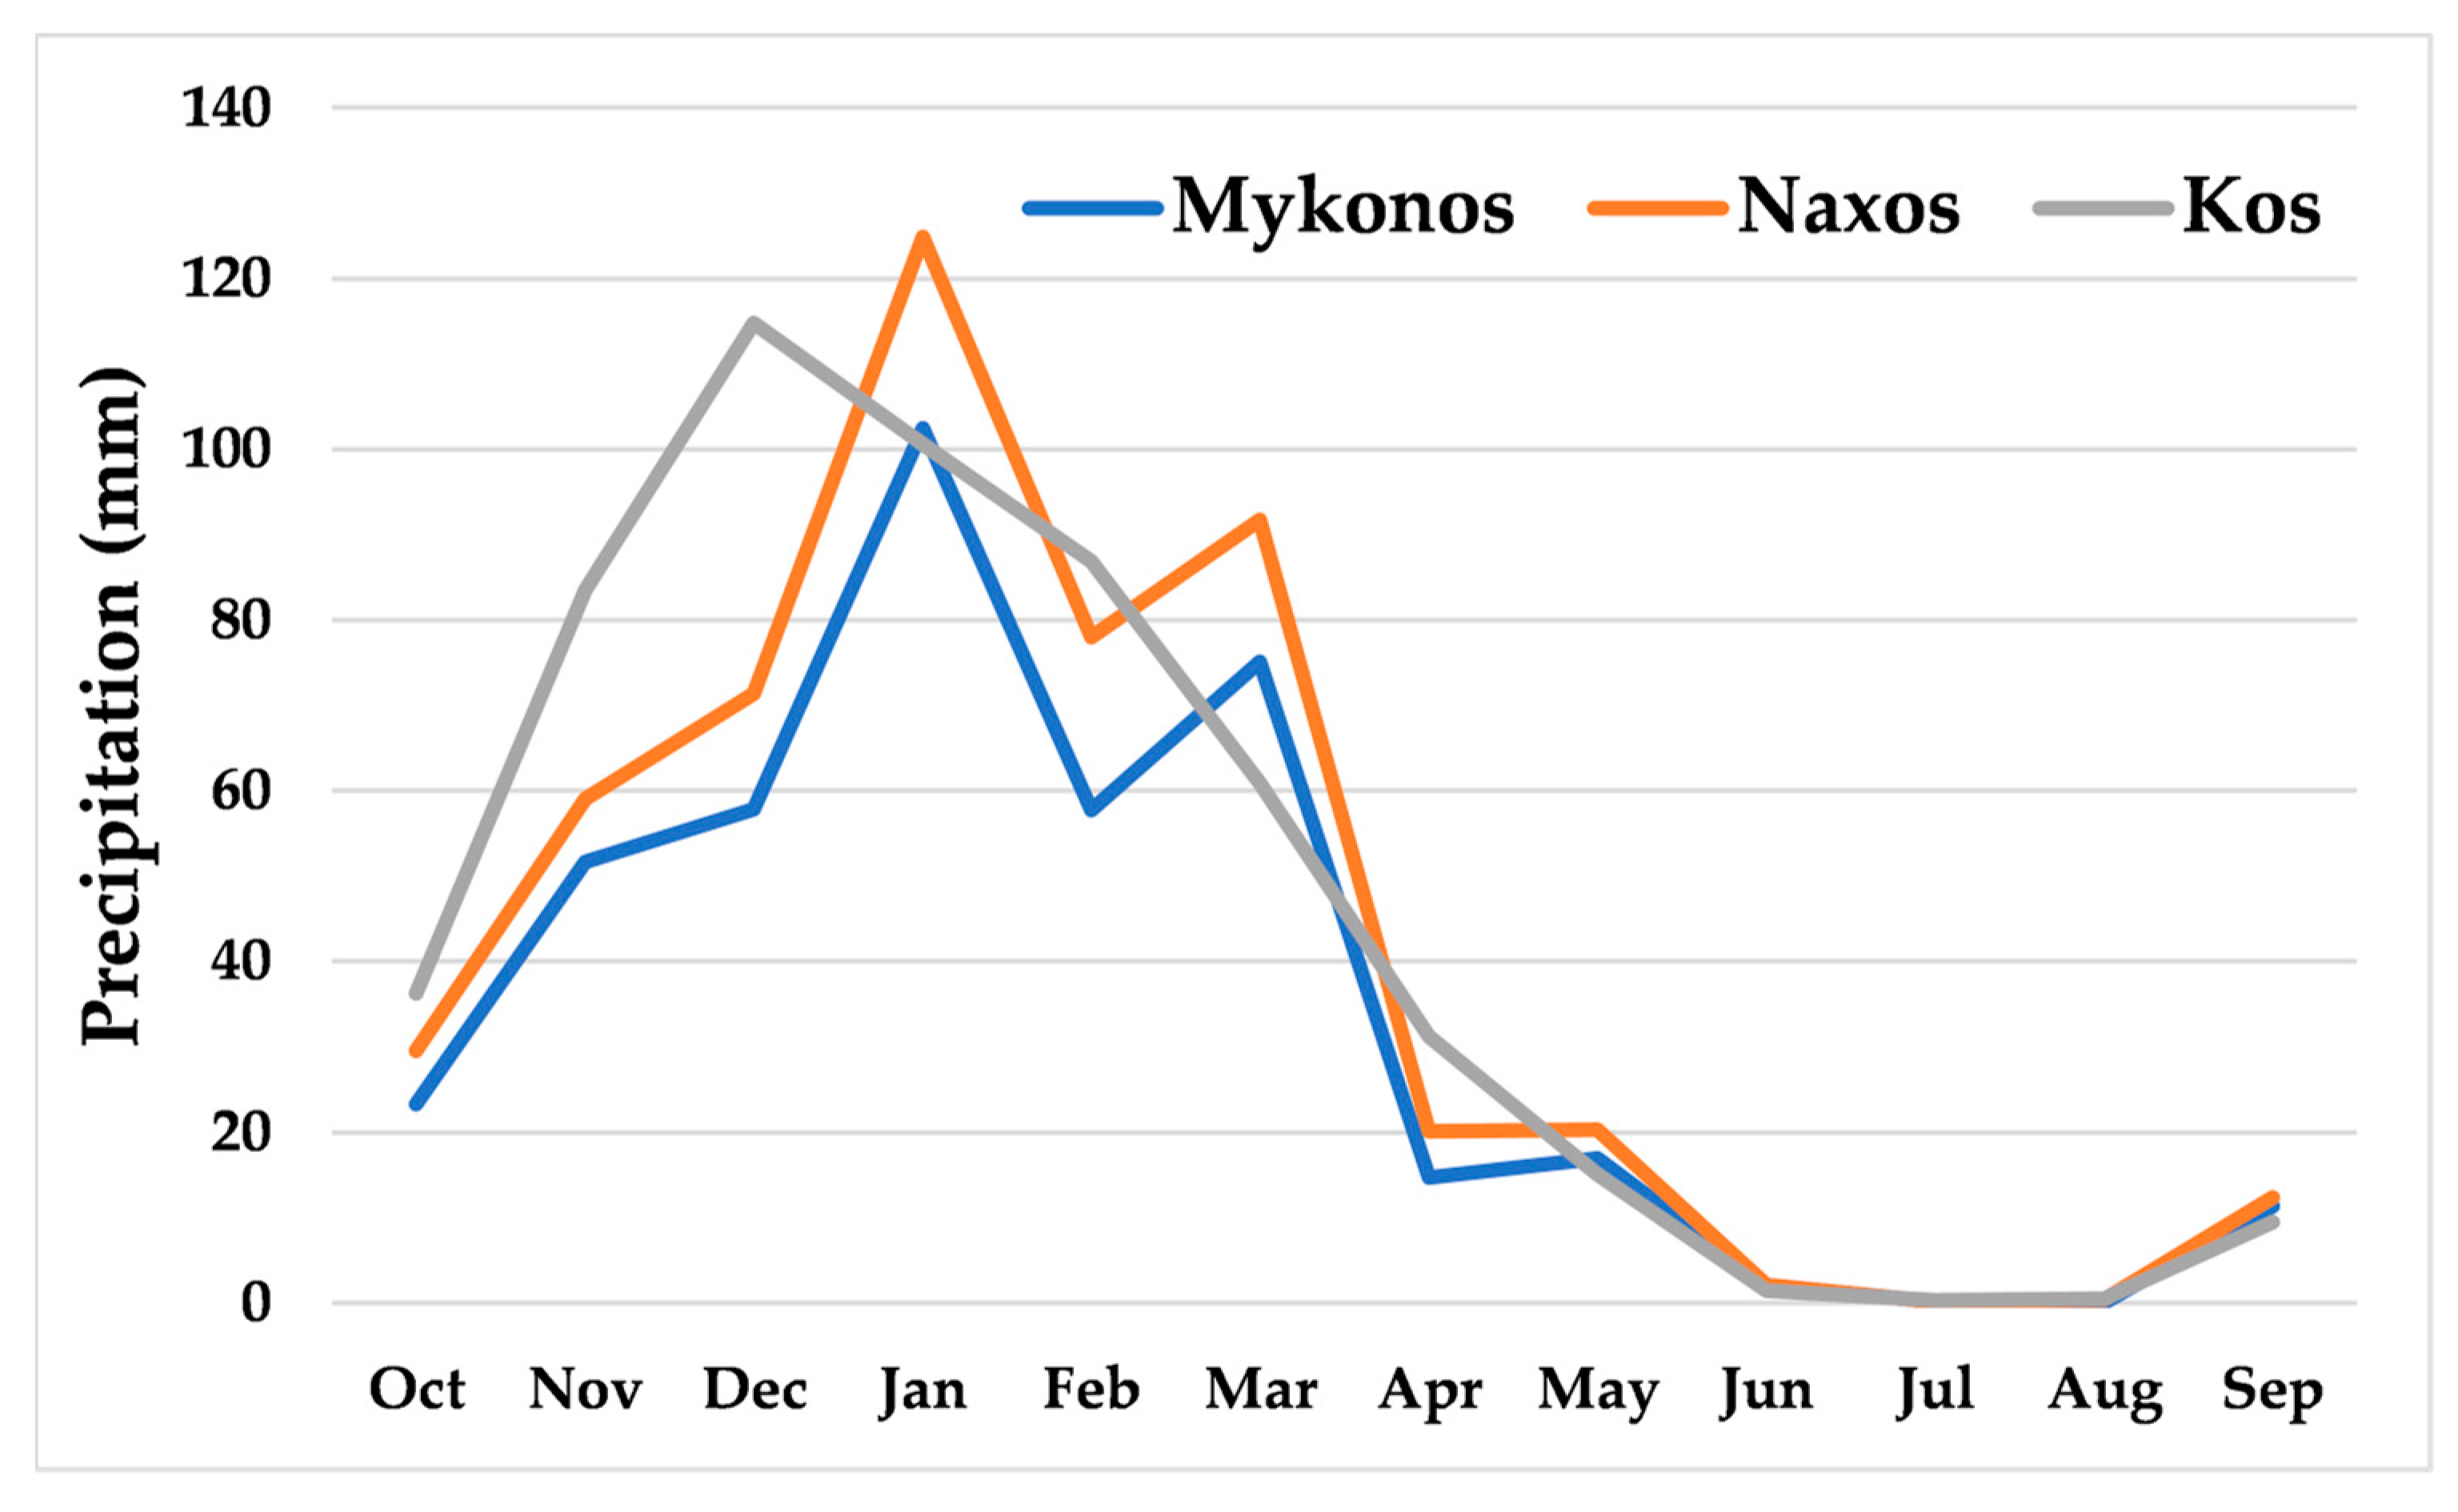
Precipitation is the most important parameter for calculating the hydrological balance of a catchment, since it is the only source of water supply. The relation of rain and altitude was used to spatially distribute the precipitation over the catchments. The results obtained are listed in Table 2 below. The mean annual rainfall is equal to 413 mm for Mykonos, 510 mm for Naxos and 541 mm for Kos. Figure 2 demonstrates the dry period duration, which in all three islands surpasses a six-month period.
Having calculated the value of the mean annual rainfall for all the main hydrological catchments of the research area and knowing the area of each catchment, the volume of water received by each catchment was calculated (Table 3). The table indicates that Kos is characterized by a higher volume of water per square kilometer, since it receives higher annual rainfall.
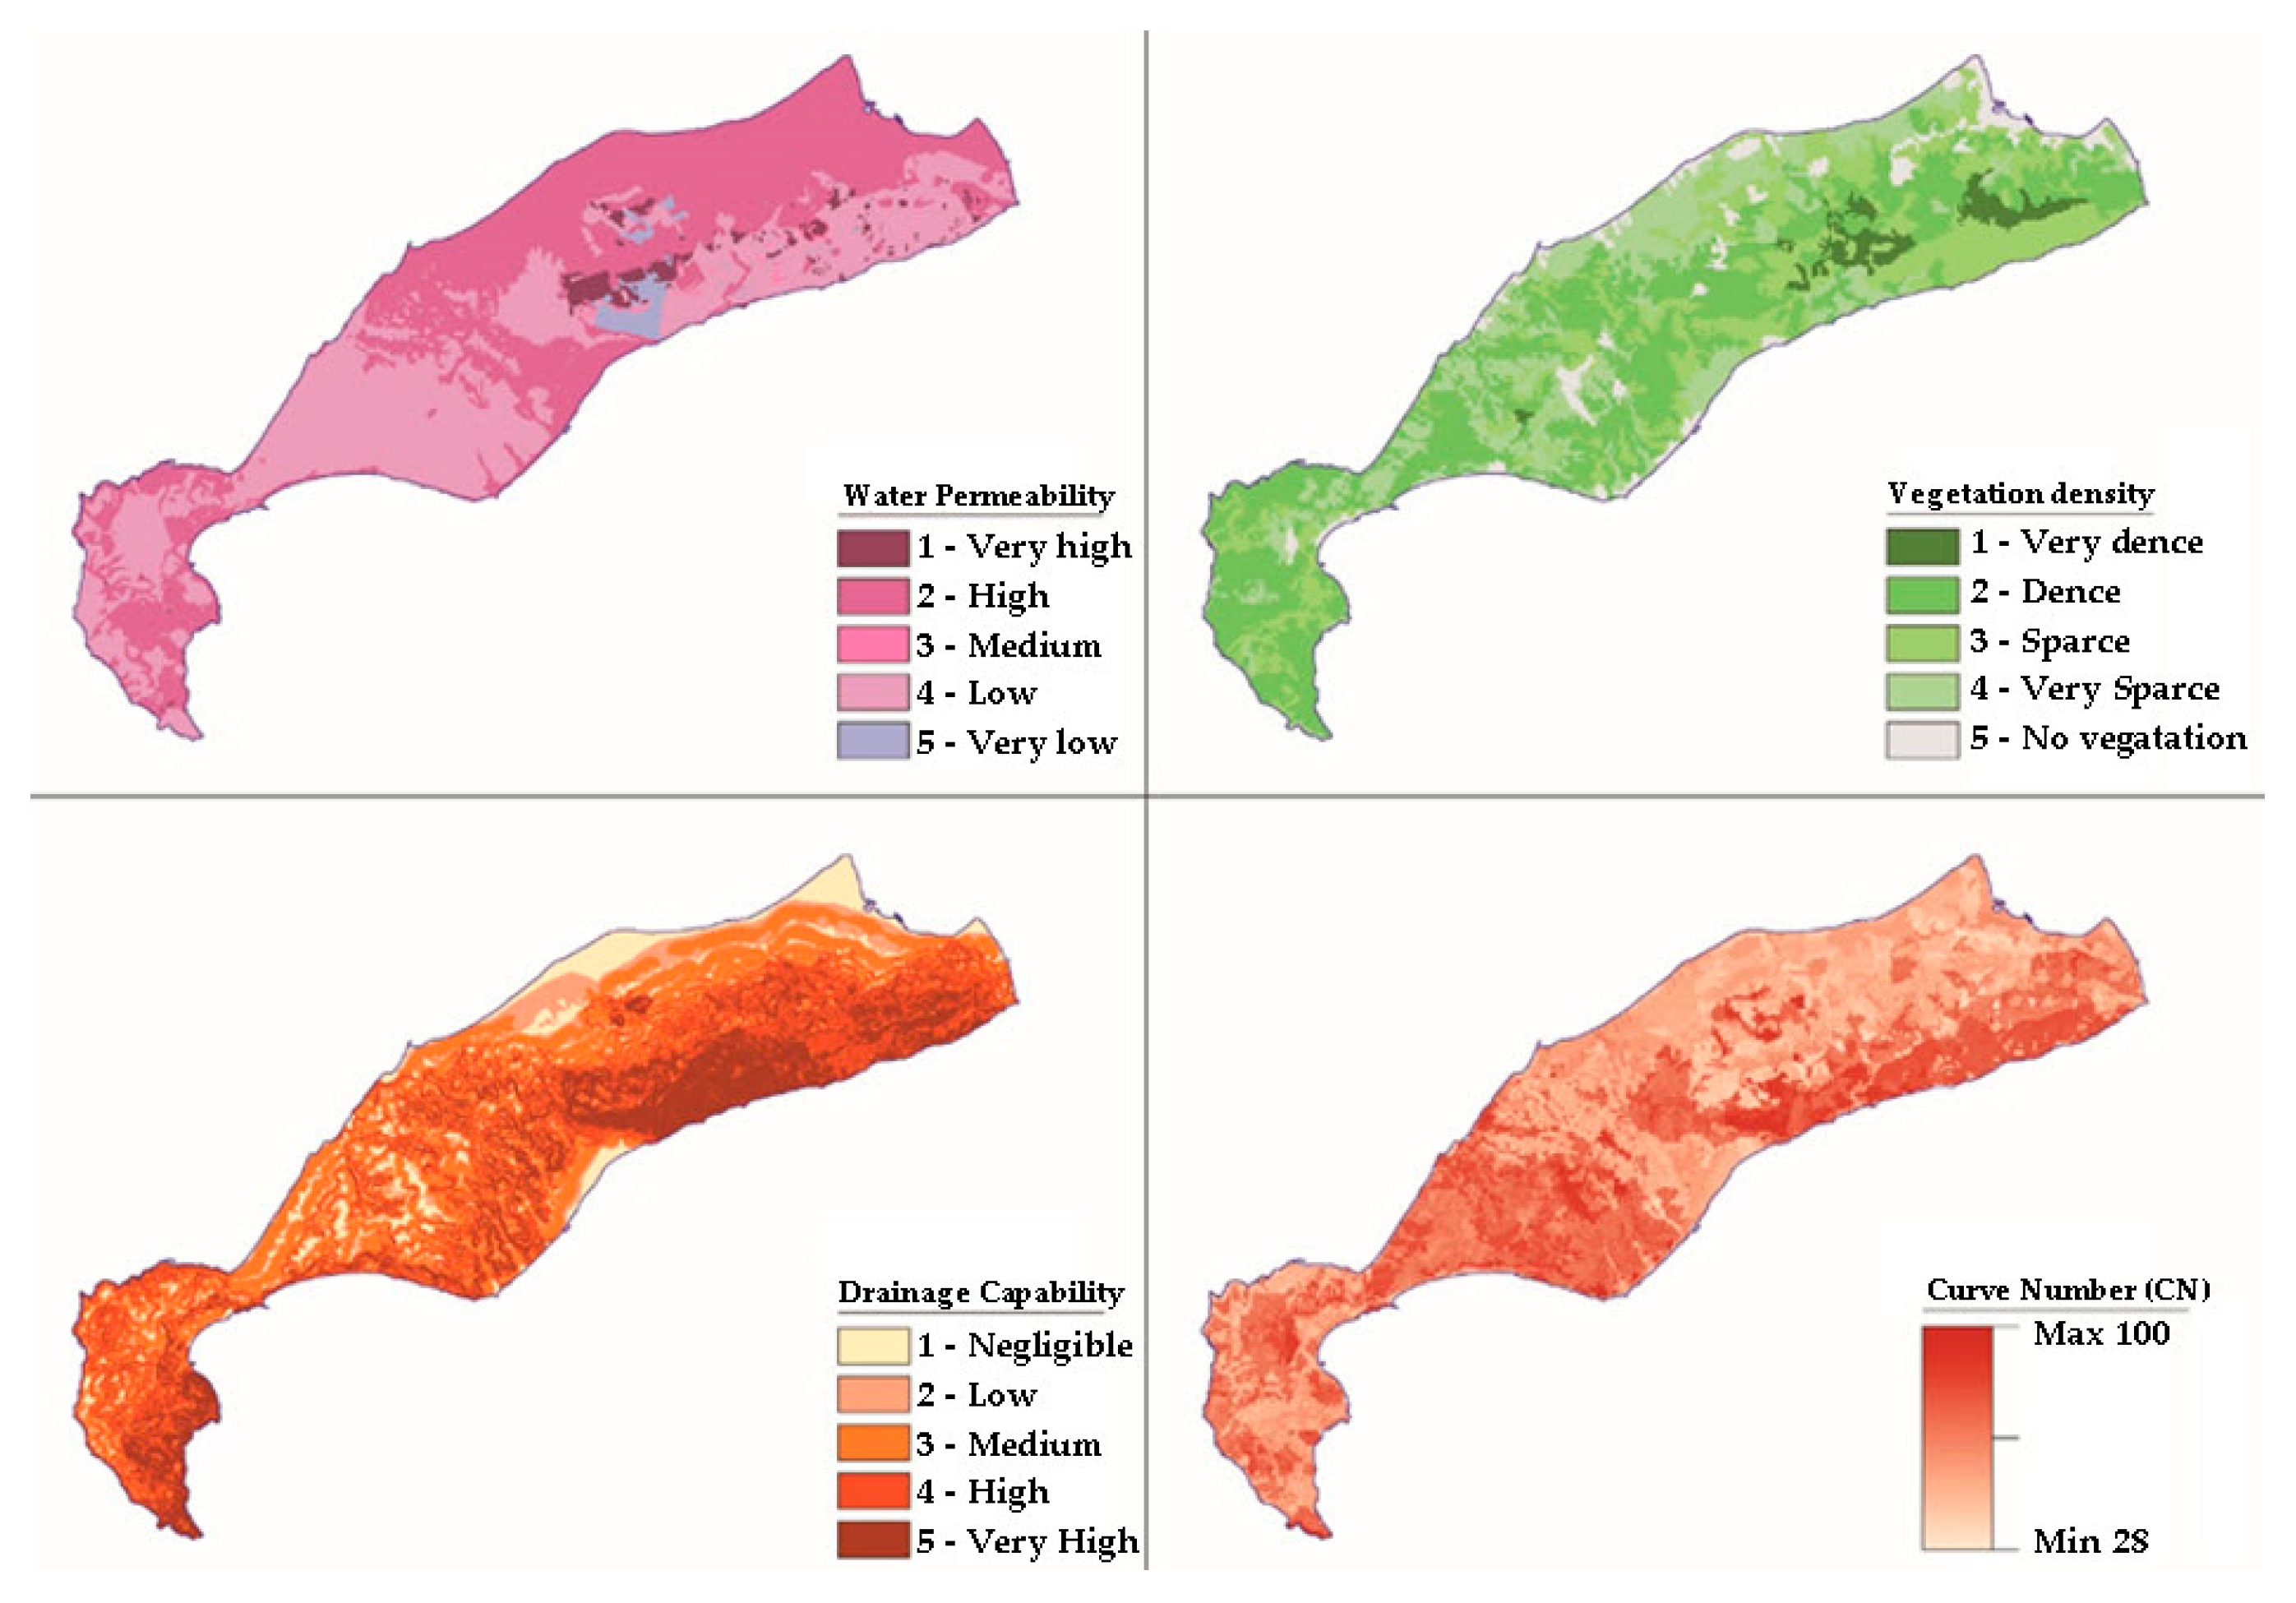
3.1.2. Curve Number (CN) Calculation
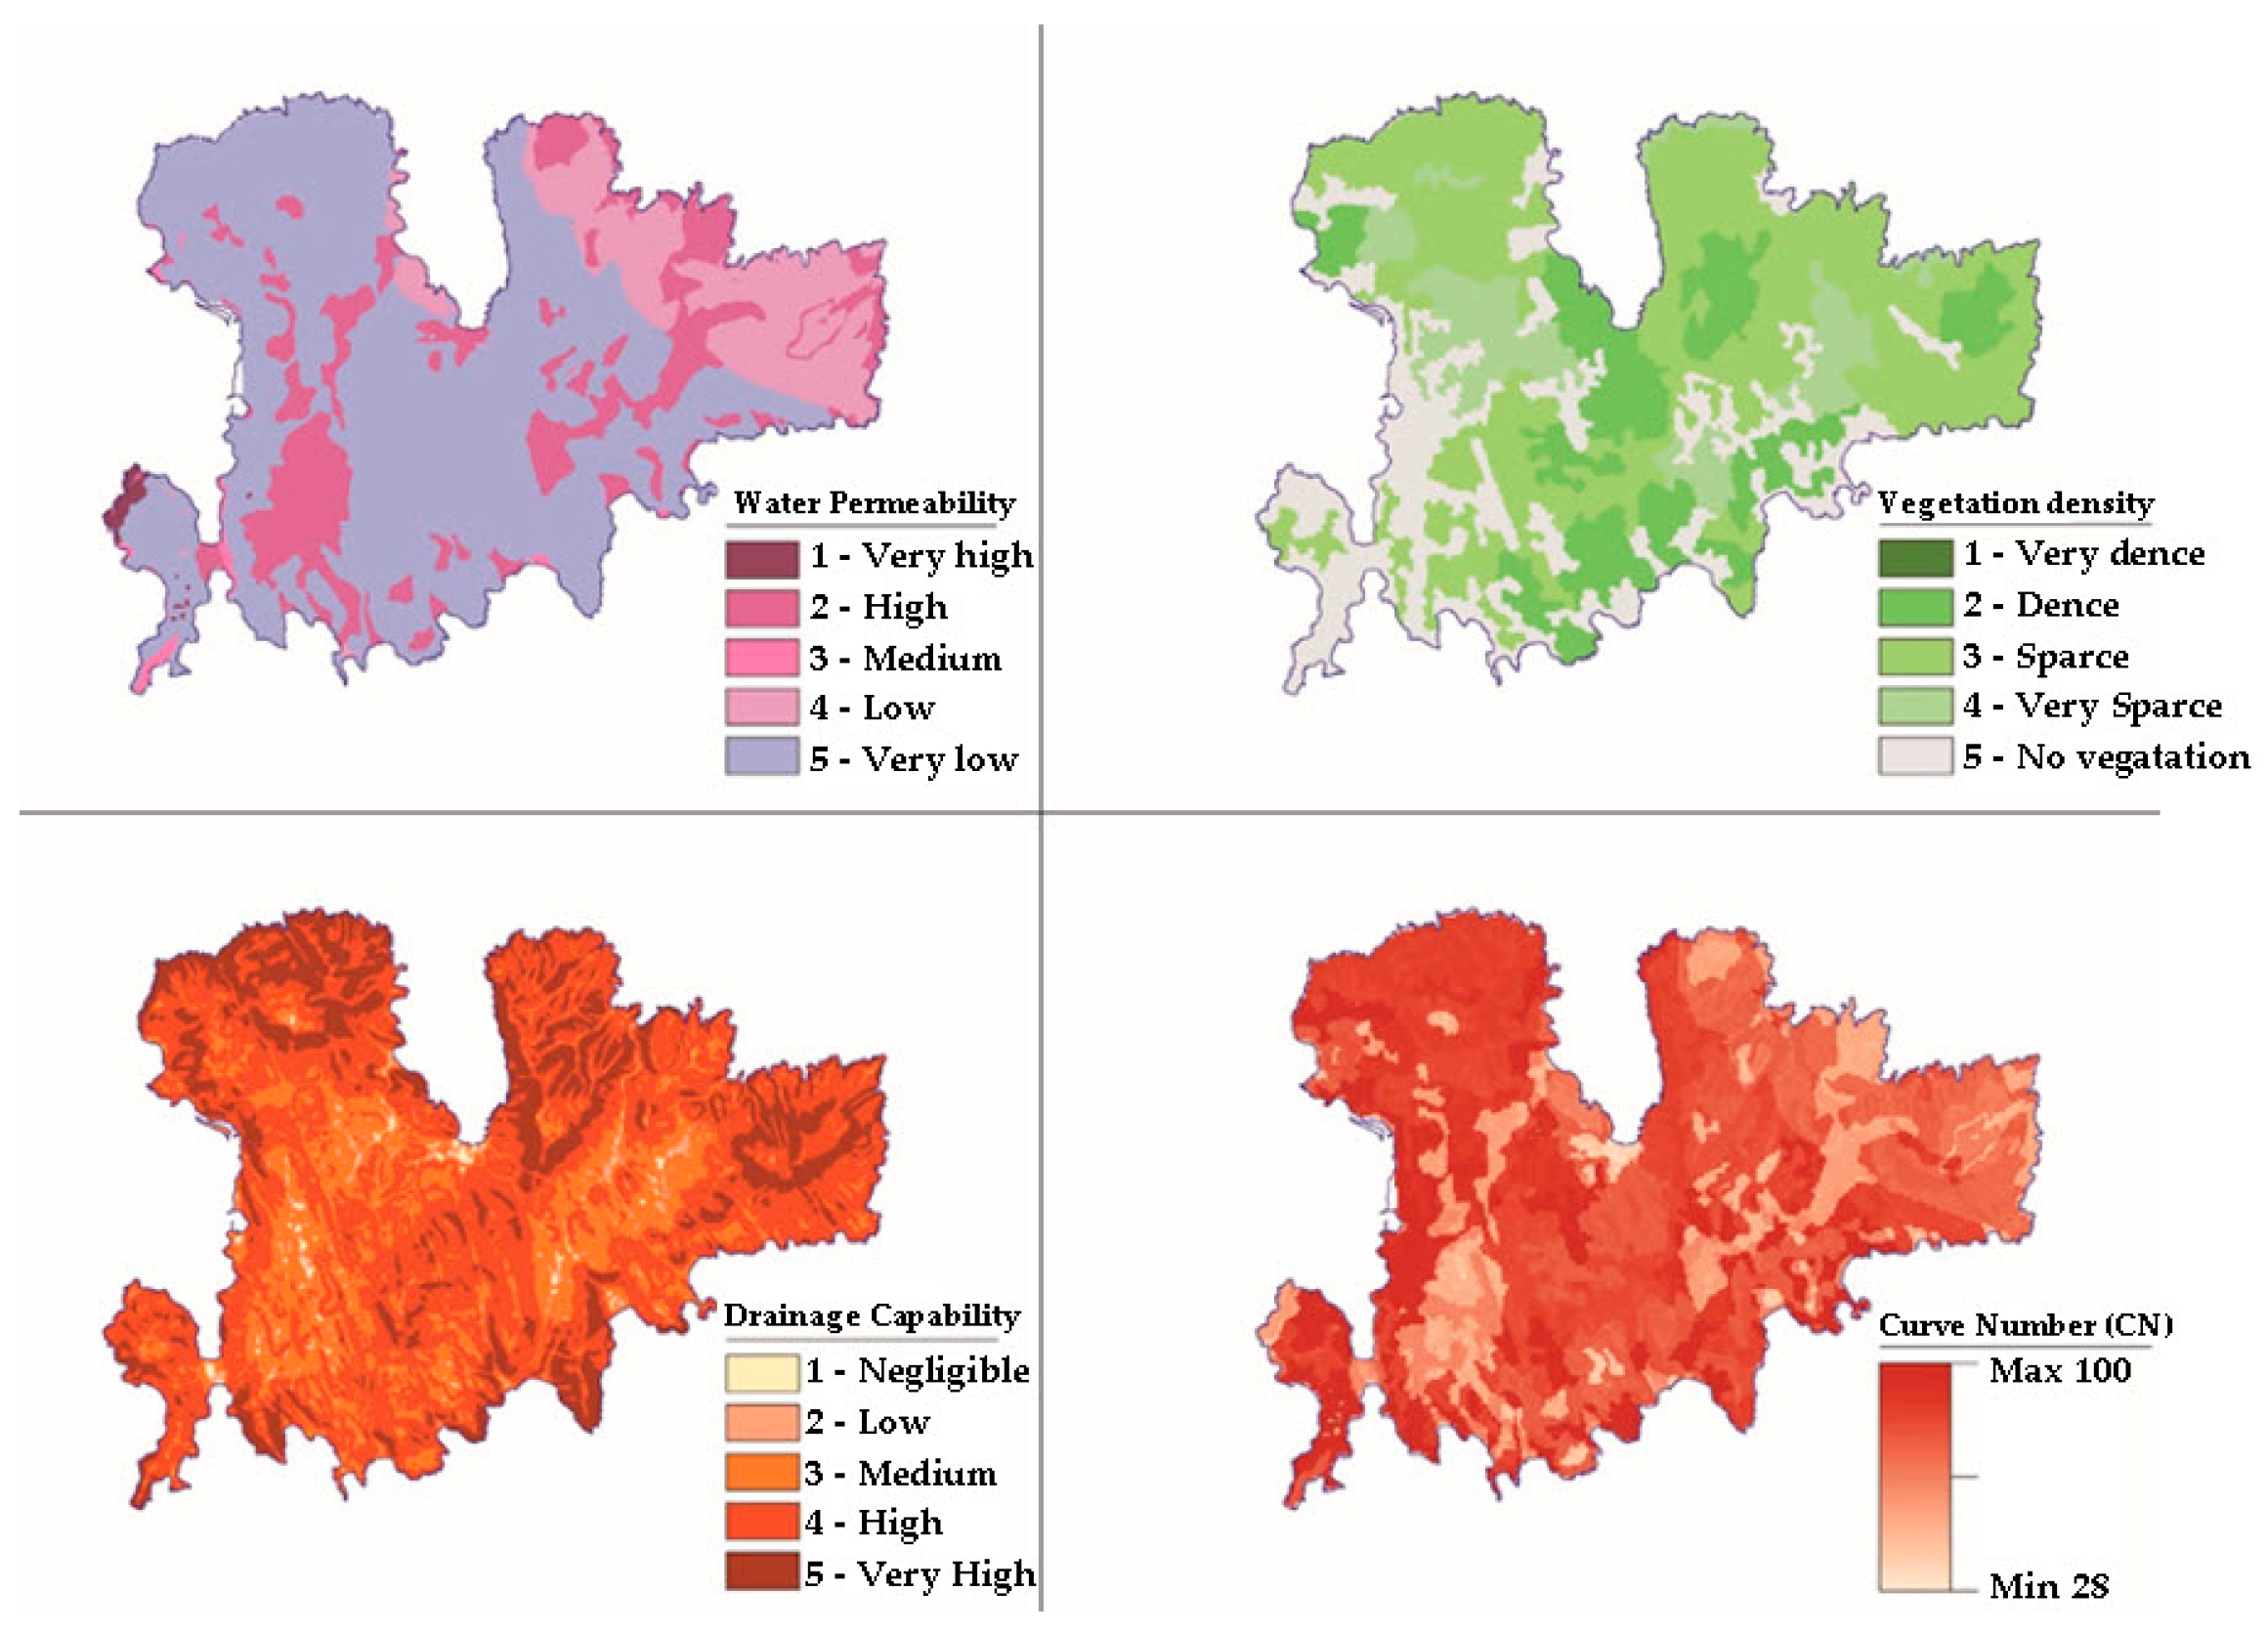
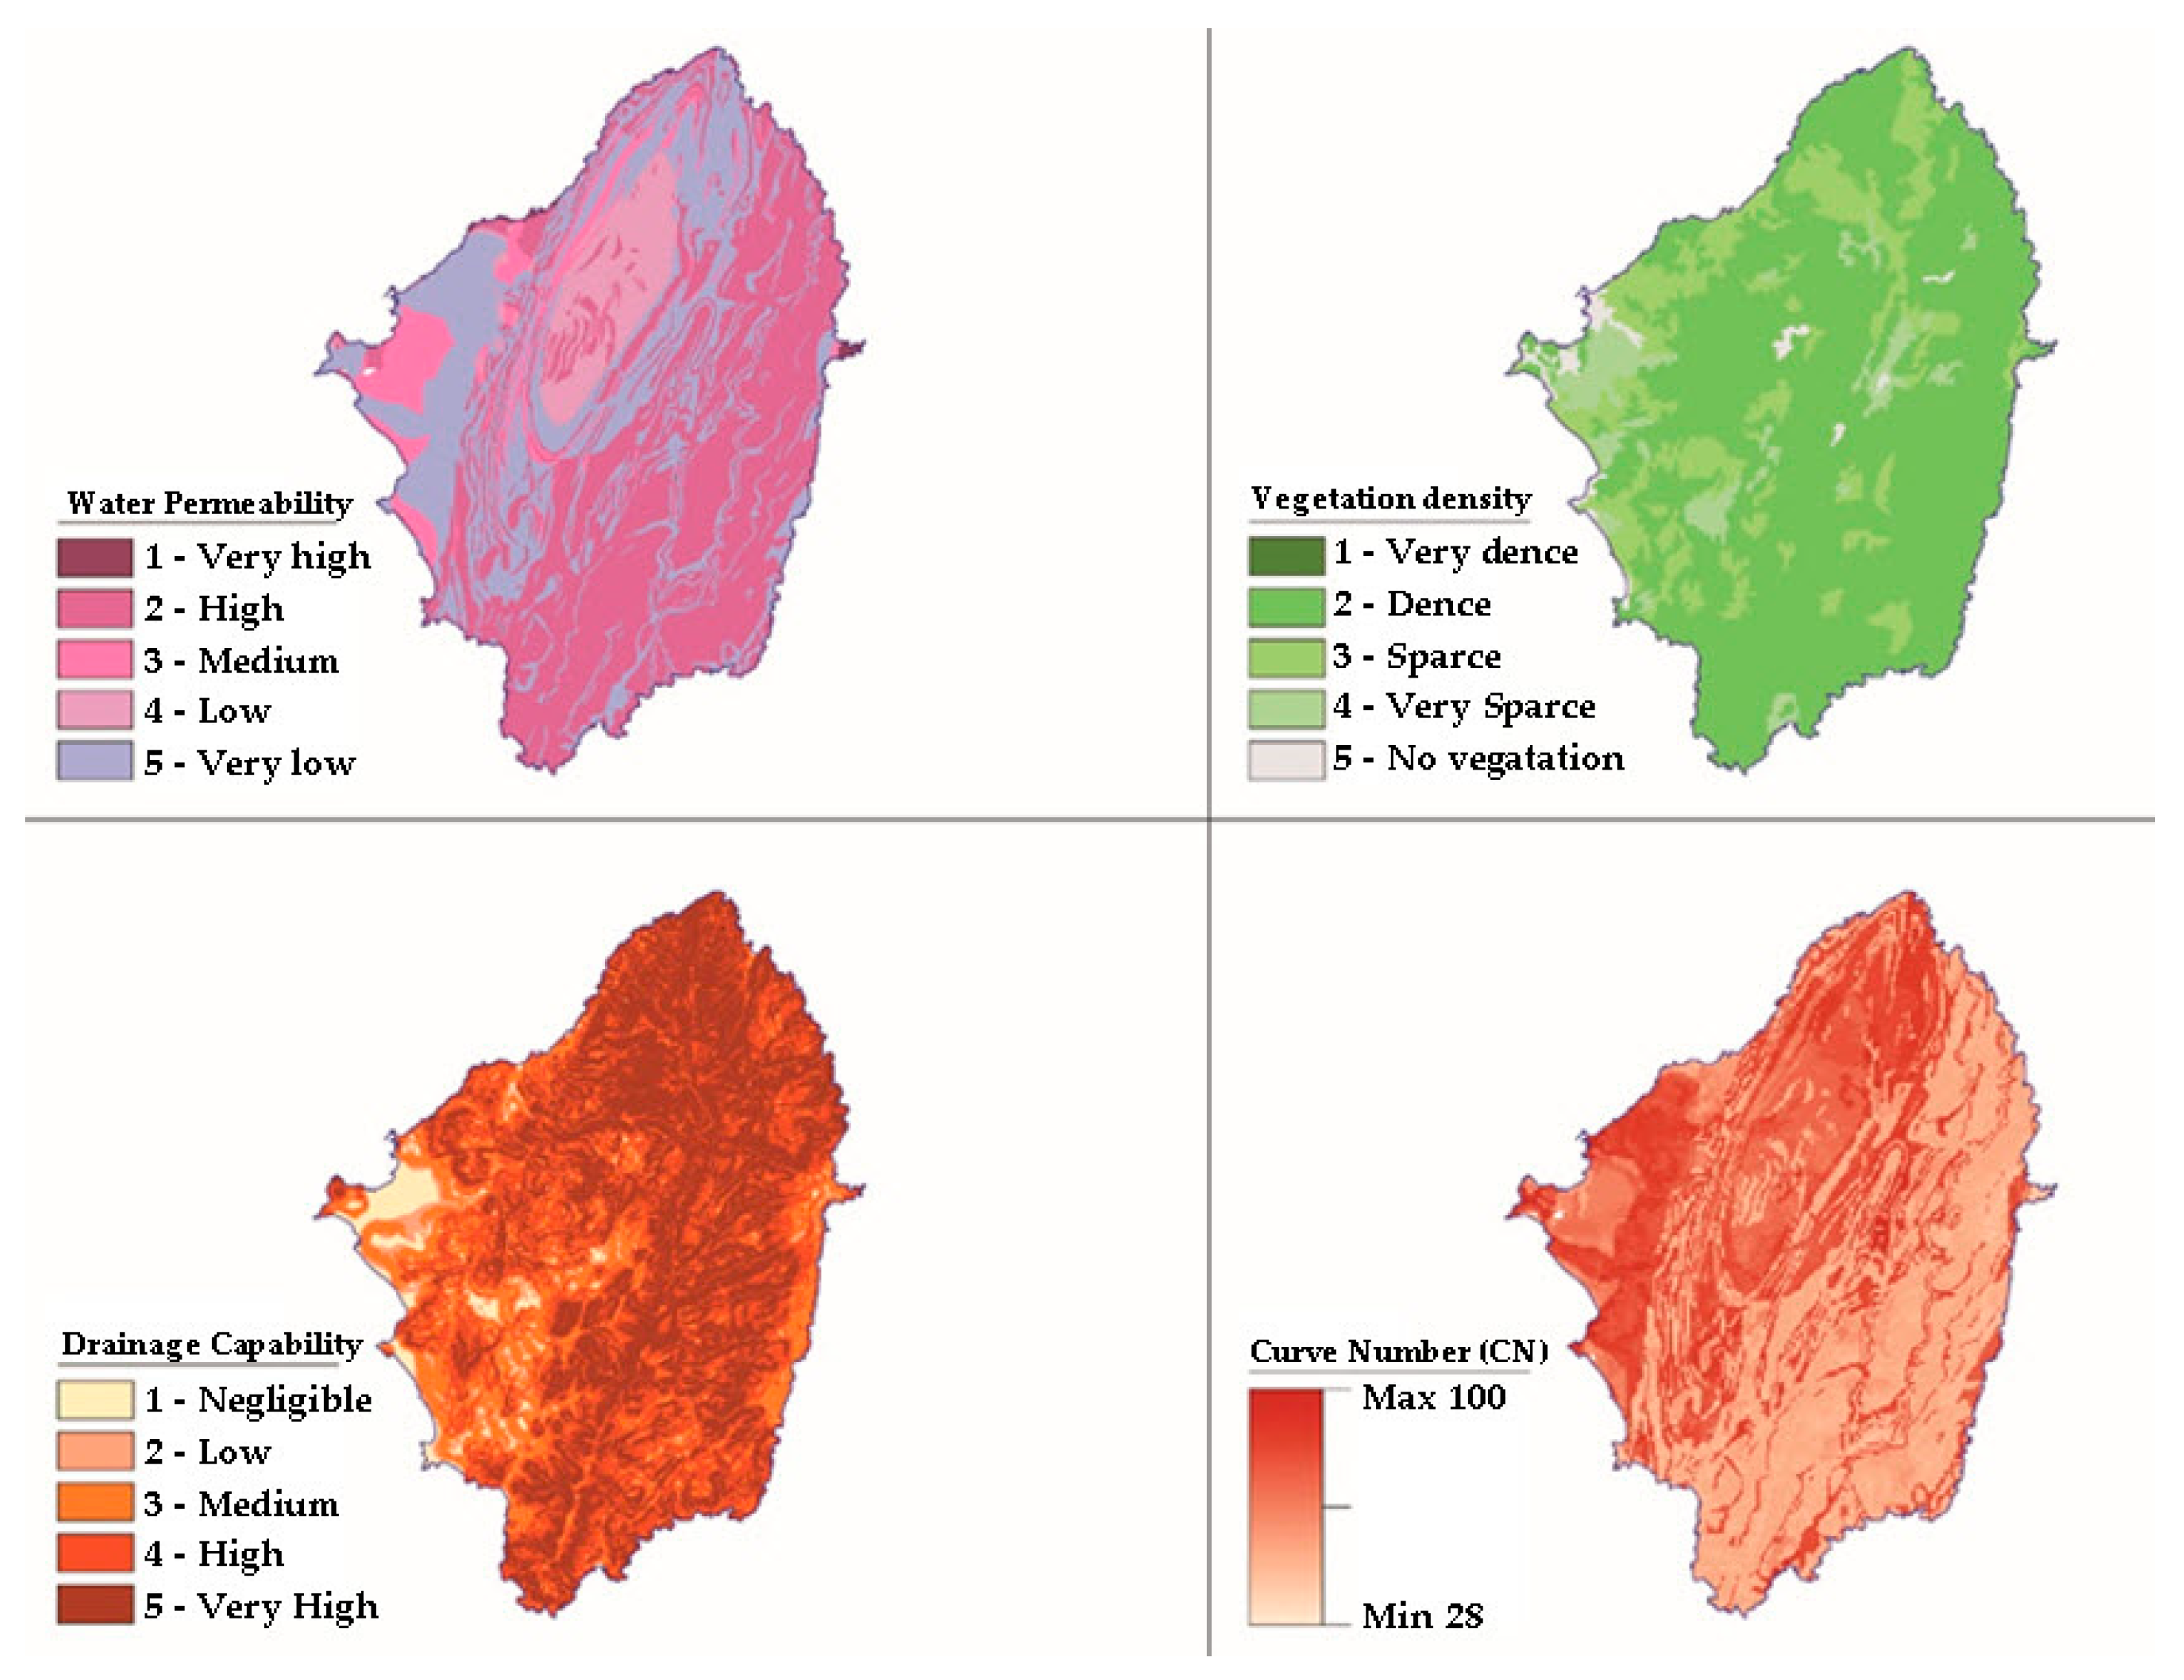
Based on the soil characteristics and land uses of the catchments, the Curve Number runoff coefficient (CN) and the maximum capacity of the soil reservoir were estimated (Κ). Figure 3, Figure 4 and Figure 5 show the categories of CN calculation factors (permeability, vegetation, drainage capacity) and the CN index.
3.1.3. Analysis of Evapotranspiration
The actual evapotranspiration has been calculated for each hydrological catchment. According to the results, it appears that evapotranspiration is quite high in the area, which is sufficiently justified by the climatic conditions of the study area. On an annual basis, the losses due to evapotranspiration correspond to 74% of the precipitation for Mykonos, 75% for Naxos and 73% for Kos. From the total amount of precipitation, if evapotranspiration losses are subtracted, 26% of the precipitation in Mykonos, 25% in Naxos and 27% in Kos remains available for runoff and infiltration.
3.1.4. Surface Runoff
The surface runoff in the research area, as in the rest of the Aegean islands, appears in the form of flash floods events, through the relatively dense hydrographic network, giving a more torrential function to the stream of the islands. The rapid runoff is caused by geomorphological factors, such as the low length of streams and small area of catchments, combined with the relatively steep slopes.
There are no streams of permanent flow in the area. The possible presence of some flow in some places is connected to the source springs, from which they are supplied. On-site measurements of surface runoff are infeasible to perform due to the temporary nature of runoff in the study area. For this reason, through the application of the hydrological model, it was possible to calculate the mean monthly and mean annual surface runoff for each of the main hydrological catchments (Table 3).
According to Table 3, it appears that the island of Naxos exhibits the lowest surface runoff volume, which is mainly justified by the higher infiltration rate. The high infiltration rate, compared to the other two islands, is mainly attributed to the large area covered by limestone formations.
3.1.5. Infiltration
This parameter of the hydrological balance is estimated to be at high levels in Naxos, which is attributed to the wide spread of highly permeable geological formations (limestone). However, in this case, the infiltration depends not only on the permeability of the formations, but also on the direction and density of the rock discontinuities. It is revealed that the infiltration varies at fairly low levels on the islands of Mykonos and Kos, due to the relatively impermeable geological formations (granite, gneiss, volcanic rocks), while in Naxos the infiltration rate is higher (Table 3).
3.2. Water Balance
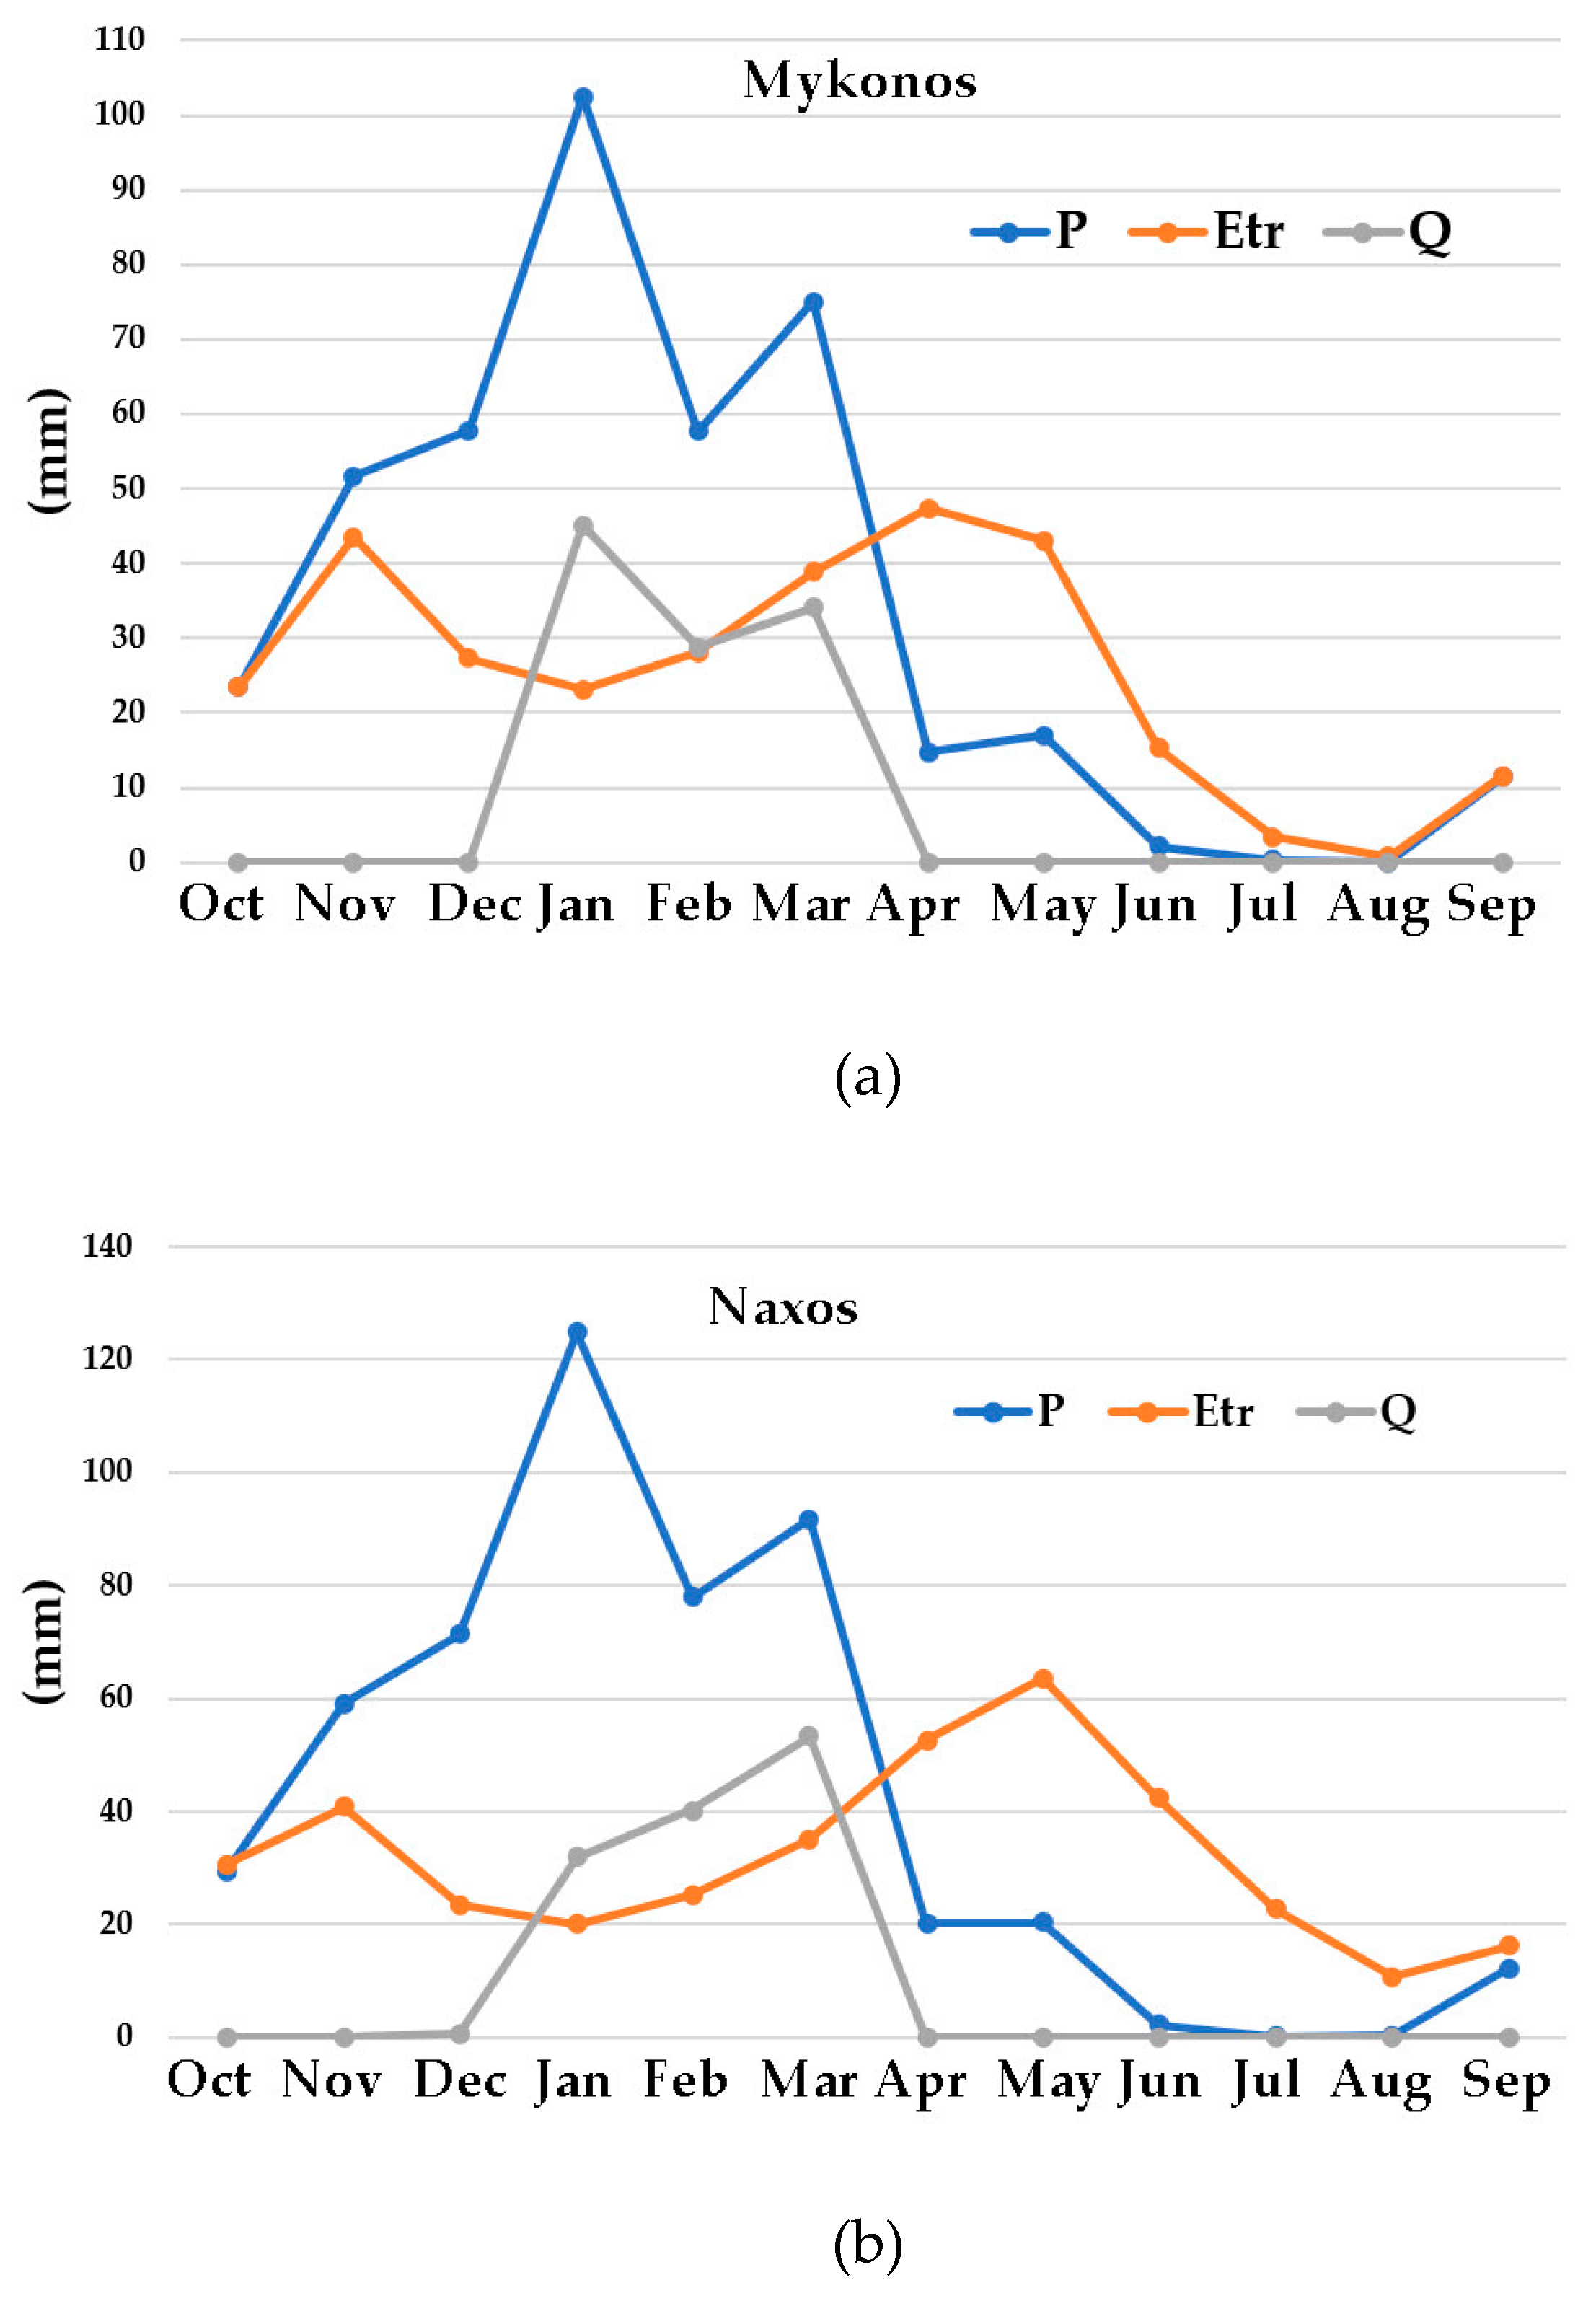
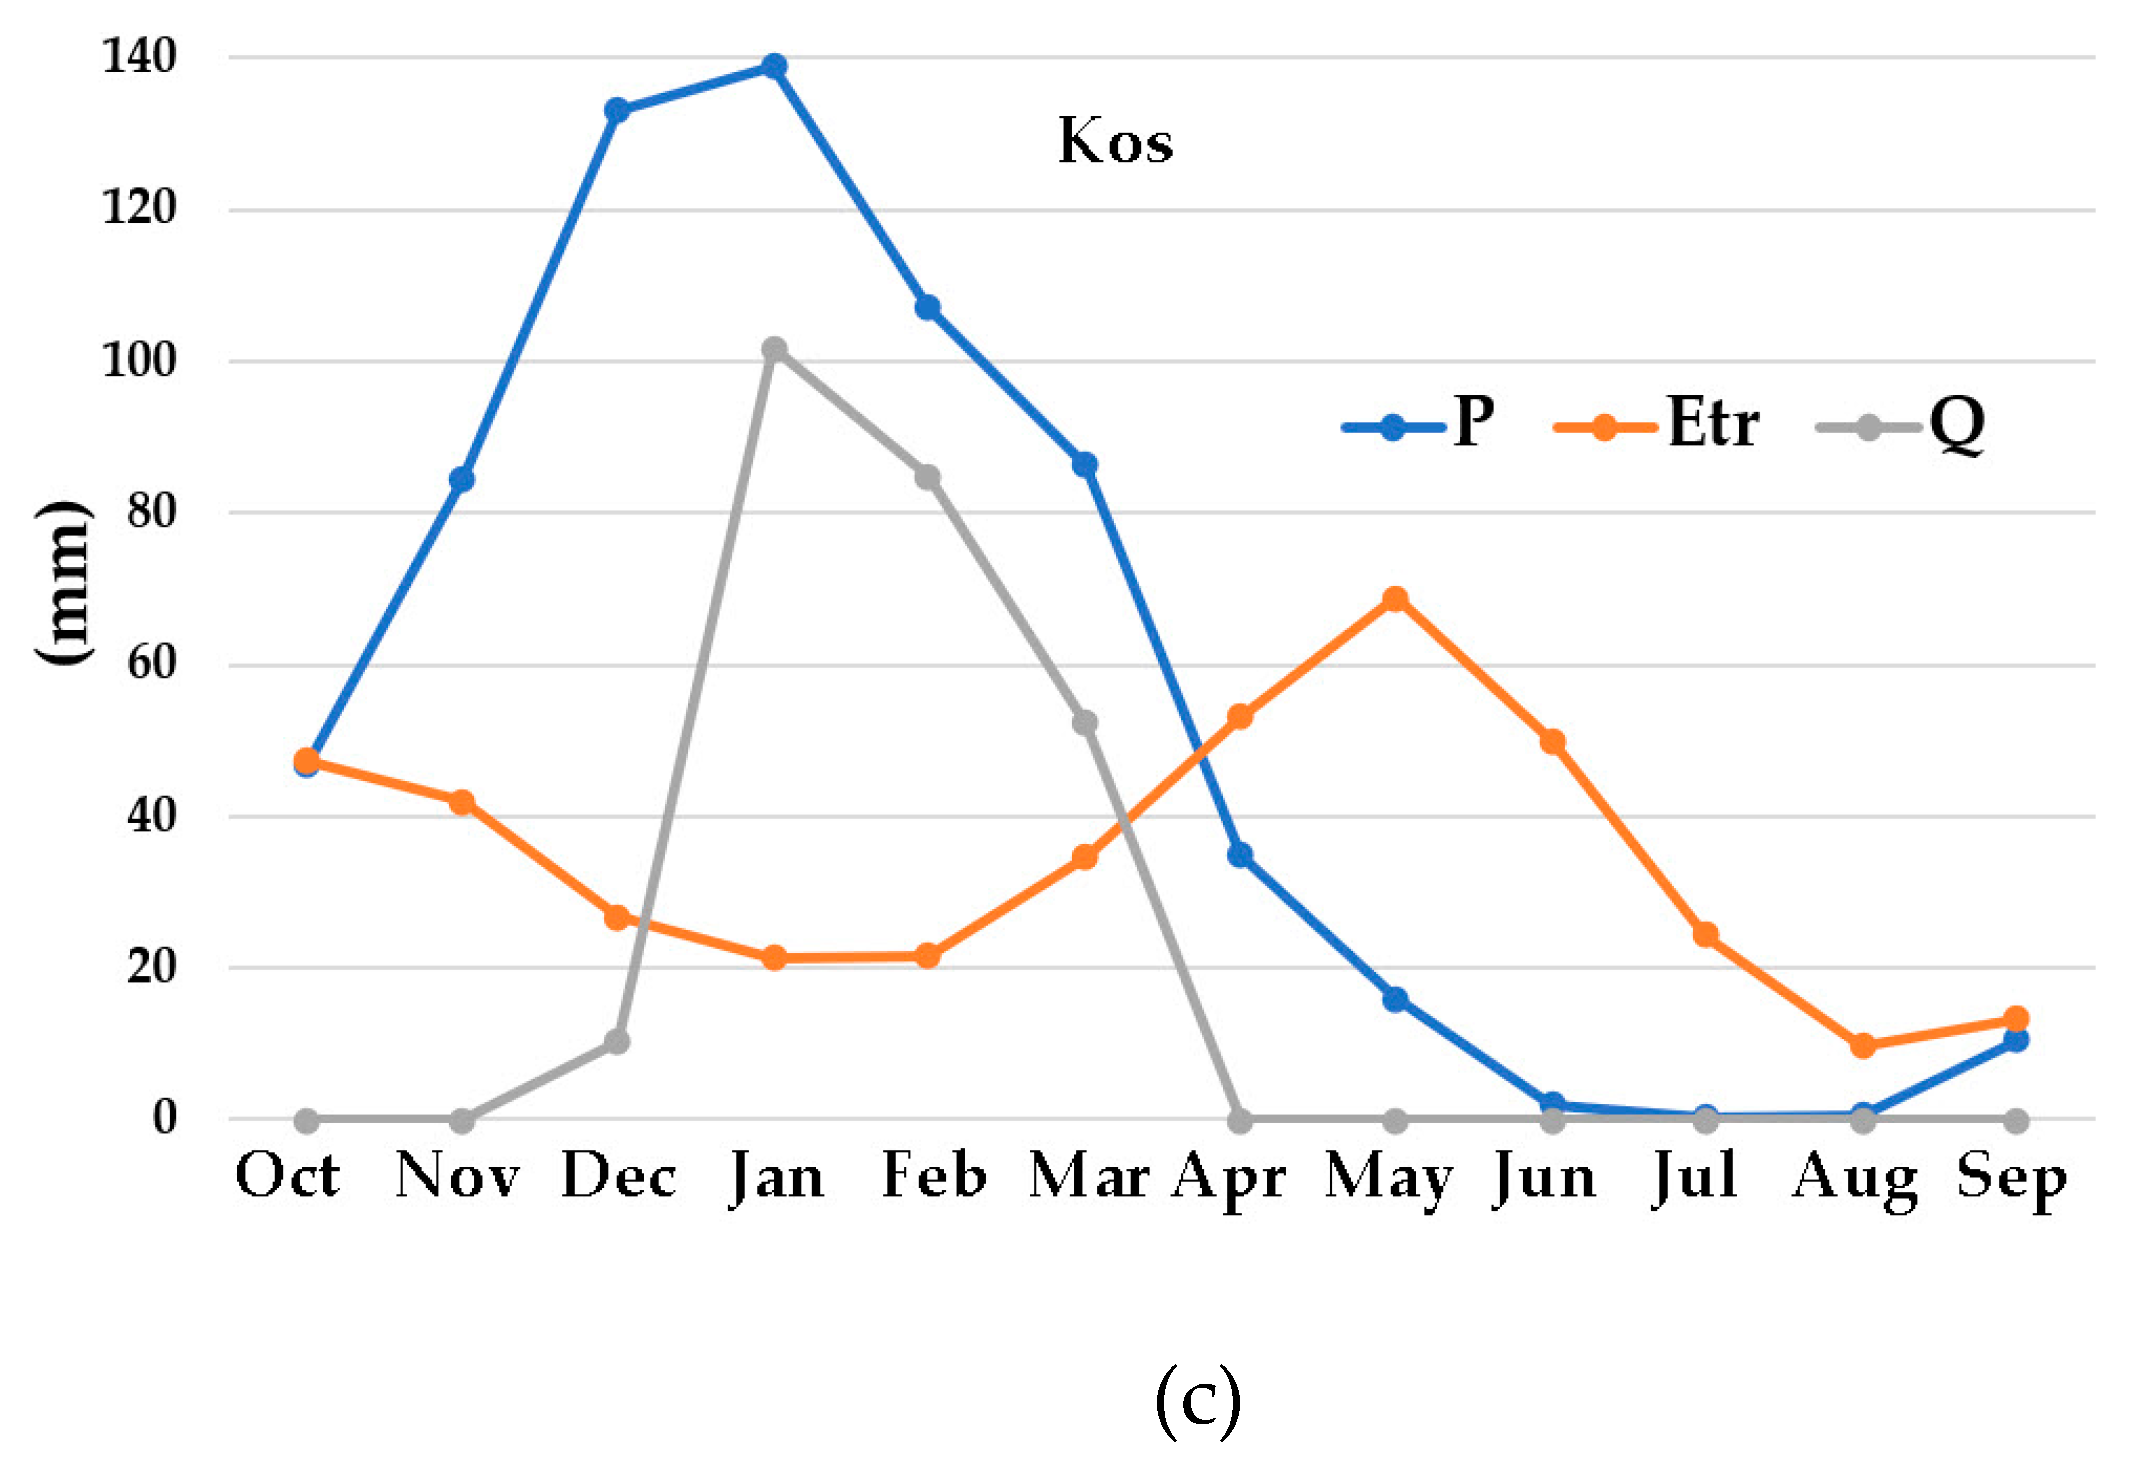
The results of the monthly runoff values were derived from the application of the modified Thornthwaite–Mather water balance model. Table 3 presents the mean annual values of precipitation (P), actual evapotranspiration (Etr), surface runoff (Q) and infiltration (I) for the catchments of the three islands of the study area.
In Table 4, it can be seen that the monthly runoff and infiltration values range from 0 to 45 mm for Mykonos Island, 0–53 mm for Naxos and 0–65 mm for Kos. According to Table 4 and Figure 6, it is observed that surface runoff occurs exclusively during the winter months (December, January and February) with significantly higher values on the island of Kos. The long period of absence of surface runoff (8–9 months), observed in the study area, is highly typical for the Mediterranean region and especially for the Greek conditions. Different studies conducted in northern Greece, an area which receives higher amounts of precipitation, showed a similarly long period of zero surface runoff between the period of May and November [57,58]. Previous studies from the Greek territory, had showed similar results of very long periods of water deficit [43,45]. Additionally, a study carried out in Spain showed that the period of surface runoff is concentrated mainly between January and March [59].
These amounts of water could be further utilized to solve the problem of water scarcity in the study area. The amount of runoff generated from an area of one km2 during the hydrological year, corresponds to the mean annual specific runoff m3/km2/year and amounts to 74,200 in Mykonos, 41,290 in Naxos and 107,900 in Kos. Characteristic of the study area is the lack of surface runoff for most of the year (more than 9 months).
For the calculation of the evapotranspiration of each month, the model also takes into account the stored water in the soil (Sn) of the previous month. November is the first month of the year that the monthly precipitation exceeds the evapotranspiration. This indicates that the water stored in the soil was almost zero in previous months. According to the model, surface runoff and infiltration movement to the aquifer are calculated when the stored water in the soil exceeds the maximum soil moisture capacity (Κ). The average maximum soil moisture capacity (Κ) for the study area is 76 mm. The surface runoff and infiltration are almost zero in December, because the water deficit in stored water in the soil, was very high in the previous months. In the following months (January–March), where precipitation is much higher than evapotranspiration, the water stored in the soil exceeds the maximum soil moisture capacity (Κ) and the surface runoff and infiltration begin to take place.
Table 5 and summarize the water balance of the catchments of the three islands derived from the water balance parameters calculation.
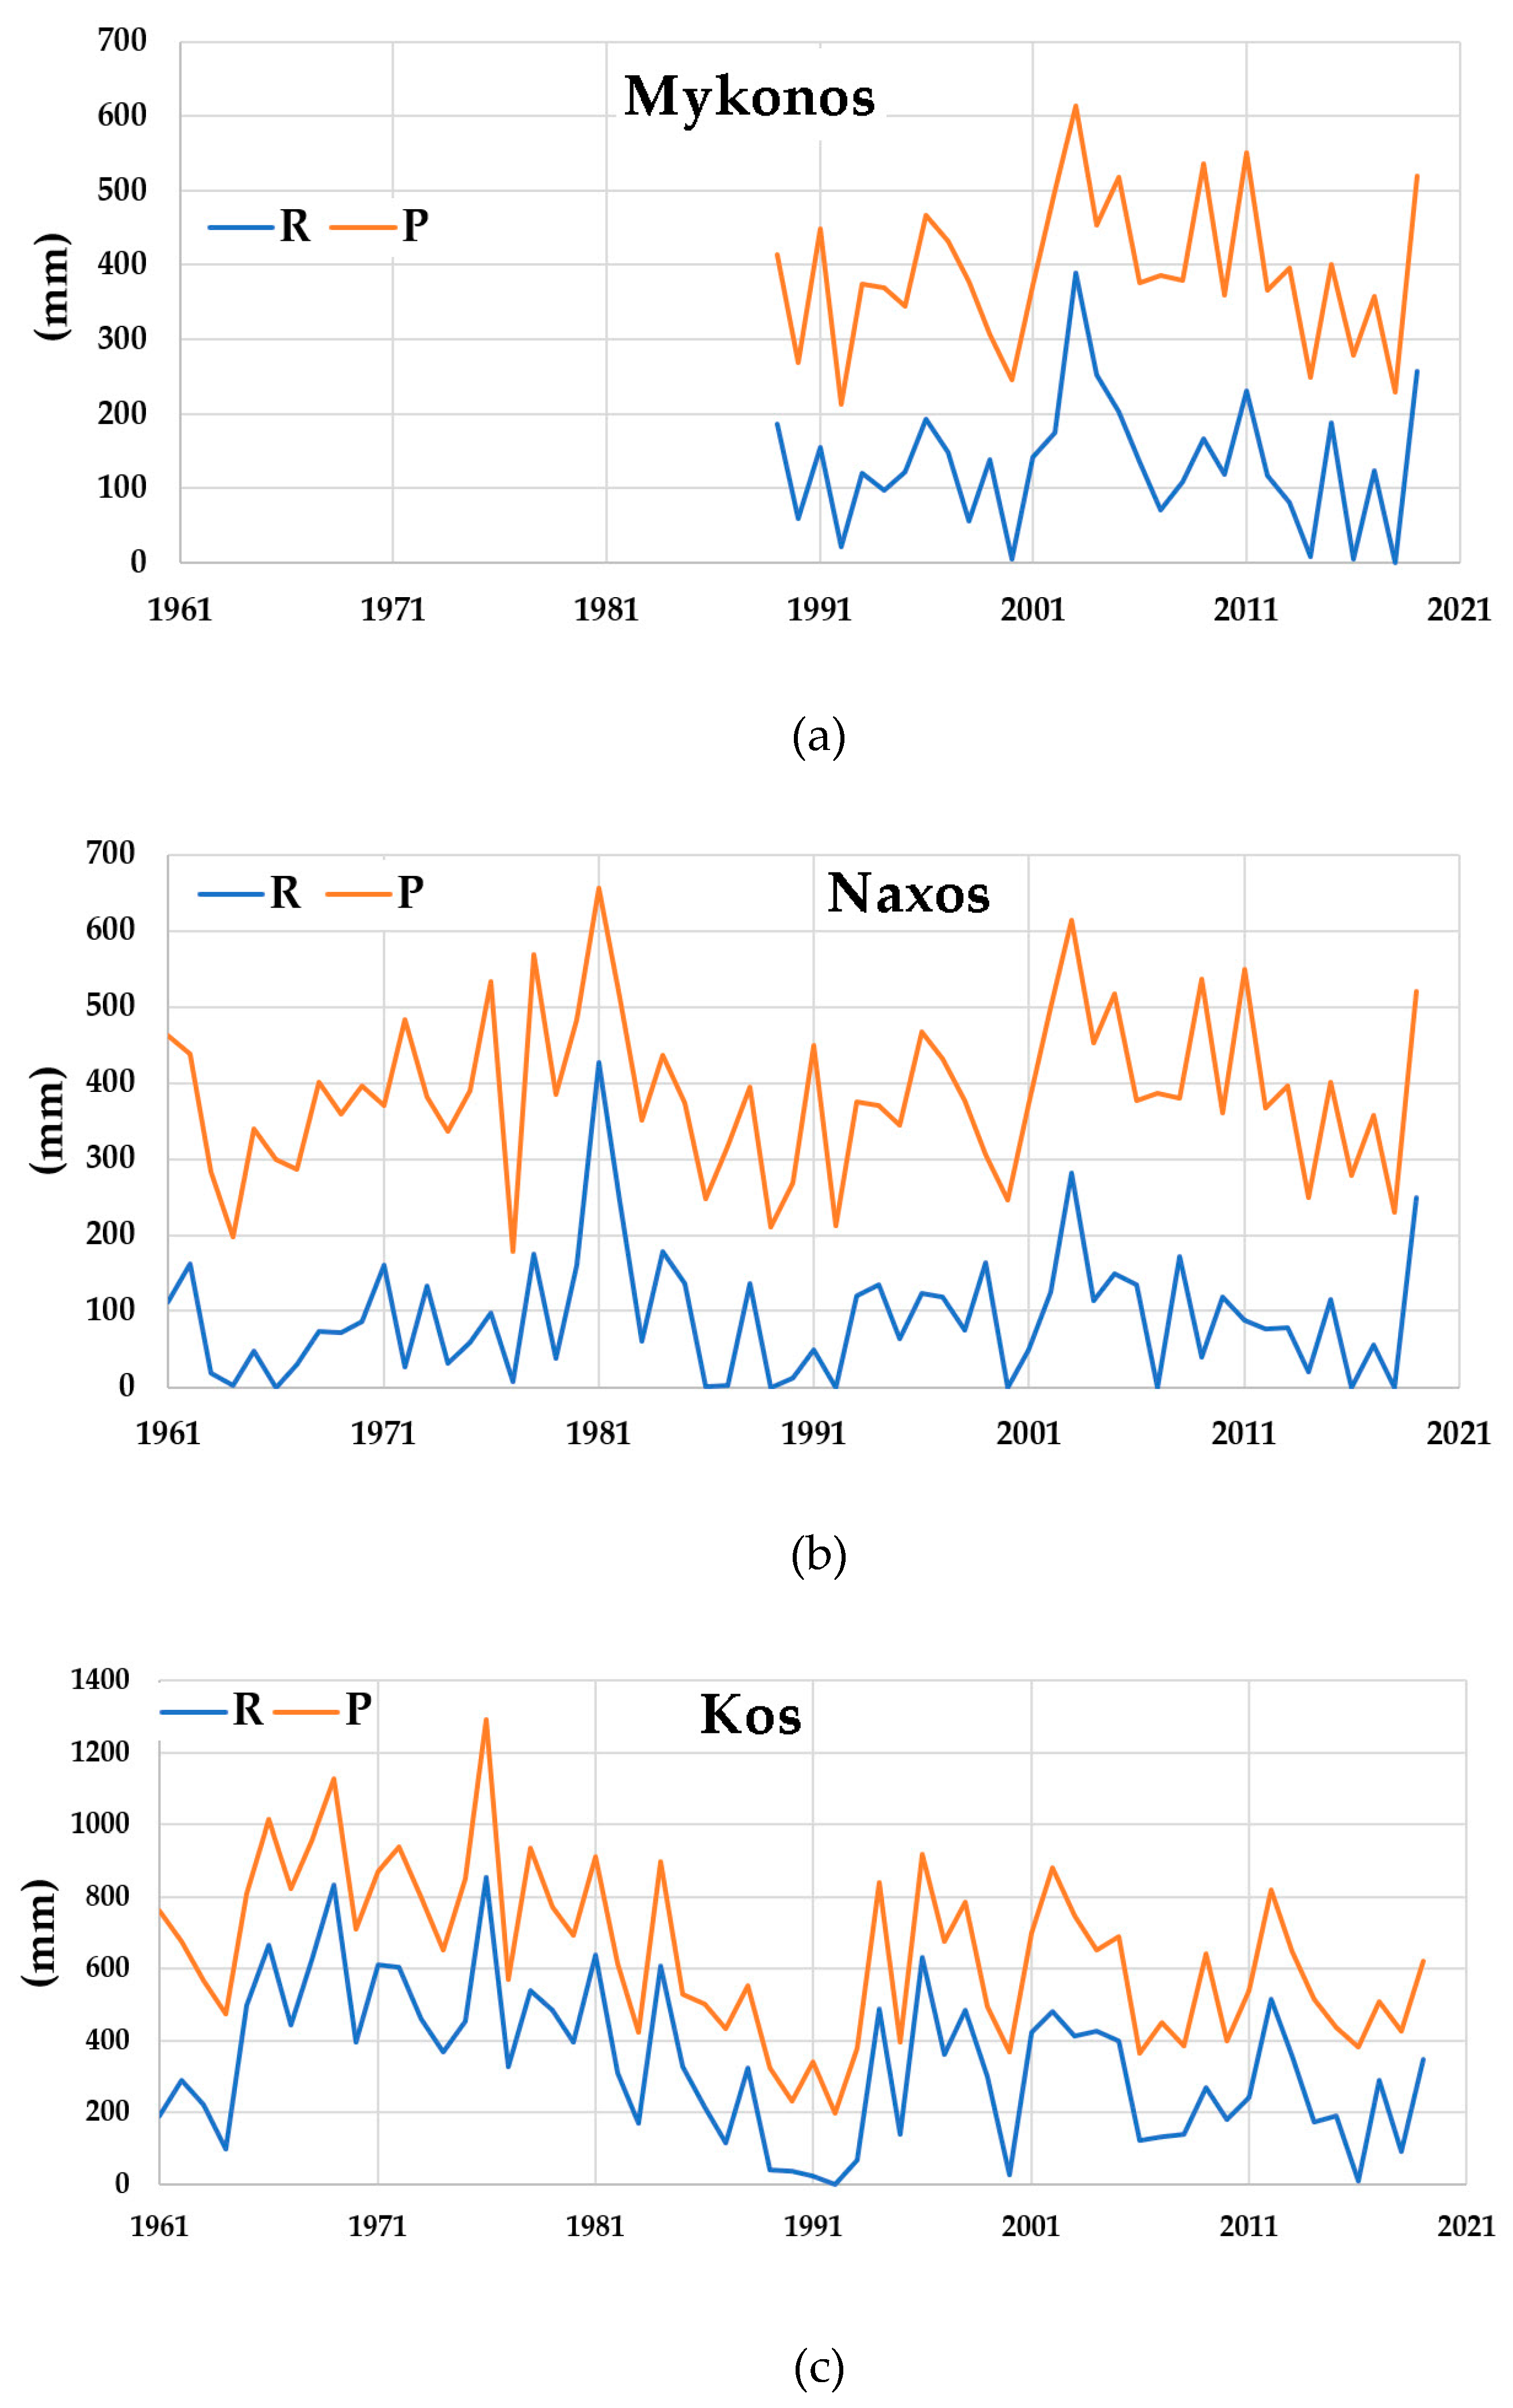
Figure 7 depicts the relation of the yearly runoff and precipitation for the three islands. The highest values of runoff and precipitation in Naxos were observed in the years 1981 and 2003. For Kos, the corresponding maximum runoff and precipitation values were observed in the years 1976 and 1969. Concerning Mykonos for the period 1989–2019, the maximum runoff and precipitation values were observed in the years 2003 and 2011, respectively. The minimum runoff values appeared during periods of severe drought that have been recorded nationally [60,61], but also in the wider area of the eastern Mediterranean [35,62,63,64], such as the severe drought episode during the period of 1989–1992.
3.3. Water Supply Demands
The fulfillment of the water needs comes first on the list of priorities, both because the water needs of the population should be satisfied, and the most basic sector of the islands’ economy (tourism) should be maintained/respected. The following paragraphs present the results of the research and the calculations of the water supply needs of each island.
3.3.1. Water Supply Demands in Mykonos
The island of Mykonos is supplied with water by seawater desalination units, the “Marathi” and “Ano Mera” dams and by approximately 1000 water drillings. Towards the water supply of Mykonos settlement, five seawater desalination units are used at the Korfos Mykonos location, while the Marathi dam contributes to the coverage of water needs, as well as some drillings. Seven tanks with a volume of 14,500 m3 operate in the Mykonos settlement. The existing 45 km long network is made of cement pipes, while in the mainland it is made of PVC, of relatively good quality.
In the Ano Mera settlement, the water supply is covered by one dam, as well as a drilling at the location of St. Sofia, in which the mean water pumping rate is 3.5 m3/hour with annual water yield of 15,000 m3. The existing pipeline network is 6 km long, of relatively good quality.
The total water supply needs per Municipality were calculated as mentioned previously. They are calculated for permanent residents and vacationers. The total amount of the water supply for Mykonos island is 1,521,500 m3. The above calculation was made with network losses of 20%.
3.3.2. Water Supply Demands in Naxos
Ensuring sources of water to cover the water needs of Naxos has always been difficult, though easier than the other islands of the Cyclades island complex (due to the larger size and mountainous mass of the island). Surface water is only available for a few days after heavy winter rains and water needs are met mainly by groundwater. However, underground reserves are limited due to natural causes and have been limited in recent years due to man-made interventions to the island’s fragile ecosystem.
The total water needs for the adequate water supply of permanent residents and the service of tourist facilities are currently estimated at 2,000,000 m3/year.
The island’s needs are covered by underground water reserves, through water drillings (mainly in the lowlands) and springs. The water supply network has a total length of 192.15 km. During the peak of the summer season, water is transported by tank trucks from nearby springs and water drillings. According to the data of MWSSS of Cyclades, 99 water drillings and 36 wells have been authorized. According to the data of Naxos Municipality, 611 applications have been submitted to date for a water use permit. It should be emphasized that there is a very high number of old wells (unlicensed) scattered, mainly in the lowland area (Livadi). In a 1960 study, 1825 wells were recorded (763 motor-driven, 846 animal-driven and 216 simple). Taking into account all the above, it can be concluded that the island has the potential to meet its water needs, while the general perception is that water problems are more related to a bad or absent water management plan, rather than to an available water deficit.
3.3.3. Water Supply Demands in Kos
The tourism sector consumes very high water quantities and as a result there is a conflict of interest with the agricultural sector. Nevertheless, there are hydro-collecting projects with the aim of satisfying both irrigation needs and residential water use. Water drillings can be found in various parts of the island, especially in the low-lying northern parts, where many landowners run private water drillings. Irrigation is also supported by the reservoirs in the area of Platy and in the area of Messaria.
At the “Platy” site, located in the city’s southernmost region, a 342,000 m3 reservoir for irrigation and water supply has been built. It is designed to cover the irrigation of 12.8 ha of arable land. The island’s second reservoir is located in the area of Messaria with a volume of 225,000 m3 and its use is dedicated exclusively to irrigation. The water supply needs of the island are covered mainly by water drillings and natural springs. Kos is being supplied with water from 23 water drillings, in which pumping rates range from 15 to 80 m3/h. These amounts of water fully cover the water needs. On the island, there is no stream of continuous flow. Most of them are ephemeral streams which present low water discharge during the rainy season. Some of the springs are of continuous flow and in some of them, water storage works have been built. For the island of Kos, the annual water supply needs are estimated at 4,500,000 m3.
3.4. Irrigation Water Demand
Irrigation is the main factor that contributes to maintaining and increasing agricultural production and therefore, agricultural income. The studies of the irrigation projects and the related agrotechnical studies prepared for the area of the Aegean islands were drawn up with the criterion of saving water, so the irrigation methods implemented or planned to be implemented, improved or are going to improve the way of managing the existing limited irrigation potential. The same trend has been observed in the development of private irrigation, where the farmers of the Aegean islands tried to increase the cultivated areas based on the available water potential. Irrigation is generally applied to the low-lying parts of the islands where it is possible to supply water, either due to the availability of groundwater there, or for reasons of disposal of the water with the help of gravity. In general, the soil, topographic, agronomic, as well as climatic conditions, combined with the maximum possible utilization of water, led to the application of water distribution systems that transport water to the fields through closed pipelines under pressure.
Recently, in Aegean islands, the drip irrigation system has been applied, which achieved savings in water consumption, and is constantly gaining ground. It is noted that in a significant percentage of the areas that are irrigated, the drip irrigation system is applied for tree crops and vegetables. Finally, the proposed crops in all existing utilization plans can and should (for reasons of savings in natural water resources) be irrigated applying the drip irrigation system.
3.4.1. Demand for Irrigation Water in Mykonos
According to Hellenic Statistical Authority, there are 97.1 ha of irrigated arable crops, 100.9 ha of irrigated vegetables crops, 1.8 ha of irrigated orchards and 1 ha of irrigated vineyards. The total annual irrigation water needs for the island are estimated at 1,401,000 m3.
3.4.2. Demand for Irrigation Water in Naxos
Surface water is only available for a few days after heavy winter rains and water needs are met mainly by groundwater. However, underground reserves are limited due to natural causes and have been limited in recent years due to man-made interventions in the island’s fragile ecosystem.
The total water needs related to irrigation requirements are approximately four times that of water supply requirements (8,000,000 m3/year). The water is used for the irrigation of 200 ha. According to the data of the Directorate of Agricultural Economy of Cyclades, the drilling of 99 drilling holes and 36 wells has been authorized.
According to the Municipality of Naxos and Small Cyclades, 611 applications have been submitted for a water use permits, while 99 water drillings and 36 wells have been authorized. It should be reported that there is a very high number of old wells (unlicensed) scattered mainly in the lowland area (Livadi). In a 1960 study, 1825 wells were recorded (763 motorized, 846 animal-powered and 216 simple).
3.4.3. Demand for Irrigation Water in Kos
The majority of the irrigated crops are irrigated mainly through private water drillings. The unplanned water drilling combined with the short distance from one to the other, the over-pumping and the short distance from the coastal zone have led to aquifer salinization. In other places, like the Kardamena region, sea water has reached the deepest aquifer, which is 20 m below the surface. The situation is more difficult during periods of drought that appear every few years.
Concerning the springs, they exist in several parts of the island and mainly in its central part. Their type depends on the hydrogeological conditions prevailing in each region, and some of them have been flowing continuously. Due to over pumping some springs have acquired a periodicity in their operation. A typical example is the spring located in the area of Asklipieion, which used to have a continuous flow, while in recent years it dries up in the summer months.
In total, there are 2772.5 ha of irrigated land on the island, of which 121.5 ha are arable crops, 1687 ha are vegetables, 713.9 ha are orchards, 153.5 ha are olives and 96.6 ha are irrigated vineyards. The total annual irrigation water needs for the island are estimated at 7,500,000 m3.
3.5. Total Water Demand
Table 6 presents the types of crops on the lands of the research area, while Table 7 shows the total water demand in the research area after the collection and processing of the data for the three islands. According to Table 7, it can be seen that the available water (runoff + infiltration) is more than sufficient to meet the needs of the islands of Naxos and Kos, as it far exceeds the increased needs of the islands. Furthermore, it appears that in Mykonos, where the water resources have been nearly entirely utilized, the available water (runoff plus infiltration), is just enough to meet the water needs. It is evident that all three islands present significant sources of available water, which could meet the growing needs of the residents. However, the lack of the necessary water exploitation projects, mainly for the surface runoff, has led to the intense water supply problems that the islands struggle with. The necessity of the water harvesting projects becomes even more important, under the conditions of significant increases in temperature [9,65,66,67,68,69], where the increase in evapotranspiration constitutes a highly likely scenario, especially in arid and semi-arid regions. Previous studies conducted in the Mediterranean region revealed that under various climate change scenarios, the water balance could be significantly affected. More specifically: (a) increases in minimum and maximum temperatures suggest an increase in actual evapotranspiration and surface runoff, though a decrease in infiltration; (b) even if, the precipitation rises, the increase in temperature reduces infiltration; (c) increasing and decreasing precipitation, subsequently increased and decreased all the hydrological variables, accordingly [37,58,70].
4. Conclusions
The intense seasonal drought that prevails in the research area, characteristic of the uneven distribution of precipitation during the year, coincides with the highest water demand period. In the summer period, in addition to the increased water needs of the permanent population of the islands, there is also significant tourist activity. Additionally, increased irrigation needs are recorded, since most cultivated species have the highest water requirements during this period.
The evapotranspiration is very high in the area, which is sufficiently justified by the climatic conditions of the study area. On an annual basis, losses due to evapotranspiration correspond to 73.90% of precipitation for Mykonos, 75.20% for Naxos and 73.10% for Kos. If the evapotranspiration losses are subtracted from the total amount of precipitation, the remaining water for runoff and infiltration is 26.10% in Mykonos, 24.80% in Naxos and 26.90% in Kos.
In Mykonos, there is a water resource shortage, while the reservation of available water for the water supply and irrigation needs of the island is difficult, especially in the summer months, due to the intense tourist activity. In Naxos and Kos, due to the higher size and the relative mountainous relief of the islands, the water storage potential is higher than Mykonos. Although Naxos presents high amounts of runoff and underground reserves, over-pumping of groundwater is observed, resulting in aquifer salinization in some areas. In general, in the study area there are significant amounts of available water (mainly runoff), which are being left to be lost unexploited, while at the same time great pressure is exerted on the underground reserves.
On a practical level, the above analysis shows that in the Mediterranean islands, where the water scarcity during the summer is very high, there are significant capabilities to exploit the available water from rainfall, which so far is being lost to the sea. It is evident that a combined strategy of water exploitation works, could efficiently store higher water amounts during the wet period and take advantage in a more efficient way of the summer rain storms. These kinds of studies could be considered to be of highly critical impact for stakeholders and decision makers, since the key knowledge corpus, such as the available water amounts, the yearly distribution of the precipitation and the duration of the drought period, constitute crucial variables, important for the implementation of optimal choices concerning the water exploitation practices in a specific area.
It is estimated that due to climate change, the environmental pressures on the water resources of the three islands, and the Mediterranean in general, will intensify, resulting in the depletion of surface resources, the over-pumping of underground water and the expansion of the salinization phenomenon, especially in the coastal areas which are irrigated exclusively with underground water. Therefore, the rational management of water resources and the protection of the environment require the efficient embrace of economic principles, tools and measures. The consideration of an integrated rational management strategy of water resources that would be differentiated according to the needs and available means of each region should include a combination of: (1) effective runoff exploitation; (2) installation of desalination units; (3) saving water in the agriculture sector; (4) saving water in the water supply/consumption area; (5) reduction in water supply/irrigation network losses; (6) registration of illegal drillings/wells; (7) changes in pricing policies and in cases of emergency; (8) transportation of water via water vessels.
Author Contributions
Conceptualization, D.M. and E.S.; methodology, E.S. and A.K.; software, E.S.; validation, E.S.; formal analysis, E.S. and A.K.; investigation, E.S.; data curation, E.S. and A.K.; writing—original draft preparation, E.S. and A.K.; writing—review and editing, E.S. and A.K.; visualization, A.K.; supervision, D.M. All authors have read and agreed to the published version of the manuscript.
Funding
This research received no external funding.
Data Availability Statement
The data that support the findings of this study are available from the corresponding author upon reasonable request.
Conflicts of Interest
The authors declare no conflict of interest.
References
- Tsakiris, G.; Vangelis, H. Towards a Drought Watch System Based on Spatial SPI. Water Resour. Manag. 2004, 18, 1–12. [Google Scholar] [CrossRef]
- Santos Pereira, L.; Cordery, I.; Iacovides, I. Coping with Water Scarcity; Springer: Dordrecht, The Netherlands, 2009; ISBN 978-1-4020-9578-8. [Google Scholar]
- Dalezios, N.R.; Angelakis, A.N.; Eslamian, S.S. Water Scarcity Management: Part 1: Methodological Framework. Int. J. Glob. Environ. Issues 2018, 17, 1–40. [Google Scholar] [CrossRef]
- Dalezios, N.R.; Dercas, N.; Eslamian, S.S. Water Scarcity Management: Part 2: Satellite-Based Composite Drought Analysis. Int. J. Glob. Environ. Issues 2018, 17, 262. [Google Scholar] [CrossRef]
- Kastridis, A.; Stathis, D. The Effect of Small Earth Dams and Reservoirs on Water Management in North Greece (Kerkini Municipality). Silva Balc. 2015, 16, 71–84. [Google Scholar]
- Anagnostopoulou, C. A Contribution to the Drought Analysis in Greece. Ph.D. Thesis, Aristotle University of Thessaloniki, Thessaloniki, Greece, 2003. [Google Scholar]
- Anandharuban, P.; Elango, L. Spatio-Temporal Analysis of Rainfall, Meteorological Drought and Response from a Water Supply Reservoir in the Megacity of Chennai, India. J. Earth Syst. Sci. 2021, 130, 17. [Google Scholar] [CrossRef]
- Caloiero, T.; Veltri, S.; Caloiero, P.; Frustaci, F. Drought Analysis in Europe and in the Mediterranean Basin Using the Standardized Precipitation Index. Water 2018, 10, 1043. [Google Scholar] [CrossRef] [Green Version]
- Kastridis, A.; Kamperidou, V.; Stathis, D. Dendroclimatological Analysis of Fir (A. Borisii-Regis) in Greece in the Frame of Climate Change Investigation. Forests 2022, 13, 879. [Google Scholar] [CrossRef]
- Kaldellis, J.K.; Kondili, E.M. The Water Shortage Problem in the Aegean Archipelago Islands: Cost-Effective Desalination Prospects. Desalination 2007, 216, 123–138. [Google Scholar] [CrossRef]
- Nastos, P.T.; Evelpidou, N.; Vassilopoulos, A. Does Climatic Change in Precipitation Drive Erosion in Naxos Island, Greece? Nat. Hazards Earth Syst. Sci. 2010, 10, 379–382. [Google Scholar] [CrossRef] [Green Version]
- Baltas, E.A. Climatic Conditions and Availability of Water Resources in Greece. Int. J. Water Resour. Dev. 2008, 24, 635–649. [Google Scholar] [CrossRef]
- Baltas, E.; Mimikou, M.; Fragiskou, A. Hydrological Balance and Application of the MedWater Model on Naxos Island. Water Int. 2012, 37, 32–42. [Google Scholar] [CrossRef]
- Gerasidi, A.; Apostolaki, S.; Manoli, E.; Assimacopoulos, D.; Vlachos, E. Towards the Formulation of a New Strategy of Water Resource Management for Urban Areas Achieved through Participatory Processes. Urban Water J. 2009, 6, 209–219. [Google Scholar] [CrossRef]
- Myronidis, D.; Theofanous, N. Changes in Climatic Patterns and Tourism and Their Concomitant Effect on Drinking Water Transfers into the Region of South Aegean, Greece. Stoch. Environ. Res. Risk Assess. 2021, 35, 1725–1739. [Google Scholar] [CrossRef] [PubMed]
- Soulis, K.; Dercas, N. Development of a GIS-Based Spatially Distributed Continuous Hydrological Model and Its First Application. Water Int. 2007, 32, 177–192. [Google Scholar] [CrossRef]
- Secretariat General for the Aegean and Island Policy (SPAIP). Provision of Water Transfer Dataset; Secretariat General for the Aegean and Island Policy: Drapetsona, Greece, 2019. [Google Scholar]
- Deyà Tortella, B.; Tirado, D. Hotel Water Consumption at a Seasonal Mass Tourist Destination. The Case of the Island of Mallorca. J. Environ. Manag. 2011, 92, 2568–2579. [Google Scholar] [CrossRef]
- Iglesias, A.; Garrote, L.; Flores, F.; Moneo, M. Challenges to Manage the Risk of Water Scarcity and Climate Change in the Mediterranean. Water Resour. Manag. 2007, 21, 775–788. [Google Scholar] [CrossRef]
- Myronidis, D. Hydrology and Hydraulics; Tziolas Publications: Thessaloniki, Greece, 2021; ISBN 978-960-418-884-0. (In Greek) [Google Scholar]
- Koutsoyiannis, D.; Xanthopoulos, T. Engineering Hydrology [Undergraduate Textbook]; Kallipos, Open Academic Editions: Athens, Greece, 1999. [Google Scholar]
- Voudouris, K.; Mavrommatis, T.; Antonakos, A. Hydrologic Balance Estimation Using GIS in Korinthia Prefecture, Greece. Adv. Sci. Res. 2007, 1, 1–8. [Google Scholar] [CrossRef]
- Voudouris, K.; Mavromatis, T.; Krinis, P. Assessing Runoff in Future Climate Conditions in Messara Valley in Crete with a Rainfall-Runoff Model. Meteorol. Appl. 2012, 19, 473–483. [Google Scholar] [CrossRef]
- Voudouris, K.S.; Georgiou, P.E.; Mavromatis, T.; Gianneli, C. Comparison of Actual Evapotranspiration Estimation Methods: Application to Korisos Basin, NW Greece. Evapotranspiration Process. Sources Environ. Implic. 2013, 7, 105–118. [Google Scholar]
- Kaleris, V.; Langousis, A. Comparison of Two Rainfall–Runoff Models: Effects of Conceptualization on Water Budget Components. Hydrol. Sci. J. 2017, 62, 729–748. [Google Scholar] [CrossRef]
- Mohajerani, H.; Zema, D.A.; Lucas-Borja, M.E.; Casper, M. Understanding the Water Balance and Its Estimation Methods. In Precipitation; Elsevier: Amsterdam, The Netherlands, 2021; pp. 193–221. [Google Scholar]
- European Environment Agency (EEA). CORINE Land Cover (CLC); EEA: Copenhagen, Denmark, 2018. [Google Scholar]
- Lagouvardos, K.; Kotroni, V.; Bezes, A.; Koletsis, I.; Kopania, T.; Lykoudis, S.; Mazarakis, N.; Papagiannaki, K.; Vougioukas, S. The Automatic Weather Stations NOANN Network of the National Observatory of Athens: Operation and Database. Geosci. Data J. 2017, 4, 4–16. [Google Scholar] [CrossRef]
- Stathi, E. Investigation of the Possibilities of Adaptation to Water Scarcity Conditions in the Islands of the South Aegean. Ph.D. Thesis, Aristotle University of Thessaloniki, Thessaloniki, Greece, 2022. [Google Scholar]
- Thornthwaite, C.W.; Mather, J.R. The Water Balance; Publications in Climatology; Drexel Institute of Technology, Laboratory of Technology: Centerton, NJ, USA, 1955; Volume 8, pp. 1–105. [Google Scholar]
- Thornthwaite, C.W. An Approach toward a Rational Classification of Climate. Geogr. Rev. 1948, 38, 55–94. [Google Scholar] [CrossRef]
- Mather, J.R. Use of the Climatic Water Budget to Estimate Streamflow. In Use of the Climatic Water Budget in Selected Environmental Water Problems; Elmer, N.J., Sites, C.W., Eds.; Thornthwaite Associates, Laboratory of Climatology, Publications in Climatology: Centerton, NJ, USA, 1979; Volume 32, pp. 1–52. [Google Scholar]
- Mather, J.R. The Climatic Water Balance in Environmental Analysis; Heath and Company: Lexington, MA, USA, 1978. [Google Scholar]
- Xu, D.; Zhang, Q.; Ding, Y.; Zhang, D. Spatiotemporal Pattern Mining of Drought in the Last 40 Years in China Based on the SPEI and Space–Time Cube. J. Appl. Meteorol. Climatol. 2021, 60, 1219–1230. [Google Scholar] [CrossRef]
- Myronidis, D.; Ioannou, K.; Fotakis, D.; Dörflinger, G. Streamflow and Hydrological Drought Trend Analysis and Forecasting in Cyprus. Water Resour. Manag. 2018, 32, 1759–1776. [Google Scholar] [CrossRef]
- Penman, H.L. Natural Evaporation from Open Water, Bare Soil and Grass. Proc. R. Soc. Lond. A Math. Phys. Sci. 1948, 193, 120–145. [Google Scholar] [PubMed] [Green Version]
- Kafle, H.K.; Bruins, H.J. Climatic Trends in Israel 1970–2002: Warmer and Increasing Aridity Inland. Clim. Change 2009, 96, 63–77. [Google Scholar] [CrossRef]
- Barrow, C.J. World Atlas of Desertification (United Nations Environment Programme); Middleton, N., Thomas, D.S.G., Eds.; Edward Arnold: London, UK, 1992; Volume 3. [Google Scholar]
- FAO. Forest Resources Assessment 1990. Tropical Countries; FAO: Rome, Italy, 1993; Volume 59. [Google Scholar]
- Nastos, P.T.; Politi, N.; Kapsomenakis, J. Spatial and Temporal Variability of the Aridity Index in Greece. Atmos. Res. 2013, 119, 140–152. [Google Scholar] [CrossRef]
- Cheval, S.; Dumitrescu, A.; Birsan, M.-V. Variability of the Aridity in the South-Eastern Europe over 1961–2050. Catena 2017, 151, 74–86. [Google Scholar] [CrossRef]
- Şarlak, N.; Mahmood Agha, O.M.A. Spatial and Temporal Variations of Aridity Indices in Iraq. Theor. Appl. Climatol. 2018, 133, 89–99. [Google Scholar] [CrossRef]
- Kerkides, P.; Michalopoulou, H.; Papaioannou, G.; Pollatou, R. Water Balance Estimates over Greece. Agric Water Manag. 1996, 32, 85–104. [Google Scholar] [CrossRef]
- Turc, L. Nouvelle Formule Pour Le Calcul Du Bilan de l’eau En Fonction Des Valeurs Annuelles Moyennes Des Précipitations et de La Température. C. R. Acad. Sci. 1951, 233, 633–635. [Google Scholar]
- Soulios, G.; Toubektsi, M.; Tzevelekis, G.; Ezeigbo, H. Water Balance of Basins in Central Greece: Comparison with Other Circum-Mediterranean Basins and Validity of Empirical Methods. Environ. Geol. Water Sci. 1991, 18, 85–94. [Google Scholar] [CrossRef]
- Mimikou, M.A.; Baltas, E.A.; Tsihrintzis, V.A. Hydrology and Water Resource Systems Analysis; CRC Press: Boca Raton, FL, USA, 2016; ISBN 9781466581326. [Google Scholar]
- Burak, S.; Bilge, A.H.; Ülker, D. Thornthwaite’s Method for the Computation of the Water Balance; Springer International Publishing: Cham, Switzerland, 2022; pp. 339–347. [Google Scholar]
- Soil Conservation Service (SCS). National Engineering Handbook; Section 4; U.S. Department of Agriculture: Washington, DC, USA, 1972. [Google Scholar]
- United States Department of Agriculture (USDA). Urban Hydrology for Small Watersheds, Technical Release 55 (TR-55). In Natural Resources, Conservation Service, Conservation Engineering Division; USDA: Washington, DC, USA, 1986. [Google Scholar]
- Arhonditsis, G.; Giourga, C.; Loumou, A.; Koulouri, M. Quantitative Assessment of Agricultural Runoff and Soil Erosion Using Mathematical Modeling: Applications in the Mediterranean Region. Environ. Manag. 2002, 30, 434–453. [Google Scholar] [CrossRef] [PubMed]
- Romero, P.; Castro, G.; Gómez, J.A.; Fereres, E. Curve Number Values for Olive Orchards under Different Soil Management. Soil Sci. Soc. Am. J. 2007, 71, 1758–1769. [Google Scholar] [CrossRef]
- Kastridis, A.; Stathis, D. Evaluation of Hydrological and Hydraulic Models Applied in Typical Mediterranean Ungauged Watersheds Using Post-Flash-Flood Measurements. Hydrology 2020, 7, 12. [Google Scholar] [CrossRef] [Green Version]
- Kastridis, A.; Kirkenidis, C.; Sapountzis, M. An Integrated Approach of Flash Flood Analysis in Ungauged Mediterranean Watersheds Using Post-Flood Surveys and Unmanned Aerial Vehicles. Hydrol. Process 2020, 34, 4920–4939. [Google Scholar] [CrossRef]
- Institute of SETE-INSETE Actions to Forecast and Monitor Changes in the Tourism Sector to Strengthen Its Competitiveness and Structural Adaptation Operational Program “Competitiveness, Entrepreneurship and Innovation 2014–2020” Cofinanced by the European Social Fund (ESF) with Code MIS 5003333; Athens, Greece. 2019. Available online: https://insete.gr/statistical-data-of-incoming-tourism-in-greece/?lang=en (accessed on 1 February 2022).
- Blaney, H.F.; Criddle, W.D. Determining Water Requirements in Irrigated Area from Climatological Irrigation Data; United States Department of Agriculture, Soil Conservation Service: Washington, DC, USA, 1952; Volume 48. [Google Scholar]
- Zotou, I.; Tsihrintzis, V.A. The Water Footprint of Crops in the Area of Mesogeia, Attiki, Greece. Environ. Process. 2017, 4, 63–79. [Google Scholar] [CrossRef]
- Gudulas, K.; Voudouris, K.; Soulios, G.; Dimopoulos, G. Comparison of Different Methods to Estimate Actual Evapotranspiration and Hydrologic Balance. Desalination Water Treat. 2013, 51, 2945–2954. [Google Scholar] [CrossRef]
- Venetsanou, P.; Anagnostopoulou, C.; Loukas, A.; Voudouris, K. Hydrological Impacts of Climate Change on a Data-Scarce Greek Catchment. Theor. Appl. Climatol. 2020, 140, 1017–1030. [Google Scholar] [CrossRef]
- Rodríguez-Rodríguez, M.; Green, A.J.; López, R.; Martos-Rosillo, S. Changes in Water Level, Land Use, and Hydrological Budget in a Semi-Permanent Playa Lake, Southwest Spain. Environ. Monit. Assess 2012, 184, 797–810. [Google Scholar] [CrossRef]
- Myronidis, D.; Fotakis, D.; Ioannou, K.; Sgouropoulou, K. Comparison of Ten Notable Meteorological Drought Indices on Tracking the Effect of Drought on Streamflow. Hydrol. Sci. J. 2018, 63, 2005–2019. [Google Scholar] [CrossRef]
- Tsiros, I.X.; Nastos, P.; Proutsos, N.D.; Tsaousidis, A. Variability of the Aridity Index and Related Drought Parameters in Greece Using Climatological Data over the Last Century (1900–1997). Atmos. Res. 2020, 240, 104914. [Google Scholar] [CrossRef]
- Topuz, M.; Feidas, H.; Karabulut, M. Trend Analysis of Precipitation Data in Turkey and Relations to Atmospheric Circulation: (1955–2013). Ital. J. Agrometeorol. 2020, 2, 91–107. [Google Scholar]
- Kadiolu, M. Regional Variability of Seasonal Precipitation over Turkey. Int. J. Climatol. 2000, 20, 1743–1760. [Google Scholar] [CrossRef]
- Ben Abdelmalek, M.; Nouiri, I. Study of Trends and Mapping of Drought Events in Tunisia and Their Impacts on Agricultural Production. Sci. Total Environ. 2020, 734, 139311. [Google Scholar] [CrossRef] [PubMed]
- Stathi, E.; Kastridis, A.; Myronidis, D. Analysis of Hydrometeorological Trends and Drought Severity in Water-Demanding Mediterranean Islands under Climate Change Conditions. Climate 2023, 11, 106. [Google Scholar] [CrossRef]
- Mersin, D.; Tayfur, G.; Vaheddoost, B.; Safari, M.J.S. Historical Trends Associated with Annual Temperature and Precipitation in Aegean Turkey, Where Are We Heading? Sustainability 2022, 14, 13380. [Google Scholar] [CrossRef]
- Feidas, H. Trend Analysis of Air Temperature Time Series in Greece and Their Relationship with Circulation Using Surface and Satellite Data: Recent Trends and an Update to 2013. Theor. Appl. Climatol. 2017, 129, 1383–1406. [Google Scholar] [CrossRef]
- Mamara, A.; Argiriou, A.A.; Anadranistakis, M. Recent Trend Analysis of Mean Air Temperature in Greece Based on Homogenized Data. Theor. Appl. Climatol. 2016, 126, 543–573. [Google Scholar] [CrossRef]
- Todaro, V.; D’Oria, M.; Secci, D.; Zanini, A.; Tanda, M.G. Climate Change over the Mediterranean Region: Local Temperature and Precipitation Variations at Five Pilot Sites. Water 2022, 14, 2499. [Google Scholar] [CrossRef]
- Mavromatis, T.; Stathis, D. Response of the Water Balance in Greece to Temperature and Precipitation Trends. Theor. Appl. Climatol. 2011, 104, 13–24. [Google Scholar] [CrossRef]
Figure 1.
The locations of the three studied islands (Mykonos, Naxos and Kos) in the south Aegean.

Figure 2.
Mean monthly precipitation values in the research area during the hydrological year (period 1989–2019).
Figure 2.
Mean monthly precipitation values in the research area during the hydrological year (period 1989–2019).

Figure 3.
Categorization of CN value and the related calculated factors in Mykonos.

Figure 4.
Categorization of CN value and the related calculated factors in Naxos.

Figure 5.
Categorization of CN value and the related calculated factors in Kos.

Figure 6.
Water balance parameters in the three islands throughout the hydrological year (P: precipitation, Etr: evapotranspiration, Q: surface runoff). (a): Mykonos, (b): Naxos, (c): Kos.
Figure 6.
Water balance parameters in the three islands throughout the hydrological year (P: precipitation, Etr: evapotranspiration, Q: surface runoff). (a): Mykonos, (b): Naxos, (c): Kos.


Figure 7.
The annual fluctuation of precipitation and surface runoff in the three islands (P: precipitation, R: surface runoff). (a): Mykonos, (b): Naxos, (c): Kos.
Figure 7.
The annual fluctuation of precipitation and surface runoff in the three islands (P: precipitation, R: surface runoff). (a): Mykonos, (b): Naxos, (c): Kos.


Table 1.
Meteorological Stations in the research area.
| Meteorological Station | Coordinates | Service | Altitude (m a.s.l.) | Record Period | |
|---|---|---|---|---|---|
| E | N | ||||
| Mykonos | 25.3458° | 37.4359° | HNMS | 122 | 1989–2019 |
| Naxos | 25.3728° | 37.1013° | HNMS | 11 | 1955–2019 |
| Kos (airport) | 27.0913° | 36.8012° | HNMS | 126 | 1961–2019 |
| Mykonos | 25.3260° | 37.4450° | NOA | 10 | 2012–2019 |
| Naxos | 25.3738° | 37.1014° | NOA | 19 | 2011–2019 |
| Kos | 27.3404° | 36.8772° | NOA | 37 | 2014–2019 |
| Apiranthos | 25.5200° | 37.0712° | NOA | 600 | 2012–2019 |
| Apollo | 25.5549° | 37.1811° | NOA | 35 | 2012–2019 |
| Damarionas | 25.4780° | 37.0510° | NOA | 310 | 2012–2019 |
| Crown | 25.5355° | 37.1187° | NOA | 540 | 2012–2019 |
| Cynidarus | 25.4770° | 37.0990° | NOA | 410 | 2012–2019 |
| Melanes | 25.4379° | 37.0901° | NOA | 160 | 2012–2019 |
| Little Vigla | 25.3730° | 37.0240° | NOA | 12 | 2012–2019 |
Table 2.
Mean monthly and annual precipitation values (mm) for the reference period 1989–2019.
| Wet Season | Dry Season | Wet Season | |||||||||||
|---|---|---|---|---|---|---|---|---|---|---|---|---|---|
| Island | Jan | Feb | Mar | Apr | May | Jun | Jul | Aug | Sep | Oct | Nov | Dec | Year |
| Mykonos | 102.43 | 57.70 | 75.14 | 14.72 | 16.97 | 2.10 | 0.16 | 0.05 | 11.34 | 23.32 | 51.68 | 57.81 | 413.42 |
| Naxos | 124.85 | 77.99 | 91.76 | 20.13 | 20.25 | 2.11 | 0.16 | 0.44 | 12.31 | 29.51 | 59.03 | 71.34 | 509.85 |
| Kos | 100.62 | 86.83 | 60.94 | 31.18 | 15.09 | 1.40 | 0.30 | 0.50 | 9.50 | 36.28 | 83.47 | 114.75 | 540.86 |
Table 3.
Parameters of the water balance in (mm) and volume (m3) in the catchments of the research area.
Table 3.
Parameters of the water balance in (mm) and volume (m3) in the catchments of the research area.
| Island | Catchment | Area (km2) | Rainfall | Evapotranspiration | Runoff | Infiltration | ||||
|---|---|---|---|---|---|---|---|---|---|---|
| Mykonos | (mm) | 106 m3 | (mm) | 106 m3 | (mm) | 106 m3 | (mm) | 106 m3 | ||
| 1 | Korfou | 2.09 | 408.0 | 0.85 | 301.5 | 0.63 | 73.2 | 0.15 | 33.3 | 0.07 |
| 2 | Panormou | 10.41 | 417.5 | 4.35 | 308.6 | 3.21 | 74.8 | 0.79 | 34.2 | 0.34 |
| 3 | Ftelias | 4.39 | 407.2 | 1.79 | 300.9 | 1.32 | 73.1 | 0.32 | 33.2 | 0.15 |
| 4 | Chalara | 4.30 | 425.3 | 1.83 | 314.3 | 1.35 | 75.1 | 0.34 | 35.9 | 0.14 |
| 5 | Wide Gialos | 3.25 | 415.8 | 1.35 | 307.3 | 1.00 | 74.6 | 0.24 | 33.9 | 0.11 |
| 6 | Mersinis | 2.39 | 423.0 | 1.01 | 312.6 | 0.75 | 75.2 | 0.18 | 35.2 | 0.08 |
| 7 | Mau Lagada | 8.92 | 407.3 | 3.63 | 301.0 | 2.68 | 73.1 | 0.63 | 33.2 | 0.32 |
| 8 | Merthias | 3.15 | 403.3 | 1.27 | 298.0 | 0.94 | 72.4 | 0.23 | 32.9 | 0.10 |
| TOTAL | 38.90 | 16.08 | 11.88 | 2.88 | 1.31 | |||||
| Naxos | ||||||||||
| 1 | Apollona | 2.40 | 531.62 | 1.20 | 398.72 | 0.96 | 43.06 | 0.10 | 89.84 | 0.14 |
| 2 | Potamos | 12.35 | 583.87 | 7.20 | 437.91 | 5.20 | 47.29 | 0.58 | 98.67 | 1.42 |
| 3 | Jumaya stream | 10.86 | 584.46 | 6.30 | 438.35 | 4.76 | 47.34 | 0.51 | 98.77 | 1.03 |
| 4 | Panag. Argokoiliotissas | 2.79 | 562.73 | 1.40 | 422.04 | 1.18 | 45.58 | 0.13 | 95.10 | 0.10 |
| 5 | Gaidouromantron | 2.70 | 537.48 | 1.45 | 403.11 | 1.09 | 43.54 | 0.12 | 90.83 | 0.25 |
| 6 | Pnichtis stream | 13.72 | 601.81 | 8.10 | 451.35 | 5.90 | 48.75 | 0.67 | 101.71 | 1.58 |
| 7 | Azala | 9.06 | 559.82 | 5.07 | 419.86 | 3.80 | 45.35 | 0.41 | 94.61 | 0.86 |
| 8 | Pitholakkou | 5.87 | 478.29 | 2.81 | 358.72 | 2.11 | 38.74 | 0.23 | 80.83 | 0.47 |
| 9 | Cyrcle Tap | 10.78 | 572.92 | 6.16 | 429.69 | 4.63 | 46.41 | 0.50 | 96.82 | 1.03 |
| 10 | Akridonis stream | 5.37 | 583.01 | 3.13 | 437.26 | 2.35 | 47.22 | 0.25 | 98.53 | 0.53 |
| 11 | St.Ioannis | 2.25 | 481.72 | 1.00 | 361.29 | 0.81 | 39.02 | 0.09 | 81.41 | 0.10 |
| 12 | Dark stream | 11.64 | 595.06 | 6.90 | 446.29 | 5.19 | 48.20 | 0.50 | 100.56 | 1.21 |
| 13 | Anakion stream | 8.21 | 564.54 | 4.60 | 423.41 | 3.48 | 45.73 | 0.38 | 95.41 | 0.75 |
| 14 | Klidos NA | 4.58 | 483.83 | 2.22 | 362.87 | 1.66 | 39.19 | 0.18 | 81.77 | 0.37 |
| 15 | Klidos ΒA | 2.63 | 474.54 | 1.25 | 355.90 | 0.94 | 38.44 | 0.10 | 80.20 | 0.21 |
| 16 | Krinon stream | 2.22 | 476.47 | 1.06 | 357.35 | 0.79 | 38.59 | 0.09 | 80.52 | 0.18 |
| 17 | Andrious | 2.70 | 472.48 | 1.20 | 354.36 | 0.96 | 38.27 | 0.10 | 79.85 | 0.14 |
| 18 | Fisa stream | 24.27 | 512.05 | 11.50 | 384.03 | 9.32 | 41.48 | 1.01 | 86.54 | 1.17 |
| 19 | Panagias | 2.17 | 470.61 | 1.00 | 352.96 | 0.77 | 38.12 | 0.08 | 79.53 | 0.15 |
| 20 | Gialous | 3.07 | 481.54 | 1.40 | 361.16 | 1.11 | 39.01 | 0.12 | 81.38 | 0.17 |
| 21 | Agiasou | 11.24 | 459.63 | 5.10 | 344.72 | 3.55 | 37.23 | 0.42 | 77.68 | 1.13 |
| 22 | Alikou | 39.68 | 484.55 | 19.20 | 363.42 | 14.10 | 39.25 | 1.56 | 81.89 | 3.55 |
| 23 | Glifadas | 2.64 | 407.66 | 1.08 | 305.74 | 0.81 | 33.02 | 0.09 | 68.89 | 0.18 |
| 24 | Polishnis | 4.41 | 429.67 | 1.89 | 322.25 | 1.42 | 34.80 | 0.15 | 72.61 | 0.32 |
| 25 | Plakas | 9.31 | 440.64 | 4.10 | 330.48 | 3.08 | 35.69 | 0.33 | 74.47 | 0.69 |
| 26 | Paratrexos | 58.92 | 478.53 | 28.10 | 358.90 | 21.10 | 38.76 | 2.28 | 80.87 | 4.72 |
| 27 | Karvounolakkos | 3.81 | 396.12 | 1.50 | 297.09 | 1.13 | 32.09 | 0.12 | 66.94 | 0.25 |
| 28 | Galinins | 2.33 | 438.64 | 1.00 | 328.98 | 0.77 | 35.53 | 0.08 | 74.13 | 0.15 |
| 29 | Eggaron | 35.76 | 546.38 | 19.40 | 409.78 | 14.43 | 44.26 | 1.50 | 92.34 | 3.47 |
| 30 | Perganti stream | 5.26 | 473.63 | 2.40 | 355.22 | 1.87 | 38.36 | 0.20 | 80.04 | 0.33 |
| 31 | Faneromenis | 9.50 | 594.29 | 5.50 | 445.72 | 4.23 | 48.14 | 0.46 | 100.44 | 0.81 |
| 32 | Kabou | 2.77 | 484.23 | 1.30 | 363.17 | 1.01 | 39.22 | 0.11 | 81.84 | 0.19 |
| 33 | Milou Perasma | 6.00 | 574.84 | 3.40 | 431.13 | 2.50 | 46.56 | 0.28 | 97.15 | 0.63 |
| 34 | St.Theodor | 3.12 | 533.01 | 1.60 | 399.75 | 1.25 | 43.17 | 0.13 | 90.08 | 0.22 |
| 35 | Meliga | 2.03 | 494.21 | 1.00 | 370.65 | 0.75 | 40.03 | 0.08 | 83.52 | 0.17 |
| TOTAL | 336.42 | 171.52 | 128.99 | 13.89 | 28.64 | |||||
| Kos | ||||||||||
| 1 | Kalamos stream | 5.19 | 548.2 | 2.8 | 405.09 | 2.1 | 108.5 | 0.56 | 34.59 | 0.18 |
| 2 | Kata | 2.58 | 520.4 | 1.3 | 384.57 | 1.0 | 103.0 | 0.27 | 32.84 | 0.08 |
| 3 | Evaggelistrias | 2.70 | 522.6 | 1.4 | 386.22 | 1.0 | 103.4 | 0.28 | 32.98 | 0.09 |
| 4 | Max.stream | 4.69 | 519.6 | 2.4 | 383.99 | 1.8 | 102.8 | 0.48 | 32.79 | 0.15 |
| 5 | Chochylariou | 2.05 | 513.2 | 1.1 | 379.25 | 0.8 | 101.6 | 0.21 | 32.38 | 0.07 |
| 6 | Kamariou | 2.44 | 553.3 | 1.4 | 408.88 | 1.0 | 109.5 | 0.27 | 34.91 | 0.09 |
| 7 | Kairoulia stream | 2.86 | 511.1 | 1.5 | 377.72 | 1.1 | 101.2 | 0.29 | 32.25 | 0.09 |
| 8 | River | 13.08 | 517.6 | 6.8 | 382.50 | 4.8 | 102.4 | 1.34 | 32.66 | 0.63 |
| 9 | Mournias | 6.80 | 514.7 | 3.5 | 380.39 | 2.61 | 101.9 | 0.69 | 32.48 | 0.20 |
| 10 | Deep river | 3.26 | 507.8 | 1.7 | 375.27 | 1.2 | 100.5 | 0.33 | 32.04 | 0.10 |
| 11 | Mastihariou | 4.20 | 516.2 | 2.2 | 381.47 | 1.6 | 102.2 | 0.43 | 32.57 | 0.14 |
| 12 | Kalemi | 3.40 | 510.7 | 1.7 | 377.44 | 1.3 | 101.1 | 0.34 | 32.23 | 0.11 |
| 13 | Roditi stream | 4.90 | 507.5 | 2.5 | 375.01 | 1.8 | 100.4 | 0.49 | 32.02 | 0.16 |
| 14 | Stenakas stream | 18.84 | 565.2 | 10.6 | 417.68 | 7.6 | 111.9 | 2.11 | 35.66 | 0.94 |
| 15 | Pithou | 3.55 | 496.0 | 1.8 | 366.58 | 1.3 | 98.2 | 0.35 | 31.30 | 0.11 |
| 16 | Linopotis | 2.10 | 524.4 | 1.1 | 387.55 | 0.8 | 103.8 | 0.22 | 33.09 | 0.07 |
| 17 | Panagia | 3.62 | 608.0 | 2.2 | 449.29 | 1.6 | 120.3 | 0.44 | 38.36 | 0.14 |
| 18 | Bathilaka r. | 2.66 | 513.9 | 1.4 | 379.80 | 1.0 | 101.7 | 0.27 | 32.43 | 0.09 |
| 19 | St.Paulou r. | 6.98 | 588.6 | 4.1 | 435.01 | 3.00 | 116.5 | 0.81 | 37.14 | 0.30 |
| 20 | Mesarias | 5.02 | 644.8 | 3.2 | 476.47 | 2.4 | 127.6 | 0.64 | 40.68 | 0.20 |
| 21 | Two churches | 3.20 | 522.7 | 1.7 | 386.30 | 1.2 | 103.4 | 0.33 | 32.98 | 0.11 |
| 22 | Miloi stream | 4.98 | 619.6 | 3.1 | 457.86 | 2.3 | 122.6 | 0.62 | 39.10 | 0.19 |
| 23 | Livadia | 9.35 | 510.9 | 4.8 | 377.53 | 3.5 | 101.1 | 0.95 | 32.24 | 0.30 |
| 24 | Tsikalarias r. | 2.25 | 561.1 | 1.3 | 414.66 | 0.9 | 111.0 | 0.25 | 35.41 | 0.08 |
| 25 | Wide stream | 6.78 | 566.9 | 3.8 | 418.92 | 2.80 | 112.2 | 0.76 | 35.77 | 0.28 |
| 26 | Paradise | 2.15 | 553.1 | 1.2 | 408.74 | 0.9 | 109.5 | 0.24 | 34.90 | 0.08 |
| 27 | Chavarou stream | 2.24 | 644.7 | 1.4 | 476.44 | 1.1 | 127.6 | 0.29 | 40.68 | 0.09 |
| 28 | One stream | 4.57 | 537.9 | 2.5 | 397.54 | 1.8 | 106.5 | 0.49 | 33.94 | 0.16 |
| 29 | Lia | 8.32 | 521.2 | 4.3 | 385.15 | 3.2 | 103.1 | 0.86 | 32.89 | 0.27 |
| 30 | Kardamenas | 5.73 | 520.3 | 3.0 | 384.47 | 2.2 | 103.0 | 0.59 | 32.83 | 0.19 |
| 31 | Aragi stream | 3.81 | 516.8 | 2.0 | 381.93 | 1.5 | 102.3 | 0.39 | 32.61 | 0.12 |
| 32 | St. Marinas r. | 9.75 | 519.7 | 5.1 | 384.07 | 3.6 | 102.9 | 1.00 | 32.79 | 0.46 |
| TOTAL | 164.05 | 88.73 | 64.90 | 17.57 | 7.11 | |||||
Table 4.
Mean monthly and annual values of water balance parameters (mm).
| Jan | Feb | Mar | Apr | May | Jun | Jul | Aug | Sep | Oct | Nov | Dec | Year | |
|---|---|---|---|---|---|---|---|---|---|---|---|---|---|
| Mykonos | |||||||||||||
| P | 102.43 | 57.70 | 75.14 | 14.72 | 16.97 | 2.10 | 0.16 | 0.05 | 11.34 | 23.32 | 51.68 | 57.81 | 413.42 |
| Etr | 23.15 | 28.07 | 38.76 | 47.32 | 43.18 | 15.17 | 3.50 | 0.80 | 11.51 | 23.37 | 43.54 | 27.18 | 305.54 |
| Q + Ι | 45.10 | 28.74 | 34.04 | 0.00 | 0.00 | 0.00 | 0.00 | 0.00 | 0.00 | 0.00 | 0.00 | 0.00 | 107.88 |
| Naxos | |||||||||||||
| P | 124.85 | 77.99 | 91.76 | 20.13 | 20.25 | 2.11 | 0.16 | 0.44 | 12.31 | 29.51 | 59.03 | 71.34 | 509.85 |
| Etr | 20.00 | 25.24 | 35.08 | 52.70 | 63.49 | 42.37 | 22.64 | 10.72 | 16.02 | 30.63 | 40.85 | 23.68 | 383.42 |
| Q + Ι | 31.92 | 40.33 | 53.36 | 0.00 | 0.00 | 0.00 | 0.00 | 0.00 | 0.00 | 0.00 | 0.00 | 0.82 | 126.43 |
| Kos | |||||||||||||
| P | 100.62 | 86.83 | 60.94 | 31.18 | 15.09 | 1.40 | 0.30 | 0.50 | 9.50 | 36.28 | 83.47 | 114.75 | 540.86 |
| Etr | 21.40 | 21.65 | 34.69 | 52.53 | 66.84 | 47.81 | 23.24 | 9.27 | 12.35 | 37.00 | 42.05 | 26.75 | 395.60 |
| Q + Ι | 49.00 | 64.84 | 26.11 | 0.00 | 0.00 | 0.00 | 0.00 | 0.00 | 0.00 | 0.00 | 0.00 | 5.31 | 145.26 |
Table 5.
Water balance of the research area catchments.
| Water Amount (106 m3) | Rainfall (mm) | Percentage (%) | ||
|---|---|---|---|---|
| Mykonos | ||||
| Precipitation | P | 16.08 | 413.42 | 100 |
| Evapotranspiration | ETr | 11.89 | 305.54 | 73.90 |
| Surface runoff | R | 2.88 | 74.20 | 17.95 |
| Infiltration | I | 1.31 | 33.68 | 8.15 |
| Naxos | ||||
| Precipitation | P | 171.52 | 509.85 | 100 |
| Evapotranspiration | ETr | 128.99 | 383.42 | 75.20 |
| Surface runoff | R | 13.89 | 41.29 | 8.10 |
| Infiltration | I | 28.64 | 85.14 | 16.70 |
| Kos | ||||
| Precipitation | P | 88.73 | 540.86 | 100 |
| Evapotranspiration | ETr | 64.90 | 393.60 | 73.10 |
| Surface runoff | R | 15.57 | 107.09 | 19.79 |
| Infiltration | I | 6.26 | 38.17 | 7.11 |
Table 6.
Types of cultivated land in the research area.
| Island | Arable (ha) | Vegetables (ha) | Orchards (ha) | Olives (ha) | Vineyards (ha) | Total (ha) | Fallow (ha) |
|---|---|---|---|---|---|---|---|
| Mykonos | 97.1 | 100.9 | 1.8 | 2 | 1 | 2008 | 0 |
| Naxos | 6569.6 | 304.8 | 0.35 | 1037.2 | 5646 | 9913.7 | 1437.5 |
| Kos | 4230.1 | 360.6 | 108.0 | 2585.4 | 36.0 | 10920.3 | 3600.2 |
Table 7.
Total water demand needs in the research area.
| Island | Water Supply (m3) | Irrigation (m3) | Livestock (m3) | Industry (m3) | Total (106 m3) | Available Water R + I (106 m3) |
|---|---|---|---|---|---|---|
| Mykonos | 1,521,500 | 1,401,000 | 39,000 | 123,000 | 3.0845 | 4.19 |
| Naxos | 2,000,000 | 8,000,000 | 525,000 | 150,000 | 10.675 | 42.53 |
| Kos | 4,500,000 | 9,500,000 | 520,000 | 220,000 | 14.74 | 21.83 |
Disclaimer/Publisher’s Note: The statements, opinions and data contained in all publications are solely those of the individual author(s) and contributor(s) and not of MDPI and/or the editor(s). MDPI and/or the editor(s) disclaim responsibility for any injury to people or property resulting from any ideas, methods, instructions or products referred to in the content. |
© 2023 by the authors. Licensee MDPI, Basel, Switzerland. This article is an open access article distributed under the terms and conditions of the Creative Commons Attribution (CC BY) license (https://creativecommons.org/licenses/by/4.0/).
Share and Cite
MDPI and ACS Style
Stathi, E.; Kastridis, A.; Myronidis, D. Analysis of Hydrometeorological Characteristics and Water Demand in Semi-Arid Mediterranean Catchments under Water Deficit Conditions. Climate 2023, 11, 137. https://doi.org/10.3390/cli11070137
AMA Style
Stathi E, Kastridis A, Myronidis D. Analysis of Hydrometeorological Characteristics and Water Demand in Semi-Arid Mediterranean Catchments under Water Deficit Conditions. Climate. 2023; 11(7):137. https://doi.org/10.3390/cli11070137
Chicago/Turabian StyleStathi, Efthymia, Aristeidis Kastridis, and Dimitrios Myronidis. 2023. "Analysis of Hydrometeorological Characteristics and Water Demand in Semi-Arid Mediterranean Catchments under Water Deficit Conditions" Climate 11, no. 7: 137. https://doi.org/10.3390/cli11070137
Note that from the first issue of 2016, this journal uses article numbers instead of page numbers. See further details here.