


Temporal Variability of Particulate Matter and Black Carbon Concentrations over Greater Cairo and Its Atmospheric Drivers

1
Department of Physics, Faculty of Science, Mansoura University, Mansoura 35516, Egypt
2
Instituto Pirenaico de Ecología, Consejo Superior de Investigaciones Científicas (CSIC), Avda. Montañana 1005, 50059 Zaragoza, Spain
3
Department of Metrology and Atmospheric Science, Faculty of Science, Cairo University, Giza 12613, Egypt
*
Author to whom correspondence should be addressed.
Climate 2023, 11(7), 133; https://doi.org/10.3390/cli11070133
Submission received: 20 April 2023
/
Revised: 20 June 2023
/
Accepted: 21 June 2023
/
Published: 24 June 2023
(This article belongs to the Special Issue Fine Particulate Matter (PM2.5) in a Changing Climate)
Abstract
:This study examines the seasonal and annual variability of black carbon (BC) and particular matter (PM1, 2.5, and 10) over Greater Cairo (Egypt) from 2003 to 2020. Data on PM and BC concentrations were gathered from the European Center for Medium-Range Weather Forecasts (ECWMF) reanalysis dataset. The Observed data from Abbasiya Station were employed to verify the accuracy of the reanalysis data, and a good agreement on both seasonal and annual scales was suggested. The results demonstrate that the highest concentrations of PM and BC were generally witnessed during wintertime, while the lowest was observed in summer. Trend analysis showed that, apart from fall, a significant increase (p < 0.05) in PM levels was evident in all seasons from 2003 to 2020. Contrarily, BC concentrations exhibited a statistically significant decline from 2003 to 2020. Moreover, BC concentrations correlated negatively with PM (1, 2.5 and 10) in all seasons and annually. However, weak and statistically non-significant (p > 0.05) correlations were found between PM and BC concentrations during wintertime. Additionally, this study looked at the atmospheric configurations corresponding to the most anomalous positive and negative phases of air pollution concentrations over Greater Cairo. The results indicate that the increase in PM concentrations is related to the positive anomalies observed at 250 hPa, which suggest a prevalence of stable atmospheric conditions, particularly during winter. Overall, our findings can serve as a foundation for improved urban planning and more effective strategies to lessen the negative effects of air quality in the largest megacity in Africa and the Middle East.
1. Introduction
The evaluation of air quality in densely populated urban areas holds scientific significance. The impact of urban mega cities on human health is notable due to their high population densities and extensive industrial activities, which lead to elevated levels of air pollution [1,2,3]. Adverse health outcomes can result from substandard air quality, particularly elevated levels of pollutants, such as fine particulate matter (PM2.5), nitrogen dioxide (NO2), sulfur dioxide (SO2), and ozone (O3). Empirical studies have established a correlation between exposure to air pollutants and a range of respiratory and cardiovascular ailments, such as asthma, bronchitis, lung cancer, and untimely mortality [4,5,6]. Additionally, the environment can be substantially impacted by air pollution in urban mega cities. It is well established that the emission of pollutants into the atmosphere is a significant factor in the creation of smog, acid rain, and ground-level ozone in urban environments. The presence of pollutants can cause adverse impacts on ecosystems, including vegetation, aquatic organisms, and populations of wildlife. In addition, from a climatic perspective, climate change can be linked to specific air pollutants, including greenhouse gases, like carbon dioxide and methane, as well as black carbon. These pollutants trap heat in the atmosphere and disrupt the Earth’s energy balance. Due to their extensive industrial and transportation operations, metropolitan areas represent a significant source of these emissions. As such, the assessment of air quality is a crucial component in the formulation of urban planning and policy-making procedures. Through the evaluation of pollution levels and sources, municipal authorities can pinpoint areas of concentrated pollution, make well-informed decisions regarding land utilization, transportation infrastructure, and industrial regulations, and provide valuable insights for urban development and governance.
The monitoring of air quality involves the assessment of various parameters, among which particulate matter (PM) and black carbon (BC) stand out as a crucial indicator of air pollution. PM and BC pollution are contributed by various emission sources, including industrial activities, vehicular traffic, biomass burning, and residential heating. The health implications of PM, which include PM2.5 (particles with a diameter of 2.5 μm or less) and PM10 (particles with a diameter of 10 μm or less), are significant [7]. These particles possess the ability to deeply penetrate the respiratory system, thereby resulting in a diverse array of unfavorable health consequences. PM2.5 has been linked to respiratory and cardiovascular ailments, such as asthma, bronchitis, lung cancer, and elevated mortality rates. Furthermore, BC is a constituent of particulate matter, which is emitted during incomplete combustion processes, including the burning of fossil fuels and biomass. BC exhibits a high capacity for absorbing solar radiation and is implicated in the phenomenon of global warming and alterations to Earth’s climate [8,9]. The process of identifying and controlling sources involves the evaluation of alterations in PM and BC levels, which facilitates the identification of their origins. Through the process of source characterization, policymakers can devise specific strategies aimed at managing and mitigating emissions.
In Egypt, there has been a significant increase in urbanization rates during the past decades. A representative example is the Greater Cairo, whose population rose from 7 million in 1980 to more than 20 million in 2020 [10]. This rapid urban growth has been mainly fueled by vast migration waves from less-developed neighboring rural areas. Greater Cairo is the nerve center for Egypt’s economy, serving as the hub for both manufacturing and monetary police. Due to these demographics and urban conditions, the concentrations of many air pollutants in the Greater Cairo exceed both the World Health Organization (WHO) and the Egyptian guidelines [11,12]. In Greater Cairo, PM is primarily emitted from two human activities: vehicle exhaust and non-exhaust emissions from the combustion of solid biomass. Additionally, the autumnal burning of agricultural residues in the Nile delta, as well as the other sources of carbonaceous aerosols, are significant contributors to BC concentrations over the Greater Cairo region. For example, Mahmoud et al. [13] assessed the concentration of BC in Greater Cairo during autumn 2004 and spring 2005, indicating that the hourly mean concentration was consistently high due to human activities. These concentrations were highly variable at shorter (daily) time scales and significantly higher in the fall (9.9 ± 6.6 µgC/m3)than in the spring (6.9 ± 4.8 µgC/m3). In the literature, several studies have assessed air quality characteristics over Cairo in specific, and Greater Cairo in general (e.g., [14,15]). For example, Ahmed et al. [16] employed monthly averages from an air quality monitoring network between 2011 and 2015 to examine the spatial and temporal variability of air pollutants in Greater Cairo. Based on a network of monitoring stations, the levels of PM10, NO2, and SO2 in the air were analyzed, demonstrating that downtown areas tended to show higher pollution rates, particularly during winter months. Additionally, Hereher et al. [17] employed remotely sensed data to address seasonal variations in the nighttime surface urban heat island intensity (SUHII) using information from the American Moderate Resolution Imaging Spectroradiometer (MODIS) satellite and the related seasonal distribution of selected air pollutants using information from the European TROPOspheric Monitoring System (TROPOMI).They found a stronger seasonal correlation between NO2 and the SUHII in spring, while the strongest correlation between CO and SUHII was seen in winter. In this context, although the air quality in the Greater Cairo has received more interest from the scientific community in the last few decades, most of the efforts were oriented toward assessing variability in air quality over a short time period [18,19,20] for specific air pollutants [21,22]. As such, a key innovative aspect of the current study is that it assesses changes in air quality conditions for a long period (2003–2020) on a seasonal and annual basis, including PM1, 2.5, and 10, and BC. Furthermore, it endeavors to assess, for the first time, the links between PM and BC, which has received less attention in the literature.
In the pursuit of this background, the primary aims of this study are to (i) assess changes in the mass concentration of PM and BC from 2003 to 2020 using observations and a reanalysis dataset, and (ii) explore the atmospheric configurations driving the variability of air quality concentrations. This assessment can help local decision-makers understand and visualize the spatial and temporal variability of the measured pollutants, paving the way for more informed and effective policies and decisions.
2. Study Area
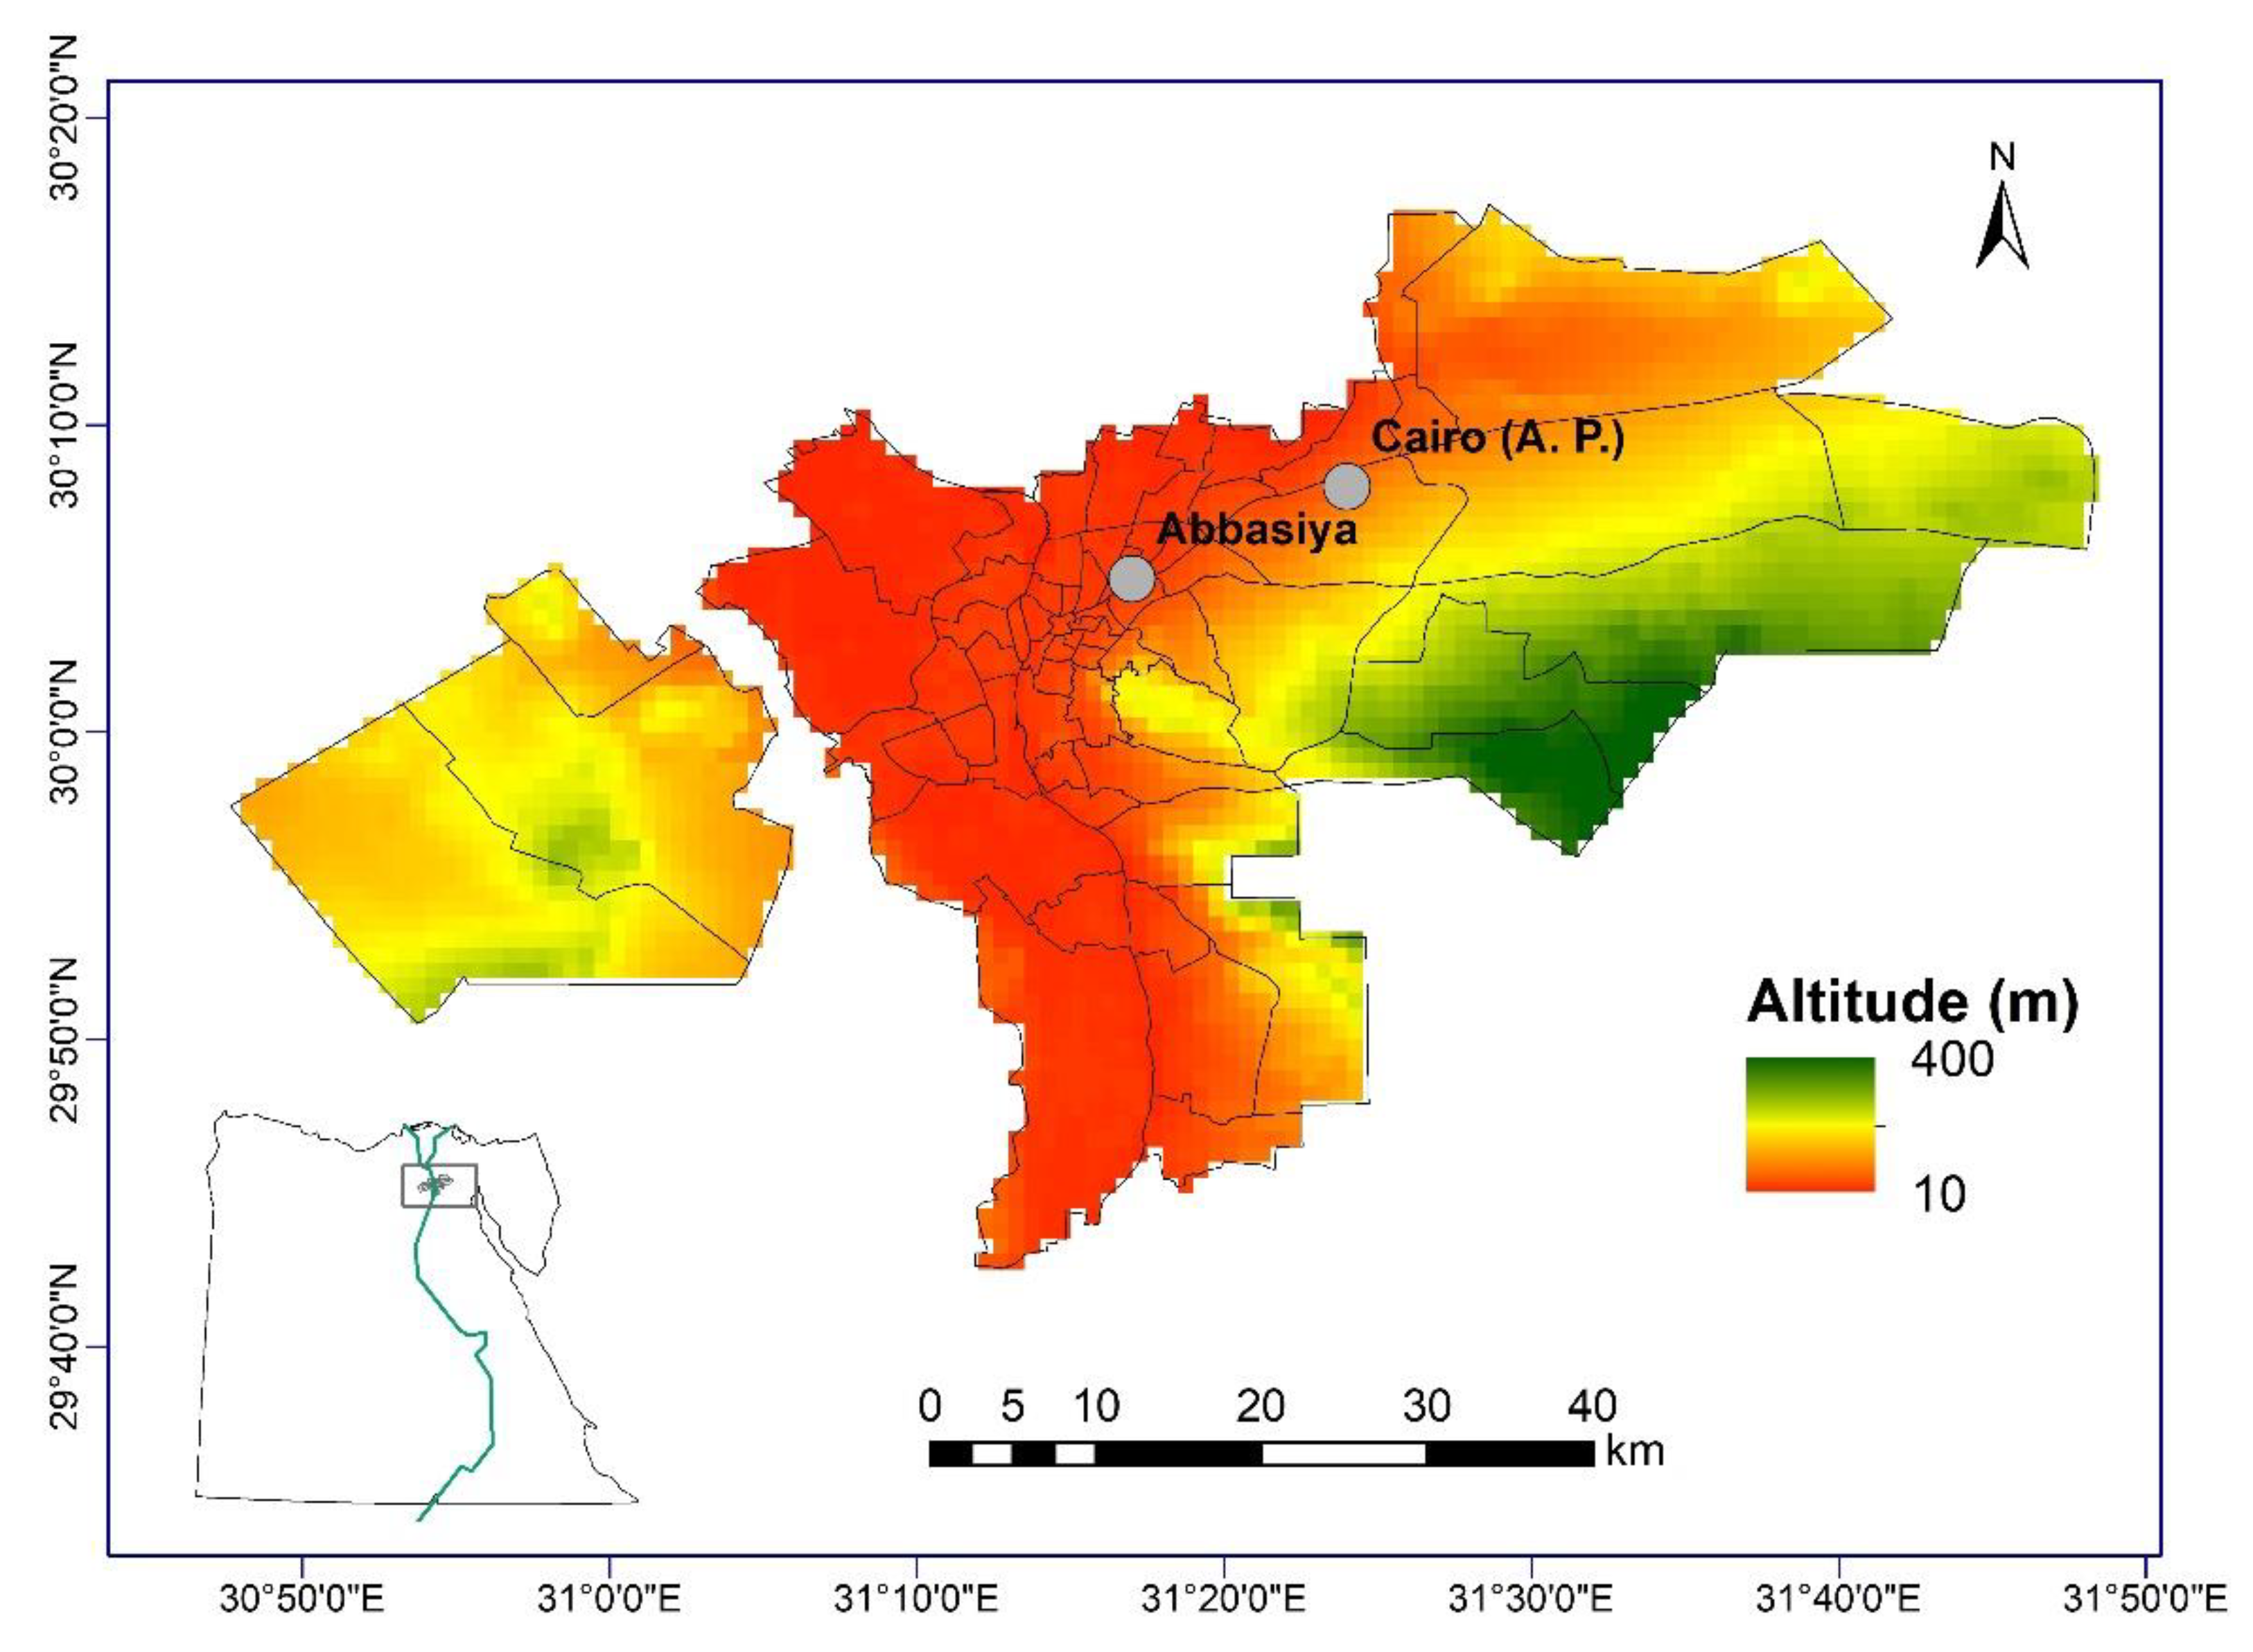
Greater Cairo is the largest metropolitan area in the Middle East, with a population of 22 million [23], with a total area of approximately 2670 km2 [24]. More than 20 million people live in Greater Cairo, which consists from the cities of Cairo, Giza, and Shoubra El-Khiema. The weather is typically hot and dry. The average temperature from 2003 to 2020 was 33 °C, with the temperature range being 27–36 °C. Radiation cooling frequently causes shallow, stable inversions, which contribute to the coolness and dampness of the winter nights. Sandstorms blow dust from the Sahara into the city, typically in spring (March to May) and fall (September to November), representing a remarkable weather phenomenon [25]. These storms are always accompanied by hot, dry winds that add to air pollution because of the dust and sand they carry. Winters (December–February) in the Greater Cairo area are cold, damp, and rainy, while summers (June–August) are hot, dry, and rainless. The wind directions vary from 220 to 361 degrees, while wind speed varies from 3.2 to 4.8 m/s. Greater Cairo’s air quality has deteriorated as a result of the city’s rapid urbanization and industrialization in the last century [26]. Greater Cairo is home to more than 1.30 million vehicles, about 52% of Egypt’s manufacturing and 40% of the country’s electrical power plants [27]. Unleaded gasoline, diesel, and compressed natural gas are the most common vehicle fuels in the Greater Cairo area. As such, it is widely recognized as one of the world’s most polluted megacities.
3. Materials and Methods
3.1. Datasets Description
3.1.1. Observed Air Quality Data
In situ data were provided by the Egyptian Environmental Affairs Agency (EEAA) from December 2011 to December 2014. Only PM10 data from Abbasiya station, located at 31°17′18.63″ longitude and 30°04′39.75″ latitude (Figure 1), were available. Unfortunately, other pollutants lacked sufficient records to conduct a comprehensive assessment. In this study, we used the existing data for Abbasiya to evaluate and validate reanalysis data, which were available at higher spatial and temporal resolutions.
3.1.2. Reanalysis Air Quality Data
Due to lack of ground measurements for most of air pollutants in the Greater Cairo, we relied on data from the European Center for Medium-Range Weather Forecasts (ECMWF) Atmospheric Composition Reanalysis 4 (EAC4) model. Data were available for PM1, PM2.5, PM10, and BC for the time period spanning January 2003 through December 2020 at a time resolution of 3 h. The data are grid-based, covering the entire planet with a horizontal resolution of 0.75 degrees. The L60 model utilized ambient density for the conversion of BC values to g/m3. PM values were multiplied by 10−9 to obtain μg/m3, and accordingly, the units for BC and PM were finally expressed as KG/KG and kg/m3, respectively. Hourly measurements of PM1, PM2.5, PM10, and BC concentrations were aggregated to daily, monthly, seasonal, and annual scales.
Since the ambient density in the L60 model level was used to convert BC values to g/m3, and we multiplied PM values by 10−9 to obtain μg/m3, the units for BC and PM were kg/kg and kg/m3, respectively. In this study, we aimed to evaluate seasonal and annual variations in air quality concentrations to illustrate the extent to which concentrations of the chosen pollutants vary as a function of season. Accordingly, the hourly data of PM1, PM2.5, PM10, and BC concentrations were aggregated to seasonal and annual scales. The months of December, January, and February (DJF), March, April, and May (MAM), June, July, and August (JJA), and September, October, and November (SON) were established as the four distinct seasons.
3.1.3. Controlling Variables of Air Pollution (Geopotential Height Field and Wind Direction)
The vertical distribution of air masses in the atmosphere can be represented by the geopotential height field, which is crucial for comprehending pollution transport. Geopotential height is a crucial meteorological parameter that reflects atmospheric pressure and facilitates comprehension of the vertical structure of the atmosphere. It has been widely utilized as an indicator of synoptic-scale weather patterns and atmospheric stability, both of which play a vital role in the transport and dispersion of air pollutants. Additionally, a thorough analysis of the correlation between pollution levels and distinct geopotential height configurations can help ascertain plausible origin regions or atmospheric circulation patterns that are linked to episodes of heightened pollution. In this study, data on geopotential height at 250 hPa and 1000 hPa were employed to explore the connections between geopotential height field and air pollution across Greater Cairo. Data were obtained from the Modern-Era Retrospective analysis for Research Applications, version 2 (MERRA-2) (https://giovanni.gsfc.nasa.gov/giovanni/doc/UsersManualworkingdocument.docx.html#h.net4655nyleb; https://ntrs.nasa.gov/citations/20130011033) (accessed on 23 September 2022). Our decision was made to consider air pressure at the height of 1000 hPa, as it indicates the pressure at the near surface. On the other hand, pressure at the height of 250 hPa denotes air pressure at the middle of the troposphere. Numerous studies employed air pressure data near the surface and at different tropospheric levels to explain the atmospheric configurations corresponding to anomalous (i.e., positive or negative) air quality concentrations [28,29].
Additionally, we employed hourly wind direction and speed data measured at Cairo International Airport (Figure 1) to explain air flow near the surface during years of anomalous air pollutant concentrations. Wind data were provided by the Egyptian Metrological Authority (EMA) for the period between January 2010 and February 2022. Through the analysis of data collected from this monitoring station, we were able to define variations in pollution levels that occur in relation to different wind directions. Overall, hourly wind direction and speed data were aggregated on a seasonal and annual basis and computed for 16 directions (N, NNE, NE, ENE, E, ESE, SE, SSE, S, SSW, SW, WSW, W, WNW, NW, and NNW).
3.2. Validation of Reanalysis Data
The available data for PM10 from Abbasiya station were employed to validate the performance of reanalysis data for the common period of 2011–2014. A set of accuracy measures, including the bias, mean absolute error (MAE), root mean squares error (RMSE) and Spearman’s rho correlation coefficient, were used. The bias is computed as
The MAE is given as
The RMSE is formulated as
where N is the number of historical periods, and e is the difference between reanalysis and observation at a time point.
Spearman’s rho isa measure of the strength of a linear relationship between paired data and is computed as
where n is the number of data points of the two variables, and di is the difference in ranks of the “ith” element.
3.3. Trend Assessment
To assess changes in the PM and BC concentrations from 2003 to 2020, a linear least square regression model was applied. The amount of change in the various air pollution variables was calculated in terms of its slope, with larger slopes indicating more rapid shifts and smaller slopes indicating slower shifts in the pollution concentration. In order to determine whether or not the observed changes were statistically significant at the 95% confidence interval (p < 0.05), the modified Mann–Kendall statistical test was used [30]. This is an example of a non-parametric test, which does not presume anything about the data’s distribution in advance. An increasing trend is indicated by a positive value for this metric, while a decreasing trend is indicated by a negative value. In contrast to the traditional Mann–Kendall test, the modified Mann–Kendall test mitigates the possible effect of serial autocorrelation in the data upon trend detection. This is because this test adjusts the original variance formulation for the sample size when serial autocorrelation is present. Investigating the use of serial correlation in detecting temporal variability of meteorological variables has been the subject of a number of studies [31,32,33].
3.4. Links of Air Pollution to Environmental Conditions
In an attempt to explain the atmospheric configurations responsible for anomalous (i.e., higher/lower) concentrations of air pollution over Greater Cairo, we computed anomalies of 250 hPa and 1000 hPa, as well as anomalies of the concentrations for all pollutants, over Greater Cairo. The anomalies were computed, on a seasonal and annual basis with respect to the base period of 2003–2020, as follows:
where i refers to a specific season/year from 2003 to 2020.
Pearson’s r correlation was used to compute the association between air quality anomalies and those of geopotential height fields. The statistical significance of the correlation was assessed at the 95% interval level.
4. Results and Discussion
4.1. Accuracy of Reanalysis Data
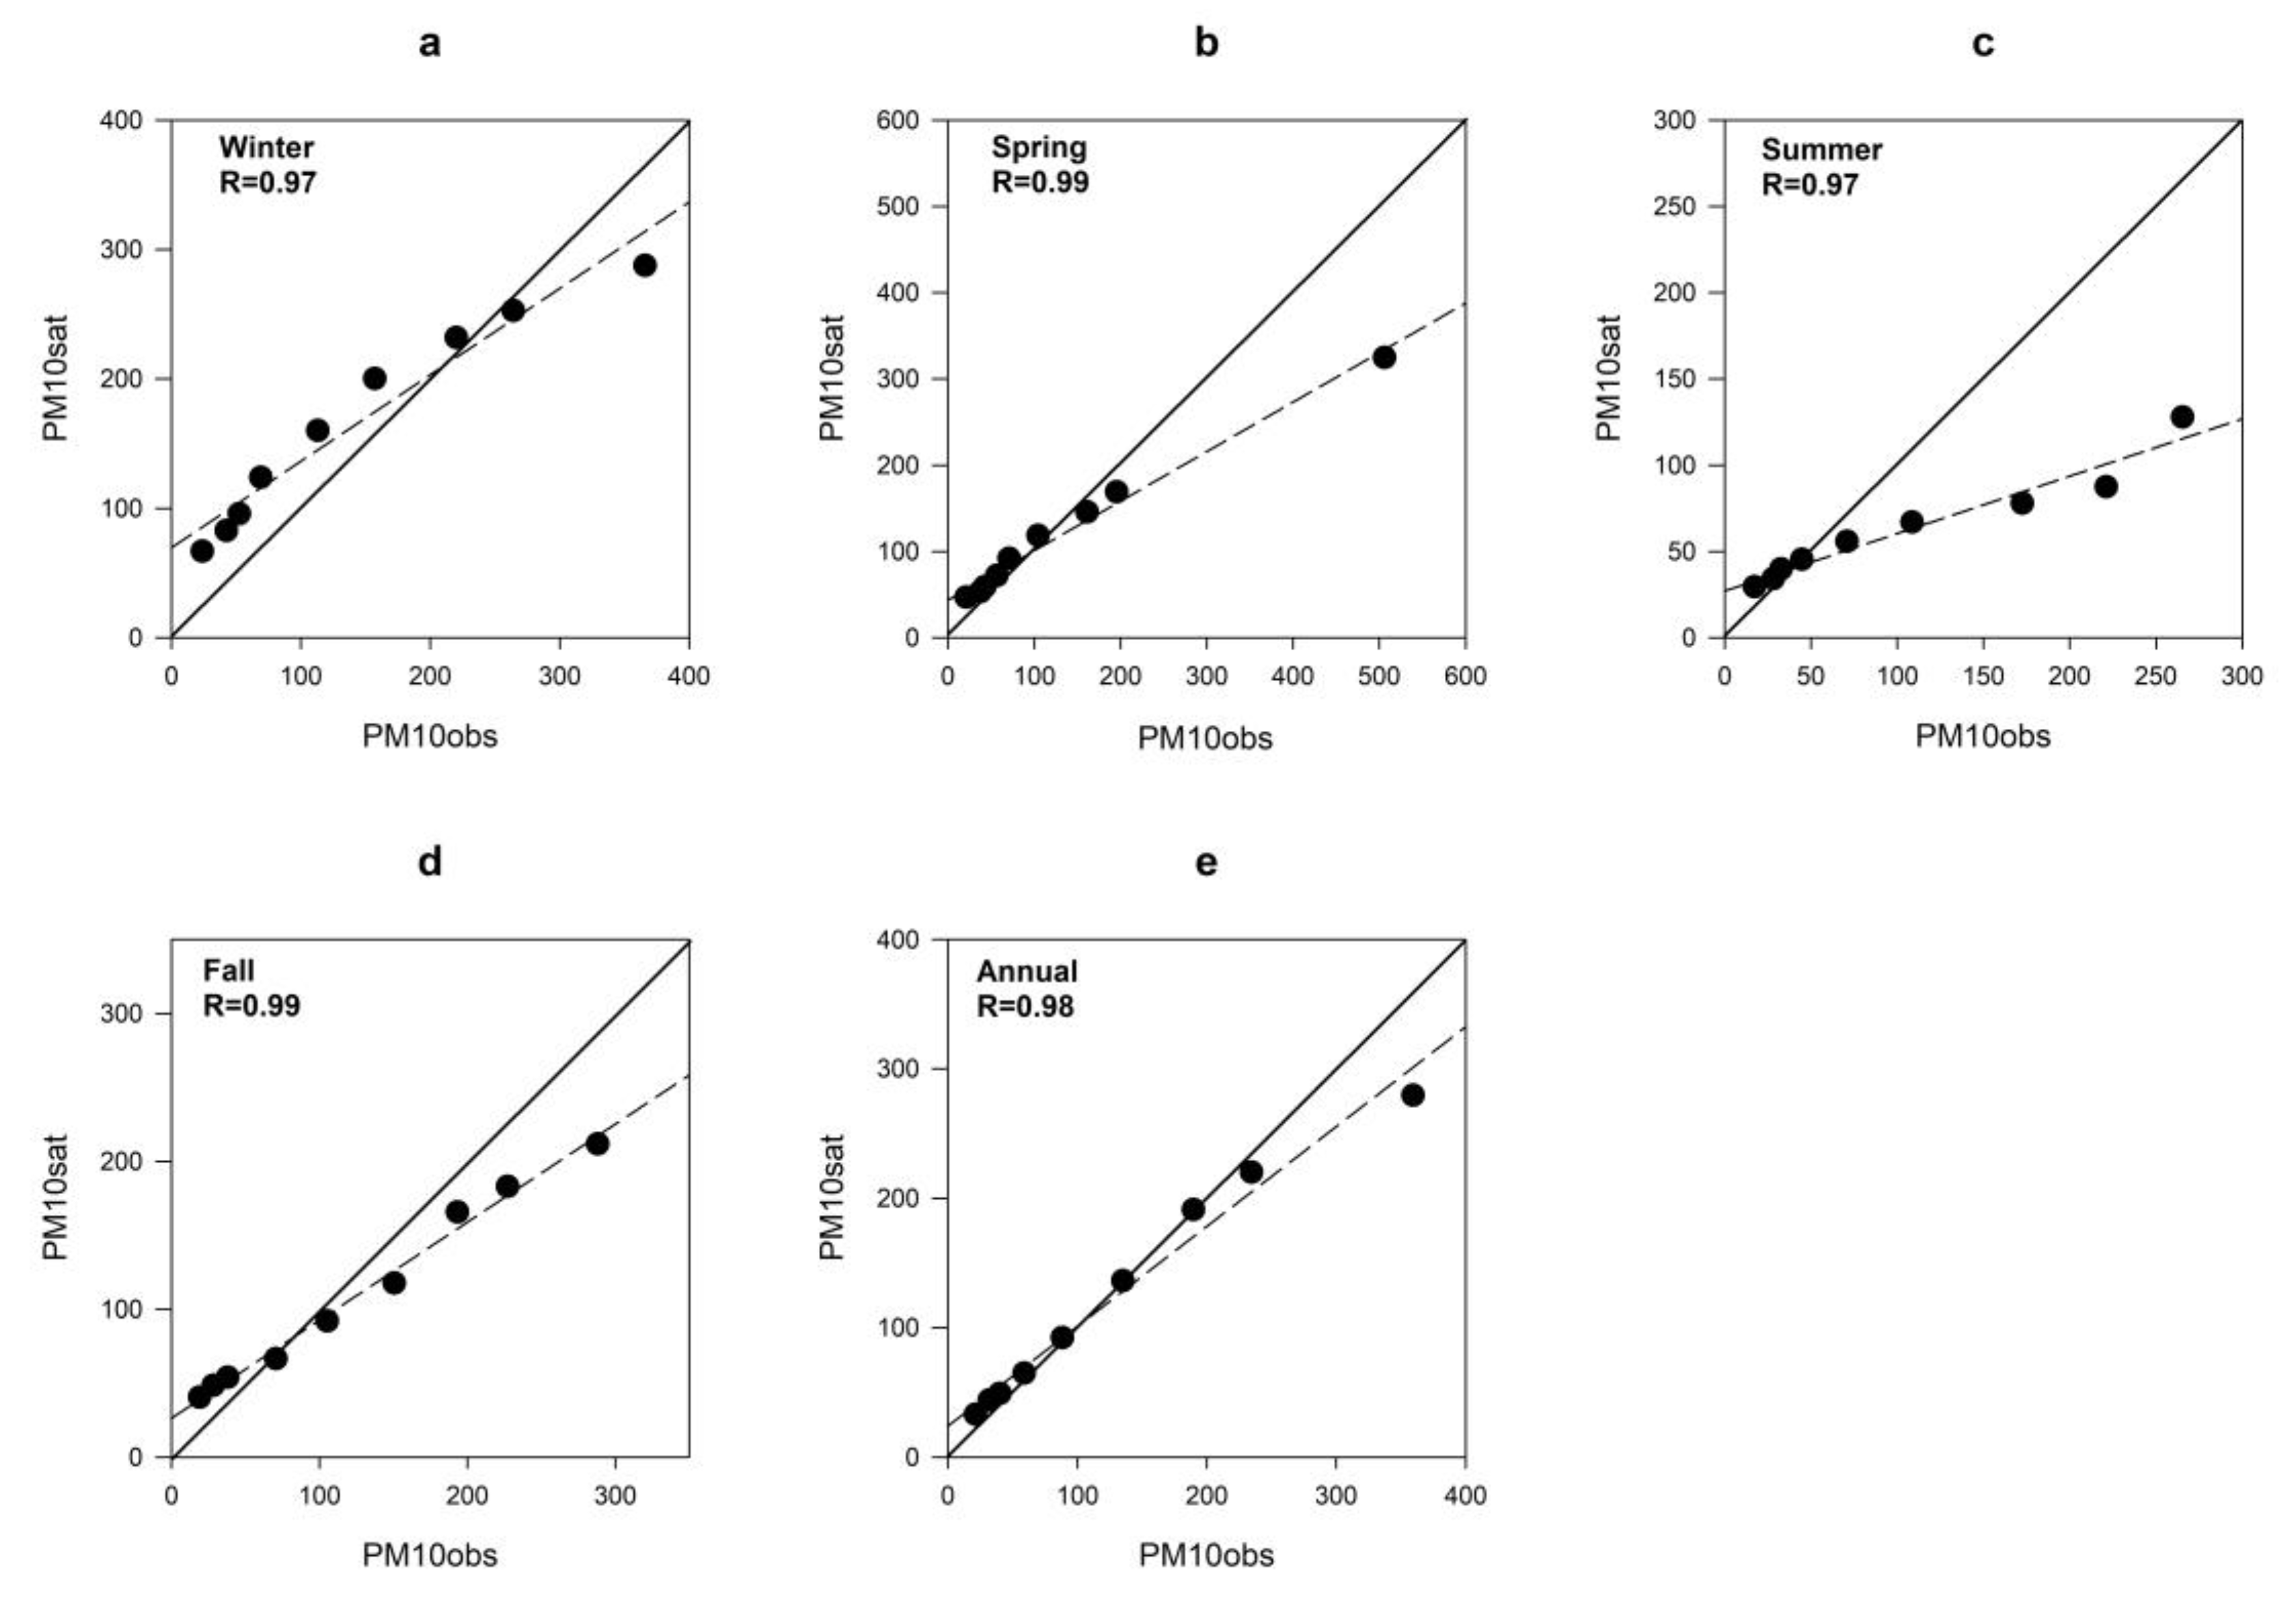
We validated the performance of reanalysis data in replicating the observed mass concentration of PM10 against reanalysis data. The results are summarized in Table 1. An inspection of accuracy metrics reveals a generally good agreement between observations of PM10 mass concentrations and the MERRA-2 reanalysis data, especially during spring and winter. Specifically, in comparison to other seasons, we found that the bias was lowest in spring (6.422 μg/m3) and annually (1.548 μg/m3). Notably, the observed data were overestimated in winter and spring, while they were underestimated in summer and fall. MAE produced the same outcomes, with better performance in springtime. The RMSE in winter was the highest of all seasons. Winter and spring had the highest correlation values, while summer showed the lowest correlation value. We also assessed the differences in data distribution of PM10, as reflected by various percentiles, between the observations and MERRA-2 reanalysis. The results are presented for the 1st, 5th, 10th, 25th, 50th, 75th, 90th, 95th, and 99th percentiles (Figure 2). As depicted, a strong and statistically significant correlation was found between the PM10 observations and MERRA-2 data, with the Pearson’s r value ranging between 0.97 (winter and summer) and 0.99 (spring and fall). Notably, all percentiles of the observed data were overestimated by the MERRA-2 reanalysis, excluding the 95th and 99th percentiles for wintertime and annually. In summer and fall, the observed data of the lower percentiles (e.g., 1st, 5th, and 10th) were overestimated, while upper percentiles (e.g., 90th and 95th) were underestimated.
Overall, our results demonstrate a good performance of the MERRA-2 reanalysis in replicating seasonal PM10 across Greater Cairo. In the literature, scientific research has been conducted to evaluate the proficiency of MERRA-2 reanalysis data in reproducing air quality observations; encompassing the evaluation of aerosol optical depth (AOD);and PM2.5, ozone, and nitrogen dioxide measurements. For example, Ou et al. [34] evaluated the efficacy of MERRA-2 AOD data, as a measure of atmospheric particulate matter, by conducting a comparative analysis with ground-based AOD measurements in China. Their research revealed a substantial concurrence between MERRA-2 and ground-based measurements, indicating that MERRA-2 has the capability to precisely capture the spatiotemporal fluctuations of AOD. In another study conducted by Di et al. [35], the ability of MERRA-2 data to approximate surface PM2.5 concentrations throughout the United States was evaluated. According to this study, a significant correlation between MERRA-2 and on-site measurements was found, suggesting that MERRA-2 has the potential to offer valuable insights into PM2.5 levels. Additionally, according to Qin et al. [36], the long-term and global variations in BC were accurately described by the MERRA-2 data. Overall, it is imperative to acknowledge that MERRA-2 data showed a good performance across our study domain, which makes thema suitable product for assessing air quality over Greater Cairo, especially with the lack of sufficient records of ground observations.
4.2. Seasonal Climatology of PM and BC Concentrations
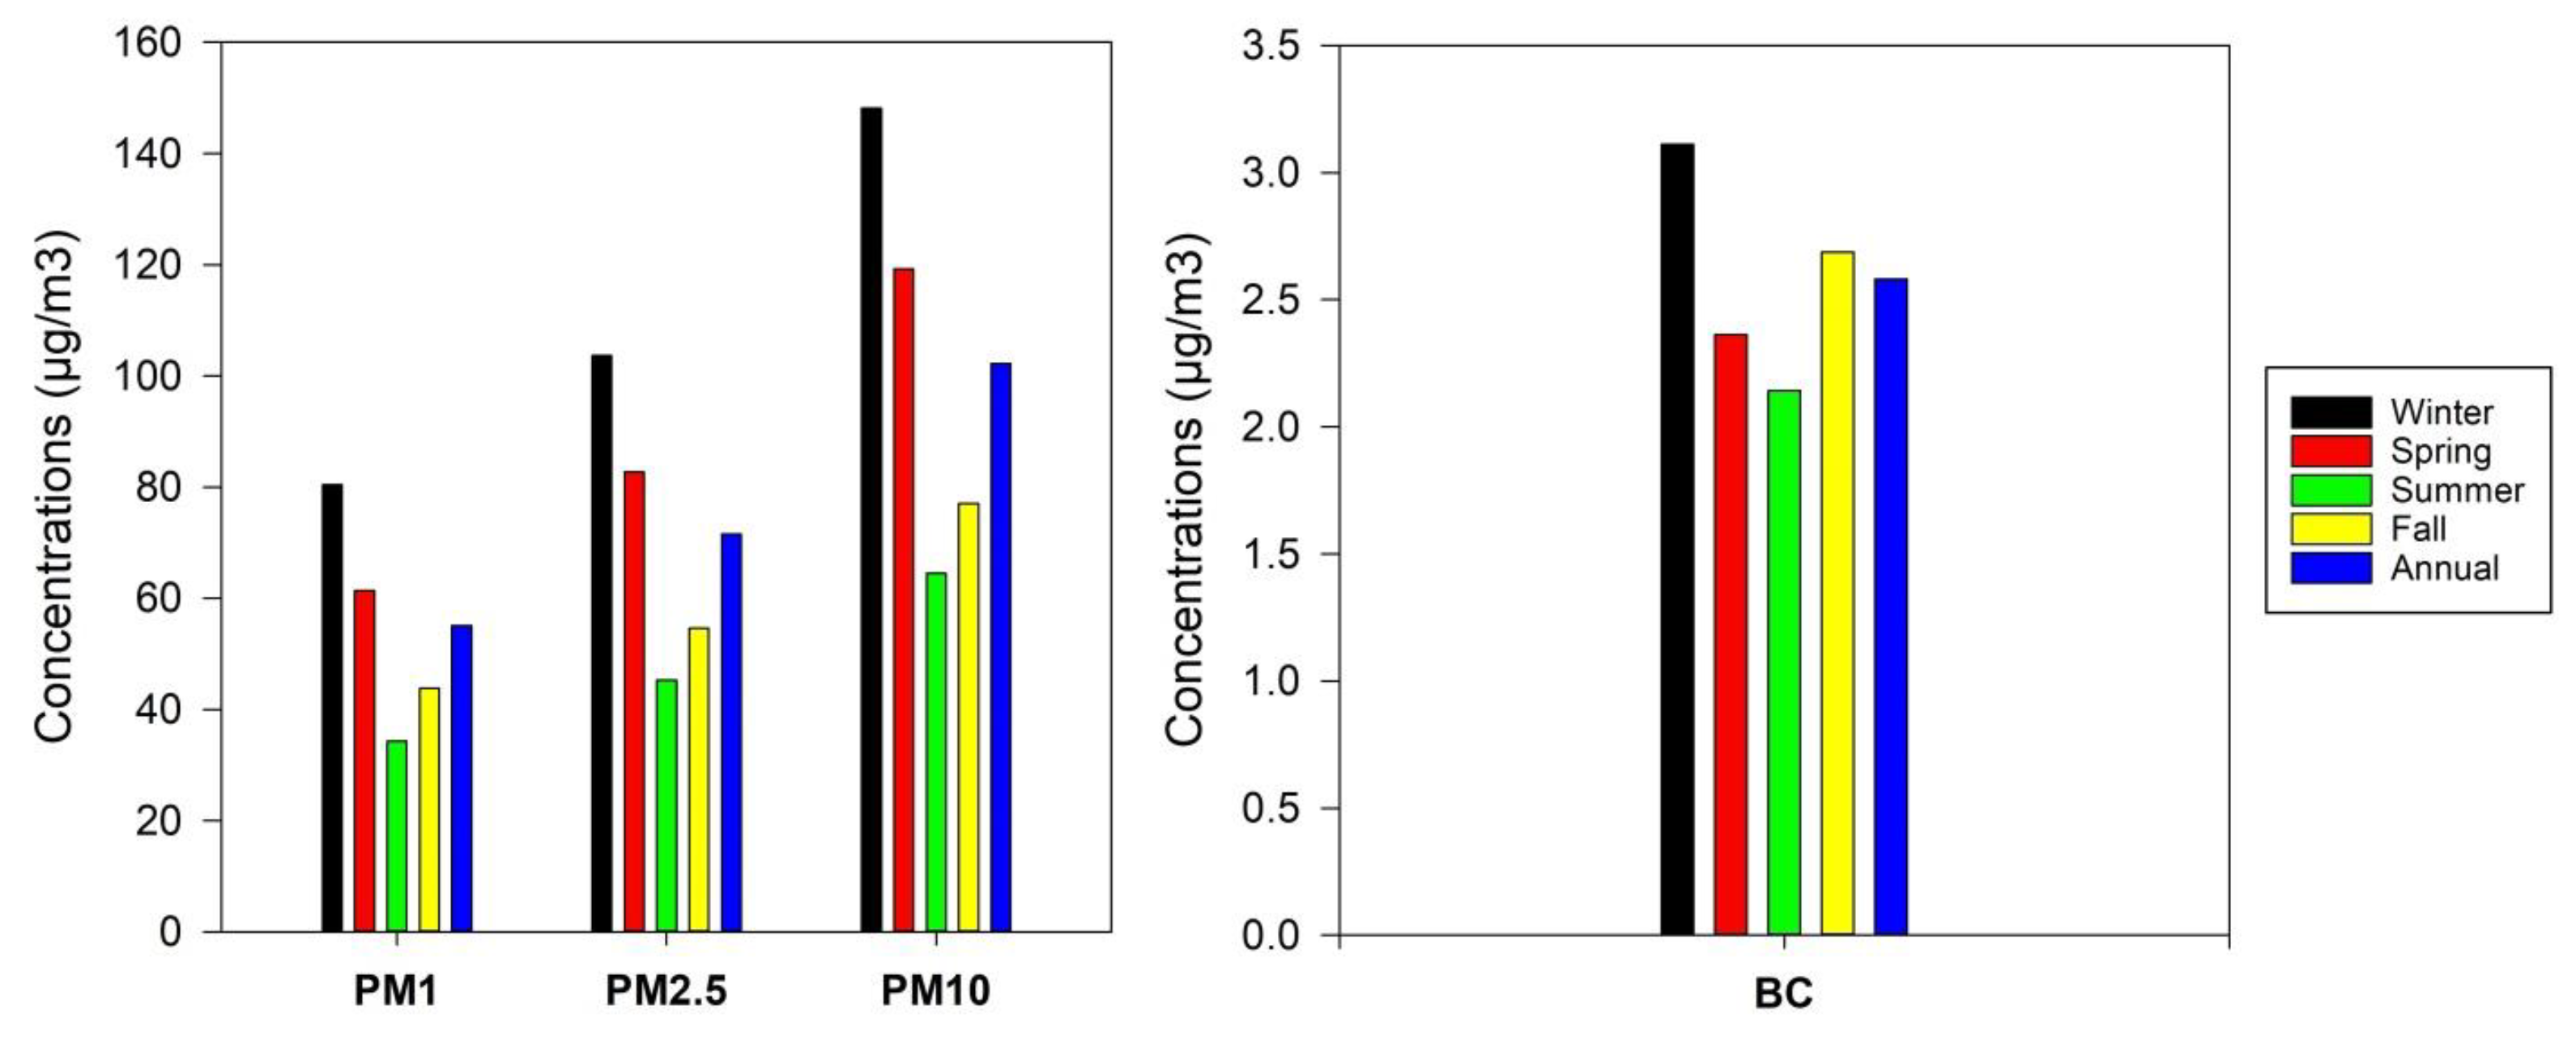
Figure 3 illustrates the average seasonal concentrations of PM and BC over Greater Cairo for the period of 2003–2020. Results demonstrate high seasonal variability among the different pollutants. Notably, PM10 exhibited higher level of concentrations, compared with finer PMs, such as PM1 and PM2.5. For example, the concentrations of PM10 in winter were 148 μg/m3, compared to only 80 μg/m3 for PM1 and 103.6 μg/m3 for PM2.5. This finding was evident for all seasons and annually. A similar finding was confirmed by [37]. Notably, there is coherence between PM1, 2.5, and 10 (Figure 3), given that the mass concentration of PM10 increases as those of PM1 and 2.5 increases. This may suggest that tiny particles with diameters of less than 2.5 micron may make up the majority of PM10 in the Greater Cairo. Additionally, we noted that, regardless of their particle size, the concentrations of all PMs were much higher during cold seasons (i.e., winter and fall), compared to warm seasons (e.g., summer and spring). Amongst all seasons, summer was the season with the least concentrations of PM. This finding implies that the concentrations of PM on the annual scale seem to be mostly driven by the level of concentrations during winter and fall rather than in spring and summer. The highest seasonal average mass concentrations of PM1, PM2.5, and PM10 in winter, compared to other seasons especially summer, can possibly be linked to the atmospheric configurations, which contribute to the accumulation of pollution in winter. This conclusion is similar to that of a study conducted in Wuhan, China, as the average monthly concentration of PM was higher in December and January [38]. Similar to PM, the results indicate higher concentrations of BC during winter and fall than in summer and spring. Notably, winter was the only season with BC concentrations exceeding 3 μg/m3.
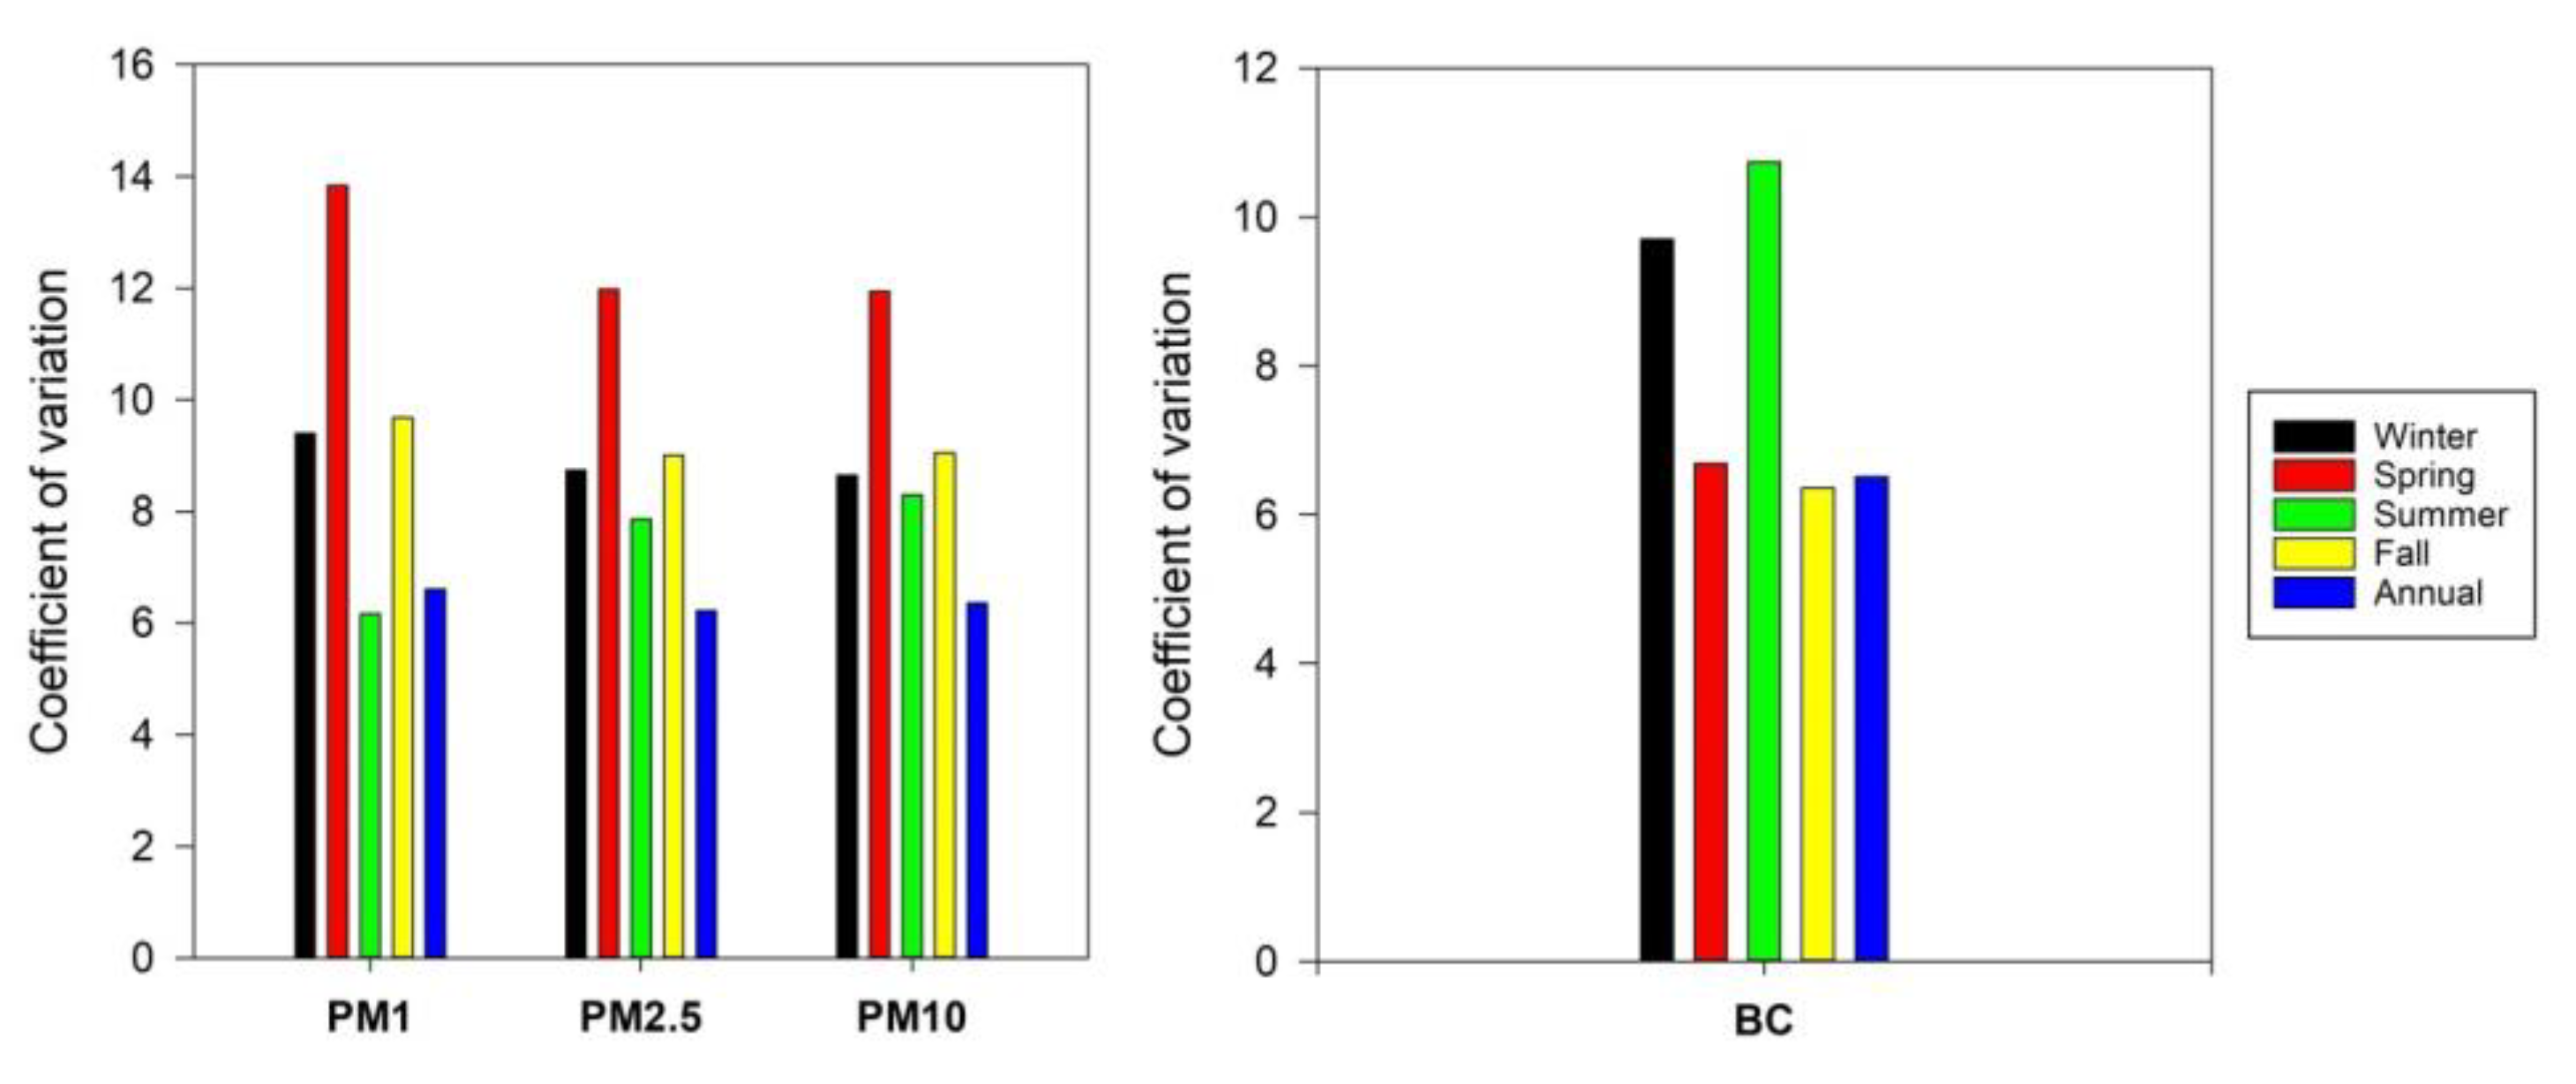
In terms of intrannual variability of the different air pollutants, our results indicate that the levels of PM and BC seem to be seasonally dependent (Figure 4). A comparison of the coefficient of variation between the different pollutants and seasons suggests that spring exhibited the most pronounced variability of PM, albeit with much variability for the finest PM (PM1), compared to PM2.5 and PM10. In contrast, we found less variability of PM concentrations during summertime, especially for PM1, while there were few variations among the different PM concentrations in winter. In contrast to PM, BC exhibited higher variability during summer and winter, while less variability was found in spring and fall. These findings demonstrate that the levels of air pollutants concentrations vary considerably amongst seasons, with the highest concentrations found during winter and fall while the lowest concentrations were witnessed in summer and spring. Wang et al. (2022) reported a comparable outcome for Xi’an, China, where the average annual concentration of PM2.5 was observed to be elevated during the winter season, while the lowest concentrations were documented during the summer season [40]. The observed seasonal variations over Greater Cairo can be attributed to the variability of sources and factors that impact the levels of PM and BC, such as traffic emissions, biomass burning, and meteorological conditions, which may differ across various seasons [41]. During the winter season, Greater Cairo is primarily influenced by a high-pressure system, resulting in a challenge for polluted air to disperse and instead remain concentrated in the lower troposphere. During the late spring season, Greater Cairo experiences frequent sandstorm occurrences that primarily originate from the western desert [42]. In particular, vast areas of the city are dominated by the hot and sandy winds of local winds (Khamsin) bellowing from the Sahara [43]. These events lead to the transportation of pollutants over a significant distance from the western and southwestern regions. Also, during early autumn, there is a custom of incinerating rice straw in the Egyptian Delta. The residual botanical matter that remains after rice harvesting, known as rice straw, is commonly burned in open fields as a traditional agricultural practice [44]. The process of combustion leads to the discharge of significant amounts of carbon dioxide (CO2), carbon monoxide (CO), volatile organic compounds (VOCs), and particulate matter (PM) into the ambient surroundings. Zhang et al. (2013) conducted a study on the chemical properties and origins of PM2.5 in Beijing, China between April 2009 and January 2010 [45]. Their study emphasized the importance of seasonal weather and climate conditions in influencing the composition of PM2.5.
4.3. Interannual Variability of PM and BC Concentrations
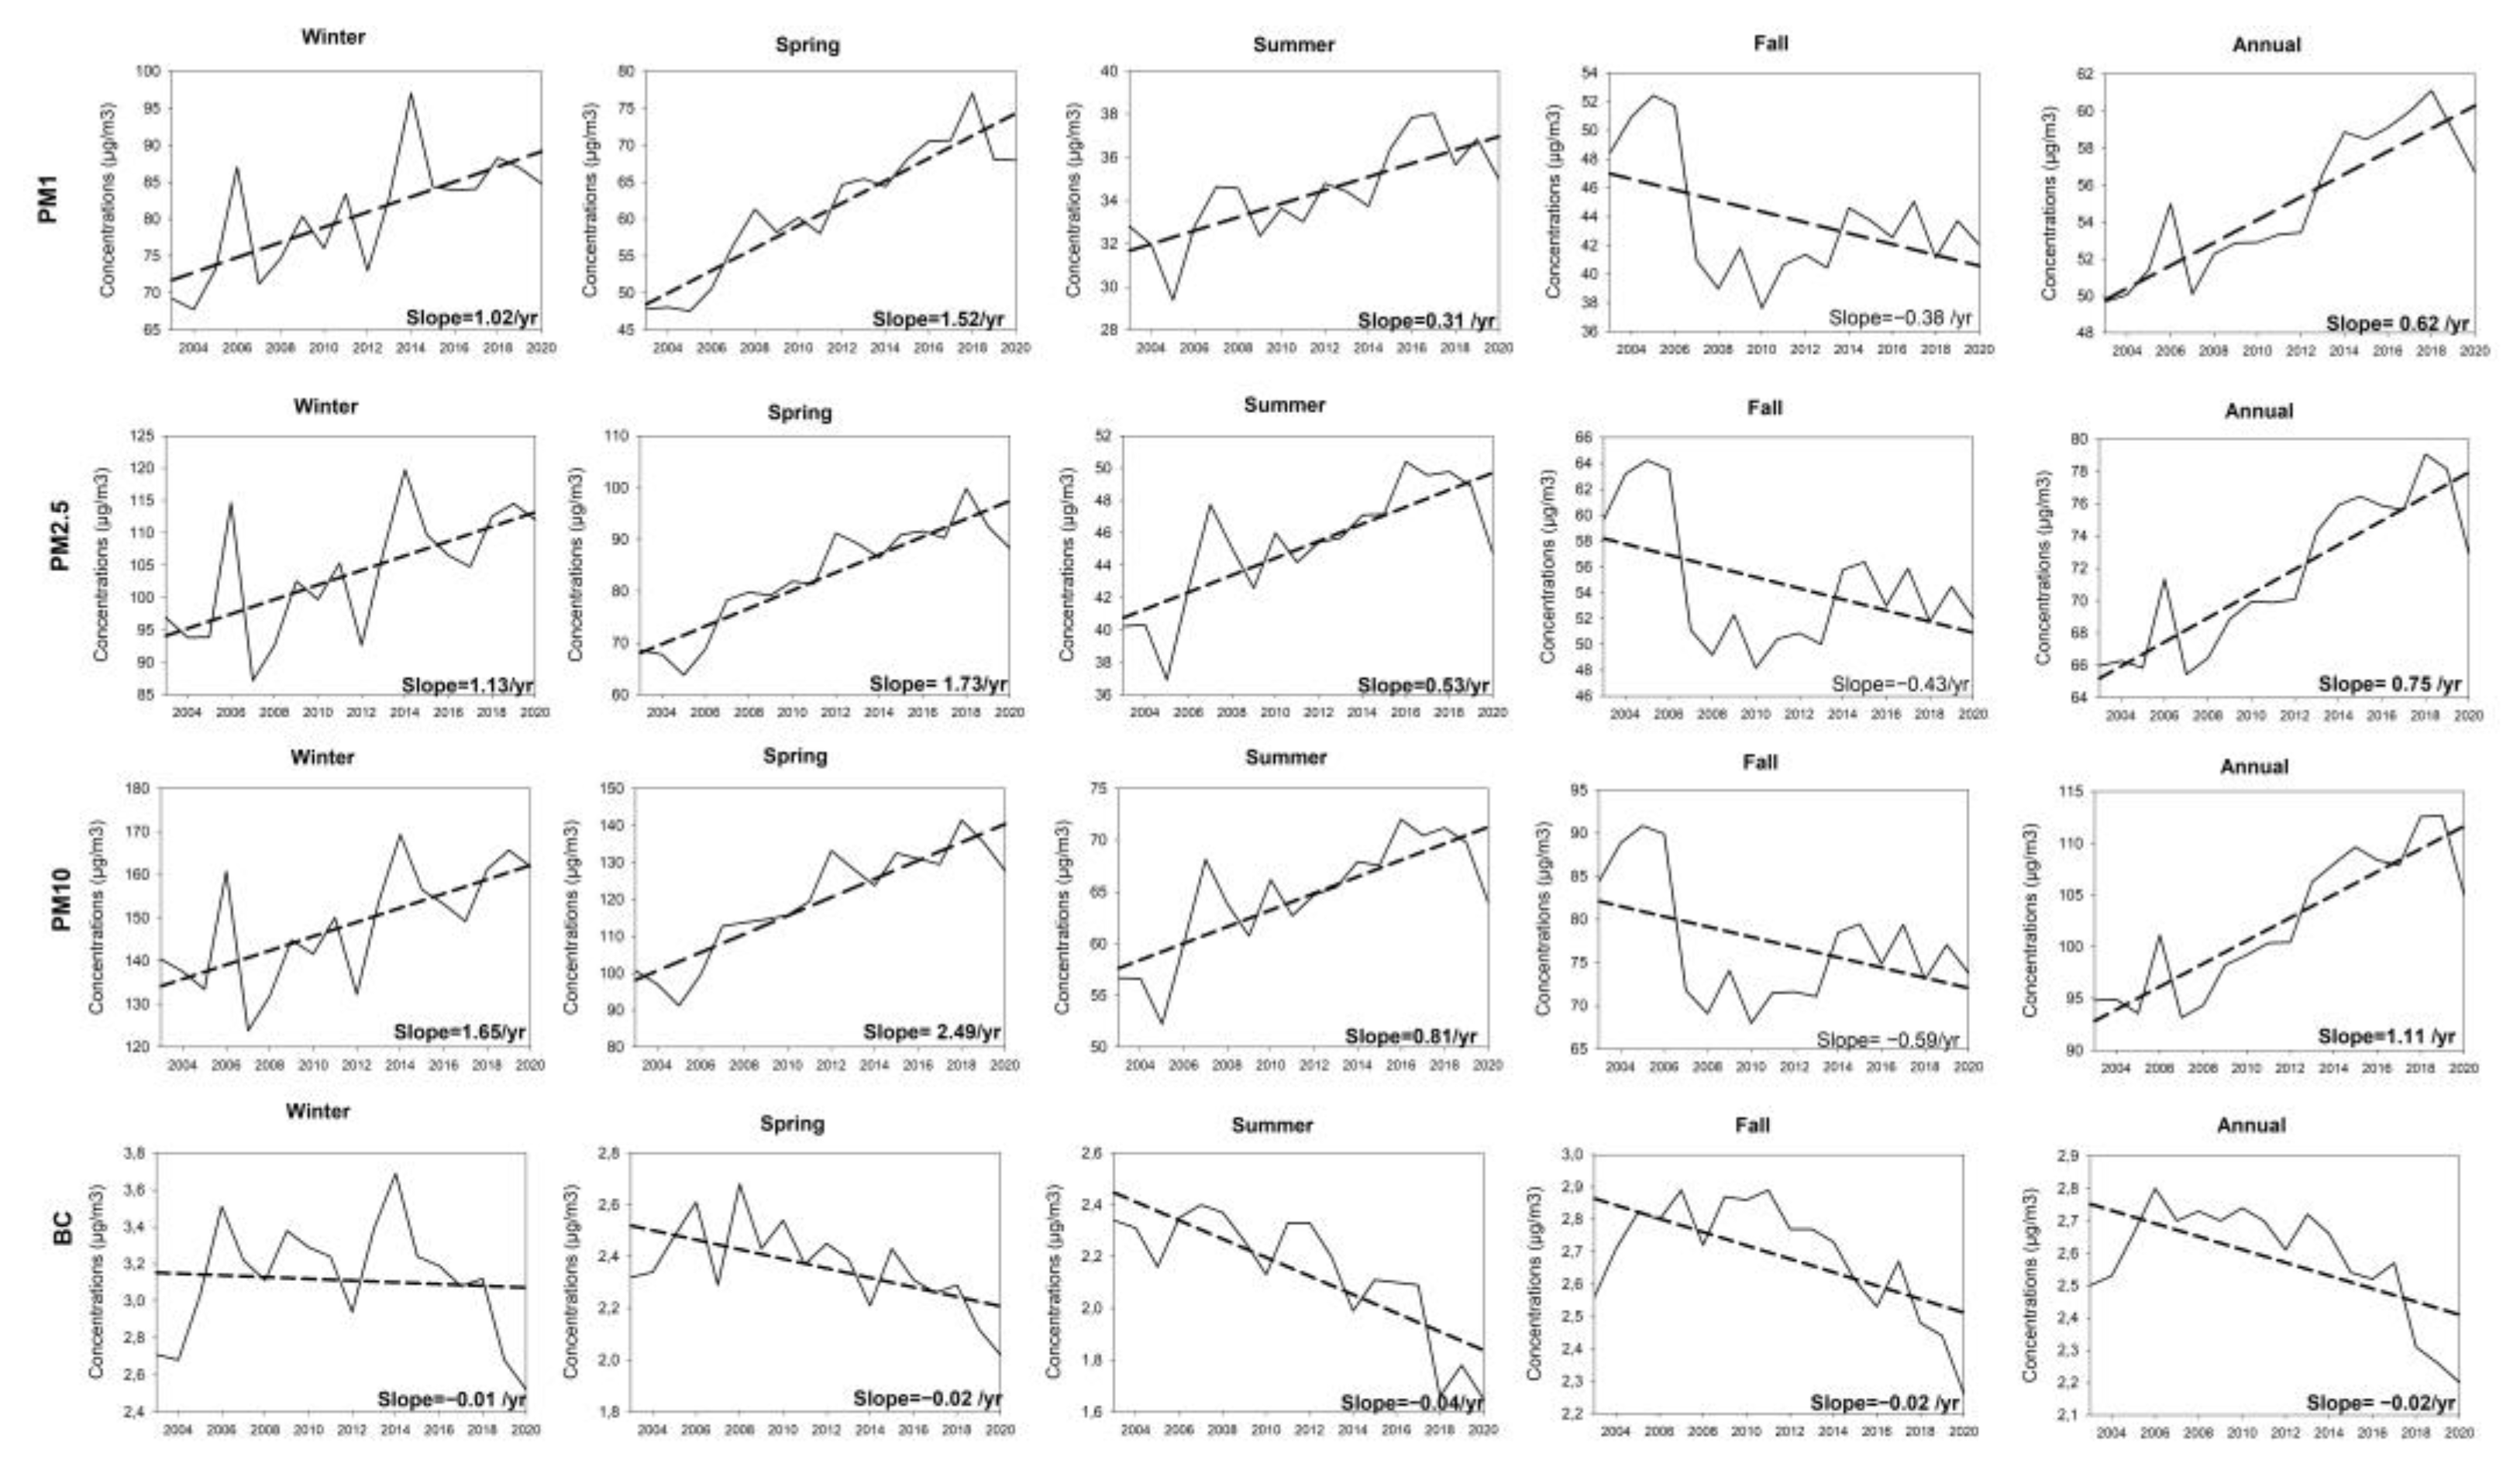
The least squares regression model was used to assess the amount of change in PM and BC from 2003 to 2020, while the statistical significance of these changes was evaluated using the modified Mann–Kendall statistic at the 95% confidence interval (p < 0.05). As depicted in Figure 5, the results indicate a significant increase in PM levels in all seasons, apart from fall. Notably, the most pronounced increasing trend was seen for PM10 but nor for PM1 and PM2.5. This finding was confirmed for all seasons. For example, PM10 increased on the order of 2.49 μg/m3.year during spring, compared to 1.52 and 1.73 μg/m3.year for PM1 and PM2.5, respectively. This makes the concentration trend of PM10 approximately 1.5 times greater than that of PM1 and PM2.5 during springtime. A comparison of all seasons indicates that the highest rates of increase in PM were seen in spring, while the lowest increase was found in summer. Interestingly, fall was the only season that exhibited a decrease in all PM levels. However, this decline was statistically non-significant (p > 0.05) in all seasons. In contrast to PM, BC concentrations showed a significant decline from 2003 to 2020. Summer witnessed the highest rate of decline (−0.04 μg/m3.year), while the least amount of change (−0.01μg/m3.year) was noted during wintertime. As illustrated in Figure 5, changes in BC were statistically significant (p < 0.05) in all seasons and annually. The multidecadal increase in the concentration of PM may be linked to the proportion of human-caused origins of PM, including but not limited to industrial activities, power production, residential burning, transportation, and agricultural practices in the neighborhoods. The population of Greater Cairo has undergone a significant and remarkable growth in recent decades, rising from 2.4 million in 1950 to 20.58 million in 2018, representing over 20% of Egypt’s total population [46]. Additionally, Greater Cairo is a metropolitan area that exhibits a remarkable level of population density, with a staggering density of approximately 8300 individuals per square kilometer, positioning it among the most densely populated metropolitan areas globally. The process of urbanization in Greater Cairo has been characterized by rapid growth in recent decades, resulting in the emergence and integration of new cities, such as 6th October and Al Obour, alongside the established metropolis. Furthermore, the expansion of urban areas into agricultural regions exacerbates this phenomenon. Megahd et al. [47] provided valuable insights into the dynamics of urbanization and land cover changes in the Greater Cairo in recent decades, demonstrating a considerable growth of urbanization within the region, which was accompanied with a transformation of agricultural land and natural vegetation into urbanized regions due to the effects of population expansion and urbanization procedures. In addition to these anthropogenic impacts, the deterioration of atmospheric conditions in our locality can also attributable to naturally occurring phenomena, such as sand and dust storms, which witnessed a significant increase in recent decades.
4.4. Association between PM and BC Variability
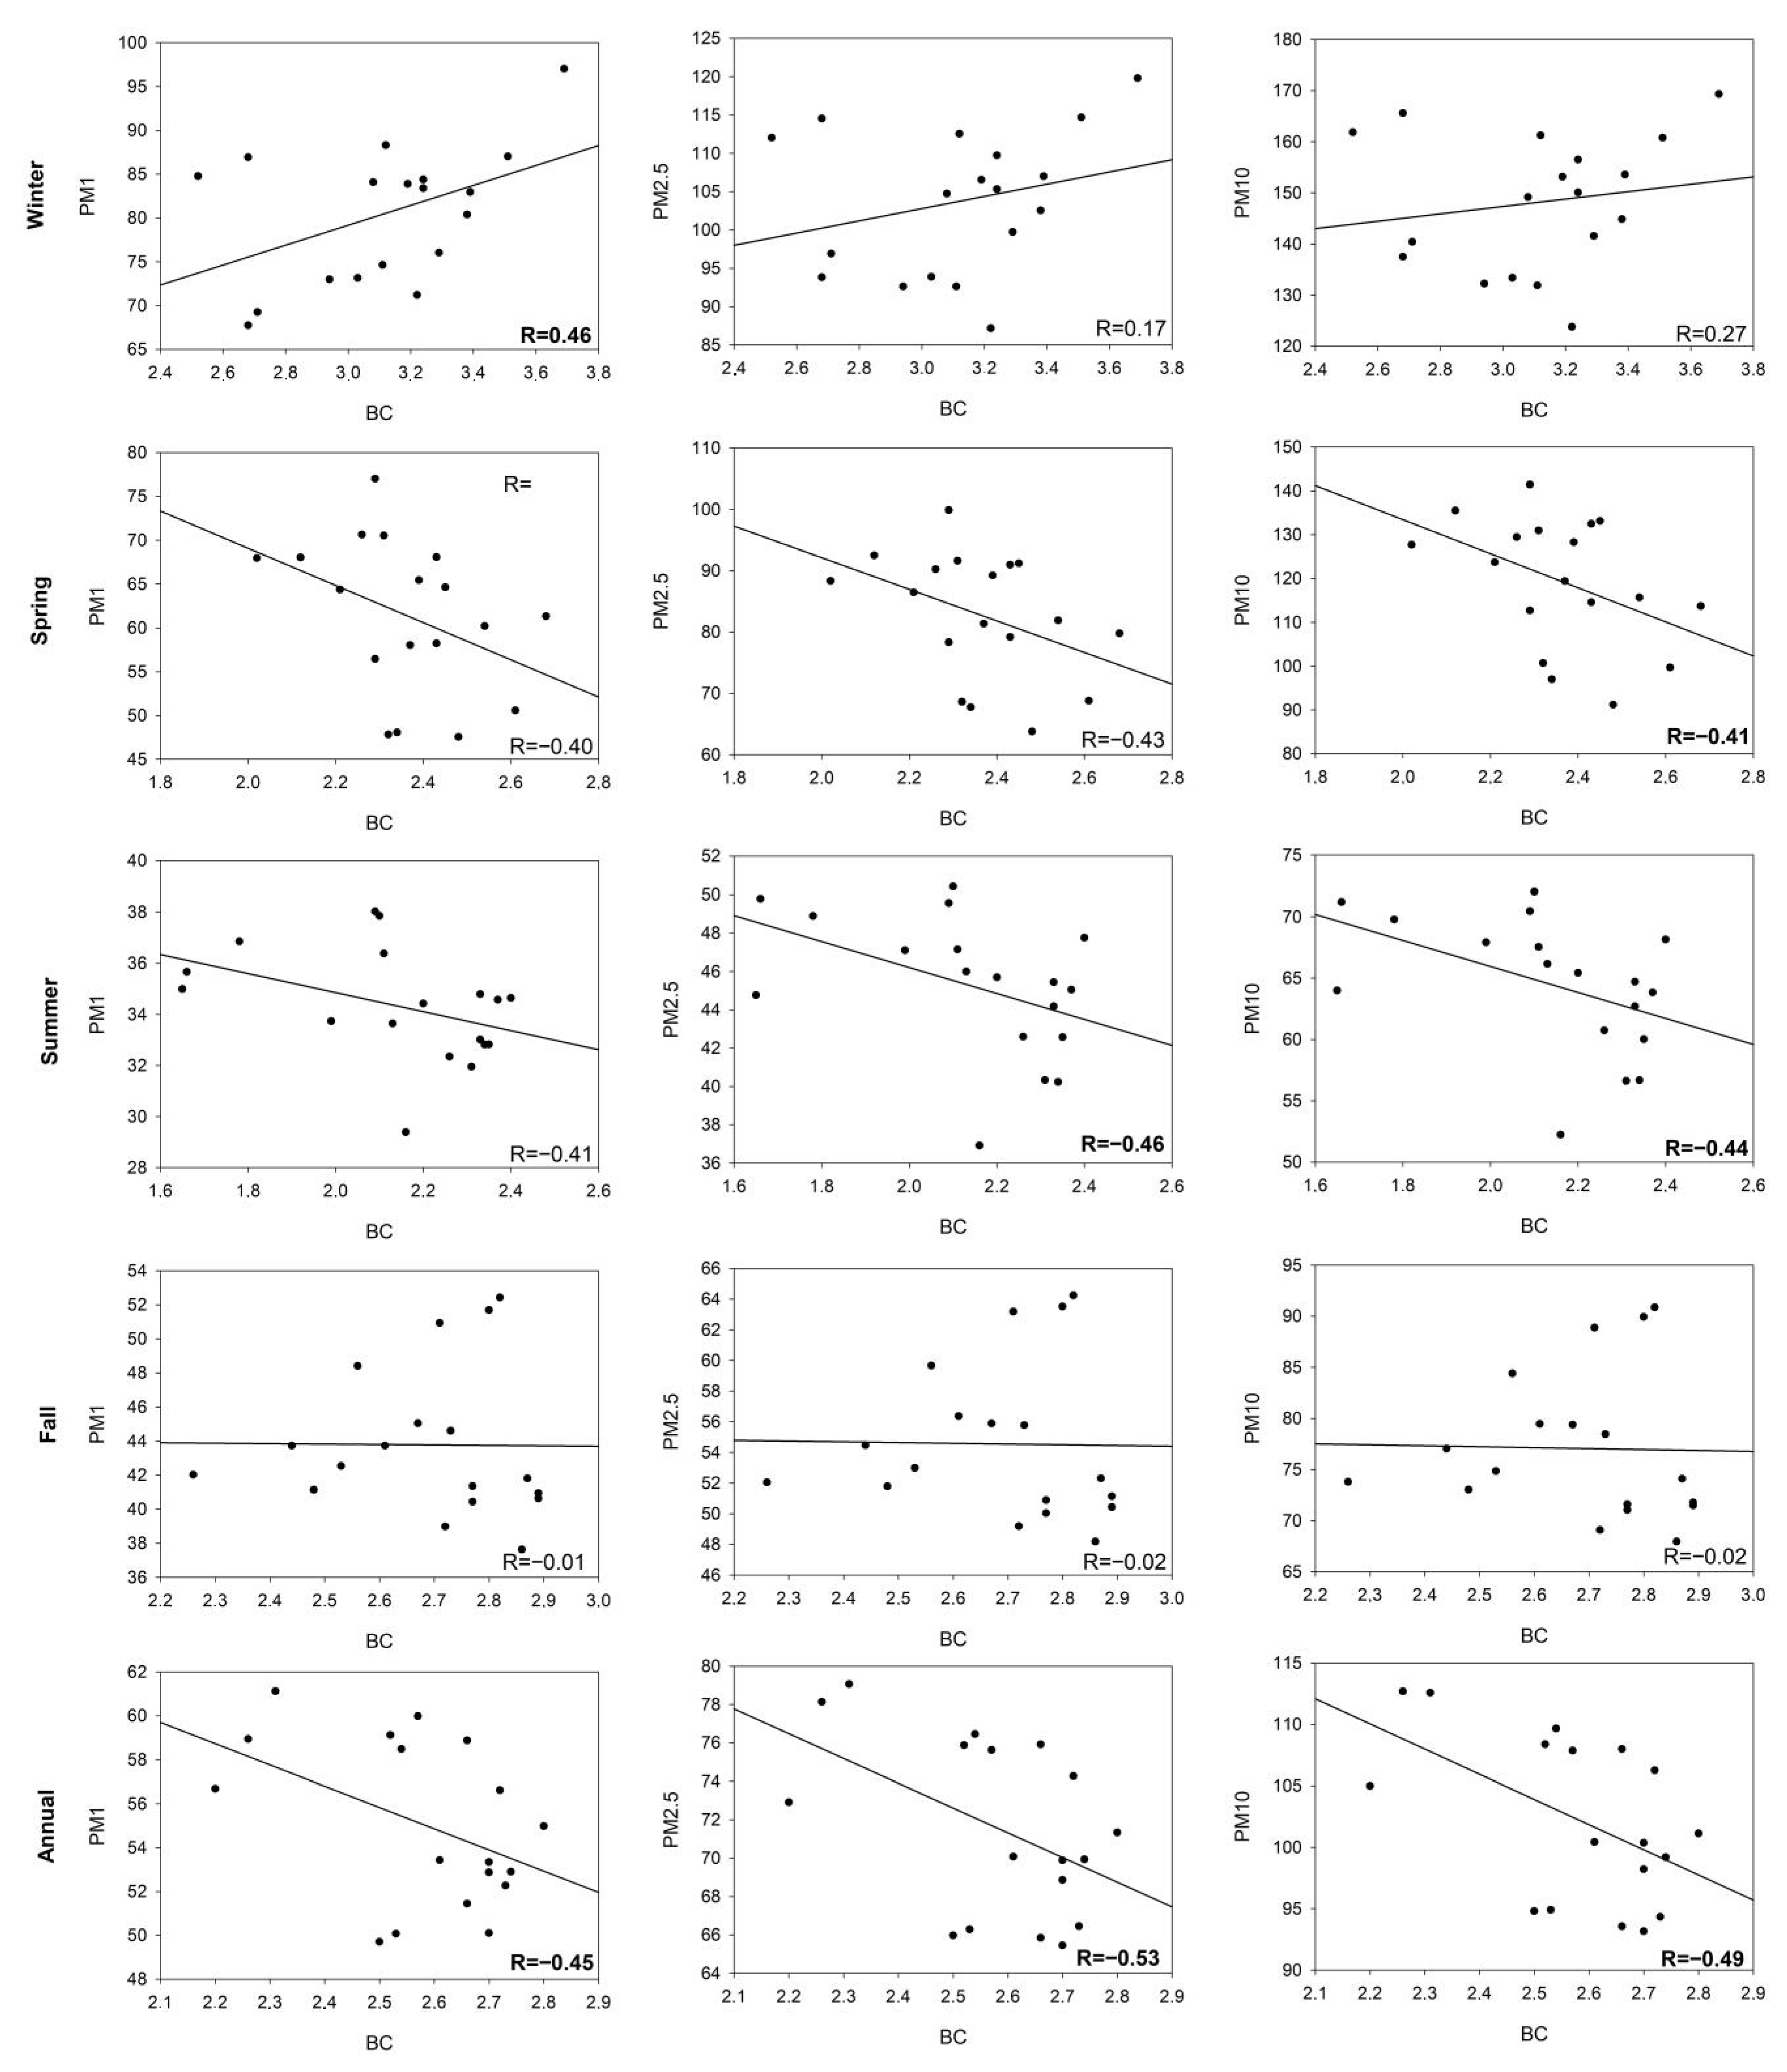
Pearson’s r values and scatter plots were employed to illustrate the association of PM and BC on a seasonal and annual basis (Figure 6). As illustrated, it seems that BC correlated negatively with PM1 in all seasons and annually. The only exception was found during wintertime (r = 0.46, p < 0.05). The negative feedback between BC and PM1 was much stronger during summer (r = −0.41, p > 0.05) and spring (r = −0.40, p > 0.05) than in fall (r = −0.01, p > 0.05). The correlation between BC and PM1 was only significant during winter and annually. Similar to PM1, we noted a negative correlation between BC and PM2.5/PM10 in all seasons. Again, winter was the only season that exhibited positive correlations between BC and PM. Additionally, the relationships between BC and PM2.5/PM10 were much stronger in spring and summer and less strong during fall. This finding suggests that the significant negative correlation between BC and PM was mainly consistent with this relationship during summer and spring rather than in winter and fall.
4.5. Role of Atmospheric Conditions in Seasonal Variability of PM and BC Concentrations
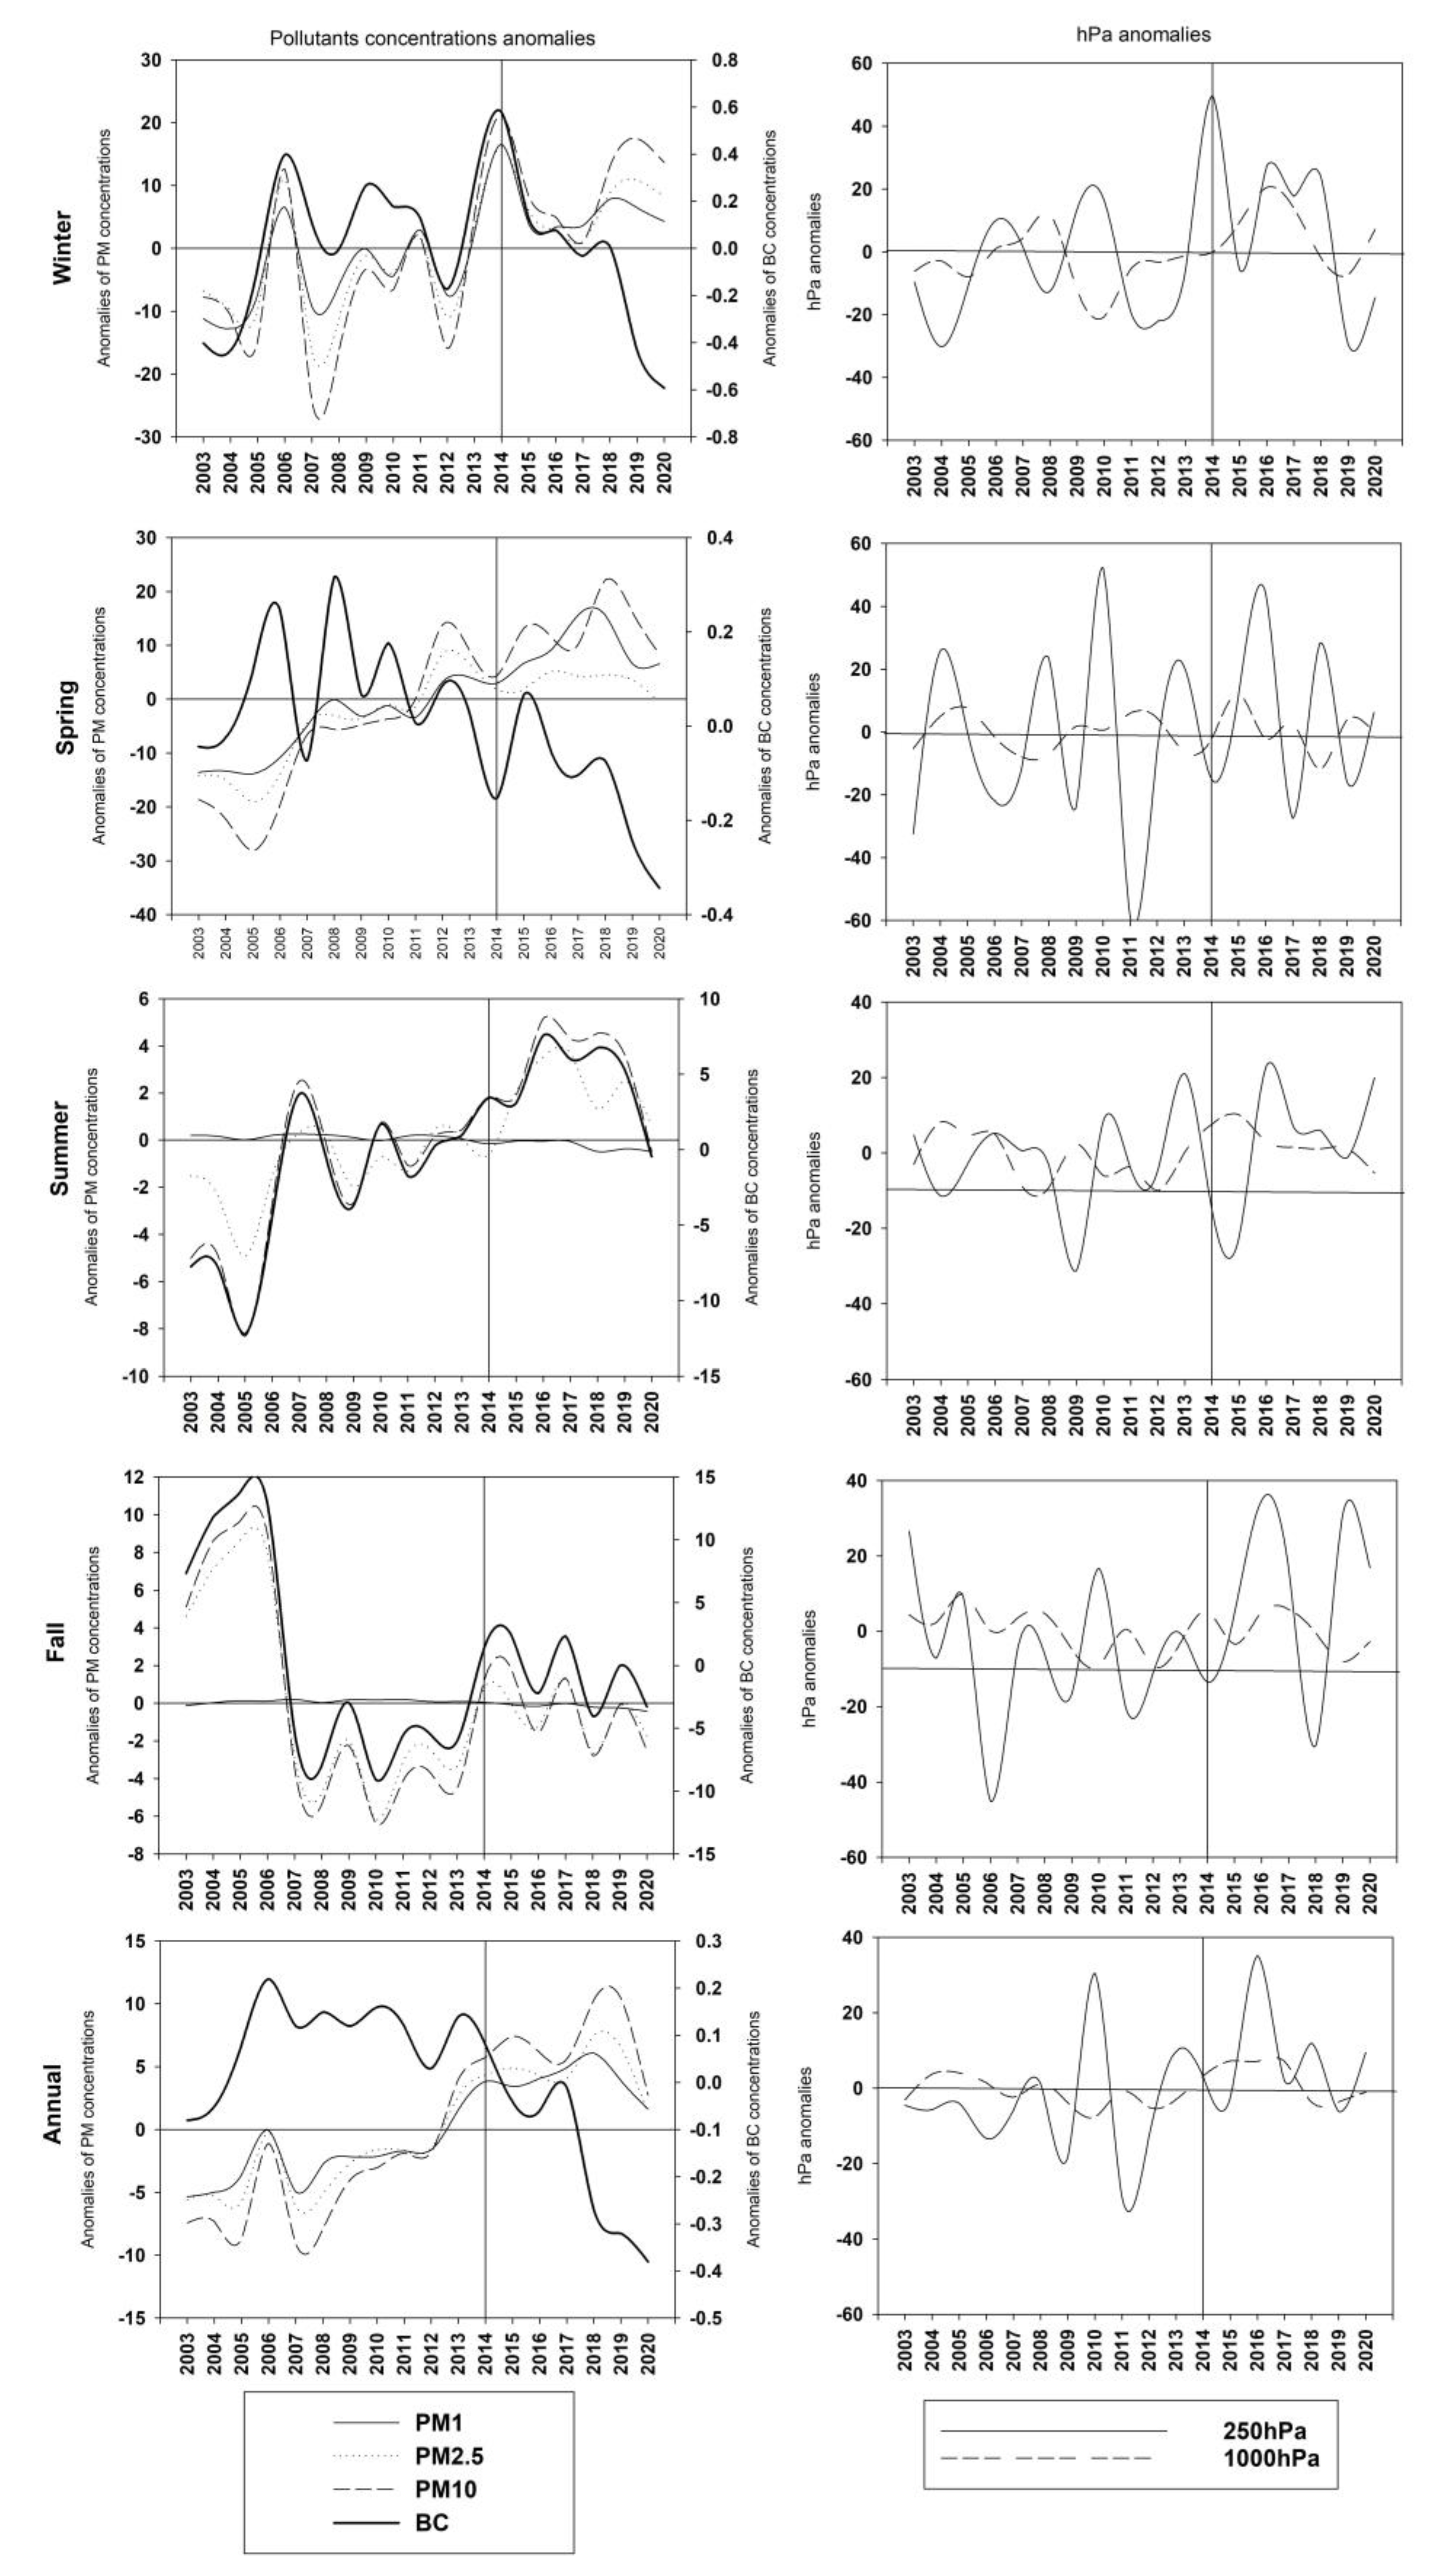
Comprehending the atmospheric configurations linked with air quality offers crucial perspectives into the origins of pollution, facilitates efficient prediction and prompt notification mechanisms, and assists in comprehending the interconnections between air quality and climate change. For this reason, we analyzed the average annual anomaly in air pressure at two different levels (250 hPa and 1000 hPa) in Greater Cairo. These levels summarize atmospheric configurations at the low and mid troposphere. Figure 7 shows that the long-term anomalies of PM1 concentration and those of 1000 hPa had a correlation of about 0.29, while the correlation between PM1 concentrations and 250 hPa was 0.31. Seasonally, winter, spring, and summer all had positive correlations, expect for PM1, with 250 hPa, while fall had a negative one. The anomaly was negative for all concentrations of PM (1, 2.5 and 10) and BC from 2003 to 2013, while a remarkable positive anomaly was noted after 2013. On a seasonal basis, the most anomalous concentrations of PM10 were found in 2014 in spring (22.14), winter (21.17), and fall (−24.37). In the winter of 2014, an above-average value of about 49.67 was noted, and the highest value at 1000 hPa was around 20.5 in winter. In comparison to PM, weaker correlations existed between BC and 1000 hPa and 250 hPa. In a few exceptions, statistically significant correlations were found between BC and 250 hPa (winter, r = 0.69, p < 0.05) and 1000 hPa (fall, r = 0.47, p < 0.05).
Overall, with the exception of the relationship between BC and 250 hPa, all concentrations showed a positive correlation with both 1000 hPa and 250 hPa. As listed in Table 2, a positive association between 1000 hPa and all concentrations was seen in fall, annually, and winter, but not for BC. Rather, negative correlations between 1000 hPa and all concentrations dominated in summer and spring (Table 2). Except for springtime, when BC’s behavior deviates from the rest of the concentrations, we found that the anomaly of PM and BC concentrations was consistent throughout the year. In winter, 250 hPa was mostly positively correlated with all concentrations, but this trend held true across all seasons.
As shown in Table 2 and Figure 7, PM1, in comparison to other pollutants, showed stronger correlations with 250 hPa and 1000 hPa. This finding may be explained by the notion that when air pressure is low, fine particles become more concentrated than coarse particles. Even when surface and mid-tropospheric pressure is low, fine particles tend to be located close to the surface. In their assessment of the atmospheric configurations corresponding to air quality in Beijing, Zou et al. (2017) [48] noted that high concentrations of PM were primarily influenced by a decrease in the height of the planetary boundary layer (PBL).
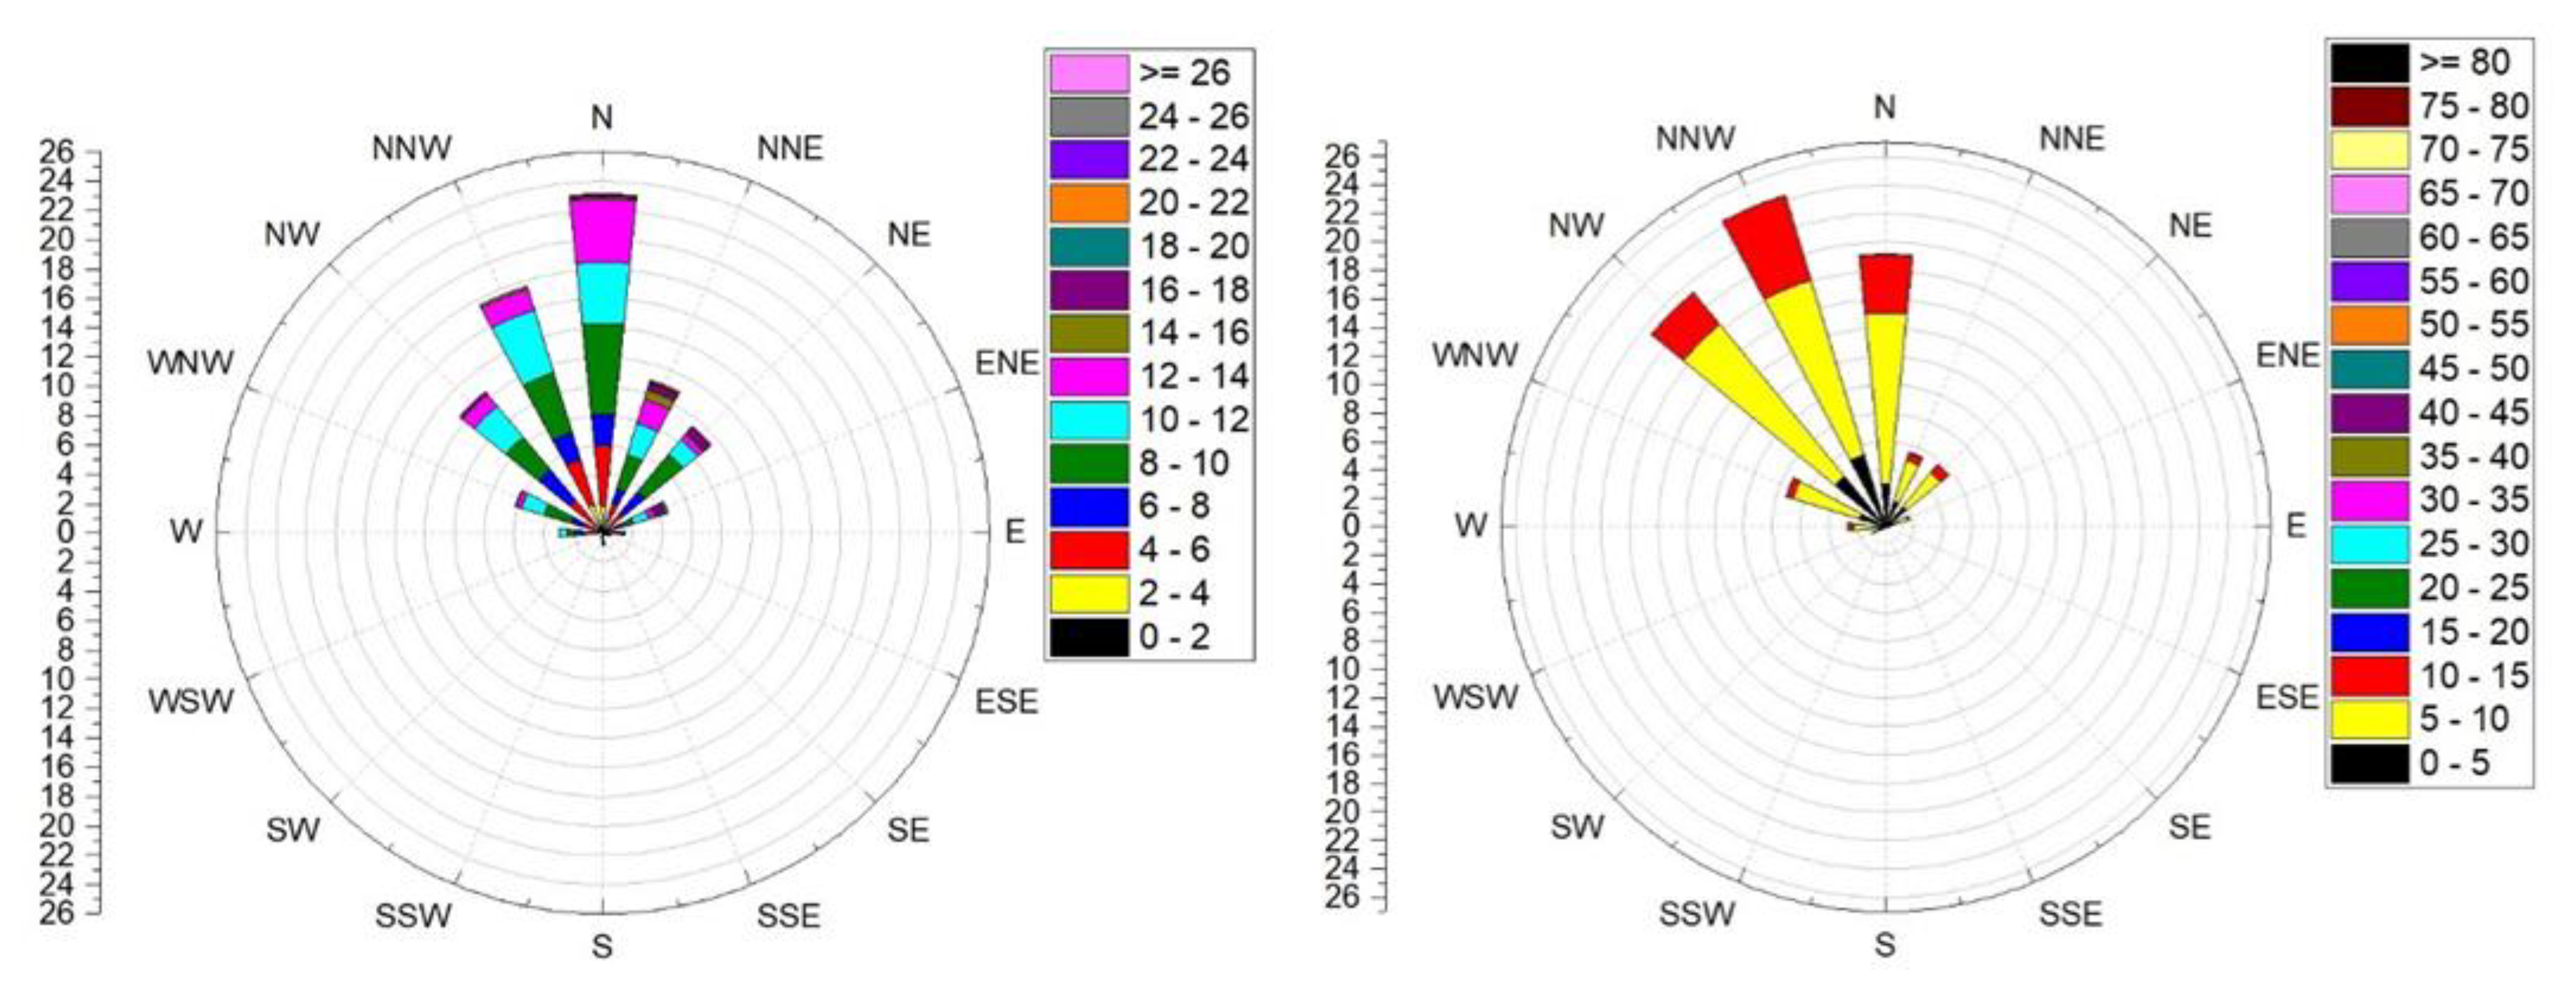
Figure 8 illustrates wind direction and speed corresponding to the most negative anomalous concentrations of air pollution. As illustrated, we selected two months that represented good air quality conditions (anomalous negative concentrations) over the study period. In June 2014, we experienced only northerly winds and no southerly winds at all. Specifically, the largest directions of wind were N (22%), NNW (16%), and NW (12%). In August, the predominant wind direction was from N, followed by NNW and NW. The NNW contributed 24% of the total gusts, while the NW contributed 20%, and the N contributed 18%, for a total gust ratio of 62%. June speeds ranged from 0 to 14 knots, while August speeds ranged from 0 to 15 knots.
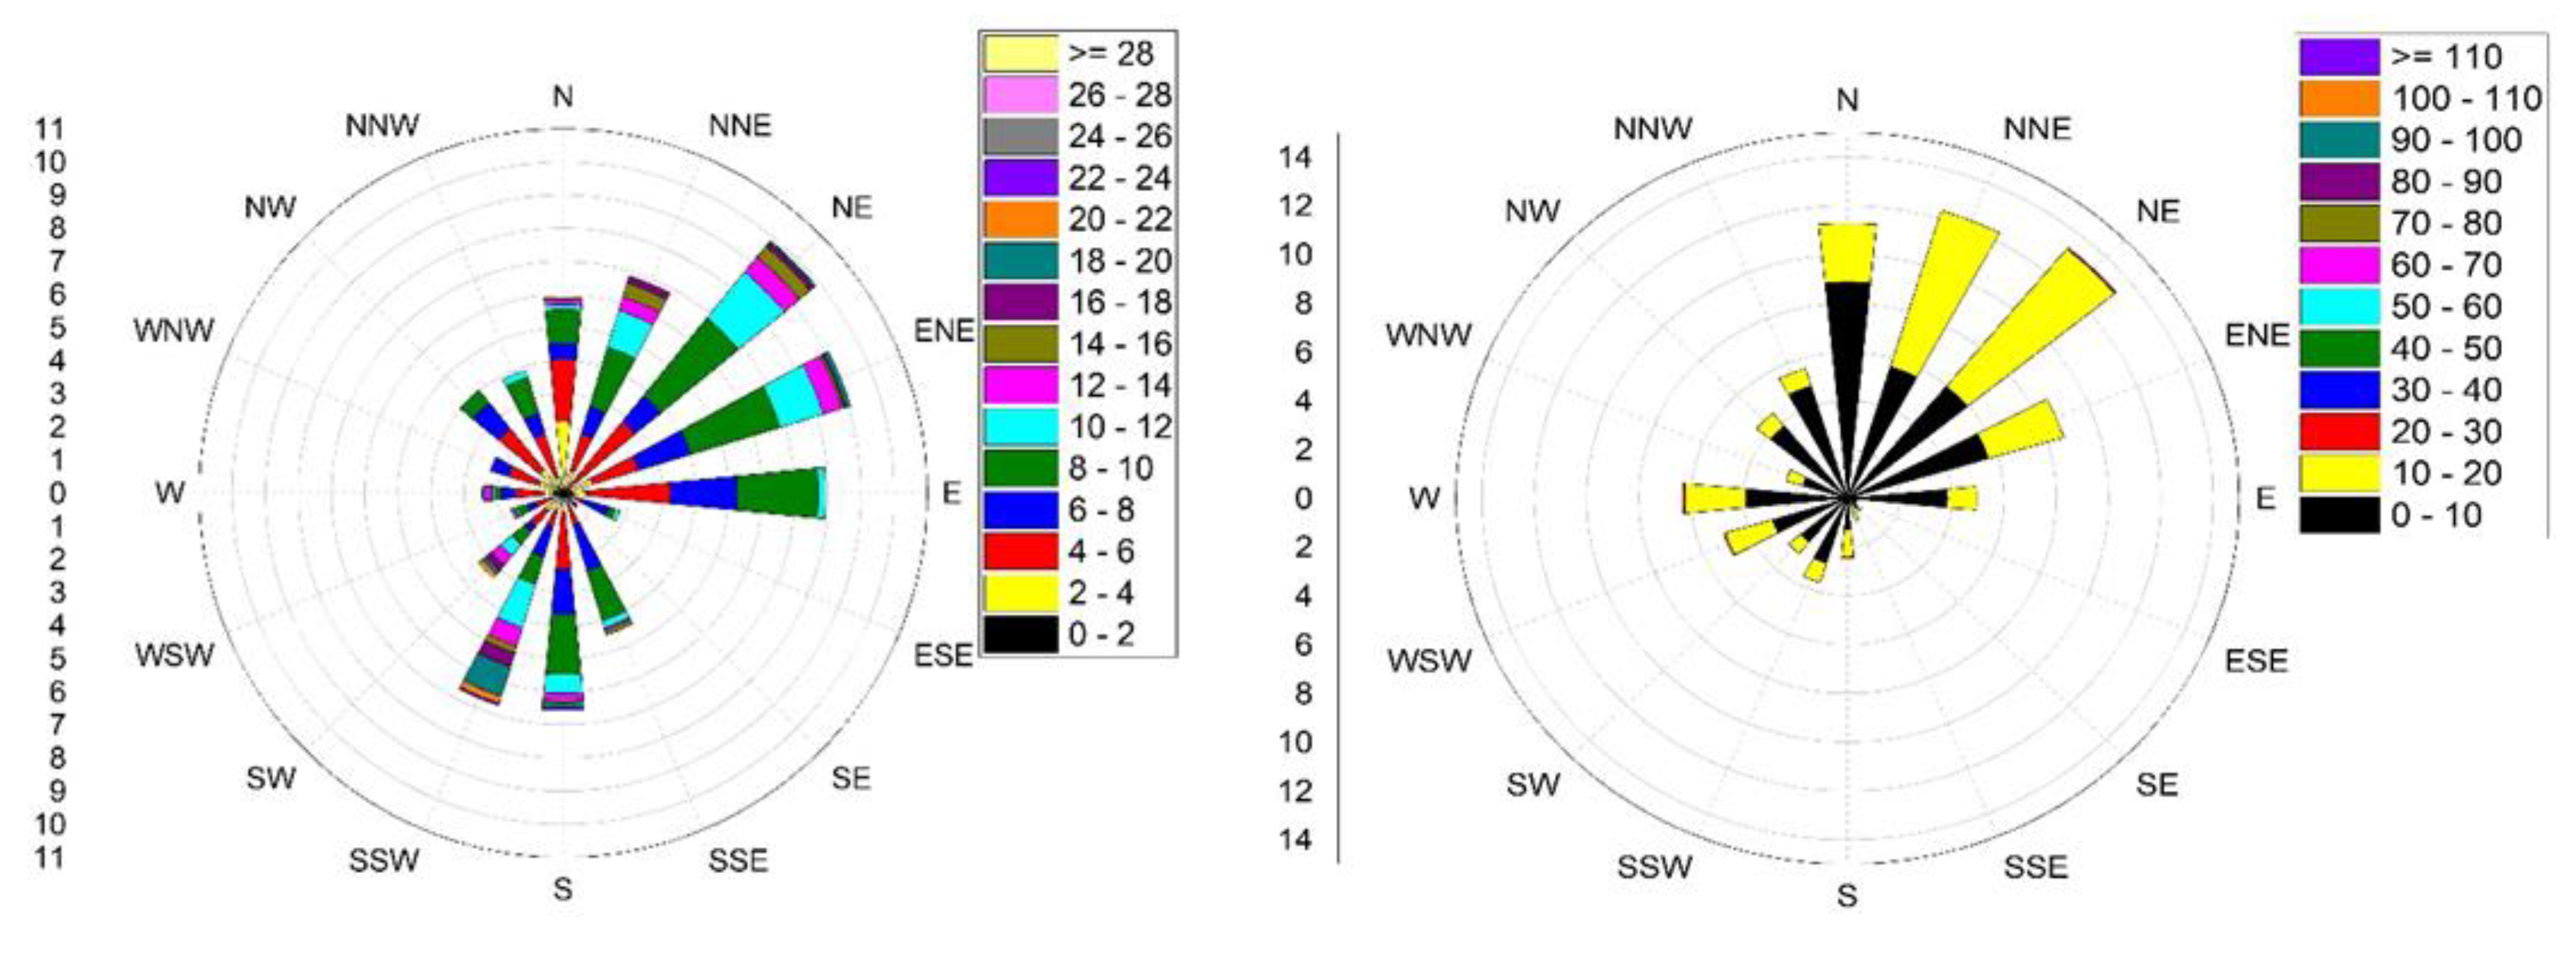
Figure 9 depicts variations in wind direction and speed corresponding to selected events with poor air quality (anomalous positive anomalies of concentrations). As illustrated, the wind blewpredominantly from the north, north-northeast, northeast, eastern, southern, and south-southeast directions in the month of January 2014, with the highest frequency coming from the northeast at around 10%, followed by the east (9%), and the east (7%). In February 2014, there wasa total wind speed of 0 to 20 knots, with 48% of the wind coming from the northeast, 12% from the north, 10% from the north-northwest, 8% from the east-northeast, and 6% from the west.
The analysis of Figure 8 and Figure 9 provides noteworthy observations regarding the atmospheric dynamics (synoptic-scale winds) that impact the levels of PM in Greater Cairo. The occurrence of positive air quality anomalies (i.e., poor air quality conditions) is mainly observed to align with wind advections that originate from the northeast and south directions. The aforementioned observation implies that the primary origins of PM and BC in the area are probably associated with sandstorms that arise from the southern region, in conjunction with discharges from the Helwan industrial complex situated in the southern vicinity of the urban agglomeration. Furthermore, the combustion of biomass in the delta region located in the northeastern part of the area (mainly from the two largest agricultural governorates in the country, namely Dakahliya and Sharkiya) could potentially make a substantial contribution to the heightened levels of PM and BC concentrations that have been detected in the vicinity of Greater Cairo. On the contrary, it seems that the negative air quality anomalies (i.e., improved air quality conditions) are mostly linked to wind advections originating from the northern and northwestern directions. From a geomorphological perspective, the northern regions of the western desert, particularly those located north of the Qattara Depression, lack significant sand formations. This indicates that the potential for these regions to generate or contribute to sandstorms is relatively low. The absence of such sand formations in the northern regions of the western desert limits the frequency and intensity of sandstorms in these regions.To conclude, in periods of decreased levels of PM, the Greater Cairo region is subject to the impact of winds emanating from the northern and northwestern sectors, a phenomenon that is commonly observed during the summer months. Further, enhanced advections from the southern and northeastern regions could be a contributing factor to increased levels of PM and BC. The complex correlation between air quality and wind direction has been extensively studied in the scientific literature [49,50]. Studies have revealed significant findings regarding the impact of prevailing winds on the dispersion and transportation of pollutants through the movement of air masses, revealing significant insights into the impact of varying wind directions on air quality. For example, Wang et al. [51] investigated the local and non-local sources of PM2.5 in Beijing and its role in exacerbating severe haze pollution. They indicated that regional and long-range transport of PM2.5, due to air masses advections, accounted for 16.4% of the observed concentrations in the city. Additionally, Creamean et al. [52] assessed how aerosol populations in Colorado, United States, can be influenced by aerosols transported over long distances, particularly those emitted from large sources such as wildfires in the Pacific Northwest.
5. Concluding Remarks
Greater Cairo is one of the largest megacities in Africa and the Middle East. The purpose of this paper is to discuss the temporal variability of PM with different diameters (1, 2.5, and 10) and their associations with BC across the city. The findings are based on information obtained from a reanalysis of the ECWMF data covering the period of 2003–2020. The reliability of the reanalysis data was assessed using observational data obtained from the Abbasiya station, which stands as the sole air quality observation site with accessible ground measurements. Data on wind direction and speed, in addition to the geopotential height field at 1000 and 250 hPa levels, were able to shed light on the connection between the temporal variation of air quality concentrations and atmospheric configurations. While we recognize that other meteorological variables, such as air temperature, humidity, and precipitation, can impact air pollution, our study focused on the relationship between geopotential height field, wind direction, and air pollution levels. These variables were chosen for analysis based on their known impact on pollutant transport and the availability of dependable data.
The main findings of this study can be summarized as the following:
- -
- ECWMF possesses the ability to accurately capture the spatiotemporal variability of PM10 across Greater Cairo.
- -
- Particles with diameters smaller than 2.5 microns (µm) could comprise a significant portion of PM10 in the Greater Cairo.
- -
- The concentrations of all PM were significantly higher during colder seasons, specifically winter, in comparison to warmer seasons (i.e., summer and spring).
- -
- There is a substantial and noteworthy increase in PM levels across most seasons between 2003 and 2020, while BC showed a declining trend.
- -
- The interannual variability of PM and BC indicates that spring had the greatest variation (high year-to-year variability) in PM concentrations, while summer was the season with the least variations (more stable conditions). This pattern may be explained by the high frequency of sandstorms during springtime and the dominance of anticyclonic conditions during summertime.
- -
- Except for winter, there was a consistent negative correlation observed between BC and PM levels in all other seasons. Winter was the only season with positive correlations between PM and BC, indicating a strong relationship between BC and PM, particularly for PM1.
- -
- Spring and winter had the highest concentrations of PM10, as well as 1000 and 250 hPa. On the other hand, summer exhibited the lowest concentrations for both.
- -
- PM1 showed the highest correlations with both 1000 hPa and 250 hPa, especially during wintertime.
- -
- The connections between dominant wind directions and the main source regions of pollutants were defined, indicating the main regional trajectories of transport on a seasonal basis.
- -
- Decreased PM levels in Greater Cairo are associated with winds from the northern and northwestern regions, while increased PM and BC levels are linked to advections from the southern and northeastern regions.
- -
- Incorporating knowledge of pollutant sources and their temporal variability is essential for sustainable urban planning and design across the city.
Overall, this study presents the first comprehensive evaluation of BC concentrations and their relationships to PM (1, 2.5, and 10) levels in Greater Cairo and their potential physical drivers using a relatively long dataset from 2003 to 2020. It provides some pertinent findings that can help local decision-makers in the city. Nonetheless, we believe that additional research is still required, most likely with the inclusion of additional reanalysis and remote sensing products to verify the validity of the obtained results, especially in the absence of ground measurements. Also, it is important to provide a more comprehensive assessment of the sources of pollution, their trajectories, and relative contributions to air quality status. By identifying the major sources of air pollution, such as industrial emissions, vehicular traffic, and biomass burning, policymakers can implement measures to reduce emissions from these specific sources, thereby effectively enhancing air quality. Also, as the urban environment is spatially heterogeneous across Greater Cairo, it would be interesting to link the spatial variability of air pollutants with the dominant land use/land cover (LULC) in the city as a future research topic. These potential developments can contribute to a more complete and accurate depiction of the status of air quality in the Greater Cairo region and its possible links to urban thermal characteristics.
Author Contributions
Conceptualization, W.D., A.M.E.K. and M.M.A.W.; methodology, W.D. and M.M.A.W.; formal analysis, W.D. and A.M.E.K.; writing—original draft preparation, W.D. and M.M.A.W.; writing—review and editing, W.D., M.M.A.W. and A.M.E.K.; visualization, W.D., M.M.A.W. and A.M.E.K.; supervision, A.H.O. and M.M.A.W. All authors have read and agreed to the published version of the manuscript.
Funding
This work has been supported administratively and financially by the Research Fund Unit, Mansoura University, Egypt (Project RP03FM05), entitled “Developing a high-resolution dataset for assessing future changes in drought and their impacts on hydrological budget and crop yield in the Nile Delta”.
Data Availability Statement
Data are available upon request from the corresponding author.
Acknowledgments
We acknowledge the Egyptian Environmental Affairs Agency (EEAA) for providing the PM10 concentration data used in this study. We also acknowledge the European Center for Medium-Range Weather Forecasts (ECMWF) for providing the reanalysis data employed in this work.
Conflicts of Interest
The authors declare no conflict of interest.
References
- Pepper, I.L.; Gerba, C.P.; Brusseau, M.L. Atmospheric pollution. In Environmental and Pollution Science; Elsevier: Amsterdam, The Netherlands, 2019; pp. 293–309. [Google Scholar]
- Manisalidis, I.; Stavropoulou, E.; Stavropoulos, A.; Bezirtzoglou, E. Environmental and health impacts of air pollution: A review. Front. Public Health 2020, 8, 14. [Google Scholar] [CrossRef] [PubMed] [Green Version]
- Kim, K.-H.; Kabir, E.; Kabir, S. A review on the human health impact of airborne particulate matter. Environ. Int. 2015, 74, 136–143. [Google Scholar] [CrossRef]
- Kumar, P.; Patton, A.P.; Durant, J.L.; Frey, H.C. A review of factors impacting exposure to PM2.5, ultrafine particles and black carbon in Asian transport microenvironments. Atmos. Environ. 2018, 187, 301–316. [Google Scholar] [CrossRef]
- Qiu, Z.; Lv, H.; Zhang, F.; Wang, W.; Hao, Y. Pedestrian exposure to PM2. 5, BC and UFP of adults and teens: A case study in Xi’an, China.Sustain. Cities Soc. 2019, 51, 101774. [Google Scholar] [CrossRef]
- Schraufnagel, D.E.; Balmes, J.R.; Cowl, C.T.; De Matteis, S.; Jung, S.H.; Mortimer, K.; Perez-Padilla, R.; Rice, M.B.; Riojas-Rodriguez, H.; Sood, A.; et al. Air pollution and noncommunicable diseases: A review by the Forum of International Respiratory Societies’ Environmental Committee, Part 2: Air pollution and organ systems. Chest 2019, 155, 417–426. [Google Scholar] [CrossRef] [PubMed]
- Yang, F.; Tan, J.; Zhao, Q.; Du, Z.; He, K.; Ma, Y.; Duan, F.; Chen, G. Characteristics of PM 2.5 speciation in representative megacities and across China. Atmos. Chem. Phys. 2011, 11, 5207–5219. [Google Scholar]
- Boucher, O.; Randall, D.; Artaxo, P.; Bretherton, C.; Feingold, G.; Forster, P.; Kerminen, V.M.; Kondo, Y.; Liao, H.; Lohmann, U.; et al. Clouds and Aerosols. In Climate Change 2013: The Physical Science Basis. Contribution of Working Group I to the Fifth Assessment Report of the Intergovernmental Panel on Climate Change; Cambridge University Press: Cambridge, UK, 2013; pp. 571–657. [Google Scholar]
- Cheng, Y.; Yu, Q.-Q.; Liu, J.-M.; Zhu, S.; Zhang, M.; Zhang, H.; Zheng, B.; He, K.-B. Model vs. observation discrepancy in aerosol characteristics during a half-year long campaign in Northeast China: The role of biomass burning. Environ. Pollut. 2021, 269, 116167. [Google Scholar] [CrossRef]
- Osman, T.; Divigalpitiya, P.; Arima, T. Effect of Governmental Housing Regulations on the Egyptian Housing Market: Focusing on Greater Cairo Metropolitan Region; Faculty of Human-Environment Studies; Kyushu University: Fukuoka, Japan, 2015. [Google Scholar]
- Abdelhafiz, A.S.; Mohammed, Z.; Ibrahim, M.E.; Ziady, H.H.; Alorabi, M.; Ayyad, M.; Sultan, E.A. Knowledge, perceptions, and attitude of Egyptians towards the novel coronavirus disease (COVID-19). J. Community Health 2020, 45, 881–890. [Google Scholar] [CrossRef]
- World Health Organization. Air Quality Guidelines: Global Update 2005: Particulate Matter, Ozone, Nitrogen Dioxide, and Sulfur Dioxide; World Health Organization: Geneva, Switzerland, 2006. [Google Scholar]
- Mahmoud, K.; Alfaro, S.; Favez, O.; Wahab, M.A.; Sciare, J. Origin of black carbon concentration peaks in Cairo (Egypt). Atmos. Res. 2008, 89, 161–169. [Google Scholar] [CrossRef]
- Theroux, P. Overland from Cairo to Cape Town. In Dark Star Safari; Houghton Mifflin Harcourt: Boston, MA, USA, 2004. [Google Scholar]
- Seth, S. Difference and Disease: Medicine, Race, and the Eighteenth-Century British Empire; Cambridge University Press: Cambridge, UK, 2018. [Google Scholar]
- Ahmed, S.O.; Mazloum, R.; Abou-Ali, H. Spatiotemporal interpolation of air pollutants in the Greater Cairo and the Delta. Egypt.Environ. Res. 2018, 160, 27–34. [Google Scholar] [CrossRef]
- Hereher, M.; Eissa, R.; Alqasemi, A.; El Kenawy, A.M. Assessment of air pollution at Greater Cairo in relation to the spatial variability of surface urban heat island. Environ. Sci. Pollut. Res. 2022, 29, 21412–21425. [Google Scholar] [CrossRef] [PubMed]
- Monks, P.S.; Archibald, A.T.; Colette, A.; Cooper, O.; Coyle, M.; Derwent, R.; Fowler, D.; Granier, C.; Law, K.S.; Mills, G.E.; et al. Tropospheric ozone and its precursors from the urban to the global scale from air quality to short-lived climate forcer. Atmos. Chem. Phys. 2015, 15, 8889–8973. [Google Scholar] [CrossRef] [Green Version]
- Czernecki, B.; Marosz, M.; Jędruszkiewicz, J. Assessment of machine learning algorithms in short-term forecasting of pm10 and pm2. 5 concentrations in selected polish agglomerations. Aerosol Air Qual. Res. 2021, 21, 200586. [Google Scholar] [CrossRef]
- Kim, B.-Y.; Lim, Y.-K.; Cha, J.W. Short-term prediction of particulate matter (PM10 and PM2. 5) in Seoul, South Korea using tree-based machine learning algorithms. Atmos. Pollut. Res. 2022, 13, 101547. [Google Scholar] [CrossRef]
- Marchetti, S.; Hassan, S.K.; Shetaya, W.H.; El-Mekawy, A.; Mohamed, E.F.; Mohammed, A.M.; El-Abssawy, A.A.; Bengalli, R.; Colombo, A.; Gualtieri, M.; et al. Seasonal variation in the biological effects of PM2. 5 from greater cairo. Int. J. Mol. Sci. 2019, 20, 4970. [Google Scholar] [CrossRef] [PubMed] [Green Version]
- Baklanov, A.; Molina, L.T.; Gauss, M. Megacities, air quality and climate. Atmos. Environ. 2016, 126, 235–249. [Google Scholar] [CrossRef]
- Salem, M.; Tsurusaki, N.; Divigalpitiya, P. Analyzing the driving factors causing urban expansion in the peri-urban areas using logistic regression: A case study of the greater Cairo region. Infrastructures 2019, 4, 4. [Google Scholar] [CrossRef] [Green Version]
- KHALIL, MOSTAFA MOHAMED ASHRAF AHMED MOHAMED. Retrofitting of an existing residential building in Cairo using green facade technology: Understanding the real benefits of a vertical forest concept in Egypt. Master Thesis, Scuola di Architettura Urbanistica Ingegneria delle Costruzioni, Milan, Italy, 2022; 128p. [Google Scholar]
- Forty, G. Desert Rats at War: North Africa. Italy. Northwest Europe; Air Sea Media: Kent, WA, USA, 2014. [Google Scholar]
- Chen, J. Rapid urbanization in China: A real challenge to soil protection and food security. Catena 2007, 69, 1–15. [Google Scholar] [CrossRef]
- Huzayyin, A.S.; Salem, H. Analysis of thirty years evolution of urban growth, transport demand and supply, energy consumption, greenhouse and pollutants emissions in Greater Cairo. Res. Transp. Econ. 2013, 40, 104–115. [Google Scholar] [CrossRef]
- Govender, P.; Sivakumar, V. Application of k-means and hierarchical clustering techniques for analysis of air pollution: A review (1980–2019). Atmos. Pollut. Res. 2020, 11, 40–56. [Google Scholar] [CrossRef]
- Callahan, C.W.; Schnell, J.L.; Horton, D.E. Multi-index attribution of extreme winter air quality in Beijing, China. J. Geophys. Res. Atmos. 2019, 124, 4567–4583. [Google Scholar] [CrossRef]
- Hamed, K.H.; Rao, A.R. A modified Mann-Kendall trend test for autocorrelated data. J. Hydrol. 1998, 204, 182–196. [Google Scholar] [CrossRef]
- Yue, S.; Wang, C.Y. Applicability of prewhitening to eliminate the influence of serial correlation on the Mann-Kendall test. Water Resour. Res 2002, 38, 4-1–4-7. [Google Scholar] [CrossRef]
- Burn, D.H.; Cunderlik, J.M.; Pietroniro, A. Hydrological trends and variability in the Liard River basin/Tendances hydrologiques et variabilité dans le basin de la rivière Liard. Hydrol. Sci. J. 2004, 49, 53–67. [Google Scholar] [CrossRef] [Green Version]
- Peña-Angulo, D.; Vicente-Serrano, S.M.; Domínguez-Castro, F.; Murphy, C.; Reig, F.; Tramblay, Y.; Trigo, R.M.; Luna, M.Y.; Turco, M.; Noguera, I.; et al. Long-term precipitation in Southwestern Europe reveals no clear trend attributable to anthropogenic forcing.Environ. Res. Lett. 2020, 15, 094070. [Google Scholar] [CrossRef]
- Ou, Y.; Li, Z.; Chen, C.; Zhang, Y.; Li, K.; Shi, Z.; Dong, J.; Xu, H.; Peng, Z.; Xie, Y.; et al. Evaluation of MERRA-2 aerosol optical and component properties over China using SONET and PARASOL/GRASP data. Remote Sens. 2022, 14, 821. [Google Scholar] [CrossRef]
- Di, Q.; Amini, H.; Shi, L.; Kloog, I.; Silvern, R.; Kelly, J.; Sabath, M.B.; Choirat, C.; Koutrakis, P.; Lyapustin, A.; et al. An ensemble-based model of PM2. 5 concentration across the contiguous United States with high spatiotemporal resolution. Environ. Int. 2019, 130, 104909. [Google Scholar] [CrossRef] [PubMed]
- Qin, W.; Zhang, Y.; Chen, J.; Yu, Q.; Cheng, S.; Li, W.; Liu, X.; Tian, H. Variation, sources and historical trend of black carbon in Beijing, China based on ground observation and MERRA-2 reanalysis data. Environ. Pollut. 2019, 245, 853–863. [Google Scholar] [CrossRef]
- Srimuruganandam, B.; Nagendra, S.M.S. Analysis and interpretation of particulate matter–PM10, PM2. 5 and PM1 emissions from the heterogeneous traffic near an urban roadway. Atmos. Pollut. Res. 2010, 1, 184–194. [Google Scholar] [CrossRef] [Green Version]
- Gao, J.; Tian, H.; Cheng, K.; Lu, L.; Zheng, M.; Wang, S.; Hao, J.; Wang, K.; Hua, S.; Zhu, C.; et al. The variation of chemical characteristics of PM2. 5 and PM10 and formation causes during two haze pollution events in urban Beijing, China. Atmos. Environ. 2015, 107, 1–8. [Google Scholar] [CrossRef]
- Leão, M.L.P.; Zhang, L.; da Silva Júnior, F.M.R. Effect of particulate matter (PM2. 5 and PM10) on health indicators: Climate change scenarios in a Brazilian metropolis. Environ. Geochem. Health 2023, 45, 2229–2240. [Google Scholar] [CrossRef]
- Wang, Z.; Wang, R.; Wang, J.; Wang, Y.; Donahue, N.M.; Tang, R.; Dong, Z.; Li, X.; Wang, L.; Han, Y.; et al. The seasonal variation, characteristics and secondary generation of PM2. 5 in Xi’an, China, especially during pollution events. Environ. Res. 2022, 212, 113388. [Google Scholar] [CrossRef] [PubMed]
- El Kenawy, A.M.; Hereher, M.; Robaa, S.M.; McCabe, M.F.; Lopez-Moreno, J.I.; Domínguez-Castro, F.; Gaber, I.M.; Al-Awadhi, T.; Al-Buloshi, A.; Al Nasiri, N.; et al. Nocturnal surface urban heat island over Greater Cairo: Spatial morphology, temporal trends and links to land-atmosphere influences. Remote Sens. 2020, 12, 3889. [Google Scholar] [CrossRef]
- Jafari, E.; Rezazadeh, M.; Bazrafshan, O.; Jamshidi, S. Spatiotemporal variability of sand-dust storms and their influencing factors in the MENA region. Theor. Appl. Climatol. 2022, 149, 1357–1371. [Google Scholar] [CrossRef]
- El-Wakil, S.A.; El-Metwally, M.; Gueymard, C. Atmospheric turbidity of urban and desert areas of the Nile Basin in the aftermath of Mt. Pinatubo’s eruption. Theor. Appl. Climatol. 2001, 68, 89–108. [Google Scholar] [CrossRef]
- Abdelhady, S.; Borello, D.; Shaban, A.; Rispoli, F. Viability study of biomass power plant fired with rice straw in Egypt. Energy Procedia 2014, 61, 211–215. [Google Scholar] [CrossRef] [Green Version]
- Zhang, R.; Jing, J.; Tao, J.; Hsu, S.C.; Wang, G.; Cao, J.; Lee, C.S.; Zhu, L.; Chen, Z.; Zhao, Y.; et al. Chemical characterization and source apportionment of PM 2.5 in Beijing: Seasonal perspective.Atmos. Chem. Phys. 2013, 13, 7053–7074. [Google Scholar]
- Jacobson, M.Z.; Von Krauland, A.K.; Burton, Z.F.; Coughlin, S.J.; Jaeggli, C.; Nelli, D.; Nelson, A.J.H.; Shu, Y.; .Smith, M.; Tan, C.; et al. Transitioning all energy in 74 metropolitan areas, including 30 megacities, to 100% clean and renewable wind, water, and sunlight (WWS). Energies 2020, 13, 4934. [Google Scholar] [CrossRef]
- Megahed, Y.; Cabral, P.; Silva, J.; Caetano, M. Land cover mapping analysis and urban growth modelling using remote sensing techniques in Greater Cairo Region—Egypt. ISPRS Int. J. Geo-Inf. 2015, 4, 1750–1769. [Google Scholar] [CrossRef] [Green Version]
- Zou, J.; Sun, J.; Ding, A.; Wang, M.; Guo, W.; Fu, C. Observation-based estimation of aerosol-induced reduction of planetary boundary layer height. Adv. Atmos. Sci. 2017, 34, 1057–1068. [Google Scholar] [CrossRef]
- Wang, L.; Hao, J.; He, K.; Wang, S.; Li, J.; Zhang, Q.; Streets, G.S.; FU, J.S.; Jang, C.Y.; Takekawa, H.; et al. A modeling study of coarse particulate matter pollution in Beijing: Regional source contributions and control implications for the 2008 Summer Olympics. J. Air Waste Manag. Assoc. 2008, 58, 1057–1069. [Google Scholar] [CrossRef] [PubMed]
- Perrone, M.R.; Becagli, S.; Orza, J.G.; Vecchi, R.; Dinoi, A.; Udisti, R.; Cabello, M. The impact of long-range-transport on PM1 and PM2. 5 at a Central Mediterranean site. Atmos. Environ. 2013, 71, 176–186. [Google Scholar] [CrossRef]
- Wang, Y.; Bao, S.; Wang, S.; Hu, Y.; Shi, X.; Wang, J.; Zhao, B.; Jiang, J.; Zheng, M.; Wu, M.; et al. Local and regional contributions to fine particulate matter in Beijing during heavy haze episodes. Sci. Total Environ. 2017, 580, 283–296. [Google Scholar] [CrossRef] [PubMed]
- Creamean, J.M.; Neiman, P.J.; Coleman, T.; Senff, C.J.; Kirgis, G.; Alvarez, R.J.; Yamamoto, A. Colorado air quality impacted by long-range-transported aerosol: A set of case studies during the 2015 Pacific Northwest fires. Atmos. Chem. Phys. 2016, 16, 12329–12345. [Google Scholar] [CrossRef] [Green Version]
Figure 1.
Location of the study domain and its topographical gradient. The location of Cairo Airport and Abbasiya observatories is plotted. The topographical gradient is represented based on the digital elevation model (DEM) at a spatial resolution of 30 m, provided by the US Geological Survey and retrieved from “https://www.usgs.gov/core-science-systems/ngp/3dep (accessed on 13 February 2023).

Figure 2.
Scatter plots summarizing the values from PM10 observation and those from PM10 reanalysis. Dots represent the 1st, 5th, 10th, 25th, 50th, 75th, 90th, 95th, and 99th percentiles of the data. The dotted line denotes the line of the best fit that approximates the scattered data. Results are presented for winter (a), spring (b), summer (c), fall (d), and annually (e).

Figure 3.
Averaged seasonal concentrations of PM (left) and BC (right) over Greater Cairo from 2003 to 2020. It should be noted that the World Health Organization (WHO) air quality guidelines recommend that the annual mean concentrations should not exceed 10 and 20 µg/m3 for of PM2.5 and PM10, respectively [39].

Figure 4.
Coefficient of variation ofseasonal PM (left) and BC (right) concentrations over Greater Cairo from 2003 to 2020.
Figure 4.
Coefficient of variation ofseasonal PM (left) and BC (right) concentrations over Greater Cairo from 2003 to 2020.

Figure 5.
Seasonal and annual changes in the PM and BC concentrations from 2003 to 2020. Only statistically significant trends (p < 0.05) are shown in bold.
Figure 5.
Seasonal and annual changes in the PM and BC concentrations from 2003 to 2020. Only statistically significant trends (p < 0.05) are shown in bold.

Figure 6.
Scatter plots showing the association between PM (1, 2.5, and 10) and BC over the period of 2003–2020. The best fitted regression model is illustrated. Only Pearson’s r given in bold is statistically significant at the 95% level (p < 0.05).
Figure 6.
Scatter plots showing the association between PM (1, 2.5, and 10) and BC over the period of 2003–2020. The best fitted regression model is illustrated. Only Pearson’s r given in bold is statistically significant at the 95% level (p < 0.05).

Figure 7.
Anomaly of mass concentrations of BC, PM1, PM2.5 and PM10 and the corresponding anomalies of 250 hPa and 1000 hPa. Anomalies are presented on the seasonal and annual scales. Anomalies were computed independently for each season as deviations from the long-term average (2003–2020).
Figure 7.
Anomaly of mass concentrations of BC, PM1, PM2.5 and PM10 and the corresponding anomalies of 250 hPa and 1000 hPa. Anomalies are presented on the seasonal and annual scales. Anomalies were computed independently for each season as deviations from the long-term average (2003–2020).

Figure 8.
Wind direction and speed corresponding to periods of anomalous negative concentrations of PM. Left panel refers to June 2014, while right panel denotes August 2014.
Figure 8.
Wind direction and speed corresponding to periods of anomalous negative concentrations of PM. Left panel refers to June 2014, while right panel denotes August 2014.

Figure 9.
Wind direction and speed corresponding to periods of anomalous positive concentrations of PM. Left panel refers to January 2014, whilst right panel denotes February 2014.
Figure 9.
Wind direction and speed corresponding to periods of anomalous positive concentrations of PM. Left panel refers to January 2014, whilst right panel denotes February 2014.


Table 1.
Summary of accuracy statistics used to validate the skill of reanalysis data in producing PM10 observations. Bold numbers denote statistically significant correlations at the 95% significance level (p < 0.05).
Table 1.
Summary of accuracy statistics used to validate the skill of reanalysis data in producing PM10 observations. Bold numbers denote statistically significant correlations at the 95% significance level (p < 0.05).
| Annual | Winter | Spring | Summer | Fall | |
|---|---|---|---|---|---|
| Bias | 1.55 | 38.86 | 6.42 | −28.94 | −16.03 |
| MAE | 46.41 | 57.03 | 37.04 | 42.85 | 47.86 |
| RMSE | 64.50 | 69.55 | 64.34 | 61.81 | 61.27 |
| Spearman’s rho | 0.46 | 0.63 | 0.50 | 0.16 | 0.39 |
Table 2.
Correlation coefficients between 250 hPa and 1000 hPa with mass concentrations of PM1, PM2.5, PM10, and BC. Bold numbers denote statistically significant correlations (p < 0.05).
Table 2.
Correlation coefficients between 250 hPa and 1000 hPa with mass concentrations of PM1, PM2.5, PM10, and BC. Bold numbers denote statistically significant correlations (p < 0.05).
| hPa | PM1 | PM2.5 | PM10 | BC | |
|---|---|---|---|---|---|
| Winter | 1000 hPa | 0.22 | 0.11 | 0.12 | −0.02 |
| 250 hPa | 0.56 | 0.42 | 0.36 | 0.69 | |
| Spring | 1000 hPa | −0.14 | −0.12 | −0.10 | 0.02 |
| 250 hPa | 0.23 | 0.18 | 0.16 | 0.18 | |
| Summer | 1000 hPa | −0.19 | −0.08 | −0.10 | −0.10 |
| 250 hPa | −0.27 | 0.33 | 0.27 | 0.27 | |
| Fall | 1000 hPa | 0.07 | 0.49 | 0.47 | 0.47 |
| 250 hPa | −0.45 | −0.08 | −0.07 | −0.07 | |
| Annual | 1000 hPa | 0.29 | 0.18 | 0.17 | 0.02 |
| 250 hPa | 0.32 | −0.21 | 0.37 | 0.35 |
Disclaimer/Publisher’s Note: The statements, opinions and data contained in all publications are solely those of the individual author(s) and contributor(s) and not of MDPI and/or the editor(s). MDPI and/or the editor(s) disclaim responsibility for any injury to people or property resulting from any ideas, methods, instructions or products referred to in the content. |
© 2023 by the authors. Licensee MDPI, Basel, Switzerland. This article is an open access article distributed under the terms and conditions of the Creative Commons Attribution (CC BY) license (https://creativecommons.org/licenses/by/4.0/).
Share and Cite
MDPI and ACS Style
Dawoud, W.; El Kenawy, A.M.; Abdel Wahab, M.M.; Oraby, A.H. Temporal Variability of Particulate Matter and Black Carbon Concentrations over Greater Cairo and Its Atmospheric Drivers. Climate 2023, 11, 133. https://doi.org/10.3390/cli11070133
AMA Style
Dawoud W, El Kenawy AM, Abdel Wahab MM, Oraby AH. Temporal Variability of Particulate Matter and Black Carbon Concentrations over Greater Cairo and Its Atmospheric Drivers. Climate. 2023; 11(7):133. https://doi.org/10.3390/cli11070133
Chicago/Turabian StyleDawoud, W., Ahmed M. El Kenawy, M. M. Abdel Wahab, and A. H. Oraby. 2023. "Temporal Variability of Particulate Matter and Black Carbon Concentrations over Greater Cairo and Its Atmospheric Drivers" Climate 11, no. 7: 133. https://doi.org/10.3390/cli11070133
Note that from the first issue of 2016, this journal uses article numbers instead of page numbers. See further details here.