Article

Extreme Coastal Water Levels Evolution at Dakar (Senegal, West Africa)

1
Laboratory Leïdi “Dynamics of the Territories and Development”, Department of Geography, University Gaston Berger, Saint-Louis BP 234, Senegal
2
Laboratory of Geophysical and Oceanographic Spatial Studies, University of Toulouse/CNRS/IRD/CNES, CEDEX 9, 31999 Toulouse, France
3
Laboratory of Biostratigraphy and Sedimentology, Department of Geology, Faculty of Science and Technology, Cheikh Anta Diop University of Dakar, Dakar BP 5005, Senegal
4
Laboratory of Applied Remote Sensing, Institute of Earth Sciences, Cheikh Anta Diop University of Dakar, Dakar BP 5005, Senegal
5
Faculty of Arts and Social Sciences, Canada Department of History and Geography, University of Moncton, Moncton, NB E1A 3E9, Canada
6
Université Amadou Mahtar Mbow de Dakar, Dakar BP 45927, Senegal
7
Normandie Université, UNIROUEN, UNICAEN, CNRS, M2C, 76000 Rouen, France
8
Laboratory of Oceanography, Environmental Sciences and Climate (LOSEC), University Assane Seck, Ziguinchor BP 523, Senegal
*
Author to whom correspondence should be addressed.
Climate 2023, 11(1), 6; https://doi.org/10.3390/cli11010006
Submission received: 22 November 2022 / Revised: 20 December 2022 / Accepted: 23 December 2022 / Published: 26 December 2022
(This article belongs to the Special Issue Severe Weather Disasters)

Abstract

:
Increasingly, it is reported that the coastline of the Dakar region is affected by coastal flooding due to extreme water levels during wave events. Here, we quantify the extreme coastal water levels as well as the different factors contributing to coastal flooding during the period 1994–2015. Severe water levels reach values of 1.78 m and increase by 8.4 mm/year. The time spent above this threshold has already increased by 1.7 over the study period and will increase by 2100 to 8 times with 0.4 m mean sea level rise and up to 20 times with 0.8 m in the IPCC low and high greenhouse gas emission scenarios, respectively. Tide is the main contributor to the extremes when combined with large wave runup, due to wave breaking which contributes to 38% of the increase in extreme events while sea level rises to 44%. Our results show that because of its prominent location, Dakar region is affected by waves coming from the Northern and Southern Hemispheres with contrasted evolutions: wave runup events increase faster (7 mm/year) during austral winter due to a maximum of the South Atlantic storm activity, and have a decreasing trend (−3 mm/year) during boreal winter (December, January, February) driven by the evolution of corresponding climate modes.

1. Introduction

In a global context marked by global warming leading to an increasing sea level rise of 3.4 mm/year, coastal areas are increasingly threatened by erosion and marine submersion risks [1,2,3]. Coastlines are vulnerable to the effects of climate change on a global scale due to sea level rise, and on a regional scale due to changes in wave climate [4,5,6,7]. In regions marked by low sea level change, a 10 cm rise could double the frequency of coastal flooding over much of the Indian Ocean, South Atlantic, and tropical Pacific [8]. These coastal floods occur due to a combination of oceanic and atmospheric factors [9,10]. They are abrupt events with diverse social, economic, cultural, heritage, morphogenic, and also ecosystem impacts [11]. Extreme events have immediate and noticeable impacts on the coast, unlike longer-term mean sea level changes [12]. According to [13], storms are among the most important driving forces inducing morphological changes in beaches and are a significant hazard threatening coastal issues. Today, many studies on modeling extreme coastal events show that recurrent events generating more frequent and severe coastal flooding are to be expected [8,14], and this will undoubtedly increase the vulnerability of coastal communities. Indeed, more than 300 million people residing in low-lying coastal areas are directly or indirectly exposed to coastal storms, causing USD tens of billions (US dollars) in damage annually [15]. Storms are among the most devastating coastal hazards in the world, causing numerous fatalities as well as severe socioeconomic consequences each year [16]. In fact, between 1980 and 2000 tropical cyclone storms killed 250,000 people, and each year about 120 million people are exposed to cyclone hazards. Today, they are the leading cause of natural disasters in the world [17,18].
The African continent is particularly exposed to coastal risks [19] because it is largely made up of low sandy coasts [20] and is highly anthropized and not benefiting from sufficient protective structures [21]; the risk of marine submersion is a real threat for large cities in the context of climate change because of the increase in sea level [22] that should give the local figure for annual increase in sea level. According to [23], Alexandria, Algiers, Casablanca, and Tunis are particularly vulnerable. According to [24], the issue of coastal flooding is also important in Central Africa, as most West African coasts are open to the Atlantic coastline according to [25] and [26].
Like other African coasts, Senegal’s low-lying coasts show signs of increased vulnerability to coastal flooding. According to [27], marine submersion is a problem of varying intensity along Senegal’s coasts, with the cities of Saint-Louis and Dakar being the most exposed. Coastal flooding often occurs on low-lying coasts [28,29], when the total water level (TWL) at the coast is higher than the land elevation [27]. Like St. Louis, Dakar has an increased vulnerability to coastal flooding, which has been recurrent since 2005 [30]. They can be caused there by rainy episodes and meteorological events. Settled in part in wet depressions known as Niayes [31], and experiencing galloping urbanization, Dakar is indeed highly vulnerable to the risks of coastal and rainfall flooding in a context of climate change marked by a recurrence of extreme events [32]. According to [33], this vulnerability is attributable to natural hazards, uncontrolled urbanization and the failure of land-use policies. The authors of [34] also judge that beyond climate dynamics the problem of flooding in Dakar is mainly due to the urbanization of non aedificandi areas at risk that should be inconstructible. According to [27], the people affected by coastal flooding in Dakar would have been between 1500 and 2000 people per year in 2018. This number could reach 20% of the population of Dakar by 2050 and 80% by 2100. This situation shows the importance of studying and understanding coastal flooding on the Senegalese coast, particularly in Dakar. In addition, in the context of ongoing climate change and the prediction of increased climate instability, the delineation of flood-prone areas for a given climate hazard is a scientific issue with strong societal implications [35]. Unfortunately, in Senegal the works on extreme weather–marine events and their modeling are very few in comparison to the issue [36]. However, this issue is an important element in the protection of coastal communities and their activities, as information on vulnerability to coastal flooding is essential to the decision-making logic and development of policies to protect coastal communities and assets [37].
The coastline of Dakar with its particular geological, geomorphological and human characteristics does not escape the phenomenon of coastal flooding. The vulnerability of a coastline depends on the geological and topographical context [38]. Indeed, this coastline, established on a low gradient and sandy facies, has the characteristics of a coastal space at risk and we observed recurring trends of extreme situations in 2007, 2009, 2011 and 2014 [39]. However, through these different storm events it is unanimously agreed that the issue of the vulnerability of the Dakar coastline to the risks of submersion and erosion is increasing steadily.
Within this context this study aims to provide the key components of coastal water level in Dakar and is a call to better understand how they impact the coast, and also refine the needs and policies in terms of protection in a country where this documentation is missing, preventing any efficient data-based sustainable coastal management strategy [11,21]. This article specifically aims to quantify, over the period 1994–2015, the extreme level of coastal waters for Dakar to contribute to the knowledge of the vulnerability of this site to coastal flooding, and better understand the various factors acting.

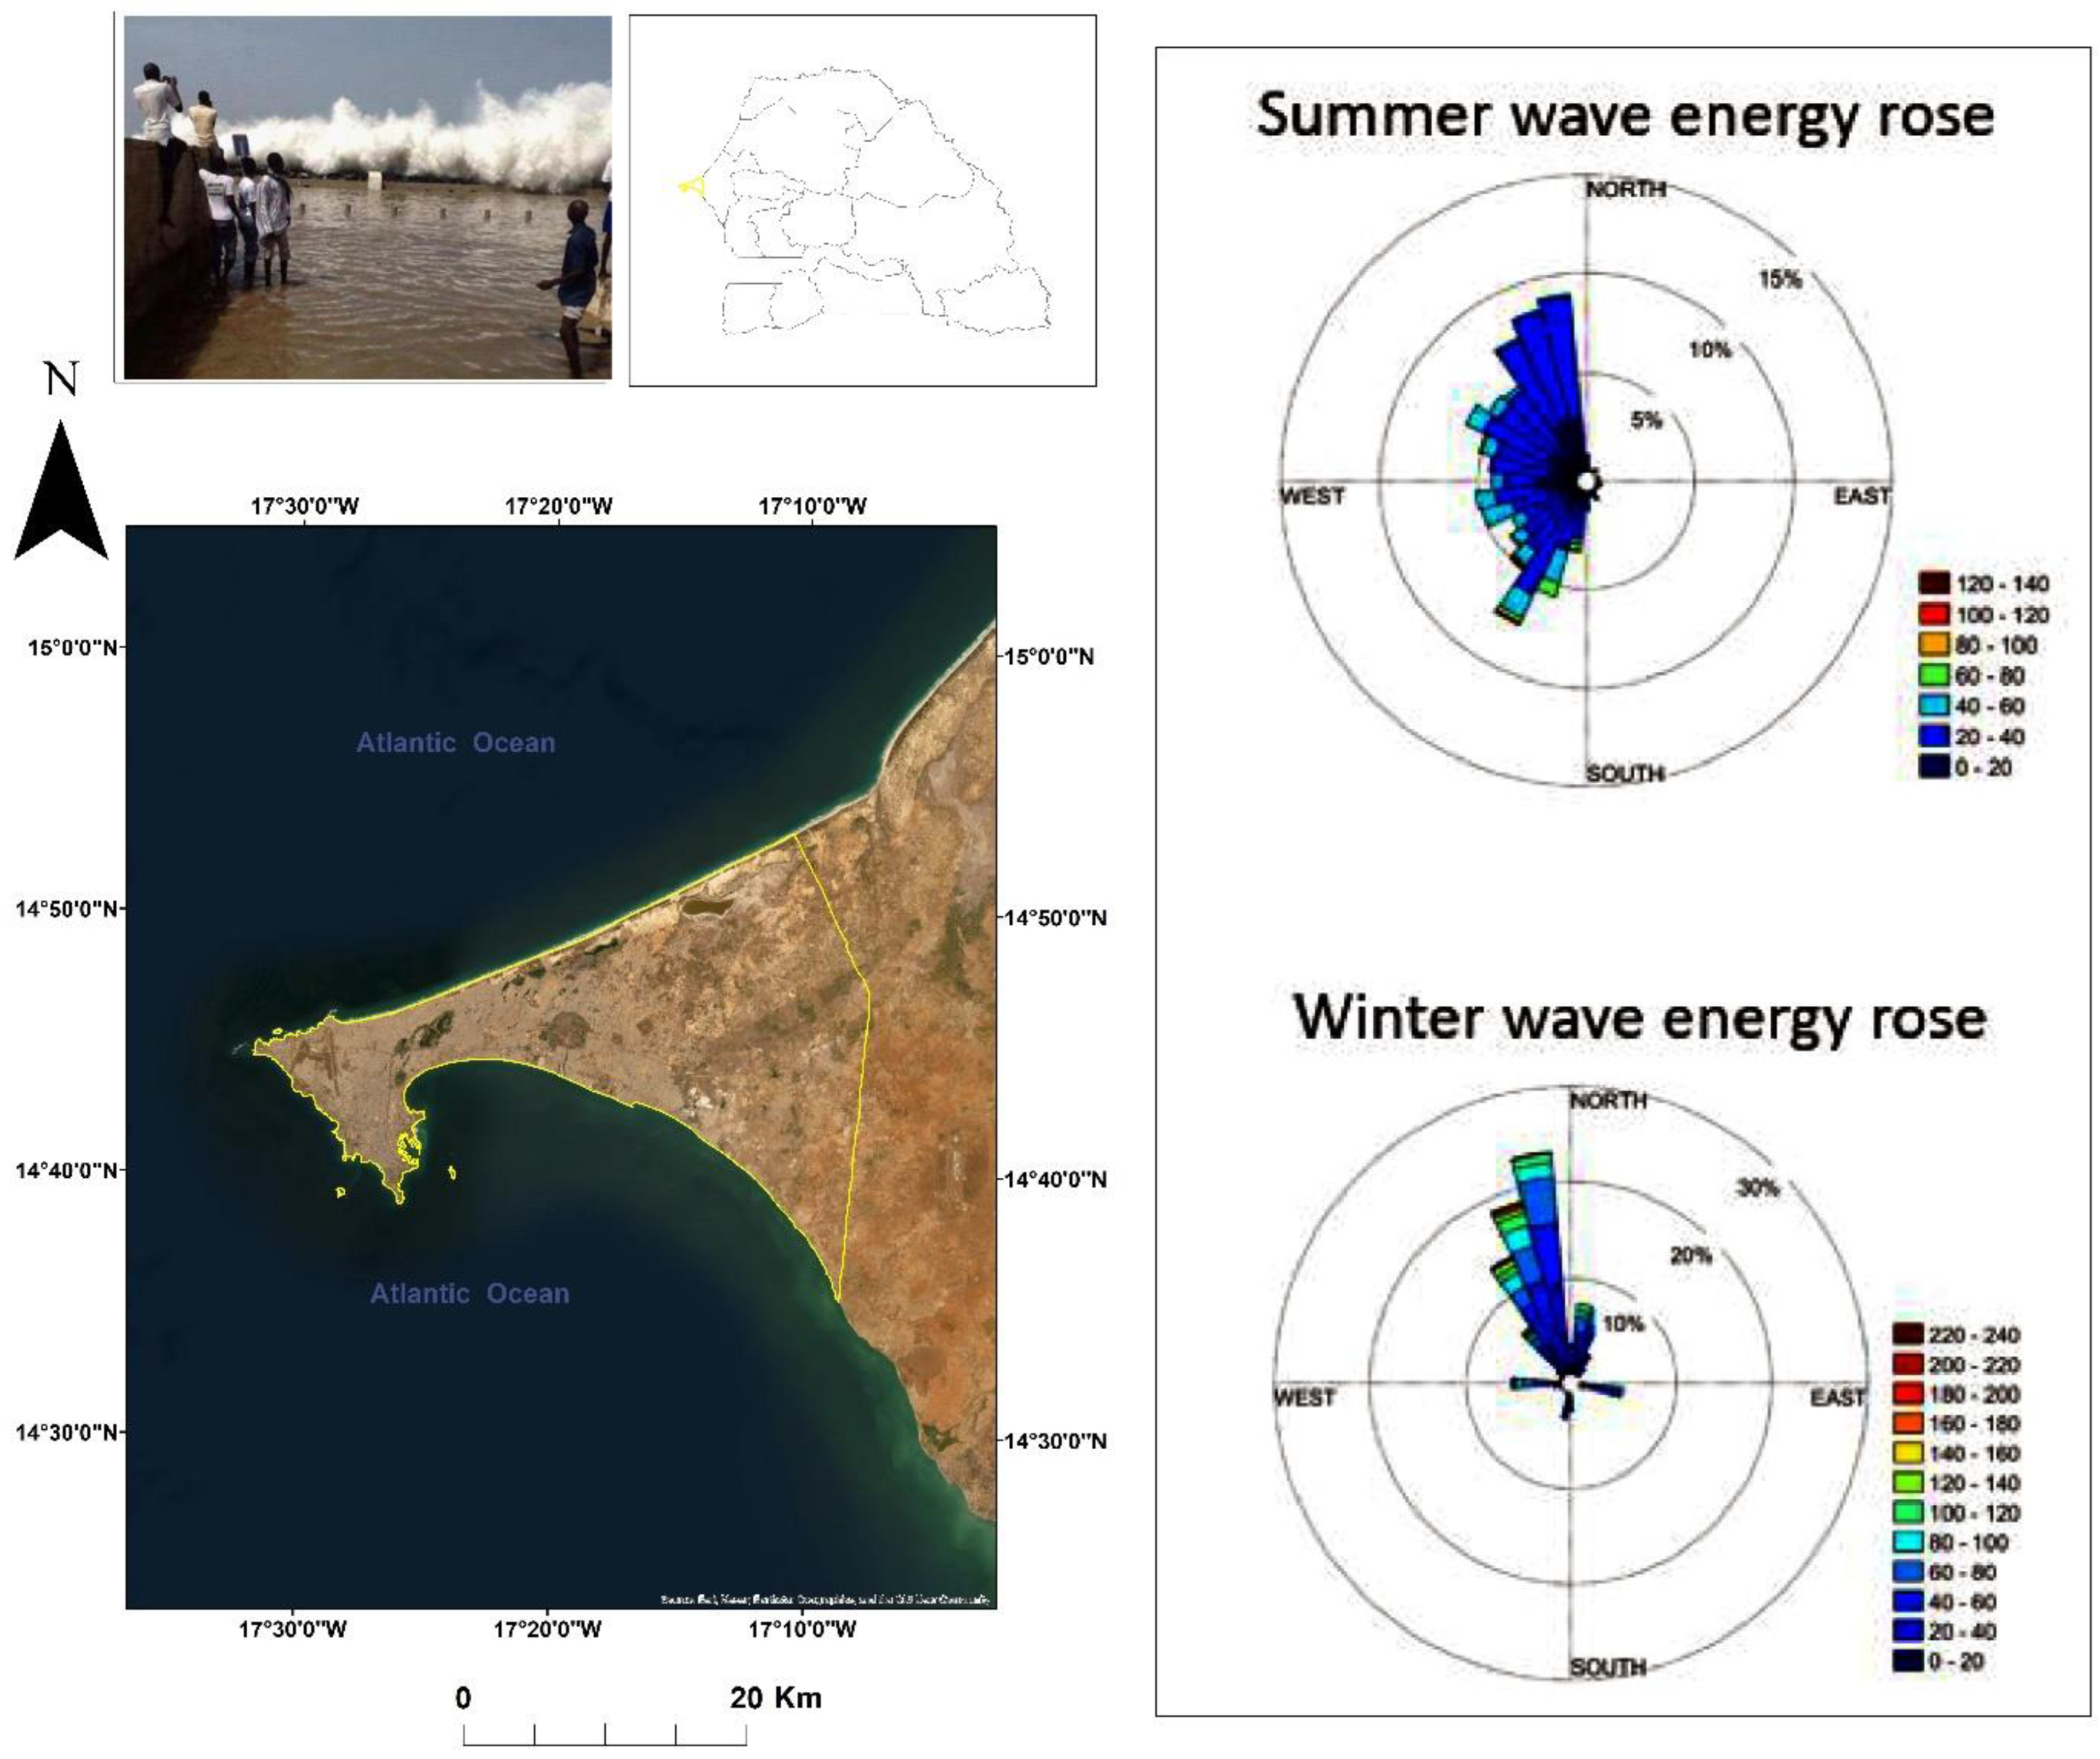
2. Presentation of the Study Area

The coastline of the city of Dakar is located south of the Cape Verde peninsula (Figure 1) on the Atlantic Ocean coastline. Its geographical position constitutes a considerable asset for its economic influence and the diversity of its ecosystems with its 133 km of coastline, along which are present two types of environment: the rocky and sandy coasts which occupy more than half of the coastline [40]. It is a highly urbanized site with the presence of human settlements and coastal issues. This situation, combined with its geomorphological characteristics, explains its vulnerability to the risk of marine submersion. The south-facing coast corresponds to the collapsed part of a fault, explaining its high vulnerability to extreme marine weather events. This tectonic feature is also a decisive factor in explaining the vulnerability of the Dakar coastline.
Two types of swell approach the Senegalese coasts, particularly the Dakar coast, namely the northwest swell and the southwest swell [26]. It is noteworthy that Senegal can be seen as a storm free coast. Wave energy in Senegal is dominated by swell, coming remotely from the generation zones at mid to high latitudes. The swells of northwest direction come from the North Atlantic and are almost present all year round. On an annual scale the swells reaching the coast come mainly from the northwest. The action of this swell is felt differently at the level of the Small (South) and Great Senegalese Coast (North). Located south of the Cape Verde peninsula, the Petite Côte is weakly impacted by the action of northwest swells because they are subject to the full force of the phenomenon of diffraction at the approach of the Cape Verde peninsula, on the one hand, against a refraction in contact with the bottom of Goree Bay [42,43]. Swells of the southwest direction come from the South Atlantic, and are almost always observed during the rainy season. The energy released by these swells is very important. Except for the refraction caused by the high seabed of the continental shelf of the Petite Côte, most of the energy of this swell reaches the coast [44]. Observed from July, they reach their maximum power in August and September. More energetic, they can cause coastal flooding when they participate in storm surges and play an important role in the coastal erosion process of the Petite Côte [42]. This explains the increase in storm surges observed during the winter period [39].

3. Materials and Methods

3.1. Hydrodynamic and Meteorological Data

Quantification of extreme coastal water levels requires the availability of hydrodynamic, meteorological and tidal parameters. Tide data were extracted at the closest grid point from the global tide FES2014 model (Finite Element Solution, [45] at hourly resolution gridded worldwide at a 1/16° resolution and produced by Laboratory of Geophysical and Oceanographic Spatial Studies of Toulouse (LEGOS). Storm surge (DAC) due to atmospheric pressure and winds are produced by the Collecte Localisation Satellites (CLS) Space Oceanography Division using the MOG2D model from LEGOS and distributed by AVISO (Archiving, Validation and Interpretation of Satellite Oceanographic data), with support from Centre National d’Etudes Spatiales (CNES) (http://www.aviso.altimetry.fr/ accessed on 21 November 2022). Altimetric-derived SLA, including global mean level rise, is extracted at the closest altimetry gridded data point from AVISO and it corresponds to offshore regional sea level [46]. ERA-Interim reanalysis data (global climate and weather data available from 1979 onward) at a 0.5° × 0.5° resolution developed by the European Center for Medium-Range Weather Forecasting (ECMWF) model are used for waves data at a 6-h resolution over the 1994–2015 period. Wave runup R is computed following the dissipative beach form of Stockdon et al. 2006 (see [2]) (Equation (1)):
R = 0.043 H s L o
where Hs and Lo are offshore significant wave height and wavelength.
All the above parameters were resampled hourly during the period 2014–2015. All hydrodynamic data used in this study are globally available and all are extracted at the closest point to the city of Dakar (latitude 14.71°, longitude −17.46°) at the corresponding grids, which here ensures a maximum distance of 50 km from the coarsest grid. These correspond to offshore forcing and do not reflect the complex local coastal processes that may occur (i.e., interactions, wave refraction, morphological changes; see [47,48].

3.2. Quantification of Extreme Coastal Water Level (ECWL)

To quantify the extreme coastal water level at Dakar, we used the formula of [2] (Equation (2)):
ECWL = SLA + DAC +T + R
The extreme levels are generated following the combination of several parameters: this model incorporates the sea level anomaly (SLA), the height of the storm surge (DAC) due to atmospheric pressure and winds, the level of the astronomical tide (T) and the height of wave breaking (R).
In order to physically determine the severity of the heights reached by the sea we sought to identify the water levels corresponding to the top 2%, thus the 98th percentile, hence the classification of water levels and the determination of the value of 1.78 m. Noteworthy, this extreme value threshold is defined from purely hydrodynamic considerations and does not reflect flooding occurrence, which requires an accurate digital elevation model (e.g., Lidar, on-demand satellite) available for the topography of Dakar, which is missing. Here, we quantify the total extreme coastal water level and establish the relative weight of the parameters of the [2] equation in the ECWL, and finally compute the evolution of the total annual duration of occurrence of these very high water levels.
The contributing components during the severe events are computed as their yearly averaged values during moments exceeding the 98th percentile ECWL threshold value. To study the trend of extremes on the basis of annualized data, a linear regression is used and the Mann–Kendall significance test is performed to test the null hypothesis together with a p-value, used here with a 95% level. The contribution of each driver to the trend is computed using a linear separation of each component from the ECWL overall trend.

4. Results

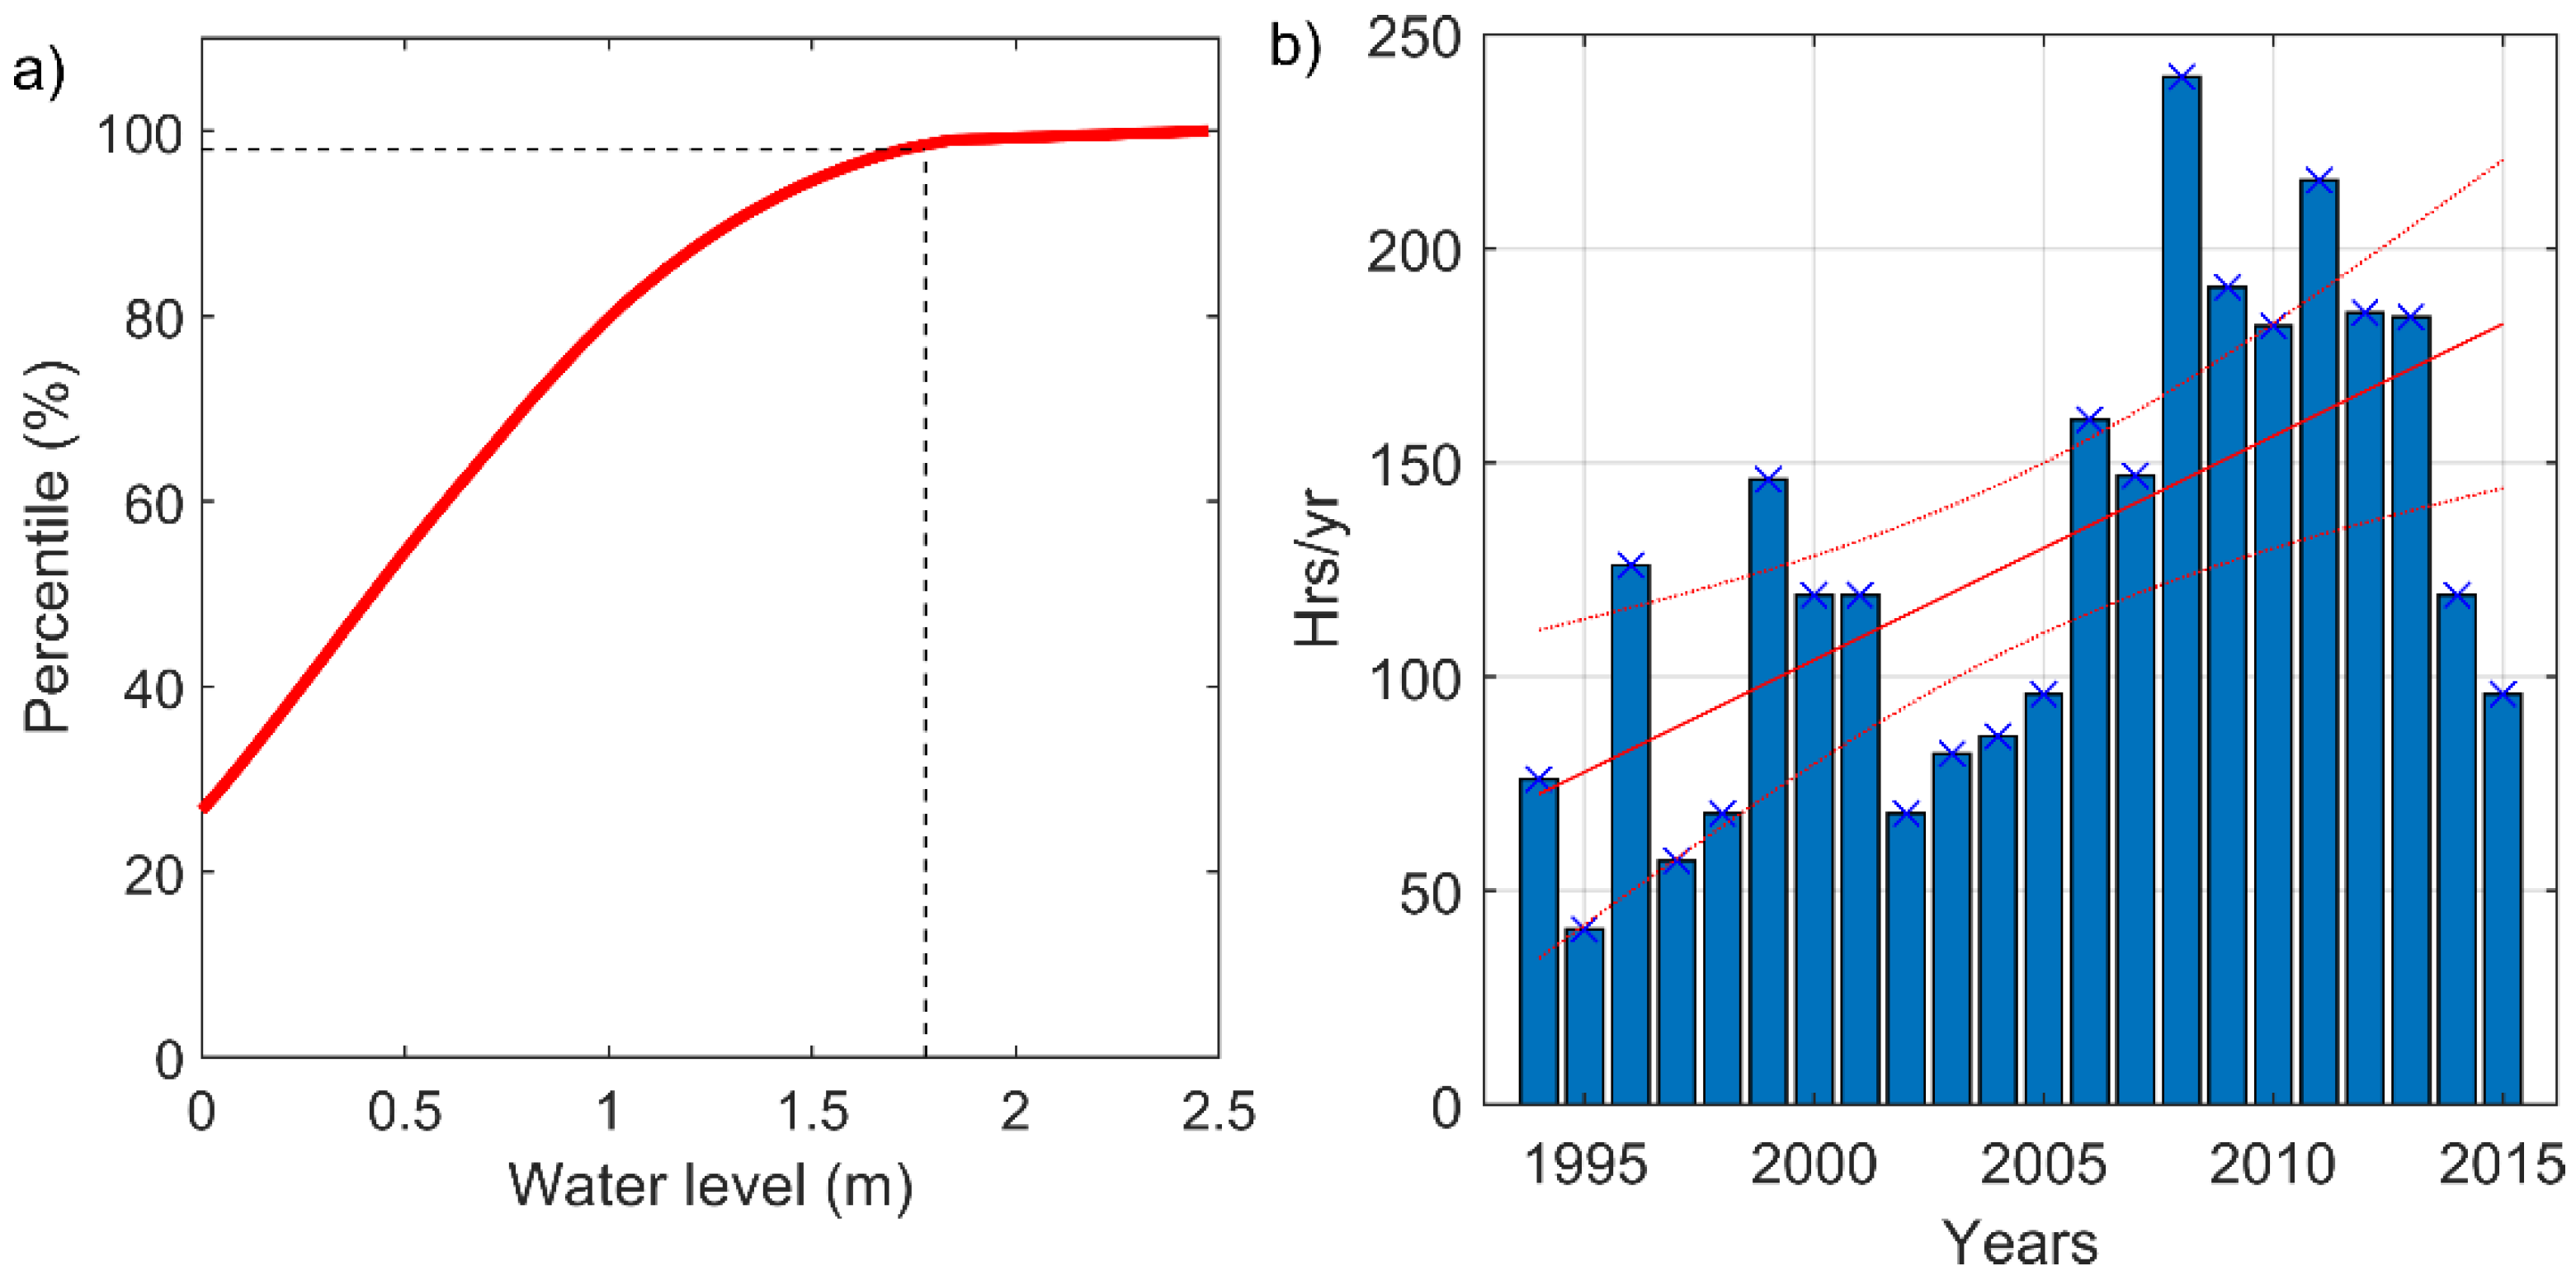
4.1. The Occurrence of Coastal Flooding

Figure 2b shows the interannual variability of the temporal occurrence of the extreme water level corresponding to the 98th percentile at Dakar. At this site, the maximum duration of the 1.78 m level was 148 h between 1995 and 2000, but after 2005 there are seven years out of ten where it exceeds 150h, with a maximum value of 248 h in 2008 (Figure 2b). This reflects an increase in the total annual duration of extreme sea levels, and probably in the temporal frequency of coastal flooding Dakar.

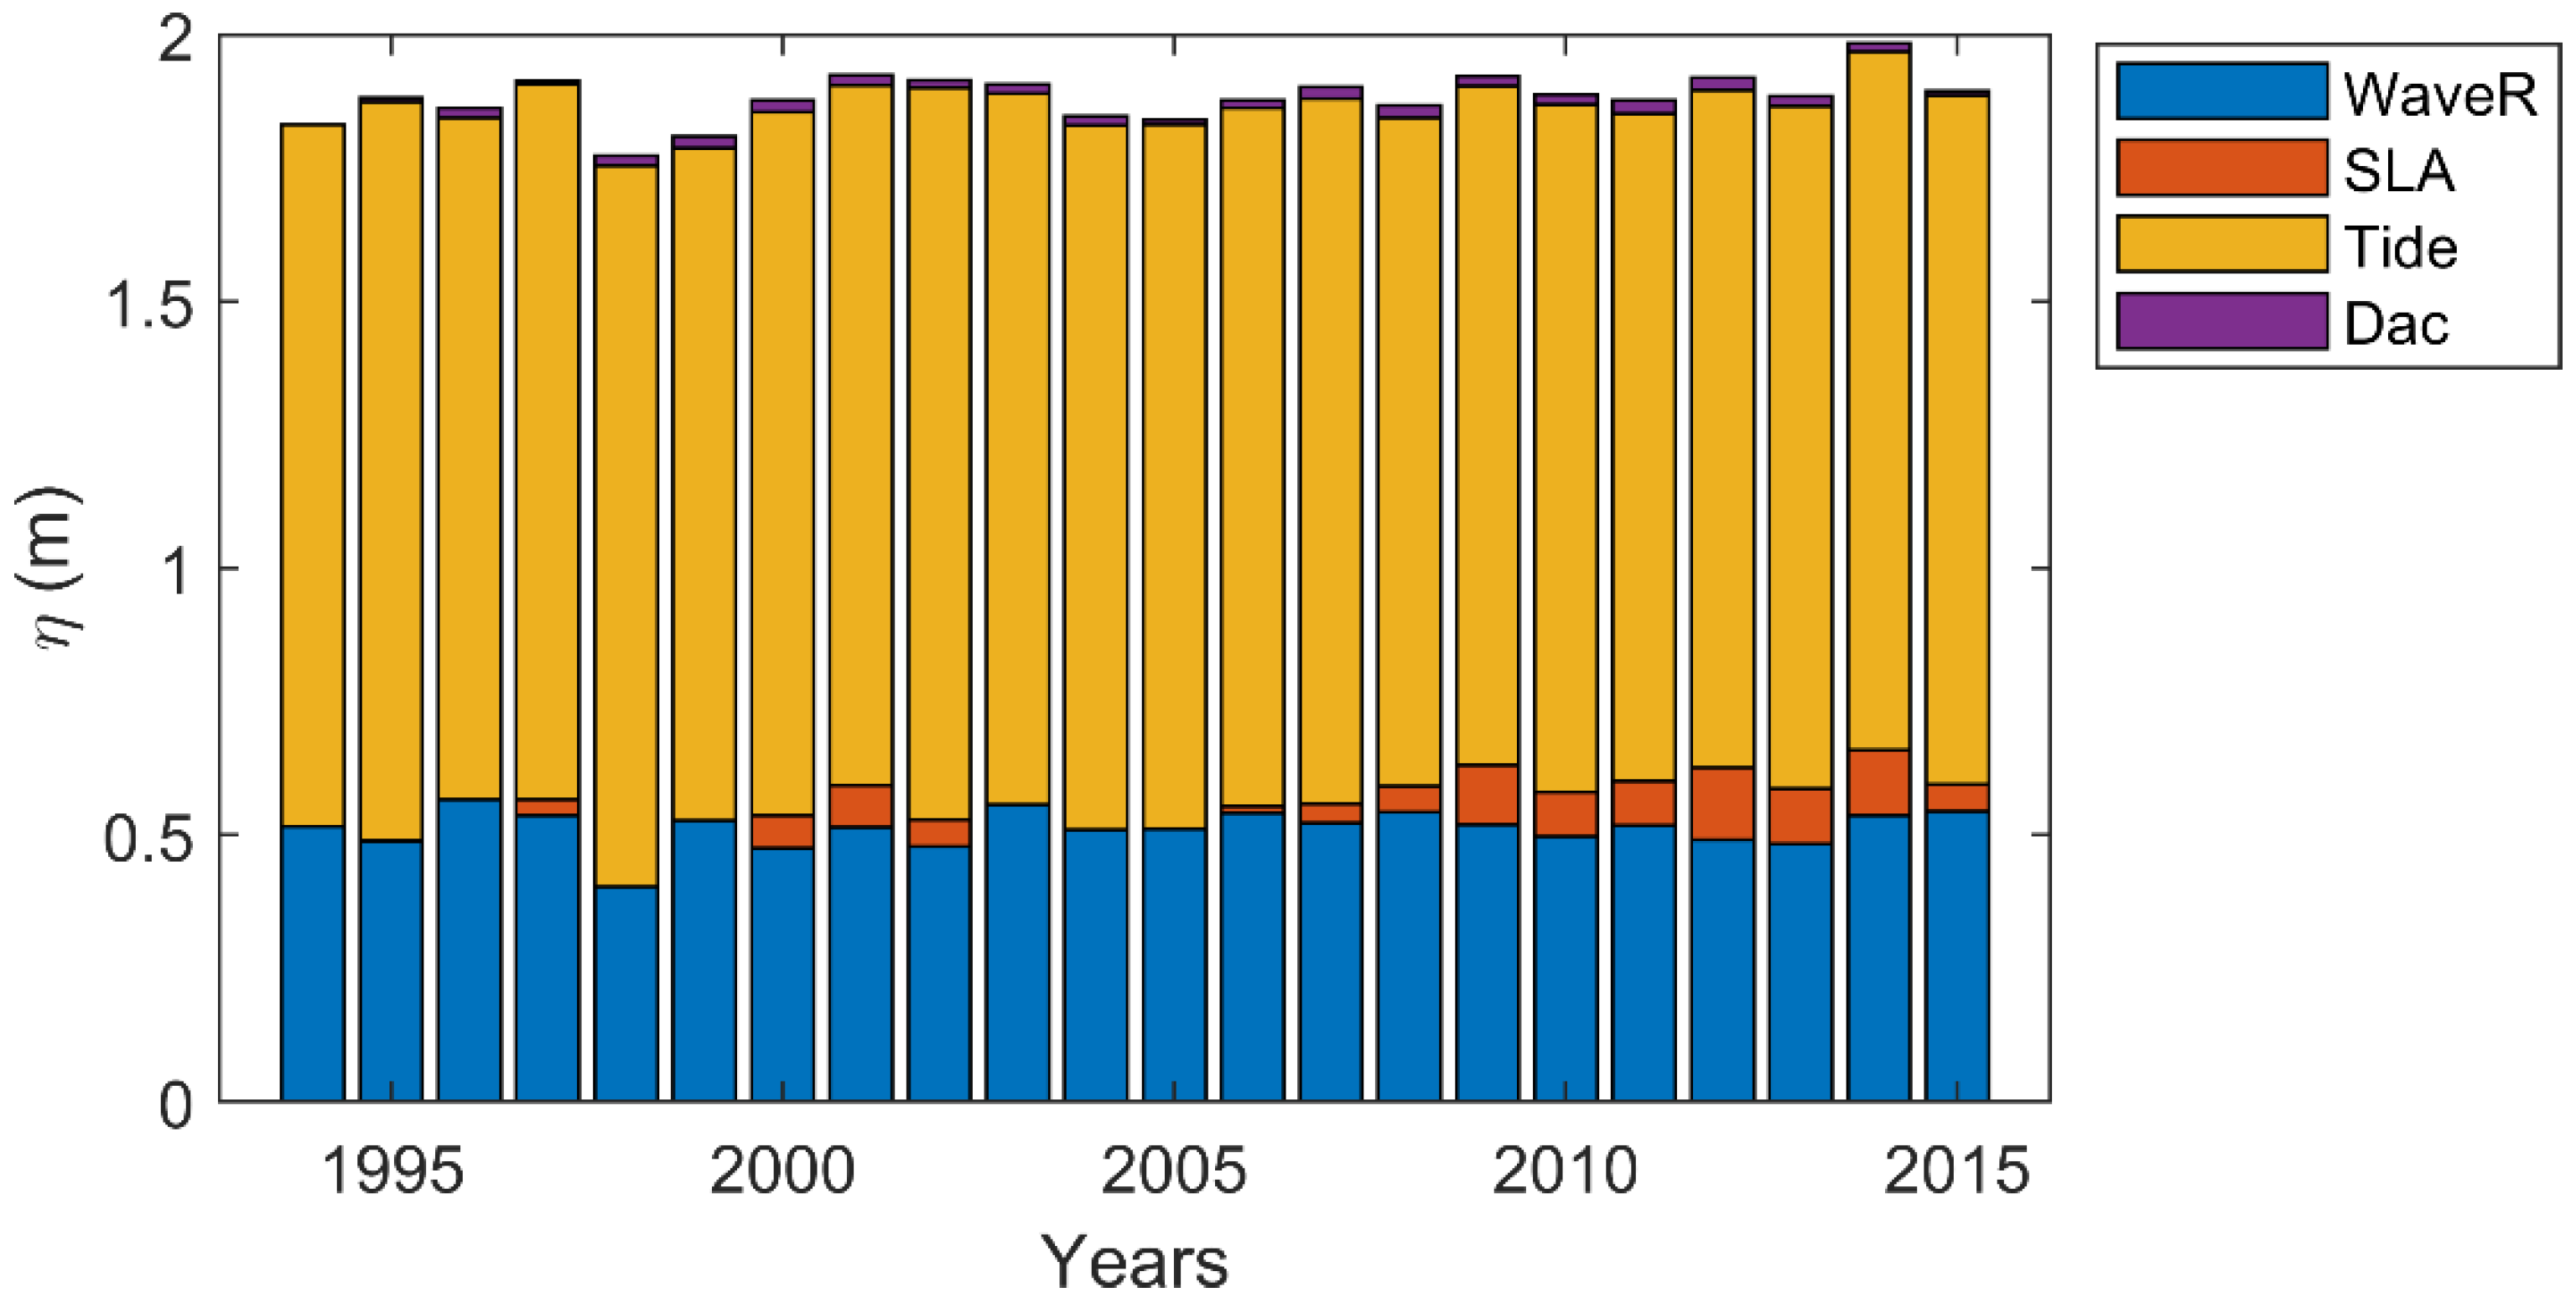
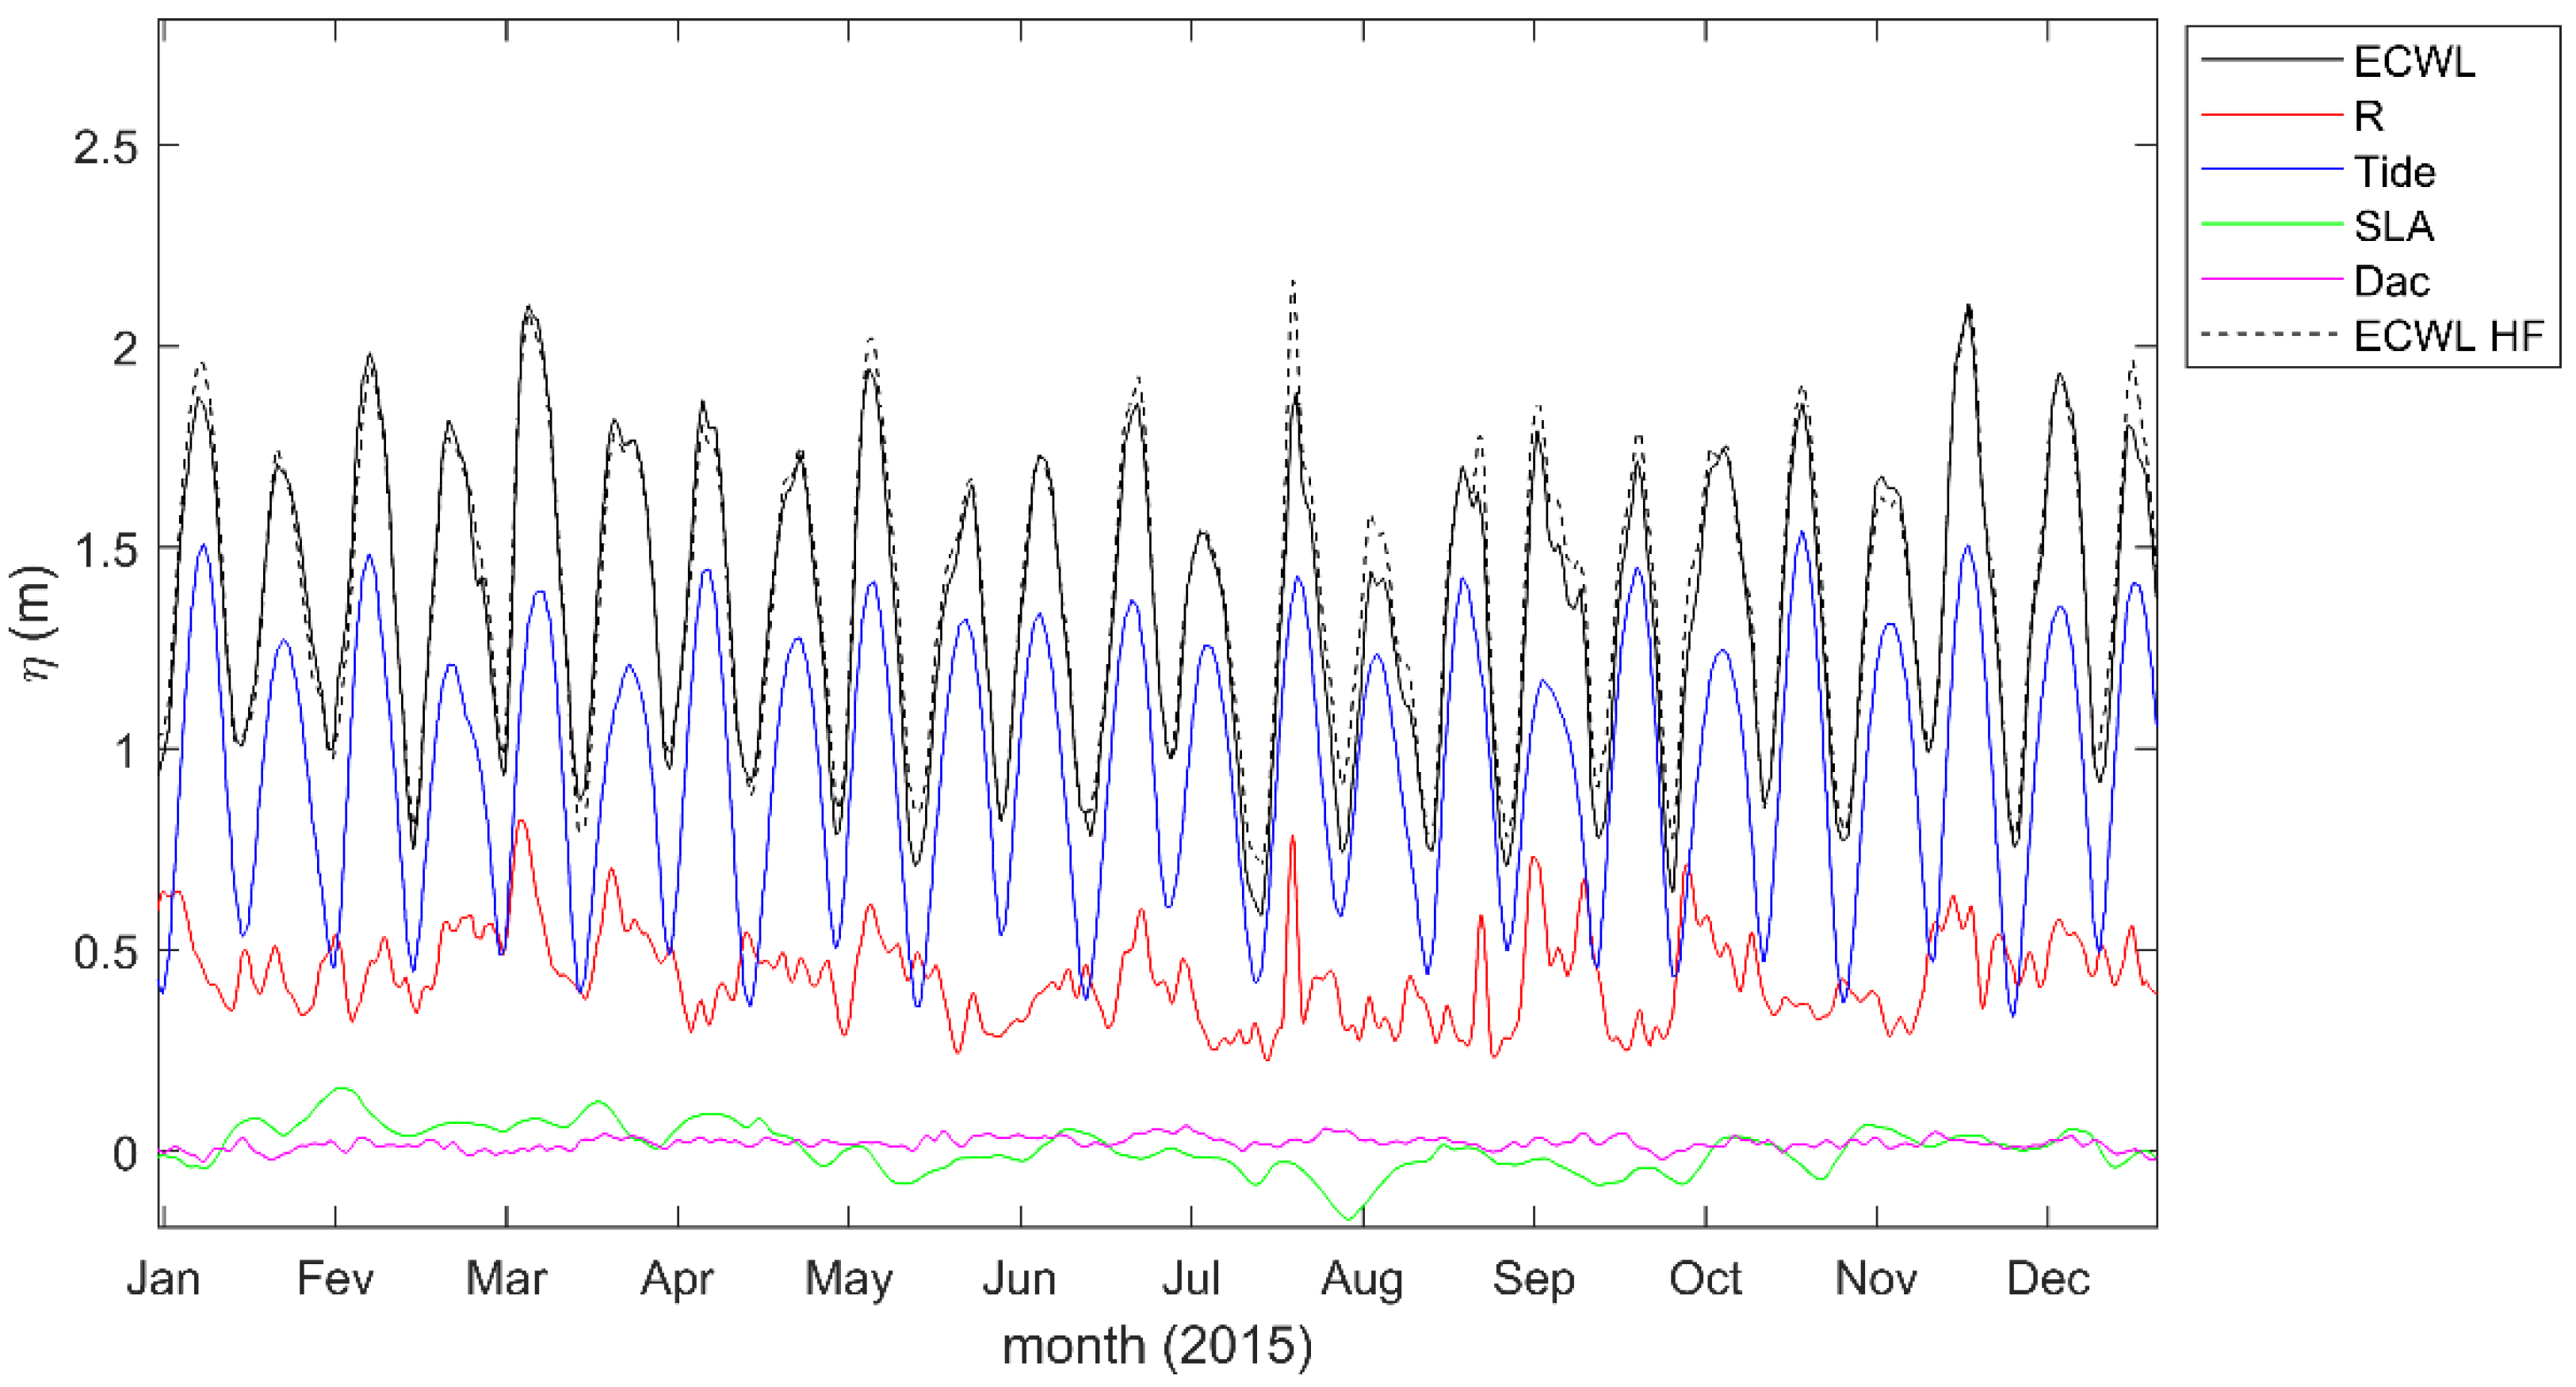
4.2. Hydrodynamic Factors Contributing to Coastal Flooding

Since the estimation of the EWCL according to [2] the model is based on four parameters, we estimate the relative weight of each of them in the 98th percentile. Figure 3 shows that the tide (“Tide”) is the dominant factor, followed by runup induced by wave breaking (“WaveR”), sea level anomaly (“SLA”), and storm surge height due to atmospheric pressure and winds (“DAC”).
Even if tide is dominant, Figure 4 illustrates for the year 2015 the fact that it is rather a combination of high “spring” tides with wave events that generate high levels. Events in March and July show this. Noteworthy, it is also the occurrence of high tide high frequency that generates extremes; a wave event occurring during low tide or neap tide will not produce a very high water level.

4.3. Trend of Evolution of Extreme Coastal Water Levels in Dakar

The analysis of the evolution trend of the extreme sea level at the coast reveals that the extreme events are evolving faster than the sea level rises. The results show that the evolution trend of the ECWL in Dakar is 8.4 mm/year over the period 1994–2015 while the sea level rise is only 3.7 mm/year, or 44% of that of the ECWL (Table 1). On the other hand, wave breaking contributes significantly to the increase in extreme sea levels in Dakar, up to 3.2 mm/year (38%), against only less than 1 mm/year for the height of the storm surge due to atmospheric pressure and winds (DAC). In total, annual extreme sea levels increased by 21 cm between 1994 and 2015 at Dakar (based on the trend computed in Table 1).

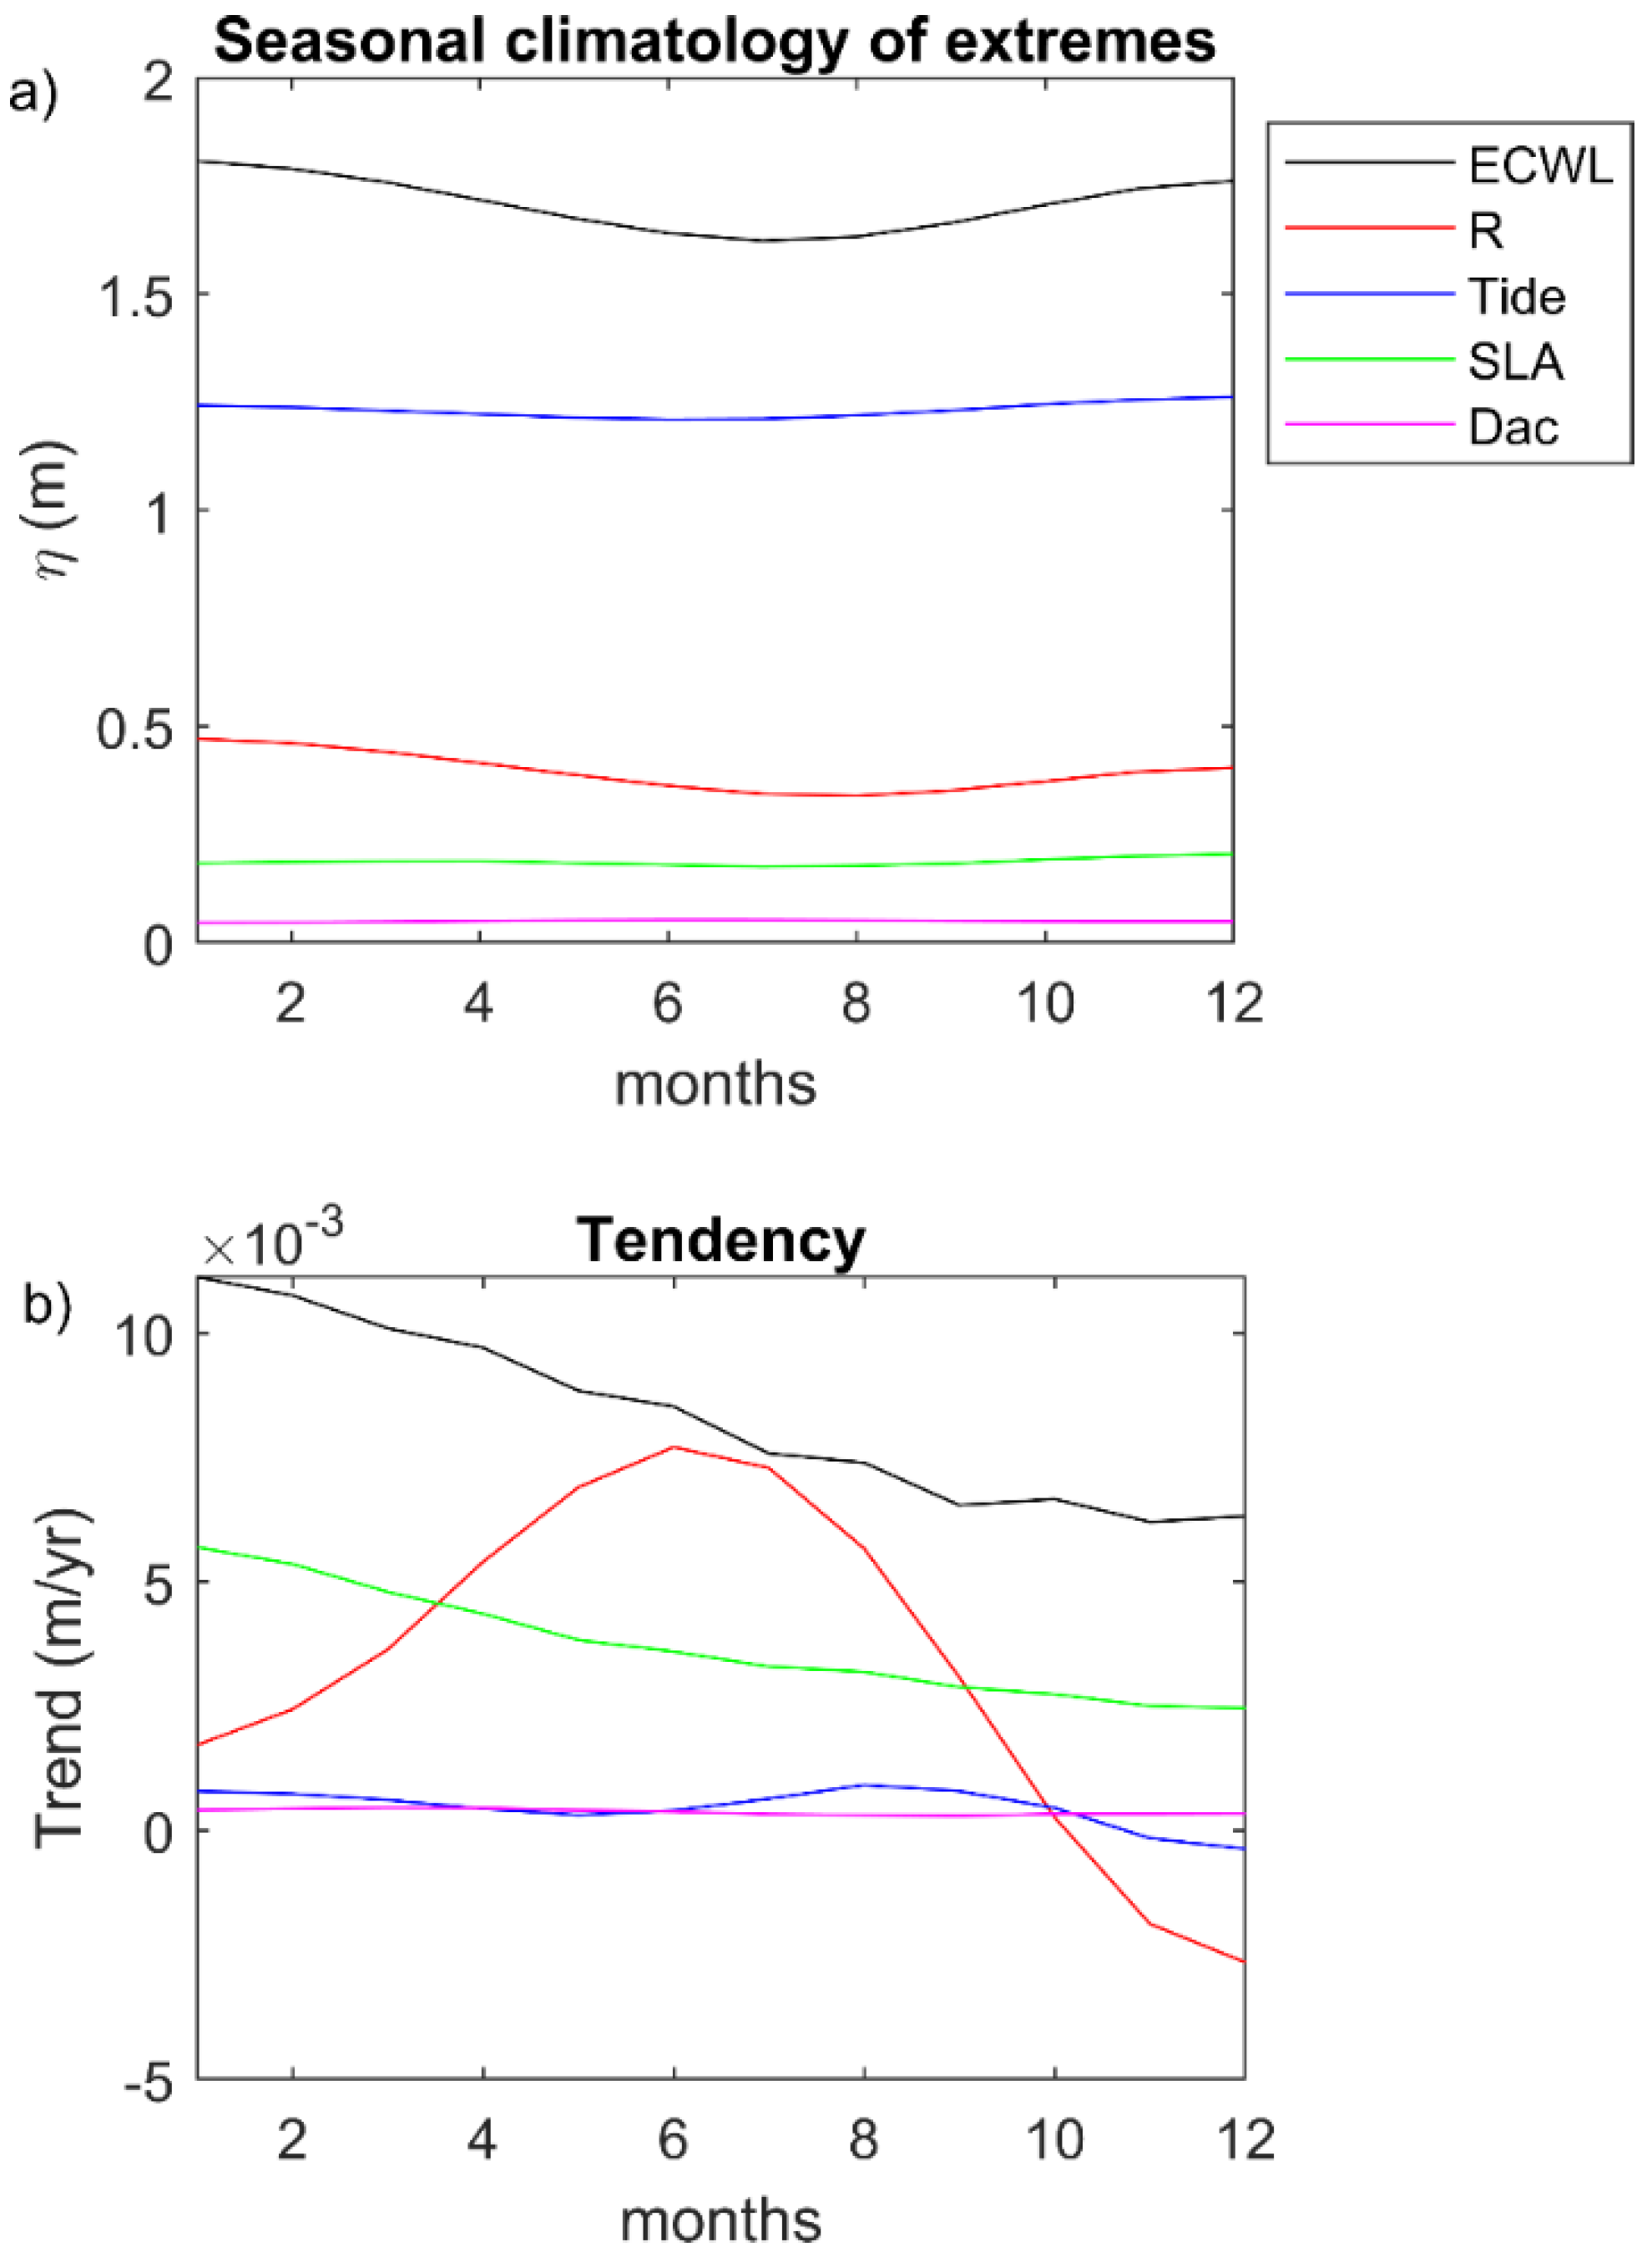
4.4. Seasonality and Origin of Swells

The analysis of the results of the seasonality of the components of ECWL in Figure 5a reveals that waves are the most variable. The monthly maximum values of runup are maximum in the boreal winter period, coinciding with the arrival of North Atlantic swells. Trends in Figure 5b show that wave extremes increase faster in June–July–August (maximum of South Atlantic swells, southern winter), at a rate of more 7 mm/year while they even decrease in northern winter (December, January and February), when dominated by the North Atlantic Storms. These results emphasize that the less frequent South Atlantic swells have increasing potential to produce damage such as flooding, than swells with a northern component. This is confirmed by most reported events observed in Dakar over the period 1994–2015 that occurred in the local rainy season (June, July and August) and the most intense events are recorded in August.

5. Discussion

The estimation of extreme sea levels at Dakar confirms that this section of the Senegalese coastline is vulnerable to extreme coastal water levels and potential flooding. Indeed, the ranking of ECWL values by severity (sea level heights), and the choice of the 98th percentile (top 2% of ECWL values), show that this threshold corresponds to a water level equal to or higher than 1.78 m (Figure 2a). At this site, the average time during which the sea level reached this height during the year was 135 h between 1995 and 2000, but from 2005 onwards it exceeded 150 h for seven years, and even 200 h (2008 and 2011) for an average value of 220 h after 2005 (Figure given the diversity of factors that can generate coastal flooding, we attempted to estimate the relative weight of each parameter in the model). Many processes such as tide, wave run-up and sea level rise contribute to coastal flooding [49]. Our results show that the tidal level (T) is the major force contributing to coastal flooding in Dakar. Indeed, studies on coastal flooding show its prominent role in the coastal flooding process [50], as well as the increase in the annual frequency of coastal flooding due to tidal action in recent decades [51]. Our results actually show that it is the interaction between T (tidal height), R (wave breaking), and to a lesser extent DAC (sea level anomaly) that explains the occurrence of very high sea levels in Dakar. Other researchers [52] point out that it is important to note that tidal inundation does not imply that high tides are solely responsible for pushing water levels above inundation thresholds, but it is the combination of different sea-level-related processes that leads to tidal inundation. In the study area, strong spring tides combined with wave events generate high levels. In addition, the results also show that neap tides do not produce very high water levels. Similar results were observed by [53] who states that extreme water levels can be counteracted under neap tide conditions. The same finding is made by [54]. The low water level in a storm period coinciding with a low tide can be explained by the variation in the breaking point. Moreover, according to Costa [55] the breaking of waves at low tide occurs further offshore due to the effect of the decrease in depth.
According to [4], most studies related to coastal flooding sensitivity tend to focus on sea level rise rather than wave and extreme water level climate. Our results show a trend of increasing extreme water level events necessarily related to elevation. The trend in ECWL at Dakar, of the order of 8.4 mm/yr, is largely the result of an increase in wave runup, which contributes significantly (38%, or 3.2 mm/yr). The occurrence of very high sea level at Dakar is thus increasing faster than the rise in sea level. Wave action (R) on coastal flooding events is likely to take on significant proportions in the context of climate change. Indeed, climate change, which translates into sea level rise, has the effect of reinforcing wave action [55,56] and will influence the bathymetric surge generating high intensity swells at the coast [55]. With the current trend of increasing wave-induced runup, far outweighing the other factors (SLA and DAC) (Table 1 and Figure 4), an increase in the occurrence of very high sea levels and extreme events generating high-impact coastal flooding should probably be expected in Dakar. The authors of [8] predict that regions in the tropics will experience the greatest increases in storm frequency. In this context, wave breaking, often ignored in the study of the probability of return of coastal flooding in the context of climate change, would deserve the interest of those responsible for the management of the coastal zone.
Wave direction contributes significantly to extreme water levels [57], hence the importance of considering them in this study. The results reveal that over the period 1994–2015 most extreme meteorological–marine events in Dakar are recorded in boreal summer/southern winter (June, July and August) and that August constitutes the maximum. This is a result of the swell from the South Atlantic at this time of year. These results are similar to those of [58], who recently showed that South Atlantic swells cause the most severe flooding in Senegal and the southern coastline. Moreover, according to these authors, swells from the South Atlantic have a strong destabilizing potential and are responsible for a strong sea level anomaly in the Dakar area and generally on the Senegalese coast. The energy released by these swells is very important. Except for the refraction caused by the seabed of the continental shelf of the Petite Côte, most of the energy of this swell reaches the southern coast of Senegal [44]. Observed from July, they reach their maximum power in August and September [42]. More energetic, they can cause coastal flooding when they participate in storm surges [39] and play an important role in the evolutionary process of the Petite Côte coastline [42]. These results show that the seasonality of the swell is an important component to consider in the study of extreme marine weather events in Dakar, especially on the Little Coast. Noteworthy, the increasing trend of wave runup in June–July–August can be attributed to a current increase in the Southern Annular Mode [58,59] activity, while the decrease during December–January–February is explained by a long term modification of the North Atlantic Oscillation [44,59] that deviates waves from sub-tropical Senegalese coasts.
The exceedance of the severe threshold of 1.78 m (98% percentile) obtained during the study period increased by 1.7x. It will potentially increase by 8x with a global mean sea level rise of 0.4 m, and 20x with 0.8 m by 2100 according to IPCC RCPs greenhouse gas emission 2.4 and 8.4 scenarios, respectively. This is assuming constant waves. However, because wave impacts on the coast depend on open ocean wave characteristics, they are also expected to be affected by patterns of climate variability and thus undergo significant changes under future climate scenarios [60,61,62,63,64]. In the Atlantic, global warming would lead to a poleward shift in extratropical storm tracks, particularly in the South Atlantic, with no global intensification but considerable regional changes [7,65,66,67]. An increase in tropical storm intensity has been reported by various studies [8,68,69,70] with significant potential impact due to their coastal–normal orientation in Senegal. An increase in the impact of storms and flooding [8], more frequent tropical cyclones, and South Atlantic events have the potential to significantly change the equilibrium state of Senegal’s sandy coast, and by extension likely the entire West African coast.
Noteworthy, the results obtained in this study are from global model re-analyses and observations. Due to the scarcity of in situ information in West Africa [41,71] it is not possible to compare our estimate with other observations, which is a limitation when using global re-analysis and satellite data, which are necessarily coarse. However, these data are validated worldwide in similar environments [2], which gives confidence in our results.

6. Conclusions

In a context of global warming the sea level is expected to rise, which is already the case. Dakar region already experienced this several times in recent decades, with the growing fear of the impact on coastal communities of more frequent or more severe marine flooding and damage to the infrastructure. On this site whose sensitivity to coastal flooding has been known for a long time, we quantified the various components contributing to very high sea levels; our results reveal that the tide is the major contributing force, but that runup through wave breaking remains an important explanatory factor of the increase in extreme events (38%), together with sea level rise (44%). Finally, this work provided new information on the evolution and origin of extreme coastal water levels that are not sufficiently studied on the Senegalese coast, but whose knowledge is an essential element for the development of coastal development schemes and the protection of coastal communities.

Author Contributions

Conceptualization, C.O.T.C. and R.A.; methodology, C.O.T.C. and R.A.; formal analysis, C.O.T.C. and R.A.; writing-preparation of the original draft, C.O.T.C., R.A., J.P.M.Y., S.J., A.T., B.A.S. (Boubou Aldiouma Sy), I.S., B.A.S. (Bamol Ali Sow) and H.D.; writing-revision and editing, C.O.T.C., R.A., J.P.M.Y., S.J., A.T., B.A.S. (Boubou Aldiouma Sy), I.S., B.A.S. (Bamol Ali Sow) and H.D.; visualization, C.O.T.C., R.A. and S.J.; supervision C.O.T.C. All authors have read and agreed to the published version of the manuscript.

Funding

The authors received no financial support for the research of this article.

Conflicts of Interest

The authors declare no conflict of interest.

References

  1. Kulp, S.A.; Strauss, B.H. New elevation data triple estimates of global vulnerability to sea-level rise and coastal flooding. Nat. Commun. 2019, 10, 4844. [Google Scholar] [CrossRef] [PubMed] [Green Version]
  2. Almar, R.; Ranasinghe, R.; Bergsma, E.W.J.; Diaz, H.; Melet, A.; Papa, F.; Vousdoukas, M.; Athanasio, P.; Dada, O.; Almeida, P.L.; et al. A global analysis of extreme coastal water levels with implications for potential coastal overtopping. Nat. Commun. 2021, 12, 3775. [Google Scholar] [CrossRef] [PubMed]
  3. Hauer, M.E.; Hardy, D.; Kulp, S.A.; Mueller, V.; Wrathall, D.J.; Clark, P.U. Assessing population exposure to coastal flooding due to sea level rise. Nat. Commun. 2021, 12, 6900. [Google Scholar] [CrossRef] [PubMed]
  4. Masselink, G.; Castelle, B.; Scott, T.; Dodet, G.; Suanez, S.; Jackson, D.; Floc’h, F. Extreme wave activity during 2013/2014 winter and morphological impacts along the Atlantic coast of Europe, Geophys. Res. Lett. 2016, 43, 2135–2143. [Google Scholar] [CrossRef]
  5. Dodet, G.; Melet, A.; Ardhuin, F.; Bertin, X.; Idier, D.; Almar, R. The contribution of wind-generated waves to coastal sea-level changes. Surv. Geophys. 2019, 40, 1563–1601. [Google Scholar] [CrossRef] [Green Version]
  6. Melet, A.; Meyssignac, B.; Almar, R.; Le Cozannet, G. Under-estimated wave contribution to coastal sea-level rise. Nat. Clim. Chang. 2018, 8, 234–239. [Google Scholar] [CrossRef]
  7. Melet, A.; Almar, R.; Hemer, M.; Le Cozannet, G.; Meyssignac, B.; Ruggiero, P. Contribution of wave setup to projected coastal sea level changes. J. Geophys. Res. Ocean. 2020, 125, e2020JC016078. [Google Scholar] [CrossRef]
  8. Vitousek, S.; Barnard, P.L.; Fletcher, C.H.; Frazer, N.; Erikson, L.; Storlazzi, C.D. Doubling of coastal flooding frequency within decades due to sea-level rise. Sci. Rep. 2017, 7, 1399. [Google Scholar] [CrossRef] [Green Version]
  9. Marcos, M.; Rohmer, J.; Vousdoukas, M.I.; Mentaschi, L.; Le Gozannet, G.; Amores, A. Increased extreme coastal water levels due combined action of sturm surges and wind waves. Geophys. Res. Lett. 2019, 46, 4356–4364. [Google Scholar] [CrossRef] [Green Version]
  10. Woodworth, P.L.; Melet, A.; Marcos, M.; Ray, R.D.; Wöppelmann, G.; Sasaki, Y.N.; Cirano, M.; Hibbert, A.; Huthnance, J.M.; Monserrat, S.; et al. Forcing factors affecting sea level changes at the coast. Surv. Geophys. 2019, 40, 1351–1397. [Google Scholar] [CrossRef]
  11. Dada, O.; Almar, R.; Morand, P.; Ménard, F. Towards West African coastal social-ecosystems sustainability: Interdisciplinary approaches. Ocean. Coast. Manag. 2021, 211, 105746. [Google Scholar] [CrossRef]
  12. Menéndez, M.; Woodworth, P.L. Changes in extreme high water levels based on a quasi-global tide-gauge data set. J. Geophys. Res. 2010, 115, C10011. [Google Scholar] [CrossRef] [Green Version]
  13. Vousdoukas, M.I.; Almeida, L.P.; Ferreira, O. Modelling storm-induced beach morphological change in a meso-tidal, reflective beach using XBeach. J. Coast. Res. 2011, 1916–1920. Available online: https://www.jstor.org/stable/26482510 (accessed on 21 November 2022).
  14. Vousdoukas, M.I.; Voukouvalas, E.; Mentaschi, L.; Dottori, F.; Giardino, A.; Bouziotas, D.; Bianchi, A.; Salamon, P.; Feyen, L. Developments in large-scale coastal flood hazard mapping. Nat. Hazards Earth Syst. Sci. 2016, 16, 1841–1853. [Google Scholar] [CrossRef] [Green Version]
  15. Wahl, T.; Haigh, I.D.; Nicholls, R.J.; Arns, A.; Dangendorf, S.; Hinkel, J.; Slangen, A.B.A. Understanding extreme sea levels for broad-scale coastal impact and adaptation analysis. Nat. Commun. 2017, 8, 16075. [Google Scholar] [CrossRef] [Green Version]
  16. Kupfer, S.; Aguilar, S.S.; Niekerk, L.V.; Luck-Voger, M.; Vafeidis, A.T. Investigating the interaction of waves and river discharge during compound flooding at breede estuary, South Africa. Nat. Hazards Earth Syst. Sci. 2022, 22, 187–205. [Google Scholar] [CrossRef]
  17. Bertoni, J.C. Inondations urbaines en Amérique Latine: Réflexions sur le rôle des facteurs de risque. Front. Flood Res. 2006, 305, 123–141. [Google Scholar]
  18. Boucharel, J.; Almar, R.; Kestenare, E.; Jin, F.F. On the influence of ENSO complexity on Pan-Pacific coastal wave extremes. Proc. Natl. Acad. Sci. USA 2021, 118, e2115599118. [Google Scholar] [CrossRef]
  19. Vousdoukas, M.I.; Clarke, J.; Ranasinghe, R.; Reimann, L.; Khalaf, N.; Duong, T.M.; Simpson, N.P. African heritage sites threatened as sea-level rise accelerates. Nat. Clim. Chang. 2022, 12, 256–262. [Google Scholar] [CrossRef]
  20. Luijendijk, A.; Hagenaars, G.; Ranasinghe, R.; Baart, F.; Donchyts, G.; Aarninkhof, S. The state of the world’s beaches. Sci. Rep. 2018, 8, 6641. [Google Scholar] [CrossRef]
  21. Alves, B.; Angnuureng, D.B.; Morand, P.; Almar, R. A review on coastal erosion and flooding risks and best management practices in West Africa: What has been done and should be done. J. Coast. Conserv. 2020, 24, 38. [Google Scholar] [CrossRef]
  22. Hzami, A.; Heggy, E.; Amrouni, O.; Mahé, G.; Maanan, M.; Abdeljaouad, S. Alarming coastal vulnerability of the deltaic and sandy beaches of North Africa. Sci. Rep. 2021, 11, 2320. [Google Scholar] [CrossRef] [PubMed]
  23. Ennesser, Y.; Terrier, M.; Said, V. The large coastal cities of North Africa facing climate change and natural hazards. Geosci. BRGM Mag. A Sustain. Earth 2016, 21, 50–57. [Google Scholar]
  24. Ovono, Z.M.; Pottier, P. Flood Risk in the Small Urban Coastal Slopes of Libreville (Gabon). Example of Ogombié and Inongui. Available online: https://cahiers-nantais.fr/index.php?id=1166 (accessed on 21 November 2022).
  25. Tchindjang, M.; Mbevo, F.; Bodpa, A. Construire Ville Portuaire de demain en Afrique Atlantique. Available online: https://www.researchgate.net/publication/332371792_Construire_Ville_Portuaire_de_demain_en_Afrique_Atlantique (accessed on 21 November 2022).
  26. Almar, R.; Kestenare, E.; Boucharel, J. On the key influence of remote climate variability from Tropical Cyclones, North and South Atlantic mid-latitude storms on the Senegalese coast (West Africa). Environ. Res. Commun. 2019, 1, 071001. [Google Scholar] [CrossRef] [Green Version]
  27. Quiroga, I.A.; De Murieta, E.S.; Losada, I.; Toimil, A.; Torres, S.; Markanday, A.; Briones, A. Coastal Flooding and Erosion under Climate Change: Risk Assessment Risk in Dakar. Available online: https://zenodo.org/record/6035738#.Y6khYxVByUk (accessed on 21 November 2022).
  28. Woodruff, J.D.; Irish, J.L.; Camargo, S.J. Coastal flooding by tropical cyclones and sea-level rise. Nature 2013, 504, 44–51. [Google Scholar] [CrossRef] [Green Version]
  29. Mie, J.; Zhang, M.; Zhu, Z.; Vuik, V.; Wen, J.; Gao, H.; Bouma, T.J. Morphological wave attenuation of the nature-based flood defense: A case study from Chongming Dongtan Shoal. China Sci. Total Environ. 2022, 831, 154813. [Google Scholar] [CrossRef]
  30. Diongue, M. Urban periphery and flood risks in Dakar (Senegal): The case of Yeumbeul Nord. Eso Work. Doc. 2014, 37, 45–54. [Google Scholar]
  31. Ndao, M. Dynamics and Environmental Management from 1970 to 2010 of Wetlands in Senegal: Study of Land Use by Remote Sensing of the Niayes with Djiddah Thiaroye Kao (in Dakar), Mboro (in Thiès and Saint-Louis). Ph.D. Thesis, University of Toulouse, Toulouse, French, 2012; 372p. [Google Scholar]
  32. Wang, H.G.; Montoliu-Munoz, M.; Gueye Nd, F.D. Preparing to manage natural hazards and climate change risks. In Dakar Senegal. A Spatial and Institutional Approach; The World Bank Géoville: Tokyo, Japan, 2009; 90p. [Google Scholar]
  33. Wade, S.; Rudant, J.P.; Ba, K.; Ndoye, B. Remote sensing and management of natural disasters: Application to the study of urban flooding of Saint-Louis and Gulling due to water erosion in Nioro du Rip (Senegal). Rev. Teledetect. 2009, 8, 203–210. [Google Scholar]
  34. Cisse, O. Les Inondations à Dakar; Éditions Karthala: Paris, France, 2018; 322p. [Google Scholar]
  35. Breilh, J.F.; Chaumillon, E.; Bertin, J. Improve of a static flooding method and application to the case of the Xynthia Storm. XIIth J. Natl. Conf. Coast. Eng.—Civ. Cherbg. 2012, 917–924. [Google Scholar] [CrossRef]
  36. Cisse, C.O.T.; Sagne, P.; Ba, K.; Fall, B.; Sy, B.A.; Marone, A. Modélisation des niveaux d’eau extrêmes sur les plages sableuses de Malibu, de Gadaye et de Malika (Dakar, Sénégal) consécutive à la tempête du 19 novembre 2018. Eur. Sci. J. 2022, 18, 80–100. [Google Scholar] [CrossRef]
  37. Tebaldi, C.; Strass, B.H.; Zervas, C.E. Modelling sea level rise impacts on storm surges along us coasts. Envr. Res. Lett. 2012, 7, 014032. [Google Scholar] [CrossRef]
  38. Lacroix, D.; Mora, O.; Menthière, N.; Bethinger, A. Sea level rise: Consequences and anticipations by 2100, the light of foresight. Study Rep. Natl. Environ. Res. Alliance 2019, 51, 172. [Google Scholar]
  39. Ndour, A. Evolution Morpho-Sédimentaire et Impacts des Ouvrages de Protection sur le Littoral de Dakar, Petite Côte. Ph.D. Thesis, Cheikh Anta Diop University in Dakar, Dakar, Senegal, 2015; 243p. [Google Scholar]
  40. Bakhoum, P.W.; Niang, I.; Sambou, B.; Diaw, A.T. A peninsula in coastal erosion? Dakar, the Senegalese capital facing sea rise in the context of climate change. Environ. Water Sci. Public Health Territ. Intell. 2018, 2, 91–108. Available online: http://revues.imist.ma/?journal=ewash-ti/ (accessed on 21 November 2022).
  41. MOLOA (West African coastline observation mission). Reporting of Hazards Due to Extreme Coastal/Sea Weather Events. Available online: https://ocean-climate.org/en/west-african-regional-coastal-observatory-orloa/ (accessed on 21 November 2022).
  42. Diallo, S. Geomorphological Evolution of the Coastline on the Little Coast in Dakar. Master’s Thesis, Cheikh Anta Diop University in Dakar, Dakar, Senegal, 1982; 117p. [Google Scholar]
  43. Guerin, K. Dynamics of the Sandy Coastline from Thiaroye to Bargny (Bay of Goree-Senegal). Master’s Thesis, University of Paris 1-Sorbonne-Panthéon, Paris, France, 2003; 198p. [Google Scholar]
  44. Turmine, V. Coastal Dynamics between Mbour and Joal; University of Paris VII Denis Diderot: Paris, France, 2000; 255p. [Google Scholar]
  45. Carrere, L.; Lyard, F.H.; Cancet, M.; Guillot, A. Finite Element Solution FES2014, a New Tidal Model–Validation Results and Perspectives for Improvements. In Proceedings of the ESA Living Planet Conference, Prague, Czech Republic, 9–13 May 2016. [Google Scholar]
  46. Marti, F.; Cazenave, A.; Birol, F.; Passaro, M.; Léger, F.; Niño, F.; Almar, F.; Benveniste, J.; Legeais, J.F. Altimetry-based sea level trends along the coasts of western Africa. Adv. Space Res. 2021, 68, 504–522. [Google Scholar] [CrossRef] [Green Version]
  47. Idier, D.; Bertin, X.; Thompson, P.; Pickering, M.D. Interactions between mean sea level, tide, surge, waves and flooding: Mechanisms and contributions to sea level variations at the coast. Surv. Geophys. 2019, 40, 1603–1630. [Google Scholar] [CrossRef] [Green Version]
  48. Bergsma, E.W.; Almar, R.; Anthony, E.J.; Garlan, T.; Kestenare, E. Wave variability along the world’s continental shelves and coasts: Monitoring opportunities from satellite earth observation. Adv. Space Res. 2022, 69, 3236–3244. [Google Scholar] [CrossRef]
  49. Marfai, M.A.; King, L. Coastal flood management in Semarang, Indonesia. Environ. Geol. 2007, 55, 1507–1518. [Google Scholar] [CrossRef]
  50. Takagi, H.; Esteban, M.; Mikami, T.; Fuji, D. Projection of coastal flood in 2050 Jakarta. Urban Clim. 2016, 17, 135–145. [Google Scholar] [CrossRef]
  51. Sweet, V.W.; Dusek, G.; Obeysekera, J.; Marra, J.J. Patterns and Projections of High Tide Flooding a Long the U.S. Coastaline Using a Common Impct Threshold; NOAA Technical Report NOS CO-OPS; NOAA, NOS Center for Operational Oceanographic Products and Services: Silver Spring, MD, USA, 2018; Volume 86, 56p.
  52. Li, Y.; Zeng, C.; Yihan, Z.; Hu, P.; Sun, T.; Hou, Y.; Mo, D.; Wang, D. Experimental Study of Overtopping on Sea Dikes and Coastal Flooding Under the Coupled Processes of Tides and Waves. China Ocean. Eng. 2022, 36, 413–426. [Google Scholar] [CrossRef]
  53. Bonte, Y. Effect of Swash on the Erosion of a High Beach Escarpment. Ph.D. Thesis, University of Caen Lower Normandy, Caen, France, 2013; 163p. [Google Scholar]
  54. Sergent, P.; Prevot, G.; Trmal, C. Renforcement des Ouvrages Situés en Faibles Profondeurs vis-à-vis de la Montée du Niveau des Mers. Available online: https://www.researchgate.net/publication/256306084_RENFORCEMENT_DES_OUVRAGES_SITUES_EN_FAIBLES_PROFONDEURS_VIS-A-VIS_DE_LA_MONTEE_DU_NIVEAU_DES_MERS (accessed on 21 November 2022).
  55. Costa, S. Sea level rise and response strategies: The case of the Normandy-Picardy coastline. Ann. De Géographie 1995, 107, 179–200. [Google Scholar] [CrossRef]
  56. Wang, X.L.; Zwiers, F.W.; Swail, V.R. North Atlantic Ocean wave cliamte change scenarios for the twebty first century. J. Clim. 2003, 17, 2368–2383. [Google Scholar] [CrossRef]
  57. Cohn, N.; Ruggiero, P. The influence of seasonal to interannual nearshore profile variability on extreme water levels: Modeling wave runup on dissipative beaches. Coast. Eng. 2016, 115, 79–92. [Google Scholar] [CrossRef]
  58. Almar, R.; Kestenare, E.; Reyns, J.; Jouanno, J.; Anthony, E.J.; Laibi, R.; Hemer, M.; Du Penhoat, Y.; Ranasinghe, R. Response of the Bight of Benin (Gulf of Guinea, West Africa) coastline to anthropogenic and natural forcing, Part1: Wave climate variability and impacts on the longshore sediment transport. Cont. Shelf Res. 2015, 110, 48–59. [Google Scholar] [CrossRef]
  59. Marshall, A.G.; Hemer, M.A.; Hendon, H.H.; McInnes, K.L. Southern annular mode impacts on global ocean surface waves. Ocean. Model. 2018, 129, 58–74. [Google Scholar] [CrossRef]
  60. Hochet, A.; Dodet, G.; Ardhuin, F.; Hemer, M.; Young, I. Sea State Decadal Variability in the North Atlantic: A Review. Climate 2021, 9, 173. [Google Scholar] [CrossRef]
  61. Hemer, M.; Chruch, J.-A.; Hunter, J.-R. Variability and trends in the directional wave climate of the Southern Hemisphere. Int. J. Climatol. 2010, 30, 475–491. [Google Scholar] [CrossRef]
  62. Semedo, A.; Suselj, K.; Rutgersson, A.; Sterl, A. A global view on the wind sea and swell climate and variability from ERA-40. J. Clim. 2011, 24, 1461–1479. [Google Scholar] [CrossRef]
  63. Young, I.R.; Zieger, S.; Babanin, A.V. Global trends in wind speed and wave height. Science 2011, 332, 451–455. [Google Scholar] [CrossRef]
  64. Hemer, M.; Fan, Y.; Mori, N.; Semedo, A.; Wang, X. Projected changes in wave climate from a multi-model ensemble. Nat. Clim. Chang. 2013, 3, 471–476. [Google Scholar] [CrossRef]
  65. Wang, X.L.; Feng, Y.; Swail, V.R. Changes in global ocean wave heights as projected using multimodel CMIP5 simulations. Geophys. Res. Lett. 2014, 41, 1026–1034. [Google Scholar] [CrossRef]
  66. Mizuta, R. Intensification of extratropical cyclones associated with the polar jet change in the CMIP5 global warming projections. Geophys. Res. Lett. 2012, 39, L19707. [Google Scholar] [CrossRef] [Green Version]
  67. Semedo, A.; Weisse, R.; Behrens, A.; Sterl, A.; Bengtsson, L.; Günther, H. Projection of global wave climat change toward the end of the twenty-firsts century. J. Clim. 2013, 26, 8269–8288. [Google Scholar] [CrossRef] [Green Version]
  68. Zappa, G.; Shaffrey, L.C.; Hodges, K.I.; Sansom, P.G.; Stephenson, D.B. A multimodel assessment of future projections of North Atlantic and European extratropical cyclones in the CMIP5 climate models. J. Clim. 2013, 26, 5846–5862. [Google Scholar] [CrossRef] [Green Version]
  69. Nicholls, R.J.; Wong, P.P.; Burkett, V.R.; Codignotto, J.O.; Hay, J.E.; McLean, R.F.; Ragoonaden, S.; Woodroffe, C.D. Coastal Systems and Low-Lying Areas. Climate Change: Impacts, Adaptation and Vulnerability. In Contribution of Working Group II to the Fourth Assessment Report of the Intergovernmental Panel on Climate Change; Parry, M.L., Canziani, O.F., Palutikof, J.P., van der Linden, P.J., Hanson, C.E., Eds.; Cambridge University Press: Cambridge, UK, 2007; pp. 315–356. [Google Scholar]
  70. Sterl, A.; den Brink, V.; De Vries, H.; Haarsma, H.; van Meijgaard, R.R. An ensemble study of extreme storm surge related water levels in the North Sea in a changing climate. Ocean Sci. 2009, 5, 369–378. [Google Scholar] [CrossRef] [Green Version]
  71. Anthony, E.; Almar, R.; Besset, M.; Reyns, J.; Laibi, R.; Ranasinghe, R.; Abessolo Ondoa, G.; Vacchi, M. Response of the Bight of Benin (Gulf of Guinea, West Africa) coastline to anthropogenic and natural forcing, Part 2: Sources and patterns of sediment supply, sediment cells, and recent shoreline change. Cont. Shelf Res. 2019, 173, 93–103. [Google Scholar] [CrossRef]
Figure 1. Location of Dakar [41] (latitude = 14.71°, longitude = −17.46°), Senegal (West Africa). Left column roses show summer and winter months wave energy incoming directions.
Climate 11 00006 g001
Figure 2. (a) Distribution of different percentiles of extreme coastal water level (ECWL), from 1994 to 2015. (b) Number of hours per year that the sea level at Dakar corresponded to the 98th percentile (1.78 m), from 1994 to 2015. Solid red line is the linear trend. Dashed red lines show the 95% significant interval.
Climate 11 00006 g002
Figure 3. Contribution of each model parameter described in Equation (2) for the extreme sea levels exceeding the 98% percentile threshold value at Dakar, between 1994 and 2015.
Climate 11 00006 g003
Figure 4. Illustration of the daily (maximum) contributors to Extreme Coastal Water Level over the full 2015 year. Black dashed line represents the interaction between hourly tide and other components.
Climate 11 00006 g004
Figure 5. Trend of increasing ECWL values due to South Atlantic swells. (a): the analysis of the results of the seasonality of the components of ECWL; (b): the analysis of the results of Tendency.
Climate 11 00006 g005
Table 1. Relative trends of different model parameters in the increase in extreme water levels in Dakar, from 1994 to 2015 and their interannual variations. * indicates trends statistically significant, passing the NULL hypothesis using the Mann–Kendall test, at a 95% level.
Sea Level ComponentTrend (mm/an)Interannual Variability (mm)
ECWL8.4 *28.3
R3.210.1
SLA3.7 *22.3
Dac<12.6
Disclaimer/Publisher’s Note: The statements, opinions and data contained in all publications are solely those of the individual author(s) and contributor(s) and not of MDPI and/or the editor(s). MDPI and/or the editor(s) disclaim responsibility for any injury to people or property resulting from any ideas, methods, instructions or products referred to in the content.

