
The Western Pacific North Equatorial Countercurrent Responses to Two Forms of El Niño during the Period 1978 to 2017

1
Physical Oceanography Laboratory, Department of Physics and Earth Sciences, University of the Ryukyus, Nishihara, Okinawa 903-0213, Japan
2
Department of Oceanography, Faculty of Fisheries and Marine Science, Diponegoro University, Semarang, Central Java 50275, Indonesia
3
Research Center for Oceanography, National Research and Innovation Agency, Jakarta 14430, Indonesia
*
Author to whom correspondence should be addressed.
Climate 2022, 10(10), 136; https://doi.org/10.3390/cli10100136
Submission received: 5 September 2022
/
Revised: 14 September 2022
/
Accepted: 16 September 2022
/
Published: 20 September 2022
(This article belongs to the Special Issue Climate System Modelling and Observations)
Abstract
:This research aims to examine how the Western Pacific North equatorial countercurrent (NECC) flow reacts to two different forms of El Niño (EN) over a 40-year period. To establish the prevailing modes for each season, we implemented Empirical Orthogonal Function (EOF) analysis on the eastward current component of the Ocean Reanalysis System 5 (ORAS5) dataset. In comparison to the Central Pacific (CP) episode, the time series principal component of the first mode (PC1) demonstrated that the strongest NECC’s magnitude often emerged during the development period (spring to fall) of the Eastern Pacific (EP) EN event. However, in episode CP 2002/2003, we witnessed an abnormal behavior in which the stronger NECC manifested. This was due to the emergence of a strong anomalous westerly wind, which differed from other CP events and forced the NECC’s magnitude to be greater. When approaching the peak stage, on the other hand, the magnitude of the NECC during the CP episode was typically greater than that of the EP episode. The NECC’s magnitude fell greatly in the second year of the EP episode, particularly during the spring season, since most EP episodes would transition into an La Niña (LN) event in the succeeding event. During the EP EN, it was found that the strength of the westerly wind had a bigger effect on the NECC than during the CP EN.
1. Introduction
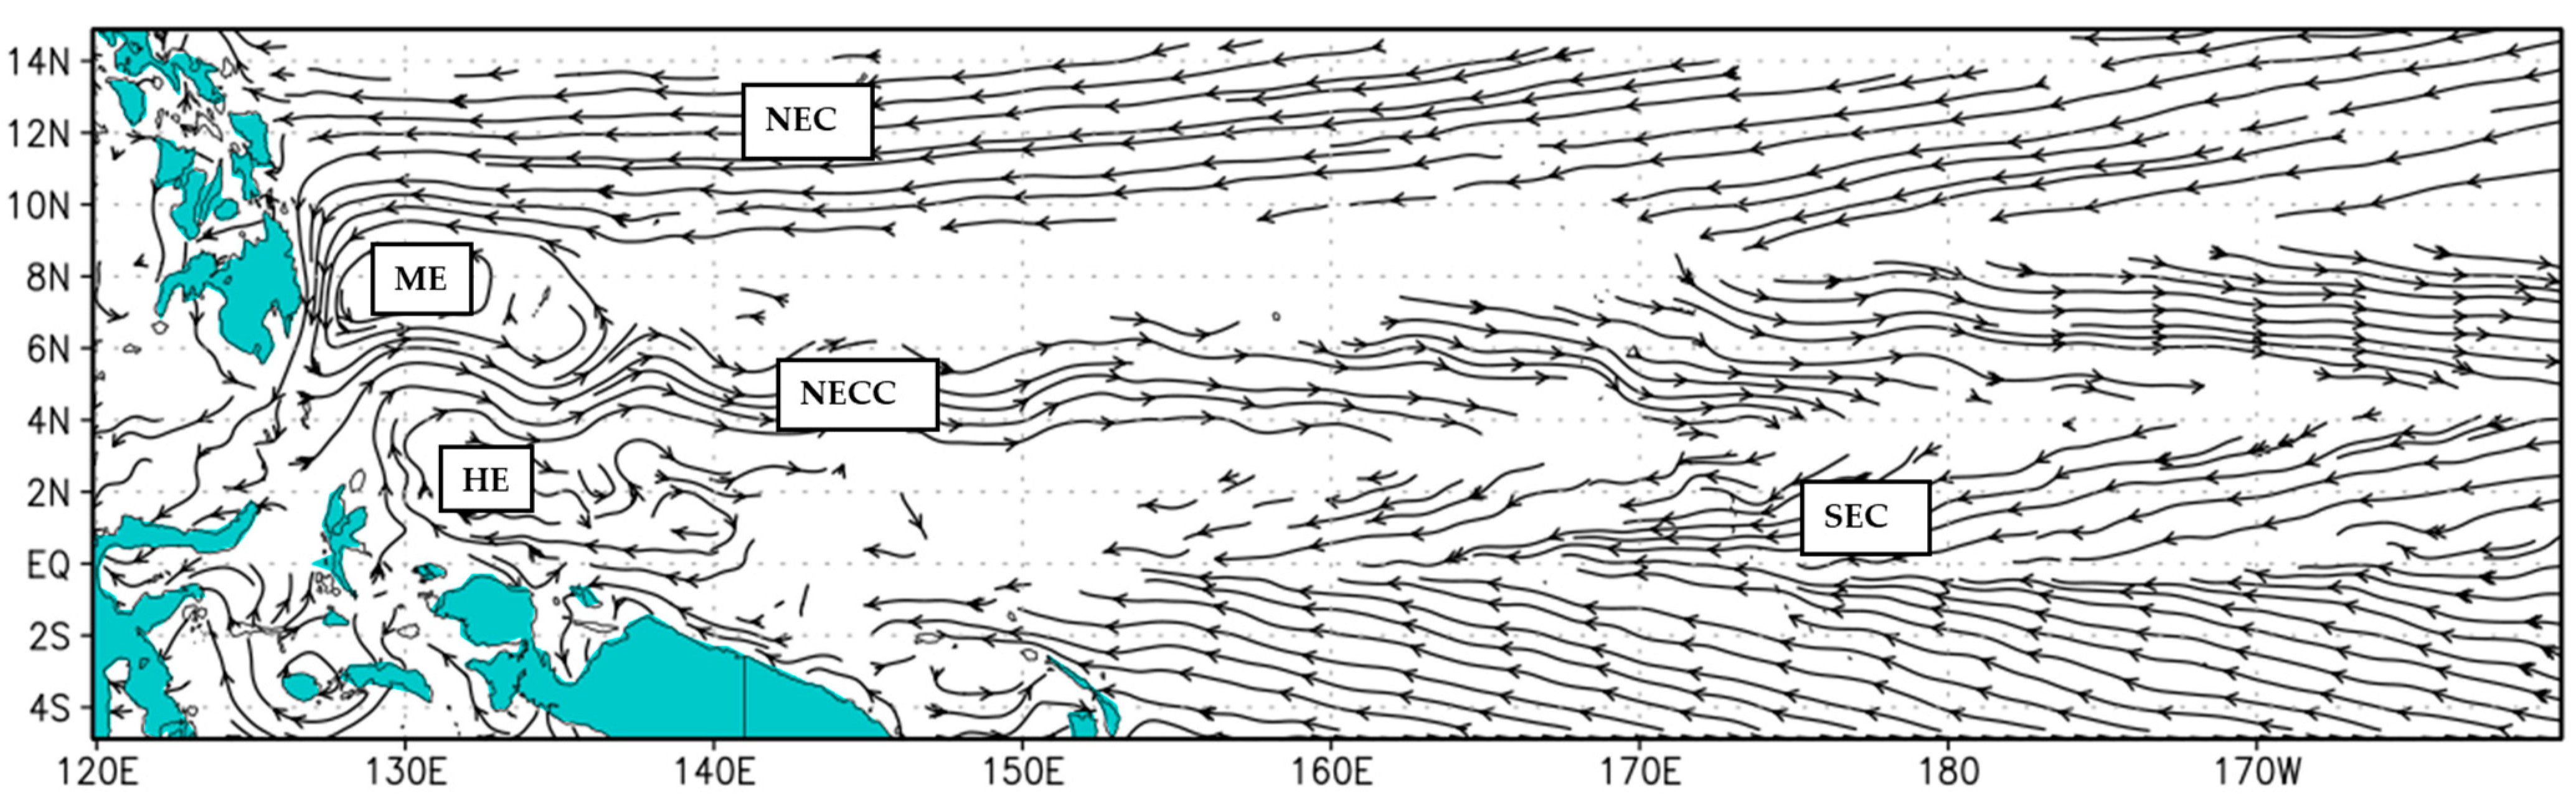
The North Equatorial Countercurrent (NECC) is one of the Pacific Ocean’s primary circulation systems, which transports surface water masses eastward. The North Equatorial Current (NEC) to the north and the South Equatorial Current (SEC) to the south are the nearest major currents. However, their flow orientations are opposite to that of the NECC. In the Western Pacific Ocean, the main body position of the NECC is farther south, varying between 2° N to 8° N, and is shallower than the eastern part [1,2]. In its birthplace, the NECC has a large meander and is associated with two eddies: the counterclockwise Mindanao Eddy (ME) and the clockwise Halmahera Eddy (HE), which are centered around 7° N, 128° E and 3° N, 131° E, respectively [3,4,5]. Figure 1 presents an illustration of the sites of all of these flows.
The NECC has piqued the interest of scientists due to the possibility that it may play a significant part in the transformation of the ENSO event consisting of the neutral phase, El Niño (EN), and La Niña (LN). On top of that, previous research suggested that the strong magnitude of the NECC was principally responsible for the commencement of the strong EN event [6]. According to the observations of Zhao et al. [7], Chen et al. [8], and Wijaya and Hisaki [9], the NECC’s magnitude has been seen to be reinforced during the first year of the EN. ENSO events are intimately tied to fluctuations in the depth of the thermocline in the Pacific Ocean. This change is brought about by westward propagating features known as oceanic Rossby waves, commonly found between 9° N and 15° N and propagating from the Eastern Pacific Ocean [10,11,12]. The upwelling (downwelling) Rossby waves that occur as a result of strong (weak) westerly winds cause a decrease (increase) in sea surface height (SSH) in the Western Pacific Ocean, which leads to an increase (decrease) in the magnitude of the NECC. Furthermore, it has been reported that the latitudinal migration of the NECC is connected to ENSO. This is because when the size of the NECC increases or decreases, there is either equatorial or poleward migration [8,9,13].
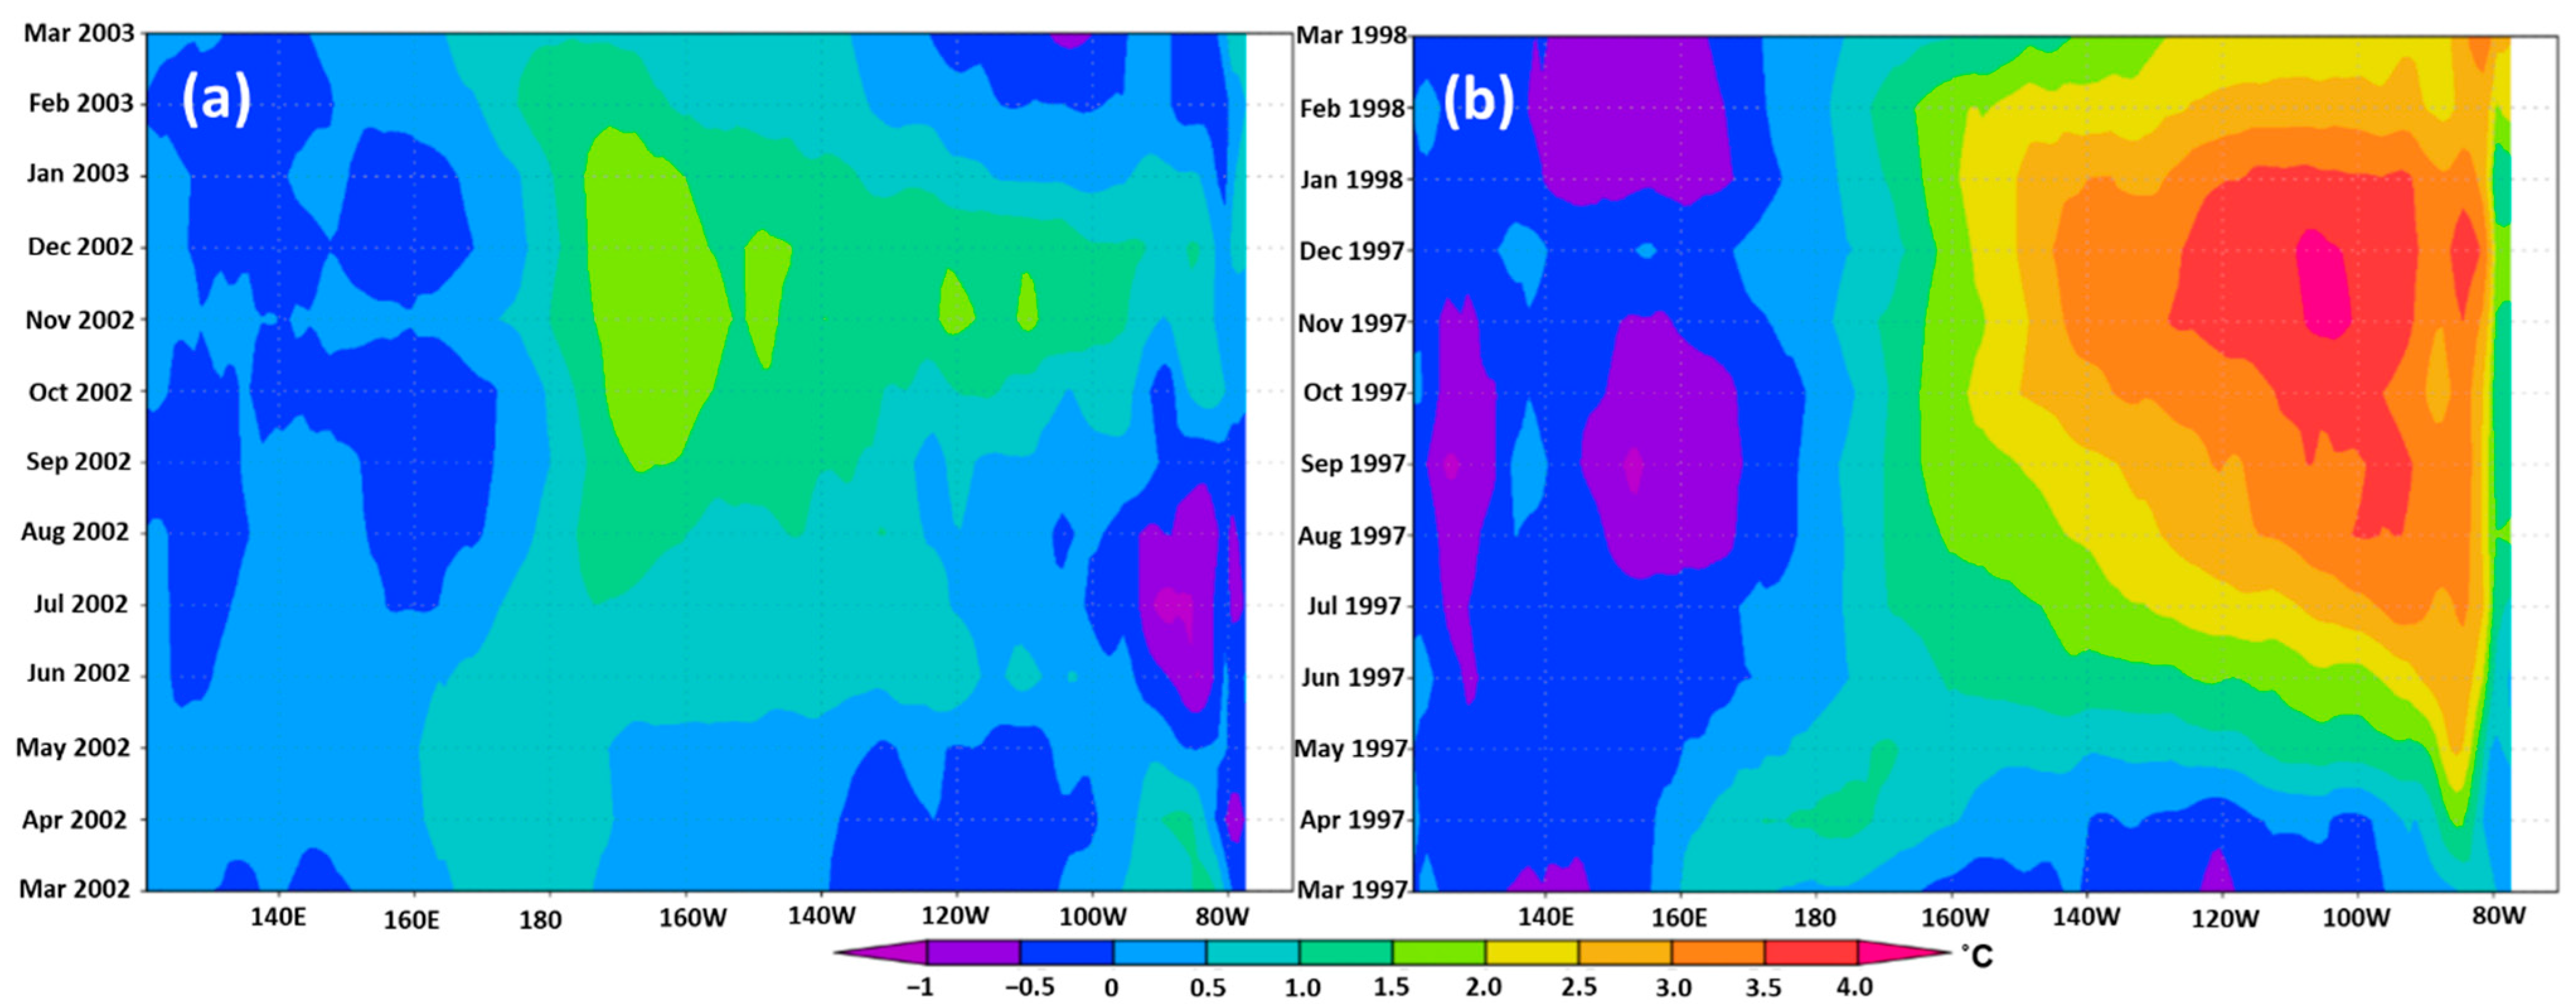
EN events can be divided into two primary categories, namely the Central Pacific (CP) episode and the Eastern Pacific (EP) episode, based on the distributions of the sea surface temperature anomaly (SSTA) that are observed over the equatorial Pacific Ocean [14,15,16,17,18,19]. The EP episode is quite similar to the canonical EN event that was characterized by Rasmusson and Carpenter [20], whereas the CP episode is known as EN Modoki [14]. Figure 2 illustrates the evolutionary differences between CP EN and EP EN found in the time series of the SSTA in the equatorial Pacific. The maximum SSTA for the EP episode is found in the eastern equatorial Pacific, whereas the CP episode tends to shift westward in the central equatorial Pacific as it approaches its peak. Different evolutionary mechanisms are responsible for the development of EP and CP EN. The thermocline variation and vertical advection play an essential part in the formation of EP EN, whereas CP EN formation involves more complex processes, such as coupled atmosphere–latent heat flux and zonal advection anomaly [15,21,22,23]. Several prior investigations have revealed dissimilarities in the NECC variability to the episodes of EP and CP EN, some of which believe that EP EN is more strongly linked to amplifying the NECC magnitude across the Pacific Ocean [24,25]. However, according to a separate study, CP EN has a significantly greater impact on the strengthening of NECC east of the dateline, whereas EP EN is more associated with the same phenomenon west of the dateline [26].
In the present study, we use forty-year (1978 to 2017) ocean reanalysis datasets in the present study to examine seasonal differences in the NECC for different EN forms. Using the empirical orthogonal function (EOF) method as the analytic tool, we compared the dominating fluctuation of NECC for each season, including the development stage (typically in boreal summer) and the peak stage (commonly in boreal winter) [27,28]. This work is structured in the following way to make the content easier to understand: Section 2 outlined the methodologies utilized; Section 3 presented the result of the experiment; and Section 4 and Section 5 summarized the study with a discussion and conclusion, separately.
2. Materials and Methods
This experiment employed monthly zonal current (0–100 m) from the Ocean Reanalysis System 5 (ORAS5) dataset supported by the European Centre for Medium-Range Weather Forecast (ECMWF) to monitor the NECC flow’s fluctuation. This data encompassed the years 1978 to 2017, with a horizontal resolution of 1° latitude × 1° longitude and a vertical resolution of 1 m near the surface. ORAS5 exceeded its predecessors regarding SST and sea level due to upgrades in multiple areas when validated against a valid observational dataset. In addition, Zuo et al. [29] provided further comprehensive information on the data characteristics and quality.
We adopted EOF as a convenient method for completing the analysis to obtain the prevailing pattern from the zonal current in each season [30,31,32]. EOF’s goal is to separate a field’s value into its spatial and temporal components from 1978 to 2017 in the Western Pacific region (124.5° E to 179.5° E, 0.5° N to 14.5° N). After removing the annual signal from the data over 40 years, we estimated the very first three EOF summers (JJA), autumns (SON), winters (DJF), and springs (MAM).
The current investigation used a set of surface wind data from the ECMWF’s fifth-generation reanalysis (ERA5) with 0.25° geographical resolution and monthly temporal resolution. Involving many instruments, the input for ERA5 is a composite of satellite and in situ observations with considerable data quality enhancements over its predecessors. Hersbach et al. [33] and Molina et al. [34] have more information on the ERA5 data.
In addition, the National Oceanic and Atmospheric Administration (NOAA) NIÑO 3.4 index data is another monthly dataset used in this study [35]. NIÑO 3.4 index is the average SSTA near the equator of the Pacific Ocean, involving an area of 5° N–5° S, 170° W–120° W, and is widely used as an indication of EN or LN events. We only noted situations during EN events of moderate to extremely severe magnitude, which are often characterized by index values ranging from 1 to 1.4 for moderate, 1.5 to 1.9 for strong, and 2 to 2.5 for an extreme event. Table 1 lists the EN events that occurred between 1978 and 2017.
Additionally, the t-test and Pearson correlations were utilized in this research so that the correlation coefficient between wind intensity and zonal current could be calculated. The effective degree of freedom was calculated using the expression that was provided by Chelton [36] and it was as follows:
where N is the entire amount of data, represents the output’s autocovariance, represents the input’s autocovariance, and and stand for the cross-covariances between the input and output, respectively.
3. Results
3.1. The NECC Investigation
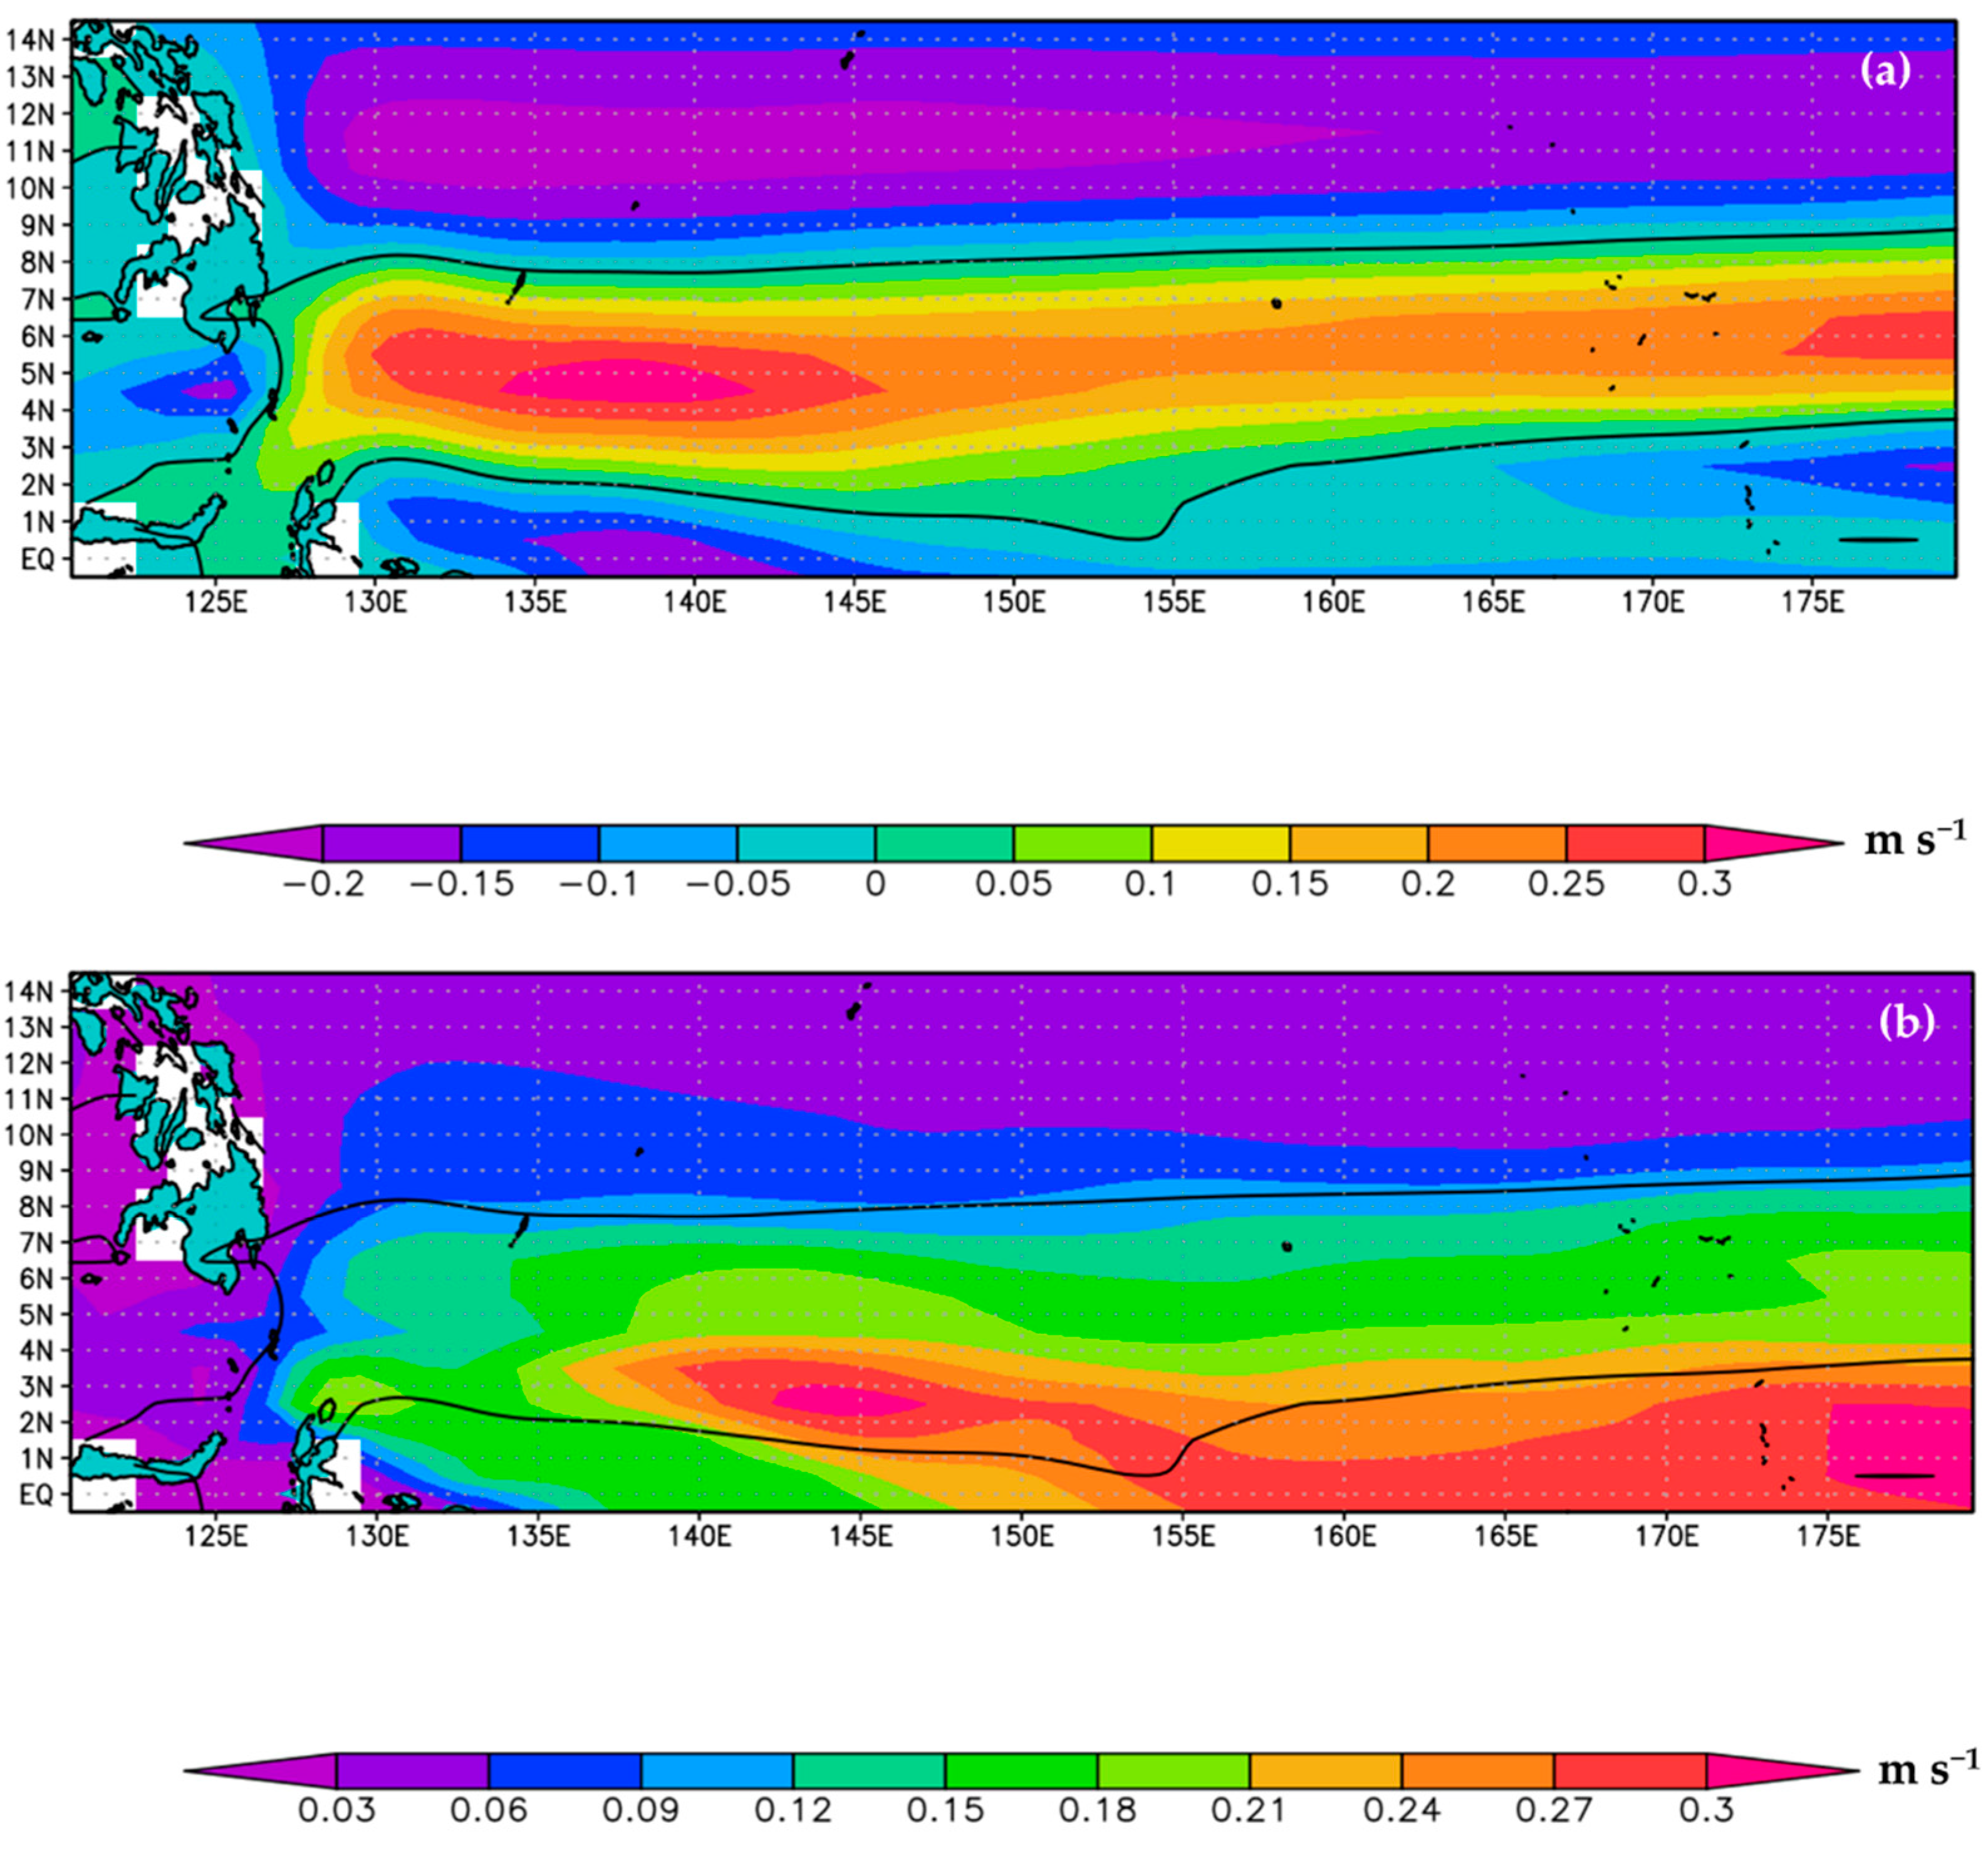
Using the ORAS5 dataset, we took the average of the zonal currents west of the dateline, as shown in Figure 3a. A positive value represents eastward movement, which is one of the NECC flow’s features. On average, the NECC’s primary pathway is centered about latitude 5° N in the upstream area, but as it travels eastward, its track progressively drifts to the north of 6° N near the dateline. However, the mean NECC pathway in the Western Pacific runs relatively within latitudes of 0.5° N to 8.5° N (black line in Figure 3). Moreover, this primary pathway appears wider west of 160° E and thinner east of it. In terms of magnitude, the NECC recorded its maximum speed between longitudes 135° E and 140° E, with a magnitude of more than 0.3 m/s.
The standard deviation was easily determined using monthly data collected over 40 years, and the results are shown in Figure 3b. The value fluctuates substantially around the NECC flow pathway according to the standard deviation distribution, suggesting that the NECC flow’s meridional tilt is very dynamic and varied. South of 5° N, the zonal current fluctuation is quite substantial, with geographical locations at longitudes 140° E to 145° E and near the dateline. This pattern may imply that the NECC flow is at its strongest or weakest state when it is meridionally close or away from the equatorial region, respectively. As stated in the Section 1, previous investigations have confirmed this [2,8,9]. Moreover, this also suggests that the NECC is often part of an eastward current that extends equatorward from 8° N.
3.2. EOF Analysis
3.2.1. Spring
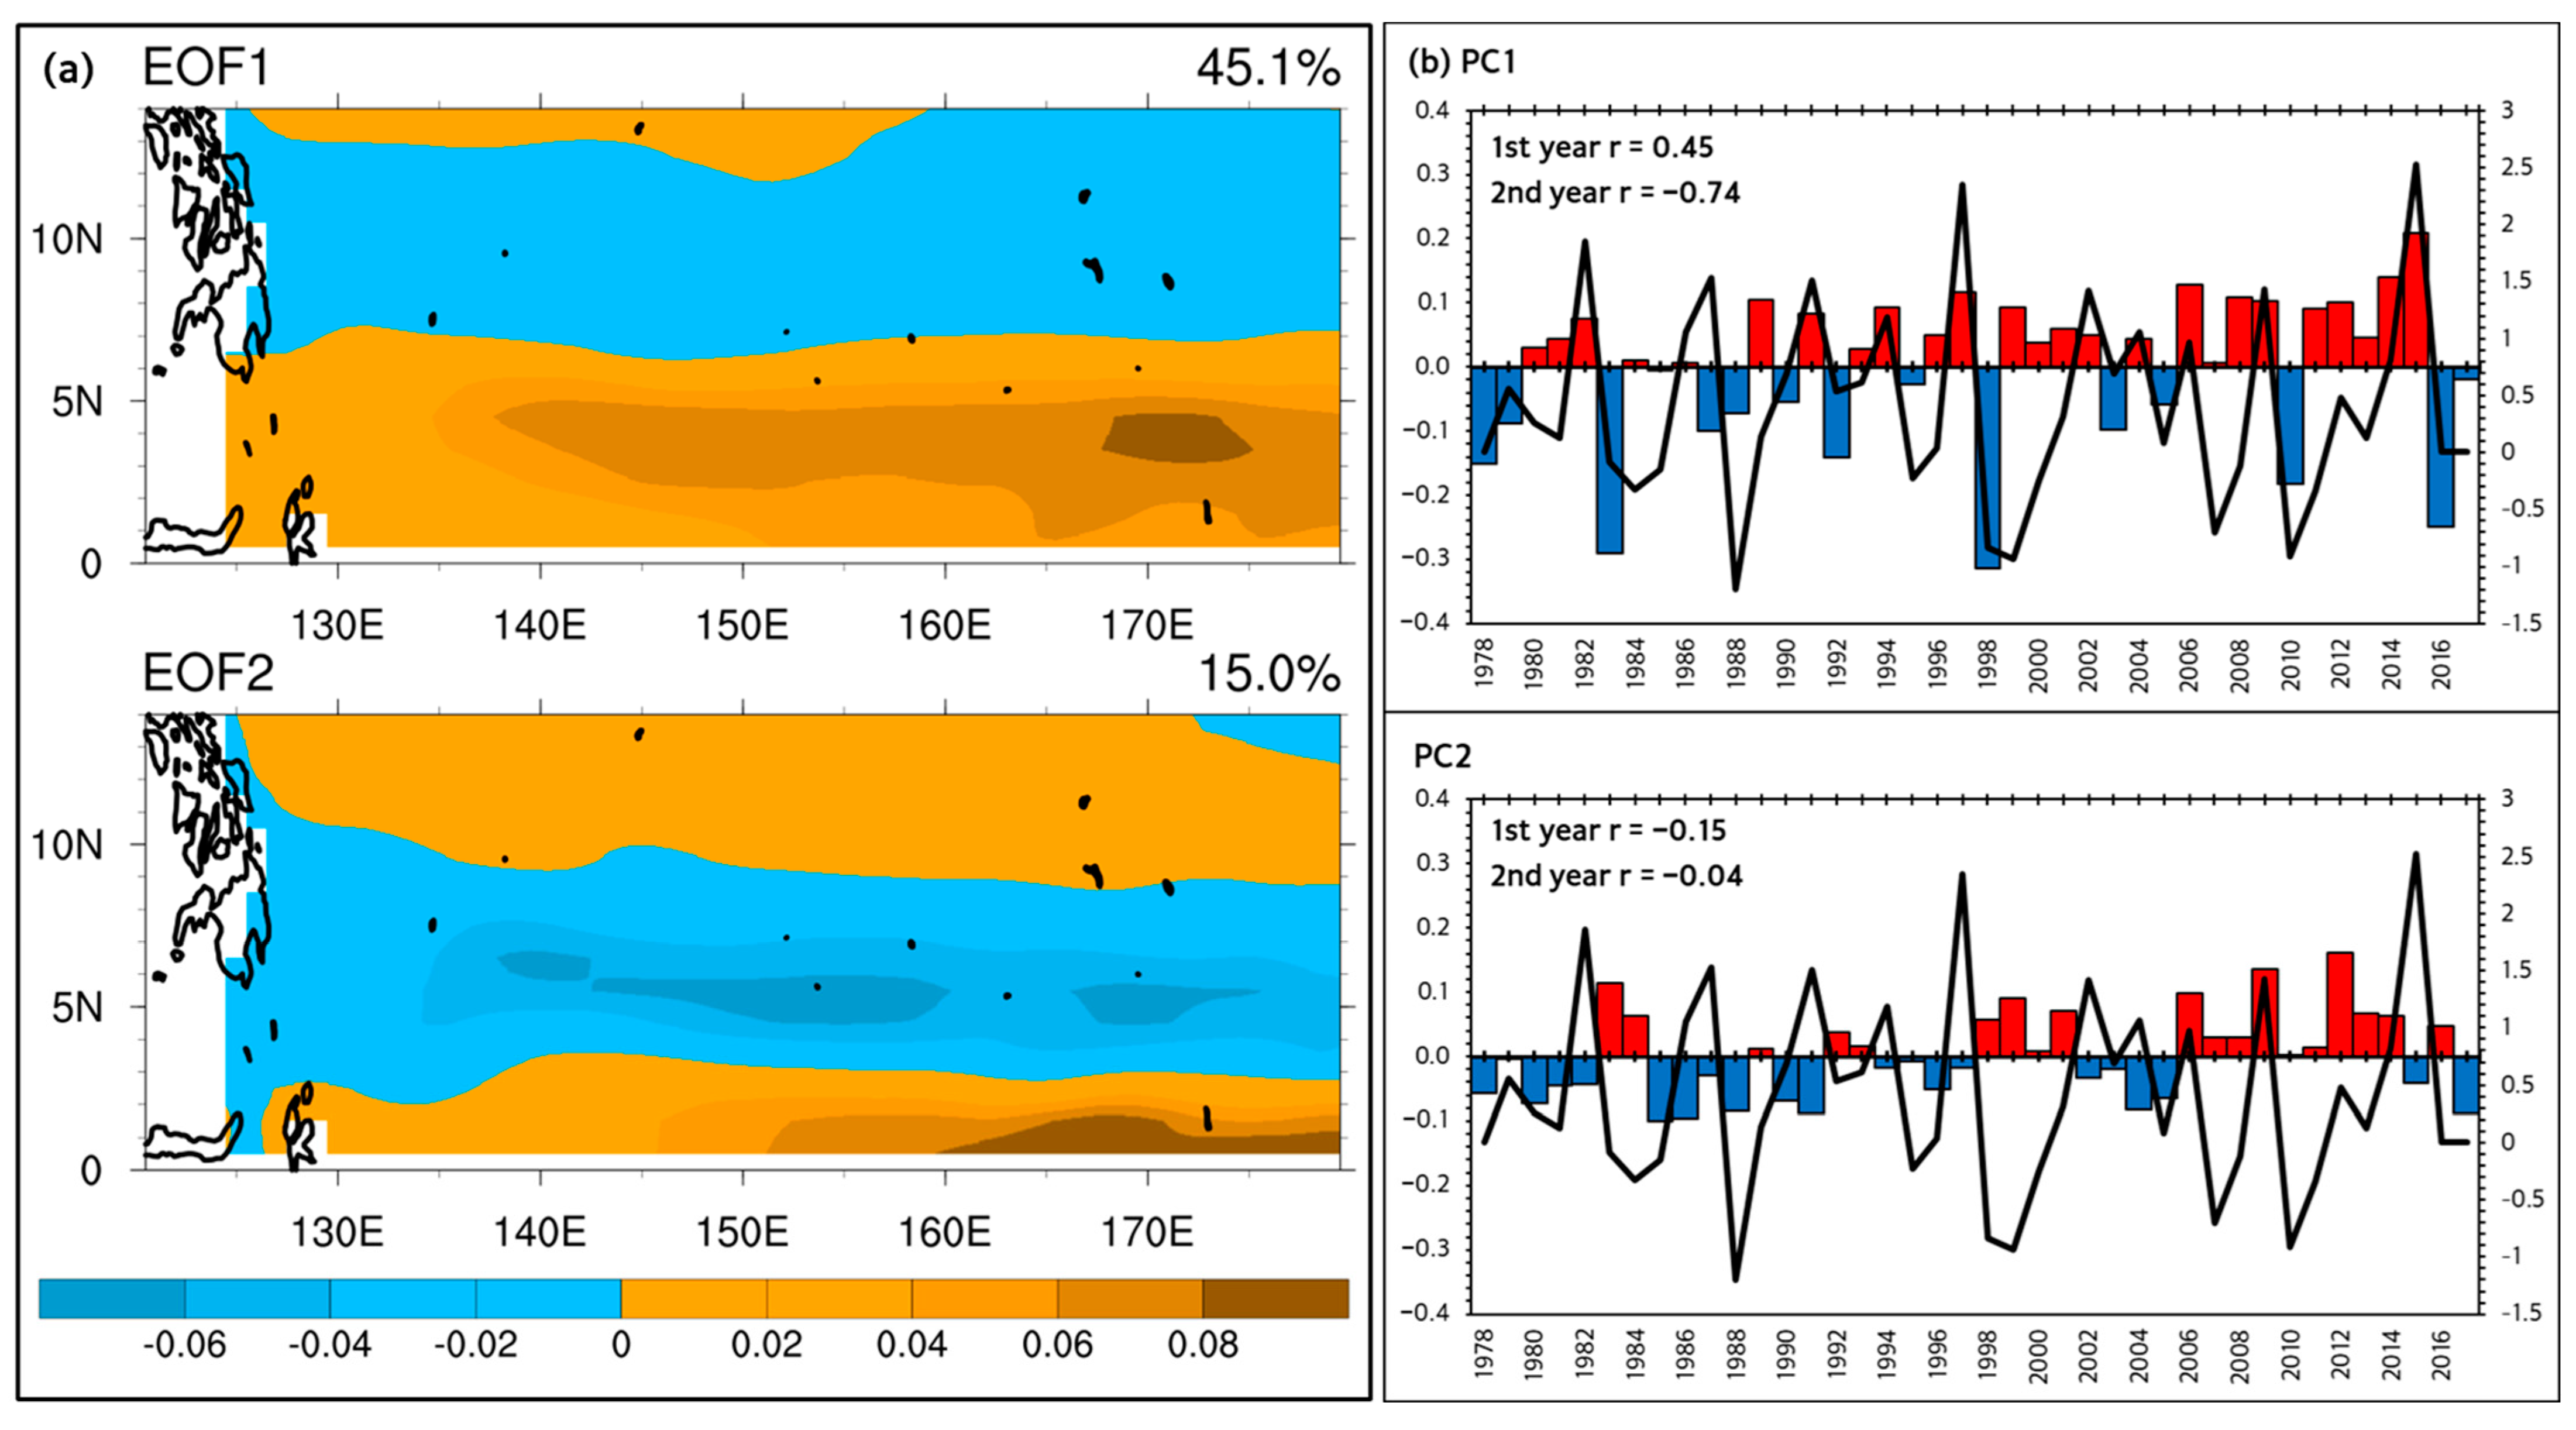
Figure 4 depicts the first two EOF modes of the zonal current of MAM in the Western Pacific Ocean. Together, these modes explain 60.1% of the entire variation. The first mode (EOF1) accounting for 45.1% of the total variance, while the remaining 15.0% is explained by the second mode (EOF2). EOF1 has a dipole pattern, with positive anomalies south of 7° N (Figure 4a). This pattern is also a common pattern for the eastward flow of the Western Pacific, which strengthens and shifts southward during the development stage of an EN event. EOF2 features a tripole pattern (positive, negative, and positive), has maximum positive anomaly further south near the equator, and can be found east of 160° E longitude.
The time series PC1 displays interannual variation (Figure 4b). In this part, we split the spring season into two halves: the first year and the second year of EN. The springtime in the second year of EN, which is frequently associated with the decaying stage, has a fairly strong correlation with ENSO, as measured by a correlation coefficient of −0.74 between the corresponding time series PC1 and the NIÑO 3.4 index. This indicates that the eastward flow experiences a decline in strength during the second year of the EN event. On the other hand, the PC1 springtime during the first year of an EN displays only a relatively small association with the NIÑO 3.4 index (r = 0.45). Moreover, the corresponding time series PC2 has no substantial association with the ENSO event (correlation coefficient −0.15 and −0.04), with quasi-decadal timescale variability after the mid-2000s. From PC1, we examine the amplitude produced by each form of the EN. It is quite difficult to assess which episode delivers a greater eastward flow magnitude during the first year of EN, the CP or EP episode. Despite this, the most significant amplitude was observed during the first year of the EP episode that occurred in 2015/2016. In addition, it was found that the extreme EP episodes that occurred in 1982/1983, 1997/1998, and 2015/2016 were followed by an eastward current that was substantially weaker the following year. Every EN event has on average, a positive phase amplitude in the first year and a negative phase amplitude in the second year, with the exception of the EP and CP episodes that occurred in 1986/1987 and 1987/1988, respectively.
3.2.2. Summer and Autumn
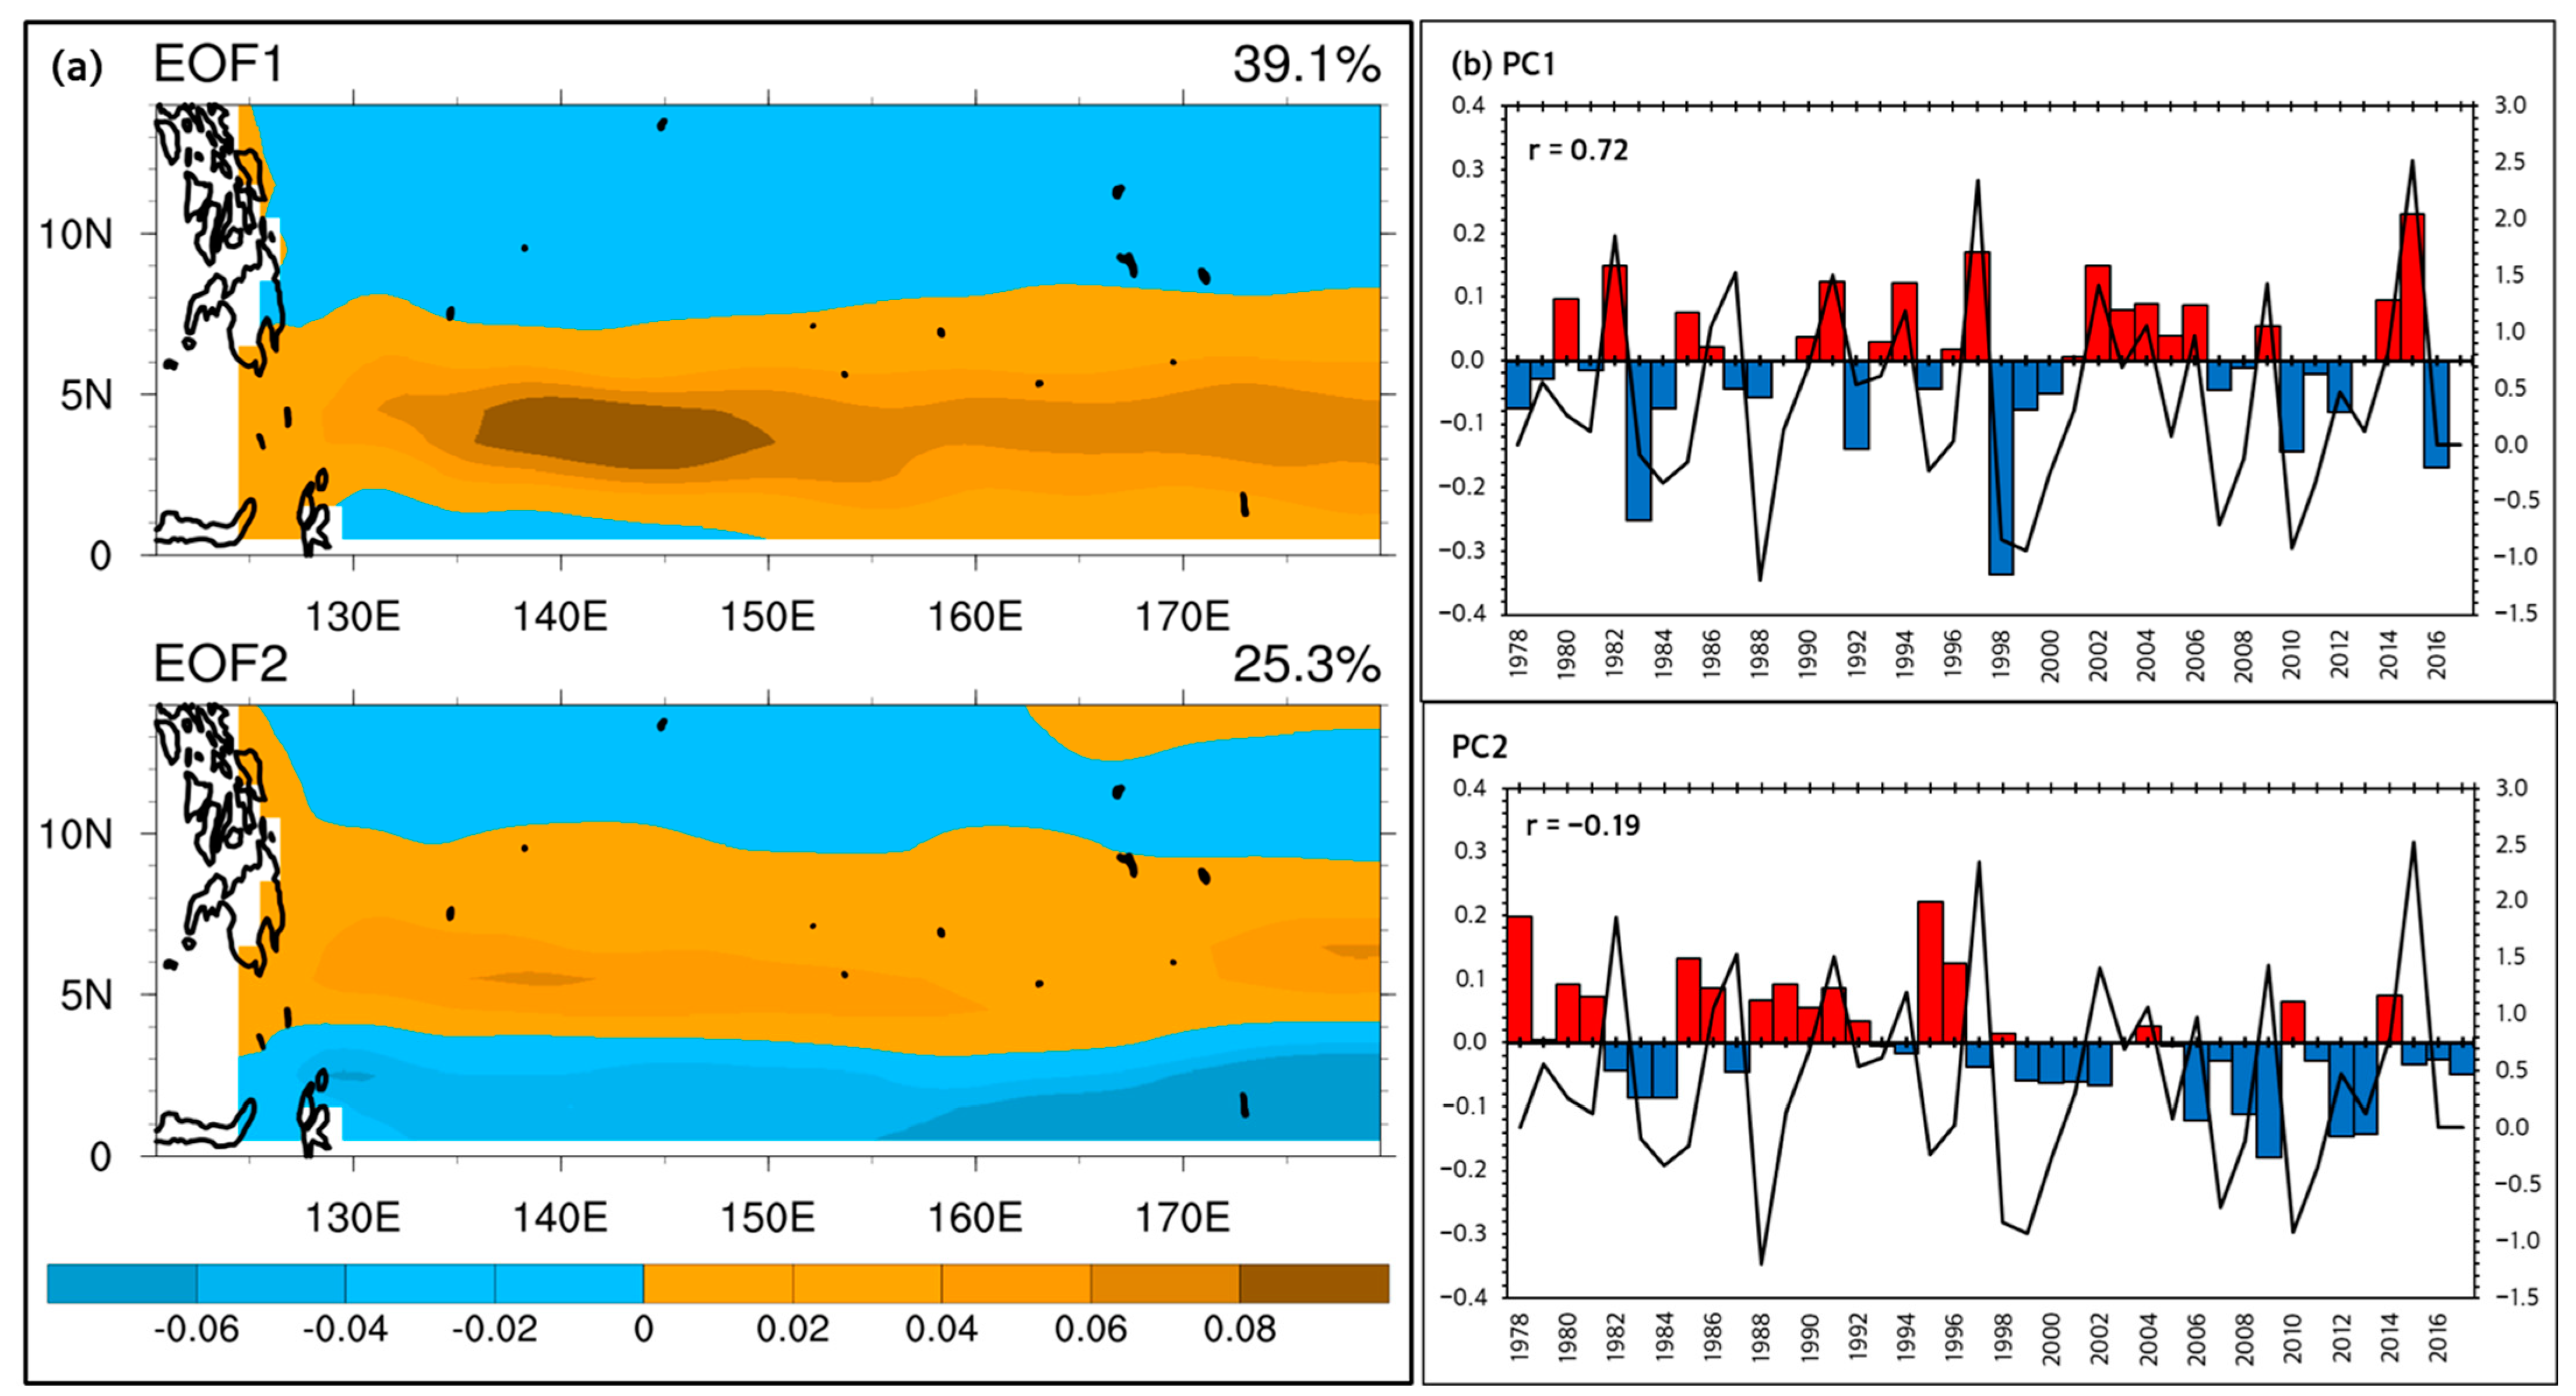
Figure 5 depicts two unique patterns of fluctuation of zonal current in the summertime: the EOF1 explains 39.1% of the overall variance, while the matching PC1 displays pronounced interannual variability (Figure 5a). With the phase change from positive to negative amplitude in the early 2000s, the EOF2 is responsible for 25.3% of the variance that predominates on decadal-scale fluctuation in PC2. The EOF1 follows a tripole pattern, which may alternatively be described as “negative, positive, and negative”. Its maximum can be found to the west of the 150° E longitude line. This tripole pattern is also characteristic of the average zonal current found in the Western Pacific Ocean. The EOF2 has some of the same characteristics as the EOF1, which also displays a “negative, positive, and negative” pattern, albeit with positive anomalies located further north of 4N.
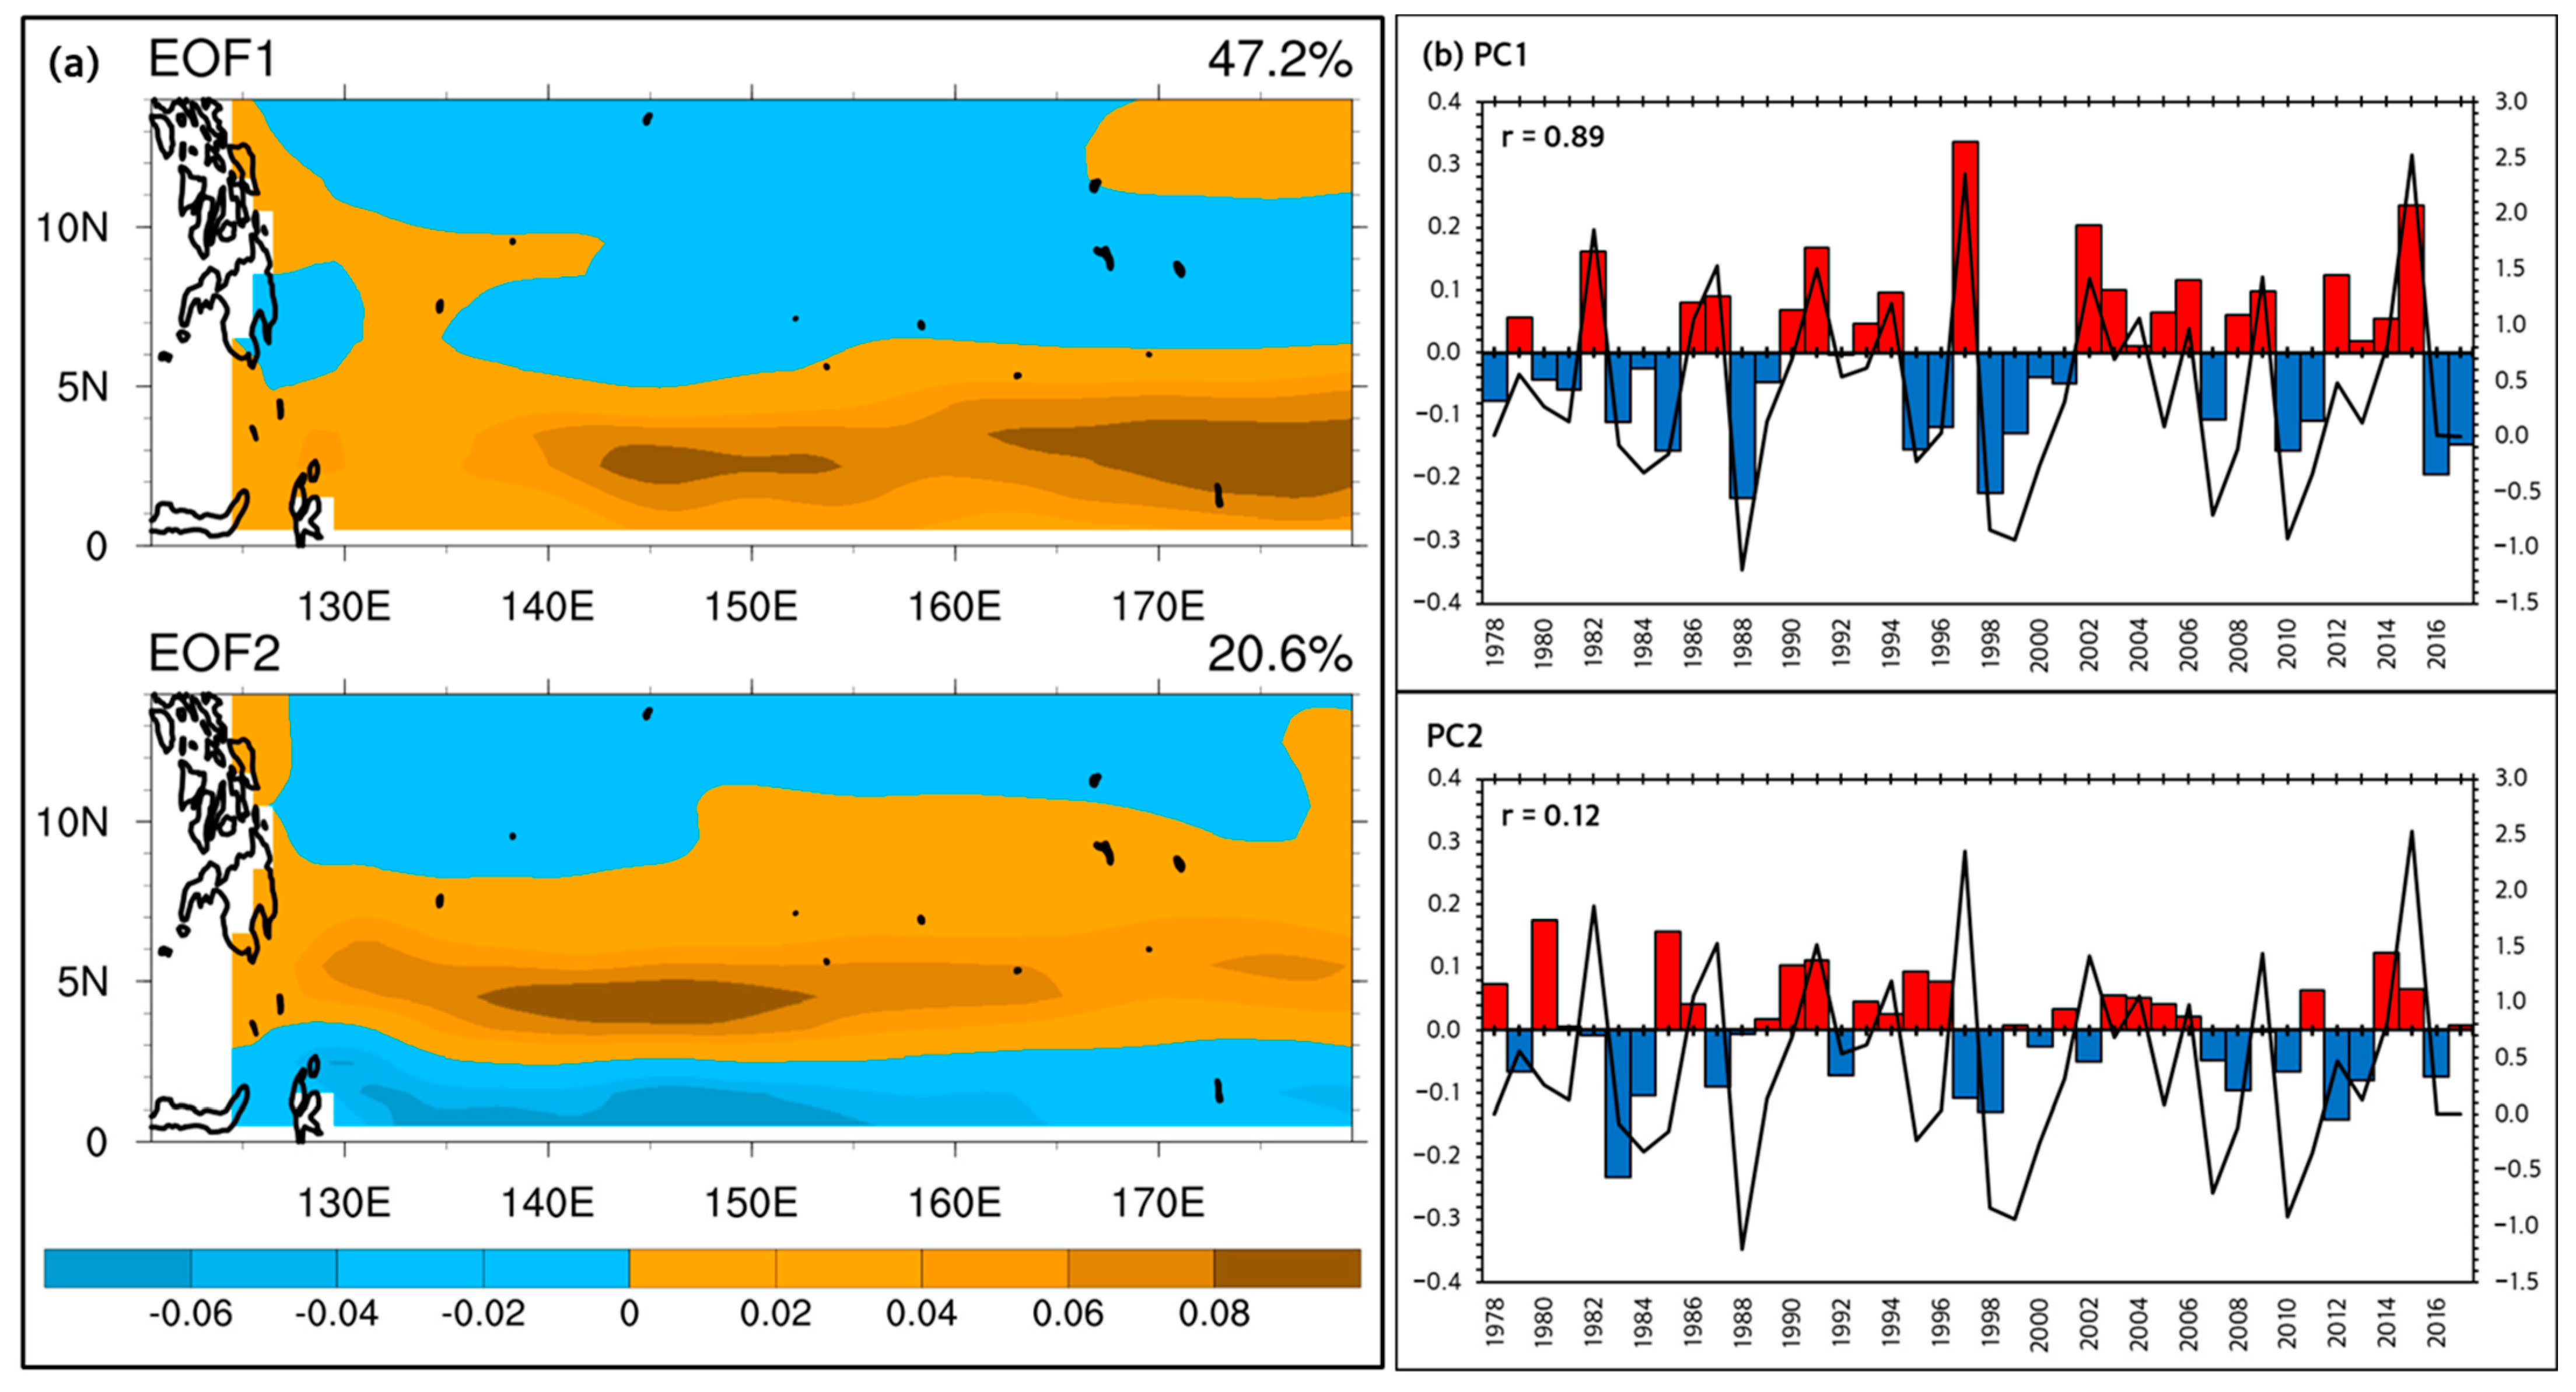
The EOF1 for autumn accounts for 47.2 percent of the total variance. It exhibits a positive anomaly to the south of 6° N, and its maximum is found close to the dateline (Figure 6a). This pattern shares certain characteristics with the EOF1 seen in the spring. The corresponding time series PC1 denotes the interannual variability of this pattern. The EOF2 explains 20.6% of the variance, reveals a tripole pattern (negative, positive, and negative), and is maximal at the west of 155° E. Interannual variations can also be seen in the PC time series corresponding to the EOF2 (PC2).
The PC1 strongly connects with the NIÑO 3.4 index, with a correlation coefficient of 0.72 and 0.89, respectively, for summer and autumn (Figure 5b and Figure 6b). This implies that in every circumstance, EN has an impact on enhancing the eastward flow, while the relationship between PC2 and NIÑO 3.4 is negligible. From the PC1, the 2015/2016 EP episode was documented as having the greatest eastward current throughout the summertime between 1978 and 2017, with the 1997/1998 EN EP episode coming in as a close second. In addition, another difference is that a stronger eastward current occurred in the autumn EP EN 1997/1998 than in the 2015/2016 EP EN. During EP episodes, the amplitude of eastward flow appears to be stronger than it does during CP episodes, with the exception of the EP EN 1986/1987. When comparing the autumnal amplitudes generated by each type of EN, comparable results are seen. The EP and CP episodes alternately displayed stronger or weaker amplitude results, but overall, the results were nearly equivalent. For instance, the 1997/1998 and 2015/2016 EP ENs are the top two in producing the magnitude of the eastward current over the past 40 years. On the contrary, the CP event in 2002/2003 had a stronger eastward flow amplitude than the EP episodes in 1982/1983 and 1986/1987.
3.2.3. Winter
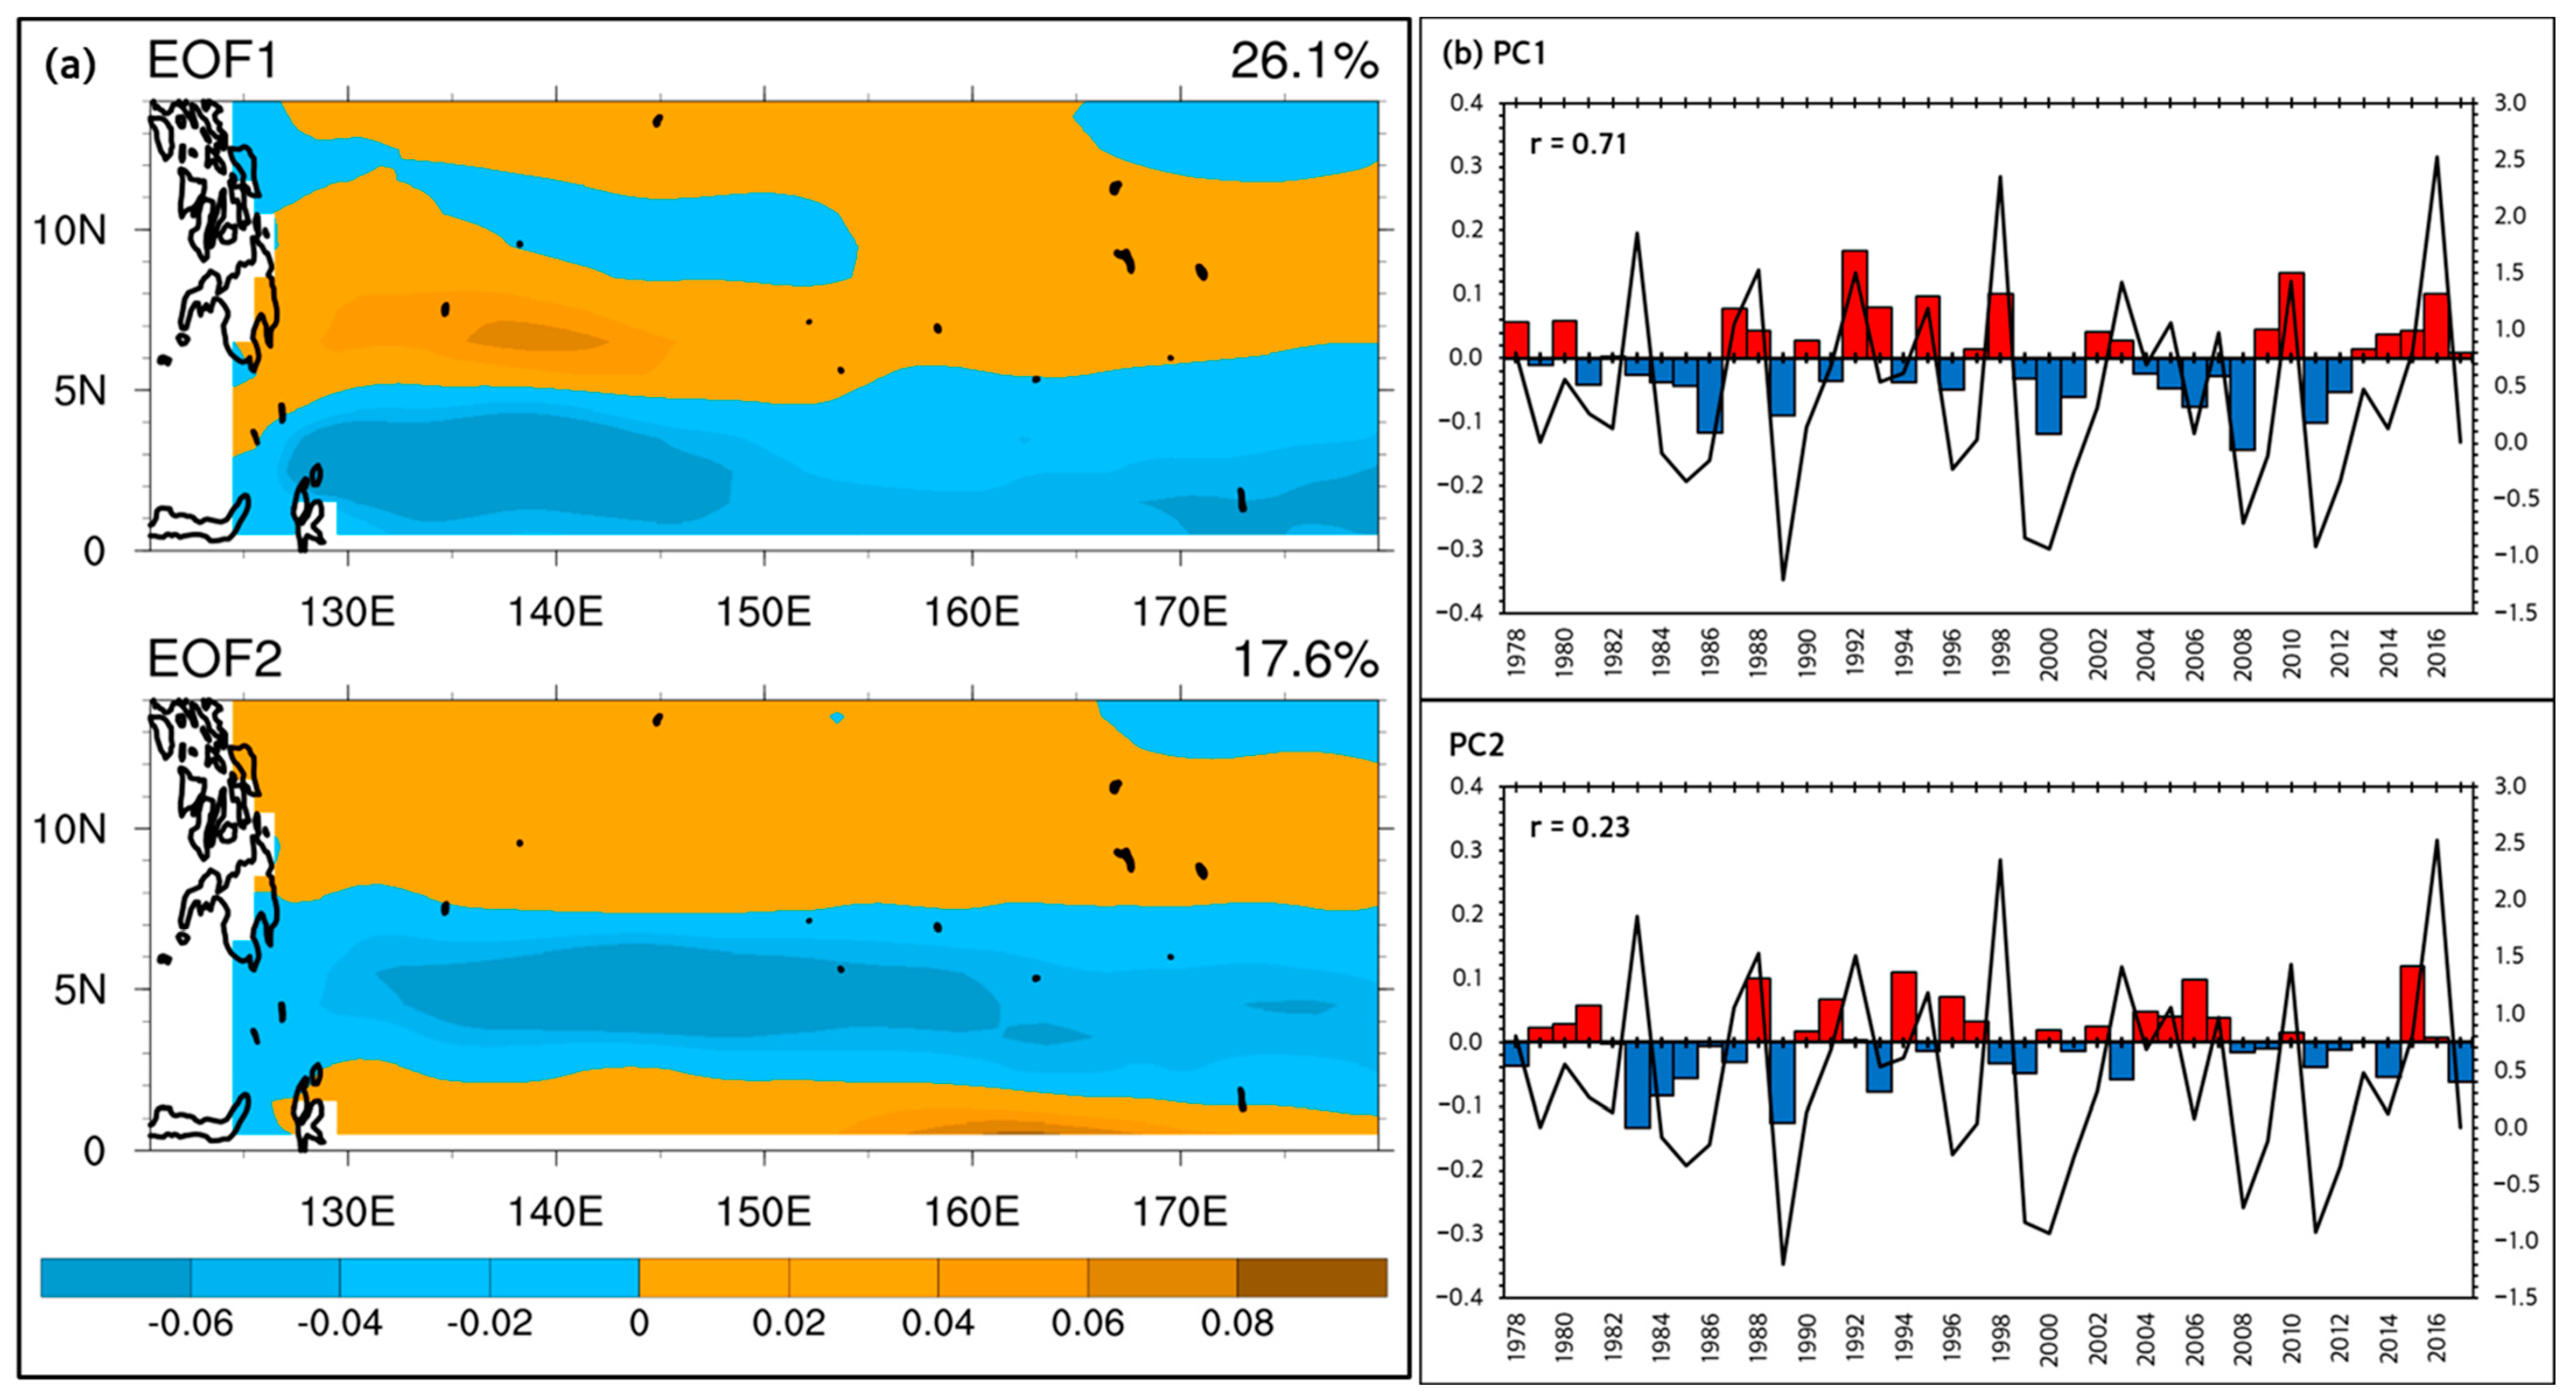
The EOF analysis gave two dominant winter modes of variations, which explained 26.1% in EOF1 and 17.6% in EOF2 (Figure 7a). The spatial distribution of EOF1 is characterized by positive anomalies to the north of 4° N. This is a typical pattern for the eastward-flowing NECC that usually occurs during the LN year when the NECC is known to weaken and shift northward. On the other hand, EOF2 in winter has some similarities with EOF2 in spring. In this mode, a strong negative signal is observed to the east of 160° E.
The corresponding time series PC1 suggests that the eastward-flowing NECC variation is significantly related to the ENSO, as indicated by the coefficient correlation > 0.7 (Figure 7b). Except for the EP episode that occurred in 1982/1983, there is a constant appearance of a positive phase that reflects the intensification of the eastward flow during EN years with moderate to very strong intensity. Out of the nine EN events, the two greatest amplitudes of the eastward flow were observed during the CP episode, specifically in 1991/1992 and 2009/2010. Nevertheless, the CP episodes that occurred in 1987/1988 and 2002/2003 brought about a lower positive phase amplitude than the EP episodes did. Unlike PC1, the time series for PC2 shows that ENSO does not significantly affect the eastward flow.
3.3. The NECC Transport
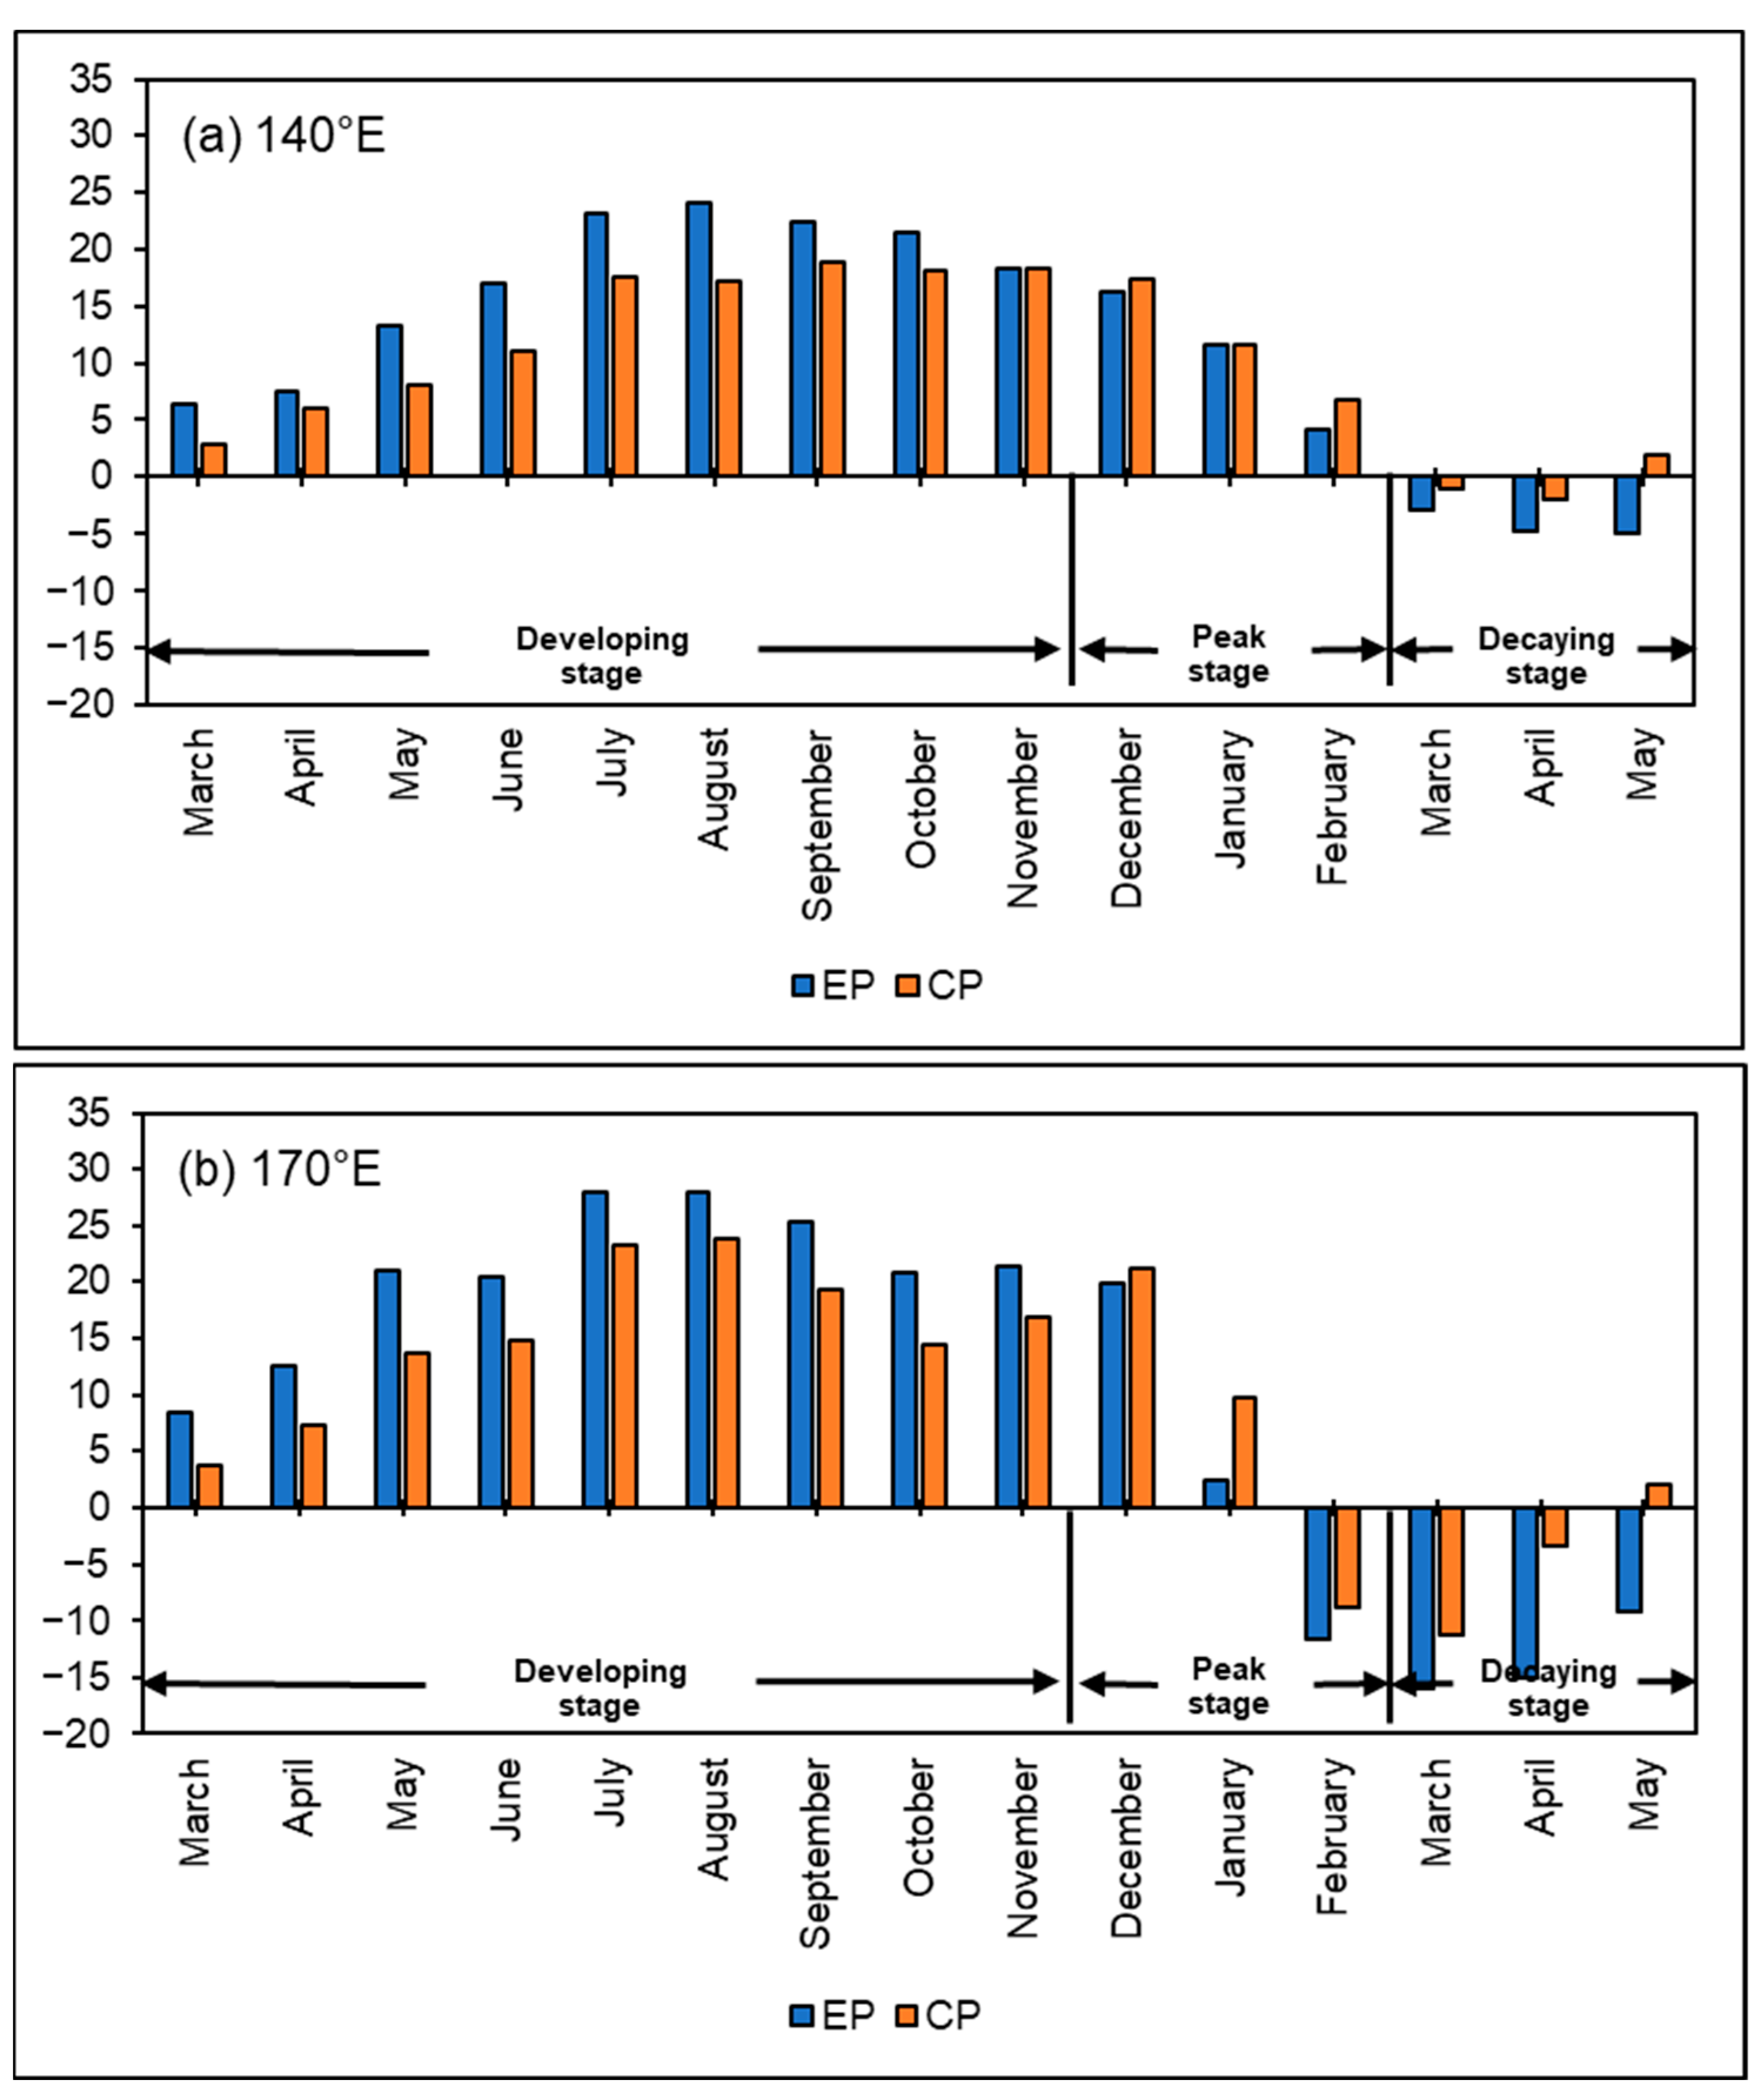
The EOF analysis results derive some crucial information concerning the association between the NECC flows and EN events. Nonetheless, distinguishing whether the greater NECC magnitude was generated by the CP or EP event is exceedingly difficult, particularly from spring through autumn. Therefore, Figure 8 depicts the average amount of eastward transport that occurs each month in each form of EN. We decided to conduct the inquiry along lines 140° E and 170° E because the positive anomaly signal of zonal current occurred at its maximum at those longitudes. This decision is based on the spatial structure of the first mode that resulted from the EOF analysis.
As shown in Figure 8, both the upper and lower panels of the images demonstrate that the EP episode appears to have a stronger eastward flow than the CP episode in the first year of the EN events. According to the findings of EOF1 in the spring, the EP episodes that occurred in 1997/1998 and 2015/2016 were responsible for the most intense eastward flow in the first year of formation, and their findings were comparable to those displayed in Figure 8. Additionally, the results of the PC1 time series in the summer and autumn, showed that two EP episodes in the years 1997/1998 and 2015/2016 also contributed the greatest eastward flows between 1978 and 2017. This provides a good reason why the average eastward flow transport during a 40-year period was observed as the greatest during the development stage of the EP EN event (March to November). Conversely, when the development stage ends and the peak stage begins, the CP episode appears to be causing a greater eastward flow. This outcome is consistent with the winter’s PC1 time series finding, which found that the two CP episodes that occurred in 1991/1992 and 2009/2010 recorded the most powerful eastward flow events. In contrast, the decaying stage is characterized by westward transport flows being produced by the EP and CP EN, with the EP episodes having stronger westward transport flows than the CP events. During the decaying stage, the eastward-flowing NECC would appear to disappear or become extremely faint at a longitude of 170° E. The PC1 time record has already detected this kind of phenomenon, resulting in a considerable weakening of the eastward flow one year after the development of the EP EN in 1982/1983, 1997/1998, and 2015/2016. These three instances all took place in the spring.
3.4. The Westerly Wind
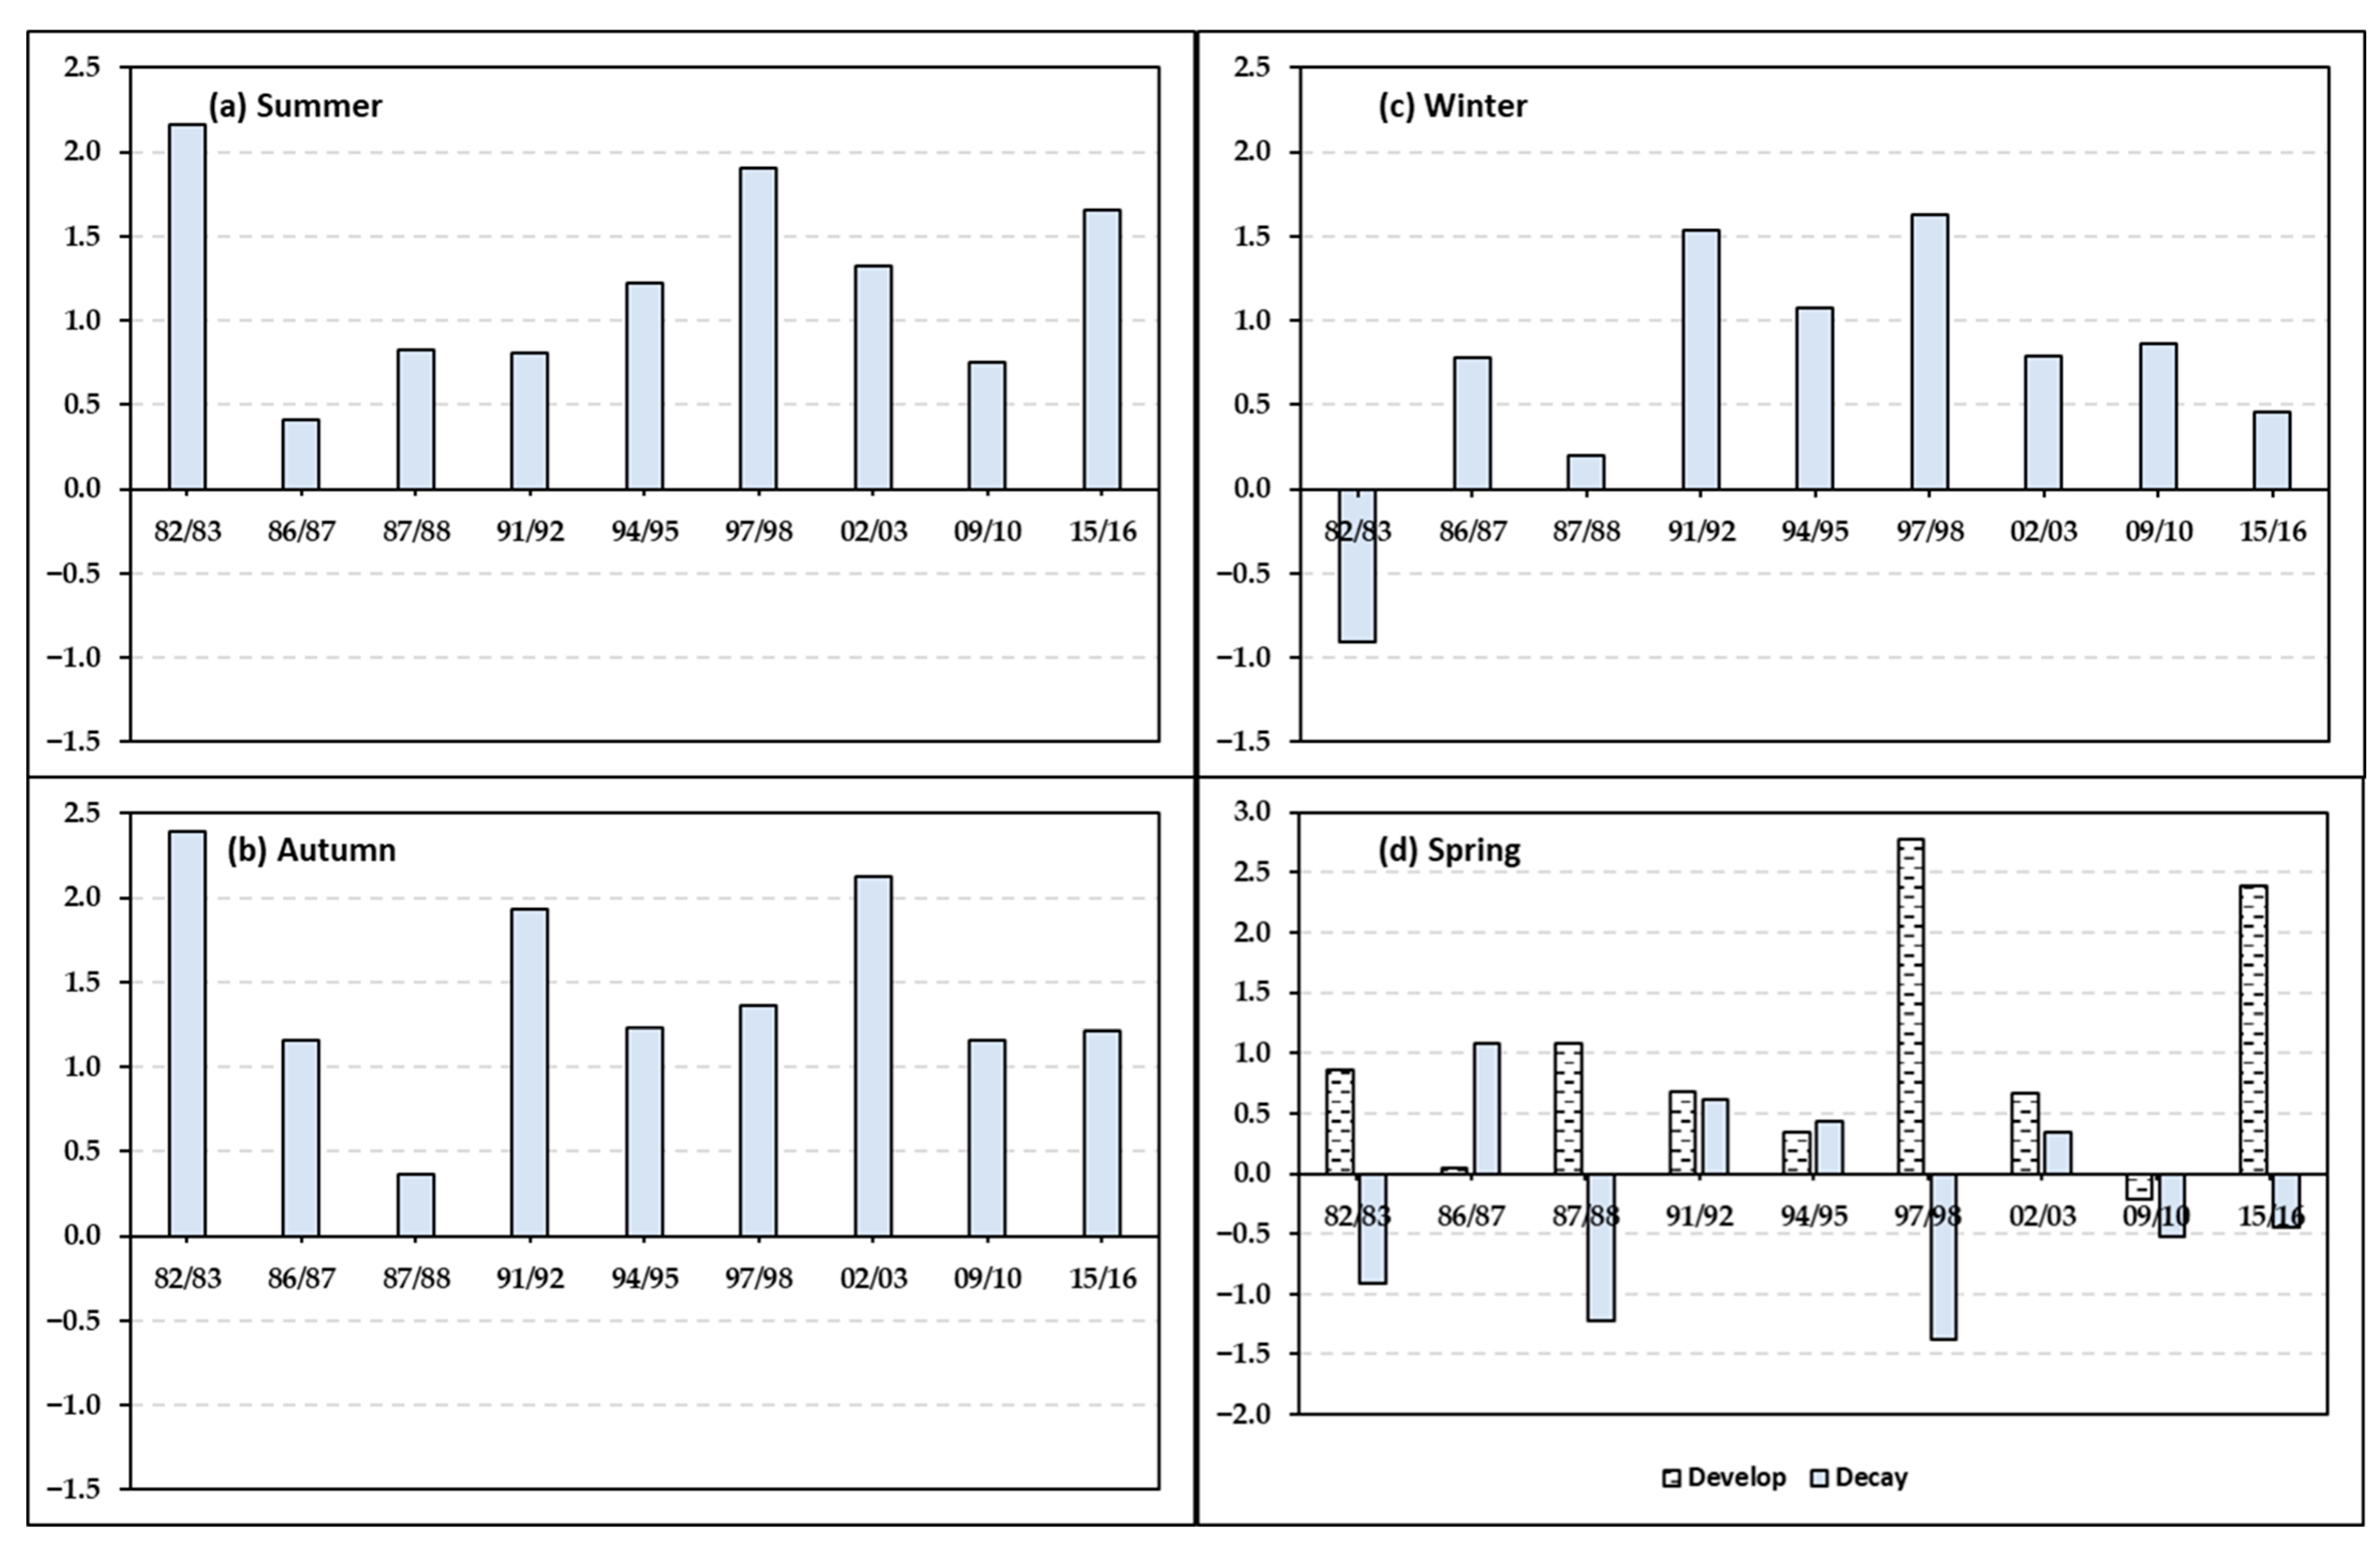
Almost every episode of EP EN demonstrates that the NECC went through a considerable decrease in strength one year following the development stage. He et al. [37] discovered and detailed how the EP EN change into LN events more frequently than the CP EN events. The reversal of westerly zonal winds in the Western Pacific was essential for the EP EN change to the LN event. This explains why there was a considerable attenuation of zonal current amplitude in the EP EN event’s second year in springtime (Figure 9d). As was mentioned in the summer PC1, which has a significant association with ENSO events, two very strong EP episodes that occurred in 1997/1998 and 2015/2016 were seen to yield more powerful zonal current magnitudes than other EN events. The moderate CP episode that occurred in 2002/2003 came in third, producing a zonal current magnitude that is almost as large as the moderate EP episode in 1982/1983. One of the causes of this variability can be related to the influence of the westerly wind strengthening, which blows from west to east.
Anomalous westerly winds were shown to be exceptionally robust during the summer months during three separate EP episodes (1982/1983, 1997/1998, and 2015/2016) (Figure 9a). This is consistent with the PC1 results, which indicated that the zonal current had the largest amplitude during those EP episodes. During the autumn, the westerly wind anomaly of the 2002/2003 CP episode was documented to be greater than other EN occasions, with only the 1982/1983 EP EN event outperforming it (Figure 9b). On the other hand, based on PC1, the EP episodes that occurred in 1997/1998 and 2015/2016 revealed a greater amplitude of the zonal current than the CP 2002/2003. When compared to other EN years, the CP years 1991/1992 and 2009/2010 both produced a greater zonal current amplitude during the wintertime PC1, despite the fact that the 1997/1998 EP episode witnessed the most extreme westerly wind anomaly recorded (Figure 9c). However, in terms of the amplitude of the zonal currents, the CP EN that developed in 1991/1992 and 2009/2010 was stronger than the EP EN in 1997/1998. Extreme EP EN in 1997/1998 and 2015/2016 caused exceptionally strong westerly winds during the springtime of the first EN event (Figure 9d). The third is the CP 1987/1988, which is a continuation of the EP 1986/1988. In the spring of the second year EN, the easterly wind developed in all EP EN, except for the special event of 1986/1987, which evolved into CP EN in the subsequent event. These results explain why EP EN in its decaying stage has more eastward transport reduction than CP EN.
4. Discussion
This research aims to analyze the influence of two different types of EN events on the NECC flow west of the dateline from 1978 to 2017 by using the 0–100 m depth zonal current dataset in ORAS5 as the main data. By applying EOF to analyze the data, we can determine the prevailing distribution of the NECC flow in each season. In addition, we use the ERA5 wind dataset provided by ECMWF to assess the strength of the westerly wind in the Western Pacific for each EN event.
The findings of the EOF analysis demonstrate that the PC time series in the first mode of each season shows a relatively strong correlation between the Western Pacific zonal current with the event of ENSO events (r > 0.7 and −0.7). The only exception to this is the first year of ENSO event in the springtime, which shows a relatively low connection (0.45 correlation coefficient). This would imply that the influence of ENSO on the NECC flow would be at its minimum when ENSO events were at their initial phase. During the first EN year, there was an overall increase in the NECC magnitude flow observed throughout all four seasons. However, we will go into more detail in this section and start from the development stage of the EN. A previous study on estimating the duration of EN events was conducted by Wu et al. [38]. Their observations show that EN events generally begin a development stage between boreal spring and early autumn. During the period from 1978 to 2017, EN events with moderate to extremely strong magnitude were recorded as four events of EP episodes and five events of CP episodes 1978 to 2017.
EOF analysis for springtime, during the first year of EN, demonstrates EP and CP episodes have identical impacts in causing substantial eastward flow. All events result in a positive phase in the first mode of EOF, except EP 1986/1987 and CP 1987/1988. The strength of the westerly wind that developed in the Western Pacific suggests that EN 1986/1987 did not generate a powerful westerly wind like a typical EN event does during the spring (Figure 9). In EN 1986/1987, the central Pacific SST began to warm around late summertime, followed by a strengthening of the westerly wind anomaly [39]. Because of this late development stage, the eastward-flowing NECC in the first year of EN did not experience any strengthening in the spring. While an episode of the 1987/1988 CP EN is a continuation of the previous year’s EN, with a development stage and mechanism that is not typical of other EN events. Almost every episode of EP EN indicated that the NECC had a significant weakening in the spring of the second year. He et al [37] reported that the reverse westerly wind, can be found most commonly in the EP EN, is the wind that is responsible for the turning of EN events into LN events. Since the NECC flow is greatly controlled by the wind pattern over the Pacific Ocean [40], it is possible that this is the factor that led to the considerable weakening of NECC that occurred in the second year of the EP episode.
Basically, EP EN are observed to produce stronger NECC magnitude than CP episodes in the summer and autumn, with the EP episodes in 2015/2016 and 1997/1998 having the strongest eastward flow. On the other hand, the 2002/2003 CP episode provided a fairly strong NECC flow, slightly stronger than the 1982/1983 EP episode during the autumn. Although, the EP EN 1982/1983 event featured the strongest westerly wind, followed by the CP episode in 2002/2003 as the second strongest. The westerly wind in the Western Pacific promotes an upwelling Rossby wave, which lowers the water level, then the westerly wind strengthens the eastward flow [41,42,43,44]. This suggests that the strong westerly wind was responsible for a significant NECC magnitude in the 2002/2003 EP EN. Some prior articles have reported on the uniqueness of CP EN in 2002/2003 but did not address its relationship to the NECC [39,43,45].
As stated in the PC1 time series for winter, CP episodes appear to be more likely than EP EN to produce a stronger eastward current. The two strongest eastward flows were documented at CP events that took place in 1991/1992 and 2009/2010. However, the magnitude of the NECC flow was not significantly enhanced in the CP episodes 1987/1988 and 2002/2003, which were even weaker than the EP episodes 2015/2016. In CP 1987/1988, the weaker NECC occurs as a result of the weakening of the westerly wind generated by the CP EN, which transitions into an LN event of high intensity in the subsequent event [46]. Moreover, the unusually strong westerly wind that occurred during the development stage did not persist into the peak stage and experienced a significant weakening in episode CP 2002/2003.
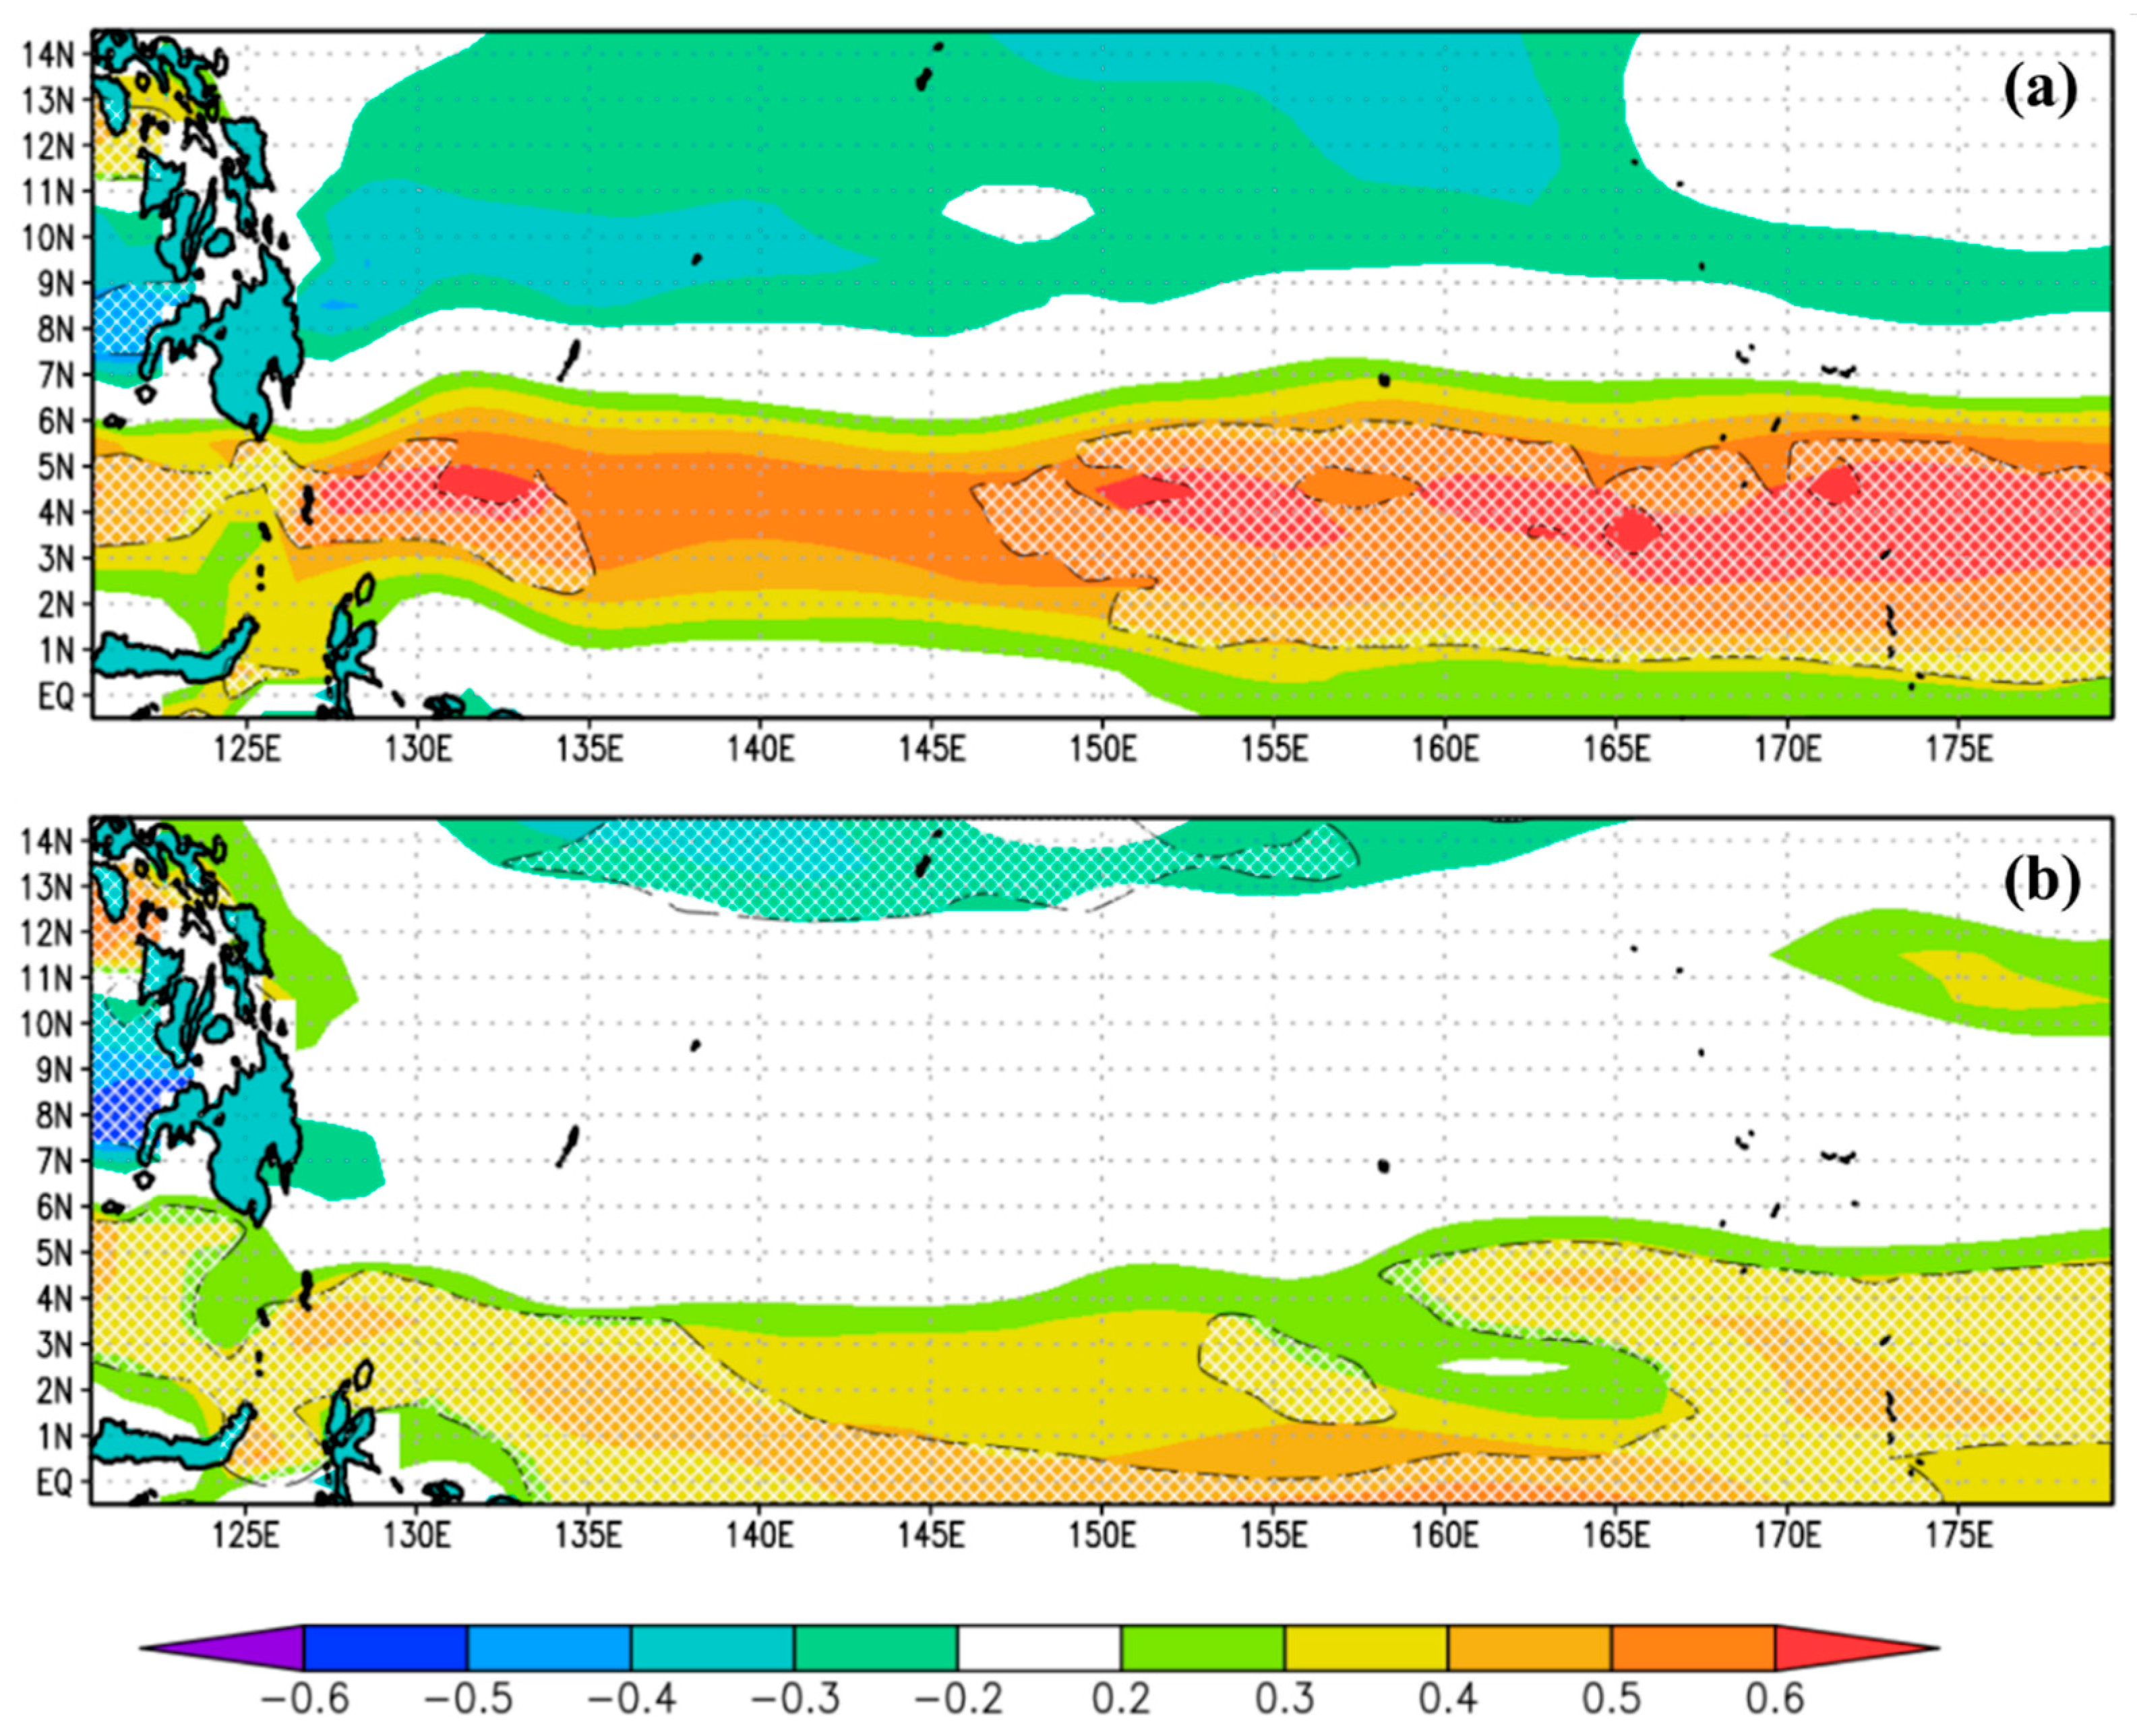
According to the results presented above, it has been found that the westerly wind’s force impacts the NECC that is moving in an easterly direction. Although this is not always the case, an EN year that has a higher wind intensity can occasionally result in a weaker eastward flow than other EN events or vice versa. This suggests that the NECC flow strengthening is also influenced by other factors, such as the propagation of Rossby and Kelvin waves [7,9,25]. In Figure 10, we generated a correlation map by applying time series data on the zonal current component and the strength of the westerly wind anomaly. This will allow us to determine how much of an impact the wind has on the zonal current NECC in the Western Pacific. Similar results may be seen in the correlation map between the westerly wind and EP (Figure 10a) and CP episode (Figure 10b), with significant correlation located around the upstream area (128° E to 136° E) and east of 160° E. Despite the fact that positive correlation in the CP episodes located more southerly than the EP EN. In the case of the EP episode, the positive correlation lay in the average region of the NECC. It is interestingly to observe that the correlation coefficients with the highest value also appear in EP EN (r > 0.6). This indicates that westerly winds have a greater impact on the NECC during the EP EN events between the years 1978 and 2017. Because the EP EN frequently has anomalous westerly winds that were greater in the first year and much weaker in the second. Previous studies discovered that a strong westerly wind burst triggered EP episodes, while CP episodes were caused by a weaker westerly wind burst [47,48].
We computed the average transport intensity obtained near the upstream and near the dateline to determine the growth trend of the NECC flow for each form of EN over 40 years. Figure 8a,b shows nearly identical findings. During the development stage, the mass transport that flows to the Central-Eastern Pacific is stronger for the EP event than for the CP episode. This might be attributed to the fact that EP episodes develop more often with greater intensity, causing a major strengthening of the westerly wind that frequently happens during EN events, allowing more warm water masses to travel to the Central-Eastern Pacific. On the other hand, CP episodes appear to have greater eastward mass transport when they reach the peak stage than EP episodes. The considerable decrease in mass transport to the Central-Eastern Pacific during the peak stage of EP episodes is due to the frequent event of EP EN events that eventually transform into LN events in the subsequent event [37].
5. Conclusions
In this section, we outline some of the key findings from our experiments. This study’s observations of the NECC flow in this study focused on its reaction to two forms of EN events in the Western Pacific from 1978 to 2017. By conducting an investigation utilizing ECMWF’s ORAS5 data reanalysis, we reached the following conclusions:
- 1.
- The EP episodes frequently caused a stronger NECC magnitude than the CP EN throughout the development stage. In the peak stage, on the other hand, the CP EN is detected more regularly, resulting in a greater NECC magnitude.
- 2.
- After a peak stage in winter, the magnitude of the NECC significantly reduced as it approached spring, one year following the EP episode’s development stage.
- 3.
- During the EP EN event between 1978 and 2017, the strength of the westerly wind had a more significant impact on the NECC than the CP episode.
Author Contributions
Conceptualization, Y.J.W. and Y.H.; methodology, Y.J.W. and Y.H.; software, Y.J.W. and U.J.W.; validation, Y.J.W. and Y.H.; formal analysis, Y.J.W. and U.J.W.; investigation, Y.J.W. and U.J.W.; resources, Y.J.W. and U.J.W.; data curation, Y.J.W. and U.J.W.; writing—original draft preparation, Y.J.W. and Y.H.; writing—review and editing, Y.J.W. and Y.H.; visualization, Y.J.W.; supervision, Y.H.; project administration, Y.H.; funding acquisition, Y.H. All authors have read and agreed to the published version of the manuscript.
Funding
This study was financially supported by a Grant-in-Aid for Scientific Research (C-2) from the Ministry of Education, Culture, Sports, Science, and Technology of Japan (20K04708).
Institutional Review Board Statement
Not applicable.
Informed Consent Statement
Not applicable.
Data Availability Statement
All of the data collected for the study can be downloaded for free from the APDRC website. soest.hawaii.edu/las/v6/dataset (accessed on 1 August 2022).
Acknowledgments
We gratefully acknowledge the Japan Ministry of Education, Culture, Sports, Science and Technology (MEXT), for providing funds to complete this research.
Conflicts of Interest
The authors declare no conflict of interest.
References
- Johnson, G.C.; Sloyan, B.M.; Kessler, W.S.; Mctaggart, K.E. Direct measurements of upper ocean currents and water properties across the tropical Pacific during the 1990s. Prog. Oceanogr. 2002, 52, 31–61. [Google Scholar] [CrossRef]
- Zhao, J.; Li, Y.; Wang, F. Seasonal Variation of the Surface North Equatorial Countercurrent (NECC) in the Western Pacific Ocean. Chin. J. Oceanol. Limnol. 2016, 34, 1332–1346. [Google Scholar] [CrossRef]
- Heron, S.F.; Joseph Metzger, E.; Skirving, W.J. Seasonal Variations of the Ocean Surface Circulation in the Vicinity of Palau. J. Oceanogr. 2006, 62, 413–426. [Google Scholar] [CrossRef]
- Zhou, H.; Yuan, D.; Guo, P.; Shi, M.; Zhang, Q. Meso-scale circulation at the intermediate-depth east of Mindanao observed by Argo profiling floats. Sci. China Earth Sci. 2010, 53, 432–440. [Google Scholar] [CrossRef]
- Kashino, Y.; Atmadipoera, A.; Kuroda, Y.; Lukijanto. Observed features of the Halmahera and Mindanao Eddies. J. Geophys. Res. Oceans 2013, 118, 6543–6560. [Google Scholar] [CrossRef]
- Webb, D.J. On the role of the North Equatorial Counter Current during a strong El Niño. Ocean Sci. 2017, 14, 633–660. [Google Scholar] [CrossRef]
- Zhao, J.; Li, Y.; Wang, F. Dynamical responses of the west Pacific North Equatorial Countercurrent (NECC) system to El Niño events. J. Geophys. Res. Oceans 2013, 118, 2828–2844. [Google Scholar] [CrossRef]
- Chen, X.; Qiu, B.; Du, Y.; Chen, S.; Qi, Y. Interannual and interdecadal variability of the North Equatorial Countercurrent in the Western Pacific. J. Geophys. Res. Oceans 2016, 121, 7743–7758. [Google Scholar] [CrossRef]
- Wijaya, Y.J.; Hisaki, Y. Differences in the reaction of north equatorial countercurrent to the development and mature phase of ENSO events in the western Pacific Ocean. Climate 2021, 9, 57. [Google Scholar] [CrossRef]
- Kessler, W.S. Observations of Long Rossby Waves in the Northern Tropical Pacific. J. Geophys. Res. 1990, 95, 5183–5217. [Google Scholar] [CrossRef] [Green Version]
- Wang, L.C.; Wu, C.R.; Qiu, B. Modulation of Rossby waves on the Pacific North Equatorial Current bifurcation associated with the 1976 climate regime shift. J. Geophys. Res. Oceans 2014, 119, 6669–6679. [Google Scholar] [CrossRef]
- Abe, H.; Tanimoto, Y.; Hasegawa, T.; Ebuchi, N. Oceanic Rossby Waves over Eastern Tropical Pacific of Both Hemispheres Forced by Anomalous Surface Winds after Mature Phase of ENSO. J. Phys. Oceanogr. 2016, 46, 3397–3414. [Google Scholar] [CrossRef]
- Zhou, H.; Liu, H.; Tan, S.; Yang, W.; Li, Y.; Liu, X.; Ren, Q.; Dewar, W.K. The Observed North Equatorial Countercurrent in the Far Western Pacific Ocean during the 2014–16 El Niño. J. Phys. Oceanogr. 2021, 51, 2003–2020. [Google Scholar] [CrossRef]
- Ashok, K.; Behera, S.K.; Rao, S.A.; Weng, H.; Yamagata, T. El Niño Modoki and its possible teleconnection. J. Geophys. Res. 2007, 112, C11007. [Google Scholar] [CrossRef]
- Kug, J.S.; Jin, F.F.; An, S.I. Two types of El Niño events: Cold tongue El Niño and warm pool El Niño. J. Clim. 2009, 22, 1499–1515. [Google Scholar] [CrossRef]
- Yeh, S.W.; Kug, J.S.; Dewitte, B.; Kwon, M.H.; Kirtman, B.P.; Jin, F.F. El Niño in a changing climate. Nature 2009, 461, 511–514. [Google Scholar] [CrossRef]
- Kao, H.Y.; Yu, J.Y. Contrasting eastern-Pacific and central-Pacific types of ENSO. J. Clim. 2009, 22, 615–632. [Google Scholar] [CrossRef]
- Hu, X.; Yang, S.; Cai, M. Contrasting the eastern Pacific El Niño and the central Pacific El Niño: Process-based feedback attribution. Clim. Dyn. 2016, 47, 2413–2424. [Google Scholar] [CrossRef]
- Paek, H.; Yu, J.-Y.; Qian, C. Why were the 2015/2016 and 1997/1998 extreme El Niños different? Geophys. Res. Lett. 2017, 44, 1848–1856. [Google Scholar] [CrossRef]
- Rasmusson, E.M.; Carpenter, T.H. Variations in tropical sea surface temperature and surface wind fields associated with the Southern Oscillation/El Niño. Mon. Weather Rev. 1982, 110, 354–384. [Google Scholar] [CrossRef]
- Yu, J.Y.; Kao, H.Y.; Lee, T. Subtropics-Related Interannual Sea Surface Temperature Variability in the Central Equatorial Pacific. J. Clim. 2010, 23, 2869–2883. [Google Scholar] [CrossRef]
- Yu, J.Y.; Kim, S.T. Relationships between Extratropical Sea Level Pressure Variations and the Central Pacific and Eastern Pacific Types of ENSO. J. Clim. 2011, 24, 708–720. [Google Scholar] [CrossRef]
- Tan, X.; Tang, Y.; Lian, T.; Yao, Z.; Li, X.; Chen, D. A study of the effects of westerly wind bursts on ENSO based on CESM. Clim. Dyn. 2020, 54, 885–899. [Google Scholar] [CrossRef]
- Wang, L.C.; Wu, C.R. Contrasting the Flow Patterns in the Equatorial Pacific Between Two Types of El Niño. Atmos.-Ocean. 2013, 51, 60–74. [Google Scholar] [CrossRef]
- Hsin, Y.-C.; Qiu, B. The impact of Eastern-Pacific versus Central-Pacific El Niños on the North Equatorial Countercurrent in the Pacific Ocean. J. Geophys. Res. 2012, 117, C11017. [Google Scholar] [CrossRef]
- Tan, S.; Zhou, H. The observed impacts of the two types of El Niño on the North Equatorial Countercurrent in the Pacific Ocean. Geophys. Res. Lett. 2018, 45, 10493–10500. [Google Scholar] [CrossRef]
- Wu, B.; Zhou, T.; Li, T. Contrast of Rainfall-SST Relationship in the Western Pacific between the ENSO-Development and ENSO-Decaying Summers. J. Clim. 2009, 22, 4398–4405. [Google Scholar] [CrossRef]
- Wen, N.; Liu, Z.; Li, L. Direct ENSO impact on East Asian summer precipitation in the development summer. Clim. Dyn. 2018, 52, 6799–6815. [Google Scholar] [CrossRef]
- Zuo, H.; Balmaseda, M.A.; Mogensen, K.; Tietsche, S. OCEAN5: The ECMWF Ocean Reanalysis System and Its Real-Time Analysis Component; Technical Memorandum No. 823; European Centre for Medium-Range Weather Forecasts: Reading, UK, 2018. [Google Scholar] [CrossRef]
- Björnsson, H.; Venegas, S. A Manual for EOF and SVD Analyses of Climate Data; Department of Atmospheric and Oceanic Sciences, Centre for Climate and Global Change Research, McGill University: Montréal, QC, Canada, 1997; 52p. [Google Scholar]
- Hannachi, A.; Jolliffe, I.T.; Stephenson, D.B. Empirical orthogonal functions and related techniques in atmospheric science: A review. Int. J. Clim. 2007, 27, 1119–1152. [Google Scholar] [CrossRef]
- Dawson, A. eofs: A Library for EOF Analysis of Meteorological, Oceanographic, and Climate Data. J. Open Res. Softw. 2016, 4, e14. [Google Scholar] [CrossRef]
- Hersbach, H.; Bell, B.; Berrisford, P.; Hirahara, S.; Horanyi, A.; Muñoz-Sabater, J.; Nicolas, J.; Peubey, C.; Radu, R.; Schepers, D.; et al. The ERA5 global reanalysis. Q. J. R. Meteorol. Soc. 2002, 146, 1999–2049. [Google Scholar] [CrossRef]
- Molina, O.M.; Gutiérrez, C.; Sánchez, E. Comparison of ERA5 surface wind speed climatologies over Europe with observations from the HadISD dataset. Int. J. Clim. 2021, 41, 4864–4878. [Google Scholar] [CrossRef]
- Reynolds, R.W.; Rayner, N.A.; Smith, T.M.; Stokes, D.C.; Wang, W. An improved in situ and satellite SST analysis for Climate. J. Clim. 2002, 15, 1609–1625. [Google Scholar] [CrossRef]
- Chelton, D.B. Effect of sampling errors in statistical estimation. Deep-Sea Res. 1983, 30, 1083–1101. [Google Scholar] [CrossRef]
- He, S.; Yu, J.Y.; Yang, S.; Fang, S.W. Why does the CP El Niño less frequently evolve into La Niña than the EP El Niño? Geophys. Res. Lett. 2020, 47, e2020GL087876. [Google Scholar] [CrossRef]
- Wu, X.; Okumura, Y.M.; DiNezio, P.N. Predictability of El Niño duration based on the onset timing. J. Clim. 2021, 34, 1351–1366. [Google Scholar] [CrossRef]
- Chen, M.; Li, T. Why 1986 El Niño and 2005 La Niña evolved different form a typical El Niño and La Niña. Clim. Dyn. 2018, 51, 4309–4327. [Google Scholar] [CrossRef]
- Sun, Z.; Liu, H.; Lin, P.; Tseng, Y.; Small, J.; Bryan, F. The modeling of the North Equatorial Countercurrent in the Community Earth System Model and its oceanic component. J. Adv. Model. Earth Syst. 2019, 11, 531–544. [Google Scholar] [CrossRef]
- Boulanger, J.P.; Durand, E.; Duvel, J.P.; Menkes, C.; Delecluse, P.; Imbard, M.; Lengaigne, M.; Madec, G.; Masson, S. Role of non-linear oceanic processes in the response to westerly wind events: New implications for the 1997 El Niño onset. Geophys. Res. Lett. 2001, 28, 1603–1606. [Google Scholar] [CrossRef]
- Lengaigne, M.; Boulanger, J.P.; Menkes, C.; Masson, S.; Madec, G.; Delecluse, P. Ocean response to the March 1997 Westerly Wind Event. J. Geophys. Res. 2002, 107, 8015. [Google Scholar] [CrossRef]
- McPhaden, M.J. Evolution of the 2002/03 El Niño*. Bull. Am. Meteorol. Soc. 2004, 85, 677–696. [Google Scholar] [CrossRef]
- Peng, Q.; Xie, S.P.; Wang, D.; Kamae, Y.; Zhang, H.; Hu, S.; Zheng, X.T.; Wang, W. Eastern Pacific Wind Effect on the Evolution of El Niño: Implications for ENSO Diversity. J. Clim. 2020, 33, 3197–3212. [Google Scholar] [CrossRef]
- Mosquera-Vásquez, K.; Dewitte, B.; Illig, S.; Takahashi, K.; Garric, G. The 2002/2003 El Niño: Equatorial waves sequence and their impact on sea surface temperature. J. Geophys. Res. Oceans 2013, 118, 346–357. [Google Scholar] [CrossRef]
- Zhang, R.H.; Endoh, M. Simulation of the 1986–1987 El Niño and 1988 La Niña events with a free surface tropical Pacific Ocean general circulation model. J. Geophys. Res. 1994, 99, 7743–7759. [Google Scholar] [CrossRef]
- Fedorov, A.V.; Hu, S.; Lengaigne, M.; Guilyardi, E. The impact of westerly wind bursts and ocean initial state on the development, and diversity of El Niño events. Clim. Dyn. 2015, 44, 1381–1401. [Google Scholar] [CrossRef]
- Seiki, A.; Takayabu, Y.N.; Hasegawa, T.; Yoneyama, K. Lack of Westerly Wind Bursts in Unmaterialized El Niño Years. J. Clim. 2018, 31, 593–612. [Google Scholar] [CrossRef]
Figure 1.
Outline of the principal ocean surface current and eddy phenomena in the region of Western Pacific Ocean.
Figure 1.
Outline of the principal ocean surface current and eddy phenomena in the region of Western Pacific Ocean.

Figure 2.
The temporal evolution of SSTA over equatorial Pacific during the CP episode in 2002/2003 (a) and the EP episode in 1998/1998 (b), units in °C.
Figure 2.
The temporal evolution of SSTA over equatorial Pacific during the CP episode in 2002/2003 (a) and the EP episode in 1998/1998 (b), units in °C.

Figure 3.
Average plot of zonal velocity of ORAS5 (a) and its related standard deviation (b) from January 1978 to December 2017. The positive and negative numbers in (a) represent the eastward and westward currents, respectively.
Figure 3.
Average plot of zonal velocity of ORAS5 (a) and its related standard deviation (b) from January 1978 to December 2017. The positive and negative numbers in (a) represent the eastward and westward currents, respectively.

Figure 4.
The first and second EOF modes of boreal spring (MAM) zonal current geographical distribution (a), and associated time series PC from 1978 to 2017 overlaid with the NIÑO 3.4 indices (black line) (b). In (b), the positive and negative values denote the greater and weaker NECC magnitudes, respectively.

Figure 5.
The first and second EOF modes of boreal summer (JJA) zonal current geographical distribution (a), and associated time series PC from 1978 to 2017 overlaid with the NIÑO 3.4 indices (black line) (b). In (b), the positive and negative values denote the greater and weaker NECC magnitudes, respectively.

Figure 6.
The first and second EOF modes of boreal autumn (SON) zonal current geographical distribution (a), and associated time series PC from 1978 to 2017 overlaid with the NIÑO 3.4 indices (black line) (b). In (b), the positive and negative values denote the greater and weaker NECC magnitudes, respectively.

Figure 7.
The first and second EOF modes of boreal winter (DJF) zonal current geographical distribution (a), and associated time series PC from 1978 to 2017 overlaid with the NIÑO 3.4 indices (black line) (b). In (b), the positive and negative values denote the greater and weaker NECC magnitudes, respectively.

Figure 8.
The average transport of zonal flow (Sv) from 1° N to 9° N; for meridional lines 140° E (a) and 170° E (b). Eastward and westward flow are indicated by positive and negative values, respectively.
Figure 8.
The average transport of zonal flow (Sv) from 1° N to 9° N; for meridional lines 140° E (a) and 170° E (b). Eastward and westward flow are indicated by positive and negative values, respectively.

Figure 9.
The average of westerly wind anomalies (N/m2) in the Western Pacific (15° S to 15° N; 120° E to 180° E); JJA (a), SON (b), DJF (c), and MAM (d). In (d), dashed stripes bar represents the first year of EN and blue bar represents the second year of EN.
Figure 9.
The average of westerly wind anomalies (N/m2) in the Western Pacific (15° S to 15° N; 120° E to 180° E); JJA (a), SON (b), DJF (c), and MAM (d). In (d), dashed stripes bar represents the first year of EN and blue bar represents the second year of EN.

Figure 10.
Correlation map of intensity westerly wind with the zonal current during EP EN (a) and CP EN (b). Level of confidence of 90% is represented by shaded white tiles, and a color bar is displayed along the bottom side.
Figure 10.
Correlation map of intensity westerly wind with the zonal current during EP EN (a) and CP EN (b). Level of confidence of 90% is represented by shaded white tiles, and a color bar is displayed along the bottom side.


Table 1.
From 1978 to 2017, the intensity of EN events ranged from moderate to very strong.
| Intensity | EP | CP |
|---|---|---|
| Moderate | 1986/1987 | 1994/1995, 2002/2003, 2009/2010 |
| Strong | - | 1987/1988, 1991/1992 |
| Extreme | 1982/1983, 1997/1998, 2015/2016 | - |
Publisher’s Note: MDPI stays neutral with regard to jurisdictional claims in published maps and institutional affiliations. |
© 2022 by the authors. Licensee MDPI, Basel, Switzerland. This article is an open access article distributed under the terms and conditions of the Creative Commons Attribution (CC BY) license (https://creativecommons.org/licenses/by/4.0/).
Share and Cite
MDPI and ACS Style
Wijaya, Y.J.; Wisha, U.J.; Hisaki, Y. The Western Pacific North Equatorial Countercurrent Responses to Two Forms of El Niño during the Period 1978 to 2017. Climate 2022, 10, 136. https://doi.org/10.3390/cli10100136
AMA Style
Wijaya YJ, Wisha UJ, Hisaki Y. The Western Pacific North Equatorial Countercurrent Responses to Two Forms of El Niño during the Period 1978 to 2017. Climate. 2022; 10(10):136. https://doi.org/10.3390/cli10100136
Chicago/Turabian StyleWijaya, Yusuf Jati, Ulung Jantama Wisha, and Yukiharu Hisaki. 2022. "The Western Pacific North Equatorial Countercurrent Responses to Two Forms of El Niño during the Period 1978 to 2017" Climate 10, no. 10: 136. https://doi.org/10.3390/cli10100136
Note that from the first issue of 2016, this journal uses article numbers instead of page numbers. See further details here.