Article

The Application of UAVs in the Evaluation of Thermal Comfort Levels in Buildings Equipped with Internal Greenhouses

1
INESC-ID, Instituto Superior Técnico, Universidade de Lisboa, 1049-001 Lisboa, Portugal
2
Faculdade de Ciências e Tecnologia, Universidade do Algarve, Campus de Gambelas, 8005-139 Faro, Portugal
3
Institute for Systems and Robotics, Instituto Superior Técnico, Universidade de Lisboa, 1049-001 Lisboa, Portugal
4
School of Built Environment, University of Reading, Reading RG6 6AW, UK
*
Author to whom correspondence should be addressed.
Clean Technol. 2023, 5(3), 1080-1114; https://doi.org/10.3390/cleantechnol5030055
Submission received: 2 August 2023 / Revised: 29 August 2023 / Accepted: 6 September 2023 / Published: 20 September 2023

Abstract

:
A greenhouse is used to improve thermal comfort (TC) levels for its occupants in winter conditions using solar radiation, which involves low energy consumption. The aim of this research is the application of unmanned aerial vehicles (UAVs) in the evaluation of thermal comfort levels in buildings equipped with internal greenhouses. The new building design is developed numerically, and a building thermal simulator (BTS) numerical model calculates the indoor environmental variables. A new alternative and expeditious method to measure occupants’ comfort levels using UAV technology is applied using a UAV dynamic simulator (UAV DS). The evolution of the measured variables used for evaluating the predicted mean vote (PMV) is compared using the two numerical methodologies: BTS and UAV DS. In the second one, the mean radiant temperature (MRT) measuring methodology, the floor temperature, the lateral walls’ temperatures, the ceiling temperatures, and the air temperature are applied. In the method presented in this paper, a new building design is developed numerically, which includes a central greenhouse equipped with a semispherical dome, four auditoriums distributed around the central greenhouse, occupant distribution, and a ventilation methodology. The building geometry, the solar radiation on transparent surfaces, the TC, and the UAV mission methods are presented. The results show that, in general, the central greenhouse and the ventilation methodologies provide acceptable TC levels. The UAV monitoring mission, which includes two vehicles, provides good environmental variable replication, particularly when the environmental variables present greater variations. In the auditorium and greenhouse, the ceiling and lateral surface temperatures, respectively, can be used as an MRT approximation. The BTS numerical model is also important for developing buildings using renewable energy sources to improve the TC levels.

1. Introduction

When renewable energies are used in passive building design, such as greenhouses, it is important to assess the building’s thermal performance using building thermal simulator (BTS) numerical models. Furthermore, the use of unmanned aerial vehicle (UAV) methodologies in the measurement of environmental variables can improve its accuracy, representativeness, and implementation.
A BTS numerical model is capable of implementing a passive solution using renewable energies such as solar radiation to improve thermal comfort (TC) and indoor air quality (IAQ) predictions. This thermal study includes complex building geometry, external environment parameters, ventilation methodologies, occupation strategies, and other factors.
The application of UAVs to measure TC levels is important for measuring a range of environmental variables inside buildings, namely indoor air temperature, relative humidity, and MRT. On the other hand, it may require previous mission planning using numerical software to analyze all the considered parameters and their influence in detail. The measurements can be performed in the desired locations (single or multiple) by the UAV. Therefore, these methodologies do not require the duplication of equipment or its physical installation, which can be important in building-related applications.
In this paper, a UAV DS numerical model is used to monitor the environmental variables in buildings, namely air temperature, air relative humidity, and MRT. The mission planning developed in this work resorts to the information calculated by the building thermal simulator (BTS) numerical models at the same instant and in the same measured compartment. This philosophy is similar to the ones applied in a real situation, where UAV sensors measure environmental variables in a real space.
Environmental analysis and monitoring, as well as UAV indoor applications, are two large research topics that have been addressed individually in the recent literature. The potential of their combination is still relatively new. Therefore, an introduction to both topics will be presented in this section.

1.1. Internal Environment Variables

In accordance with ASHRAE-62 [1], the carbon dioxide concentration is used as an indicator of the IAQ level. ASHRAE-62 defines an indicative value of acceptable IAQ in an occupied space. This standard also includes airflow rates associated with the type of building and space and with the required airflow rate per person. The Portuguese standard, RECS [2], also provides alternative values of acceptable IAQ in an occupied area and air change rates.
The carbon dioxide concentration in occupied spaces, such as school buildings and kindergartens, was analyzed by Korsavi et al. [3] and Abdullah et al. [4], respectively. In other studies related to air change rates, Conceição et al. [5] applied tracer gas techniques in a real bus in order to obtain these values experimentally.
The TC level, developed by Fanger [6], considers the PMV index to define an acceptable indicator of TC levels. This index, which varies between −3 and 3 for cold to hot environments, depends on environmental and personal parameters. The first parameters, namely the environmental parameters, consider the indoor air temperature measured in an occupied area, the indoor air relative humidity measured in the occupied area, the indoor air velocity measured around the occupants in the occupied area, and the MRT associated with the occupied zone’s surrounding surfaces. The second parameter, namely the personal parameters, considers the clothing level and the activity levels. This index, presented in ASHRAE-55 [7] and ISO 7730 [8], is used in spaces equipped with heating, ventilating, and air conditioning systems and is applied, as an example, in Conceição and Lúcio [9].
The BTS developed and applied in buildings with complex topologies in Conceição and Lúcio [10] calculates the IAQ and the TC levels. The numerical model was validated in transient and steady-state conditions. In both cases, the numerical model was validated using a comparison between numerical and experimental variables measured in real situations. In the first one, school buildings in winter and summer conditions were used. In the second one, an experimental chamber was used in Conceição and Lúcio [11]. The experimental chamber was equipped with a radiant floor using warm water heated in an external thermal solar collector. The study, conducted in winter conditions, compares the measured data and calculated values of the internal surrounding surfaces’ temperature. In both simulations, in transient and steady-state conditions, the numerical values are in agreement with the experimental data measured.

1.2. UAVs in the Environmental Monitoring Task

The monitoring of environmental variables, indoors or outdoors, is a topic that had several contributions over the past few decades and has proven its importance for analyzing and improving its impact on human lives. This monitoring has several applications, either in the scope of IAQ analysis, atmosphere monitoring, or even TC analysis.

1.2.1. The Implementation of UAVs in Environmental Monitoring Missions

The integration of UAVs in environmental monitoring missions is a recent topic with an increasing number of contributions.
The internet of things (IoT) is frequently implemented in wireless sensor networks (WSNs) to perform environmental variables monitoring missions, Chaturvediet al. [12], Hu et al. [13], and Zhi et al. [14]. WSNs have some limitations, especially in the most frequent static implementations, such as the inability to implement three-dimensional measurements and the difficulty in updating or reprogramming the components in the system when necessary. According to Bolla et al., the application of a UAV swarm in an air pollution monitoring mission may solve some of these issues [15]. Additionally, UAVs can be an adequate solution for reducing mission performance costs when they rely on an expensive sensor. In this case, one sensor is deployed instead of several ones.
There are several approaches regarding the positioning of the sensors on UAVs, such as sensors next to the rotors, Takei et al. [16], and on top of the UAV, Burgués et al. [17]. Assembling under the body of the UAVs is not usually recommended; however, if proper support is implemented, it can be a viable option, Tuzson et al. [18]. In this work, the sensors are considered to be implemented on top of the UAV.
The vast majority of the identified applications for monitoring environmental variables are implemented in outdoor environments. There are approaches both for monitoring a wide area, Hussain et al. [19], and for analyzing the variation in monitoring environmental variables in altitude, Babaan et al. [20]. Nevertheless, certain insights drawn from outdoor applications can also be adapted for indoor applications, namely the post-processing methods and the mechanisms applied to the data collected for environmental variables. An example is the use of deep learning to implement prediction mechanisms, Hemamalini et al. [21].
Regarding the implementation of UAVs in TC analysis, no applications that were fully implemented by a UAV or a swarm of UAVs were found. However, several applications combining fixed ground assemblies and hardware implemented on a UAV to jointly perform this analysis were found. The UAV assembly is mostly composed of RGB cameras, Zhao et al. [22], or infrared cameras, Rodríguez et al. [23]. In the ground assembly, sensors are implemented according to more traditional approaches. It is thus possible to perform at least two types of evaluations. In the first one, the data obtained by the UAV are compared and validated against those obtained on the ground. In the second one, the data obtained by the UAV and the ground assemblies are reconciled to reach a single, more precise analysis.
In general, the literature suggests that there are not many applications in this area, Rodríguez et al. [24], especially at a micro-scale level. UAVs, however, could be very important for obtaining accurate three-dimensional mean radiant surface temperature results, as illustrated by Rüdisser et al. [25]. This is one of the factors necessary for the calculation of PMV, a TC assessment index. On the other hand, the limited flight capacity of UAVs can lead to brief measurements that may neglect dynamic effects in spaces.
In this application area, as observed in the IAQ monitoring context, the influence of flight on the measurements performed was also questioned. In a comparative study between results obtained by a fixed thermal camera and a thermal camera implemented on a UAV in an indoor space, Stokowiec et al. [26], both data sources were considered valid and meaningful for this purpose. Additionally, this work is one of the few pieces of research found by the authors that is specifically developed in indoor spaces, the others being mostly focused on outdoor urban spaces.

1.2.2. Indoor Flight Challenges

Indoor and outdoor environments can lead to different but complementary analyses regarding environmental parameters, and they require very different implementations and precautions regarding UAV flight preparation and support. In outdoor spaces, UAVs must be prepared for the existence of air currents and atmospheric disturbances, Wang et al. [27]. On the other hand, indoor spaces present a great restriction of movement, as well as GPS unavailability, De Croon et al. [28]. The motion constraint may imply that UAVs fly at slower speeds and require the implementation of more accurate obstacle avoidance algorithms in the case of autonomous flights (Badrloo et al. [29], Chen et al. [30], Xue et al. [31], Park et al. [32], and Mao et al. [33]). In non-autonomous or semi-autonomous flight applications, it may imply using an experienced user to operate the UAV. The GPS unavailability requires the creation of alternative ways to locate UAVs in space, Yilmaz et al. [34], Eckert et al. [35], and Gupta et al. [36]. In general, indoor spaces present more challenges to safe UAV flight in these types of missions. Some studies developed in this area, although very few compared to outdoor applications, highlight the aspects presented above as well as the application of nano-UAVs with very small dimensions, resorting to a UAV swarm, Neumann et al. [37] and Neumann et al. [38]. Additionally, it also highlighted the implementation of balance mechanisms between the energy consumption of the system and the accuracy of the obtained data, Hu et al. [13]. At last, some implementations are generically adapted to both indoor and outdoor spaces to monitor environmental variables and locate the UAVs that are used in the tests, Yungaicela et al. [39]. This work will be developed in an indoor space, specifically in a set of auditoriums interconnected by a central structure.

2. Objectives

The main aim of this research is the application of unmanned aerial vehicles (UAVs) in the evaluation of TC levels in buildings equipped with internal greenhouses. A new building geometry, a UAV DS numerical model, and a BTS numerical model are applied.
The BTS numerical model is used for developing buildings with sustainable environments, using renewable energy sources, to improve the TC level. In the development of the building model, a new methodology that uses a simulator to generate the three-dimensional geometry is applied. The main objectives are associated with the development of a passive building equipped with a central greenhouse and four surrounding auditoriums. The central circular greenhouse is used to warm the air in the auditorium regions facing north. In the greenhouse, different ceiling geometries are applied in order to increase the transmitted incident solar radiation. Special attention is given to the application of the dome in the roof area.
The BTS numerical model considers complex building geometry, building materials, geographic parameters, and external conditions and evaluates the indoor environmental variables and the TC level. The UAV DS numerical model uses information calculated by the BTS numerical model to plan a mission performed by UAVs to measure TC levels. In the methodology applied in this work, the larger environment variation and the mean radiant temperature (MRT) used in PMV evaluation are analyzed in detail by the UAV DS numerical model. The MRT methodology used in PMV evaluation, using the UAV DS numerical model, considers the floor temperature, the lateral wall temperatures, the ceiling temperatures, and the air temperature. A BTS, resorting to the building thermal project, and a UAV DS, resorting to the calculated environmental variables, are compared.
This new kind of measuring methodology will be used not only to measure the performance, development, and implementation of new thermal solutions in buildings but also to provide a planning methodology for future situations.

3. Equipment and Methods

In this work, two simulators will be considered and bridged to create a joined analysis of an indoor building environment with complex topology:
  • The first one, BTS, is able to perform a comprehensive assessment of buildings, calculating the impacts of several environmental variables and weather conditions;
  • The second one, UAV DS, can predict the movement of UAVs in indoor environments. This numerical model is capable of registering the mission associated with three-dimensional trajectory and the environmental variables associated with the environmental sensors used in the mission.

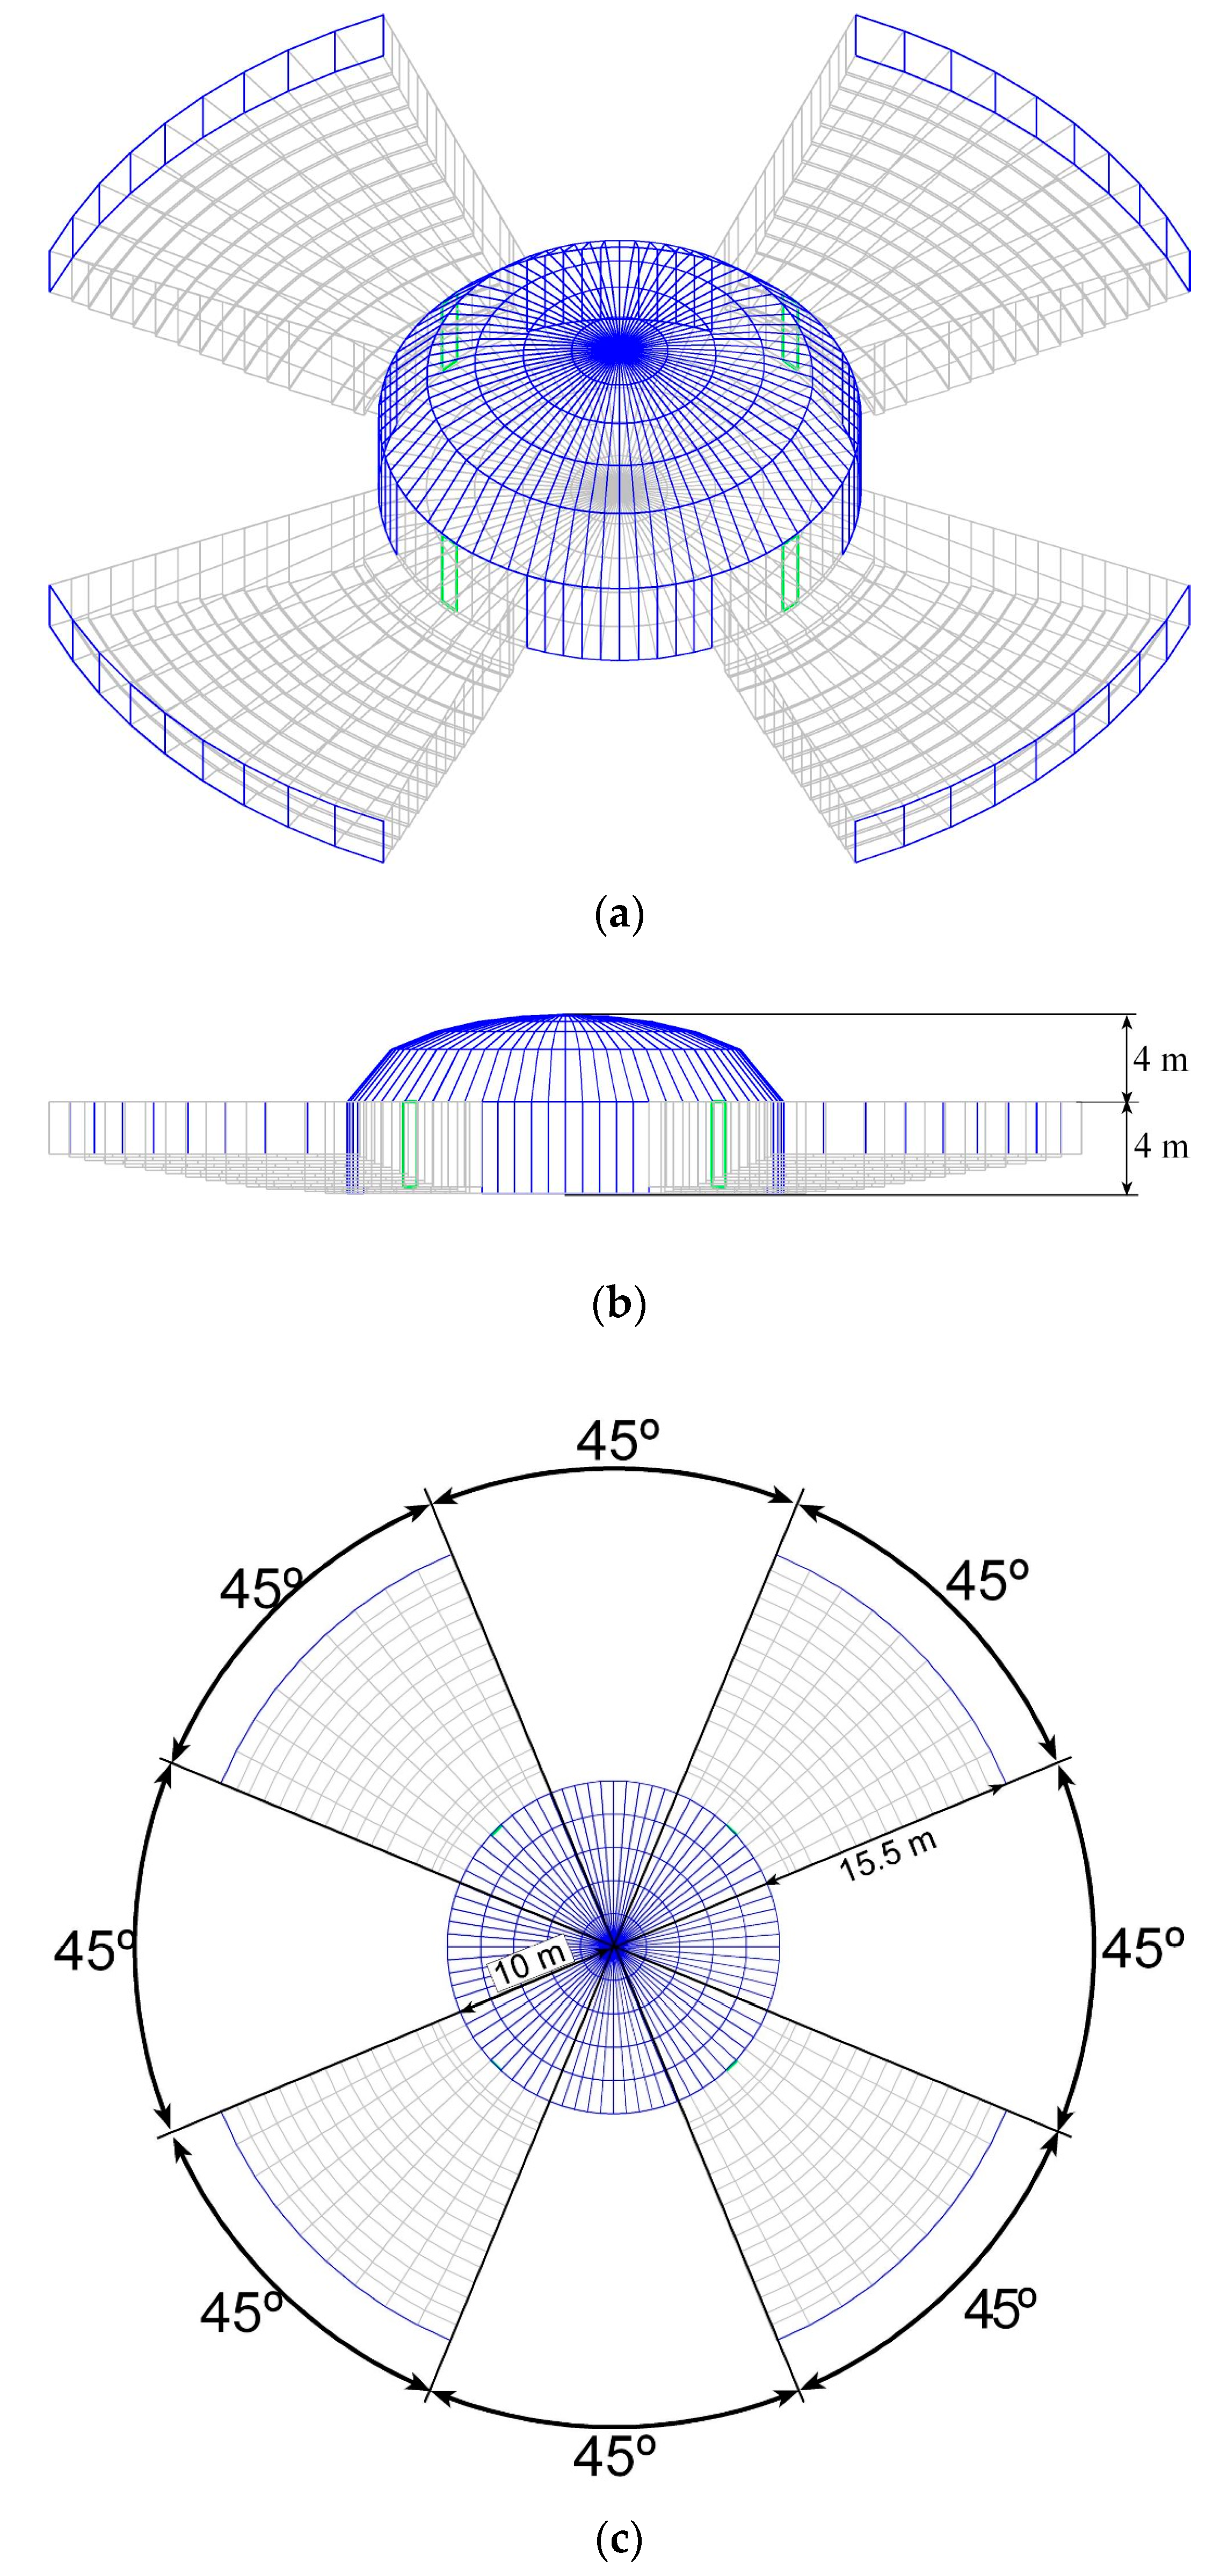
3.1. Building Design Generation

Figure 1 presents the space under analysis. It is composed of four auditoriums that are connected through a cylindrical central space equipped with a dome-configured roof. In the figure, the gray-colored surfaces represent opaque surfaces, the green-colored surfaces represent the doors, and the blue-colored surfaces represent transparent surfaces, such as glass. This figure represents the following: (a) a 3D view, (b) a lateral view, and (c) a top view.
This building consists of a central circular space, used as an internal greenhouse, equipped with a roof with a dome configuration and four auditoriums placed around it.
The numerical model that generates the building geometry considers the following aspects:
  • Trapezoidal flat surfaces in cylindrical coordinates (with the radius, angle, and height), considering vertical, horizontal, and inclined surfaces;
  • Trigonometric equations used in the auditorium surfaces and the greenhouse surface generation;
  • Three-dimensional ellipsoid equation used in the dome surface generation.
The auditoriums consider opaque surfaces (walls and doors) and transparent surfaces (window glasses). Each auditorium consists of a stage with nine rows and twelve steps. In the lower and upper zones, there is a corridor, and in the rows, there are also two sets of steps for the occupants to pass. The auditorium is built with the following:
  • Vertical and horizontal trapezoidal surfaces, using flat and cylindrical surfaces;
  • Radius, angle, and height (cylindrical coordinates).
The greenhouse considers transparent surfaces (in contact with the external environment) and opaque surfaces (in contact with the auditoriums). This central space is used as an area for people to pass to the auditoriums. The surrounding space (except the wall in contact with the auditorium) is made up of a glazed surface. Part of the side glazed surface in the lower greenhouse area is used as an entrance door. The greenhouse is built with the following:
  • Vertical trapezoidal surfaces constituted through four points, using cylindrical surfaces;
  • Radius, angle, and height (cylindrical coordinates).
The dome, developed using transparent single glass, is made up of five levels of glazed surfaces (in contact with the external environment), the size of which decreases from bottom to top. The dome geometry used in the simulation consists of the following:
  • Inclined trapezoidal surfaces, using an ellipsoidal surface;
  • Angle and height;
  • Ellipsoidal equation considers the radius of the greenhouse in the X and Y direction;
  • Ellipsoidal equation considers the height of the dome in the Z direction.
The auditoriums, greenhouse, and dome are made up of the following:
  • Auditorium with double brick in the lateral areas in contact with the outside environment;
  • Auditorium with a single brick in the areas in contact with the central space (in the central area);
  • Auditorium with a door located between the auditorium and the greenhouse;
  • Auditorium with an upper covering in contact with the outside environment;
  • Auditorium with a floor in contact with the ground;
  • Auditorium with a glazed surface placed opposite the wall in contact with the central space;
  • Greenhouse with a glazed surface in contact with the external environment;
  • Dome with a glazed surface in contact with the external environment.
Two types of ceilings were analyzed as follows:
  • One that considers the roof of the greenhouse to be flat;
  • Another that considers the roof of the greenhouse to be a dome;
  • In both situations, the ceilings are constructed of transparent glazed surfaces.
Following the preliminary results, it was concluded that the greenhouse with the dome-shaped roof manages to capture a higher level of solar radiation throughout the day than the greenhouse with the flat roof.
The occupancy cycle of each auditorium is checked in the morning and the afternoon, namely:
  • A total of 100 people between 8 am and 12 pm;
  • A total of 100 people between 2 pm and 6 pm.
Each space inside the simulation environment was numbered in order to organize the measurements through both simulators. Space 1 is considered the outdoor environment, while the remaining spaces were identified as shown in Figure 2. The airflow pattern used in the numerical simulation, in the morning (white) and the afternoon (orange), for the central space (6) and the surrounding auditoriums (2 to 5) is presented in Figure 2.
The building simulated in this study was located in Faro, Portugal, at an altitude close to sea level in a Mediterranean environment. The study was carried out considering a typical winter day in the region with clear skies.
The building considers opaque and transparent bodies as well as indoor spaces.
As opaque bodies, double bricks, single bricks, the roof, and the floor were considered in the numerical simulation:
  • In the double bricks used as a boundary between the lateral external and internal environments, eleven layers were considered;
  • In the single bricks used as a boundary between the central greenhouse and the auditoriums, seven layers were considered;
  • In the ground used as a boundary between the internal environment and the soil, ten layers were considered;
  • In the roof used as a boundary between the top external and internal environment, nine layers were considered.
Transparent bodies, windows, and a dome, were considered as the following:
  • In the window located in the external area of the auditorium, a single glass is considered;
  • In the dome located in the ceiling of the central greenhouse, a single glass is considered.
The interior spaces were considered using boundaries as the opaque and transparent surfaces:
  • Auditorium spaces were limited by the opaque and transparent surfaces;
  • Central greenhouse were limited by the opaque and transparent surfaces.
The thickness, specific heat at constant pressure, thermal conductivity, and specific mass of each of these layers were also taken into account.

3.2. IAQ and Airflow Rate

The IAQ depends on the supplied airflow rate, which is linked to the number of occupants. In order to evaluate the IAQ, the carbon dioxide concentration is used as an indicator, in accordance with the ASHRAE-62 [1]. The RECS [2] suggests an acceptable limit of carbon dioxide concentration below 2250 mg/m3. The same standard also suggests a minimum fresh air flow calculated according to occupancy and activity level, which is 35 m3/h per person for moderate activity.
The maximum value of the carbon dioxide concentration mainly depends on the occupancy level. However, the evolution of the carbon dioxide concentration in transient conditions also depends on the space volume. Thus, the two variables are important factors in the IAQ assessment.
However, when renewable energy is used and the TC depends on the passive building solution (as the solar radiation in the present work), the airflow rate should be assessed and calculated in conjunction with both the IAQ and the TC. In this study, different airflow rates are used in order to obtain a compromise between TC and IAQ in the morning and the afternoon for the central space used as a greenhouse and for the surrounding auditorium. The airflow rate for the case studied is presented in Figure 2.
The airflow rate is used to transport not only fresh air (from the external environment) but also energy. In the present study, the influence of the airflow rate on the carbon dioxide concentration is evaluated using the mass balance integral equation, and the influence of the airflow rate on the internal temperature is evaluated using the energy balance integral equations (more details are given in the next sections).
Following the previously obtained results, the airflow in the spaces facing north-east and north-west (not subjected to solar radiation) is heated in the central space used as a greenhouse. In the space facing south-east and south-west (subjected to solar radiation), different airflow rates are used in order to improve the TC and the IAQ, as follows:
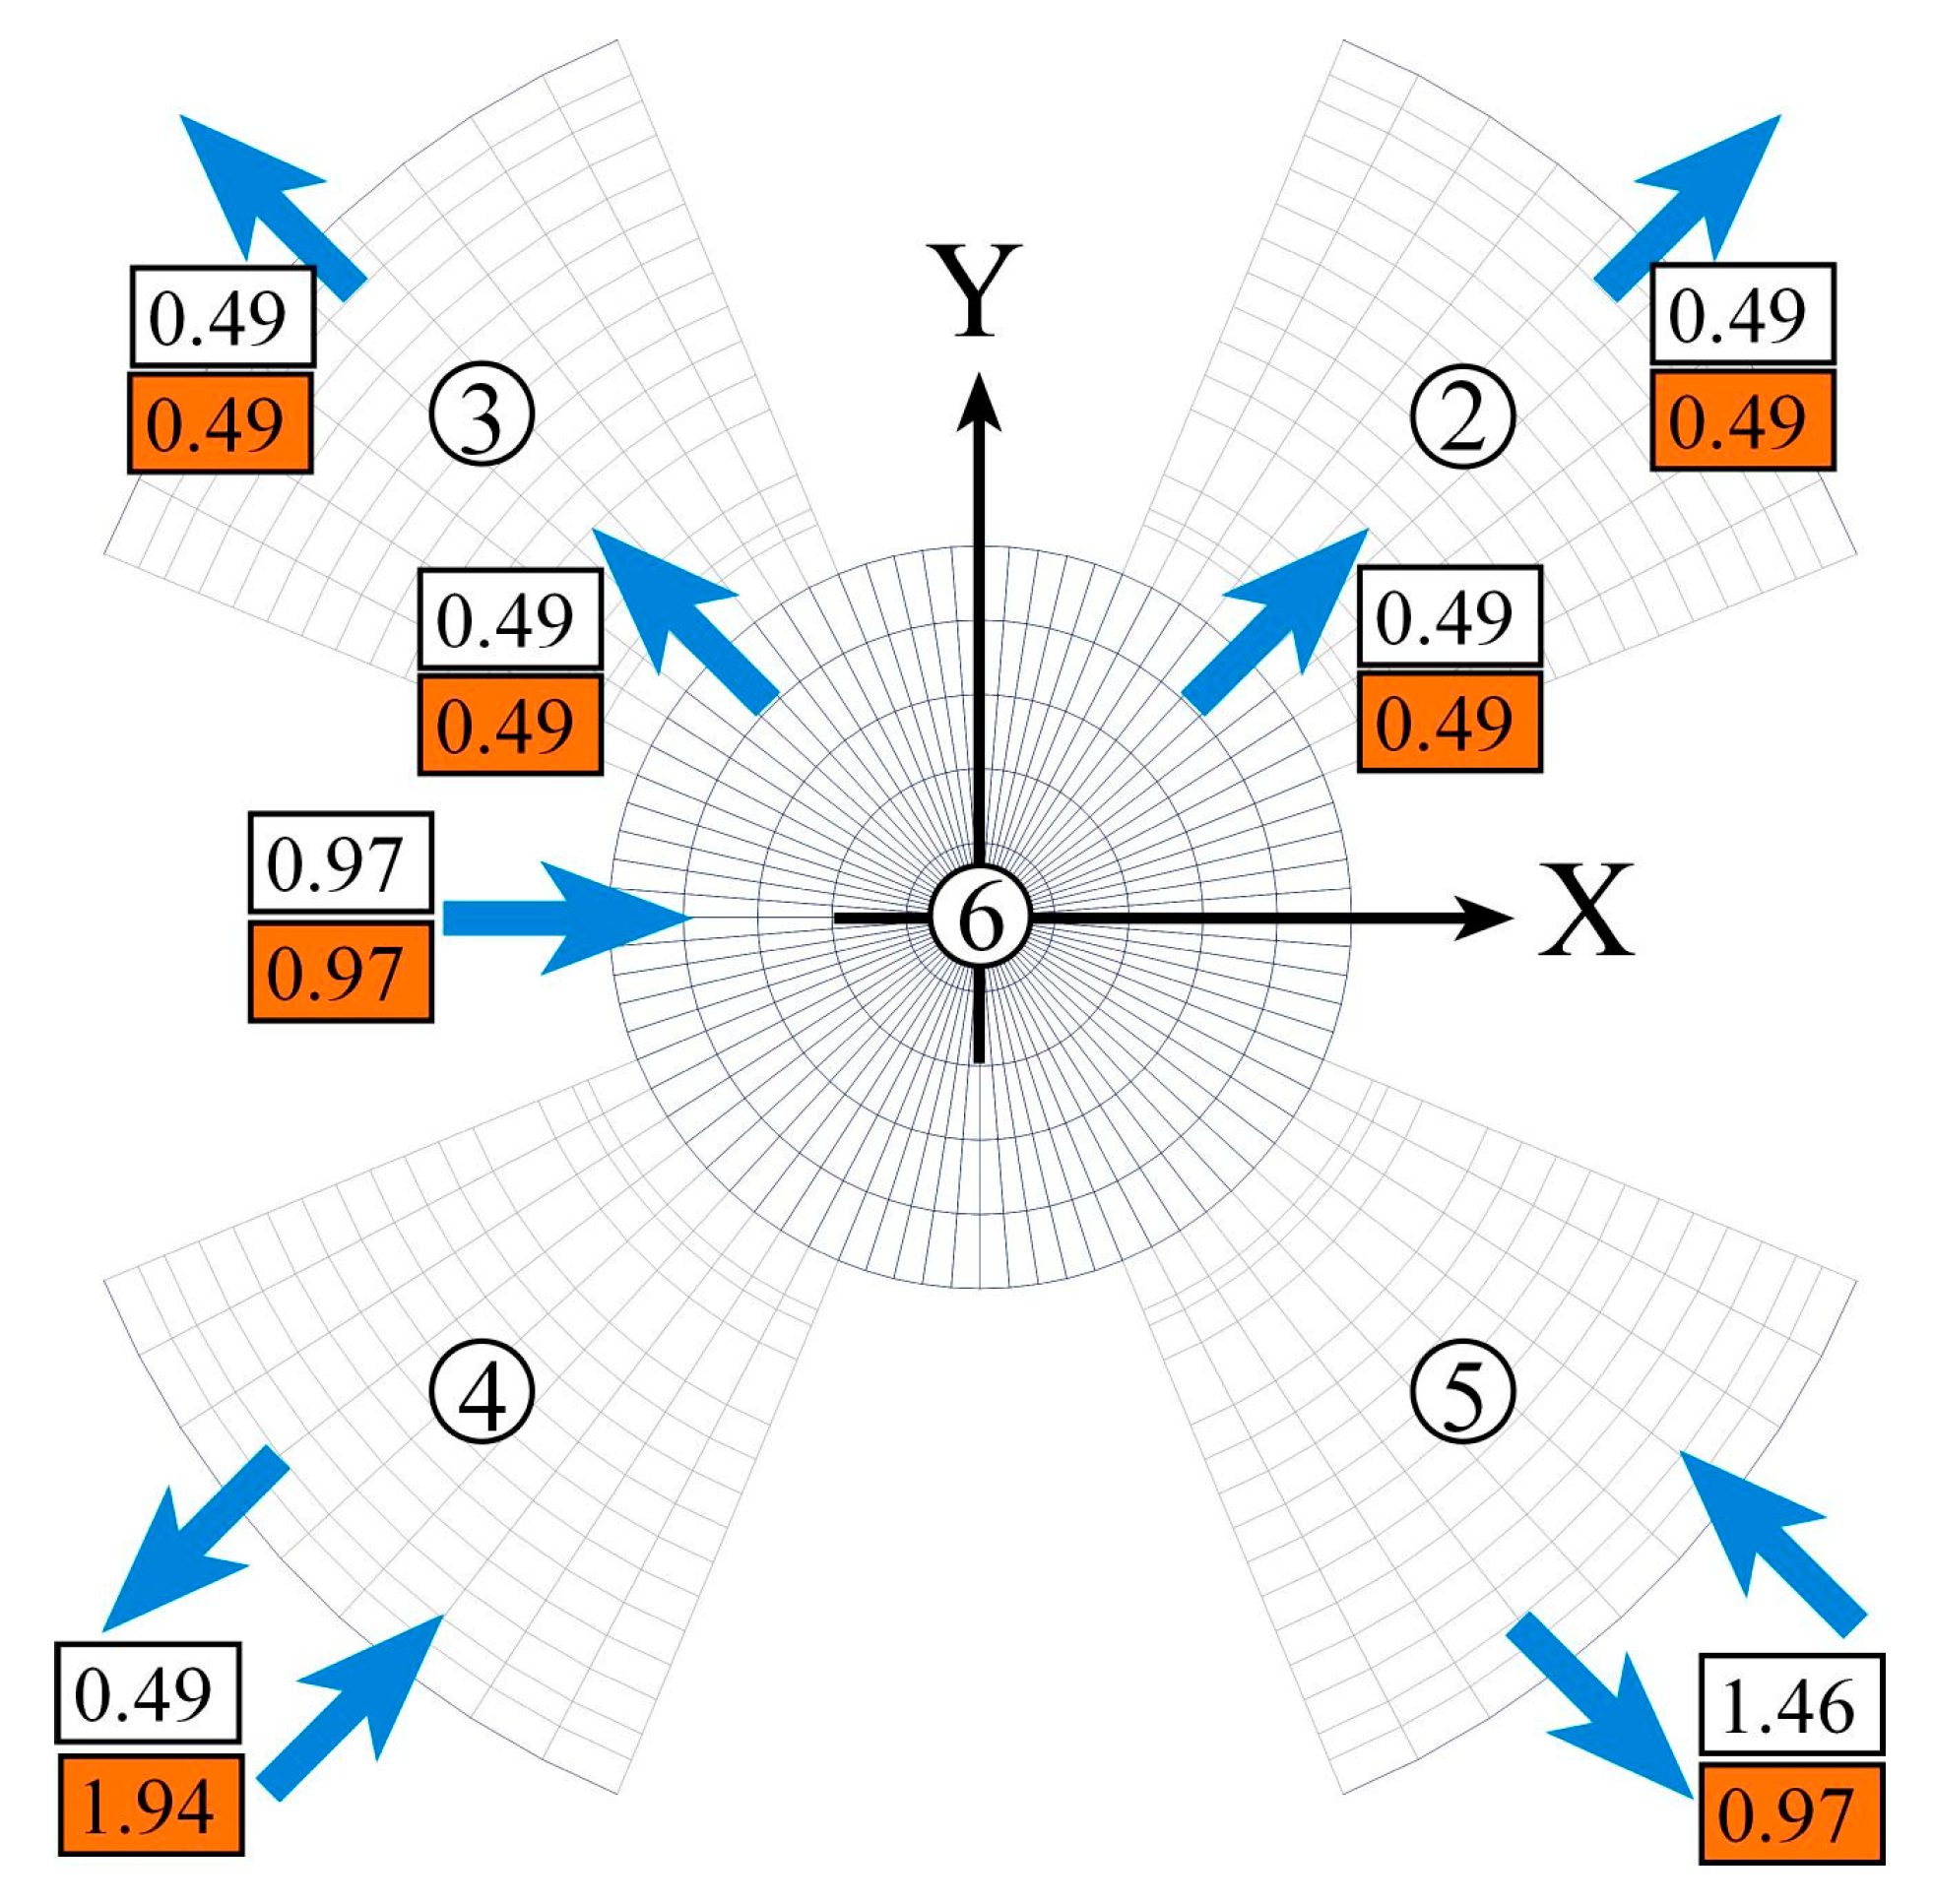
  • In the space facing south-east the airflow rate is higher in the morning than in the afternoon, because the space is subjected to solar radiation in the morning;
  • In the space facing south–west the airflow rate is higher in the afternoon than in the morning, because the space is subjected to solar radiation in the afternoon.
The airflow rate (m3/s) presented in Figure 2 is achieved using a mechanical ventilation system. This system transfers airflow:
  • From the external environment to the central greenhouse;
  • From the central greenhouse to the north auditoriums;
  • From the north auditoriums to the external environment;
  • From the external environment to the south auditoriums;
  • From the south auditoriums to the external environment.
In all the spaces considered, the mixing ventilation strategy is applied.
For the IAQ evaluation, BTS is used for calculating the carbon dioxide concentration in all spaces during the entire day.

3.3. Thermal Comfort and PMV Numerical Model

To evaluate the thermal comfort level, the PMV index, developed by Fanger [6], is used. The PMV index ranges between −3 and 3: −3 for a cold environment, −2 for a cool environment, −1 for a slightly cool environment, 0 for a neutral environment, 1 for a slight warm environment, 2 for a warm environment, and +3 for a hot environment.
This methodology uses these indexes to characterize three indoor thermal comfort categories (ASHRAE-55 [7] and ISO 7730 [8]), namely, Category A, B, and C. Category C, which is used in this work, considers a range of PMV changes between −0.7 (for negative PMV index values) and +0.7 (for positive PMV index values).

3.3.1. PMV Evaluation by the BTS

In spaces equipped with HVAC systems, the following variables are considered:
  • A group of environmental variables and a group of personal parameters;
  • The environmental variables group considers the indoor air temperature, the indoor air velocity, the indoor air relative humidity, and the indoor mean radiant temperature (MRT);
  • A group of personal parameters considers the clothing level and the activity level.
In order to evaluate the TC level using the PMV index, the BTS numerical model considers the following:
  • The air temperature, which is calculated using the BTS numerical model;
  • The air velocity, which is calculated using numerical methodologies based on the numerical simulation of airflow around the occupants;
  • The MRT of the surrounding surfaces. This temperature is calculated by the BTS numerical model on the basis of the weighted average of the surrounding space surfaces;
  • The relative humidity of the air, which is calculated using the BTS numerical model;
  • Personal parameters, such as the level of activity and clothing of the people.

3.3.2. PMV Evaluation by the UAV

Using the virtual environmental sensor values, the UAV calculates the PMV index approximation. This depends on four parameters associated with the space, such as the following:
  • The air temperature is registered by the environmental air temperature virtual sensors, using the BTS information, in the same space and at the same instant. The space and the time instant are determined by the adopted mission;
  • The air velocity, which is calculated using numerical methodologies based on the numerical simulation of airflow around the occupants;
  • The MRT, which is associated with the surrounding surfaces, considers four different parameters:
    The floor temperature;
    The lateral walls’ temperatures;
    The ceiling temperature;
    Correlation with the air temperature registered by the UAV sensor, as an approximation;
  • The relative humidity of the air, which is registered by the air relative humidity virtual sensors, using the BTS information, in the same space and at the same instant. The space and the instantaneous values are determined by the adopted mission;
  • Personal parameters, such as the level of activity and clothing of people.
In this study, a clothing level of 1 Clo, which is associated with winter clothing, as well as an activity level of 1.2 Met, which is associated with moderate activity, were considered. The clothing insulation level considered in this work consisted of a long-sleeved shirt, dust, pants, shoes, and normal underwear.

3.4. BTS Numerical Model

In this section, the simulator that evaluates the BTS response for complex building topology will be presented.
The numerical model considers the energy and mass balance integral equations for complex building topologies and with transient conditions (Conceição and Lúcio [10]). The equations developed, which are based on the design of the building, consider all geometries and all spaces.
Thus, in the numerical software developed in Conceição and Lúcio [10], the following geometries and spaces are considered:
  • Occupied and non-occupied internal spaces;
  • Opaque bodies, such as the internal and external walls, the ceiling, the floor, and others;
  • Transparent bodies, such as windows, doors, and others.
The numerical model is based on the energy balance integral equations (Conceição and Lúcio [10] and Conceição et al. [40]) and mass balance integral equations (Conceição and Lúcio [10]). Each energy balance integral equation is used to evaluate one temperature, while each mass balance integral equation is used to evaluate one concentration (the carbon dioxide concentration, water vapor concentration, and other contaminants).
The energy balance integral equations consider the heat storage term on the right side of the equation and the heat fluxes on the left side of the equation. In the energy balance integral equation, the heat flux among others is caused by the following:
  • Conduction: The conduction is observed in opaque bodies, namely between the different layers. Fourier’s law of conduction is used. The conduction, calculated between the different layers using Cartesian coordinates, evaluates the flux in transient conditions;
  • Convection: Convection is used between the surfaces and the surrounding environment calculated using Newton’s law of convection. In this calculation, the surface area, surrounding fluid, and convective heat transfer coefficient are used. This phenomenon is calculated for both surfaces of the opaque, transparent, and interior bodies. The convection is evaluated on both sides of the surfaces. In the opaque, transparent, and interior bodies, horizontal, vertical, and inclined surfaces are included. In all bodies, natural, forced, and mixed convections are considered;
  • Radiation: In radiation, two phenomena are considered: solar incident radiation and heat exchange by radiation. This calculation considers the main building geometry. All calculations consider the generated grid and its elements. When the grid increases, the calculated values become closer to the real values. However, a high grid concentration requires a longer calculation time. In all calculations, the shading devices are considered, as well as all opaque, transparent, and indoor surfaces. The solar incident radiation is observed on inside and outside surfaces. This calculation is evaluated all day. The location of the sun and the direct, indirect, and reflected solar radiation are considered, as well as the presence of the cloudy sky. The internal solar radiation entering transparent bodies is distributed around the opaque and indoor bodies. Solar radiation contributes to increasing the temperature of the body’s external and internal layers. Heat gain by radiation is calculated for each internal space. This calculation depends on the temperatures of the surfaces and the view factors calculated between all the surfaces. Two methods can be applied: The Radiosity method and the MRT method;
  • Evaporation and condensation: Water evaporation and condensation are calculated between the opaque, transparent, and indoor body surfaces and the environment. In this case, the water vapor flux and the evaporation and condensation latent heat are considered. The water vapor flux, caused by convection and diffusion between the surfaces and the environment, is considered. For mass convection, the area, the water mass concentration on the surface and the air, and the convection mass transfer coefficient are used;
  • Adsorption and desorption: Water vapor can be adsorbed and desorbed in opaque bodies, namely on both surfaces that are in contact with the interior spaces. In this case, when the mass concentration inside the space is higher than that on the surface, adsorption is considered; however, when the mass concentration inside the space is lower than that on the surface, desorption is considered;
  • Energy transport: The energy transported depends on the airflow rate and the difference in temperature (between the temperature of the airflow in the source and the space). This transport can be made directly in adjacent spaces.
Thus, the energy balance integral equations are developed for the following:
  • Air inside the spaces;
  • Different layers of the opaque bodies;
  • Transparent bodies;
  • Interior bodies.
In the mass balance integral equation, the mass flux is due to, among others, convection and diffusion.
Thus, the mass balance integral equations are developed for the following:
  • Adsorption and desorption of water vapor;
  • Water vapor and the carbon dioxide concentration (or other contaminants) inside the spaces.
The numerical model also considers the mass balance linear equations system. This equation is used to calculate the following:
  • Airflow rate or the air exchange rate;
  • Mass exchange between the different indoor spaces;
  • Mass exchange between the indoor spaces and the outdoor spaces. In this case, the inlet (from indoor spaces or outdoor spaces) and the outlet (to other indoor spaces or outdoor spaces) are considered.
The numerical simulation using BTS is considered in an integral approach. This kind of methodology uses the inlet and outlet energy and mass fluxes. The energy and mass exchanges are calculated in all the control volumes (internal spaces, internal ducts, windows, wall layers, and other volumes). The temperature or mass values obtained for each control volume with different constituted materials are representative for each volume. When more stratification is needed, as is observed on the walls, more volumes are considered. Thus, in this study, inside each control volume, the same temperature or mass values are used. Nevertheless, the occupied and non-occupied spaces used as UAV representative measurement locations are in the center of the space where measurements are made. In traditional real building spaces, as is considered in this work, the central area of the space, in general, also represents a representative location. However, for large spaces, computational fluid dynamics (CFD) can be used to evaluate a representative measuring location or locations for each space.
The numerical simulation evaluated by the BTS numerical model uses a group of inputs, namely the building data, geographical parameters, and external environmental variables:
  • In the first one in a steady-state situation, the building geometry and the building materials’ thermal proprieties are used, while in the transient situation, the occupation and airflow variations that were presented previously, are considered;
  • In the simulation related to the geographical parameters, the building was considered for the Mediterranean environment, namely in the south of Portugal at sea level;
  • Finally, the environmental variables were measured at a meteorological station for a typical winter day (December 21st), and the external air temperature, the external air relative humidity, and the wind speed were used. The external air temperature changed between 4.5 and 13.5 °C; the external air relative humidity changed between 37.2 and 65%; and the wind speed changed between 0.01 and 6.25 m/s.
In order to obtain the initial and boundary conditions, the numerical software simulated the previous five days. Thus, all variables that are considered at the beginning of the simulation and calculated by the BTS numerical model are in equilibrium with the external environment.
In the present case, the following opaque bodies, transparent bodies, and indoor spaces are considered:
  • A total of 1616 opaque bodies built with double bricks, single bricks, the roof, and the floor;
  • A total of 456 transparent bodies built with windows and dome glasses;
  • A total of 5 indoor spaces, considering the interior air of the spaces, with the boundaries of the opaque and transparent surfaces.
Thus, in accordance with the opaque bodies, the transparent bodies, and indoor spaces, the numerical model considers 18,218 energy and mass integral equations. These equations were solved using the Runge–Kutta–Felberg method with error control during all the simulation days.

3.5. UAV DS Numerical Model

In this section, the simulator capable of monitoring the movement of UAVs in indoor spaces will be presented.
The movement of the UAV inside the space under study is described by three-dimensional equations for mechanical movement and framed in three key references, as illustrated in Figure 3:
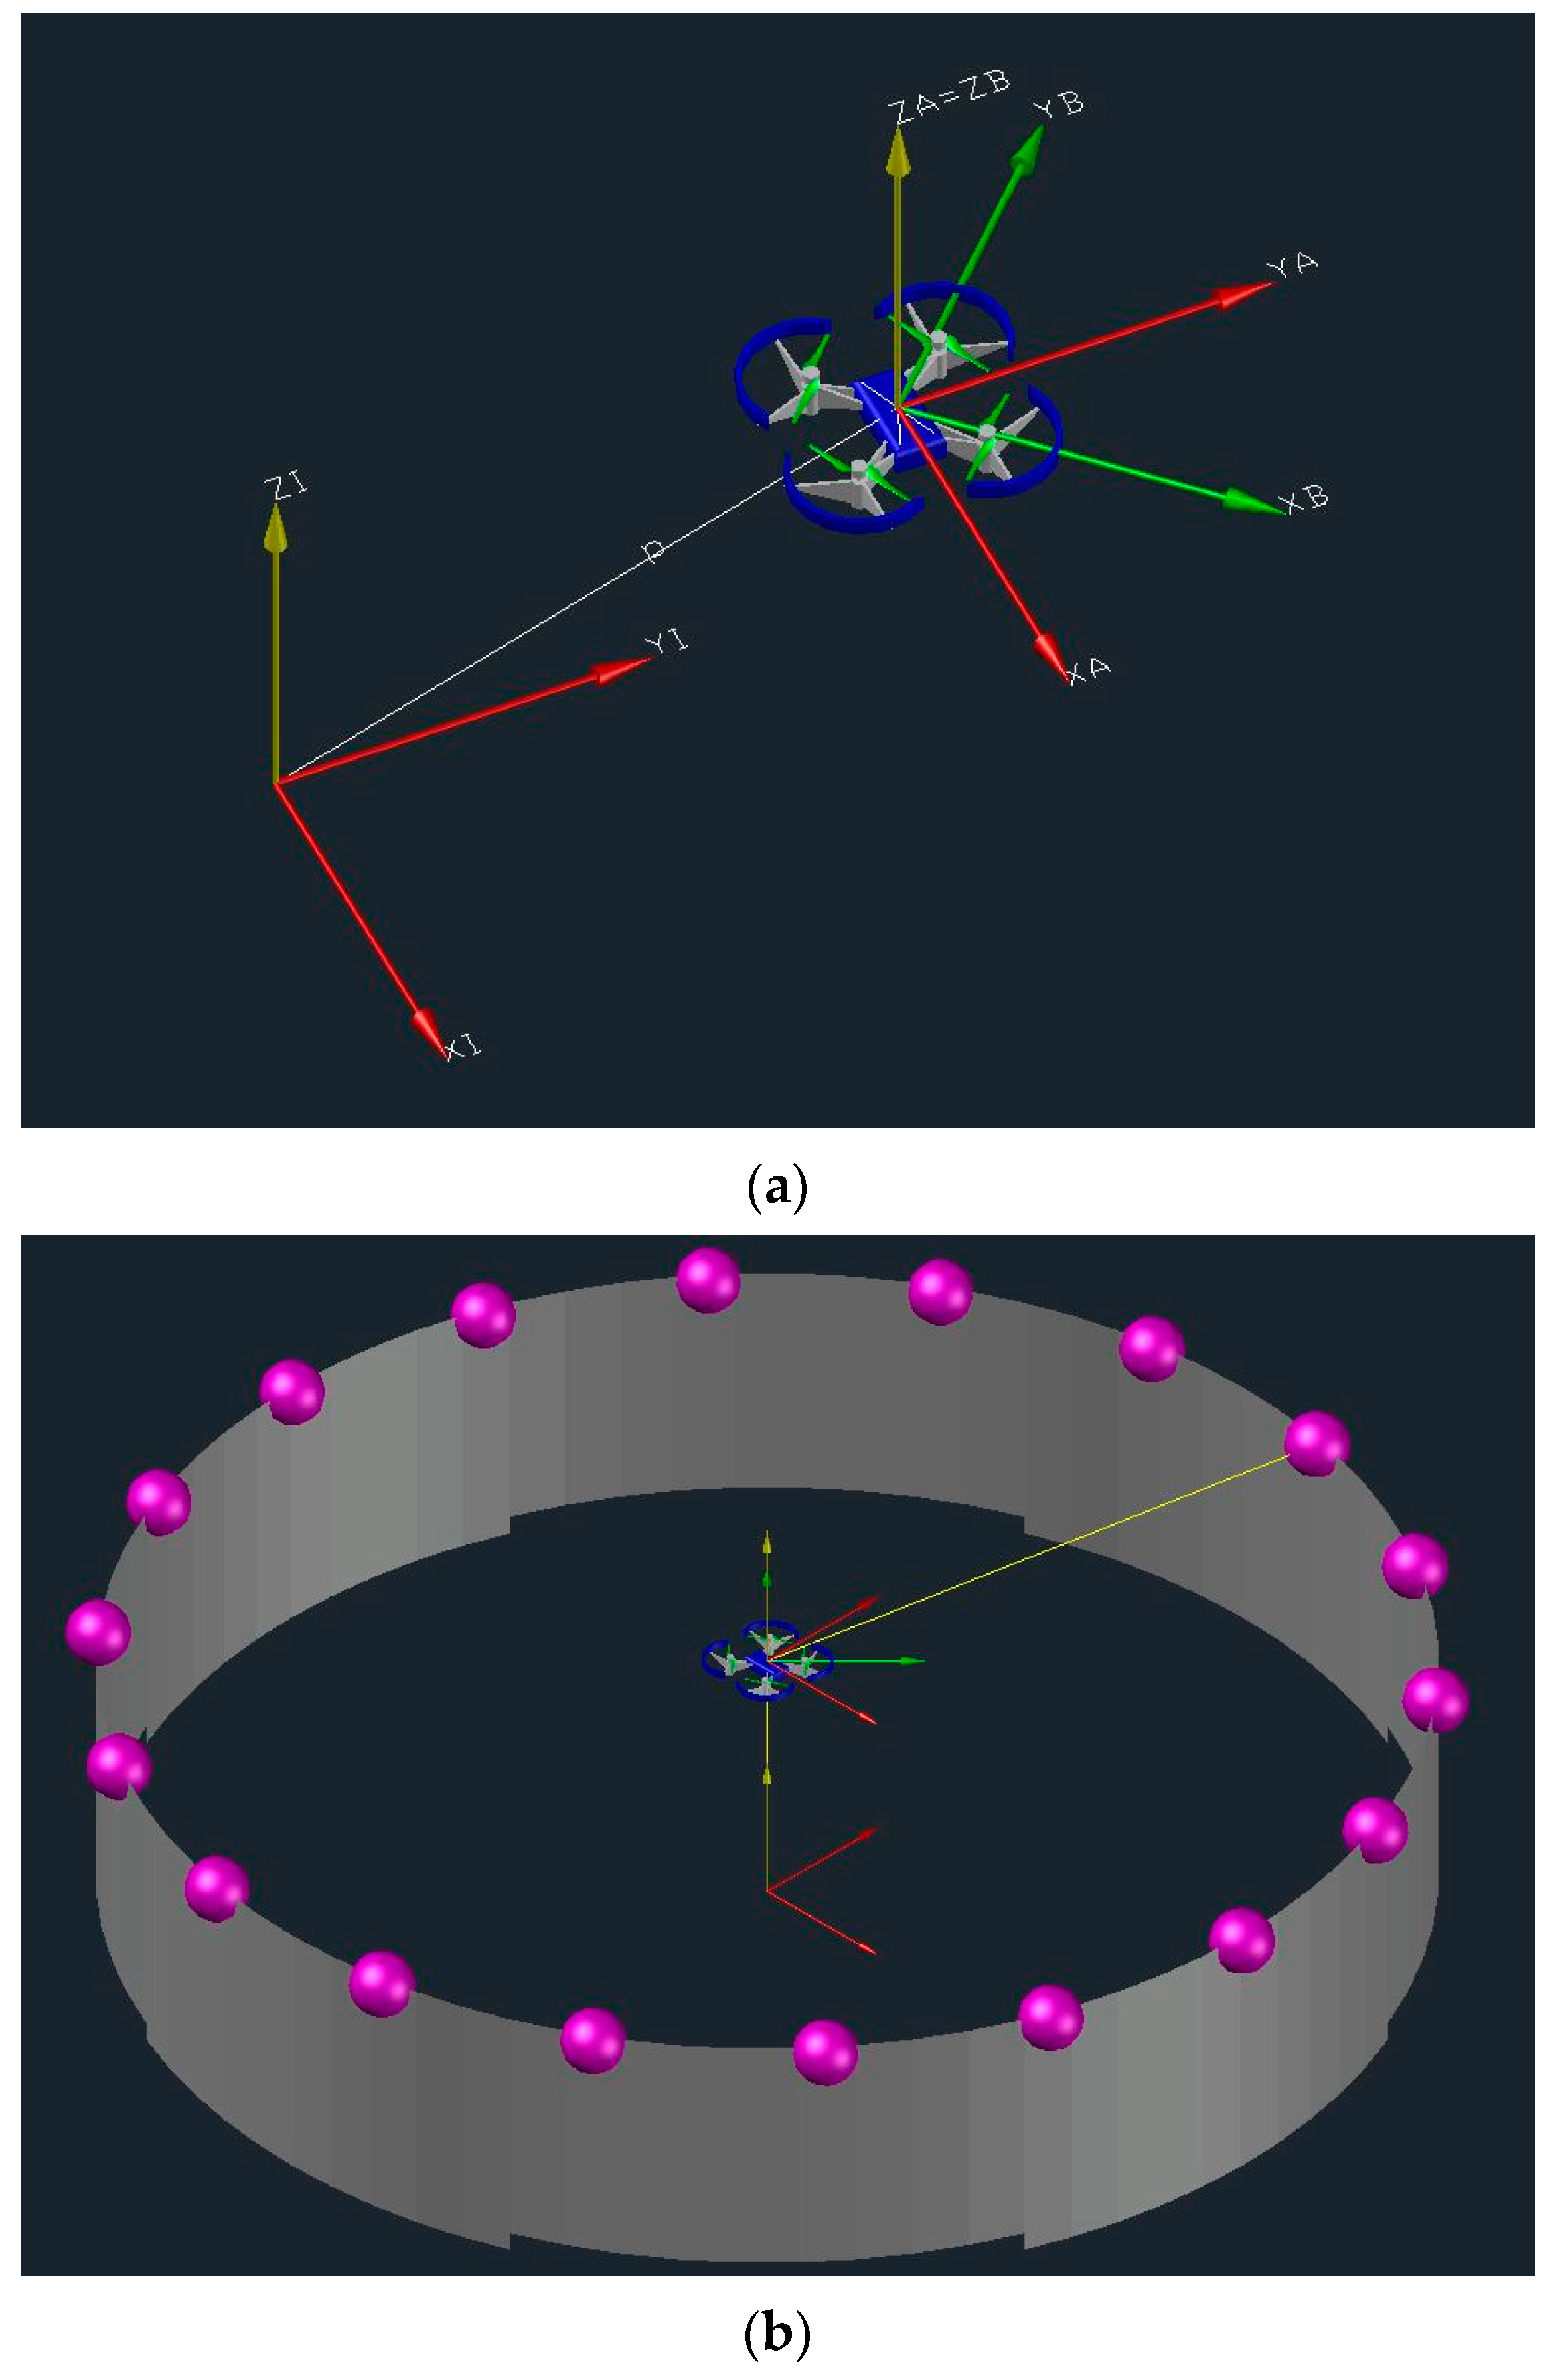
  • The inertial frame {I}, a static global frame positioned in the building’s central area;
  • The reference frame {A}, a local mobile frame attached to the UAV center of mass;
  • The body frame {B}, a local rotated mobile frame attached to the UAV center of mass.
{A} observes a translation motion with respect to {I}, while {B} observes translation and rotation motions with respect to {I}. The rotation is performed according to the rotation matrix R, which is presented in Equation (1). R ϵ   SO ( 3 ) defines the rotation from {B} to {A}, where R = I if ψ = 0.
R B A = [ c o s   ψ   s i n   ψ 0 sin   ψ c o s   ψ 0 0 0 1 ]
Besides a set of {A} and {B} reference frames, for each UAV, the following parameters were considered:
  • The position p   ϵ   R 3 of the origin of {A} and {B} relative to {I};
  • The linear velocity v ϵ   R 3 of the origin of {A} and {B} relative to {I};
  • The yaw angle ψ that {B} observes regarding {A};
  • The fixed angular velocity r of {B} relative to {A};
  • The fixed ascending vertical linear velocity a of {B} relative to {I};
  • The fixed descending vertical linear velocity a of {B} relative to {I}.
The UAV motion equations consider, in all routes, the initial p i and final p f locations of the UAV, as well as the path it travels between these two points. This path can be linear if no obstacles are considered, or curvilinear if static obstacles, like walls or pillars, or dynamic obstacles, like moving people, are considered. In the present work, a space with only static obstacles associated with the geometry of the space, such as doors and walls, will be considered.
The motion equations that describe space projectiles are given by a system of three-dimensional Cartesian equations. These make it possible to calculate, at each instant, the three-dimensional location, p , of the UAV in the space, the direction and rotation, ψ, of the movement, and the elapsed time. The route traveled by the UAV during a mission is divided into sections, each of which has an associated system of equations of movement.
For each mission, it is necessary to define the path that the UAV will describe. This route is defined based on the BTS results so that the UAV can monitor the measured environmental variables more accurately. The indoor flight will consider a sequence of spaces that the UAV will visit during the mission. The number of cycles that will constitute the totality of the UAV mission will also be defined. For each cycle, the defined sequence of spaces will be repeated. The definition of this sequence is influenced by some factors that will result in a realistic mission, as given below:
  • The limitations of the UAV under study, namely the average duration of its battery, according to the payload to be implemented;
  • The time required for the measurement of environmental variables, which affects the time that the UAV must stay in the hover position and depends on the implemented sensors;
  • A third important factor is the priority of spaces with greater measurement amplitudes and dynamics of the environmental variables compared to spaces with more constant parameters.
In the present work, the path associated with each cycle is initially given. The developed simulator determines the following:
  • The average Cartesian coordinate of each space;
  • The mean Cartesian coordinate of the passage gates that define the boundary between the spaces to be traversed. For each door, the simulator calculates the average coordinate of this passage point, which will be taken into account when calculating the UAV trajectory.
Therefore, by gathering information regarding passage and measurement points, as well as the velocities assigned to the UAV, it is possible to create a safe trajectory for the development of the mission. This information can, in a real test scenario, be provided by the user or be evaluated by the UAV itself, using information collected in a space mapping pre-mission.
The measurement points of the environmental variables must be strategically chosen, being accessible to the UAV and representative of the space under study. Thus, in this work, it was considered that the UAV performs the measurements of environmental variables in the center of each space. The levels of TC will then be evaluated.
The assessment of TC will be conducted by measuring the internal air temperature, the internal relative humidity levels and the surface temperature (of the floor, lateral walls and ceiling). The three methods, as well as the indoor air temperature MRT simplification, will be compared with the MRT calculated by the BTS.
On the other hand, some guidelines have been defined for the measurement of the remaining factors. The air velocity, if measured by the UAV itself, may be influenced by its aerodynamics. Additionally, it should represent the air movement around the occupants. Therefore, it should be measured in the occupied zone. The remaining measurements should not have this restriction, so they will be monitored through hardware in the UAV. Quick response sensors implemented in the UAV were considered for the measurement of the following:
  • The internal air temperature;
  • The internal relative humidity;
  • The surface temperature.
Based on the methodology presented, this study enables the analysis of the environmental variables of each space and, for each time instant, to reconcile two simulators, resulting in a simultaneous evaluation of the dynamic response of buildings and the evaluation of the dynamic movement of the UAV. These UAV simulators, which can evaluate the environmental variables experienced in environmental buildings, use information evaluated by the BTS numerical model, in each space and at each instant. The objective focuses on evaluating whether the measurements performed by the UAV can be representative in comparison with the more extensive building assessments, especially in space and time instants where there are greater variations of environmental variables.
In this paper, the UAV sensors, namely the air temperature, air relative humidity, and surface temperature, use the information calculated by the BTS numerical model at the same instant and the same compartment measured. This information that is related to the UAV mission (number of UAV, trajectory and measuring points) is used to evaluate the following:
  • The measuring representation when a higher environment variation level is observed, namely when the occupants enter or leave the space or when the airflow rate changes;
  • The simplification applied in the PMV evaluation.
As an alternative measuring technique, a UAV is applied to evaluate the TC levels. In this methodology, a UAV uses the information calculated by the BTS numerical model at the same instant and the same measured compartment. This methodology is used in the UAV simulator to evaluate the environmental variables in transient conditions throughout an entire day and in all spaces. This methodology is used to plan the UAV mission in a real building, namely, to plan the UAV measured velocity, the UAV trajectory, the number of UAVs, and other parameters, as well as the influence of the measurement used for the PMV evaluation.
In order to verify the performance of the UAV measurements, the comparison between the numerical values obtained in the BTS and numerical values obtained in the UAV DS is carried out. In the variables comparison:
  • The higher environment variation is assessed. In this case, the TC is compared using one and two UAV missions;
  • The mean radiant temperature (MRT) methodology used in PMV evaluation is assessed. In this case, the MRT measuring methodology, using the floor temperature, the lateral walls temperatures, the ceiling temperatures and the air temperature, is applied.

4. Results and Discussion

In this section, the results obtained by both simulators are presented and compared, and the TC assessment is analyzed in detail.

4.1. BTS Results

In this section, the solar radiation that the glass surfaces are subjected to, the carbon dioxide concentration, the indoor air temperature, the MRT, and the TC level, are presented.

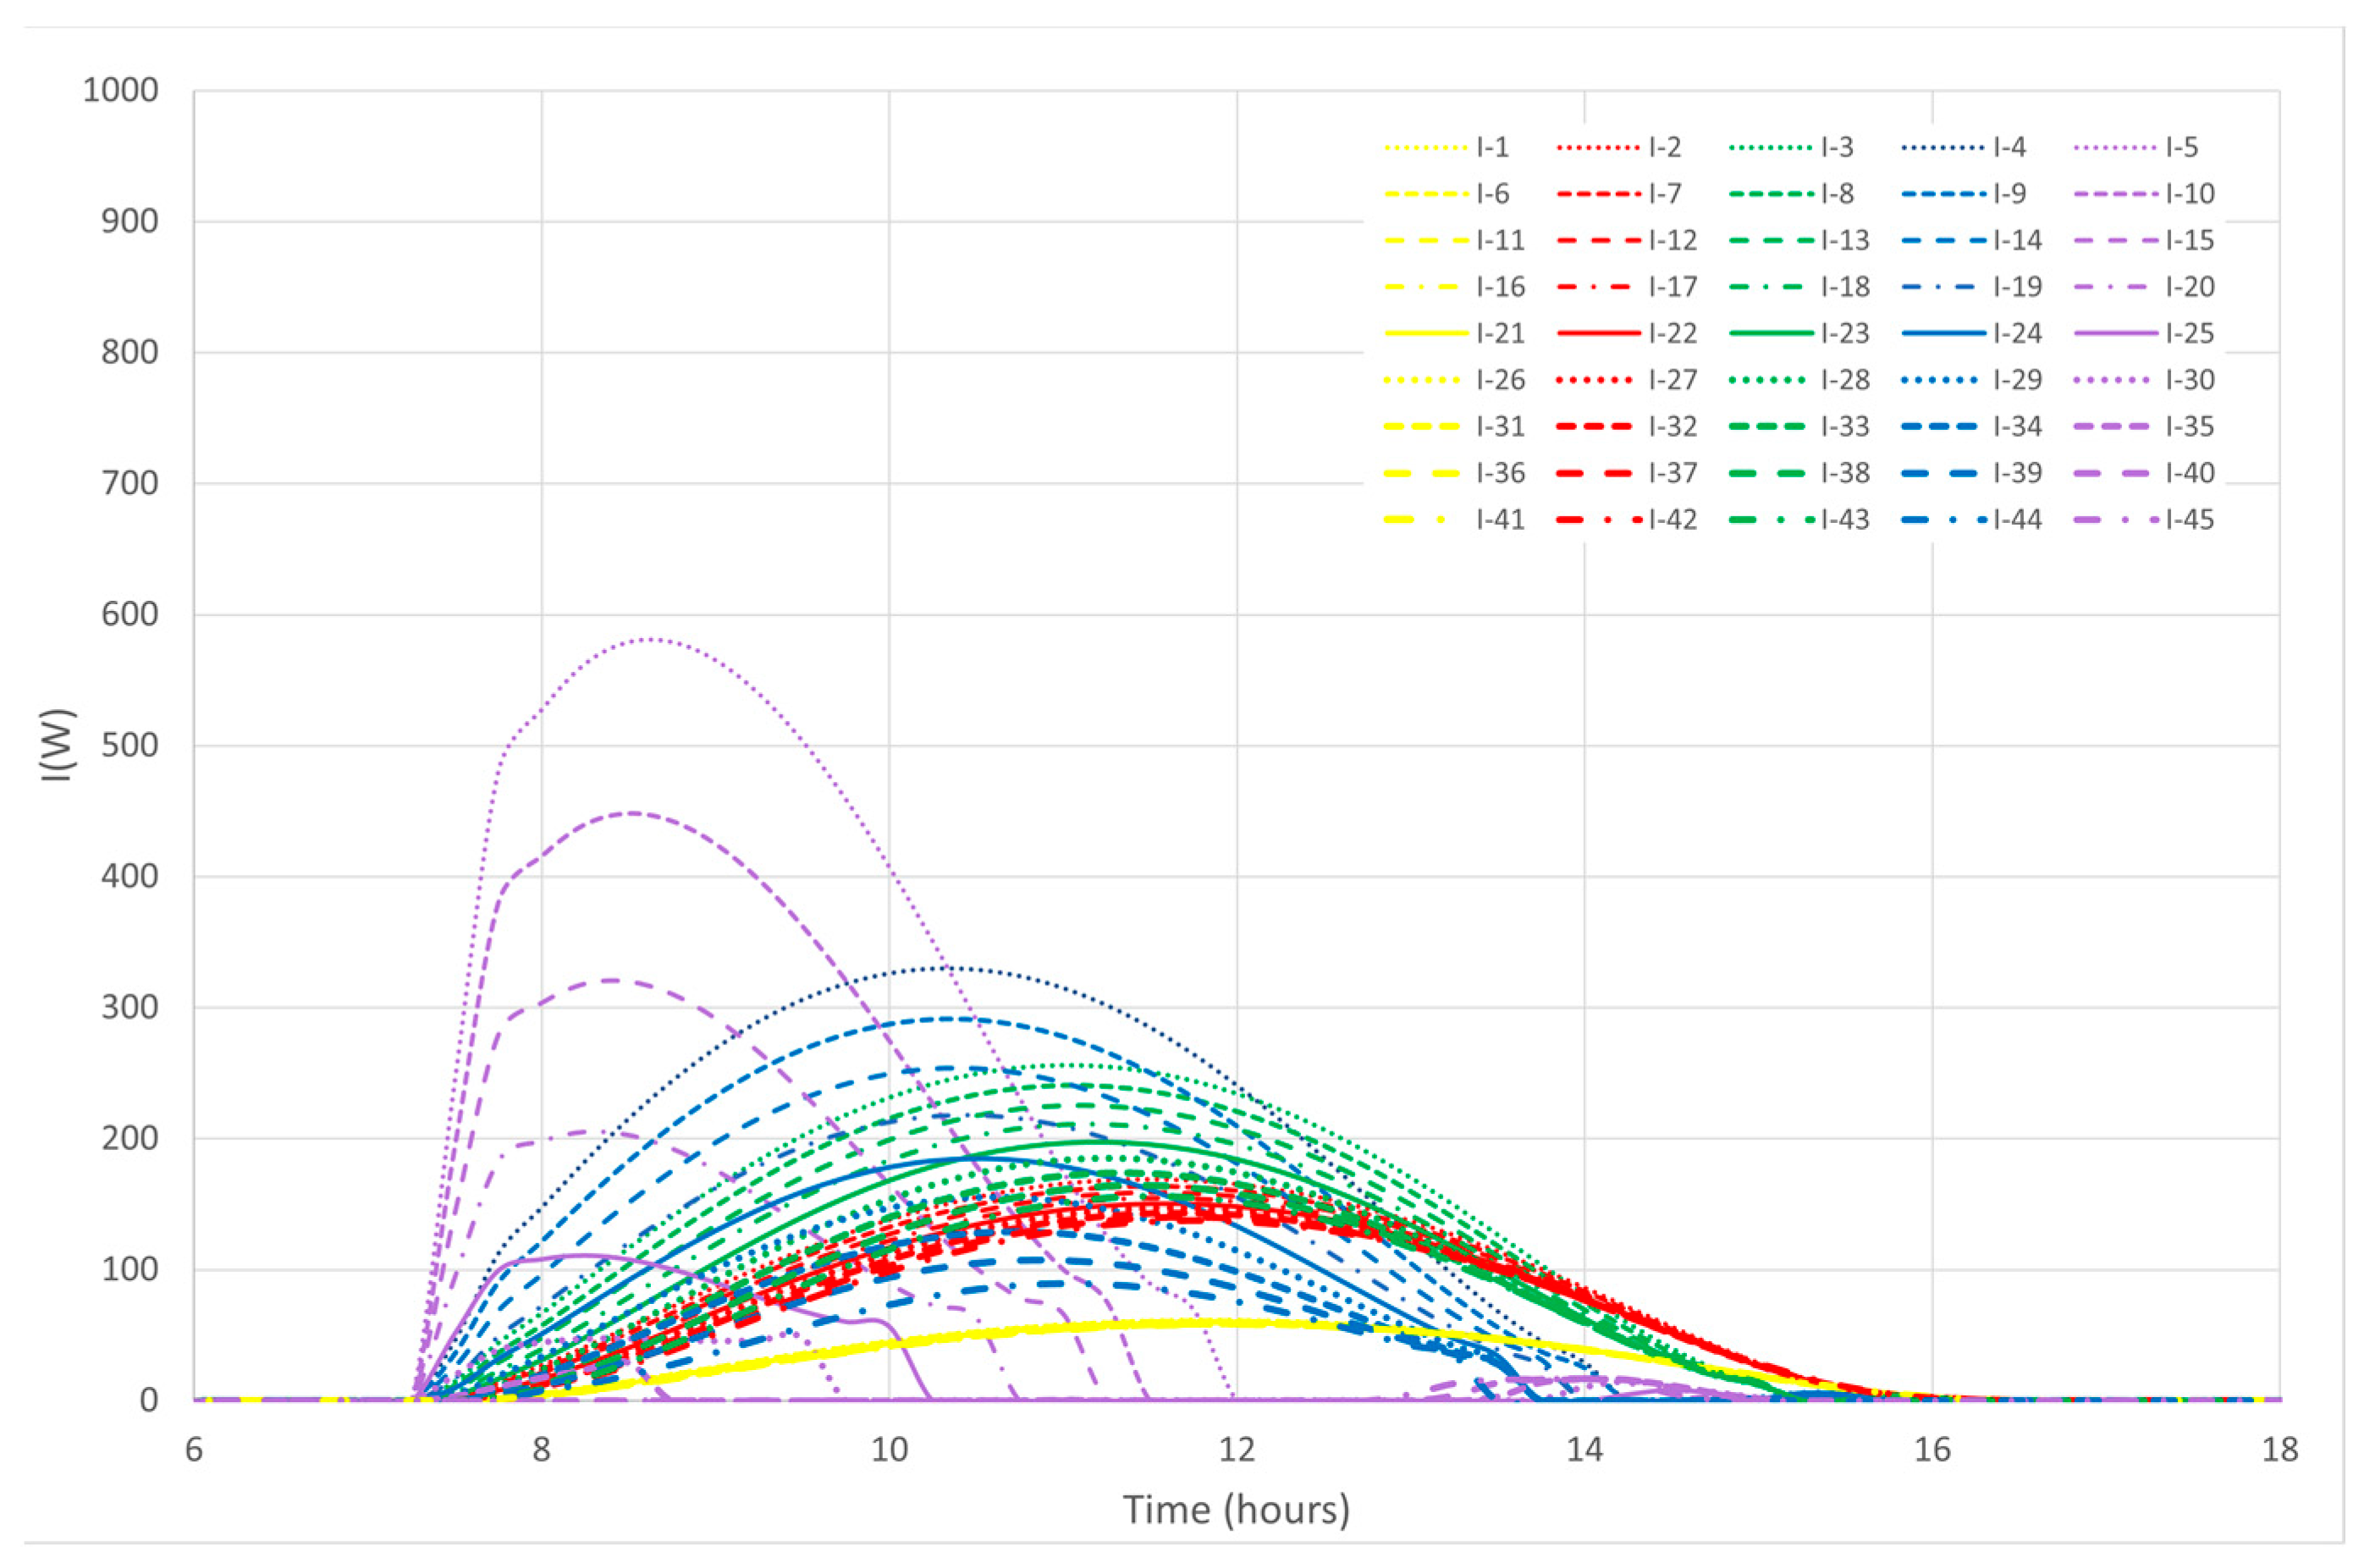
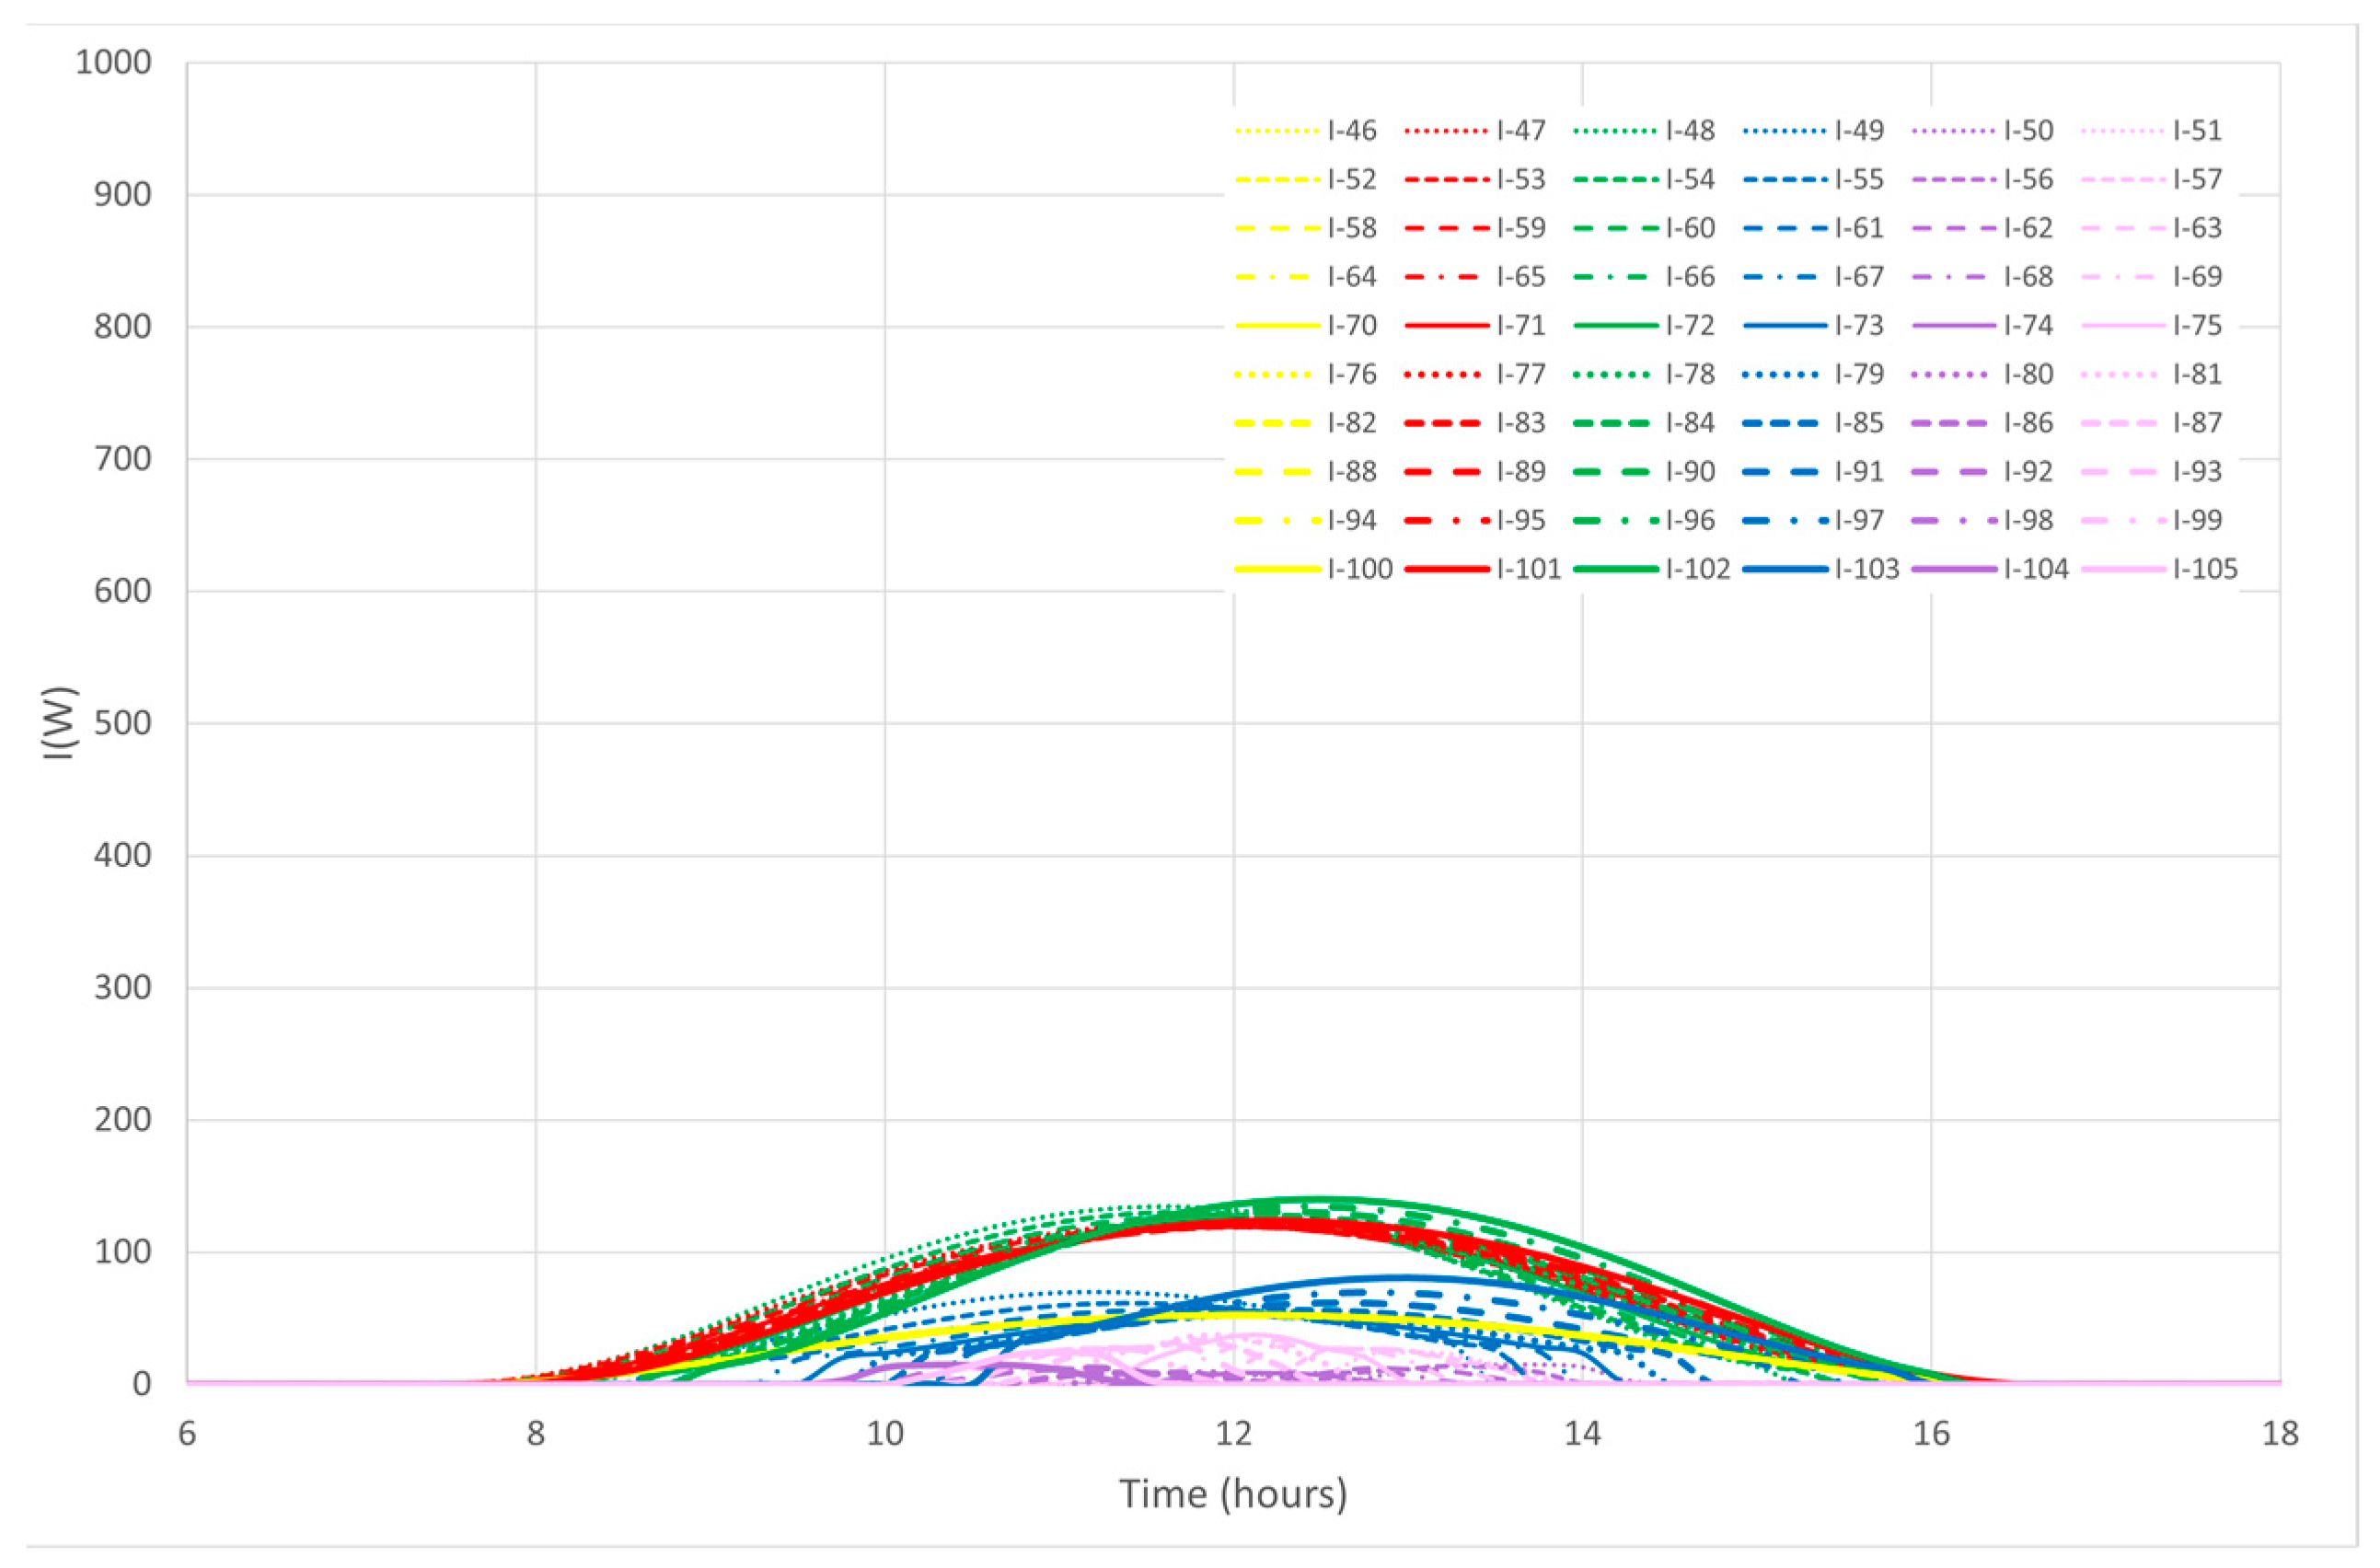
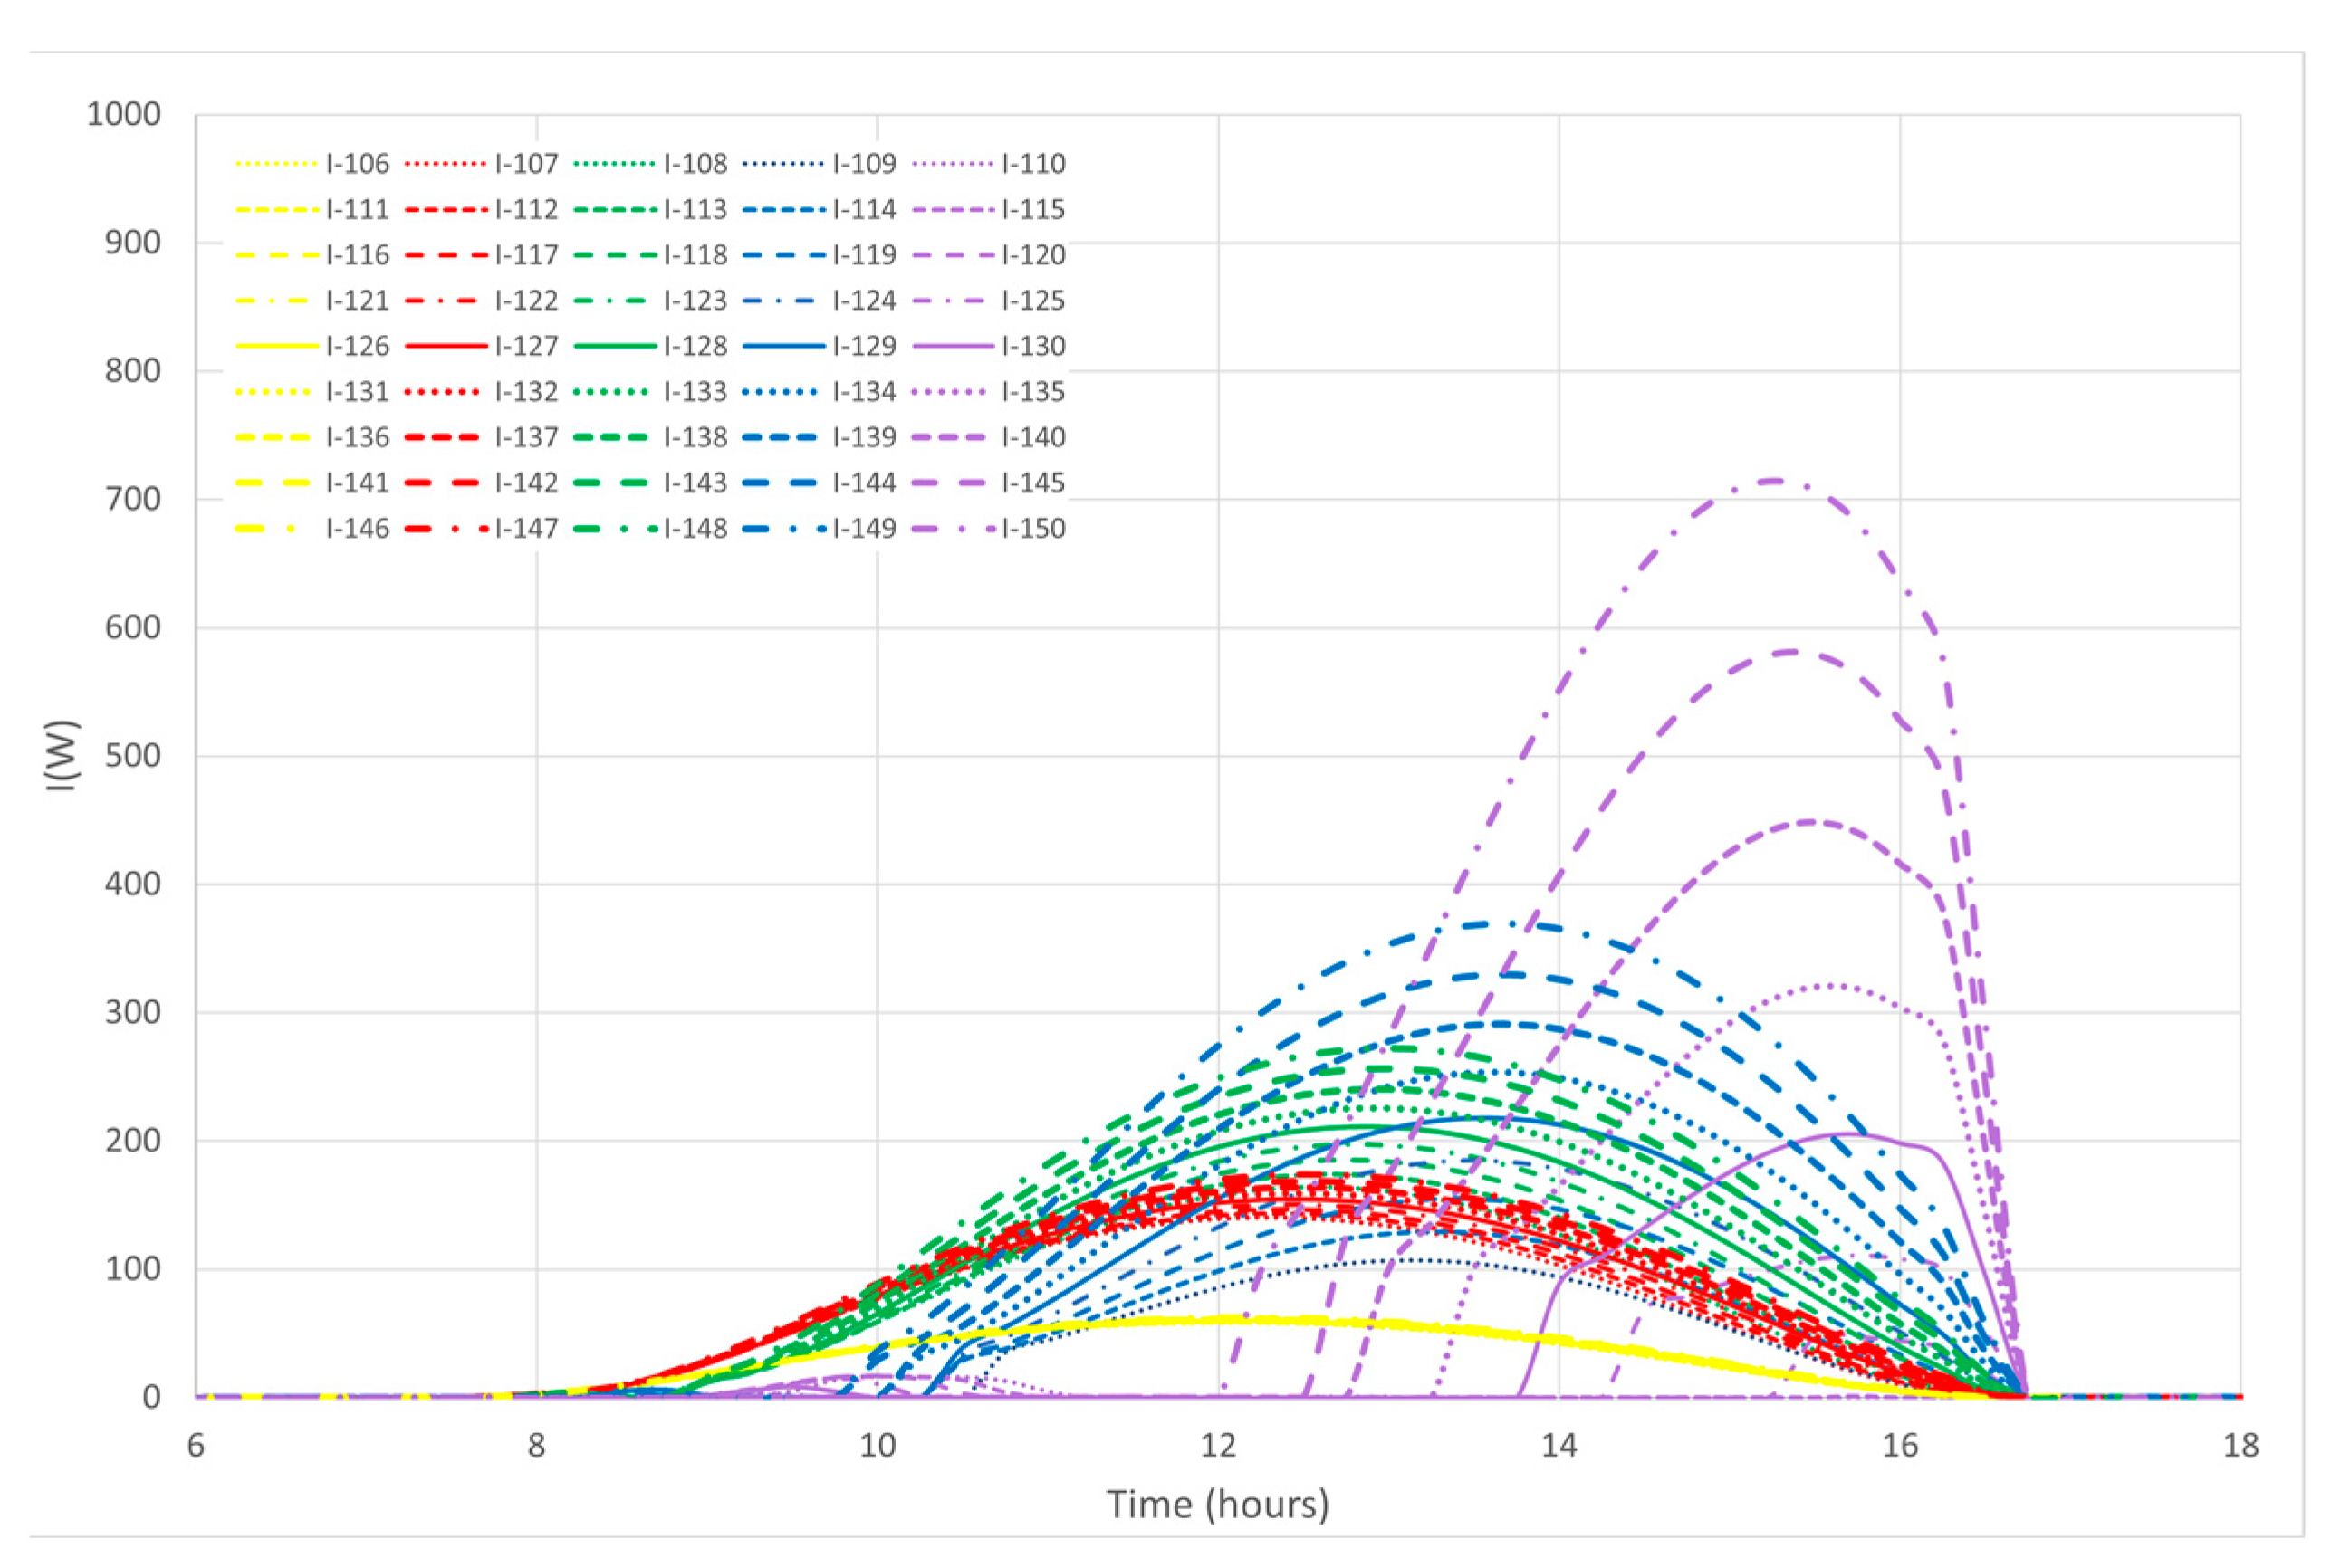
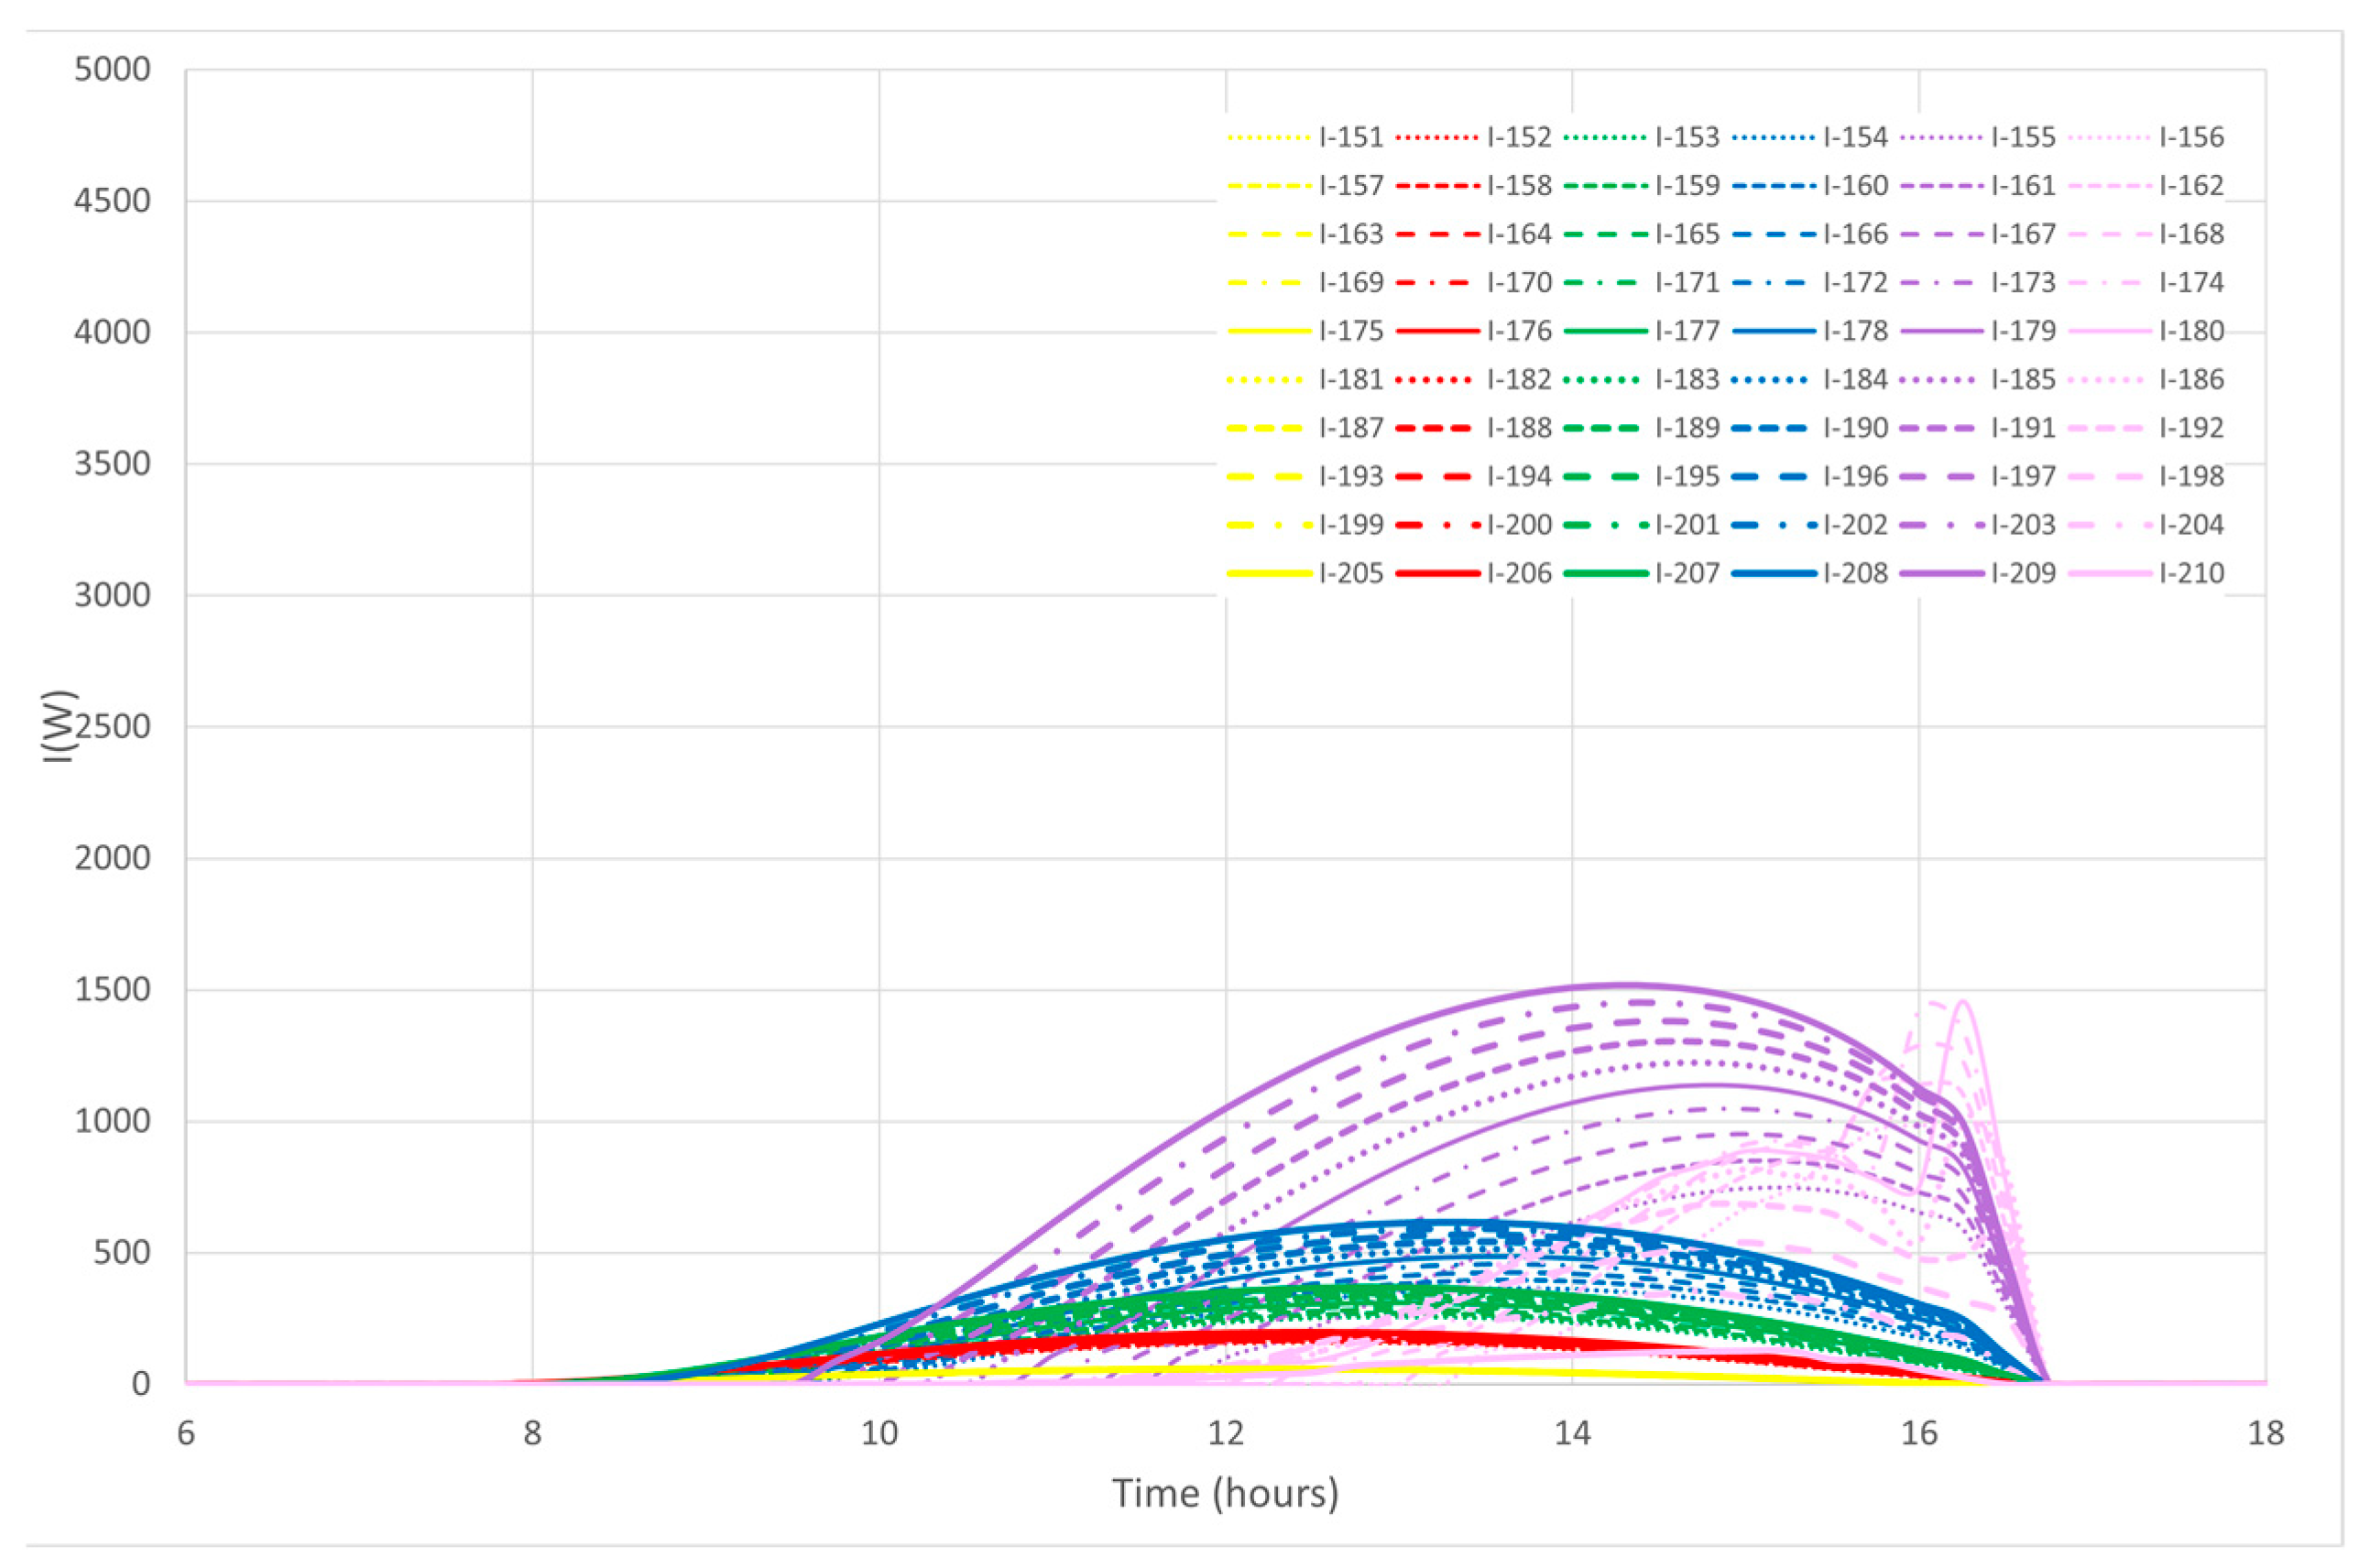
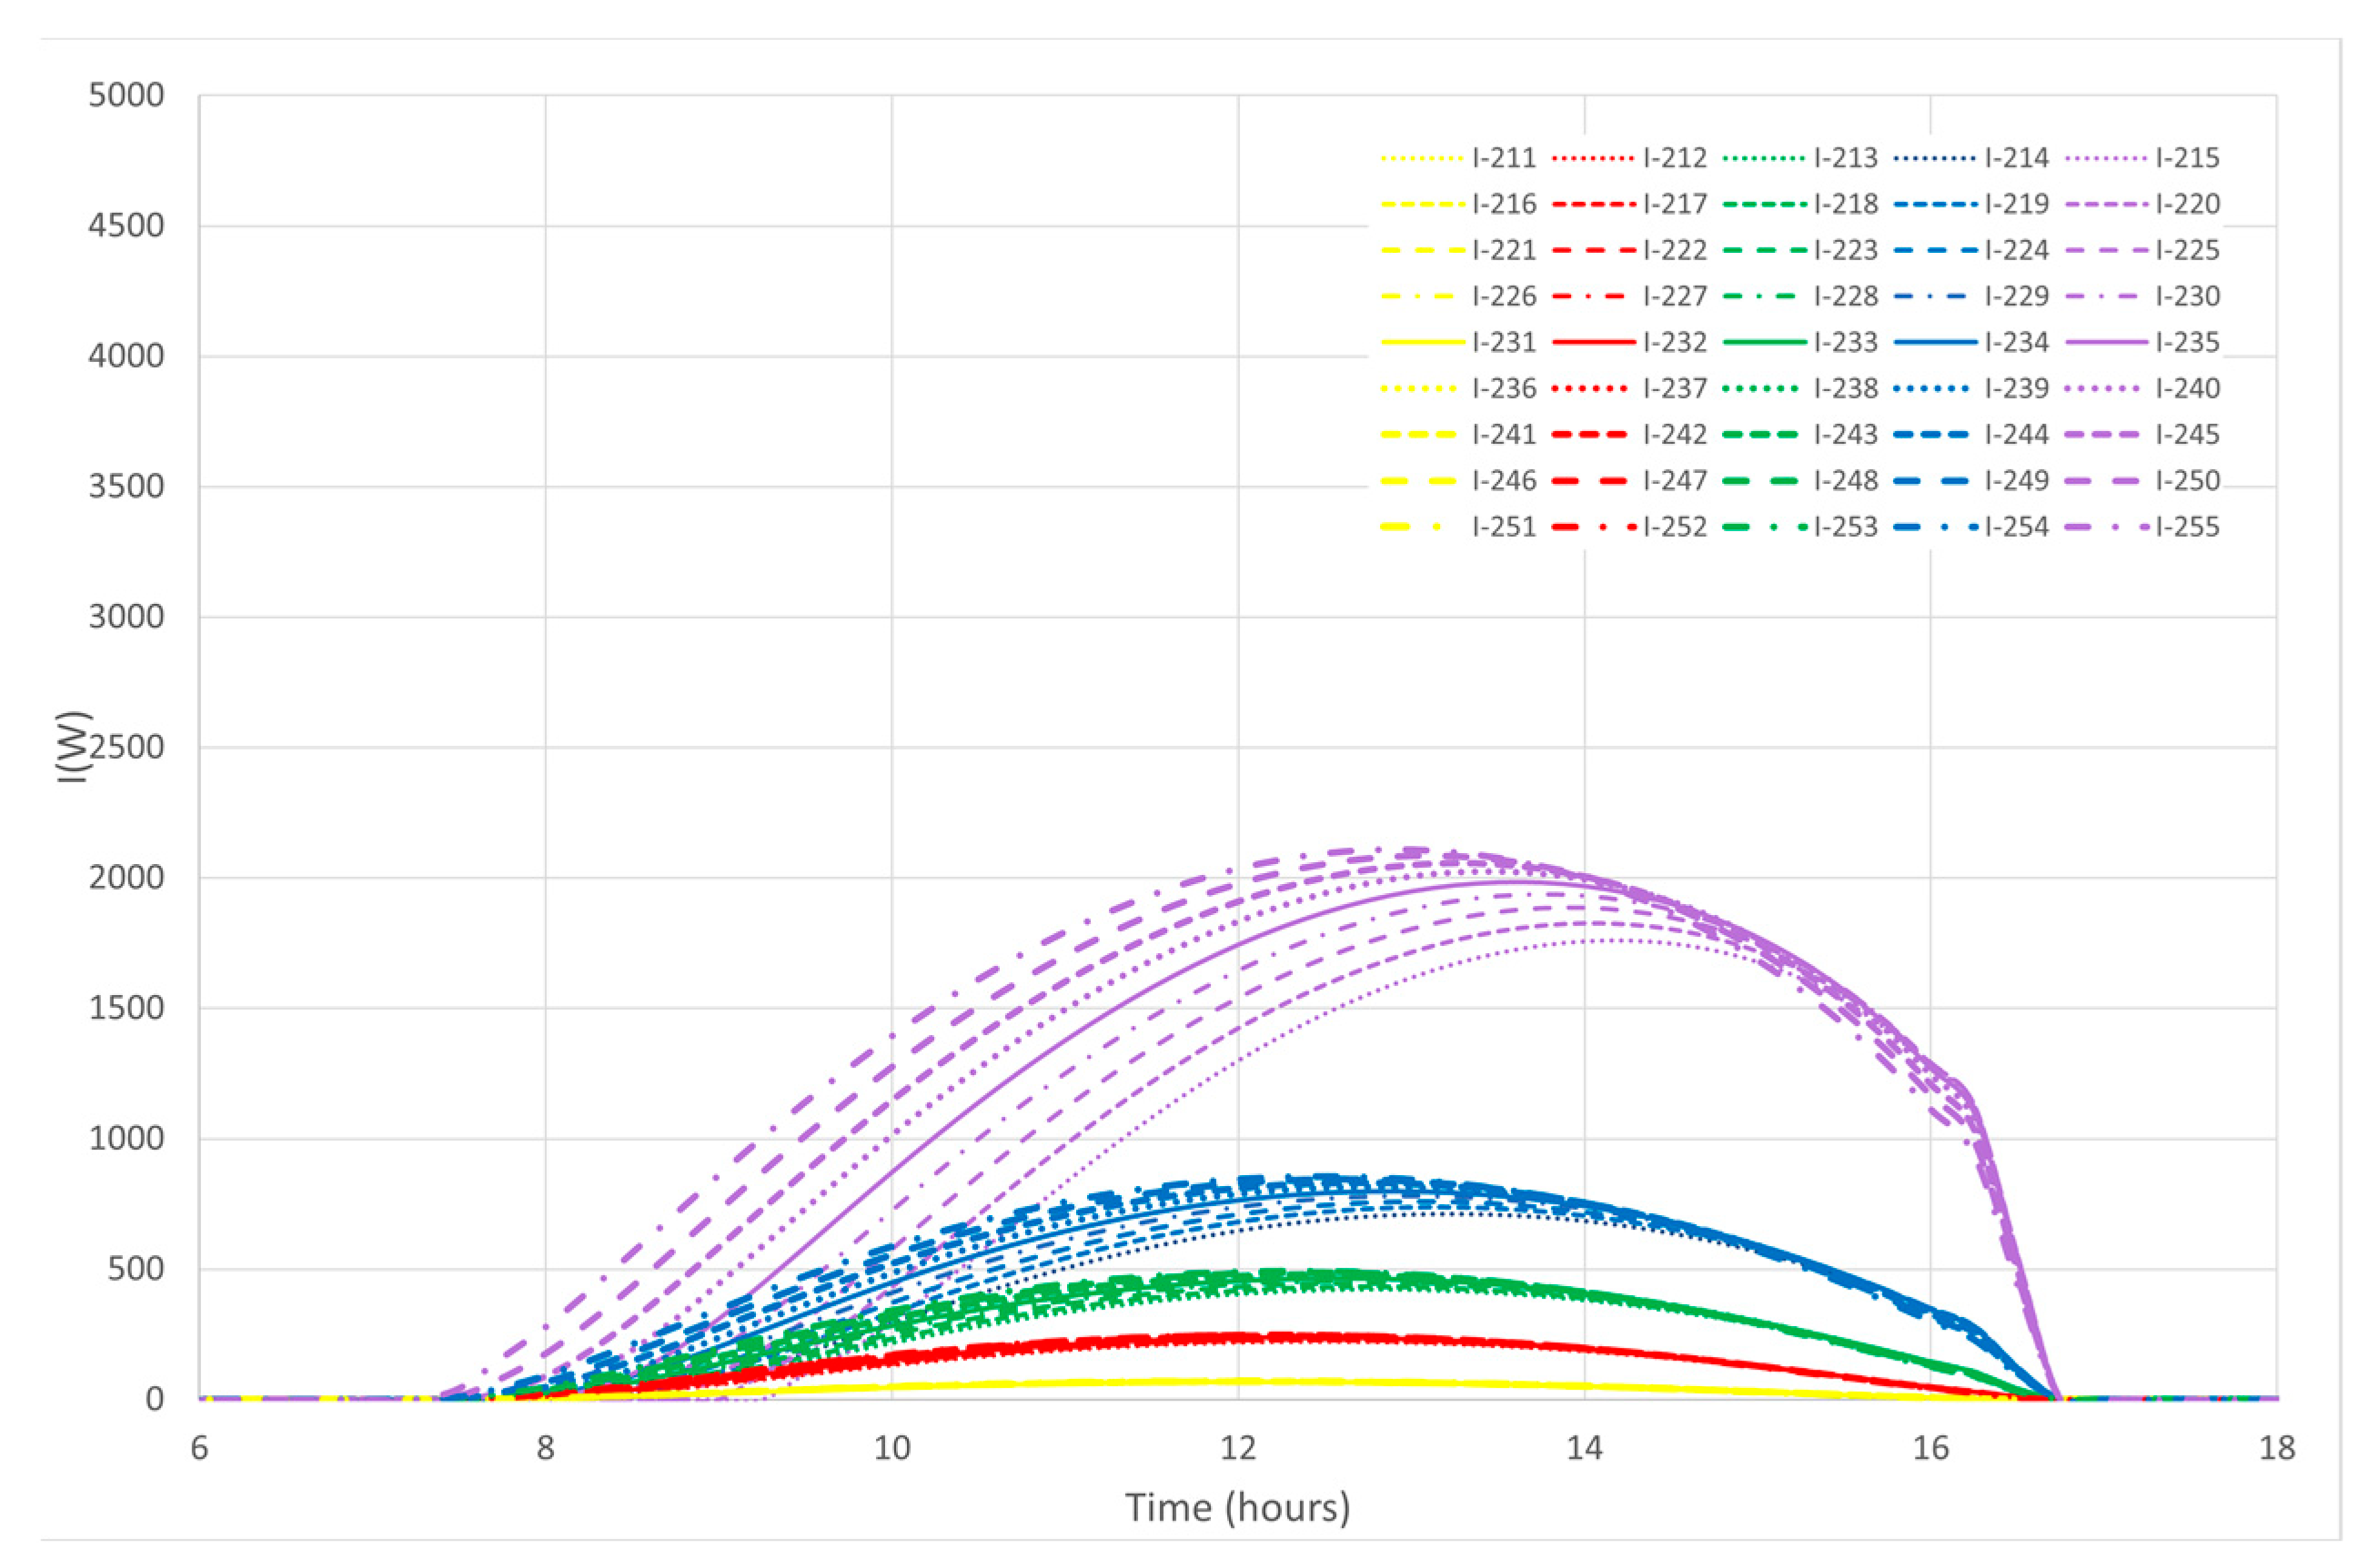
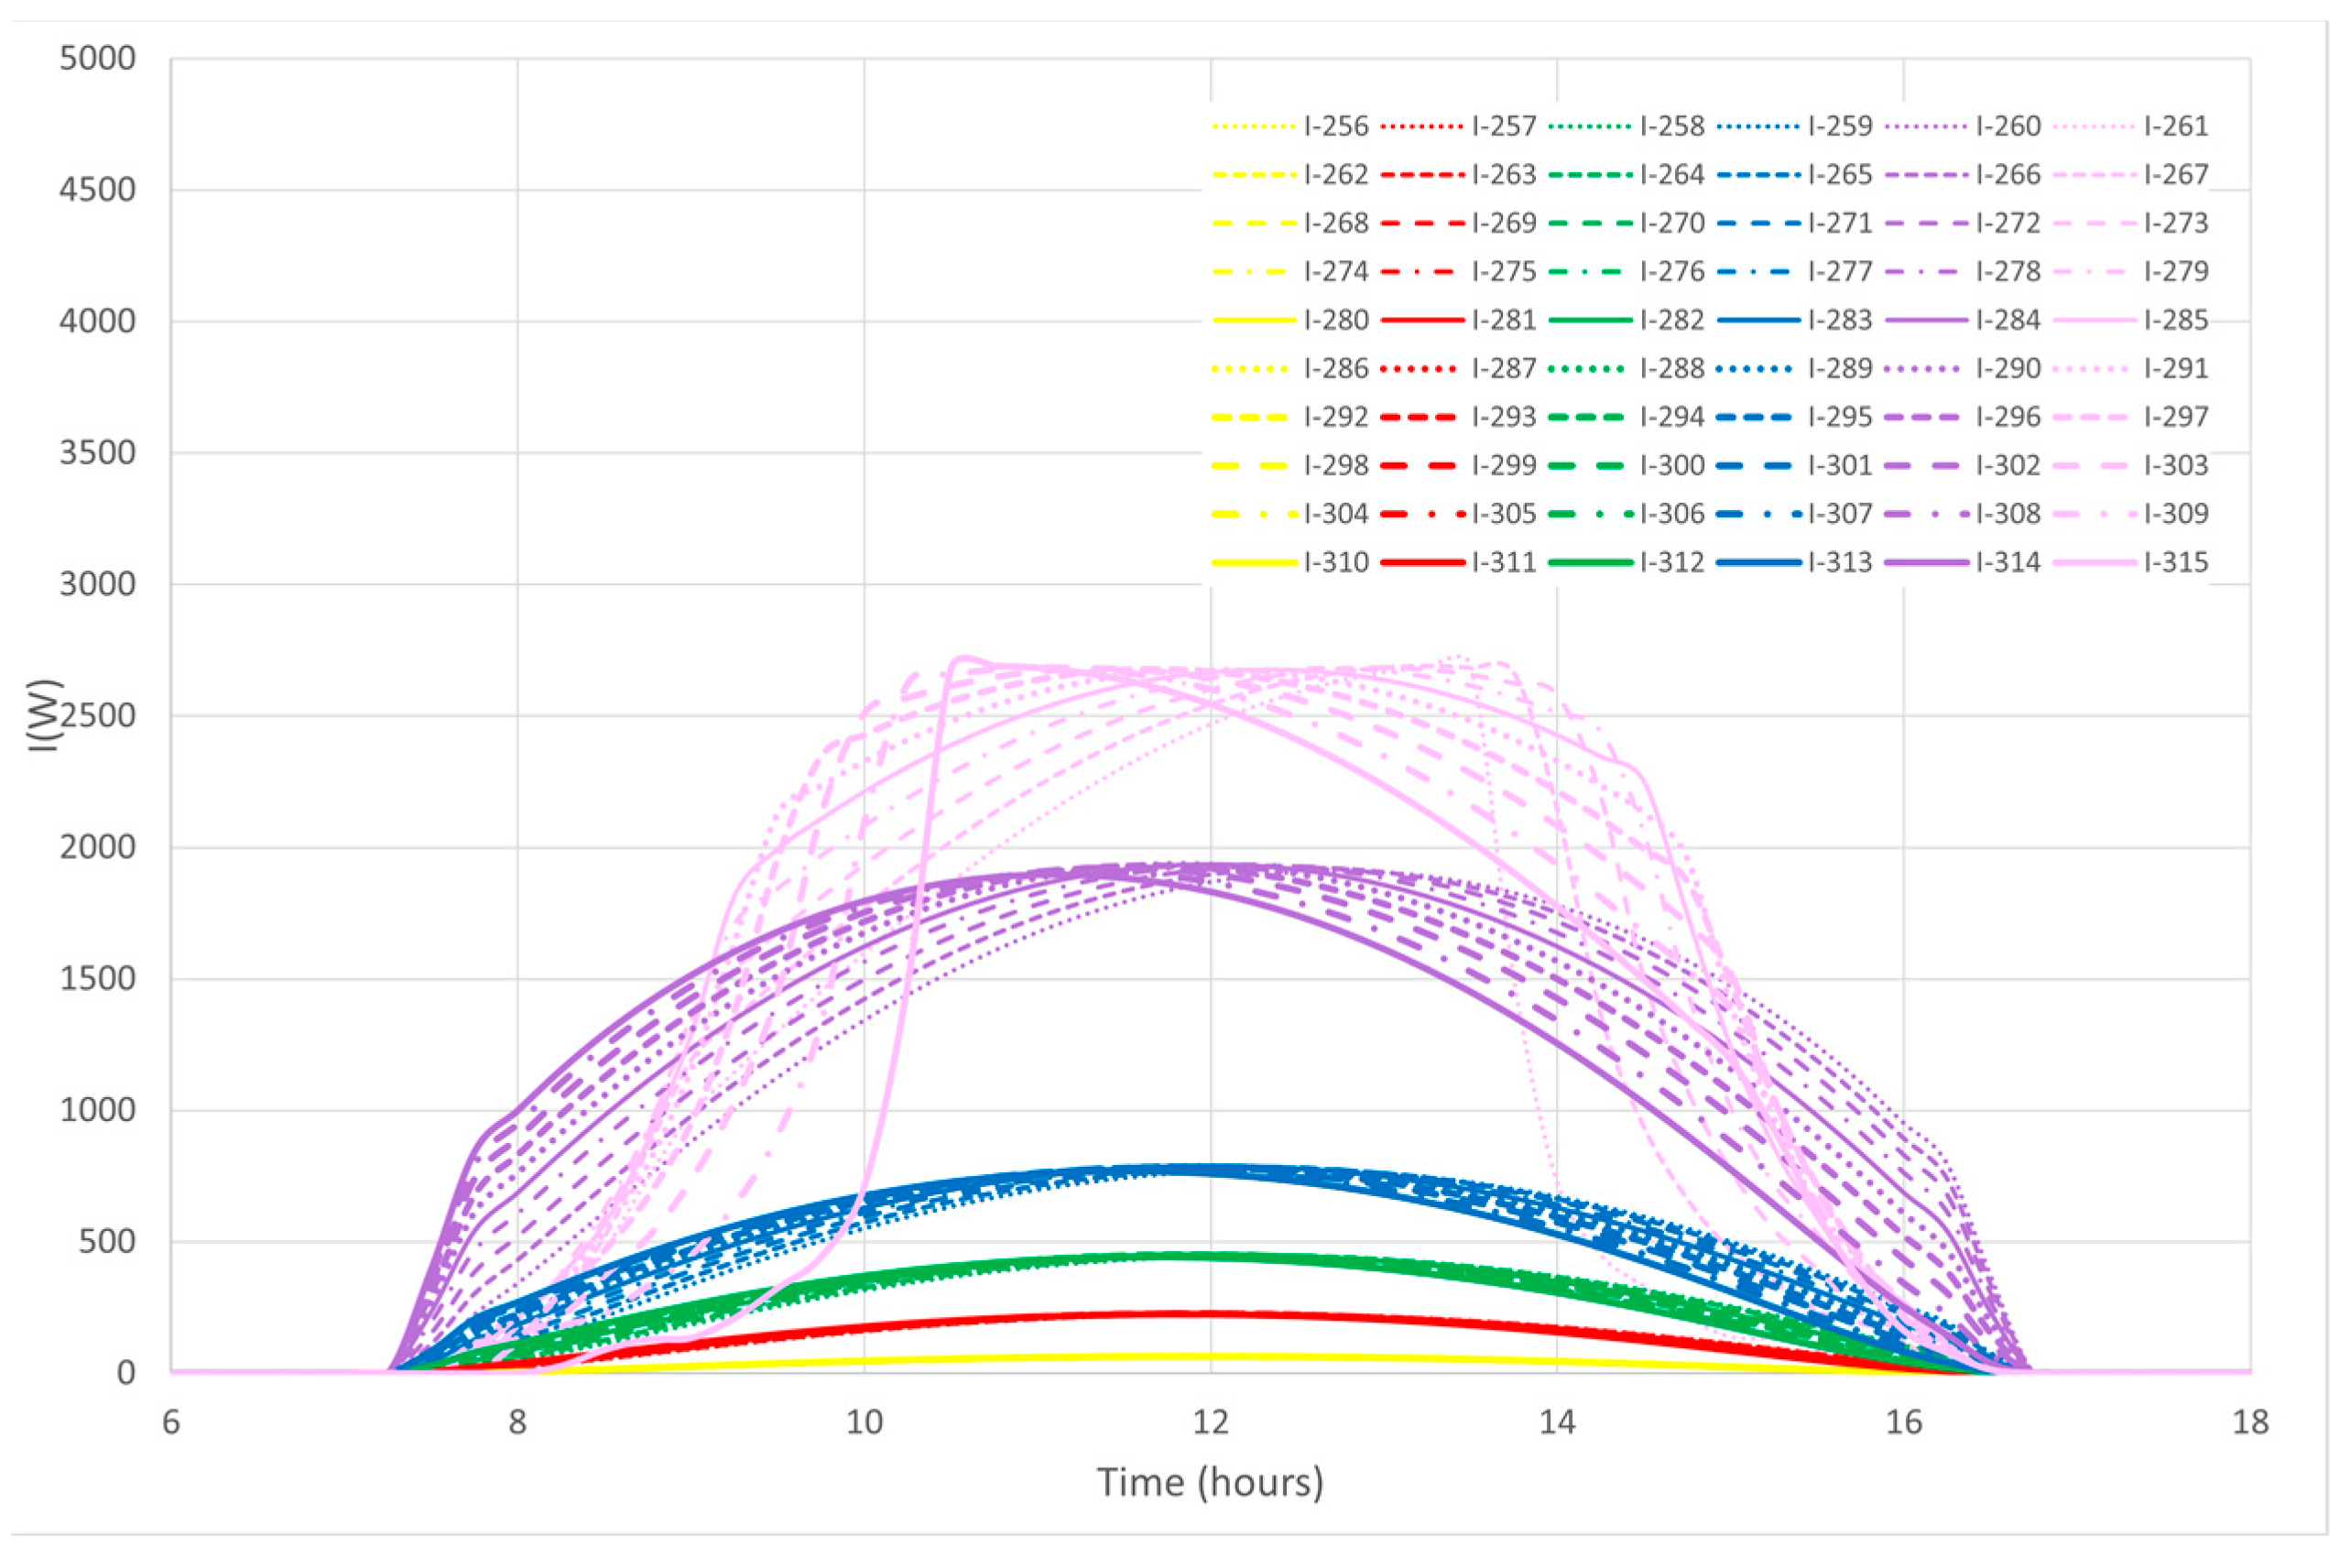
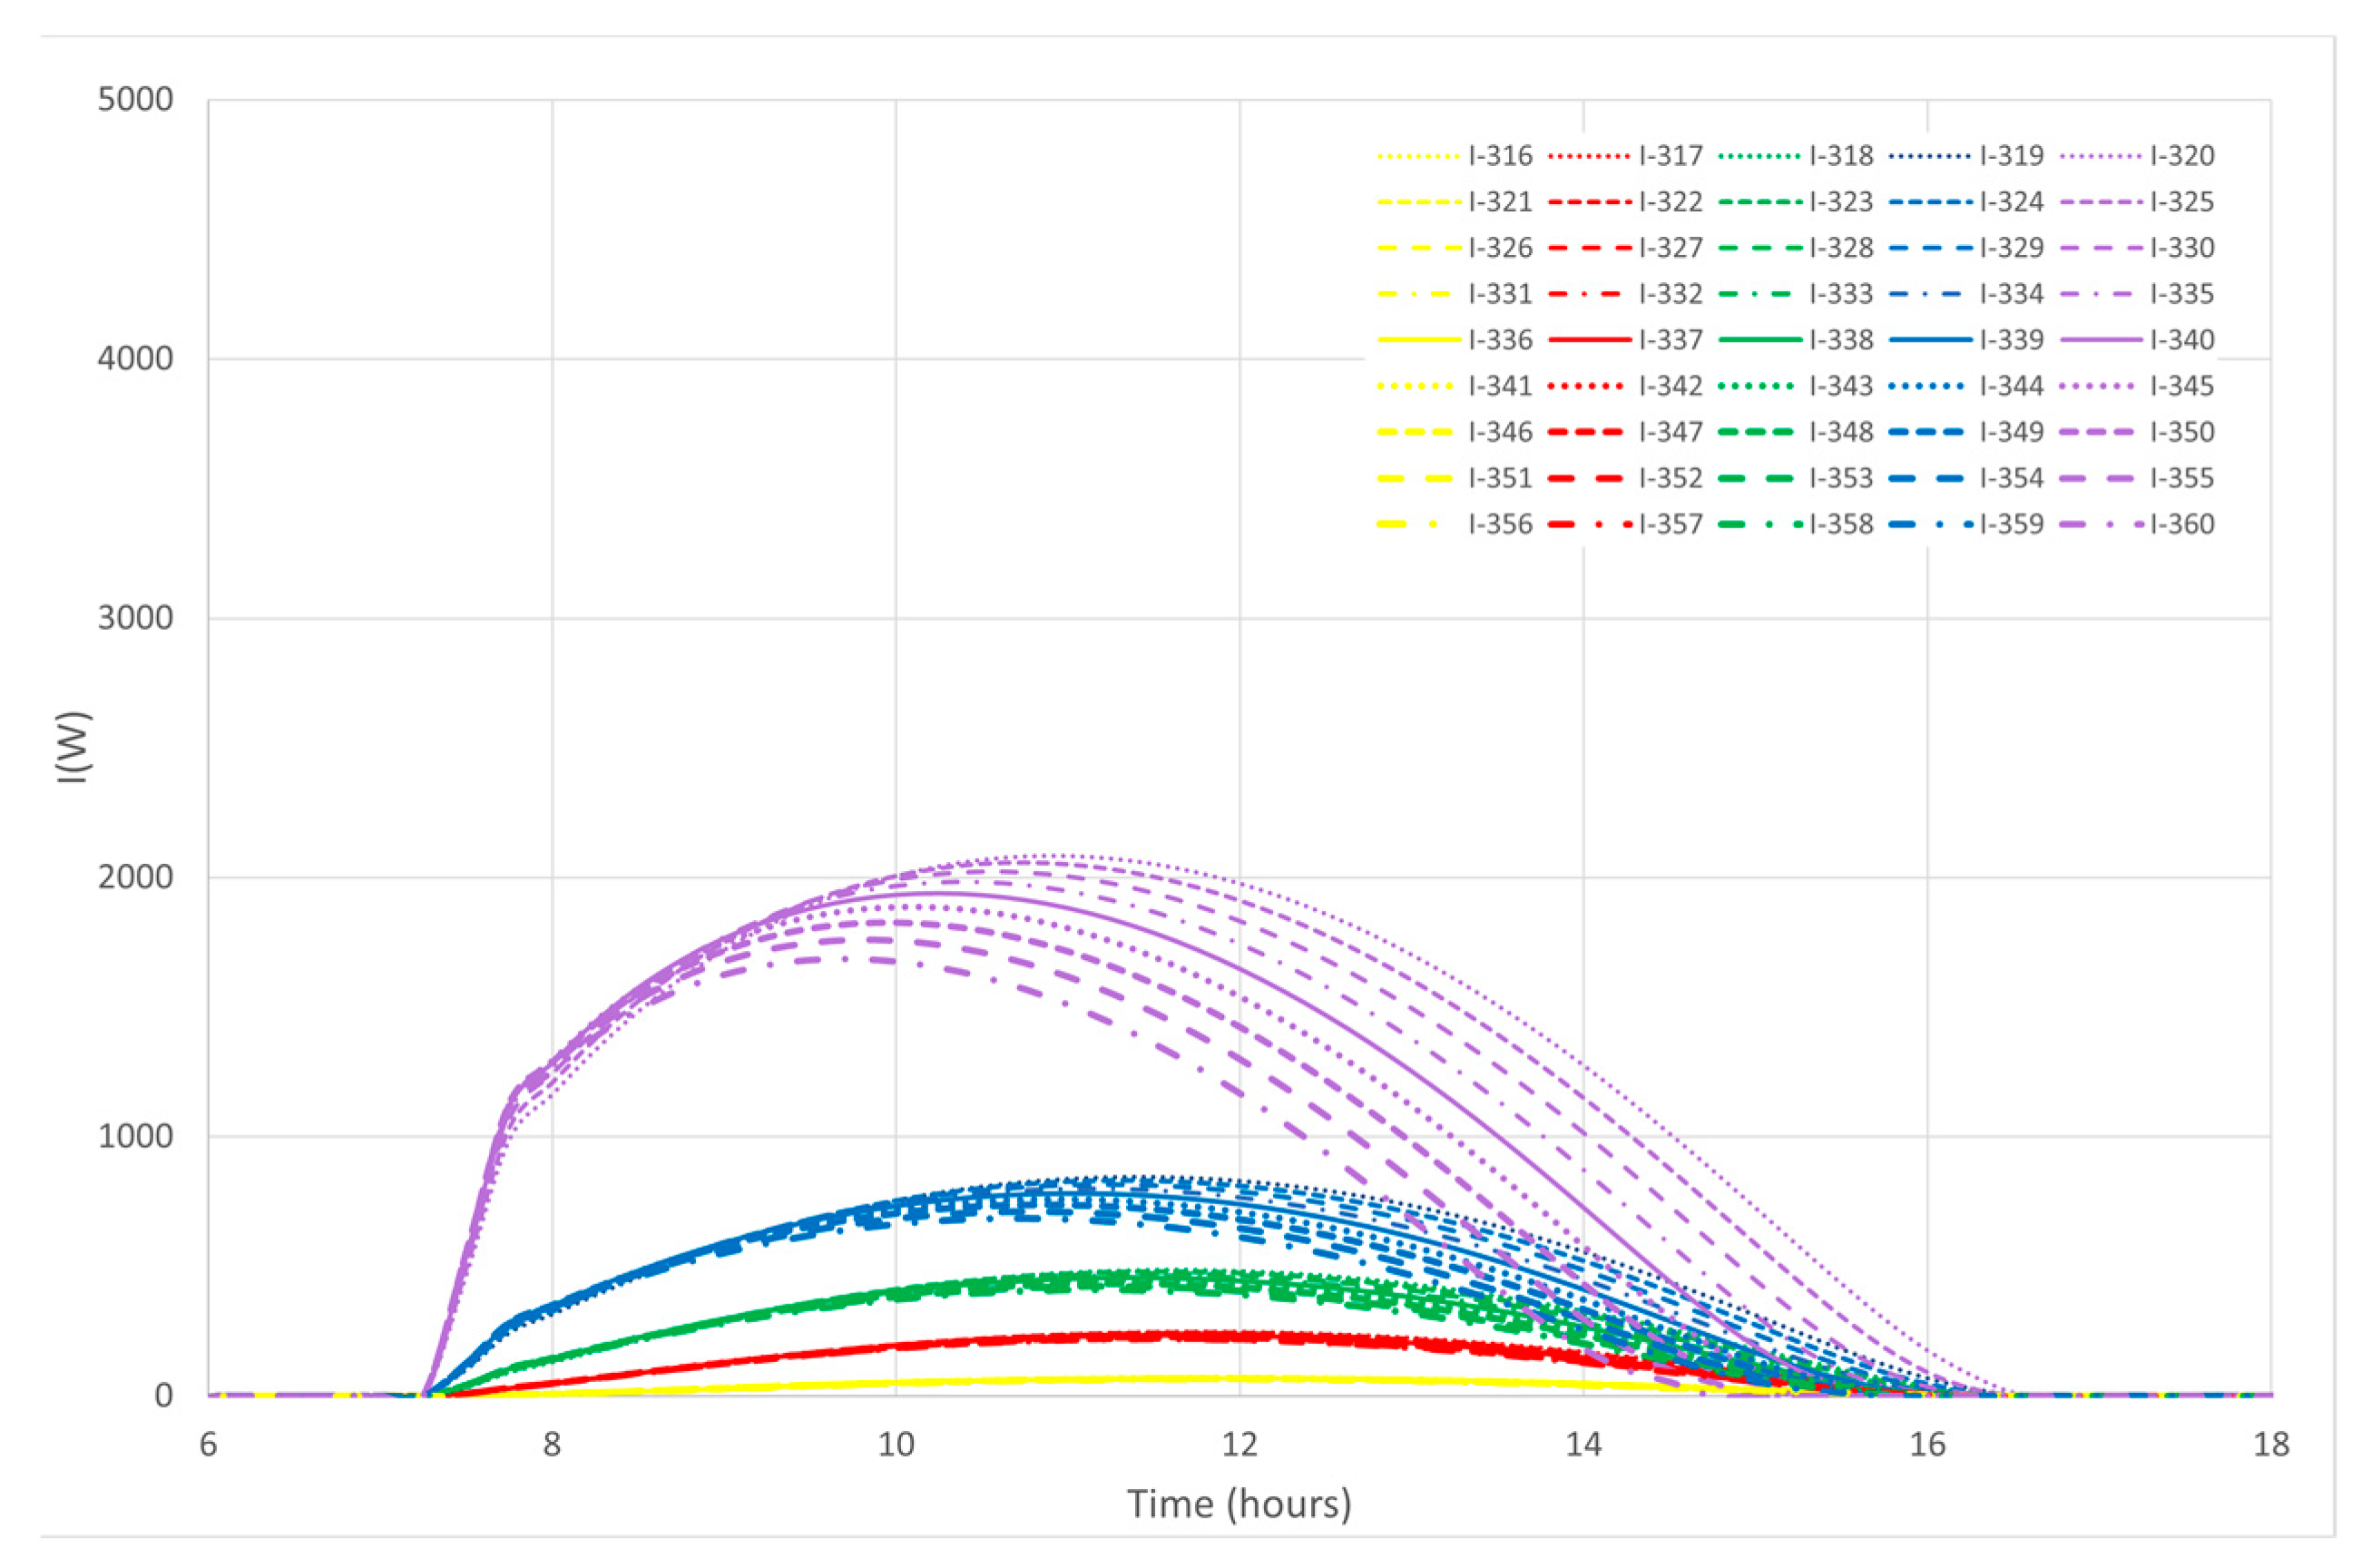
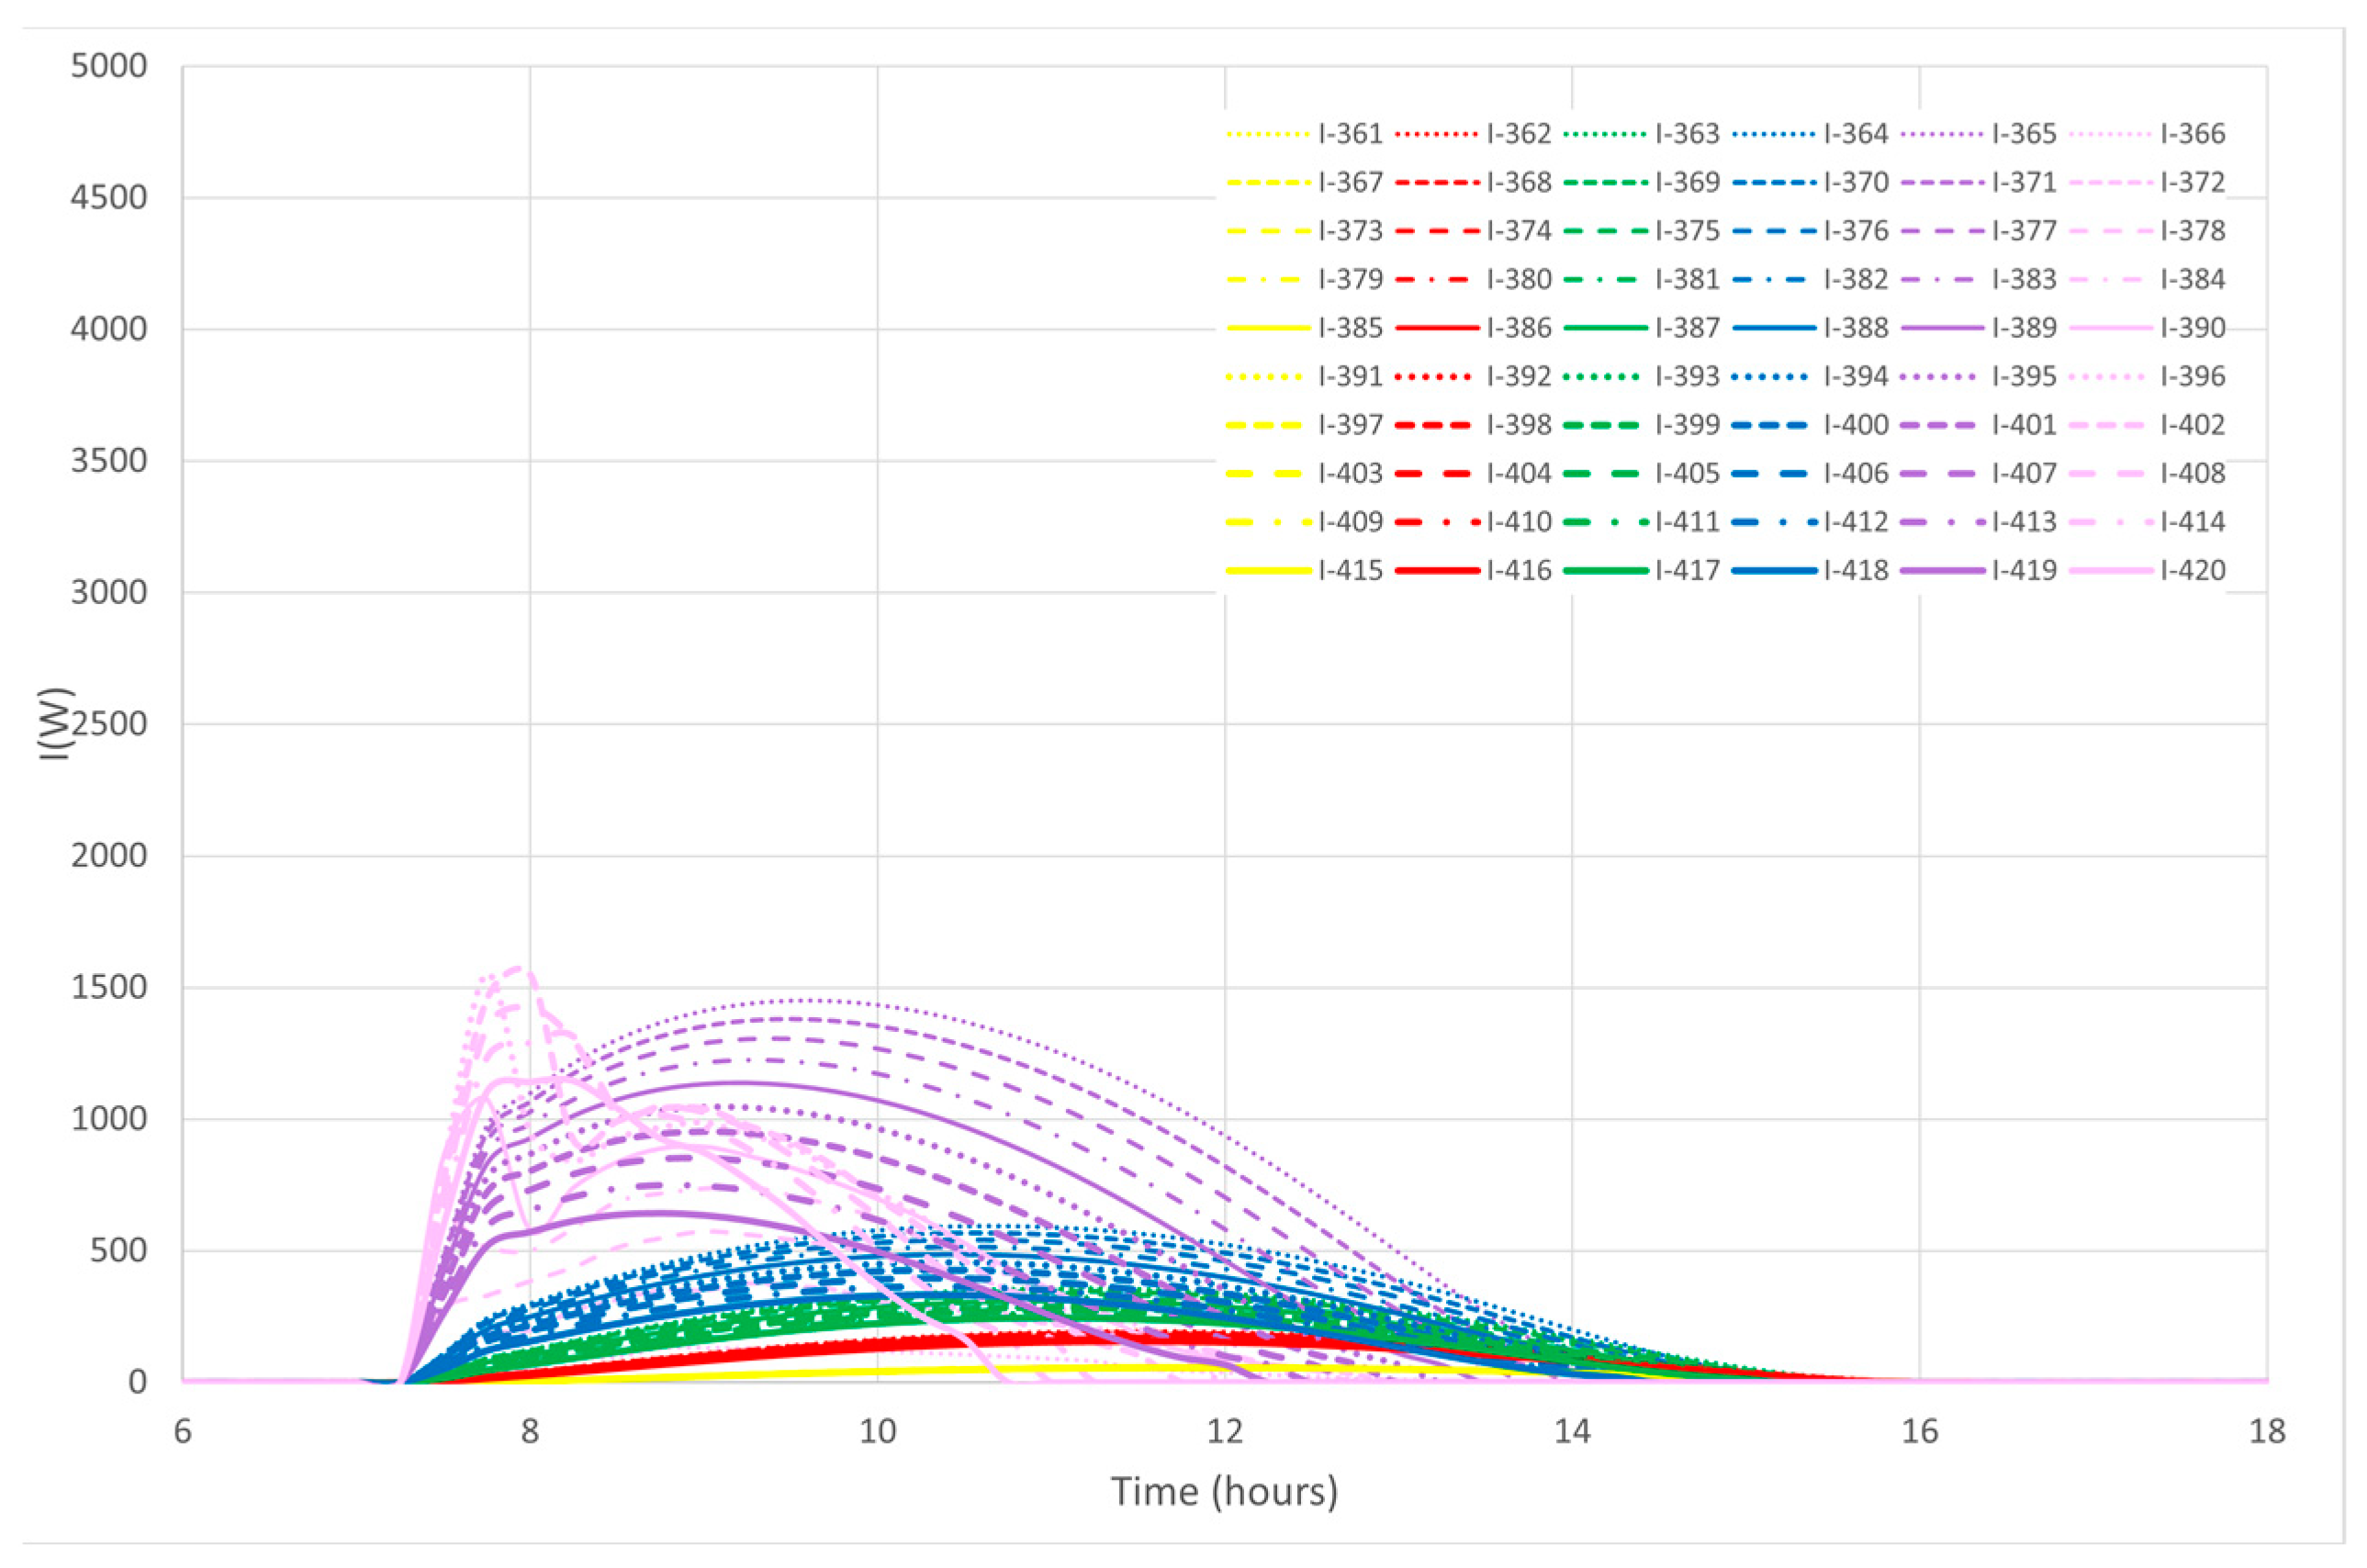
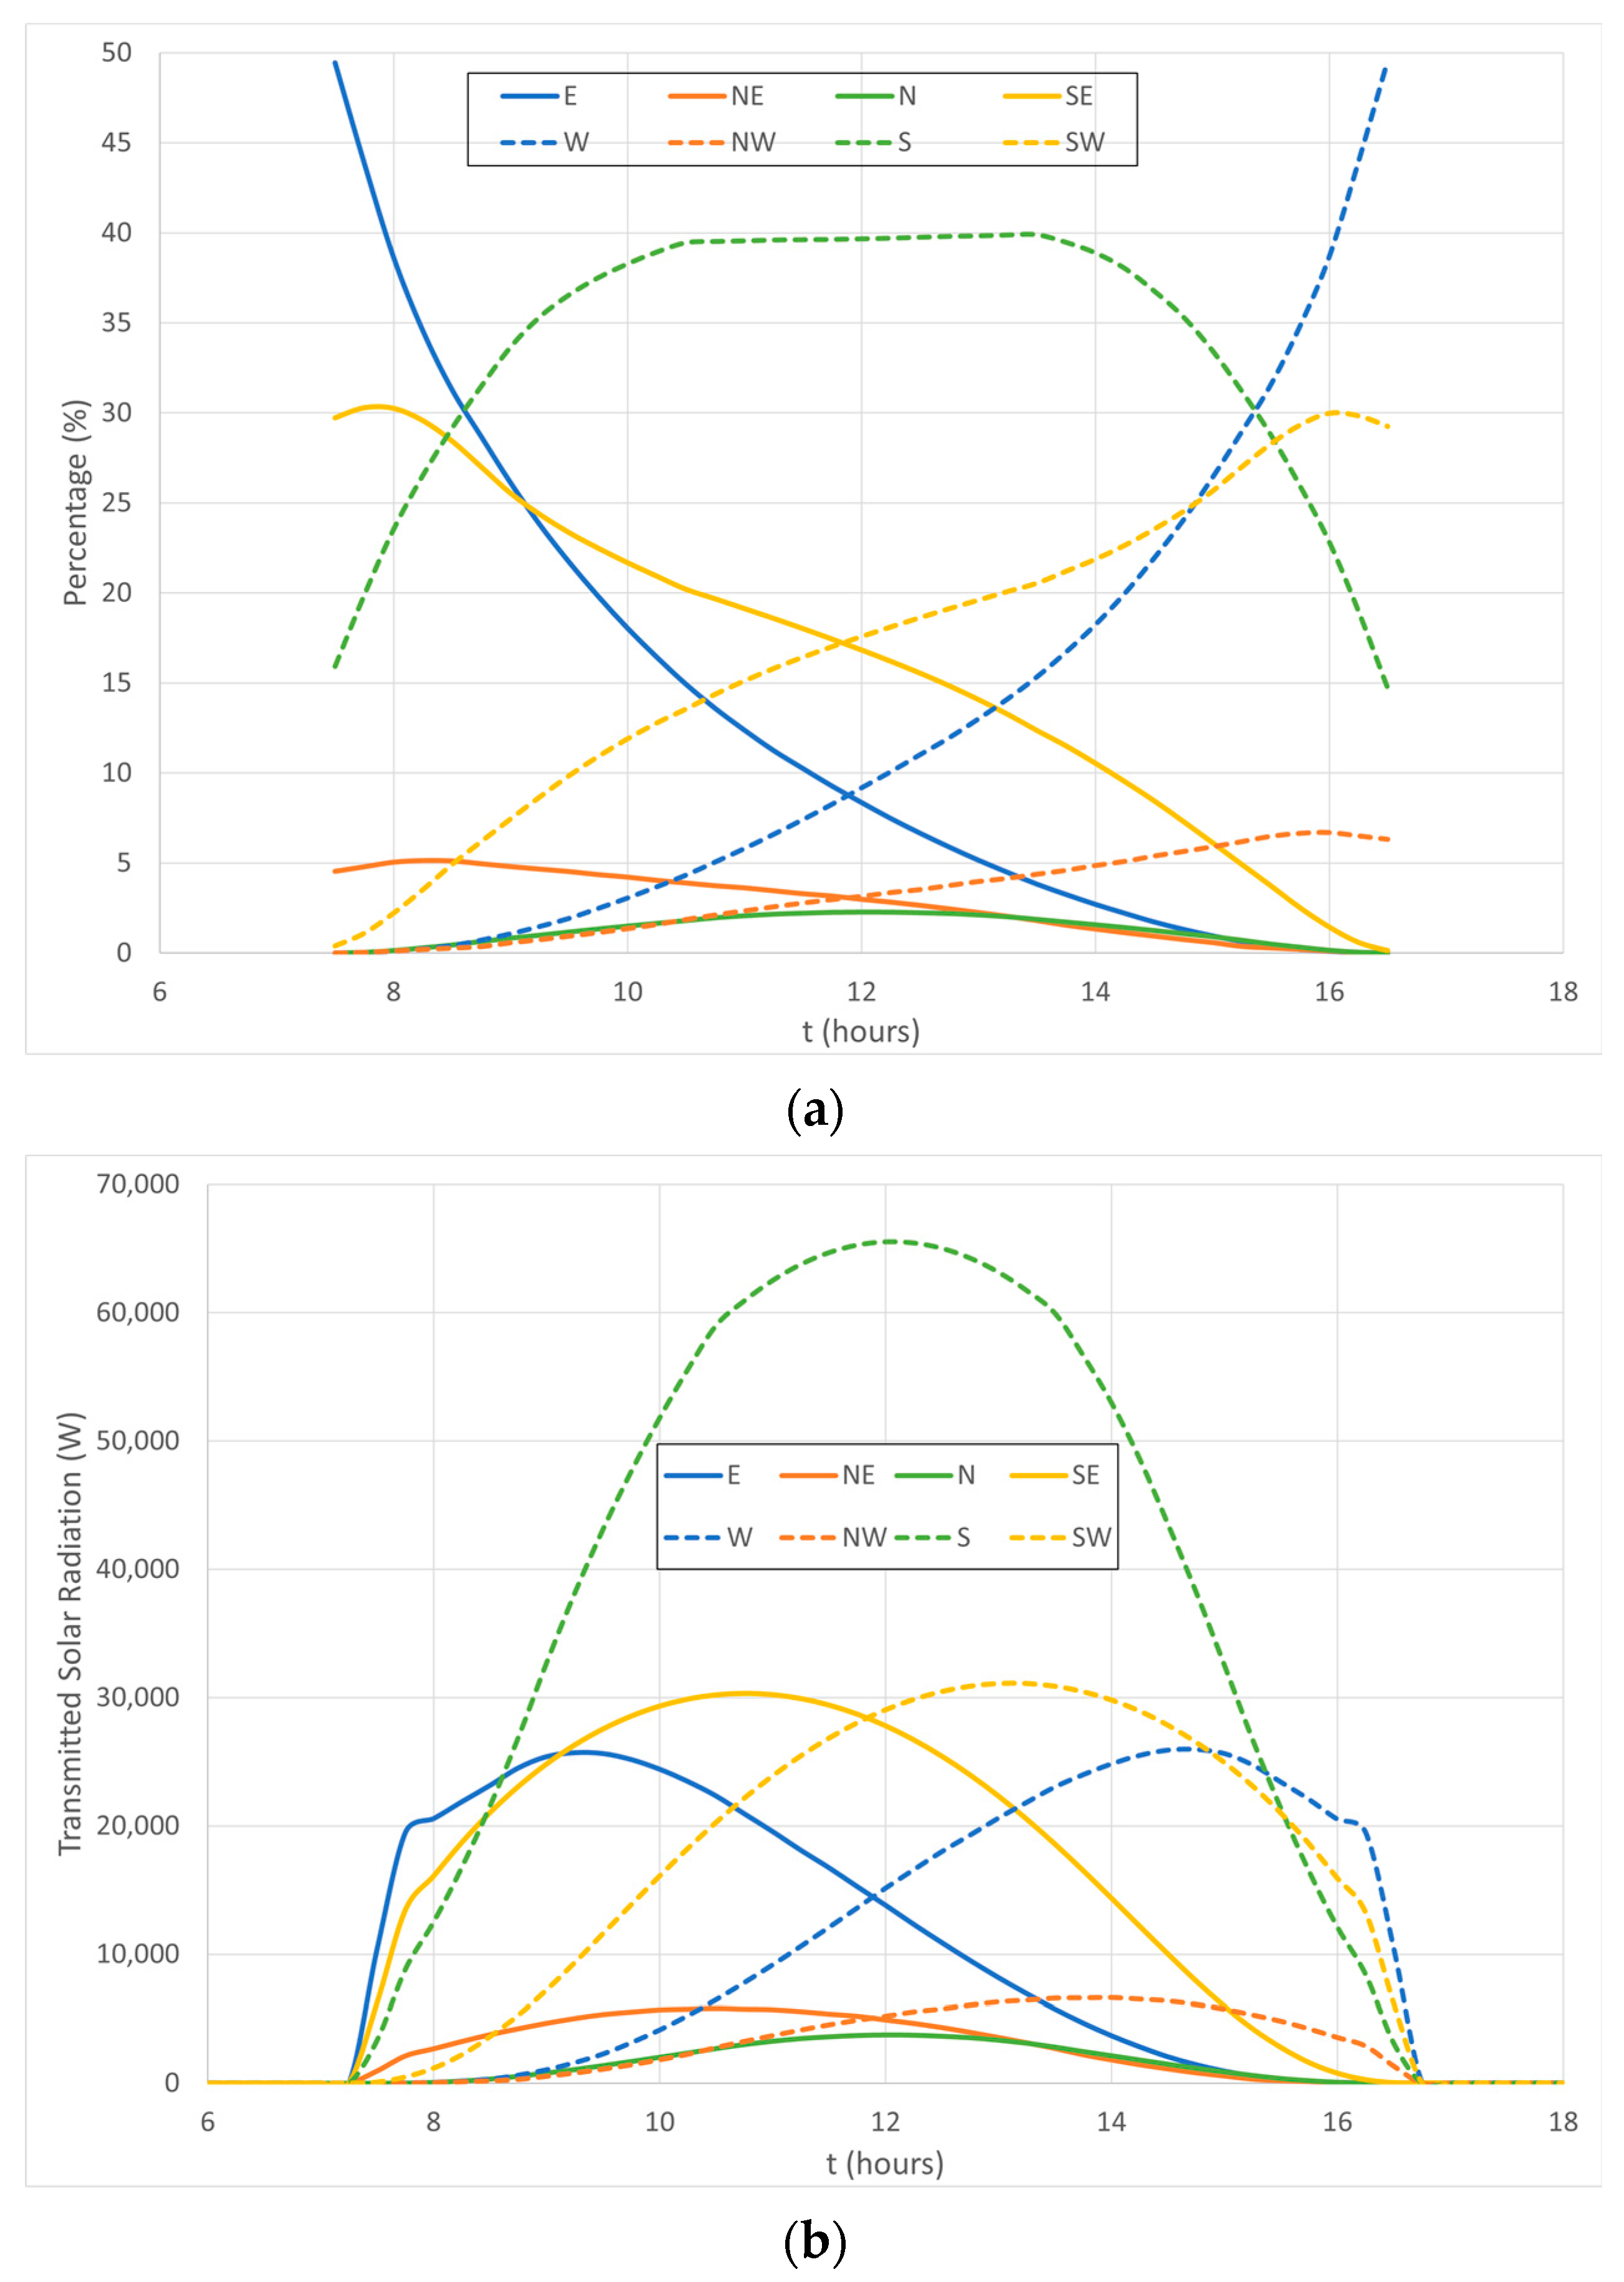
4.1.1. Solar Radiation

In this study, the application of a greenhouse to warm the air used in the north auditorium is used. For air heating with renewable energy using solar radiation, the transmitted solar radiation, mainly through transparent surfaces, represents an important contribution to the heating process.
Figure 4 shows the number of transparent surfaces considered in the central space (greenhouse and dome). In this diagram, the dome (inclined surfaces represented in gray color) considers five transparent levels and the greenhouse (vertical surfaces in red color) considers one transparent window/door level.
The diagram, which is divided into eight sections, shows the location of the auditorium area (north-east, north-west, south-east, and south-west) and the transparent area (north, south, east, and west).
In Figure 5, Figure 6, Figure 7, Figure 8, Figure 9, Figure 10, Figure 11 and Figure 12, it is possible to see the transmitted solar radiation through transparent surfaces along each section of the space under consideration throughout an entire day.
The dome surface is approximated by five inclined transparent surface levels: the first level is located near the floor, and the fifth level is located furthest from the floor level. In these figures, the following scale is used in the dome of the greenhouse:
  • Yellow is associated with the fifth level;
  • Red is associated with the fourth level;
  • Green is associated with the third level;
  • Blue is associated with the second level;
  • Purple is associated with the first level.
The pink color is associated with the vertical glasses located around the greenhouse between the auditorium’s spaces.
In accordance with the results obtained, five solar radiation levels of transmitted incident solar radiation are observed (from the highest solar radiation to the lowest solar radiation levels):
In accordance with the results obtained, the following conclusion can be presented:
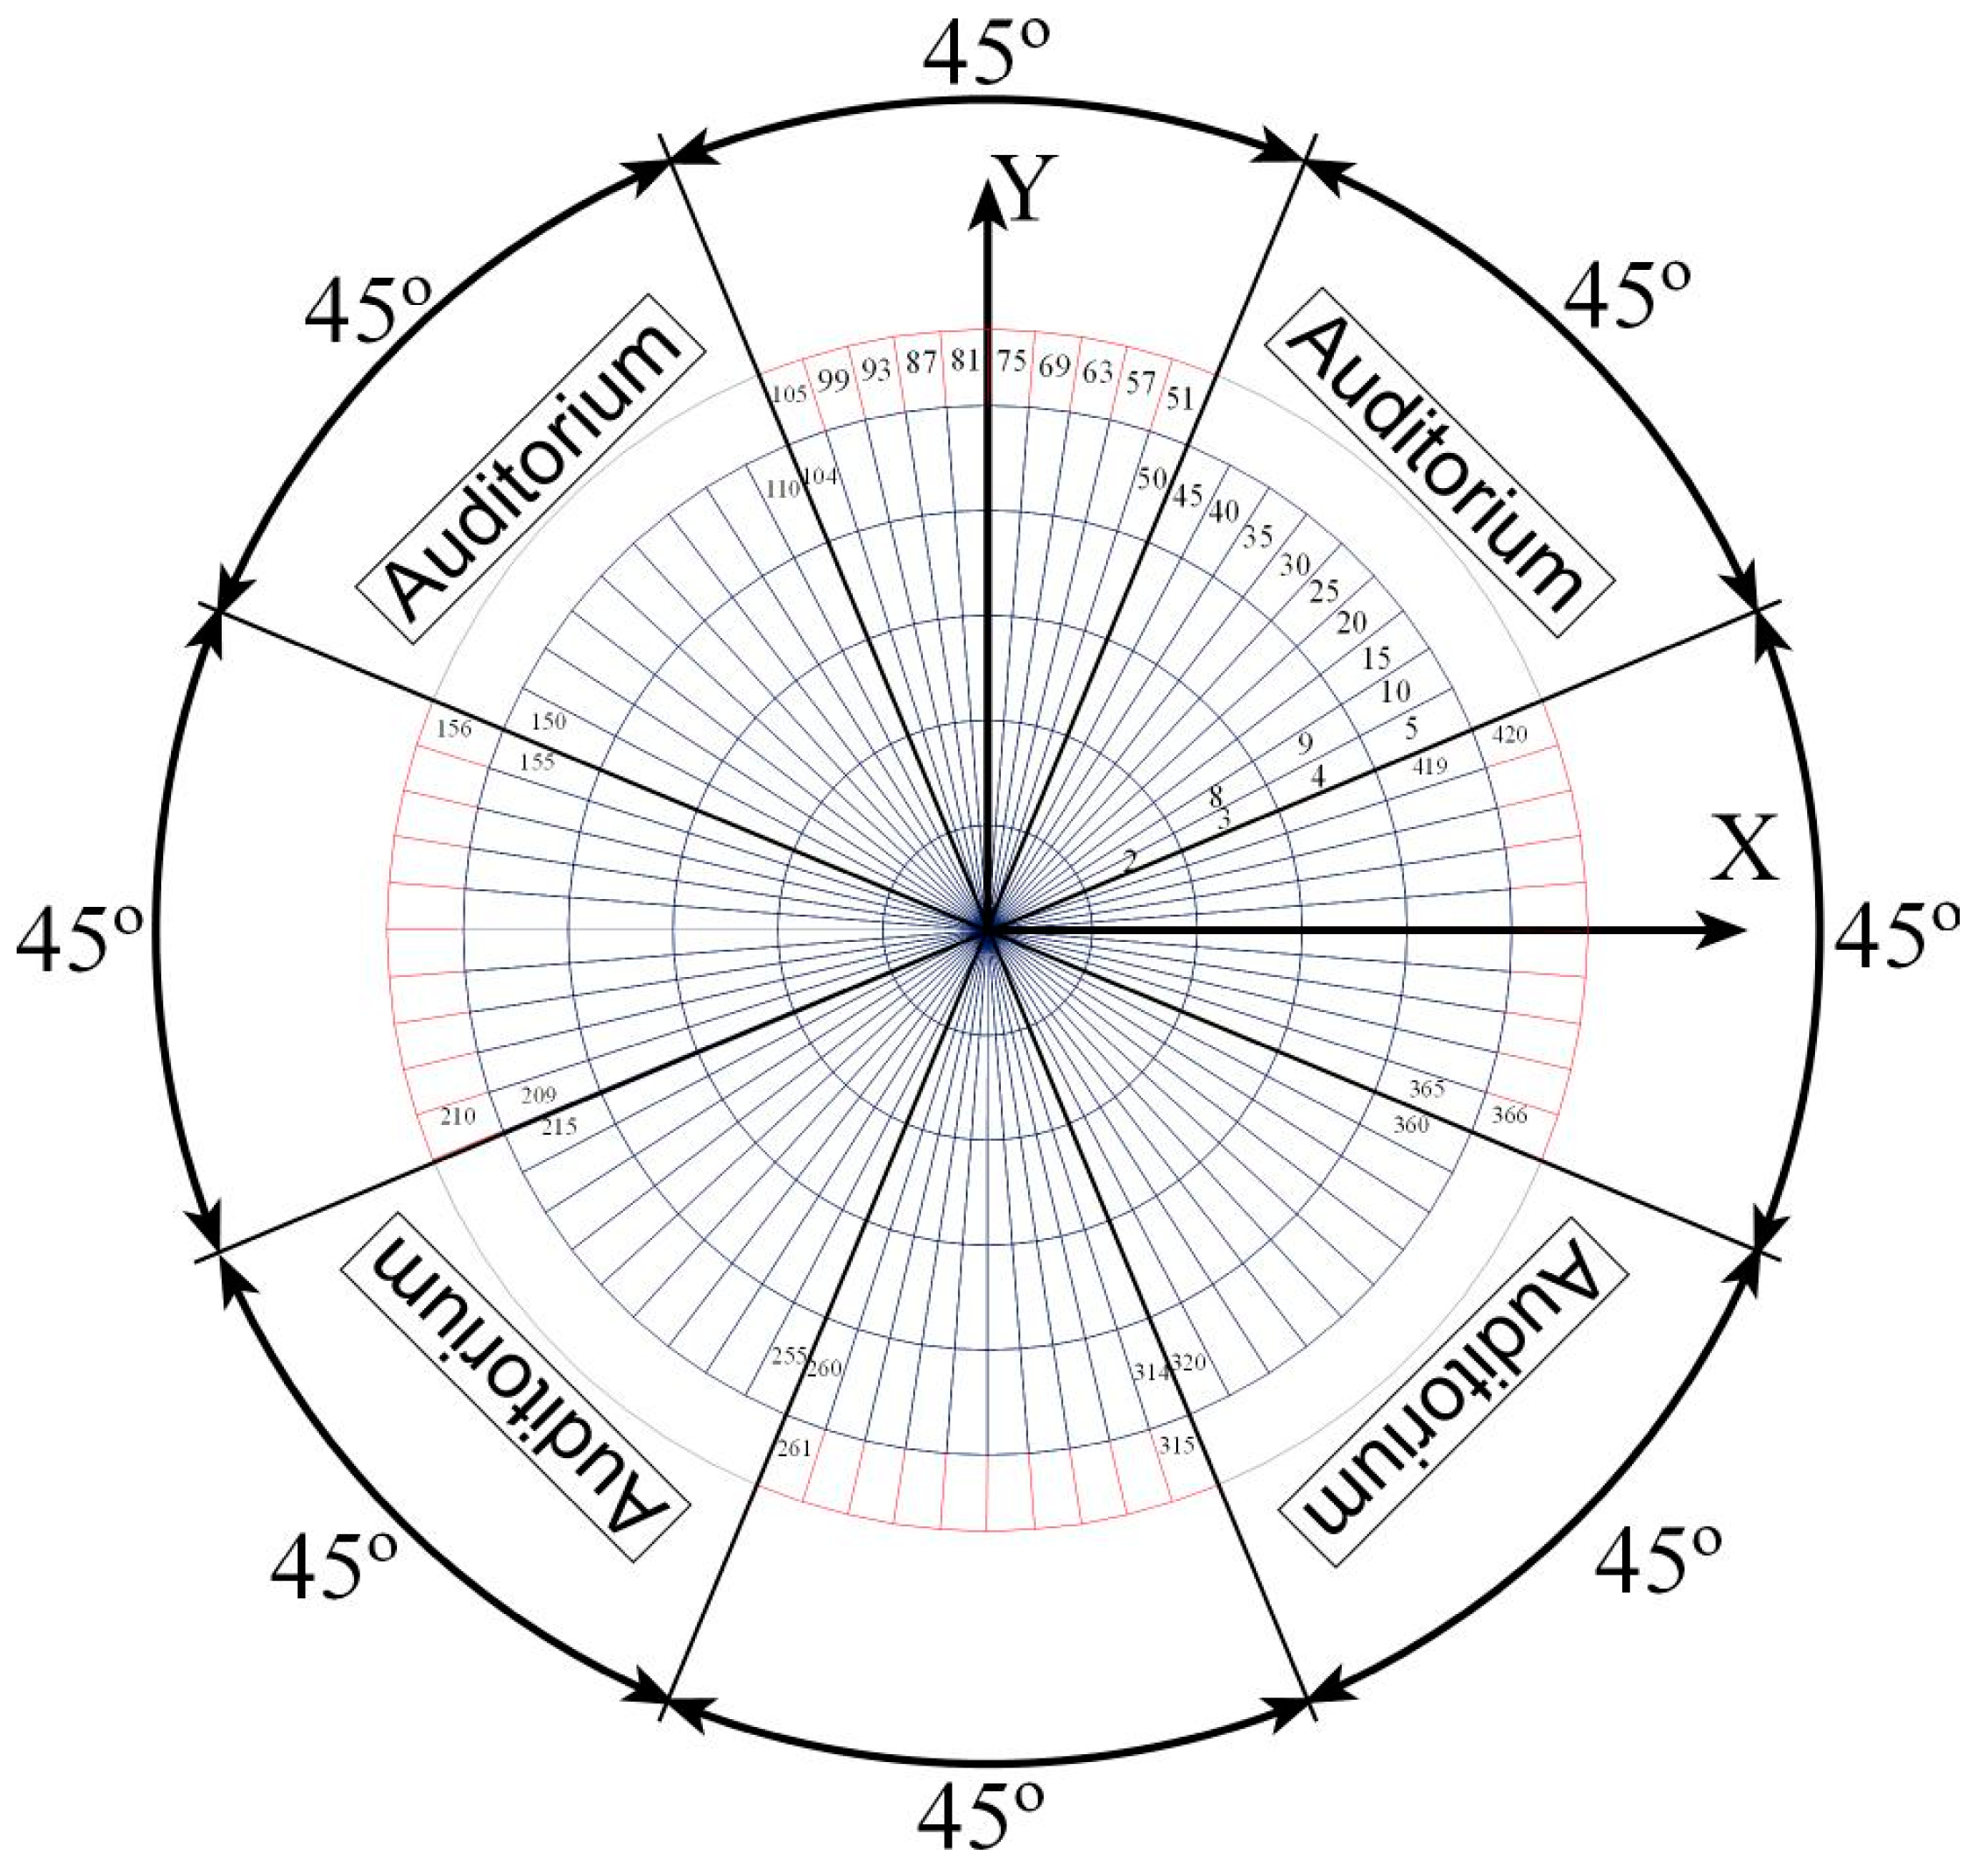
  • In the south section, from surfaces 256 to 315 (see Figure 10), six levels of transmitted incident solar radiation are presented. The vertical glasses (greenhouse) present higher solar radiation values than the inclined glasses (dome). The first level of the dome presents highest solar radiation levels than the fifth level of the dome;
  • In the south-west section, from surfaces 211 to 255 (see Figure 9), and the south-east section, from surfaces 316 to 360 (see Figure 11), five levels of transmitted incident solar radiation are presented. The first level of the dome presents the highest solar radiation values, while the fifth level of the dome presents the lowest solar radiation levels. In the south-west section, the highest solar radiation values are presented in the afternoon, while in the south-east section, the highest solar radiation values are presented in the morning;
  • In the west section, from surfaces 151 to 210 (see Figure 8), and in the east section, from surfaces 361 to 420 (see Figure 12), six levels of transmitted incident solar radiation are observed. In the west section and the east section, the first level of the dome presents the highest solar radiation values compared with the fifth solar radiation level on the dome. The west section of the vertical glass surface presents the highest solar radiation levels at the end of the afternoon. The east section of the vertical glass surface presents the highest solar radiation levels at the beginning of the morning;
  • In the north-west section, from surfaces 106 to 150 (see Figure 7), and in the north-east section, from surfaces 1 to 45 (see Figure 5), five levels of transmitted incident solar radiation are presented. In the north-west section, the first level of the dome presents the highest solar radiation values in the afternoon, mainly on surfaces that are facing the south direction. In the north-east section, the first level of the dome presents the highest solar radiation values in the morning, mainly on surfaces more located in the south direction. In the north-west section and the north-east section, the second level of the dome presents the highest solar radiation values all day;
  • Finally, in the north section, from surfaces 46 to 105 (see Figure 6), six levels of transmitted incident solar radiation are presented. The vertical glass presents null values. The second, third, and fourth levels of the dome present the highest solar radiation values, mainly at midday. However, these low values are comparable with the other directions.
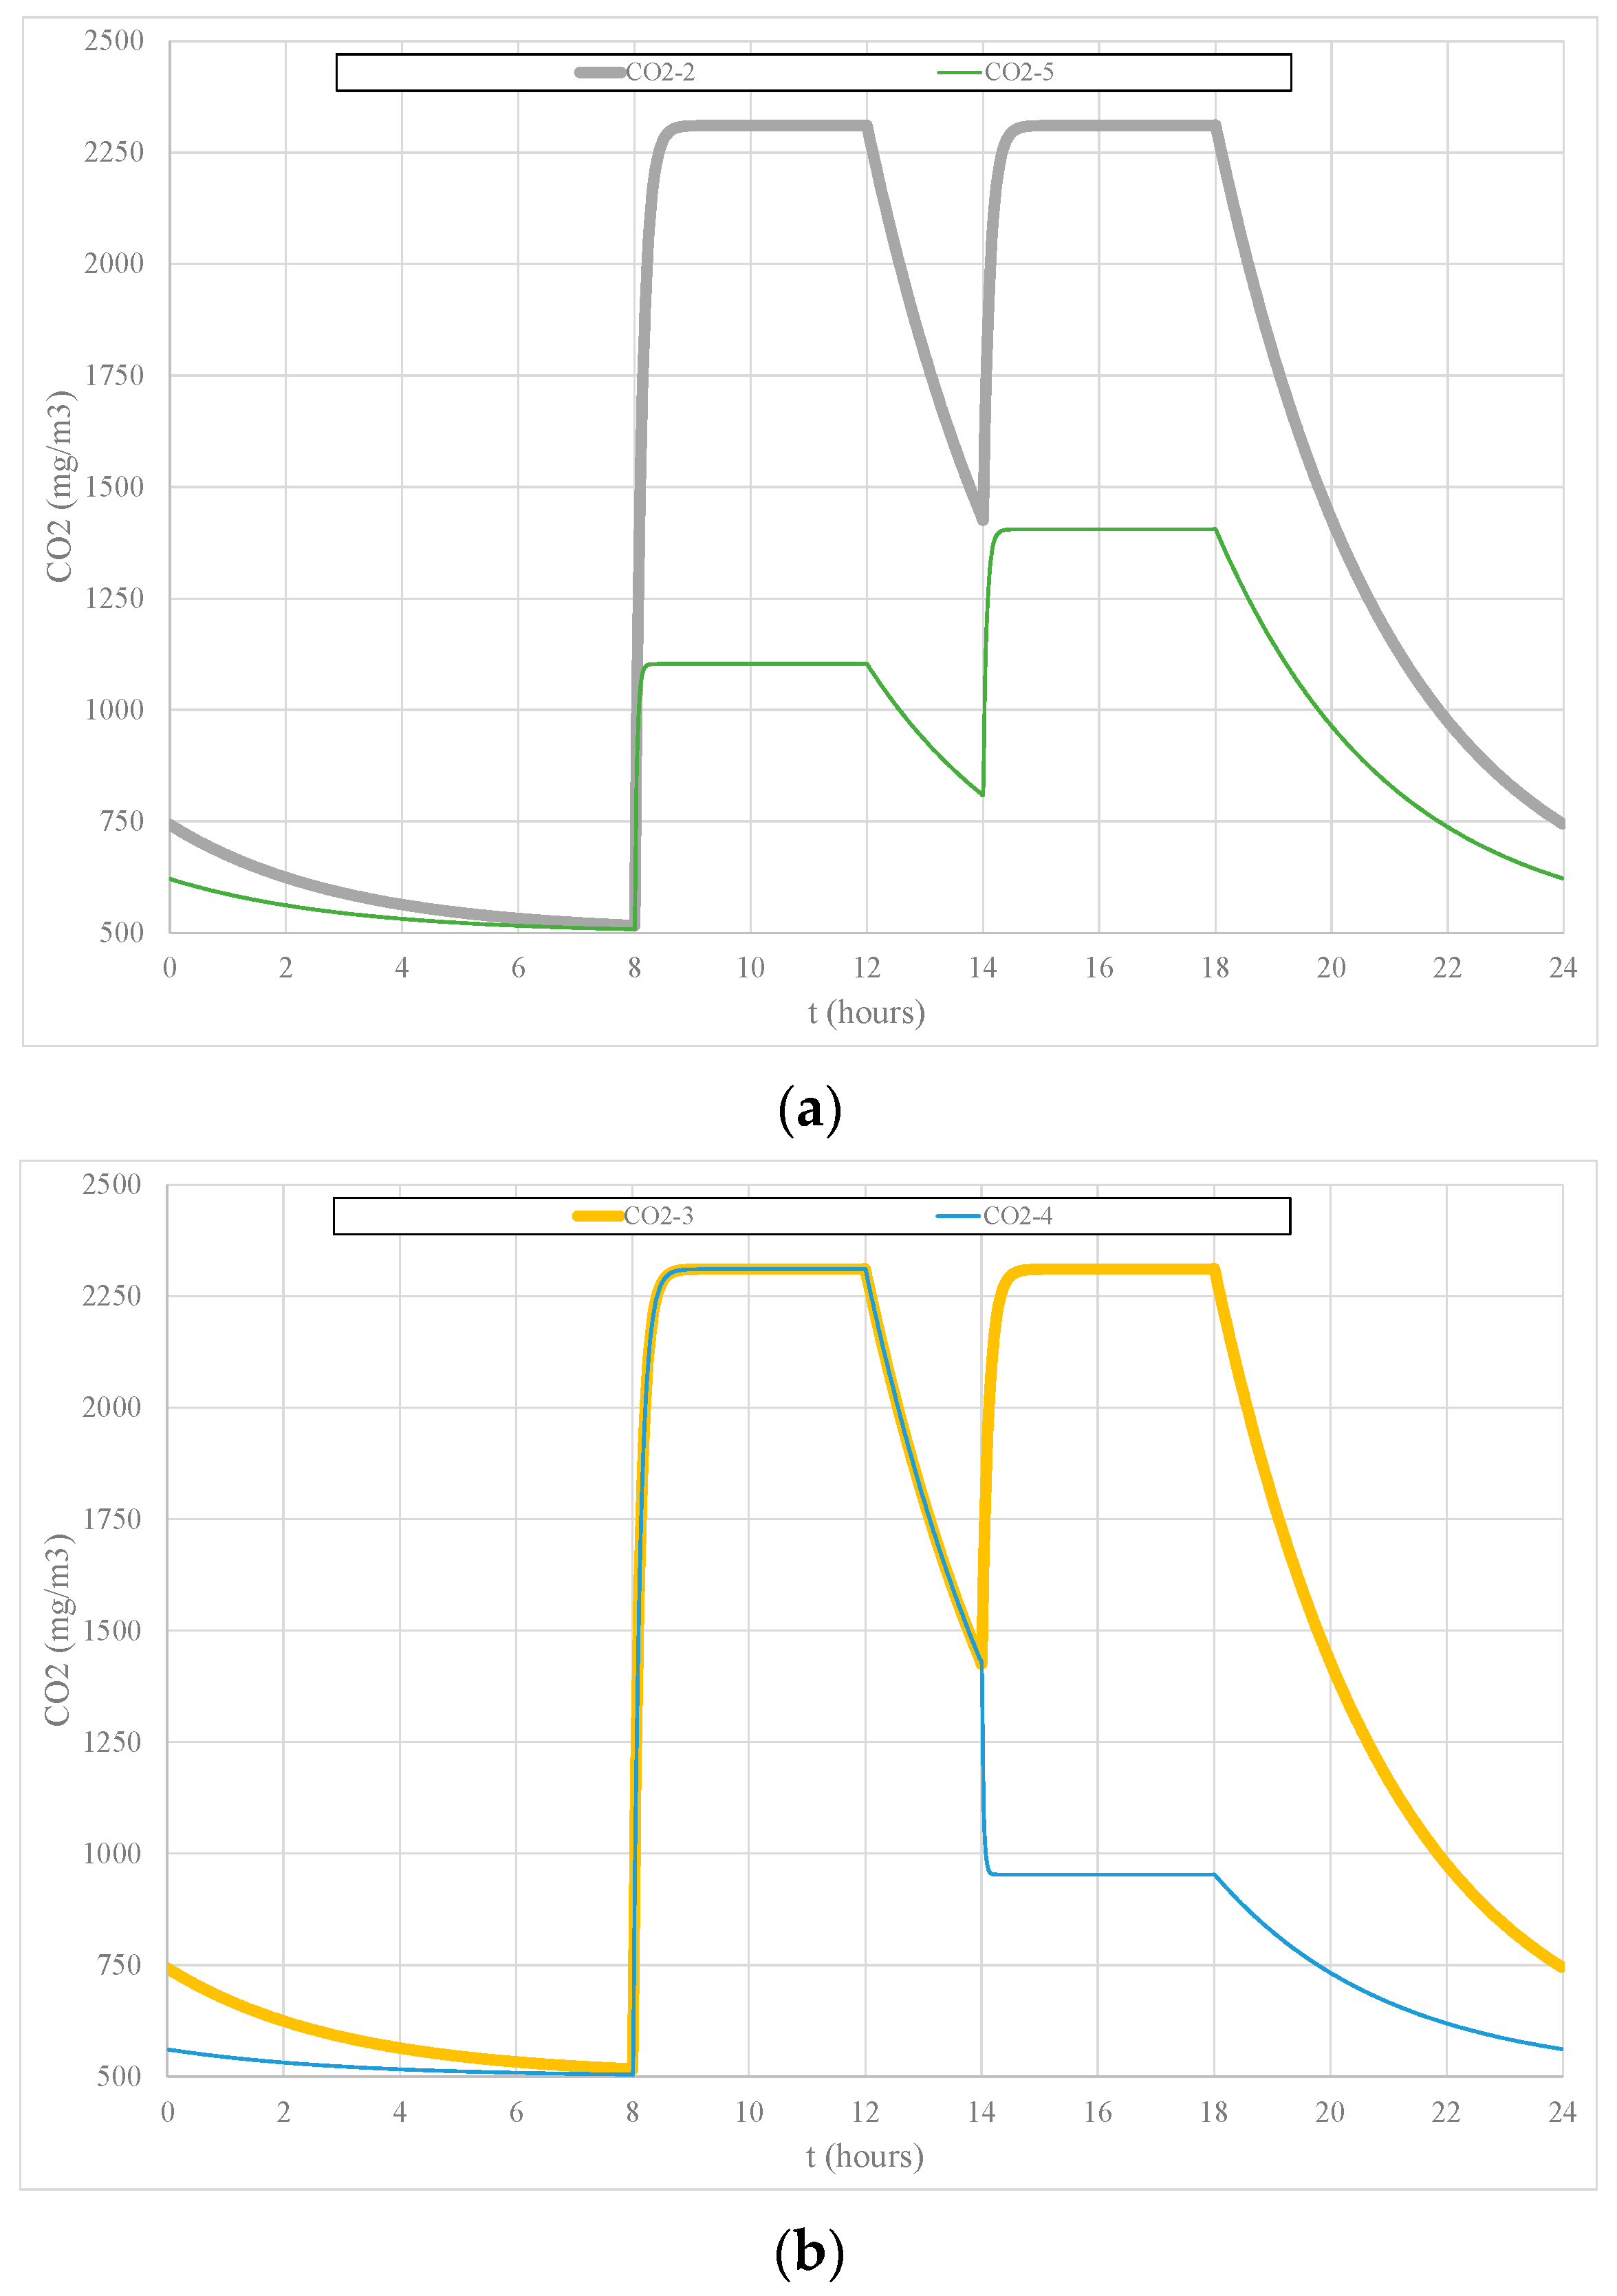
Thus, from the results obtained, the greenhouse space developed in this work with a dome ceiling transparent surface and a greenhouse vertical wall transparent surface guarantees the transmission of incident solar radiation during an entire day. The transmitted incident solar radiation is higher in the dome ceiling transparent inclined surface than in the greenhouse vertical wall transparent surfaces.

4.1.2. IAQ results

In order to evaluate the IAQ, the carbon dioxide concentration is used as an indicator of the internal IAQ. The carbon dioxide concentration evolution throughout an entire day is presented in Figure 13. Figure 13a is associated with spaces 2 and 5, while Figure 13b is associated with spaces 3 and 4.
The evolution of the carbon dioxide concentration in the morning and the afternoon in the spaces facing north-east (space 2) and north-west (space 3) is similar. The maximum concentration, when the space is occupied, is slightly higher than the ASHRAE 62 recommendations; however, it is close to the RECS recommendations. This phenomenon is associated with the lower airflow rate used in order to improve TC levels in these spaces.
The carbon dioxide concentration in the spaces facing south-west (space 4) is higher in the morning than in the afternoon. The maximum concentration, when the space is occupied, is slightly higher than the ASHRAE 62 recommendations; however, it is close to the RECS recommendations. This phenomenon is associated with the lower airflow rate during the morning, used in order to improve the TC level when the solar radiation level is lower.
The carbon dioxide concentration value in the spaces facing the south-east (space 5) is acceptable during occupancy time (lower than 1800 mg/m3), in accordance with international and national standards. The carbon dioxide concentration value is slightly lower in the morning than in the afternoon.

4.1.3. Air Temperature

Figure 14 presents the air temperature throughout the entire day.
The central space (space 6), which represents the greenhouse, shows more fluctuations in air temperature than the other spaces. This space, which is mainly built with glass surfaces, is strongly influenced by the external air temperature, the external air velocity, and the external solar radiation. The first two mentioned variables are due to a decrease in the internal air temperature in winter, while the latter variable contributes to an increase in the internal air temperature. However, due to the ventilation process, this space is also subjected to the external airflow rate (free cooling phenomena). The ventilation is used to transport the air from the external environment to the greenhouse (which contributes to reducing the greenhouse’s internal air temperature) and from the greenhouse to the spaces facing north-east (space 2) and north-west (space 3) (which contributes to an increase in the auditorium’s internal air temperature). Thus, when the space is not subjected to higher solar radiation levels (without a heated phenomenon), the ventilation process and the low thermal insulation of glazed surfaces lead to a decrease in the internal air temperature of this space. On the other hand, when the space is subjected to higher solar radiation levels, the opposite behavior is observed.
The spaces facing north-east (space 2) and north-west (space 3) present similar values with a slight temperature increase during the morning and the afternoon. This phenomenon is associated not only with the heat released by the occupants but also the heat transported from the central space (greenhouse and space 6) to these spaces due to the ventilation process. These spaces present small air temperature variation compared to the other spaces. In the morning, the space facing north-east (space 2) presents a slightly higher air temperature than the space facing north-west (space 3). This phenomenon is associated with the incident solar radiation at the window of the space facing north-east (space 2) in the morning.
The spaces facing south-east (space 5) and south-west (space 4) show higher internal air temperature variations than the previous spaces because they are subjected to direct solar radiation: the first in the morning and the second in the afternoon. The spaces facing south-east (space 5) show higher internal air temperatures in the morning than the spaces facing south-west (space 4), while the spaces facing south-west (space 4) show higher internal air temperatures in the afternoon than the spaces facing south-east (space 5). However, in both spaces, the internal air temperature is higher in the afternoon than in the morning. This phenomenon is associated with increased heating during the day, due to the presence of occupants and the solar radiation, mainly during lunchtime.

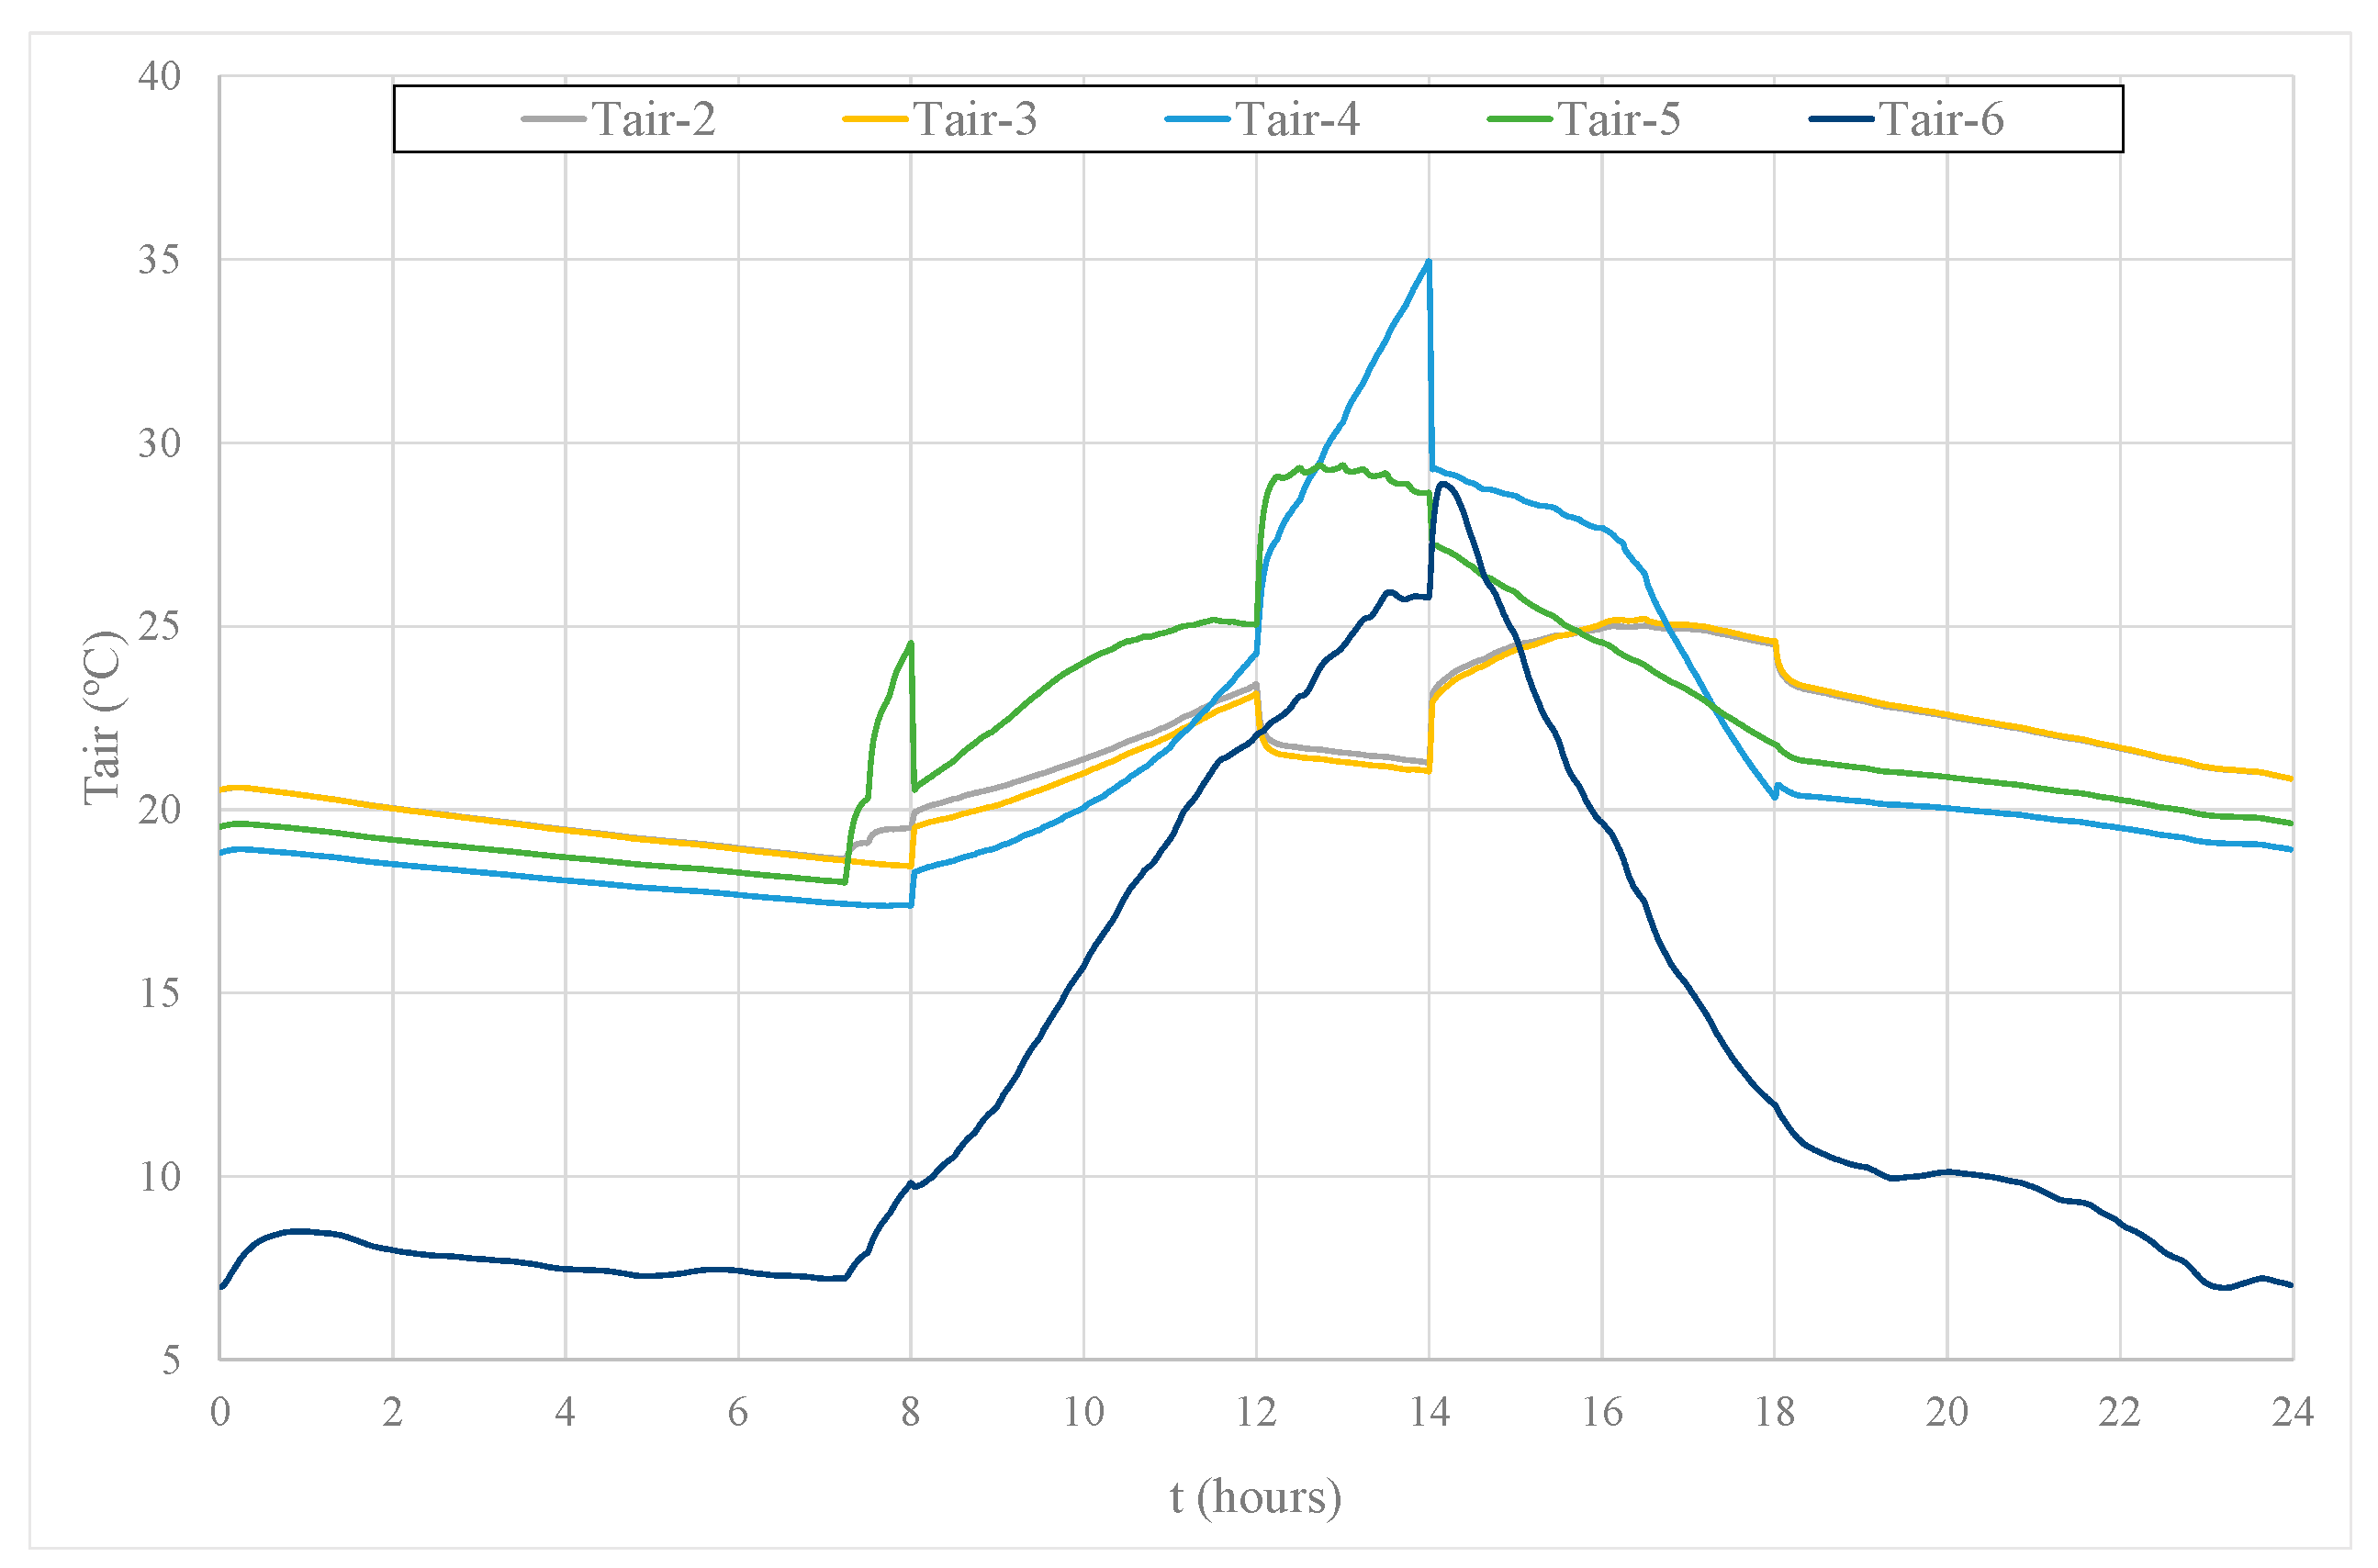
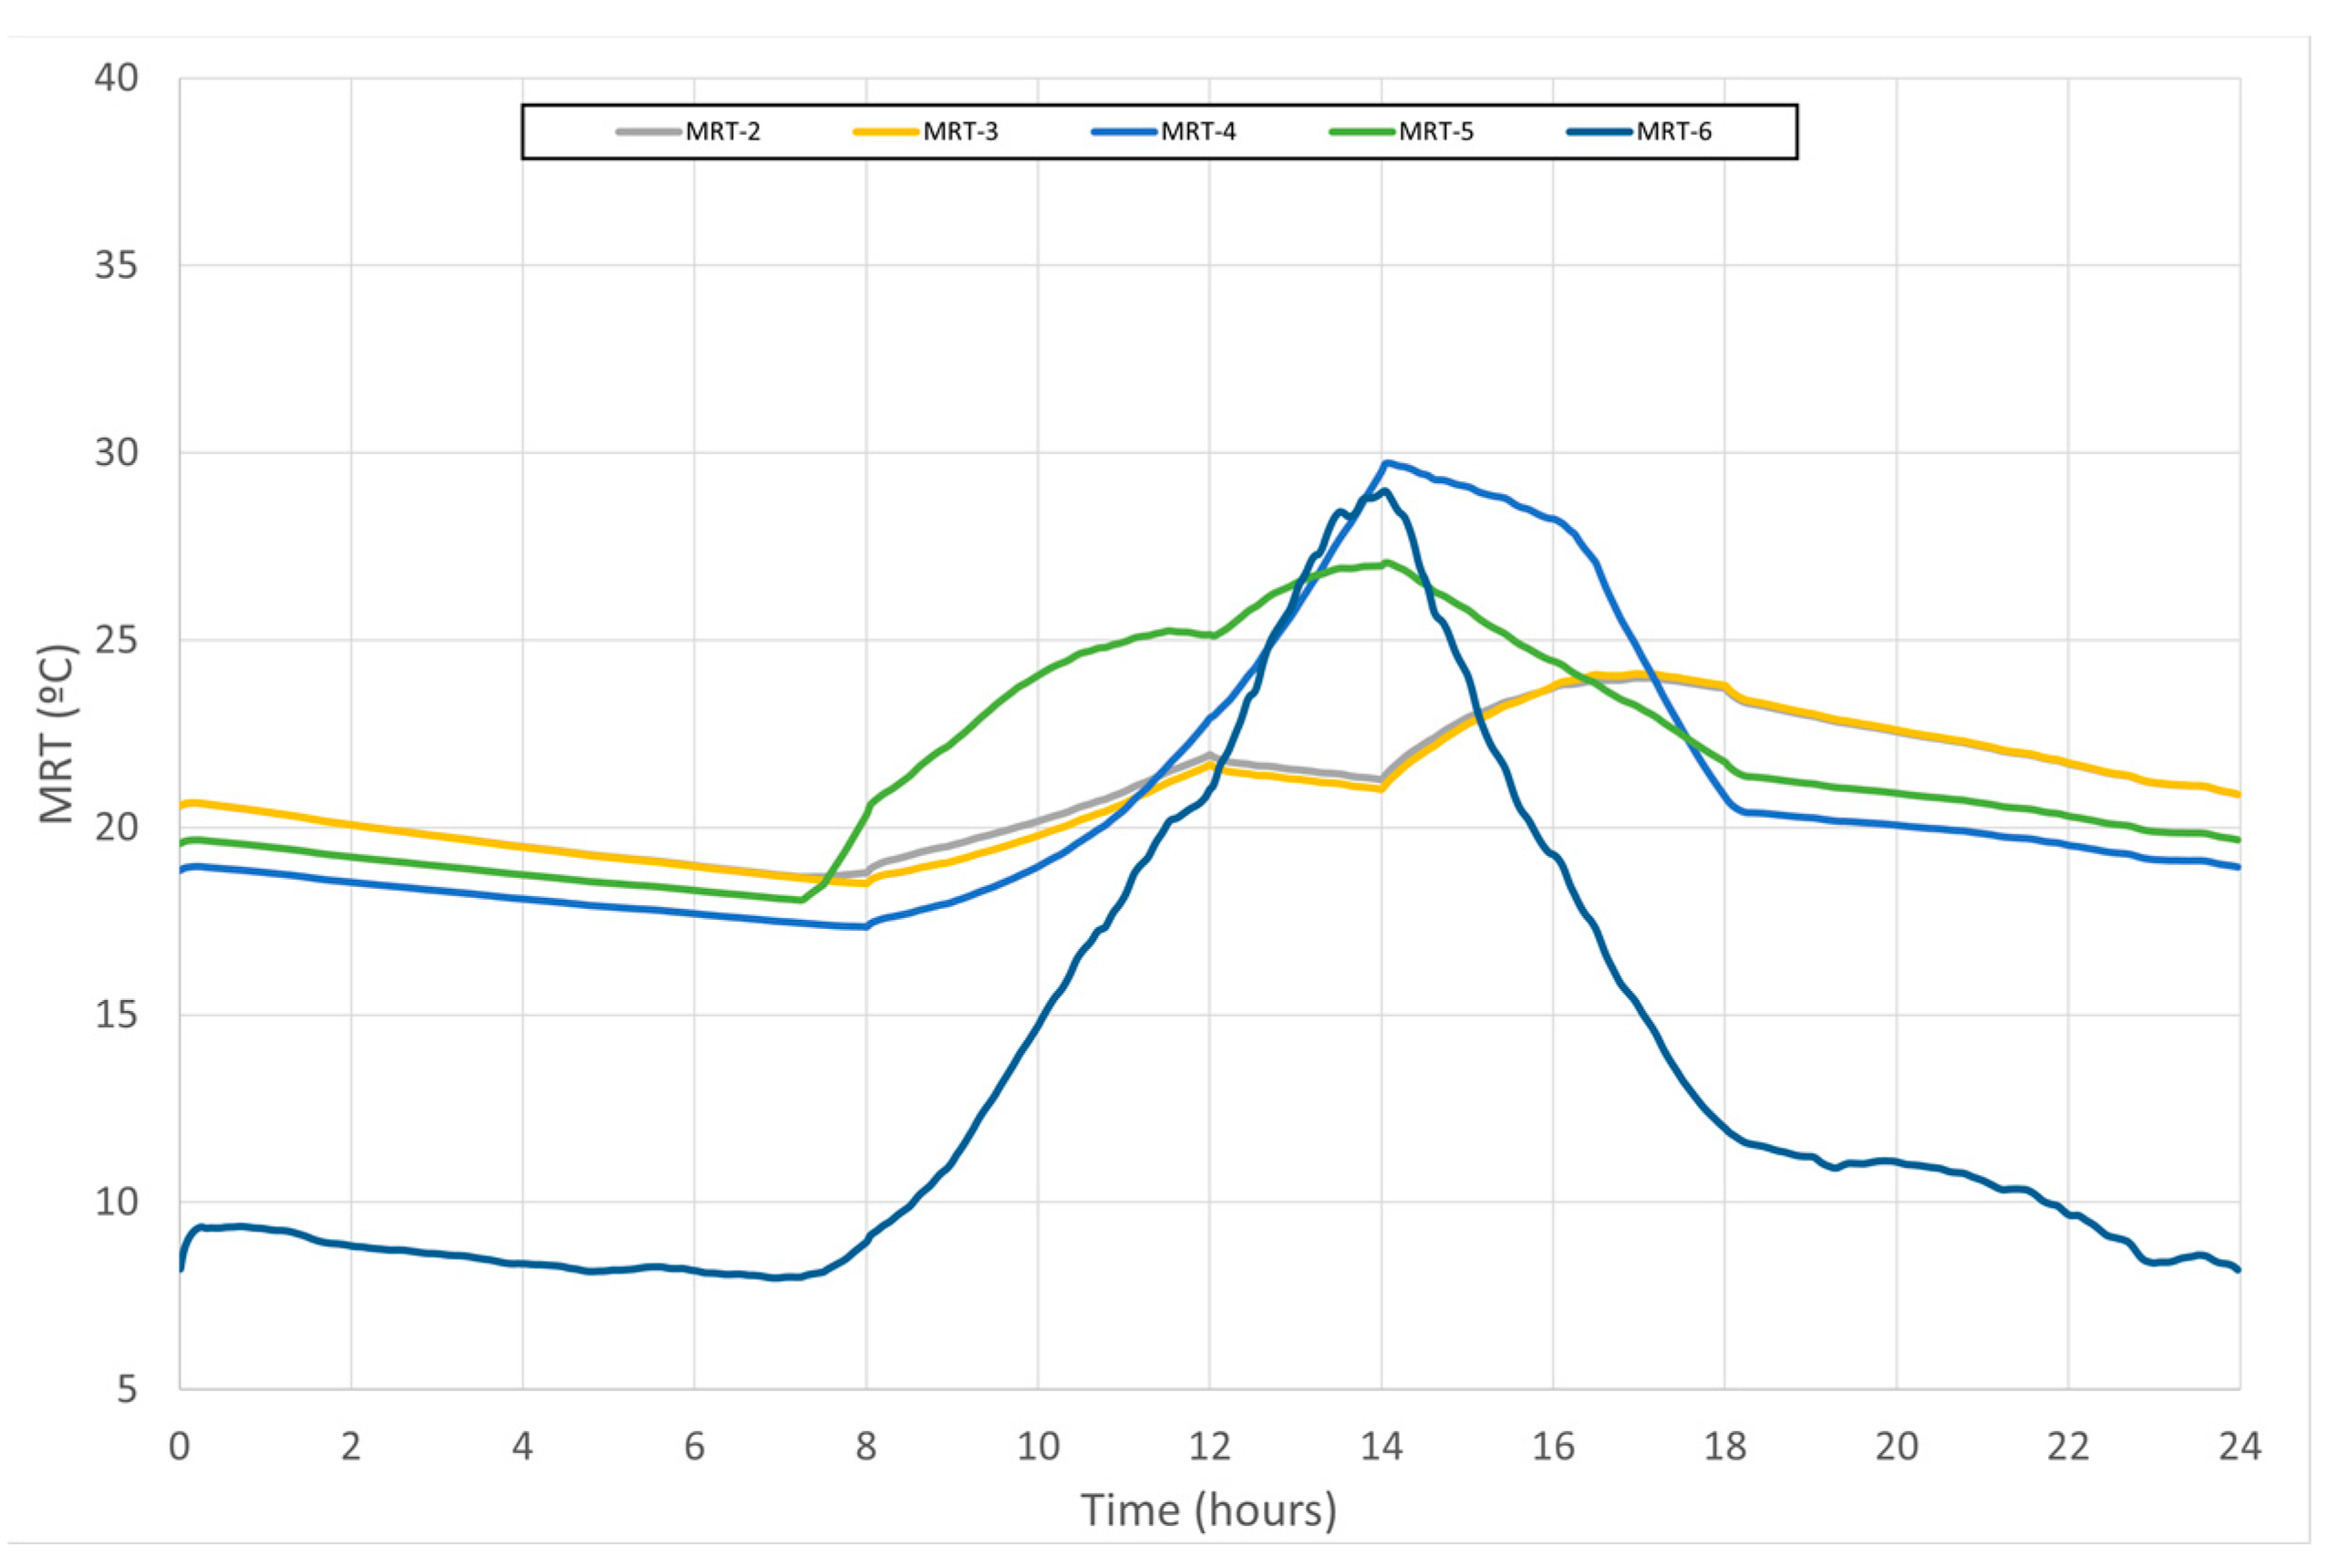
4.1.4. MRT of the Surfaces and Air Temperature of the Spaces

The MRT throughout an entire day is presented in Figure 15.
The MRT presents, in general, a similar evolution to the internal air temperature. However, slight differences are given below:
  • In the central space, representing the greenhouse (space 6), the internal air temperature in the morning shows a slightly higher value than the MRT. This phenomenon is associated with the temperature of the surrounding surfaces being slightly lower than the internal air temperature. In the afternoon, the two temperatures have similar values;
  • The internal air temperatures in the spaces facing north-east (space 2) and north-west (space 3) present slightly higher values than the MRT in the morning and afternoon. This phenomenon is also associated with the temperature of the surrounding surfaces being slightly lower than the internal air temperature;
  • The internal air temperature in spaces facing south-east (space 5) presents the same value as the MRT. This phenomenon is associated with the fact that this space is subjected to solar radiation, mainly during the morning;
  • The internal air temperature in a space facing south-west (space 4) in the morning was slightly higher than the MRT, while the internal air temperature evolution in a space facing south-west (space 4) in the afternoon was slightly lower than the MRT. This phenomenon is associated with the fact that this space is not subjected to solar radiation in the morning but rather in the afternoon.
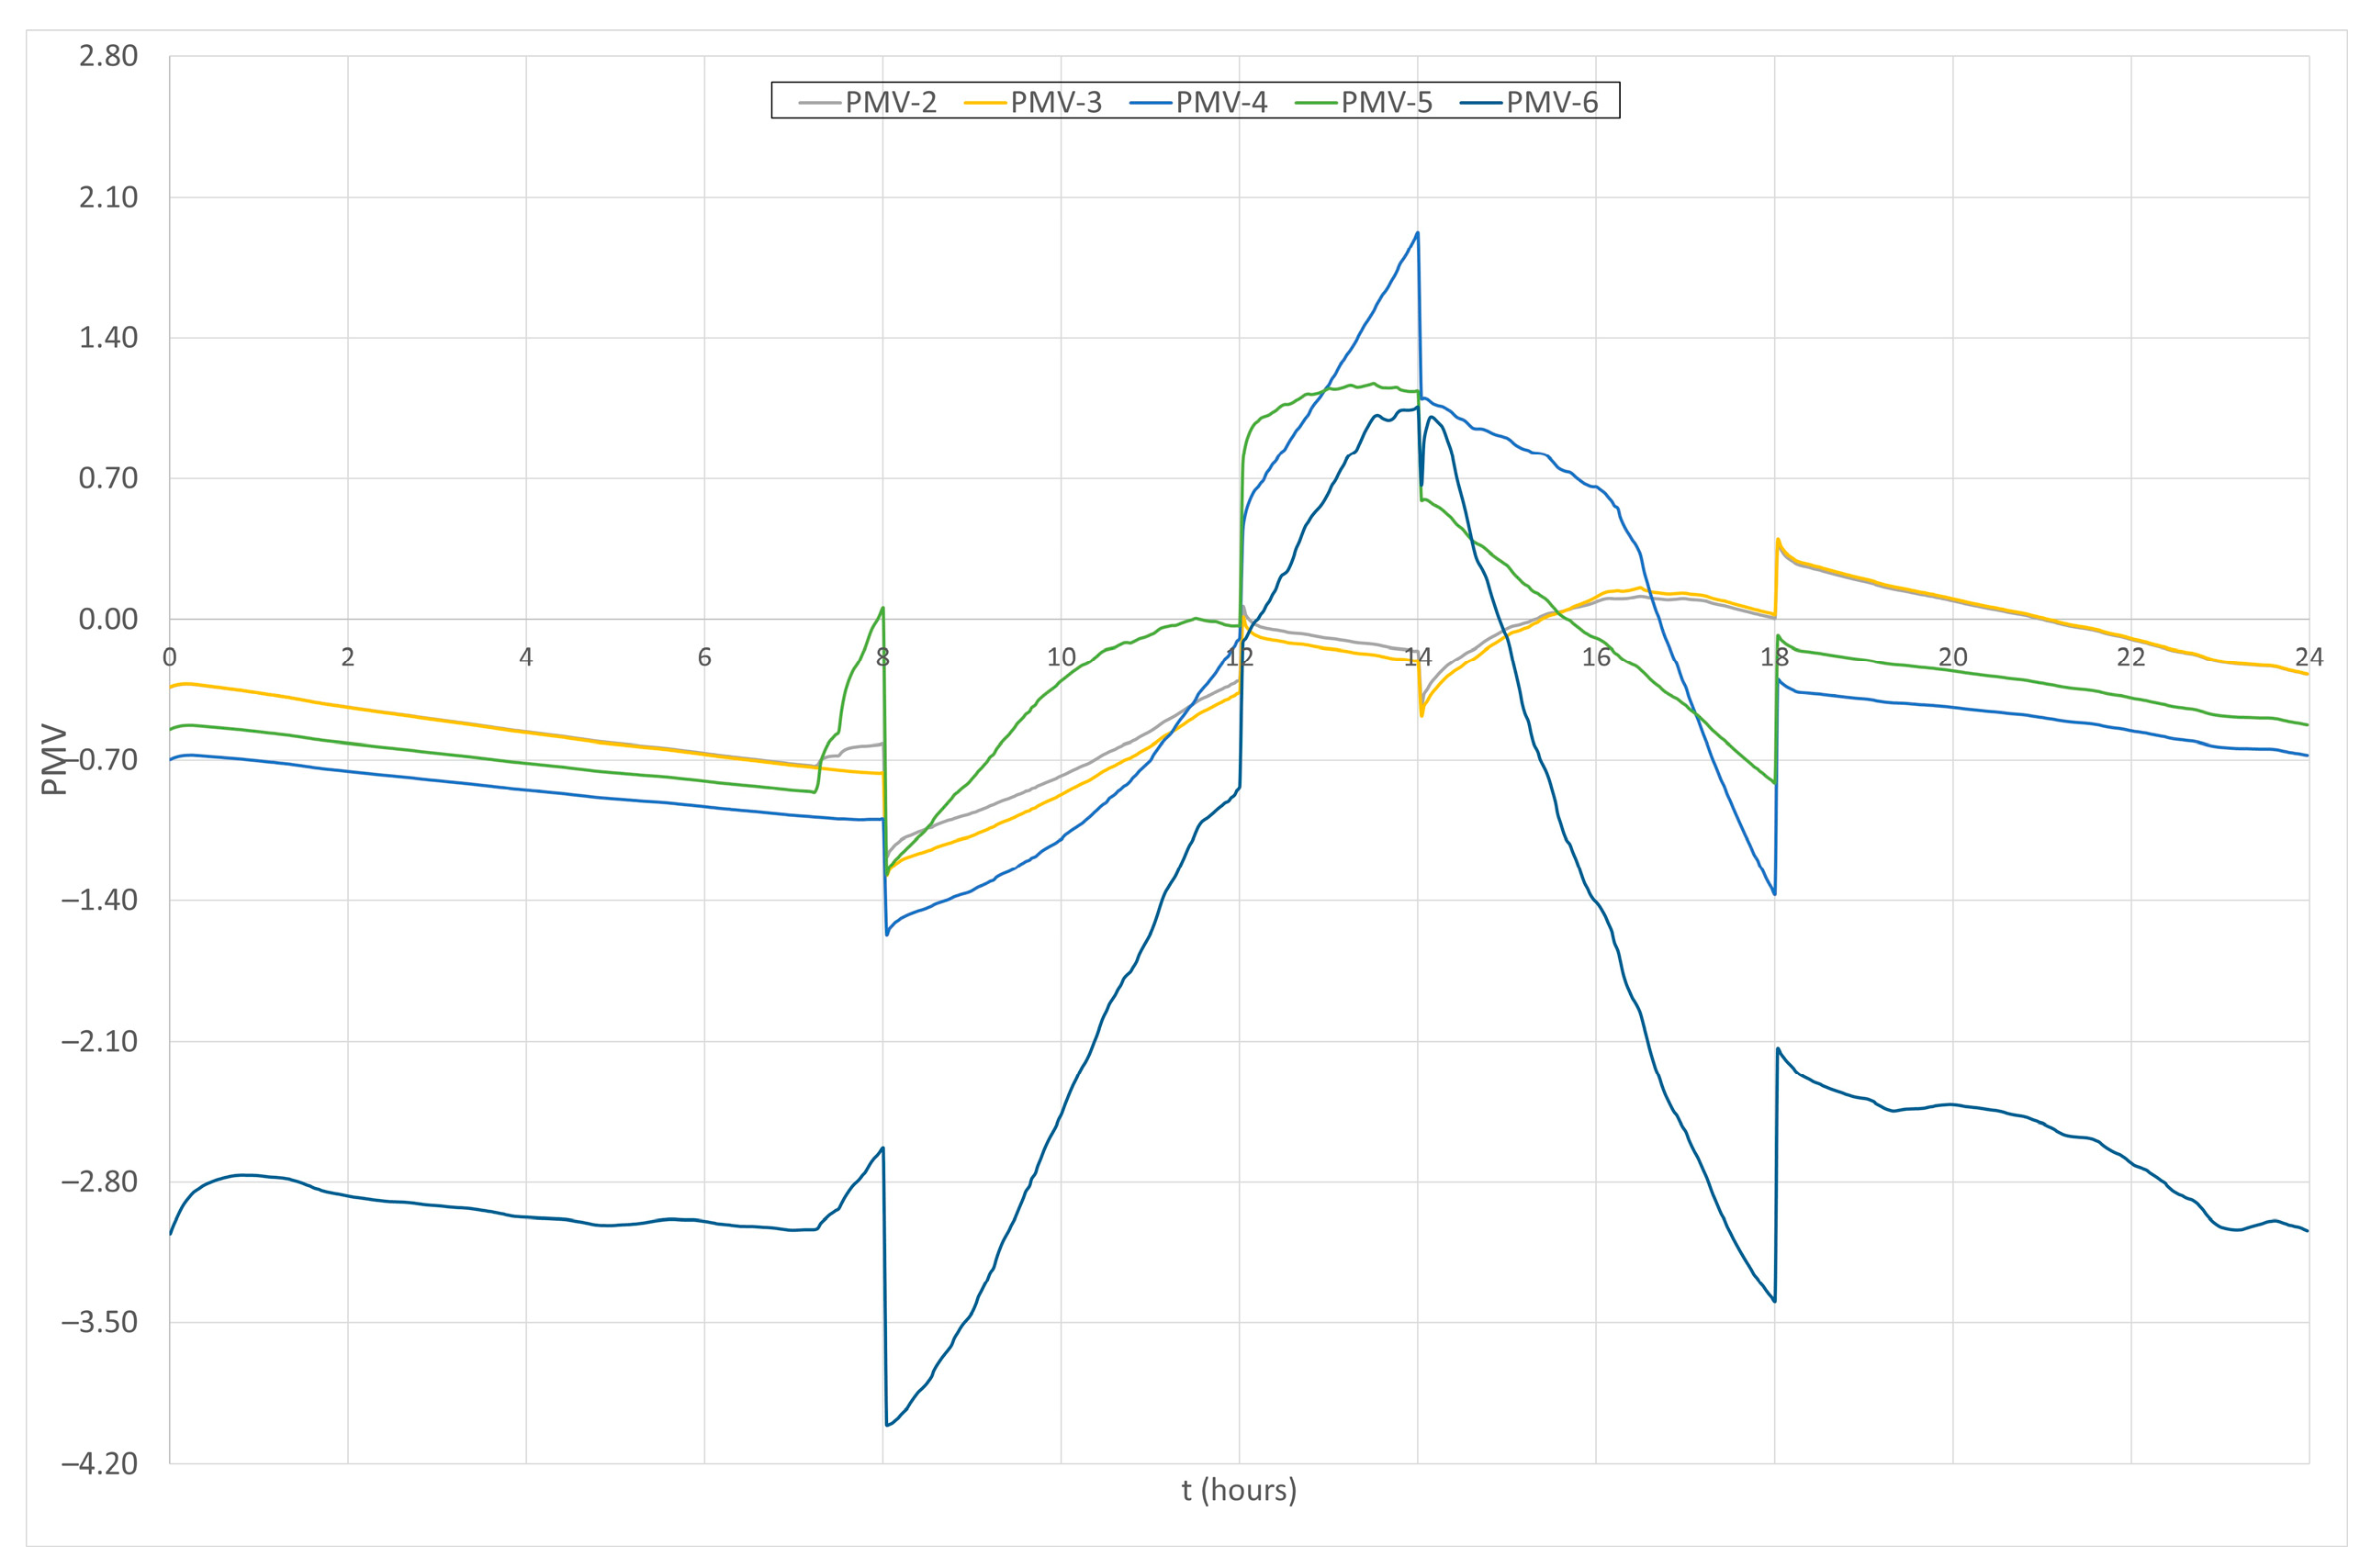
4.1.5. PMV

The PMV, throughout an entire day, is presented in Figure 16.
The central space (space 6), representing the greenhouse, has an unacceptable temperature level with negative PMV values during occupancy. In the morning, the TC level increases, and during the afternoon, it decreases. Acceptable TC levels (with PMV values higher than −0.7 and lower than 0.7) are found during lunchtime and at the beginning of the afternoon. At the end of the morning and the beginning of the afternoon, the PMV values are negative, and at the end of the afternoon, the PMV values are positive.
The spaces facing north-east (space 2) and north-west (space 3), which are subjected to warmer airflow from the central greenhouse, present similar patterns in the early hours of the morning. The spaces are slightly thermally uncomfortable, due to the negative PMV values (PMV lower than −0.7); however, at the end of the morning and in the afternoon, these spaces are thermally comfortable (PMV higher than −0.7 and lower than 0.7). This phenomenon, which is associated with uncomfortable TC levels, is due to the low solar radiation levels in the morning.
The space facing south-west (space 4) presented the following:
  • A slightly uncomfortable thermal comfort level (PMV values lower than −0.7) due to negative PMV values at the beginning of the morning;
  • A comfortable thermal level due to the slightly negative PMV values (PMV values higher than −0.7) at the end of the morning;
  • A slightly uncomfortable thermal level due to positive PMV values (PMV values lower than 0.7) at the beginning of the afternoon;
  • A comfortable thermal level due to the positive PMV values (PMV values lower than 0.7) at the end of the afternoon.
This phenomenon is associated with the fact that space 4 is only subjected to solar radiation in the afternoon.
The space facing south-east (space 5) presents the following:
  • A slightly uncomfortable thermal level with negative PMV values (PMV values lower than −0.7) at the beginning of the morning;
  • A comfortable thermal level with negative PMV values (PMV values higher than −0.7) at the end of the morning;
  • A slightly uncomfortable thermal level in the afternoon with positive PMV values at the beginning of the afternoon (PMV values higher than 0.7) and negative PMV values at the end of the afternoon (PMV values lower than −0.7).
This phenomenon is associated with the fact that this space is only subjected to solar radiation in the morning.
It is evident that the ventilation airflow rate and other variables such as the occupancy level, the transmitted incident solar radiation, and the external and internal greenhouse air temperatures influence the TC level.
In this study, the central space, which represents a greenhouse, and the ventilation strategies used provide acceptable TC levels in occupied spaces, mainly at the end of the morning and the beginning of the afternoon. At the beginning of the morning and the end of the afternoon, in some occupied spaces and due to the low transmitted incident solar radiation, the TC level is near the acceptable value.

4.1.6. Influence of the Solar Radiation on the TC Levels

The TC level that the occupants are subjected to in the several spaces is influenced by the solar radiation and occupancy level.
In this section, Figure 17 shows the total transmitted solar radiation. The percentage of transmitted solar radiation in the different sections as a function of the time in the greenhouse is presented in Figure 17a. Figure 17b shows the total transmitted solar radiation in the different sections as a function of time in the greenhouse.
The heat promoted by the occupants in each auditorium is observed between 8 and 12 h in the morning and between 14 and 18 h in the afternoon. However, due to the external environmental conditions, the heat released by the occupants is not sufficient to promote TC conditions.
Thus, in this case, the solar radiation level is an important contribution to the heating of the auditoriums. The auditoriums facing south-west (space 4) and south-east (space 5) are subjected to direct solar radiation; however, the auditoriums facing north-east (space 2) and north-west (space 3) are not subjected to direct solar radiation. Thus, the last auditoriums are subjected to warmer airflow from the central greenhouse:
  • The east section: This section presents an important contribution, mainly at the beginning of the morning in the heating process, and a consecutively and relatively high contribution to the TC level;
  • The north-east section, north section, and north-west section: These sections present low contributions in the heating process and consecutively low contributions in the TC level;
  • The west section: This section presents an important contribution, mainly at the end of the afternoon in the heating process, and a consecutively and relatively high contribution to the TC level;
  • The south-west section: This section presents an important contribution, mainly in the afternoon to the heating process, and a consecutively and relatively high contribution to the TC level;
  • The south section: This section presents the most important contribution to the heating process and a consecutively high contribution to the TC level during the whole day, but mainly at the end of the morning and beginning of the afternoon;
  • The south-east section: This section presents an important contribution, mainly in the morning, to the heating process, and a consecutively and relatively high contribution to the TC level.
Considering the auditoriums facing south-west (space 4) and south-east (space 5), the following considerations are observed:
  • The south-west section auditorium (space 4): The windows located in this space are subjected, in general, to transmitted solar radiation all day. However, in the afternoon, they present the highest contribution to the heating process and consequently to an uncomfortable TC level due to positive PMV values higher than 0.7;
  • The south-east section auditorium (space 5): The windows located in this space are subjected, in general, to transmitted solar radiation all day. However, in the morning, they present the highest contribution to the heating process and consequently to a comfortable TC level due to negative PMV values higher than −0.7.

4.1.7. Influence of the Airflow Rate on the TC and IAQ

The ventilation airflow rate during occupancy is able to control the maximum carbon dioxide concentration value. The volume of the space is an important factor when people enter and leave or when the ventilation system is connected and disconnected, influencing the carbon dioxide concertation evolution.
The maximum carbon dioxide concentration depends on the airflow rate and the occupation level. However, the airflow rate influences not only the IAQ but also the TC level. Thus, the results obtained regarding the carbon dioxide concentration development throughout an entire day present, simultaneously, acceptable levels of the IAQ and TC levels.
The increase in the airflow rate decreases the carbon dioxide concentration; however, it also decreases the energy transported to the spaces facing north and the TC level. This phenomenon is associated with the fact that the heating process in the greenhouse decreases with the decrease in time that the air stays in this space.
The decrease in the airflow rate due to the increase in the heating process in the greenhouse (the air stays longer in this space) increases the TC level in the spaces facing north. However, the carbon dioxide concentration increases in these spaces.
Thus, in accordance with the results obtained, the actual airflow rate for the present occupancy level shows an acceptable compromise between the TC and the IAQ.

4.2. UAV Results

Regarding the UAV DS, the trajectory of the indoor movement will be presented as well as the UAV measurements. The latter will be presented for each space and compared to the results obtained by the BTS numerical model.

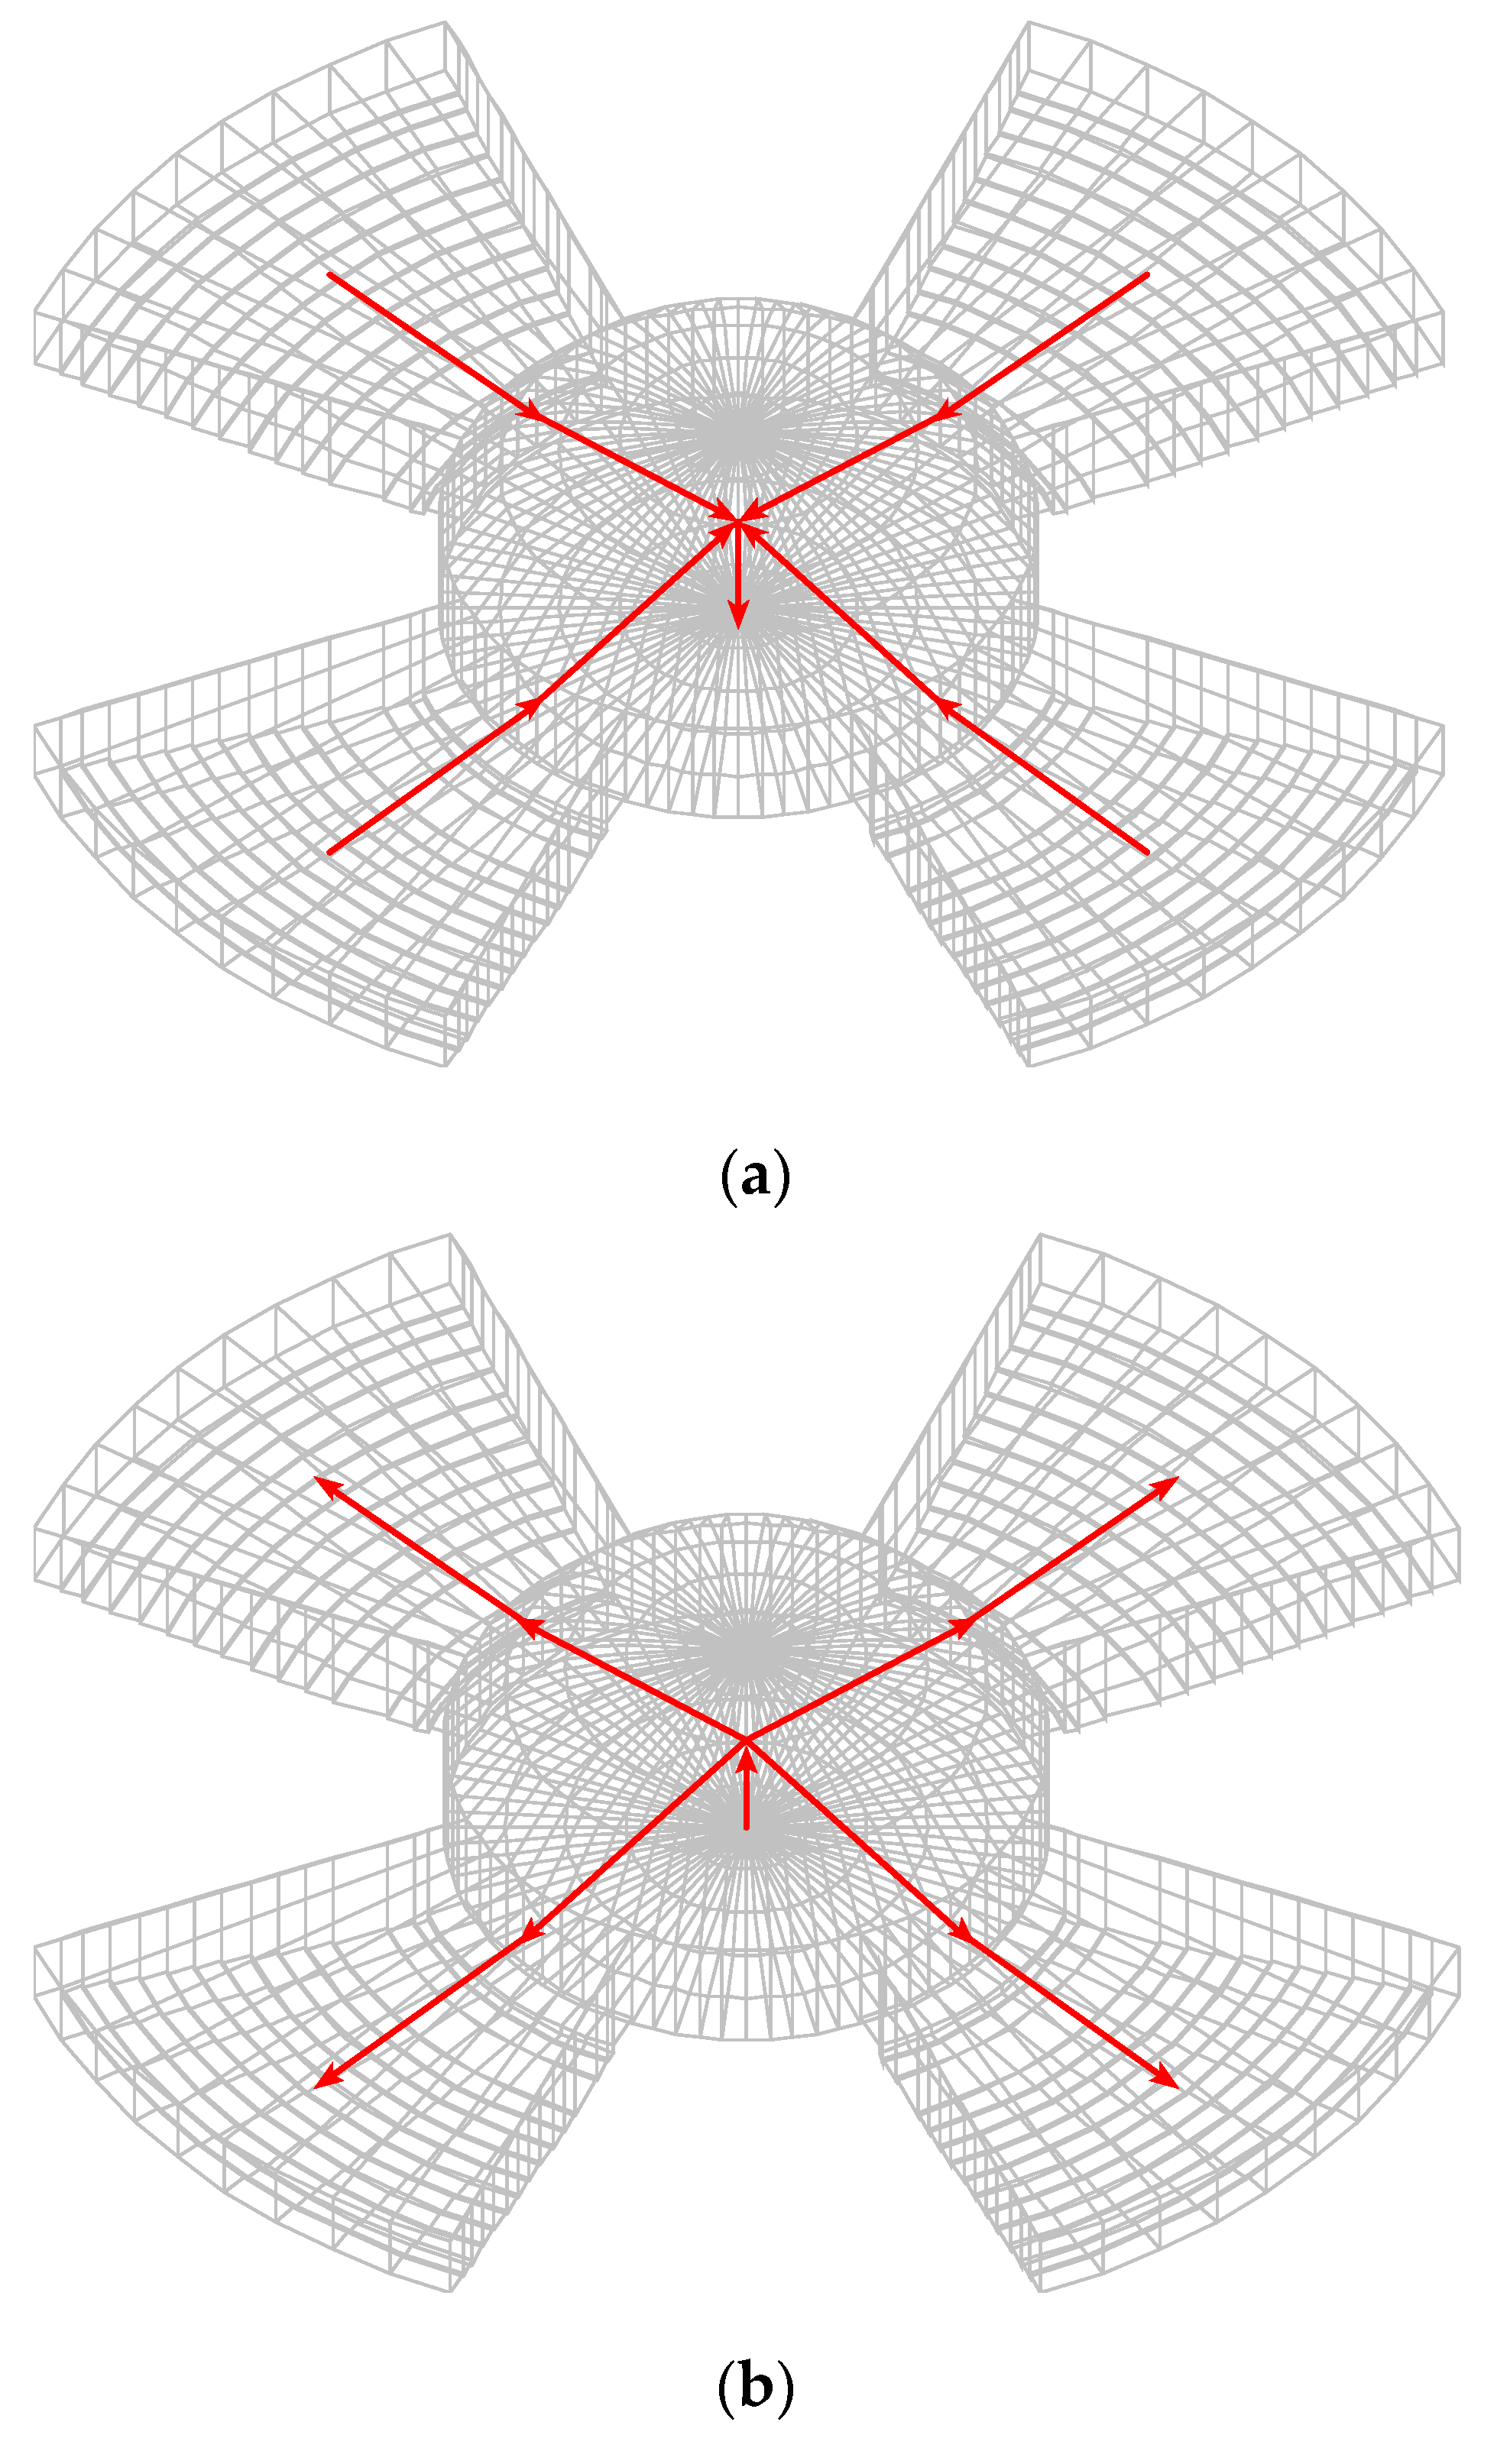
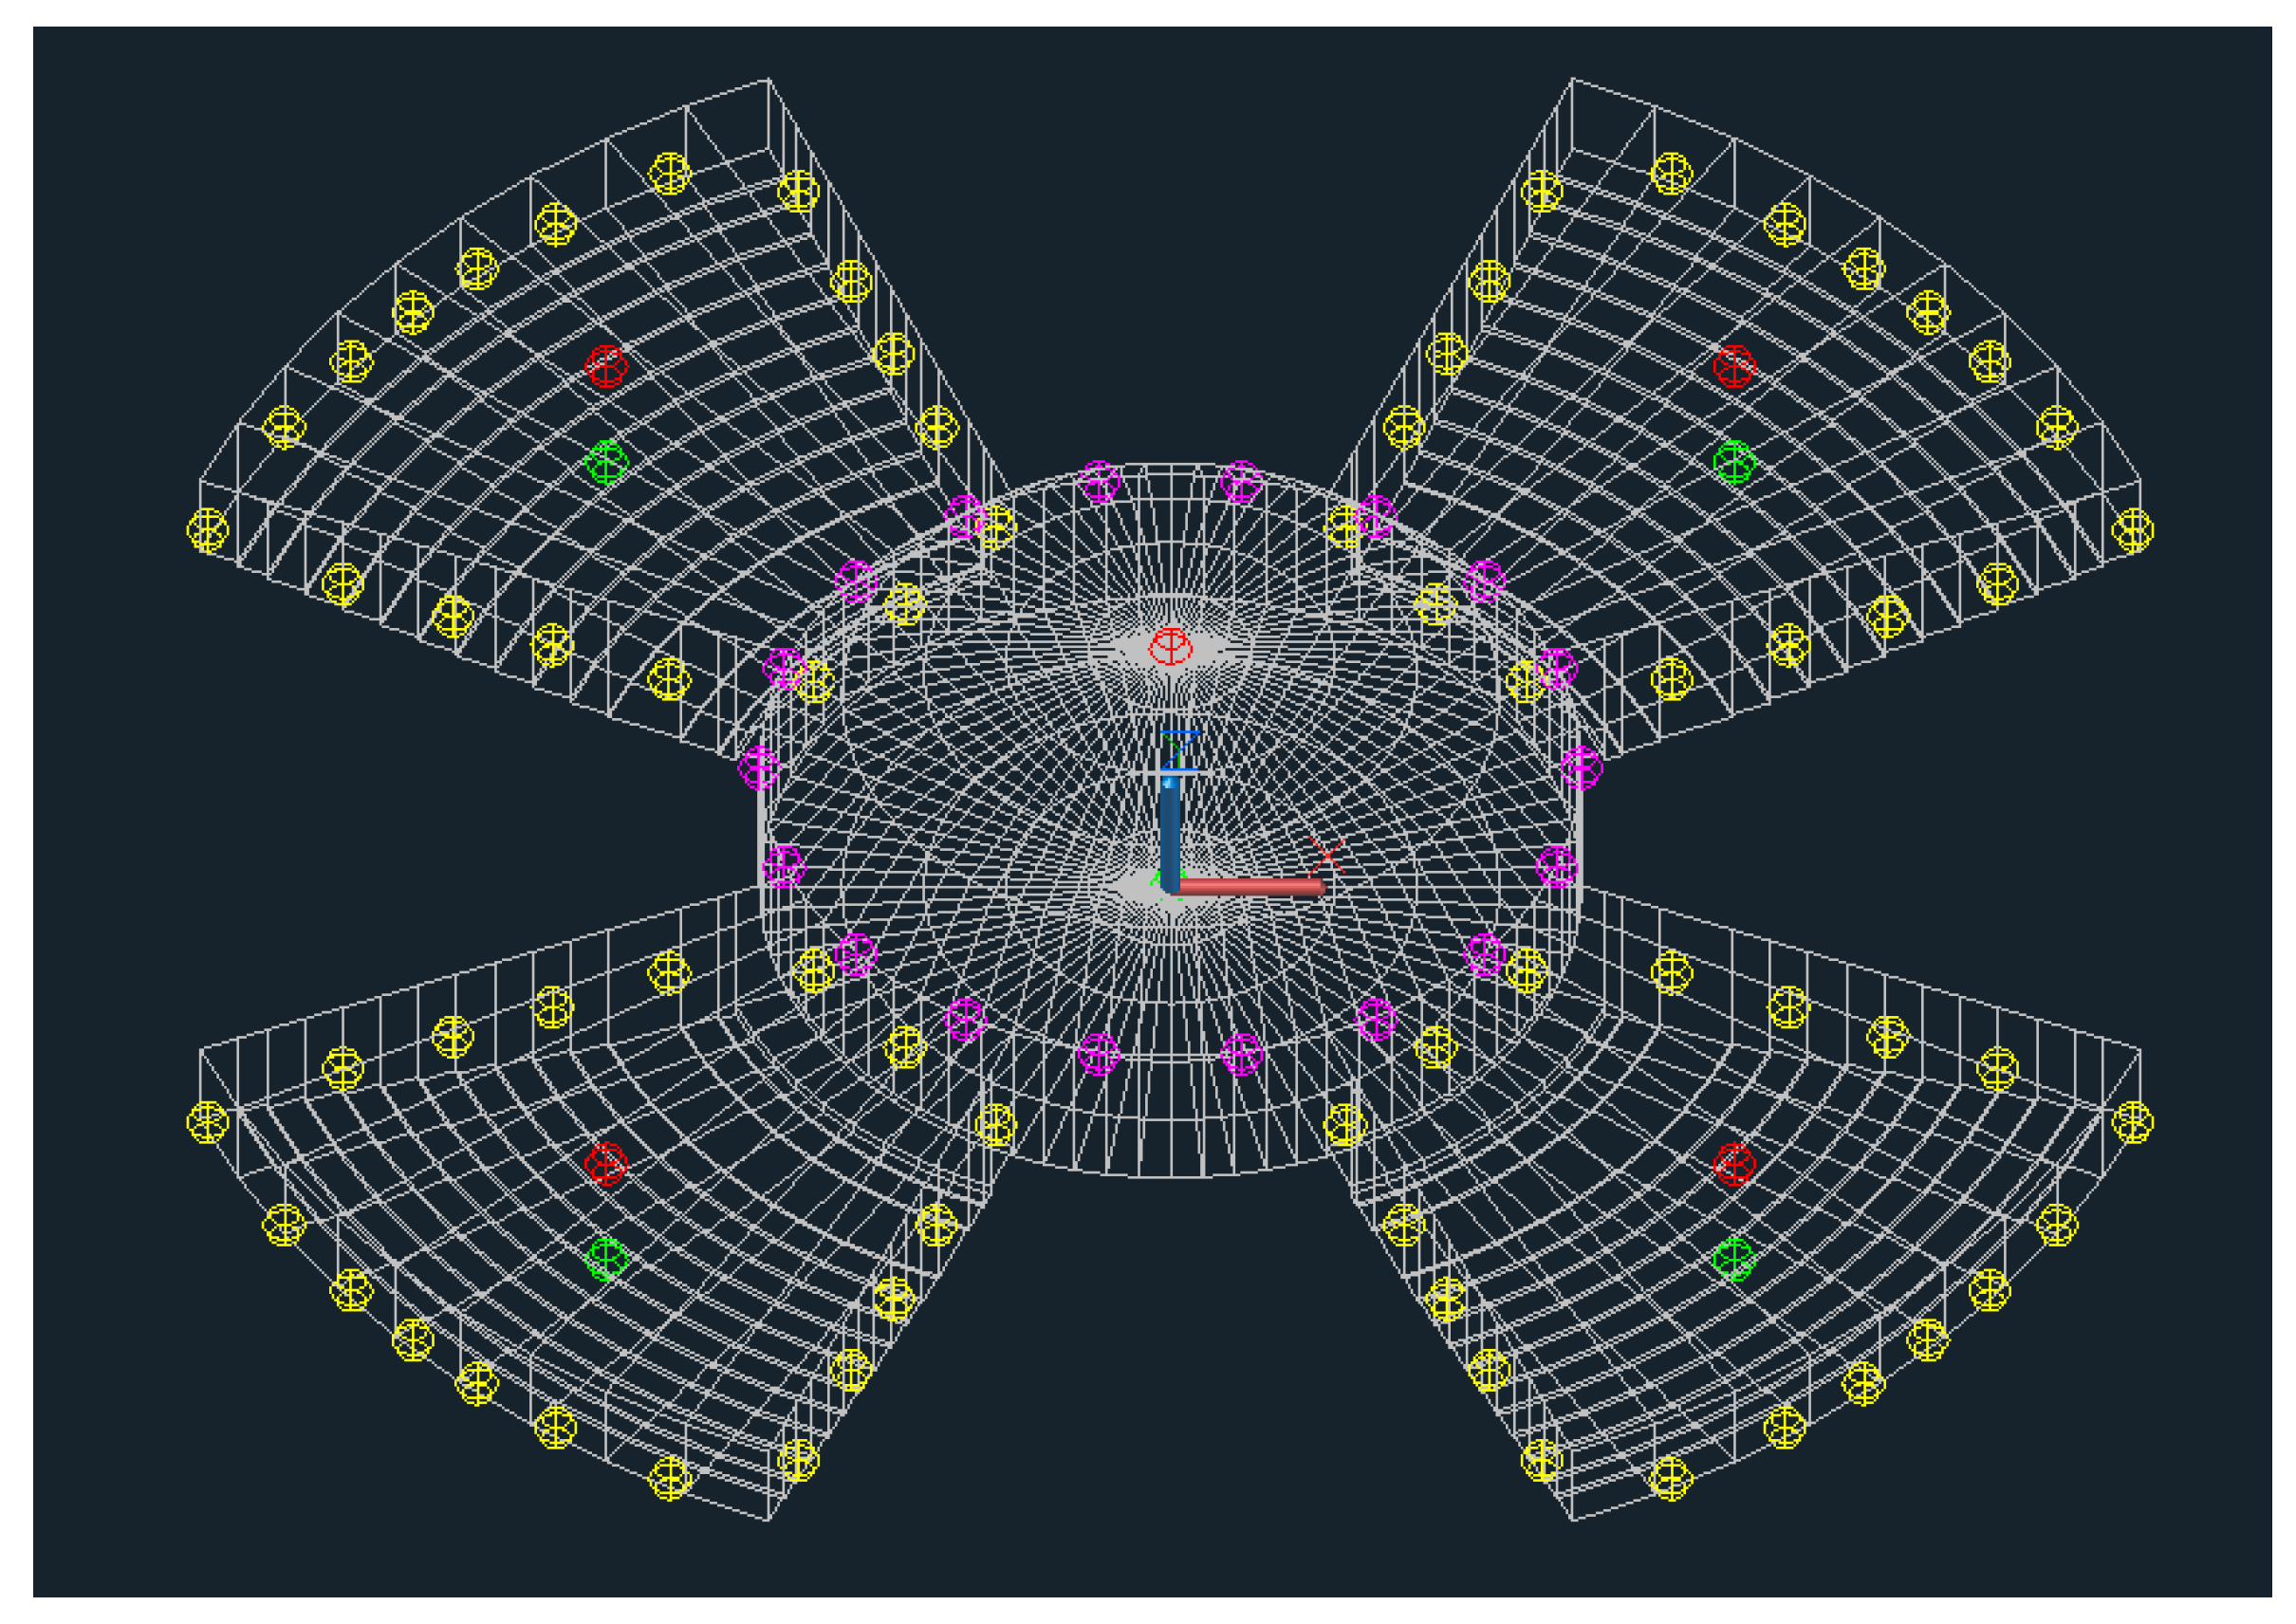
4.2.1. UAV Indoor Movement and Surface Measurements

Figure 18 presents the UAV trajectory along the space under analysis in red color using the UAV DS methodology presented in the next section.
Figure 19 shows the location of the surface temperature measurements performed by the UAV considering the floor, the lateral walls, and the ceiling surface temperature as representatives of the MRT. The lateral walls approach considers 18 measurements and their respective mean value. These measurements are performed through a 180° UAV rotation in the central space with two infrared sensors.
In Figure 19, the sphere colors are associated with the following:
  • Red, for the ceiling surface measurement location;
  • Green, for the floor surface measurement location;
  • Yellow, for the lateral wall surface measurement location in the auditorium;
  • Magenta, for the lateral wall surface in the measurement location in the greenhouse.
In the development of the building monitoring mission, two approaches were used to allow UAV monitoring missions that are compatible with their main restrictions, mainly short battery life. The building analysis will be performed from 8 h to 12 h in the morning period and from 14 h to 18 h in the afternoon period.
The developed approaches consider mission cycles composed of pre-defined measuring and resting periods. In the measuring period, the UAV flies across the spaces according to a specific order and performs the environmental measurements in the center of each space. At this position, the UAV measures the environmental variables while rotating 180° to reverse its trajectory. During resting time, the UAV stays on the ground. This period can be used, if necessary, to exchange batteries or fix any problems that may have occurred during the previous mission. In both cycle approaches, the same UAV flight velocities were considered.
Two mission approaches were developed in order to explore different spatial and temporal measurements in the environment and assess their influence on achieving an accurate environmental evolution analysis:
  • Approach A considers a single cycle composed of an 8-min measuring period and a 2-min resting period repeated continuously during the morning and afternoon testing periods. It considers a single-UAV mission, where the UAV monitors the entire building in the following order of spaces: 6, 2, 6, 3, 6, 4, 6, 5, and 6. This approach will measure across all spaces during the mission duration. Therefore, it will be adequate for monitoring environments with low variability;
  • Approach B considers two complementary cycles. The first cycle is composed of the same measuring time and a lower resting time. It is performed by two UAVs simultaneously, where each one visits two adjacent spaces and the central space. The first UAV considers the following order of spaces: 6, 2, 6, and 3, while the second UAV considers the following order of spaces: 6, 4, 6, and 5. The UAV flights are desynchronized to avoid unwanted collisions. This cycle can provide more measurements per time unit and is therefore more suitable for high environmental variability. The second cycle is equal to the single cycle of approach A regarding measurement, resting times, and the order in which the spaces are visited. It is also implemented by a single UAV. In this approach, the first cycle is implemented in periods where more measurements are required for an accurate environmental representation, while the second cycle is implemented in more environmentally stable periods. The proportion of first and second-cycle implementation periods throughout the day should be personalized to the building under analysis so that the first cycle is performed during the high environmental variation time period and the second cycle is performed during the remaining evaluation time.
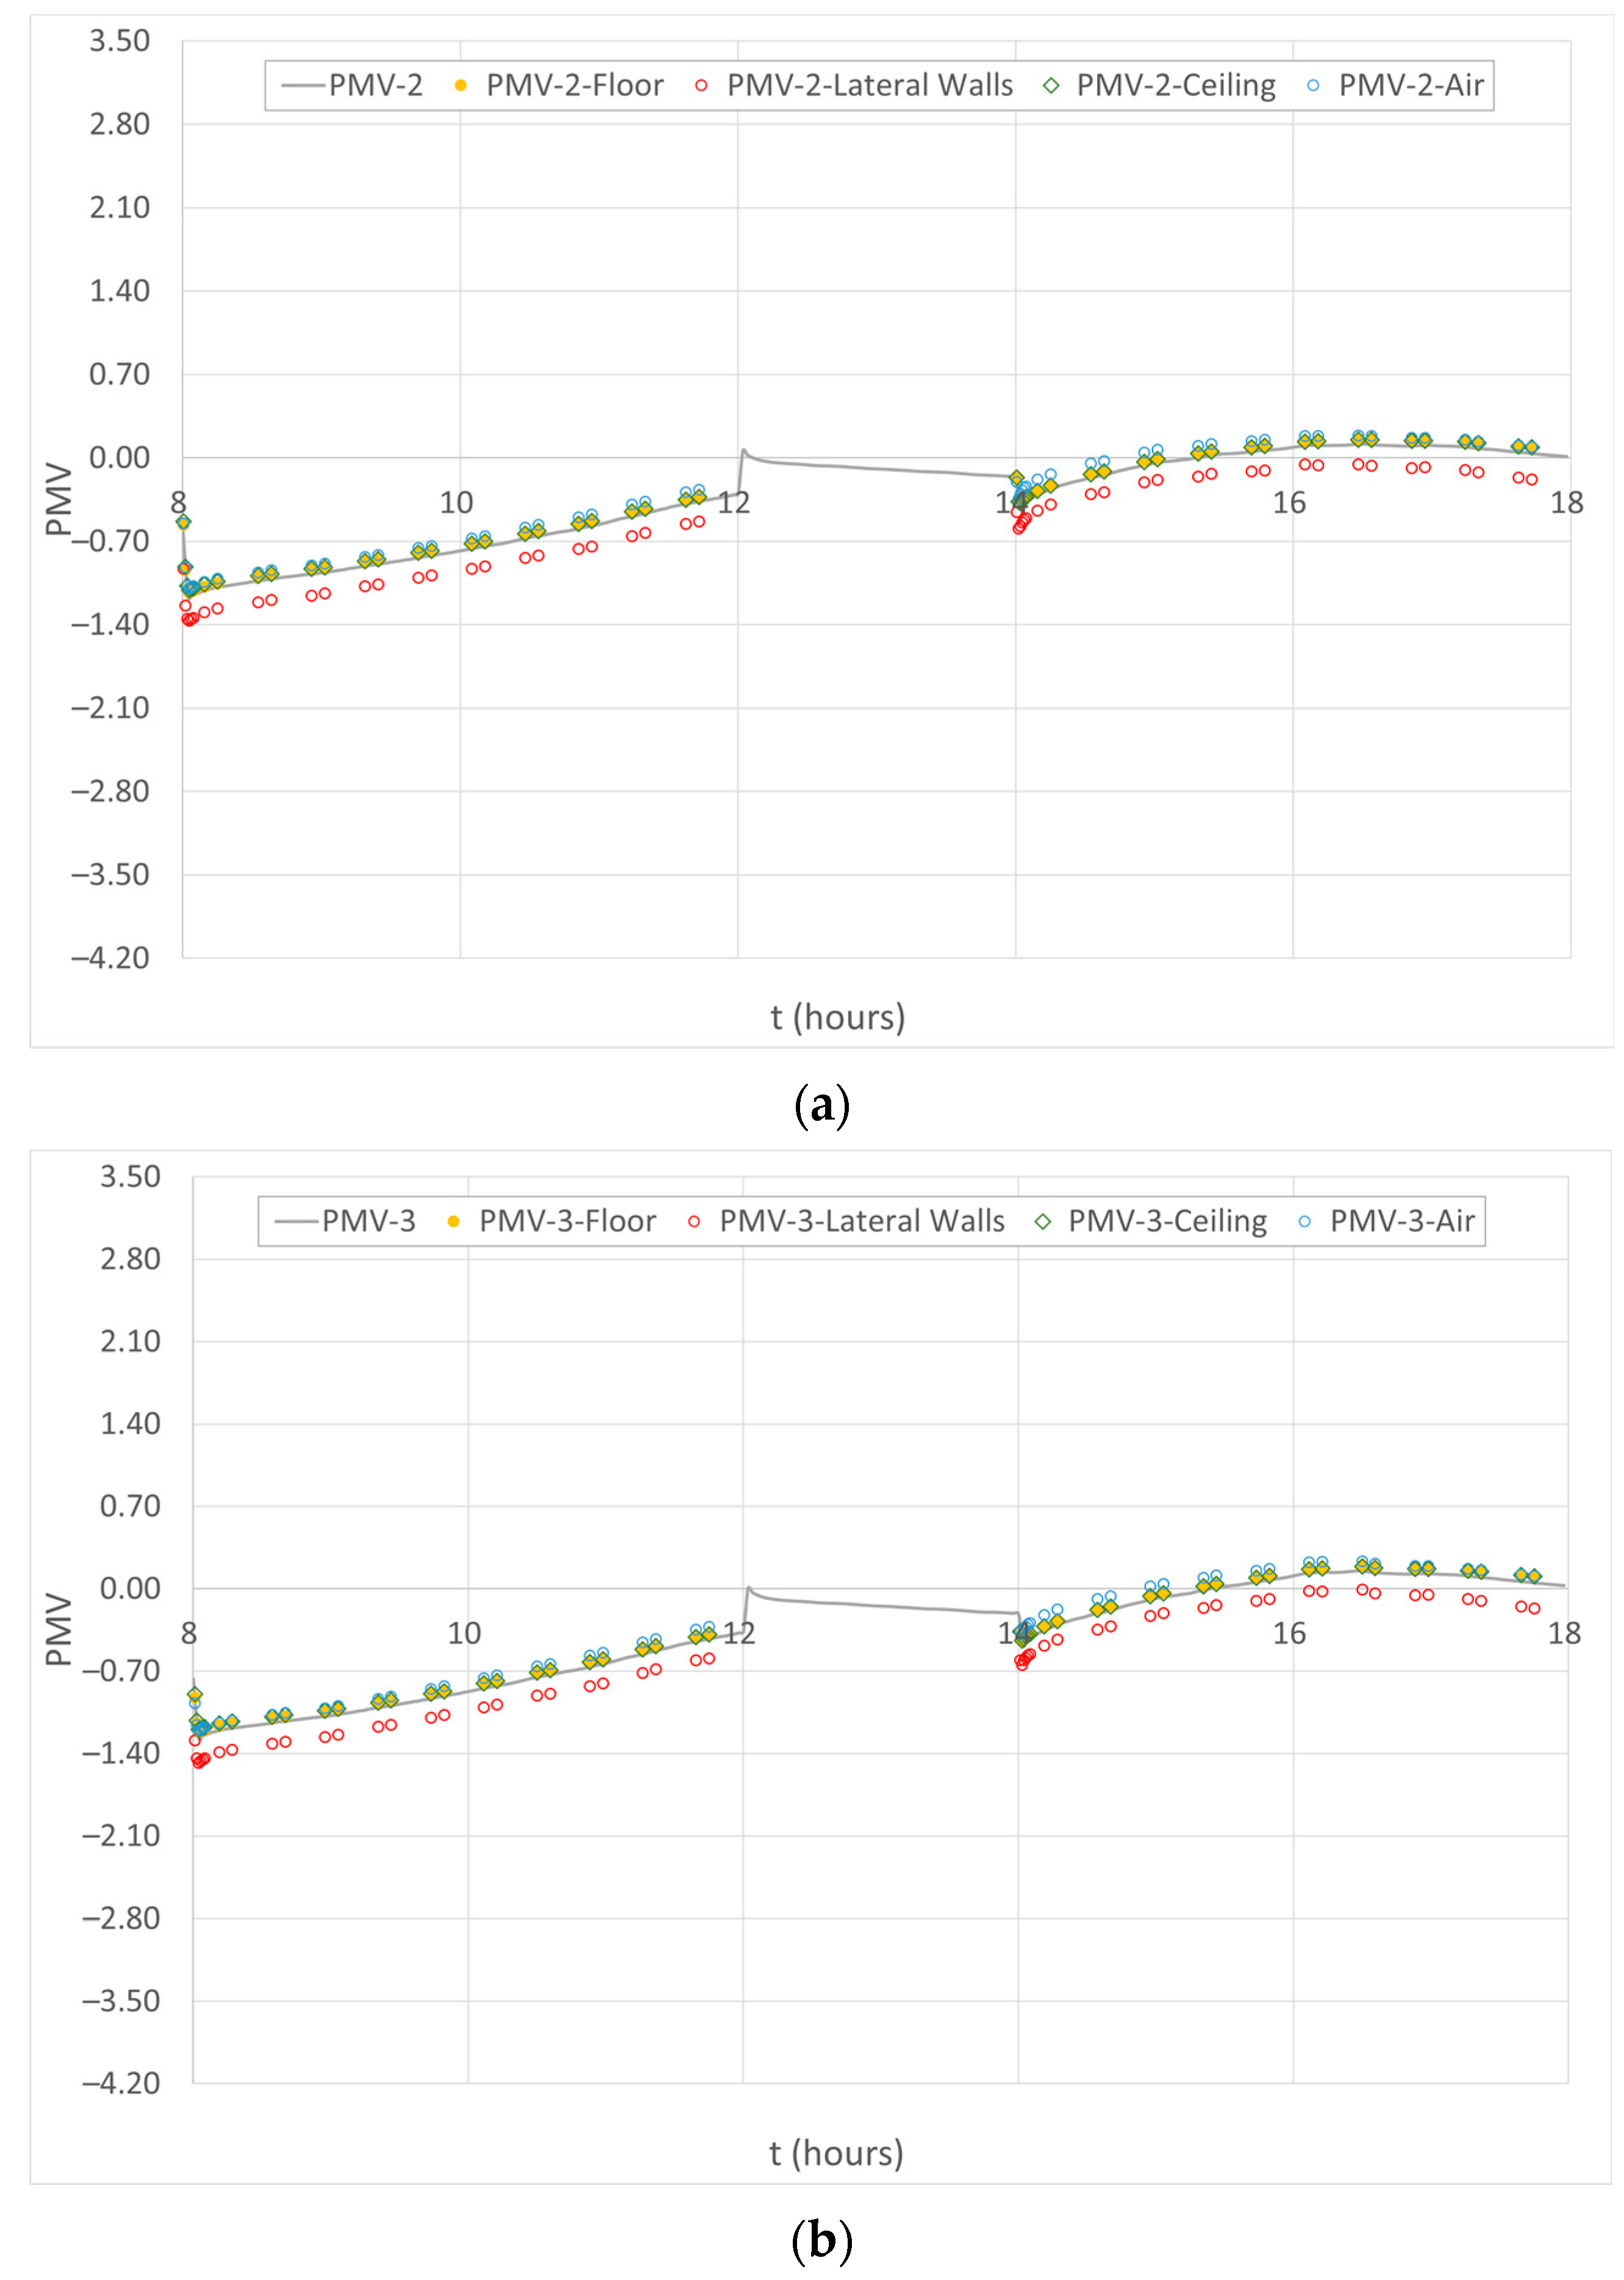
In accordance with the PMV results presented previously, at the beginning of the morning and afternoon periods, a strong variation in the TC levels is identified. In these conditions, more measurements per time unit are required. Additionally, higher variations in the TC level in spaces facing south (spaces 4 and 5) were calculated when compared to the spaces facing north (spaces 2 and 3). Therefore, it is also important to obtain more measurement data in the spaces facing south than in spaces facing north. At last, the central space shows a stronger variation in the TC level when compared to the remaining spaces, which also require more frequent measurements. Therefore, approach B was chosen to conduct the TC analysis, considering a dual-UAV mission during the more dynamic environmental periods and a single-UAV mission in the more stable periods.
All auditoriums (spaces 2 to 4) have the same dimensions and therefore will present the same z coordinate of the central measurement point (approximately 2.1 m). The correspondent x and y coordinates for each auditorium have the same modulus value (approximately 13.7 m), differing only in the signal. Spaces 2 and 4 have both positive and negative x and y coordinates. Space 5 has positive x coordinates and negative y coordinates, while space 3 has negative x coordinates and positive y coordinates. The central space (space 6) is centered in the referential origin, a central measurement point with a z coordinate of 4.1 m. The evolution of x, y, and z values thus represents the path traveled by the UAV with both approaches.

4.2.2. UAV TC

The indoor TC level will be analyzed regarding the PMV values measured according to approach B. Figure 20 presents the PMV values in spaces 2 to 6. The colored circles represent the measurements performed by the UAV, according to the UAV DS, focusing on different measurement methods. These four options consider different MRT-based results to calculate the PMV, namely the floor temperature (in yellow), the lateral walls’ temperatures (in red), the ceiling temperatures (in green), and the air temperature (in blue). The line represents the calculation performed in the space according to the BTS.
According to the TC results obtained from the UAV, the design using two UAVs guarantees acceptable reproduction of PMV values when people enter the space and the ventilation system is connected. Such was observed when the environmental variables presented higher variations.
The TC evaluation using UAV assumed that the MRT was equal to the floor surface, lateral wall surface, ceiling surface, and indoor air temperature. Thus, three situations were observed: namely, when the auditorium was oriented in the north direction (without incident solar radiation), when the auditorium was oriented in the south direction (with incident solar radiation), and in the greenhouse. In both situations, the calculated MRT presents similar, lower, or higher values than the real PMV value calculated by the BTS.
In the auditorium facing north, without incident solar radiation, the following conclusions are present:
  • In spaces 2 and 3, during the morning and afternoon periods, the calculated MTR using the floor surface, ceiling surface, and indoor air temperatures is slightly higher than the MRT simulation values. Thus, the TC level obtained by the UAV is slightly higher than that of the BTS simulation. This phenomenon is associated with the UAV considering a slightly higher value of the MRT than the BTS simulation;
  • In spaces numbers 2 and 3, during the morning and afternoon periods, the calculated MTR using the lateral wall temperatures is lower than the simulated MRT value. Thus, the TC level obtained by the UAV is lower than that of the BTS simulation. This phenomenon is associated with the UAV considering a lower value of the MRT than the BTS simulation, mainly due to the lower window glass temperatures facing north;
  • Thus, in accordance with the obtained results, in the north-facing auditorium, without incident solar radiation, the floor and ceiling surface temperatures present an acceptable value for the MRT estimation.
In the auditorium facing south with incident solar radiation, the following conclusions are obtained:
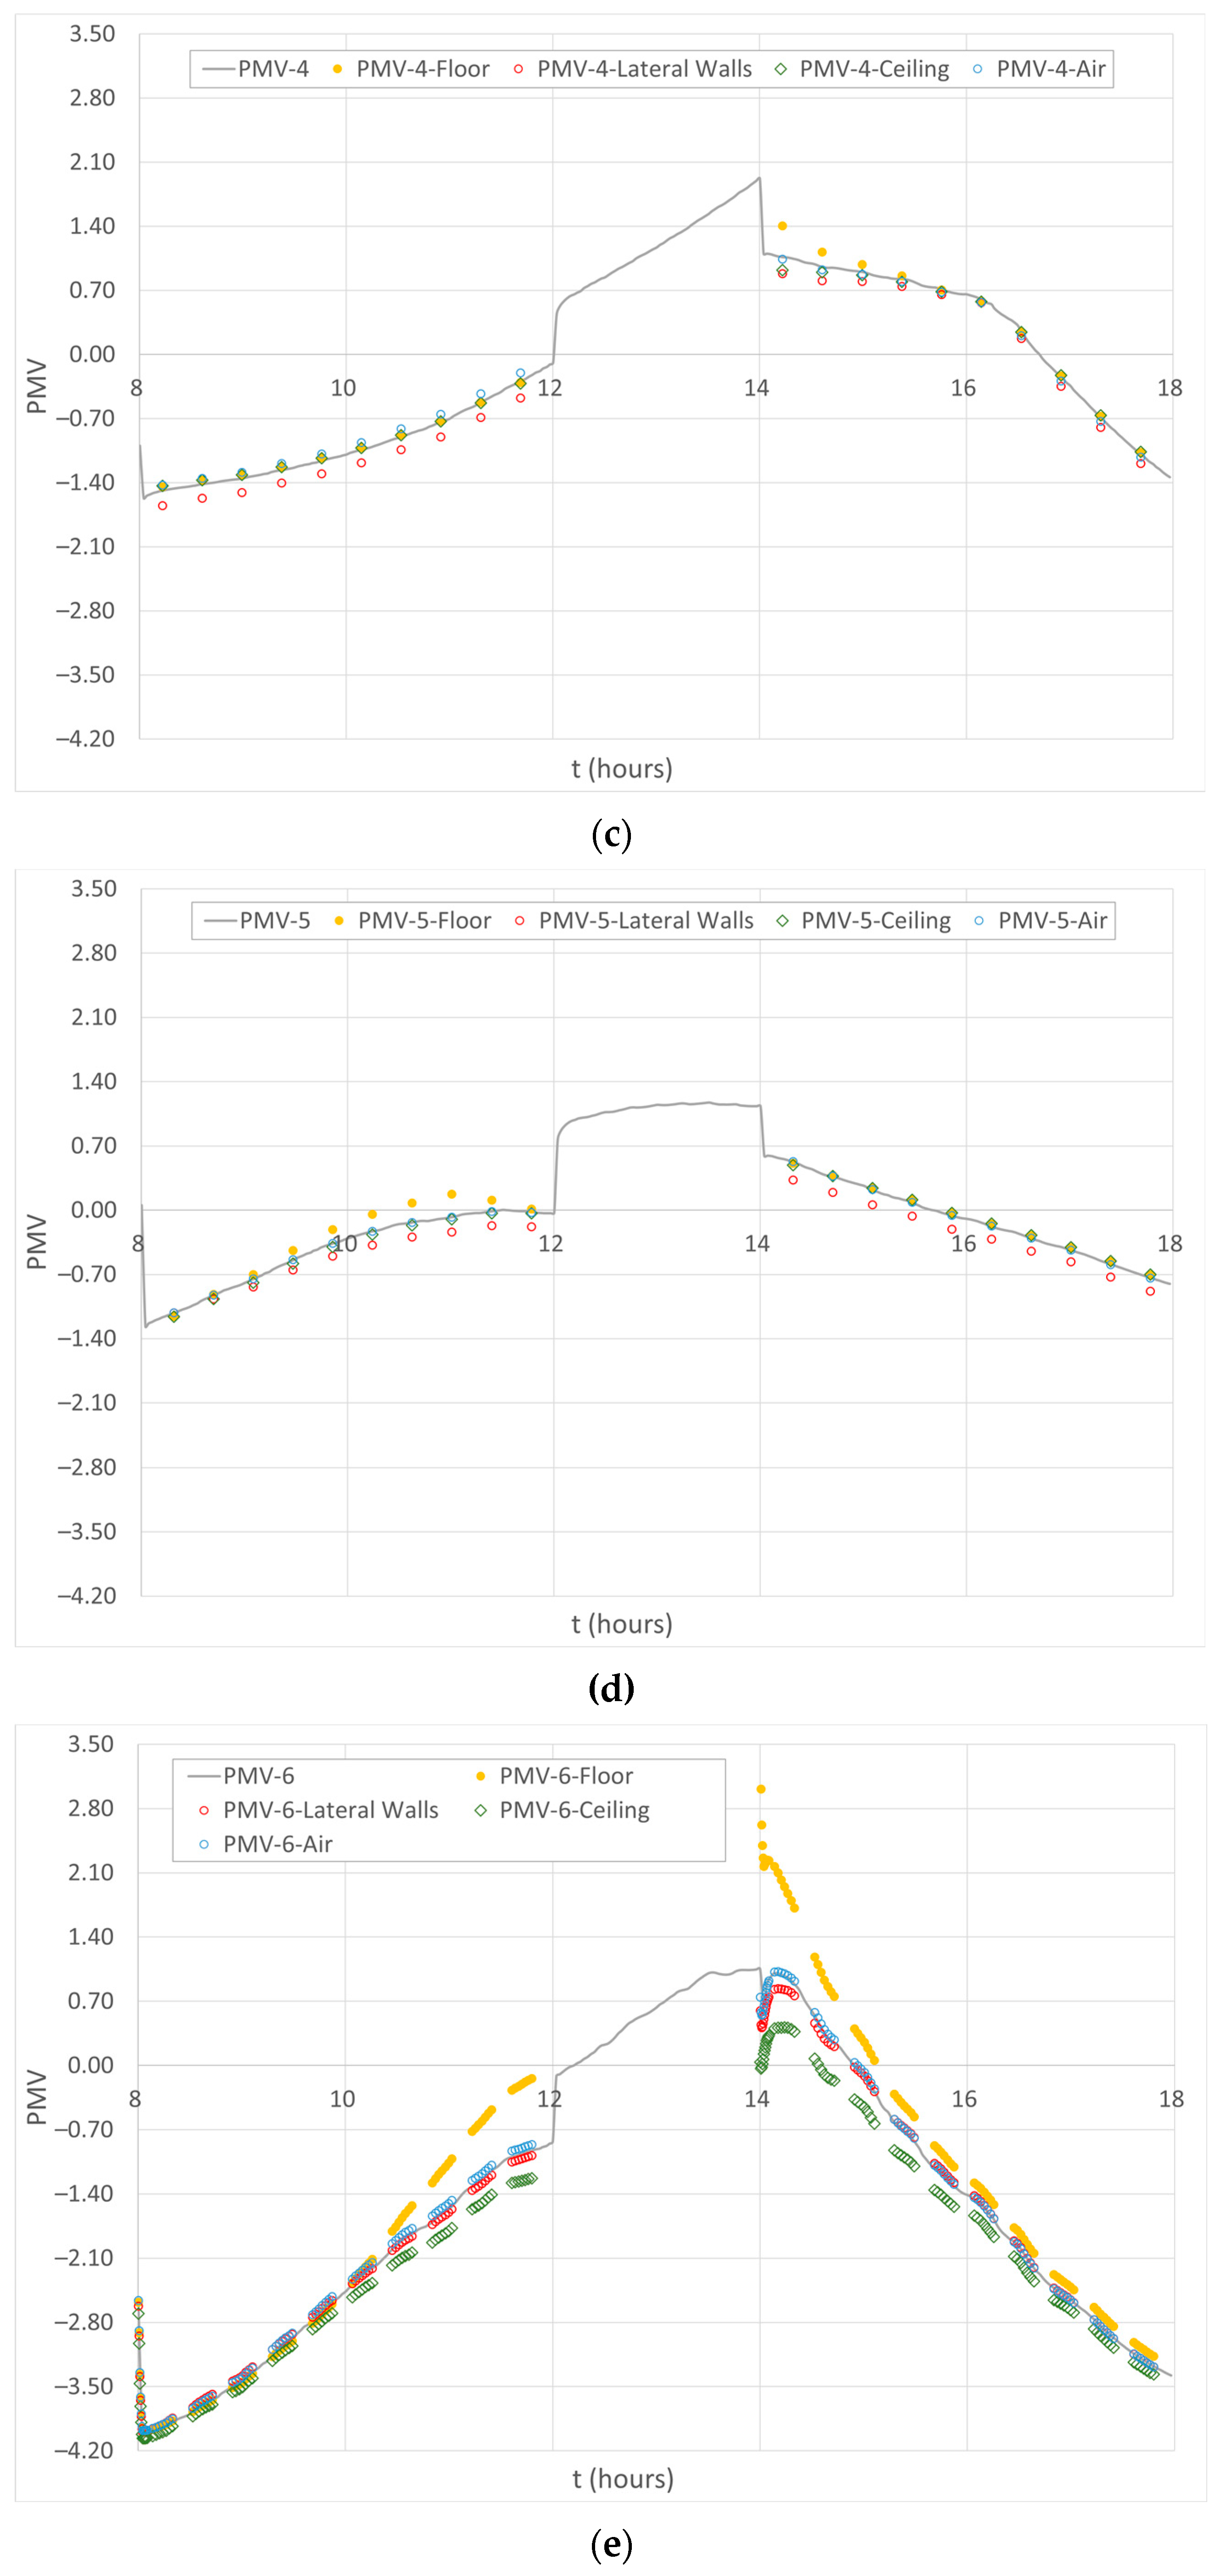
  • In space 4, during the morning period, the calculated MTR using the floor surface and ceiling surface temperatures is equal to the MRT simulation value. In space 5, during the afternoon period, the calculated MTR using the floor surface, ceiling surface, and indoor air temperatures is equal to the simulated MRT value. During the morning period, the MTR calculated using the floor surface and indoor air temperatures is equal to the simulated MRT value. Thus, the TC level obtained by the UAV is similar to the one obtained by the BTS simulation;
  • In space 4, during the morning period, the MTR was calculated using the indoor air temperatures that were slightly higher than the simulated MRT value, and in space 4, during the afternoon period, and in spaces 5, during the morning period, the MTR was calculated using the floor surface temperature that was slightly higher than the MRT simulation value. Thus, the TC level obtained by the UAV is slightly higher than the value obtained by the BTS simulation. This phenomenon is associated with the UAV considering a higher value of the MRT on the floor surface than the BTS simulation because the floor is subjected to incident solar radiation;
  • In spaces 4 and 5, during the morning and afternoon periods, the MTR calculated using the lateral wall temperatures is lower than the MRT simulation value. Thus, the TC level obtained by the UAV is lower than that of the BTS simulation;
  • Thus, in accordance with the obtained results, for the south-facing auditorium with incident solar radiation, the ceiling surface temperatures and sometimes the indoor air temperature present an acceptable value for the MRT estimation value.
In the greenhouse, with incident solar radiation, the following conclusions are obtained:
  • In space 6, during the morning and afternoon periods, the lateral wall temperature is similar to the MRT value. During the afternoon period, the indoor air temperature is similar to the MRT value. Thus, the UAV measurements obtained are similar to the BTS simulation;
  • In space 6, in the morning and afternoon periods, the ceiling surface temperature is slightly lower than the MRT value. Thus, the TC level obtained by the UAV is slightly lower than that of the BTS simulation. This phenomenon is associated with the UAV considering a lower value of the MRT on the ceiling surface than the BTS simulation because the central ceiling surface is subjected to low incident solar radiation;
  • In space 6, during the morning and afternoon periods, the MTR calculated using the floor surface temperatures is lower than the MRT simulation value. Thus, the TC level obtained by the UAV is lower than that of the BTS simulation. This phenomenon is associated with the incident solar radiation verified all day on the floor surface;
  • Thus, in accordance with the results obtained in the greenhouse, with incident solar radiation, the lateral wall surface temperatures and sometimes the indoor air temperature present an acceptable value for the MRT estimation value.
According to the results obtained, the UAVs are able to measure the environmental variables in accordance with international standards, namely, near the occupation area. The UAVs are therefore able to measure environmental variables in buildings with complex typologies without the need for measuring equipment installed in the building. The UAVs are also versatile during the development and implementation phases of this kind of building, where new renewable energies and new thermal solutions are used to improve the TC levels.

5. Conclusions

In this study, UAVs are used for measuring environmental variables in passive buildings equipped with a central greenhouse design. This study considered the use of BTS and UAV DS. The first simulator is used for building design and assessing the building’s thermal response, while the second simulator is used in the application of environmental variable measurements.
Thus, following the results obtained, the greenhouse space developed in this work with a dome-ceiling transparent surface and vertical transparent wall surfaces captures the transmitted incident solar radiation throughout an entire day.
In the present study, the solar radiation level is an important contributor to the heating of the auditoriums. The auditoriums facing south-west (space 4) and south-east (space 5) are subjected to direct solar radiation, and the auditoriums facing north-east (space 2) and north-west (space 3) are not subjected to direct solar radiation. Thus, the last auditoriums are subjected to warmer airflow from the central greenhouse.
The greenhouse and the ventilation strategies provide acceptable IAQ and TC levels. The TC is acceptable at the end of the morning and the beginning of the afternoon. At the beginning of the morning and end of the afternoon, due to the low transmitted incident solar radiation, the TC level is near the acceptable value.
The increase in the airflow rate decreases the carbon dioxide concentration. However, it also decreases the energy transported to the spaces facing north and the TC level. This phenomenon is associated with the fact that the heating process in the greenhouse decreases with the decreased time that the air stays in this space.
The decrease in the airflow rate, due to the increase in the heating process in the greenhouse (the air stays longer in this space), increases the TC level in the spaces facing north. However, the carbon dioxide concentration increases in these spaces.
Thus, in accordance with the results obtained, the actual airflow rate (considering the present occupancy level) shows an acceptable compromise between the TC and the IAQ.
The dual-UAV mission approach presents good environmental variable reproduction, particularly when the environmental variables show higher variations. When the auditorium is oriented to the north without direct incident solar radiation, the floor and ceiling surface temperatures present an acceptable value for the MRT estimation. When the auditorium is oriented to the south with direct incident solar radiation, the ceiling surface temperatures and sometimes the indoor air temperature present an acceptable value for MRT estimation. At last, in the greenhouse, with direct incident solar radiation, the lateral wall surface temperatures (and sometimes the indoor air temperature) present an acceptable value for the MRT estimation.
Therefore, the methodology presented in this work is able to provide important information to plan a UAV environmental monitoring mission in detail, not only when the environmental variables represent high variation but also when the PMV simplification is applied. Such an approach is adequate for buildings with different internal ceiling heights and irregular geometries.
This type of methodology will allow evaluation and preparation tests for buildings with complex topologies, with and without human occupation, as well as those subjected to high thermal gradients due, for instance, to solar radiation, variations in ventilation rates, and variable human occupation. Additionally, in order to improve the UAV-measured TC level, a surface thermal sensor could be added to the UAV. Several measurement topologies could be used in the analysis in order to provide acceptable MRT values that are close to the real ones. Future work may consider the implementation of larger collaborative UAV swarms to perform the missions instead of a single- or double-UAV implementation. Such an approach may be important to encompass the analysis of larger indoor spaces at the same time.

Author Contributions

All authors contributed equally to the design of the work, numerical simulation, analysis of results, writing, and review of the manuscript. All authors have read and agreed to the published version of the manuscript.

Funding

The authors would like to acknowledge to the project (SAICT-ALG/39586/2018) from Algarve Regional Operational Program (CRESC Algarve 2020), under the PORTUGAL 2020 Partnership Agreement, through the European Regional Development Fund (ERDF) and the National Science and Technology Foundation (FCT). The authors would also like to acknowledge to the project 2022–2023 ASHRAE Undergraduate Senior Project Grant Program. The authors would like to acknowledge support by National Funds through National Science and Technology Foundation (FCT) under project UIDB/50021/2020.

Institutional Review Board Statement

Not applicable.

Informed Consent Statement

Not applicable.

Data Availability Statement

Data sharing not applicable.

Conflicts of Interest

The authors declare no conflict of interest.

Nomenclature

BTSbuilding thermal simulator
CFDcomputational fluids dynamic
CO2
IoT
carbon dioxide concentration
internet of things
MRTmean radiant temperature
PMVpredicted mean vote
TCthermal comfort
UAVunmanned aerial vehicle
UAV DSUAV dynamic simulator

References

  1. ASHRAE Standard 62-1989; Ventilation for Acceptable Indoor Air Quality. American Society of Heating, Refrigerating, and Air-Conditioning Engineers, Inc.: Atlanta, GA, USA, 1990.
  2. Ministérios do Ambiente; Ordenamento do Território e Energia; da Saúde e da Solidariedade. Regulamento de Desempenho Energético dos Edifícios de Comércio e Serviços (RECS)—Requisitos de Ventilação e Qualidade do Ar Interior; no. 353-A/2013; Diário da República: Lisboa, Portugal, 2013; pp. 6644-(2)–6644-(9). [Google Scholar]
  3. Korsavi, S.S.; Montazami, A.; Mumovic, D. Indoor air quality (IAQ) in naturally-ventilated primary schools in the UK: Occupant-related factors. Build. Environ. 2020, 180, 106992. [Google Scholar] [CrossRef]
  4. Abdullah, S.; Hamid, F.F.A.; Ismail, M.; Ahmed, A.N.; Mansor, W.N.W. Data on Indoor Air Quality (IAQ) in kindergartens with different surrounding activities. Data Brief 2019, 25, 103969. [Google Scholar] [CrossRef] [PubMed]
  5. Conceição, E.; Silva, M.C.; Viegas, D.X. Air quality inside the passenger compartment of a bus. J. Expo. Anal. Environ. Epidemiol. 1997, 7, 521–534. [Google Scholar] [PubMed]
  6. Fanger, P.O. Thermal Comfort. Analysis and Applications in Environmental Engineering; Danish Technical Press: Copenhagen, Denmark, 1970. [Google Scholar]
  7. ANSI/ASHRAE Standard 55-2017; Thermal Environmental Conditions for Human Occupancy. ASHRAE Inc.: Atlanta, GA, USA, 2017.
  8. ISO 7730; Ergonomics of the Thermal Environment Analytical Determination and Interpretation of Thermal Comfort Using Calculation of the PMV and PPD Indices and Local Thermal Comfort Criteria. International Standard Organization: Geneva, Switzerland, 2005.
  9. Conceição, E.Z.; Lúcio, M.M.J. Evaluation of thermal comfort conditions in a localized radiant system placed in front and behind two students seated nearby warmed curtains. Build. Environ. 2010, 45, 2100–2110. [Google Scholar] [CrossRef]
  10. Conceição, E.Z.E.; Lúcio, M.M.J.R. Numerical simulation of passive and active solar strategies in buildings with complex topology. Build. Simul. 2010, 3, 245–261. [Google Scholar] [CrossRef]
  11. Conceição, E.Z.E.; Lúcio, M.M.J.R. Numerical Simulation of the Application of Solar Radiant Systems, Internal Airflow and Occupants’ Presence in the Improvement of Comfort in Winter Conditions. Buildings 2016, 6, 38. [Google Scholar] [CrossRef]
  12. Chaturvedi, A.; Shrivastava, L. IOT Based Wireless Sensor Network for Air Pollution Monitoring. In Proceedings of the 2020 IEEE 9th International Conference on Communication Systems and Network Technologies (CSNT), Gwalior, India, 10–12 April 2020. [Google Scholar] [CrossRef]
  13. Hu, Z.; Bai, Z.; Yang, Y.; Zheng, Z.; Bian, K.; Song, L. UAV Aided Aerial-Ground IoT for Air Quality Sensing in Smart City: Architecture, Technologies, and Implementation. IEEE Netw. 2019, 33, 14–22. [Google Scholar] [CrossRef]
  14. Zhi, S.D.; Wei, Y.B.; Yu, Z.H. Air quality monitoring platform based on remote unmanned aerial vehicle with wireless communication. In Proceedings of the International Conference on Future Networks and Distributed Systems, Cambridge, UK, 19–20 July 2017; ACM International Conference Proceeding Series. Volume Part F130522. [Google Scholar] [CrossRef]
  15. Bolla, G.M.; Casagrande, M.; Comazzetto, A.; Moro, R.D.; Destro, M.; Fantin, E.; Colombatti, G.; Aboudan, A.; Lorenzini, E.C. ARIA: Air Pollutants Monitoring Using UAVs; ARIA: Air Pollutants Monitoring Using UAVs. In Proceedings of the 2018 5th IEEE International Workshop on Metrology for AeroSpace (MetroAeroSpace), Rome, Italy, 20–22 June 2018. [Google Scholar] [CrossRef]
  16. Takei, Y.; Kanazawa, Y.; Hirasawa, K.; Nanto, H. Development of 3D gas source localization using multi-copter with gas sensor array. In Proceedings of the ISOCS/IEEE International Symposium on Olfaction and Electronic Nose, Fukuoka, Japan, 26–29 May 2019. [Google Scholar] [CrossRef]
  17. Burgués, J.; Hernández, V.; Lilienthal, A.; Marco, S. Smelling Nano Aerial Vehicle for Gas Source Localization and Mapping. Sensors 2019, 19, 478. [Google Scholar] [CrossRef]
  18. Tuzson, B.; Graf, M.; Ravelid, J.; Scheidegger, P.; Kupferschmid, A.; Looser, H.; Morales, R.P.; Emmenegger, L. A compact QCL spectrometer for mobile, high-precision methane sensing aboard drones. Atmos. Meas. Tech. 2020, 13, 4715–4726. [Google Scholar] [CrossRef]
  19. Hussain, A.M.; Azmy, S.B.; Abuzrara, A.; Al-Hajjaji, K.; Hassan, A.; Khamdan, H.; Ezzin, M.; Hassani, A.; Zorba, N. UAV-based Semi-Autonomous Data Acquisition and Classification. In Proceedings of the 2018 14th International Wireless Communications and Mobile Computing Conference, IWCMC 2018, Limassol, Cyprus, 25–29 June 2018; Institute of Electrical and Electronics Engineers Inc.: Piscataway, NJ, USA, 2018; pp. 1273–1277. [Google Scholar] [CrossRef]
  20. Babaan, J.B.; Ballori, J.P.; Tamondong, A.M.; Ramos, R.V.; Ostrea, P.M. Estimation of PM 2.5 vertical distribution using customized UAV and mobile sensors in Brgy. UP Campus, Diliman, Quezon City. Int. Arch. Photogramm. Remote Sens. Spat. Inf. Sci. 2018, 42, 89–103. [Google Scholar] [CrossRef]
  21. Hemamalini, R.R.; Vinodhini, R.; Shanthini, B.; Partheeban, P.; Charumathy, M.; Cornelius, K. Air quality monitoring and forecasting using smart drones and recurrent neural network for sustainable development in Chennai city. Sustain. Cities Soc. 2022, 85, 104077. [Google Scholar] [CrossRef]
  22. Zhao, X.; Luo, Y.; He, J. Analysis of the Thermal Environment in Pedestrian Space Using 3D Thermal Imaging. Energies 2020, 13, 3674. [Google Scholar] [CrossRef]
  23. Rodríguez, M.V.; Melgar, S.G.; Márquez, J.M.A. Assessment of aerial thermography as a method of in situ measurement of radiant heat transfer in urban public spaces. Sustain. Cities Soc. 2022, 87, 104228. [Google Scholar] [CrossRef]
  24. Rüdisser, D.; Weiss, T.; Unger, L. Spatially Resolved Analysis of Urban Thermal Environments Based on a Three-Dimensional Sampling Algorithm and UAV-Based Radiometric Measurements. Sensors 2021, 21, 4847. [Google Scholar] [CrossRef] [PubMed]
  25. Rodríguez, M.V.; Melgar, S.G.; Cordero, A.S.; Márquez, J.M.A. A Critical Review of Unmanned Aerial Vehicles (UAVs) Use in Architecture and Urbanism: Scientometric and Bibliometric Analysis. Appl. Sci. 2021, 11, 9966. [Google Scholar] [CrossRef]
  26. Stokowiec, K.; Sobura, S. Hand-Held and UAV Camera Comparison in Building Thermal Inspection Process. J. Phys. Conf. Ser. 2022, 2339, 012017. [Google Scholar] [CrossRef]
  27. Wang, R.; Zhou, Z.; Shen, Y. Robust landing control and simulation for flying wing UAV. In Proceedings of the 26th Chinese Control Conference, CCC 2007, Zhangjiajie, China, 26–31 July 2007; pp. 600–604. [Google Scholar] [CrossRef]
  28. de Croon, G.; de Wagter, C. Challenges of Autonomous Flight in Indoor Environments. In Proceedings of the IEEE International Conference on Intelligent Robots and Systems, Madrid, Spain, 1–5 October 2018; pp. 1003–1009. [Google Scholar] [CrossRef]
  29. Badrloo, S.; Varshosaz, M.; Pirasteh, S.; Li, J. A novel region-based expansion rate obstacle detection method for MAVs using a fisheye camera. Int. J. Appl. Earth Obs. Geoinf. 2022, 108, 102739. [Google Scholar] [CrossRef]
  30. Chen, S.; Wang, L.; Chen, W. Research on optimization of visual navigation algorithm for real-time obstacle avoidance of uav moving target tracking. In Proceedings of the 2019 IEEE 1st International Conference on Civil Aviation Safety and Information Technology, ICCASIT 2019, Kunming, China, 17–19 October 2019; pp. 315–320. [Google Scholar] [CrossRef]
  31. Xue, Z.; Gonsalves, T. Monocular Vision Obstacle Avoidance UAV: A Deep Reinforcement Learning Method. In Proceedings of the 2021 2nd International Conference on Innovative and Creative Information Technology (ICITech), Salatiga, Indonesia, 23–25 September 2021. [Google Scholar] [CrossRef]
  32. Park, J.; Cho, N.; Lee, S. Reactive Collision Avoidance Algorithm for UAV Using Bounding Tube against Multiple Moving Obstacles. IEEE Access 2020, 8, 218131–218144. [Google Scholar] [CrossRef]
  33. Mao, Y.; Chen, M.; Wei, X.; Chen, B. Obstacle Recognition and Avoidance for UAVs under Resource-Constrained Environments. IEEE Access 2020, 8, 169408–169422. [Google Scholar] [CrossRef]
  34. Yilmaz, K.; Kaya, O.F.; Uslu, E. Indoor UAV Localization and 3D Mapping Using Visual Odometry. In Proceedings of the 2020 Innovations in Intelligent Systems and Applications Conference (ASYU), Istanbul, Turkey, 15–17 October 2020; pp. 1–5. [Google Scholar] [CrossRef]
  35. Eckert, J.; German, R.; Dressler, F. On autonomous indoor flights: High-quality real-time localization using low-cost sensors. In Proceedings of the 2012 IEEE International Conference on Communications (ICC), Ottawa, ON, Canada, 10–15 June 2012; pp. 7093–7098. [Google Scholar] [CrossRef]
  36. Gupta, A.; Fernando, X. Simultaneous Localization and Mapping (SLAM) and Data Fusion in Unmanned Aerial Vehicles: Recent Advances and Challenges. Drones 2022, 6, 85. [Google Scholar] [CrossRef]
  37. Neumann, P.P.; Hirschberger, P.; Baurzhan, Z.; Tiebe, C.; Hofmann, M.; Hullmann, D.; Bartholmai, M. Indoor Air Quality Monitoring using flying Nanobots: Design and Experimental Study. In Proceedings of the 2019 IEEE International Symposium on Olfaction and Electronic Nose (ISOEN), Fukuoka, Japan, 26–29 May 2019. [Google Scholar] [CrossRef]
  38. Neumann, P.P.; Hüllmann, D.; Bartholmai, M. Concept of a gas-sensitive nano aerial robot swarm for indoor air quality monitoring. Mater. Today Proc. 2019, 12, 470–473. [Google Scholar] [CrossRef]
  39. Yungaicela, N.M.; Garza-Castañón, L.E.; Mendoza, A.; Minchala, I. Design and Implementation of an UAV-Based Platform for Air Pollution Monitoring and Source Identification. 2017. Available online: https://www.researchgate.net/publication/321294786 (accessed on 10 March 2023).
  40. Conceicao, E.; Da Silva, M.; Andre, J.; Viega, D. Thermal behaviour simulation of the passenger compartment of vehicles. Int. J. Veh. Des. 2000, 24, 372. [Google Scholar] [CrossRef]
Figure 1. View of the three-dimensional passive building equipped with a central greenhouse and four surrounding auditoriums. (a) 3D view, (b) lateral view, and (c) top view.
Cleantechnol 05 00055 g001
Figure 2. Airflow rate (m3/s) used in the numerical simulation, in the morning (white) and the afternoon (orange), for the central space (6) and the surrounding auditoriums (2 to 5). X is the east direction, while Y is the north direction.
Cleantechnol 05 00055 g002
Figure 3. System reference frames considered in the UAV DS (a) and measurement application example in the central greenhouse (b).
Cleantechnol 05 00055 g003
Figure 4. Number of transparent surfaces considered in the central space: five levels in the dome (inclined gray surfaces) and one level in the greenhouse (vertical red surfaces). Space is divided into eight sections. X is associated with the east direction, while Y is associated with the north direction.
Cleantechnol 05 00055 g004
Figure 5. Solar radiation of the transparent surfaces (from surface 1 to 45).
Cleantechnol 05 00055 g005
Figure 6. Solar radiation of the transparent surfaces (from surface 46 to 105).
Cleantechnol 05 00055 g006
Figure 7. Solar radiation of the transparent surfaces (from surface 106 to 150).
Cleantechnol 05 00055 g007
Figure 8. Solar radiation of the transparent surfaces (from surface 151 to 210).
Cleantechnol 05 00055 g008
Figure 9. Solar radiation of the transparent surfaces (from surface 211 to 255).
Cleantechnol 05 00055 g009
Figure 10. Solar radiation of the transparent surfaces (from surface 256 to 315).
Cleantechnol 05 00055 g010
Figure 11. Solar radiation of the transparent surfaces (from surface 316 to 360).
Cleantechnol 05 00055 g011
Figure 12. Solar radiation of the transparent surfaces (from 361 to 420).
Cleantechnol 05 00055 g012
Figure 13. Carbon dioxide concentration (CO2) from the numerical simulation for spaces 2 and 5 (a) as well as spaces 3 and 4 (b).
Cleantechnol 05 00055 g013
Figure 14. Air temperature (Tair) from the numerical simulation.
Cleantechnol 05 00055 g014
Figure 15. MRT of the surfaces during the numerical simulation.
Cleantechnol 05 00055 g015
Figure 16. PMV during the numerical simulation.
Cleantechnol 05 00055 g016
Figure 17. Total transmitted solar radiation. (a) Percentage of transmitted solar radiation in the different sections as a function of time in the greenhouse. (b) Total transmitted solar radiation in the different sections as a function of time in the greenhouse.
Cleantechnol 05 00055 g017
Figure 18. South-east view of the three-dimensional passive building with a trajectory of the UAV in red color; (a) represents the UAV backward trajectory and (b) represents the UAV forward trajectory.
Cleantechnol 05 00055 g018
Figure 19. Surface temperature measurement locations considering the floor, lateral walls, and ceiling surface temperature as representative for the MRT.
Cleantechnol 05 00055 g019
Figure 20. Evolution of PMV in spaces 2 (a), 3 (b), 4 (c), 5 (d), and 6 (e) with BTS and UAV DS, according to approach B and four different methods.
Cleantechnol 05 00055 g020aCleantechnol 05 00055 g020b
Disclaimer/Publisher’s Note: The statements, opinions and data contained in all publications are solely those of the individual author(s) and contributor(s) and not of MDPI and/or the editor(s). MDPI and/or the editor(s) disclaim responsibility for any injury to people or property resulting from any ideas, methods, instructions or products referred to in the content.

