
Assessment of Quality of Fresh Concrete Delivered at Varying Temperatures


1
Department of Civil & Environmental Engineering and Construction, University of Nevada Las Vegas, Las Vegas, NV 89154, USA
2
Operation Division, SYSTRA Korea, Seoul 06220, Korea
*
Author to whom correspondence should be addressed.
CivilEng 2022, 3(1), 135-146; https://doi.org/10.3390/civileng3010009
Submission received: 21 December 2021
/
Revised: 7 February 2022
/
Accepted: 8 February 2022
/
Published: 12 February 2022
(This article belongs to the Special Issue Connections in Concrete Volume 2)
Abstract
:Concrete is increasingly utilized in the construction field in Southern Nevada. This area has an arid and hot summer and freezing cold winter conditions. These extreme conditions affect the properties of fresh concrete, which can cause cracking. Hot weather conditions may adversely affect both fresh and hardened concrete properties. Even though practices can minimize the detrimental effects, good quality control of fresh concrete, from mixing to finishing, is crucial under hot weather conditions. The objective of the present study is to evaluate the seasonal consistency of concrete quality, considering strength and slump properties. Another objective of this research is to determine the relationship between the seasonal air temperature variations and those of freshly batched concrete. Results indicate that strength and slump remain constant with varying air and concrete temperatures during pour. Additionally, during the hot season (air temperature above 27 °C (80 °F)), fresh concrete’s temperature is lower than the air’s temperature, in contrast during the cold season (air temperature below 16 °C (60 °F)), fresh concrete’s temperature is higher than the air’s temperature. Fresh concrete temperature and air temperature are similar in the range of 60 to 80 °F. Therefore, to limit the use of additional water or admixtures it is recommended to pour concrete when the air temperature is in the range of 16° and 27 °C (60 to 80 °F).
1. Introduction
These extreme conditions affect the properties of fresh concrete, which can cause cracking. In the case of hot weather, ACI 305 [1] recommendations and ASTM C1064 [2] procedure for fresh concrete may be followed.
1.1. Main Issues Due to Hot Weather Concreting
Fresh concrete’s properties may be affected by hot weather during mixing, placing, and curing. High ambient temperatures may cause an increase in the rates of cement hydration and moisture evaporation from fresh concrete [3,4]. As a consequence, higher ambient temperatures may generate increases in water demand and slump loss rates, which implies more added water at the job site, along with a rate of setting that makes the fresh concrete difficult to finish and enhances the formation of cold joints, as well as the tendency for plastic-shrinkage [4,5]. Additionally, controlling entrained air content may be complex due to rising air temperature (ACI 305R-99 1.3.1). Hot weather concreting also has a major influence on hardened concrete properties. Indeed, Schindler and McCullough analyzed long-term performance data using the Texas Rigid Pavement (TRP) database to study the effect of elevated concrete temperature during placement on the performance of continuously reinforced concrete (CRC) pavements. It showed that for sections placed under an air temperature that exceeded 32.0 °C (90 °F), more than 36% of all failures occurred [6,7].
Therefore, control of the air temperature at placement in hot weather conditions is crucial. In addition, to obtain the same slump, more water is required in hot weather concreting. The additional water needed to maintain an appropriate slump increases the water-to-cementitious material ratio, assuming that the cementitious material amount does not proportionally increase, therefore, the strength decreases. Considering a compressive strength of 34.5 MPa (5000 psi), increasing the concrete temperature from 20 °C (68 °F) to 30 °C (86 °F) induces a loss in strength of about 2.5 MPa (360 psi) if the only realized adjustment consists in increasing the water content to maintain the slump [7]. Another study demonstrated that an average change of 5 MPa (725 psi) with an increase in the exposure temperature from 30 °C (86 °F) to 45 °C (113 °F) occurred [8].
Arid climate favors the formation of plastic-shrinkage and drying-shrinkage cracking. Plastic shrinkage occurs when freshly cast concrete’s surface dries and the surface water evaporates rapidly [9]. High concrete temperature and low humidity among other aspects, may provoke surface water’s rapid evaporation. The bleeding rate is mainly influenced by the concrete mixture’s ingredients and their proportions, as well as the depth of the structure and the type of consolidation and finishing. The risk of drying shrinkage is increased as the water content rises under hot weather concreting conditions [10]. Rapid evaporation may also provoke the crusting of a slab’s upper surface. The slab’s surface tends to not be flat, but rippled. The crusting process happens when the surface water evaporates faster than the bleed water replacement and before the slab has properly set [11]. However, many practices can limit or prevent hot weather concreting issues.
1.2. Main Practices to Prevent and Mitigate Hot Weather Concreting Issues
Concrete temperature can be reduced by decreasing the temperatures of its ingredients. Ice can be included in the mixing water to absorb heat by melting. Additionally, liquid nitrogen can be injected into the mixer to cool the mixed concrete [11]. Since aggregates represent the greatest proportion in concrete, concrete temperatures can be reduced through the aggregates. Hence, keeping aggregates as cool as possible is a way to reduce the concrete’s temperature during hot weather. In the case of reinforced concrete, although the ACI recommendations for hot-weather concreting are followed, a significant increase in concrete temperature due to high temperature reinforcing bars may cause plastic-shrinkage cracking [12]. Another dominant parameter is the concreting time. To minimize delivery times, concrete should be delivered when road traffic is fluid. In addition, the placement and finishing time of fresh concrete can be reduced using a consistency of fresh concrete that enables rapid placement and effective consolidation [13,14].
Traditionally, fly ash and ground granulated blast-furnace slag are supplementary cementitious materials that can be used as a partial cement replacement to reduce the settling rates, early strength gains, and slump loss, which are high under hot weather conditions [15]. Recent studies have focused on new methods and different additives such as Ultra-fine palm oil fuel ash [16] and Nano cotton stalk and palm leaf ashes [17] to improve the fresh and recycled concrete properties and curing procedure as well as concrete resistance against chloride [18]. Chemical admixtures, on the other hand, are commonly used under hot weather conditions. Retarding admixtures that meet the Type D requirements of ASTM C 494, are water-reducers, which have a set-retarding property. As concrete’s temperature increases, this chemical admixture reduces increased water demand. [19].
An efficient way to limit detrimental effects due to hot weather is to place concrete the temperature is favorable. Based on the ACI 305.1-06 “Specification for Hot Weather Concreting” limits the maximum allowable fresh concrete temperature to 35 °C (95 °F), [20]. According to Mindess et al., an optimum concrete temperature may be in the range of 10 to 15 °C (50 to 60 °F). However, under hot weather, such temperatures are exceeded, so a maximum for concrete temperatures may be 30 to 33 °C (85 to 92 °F). In many cases of hot weather concreting, admixtures are used, and the maximum concrete temperatures suggested at placement usually do not take into consideration their use [21]. Other additives such as shrinkage reducing admixture and expansive admixture could be used to reduce the amount of shrinkage crack in concrete slabs [22]. Moreover, the control of cracking due to plastic-shrinkage or thermal shrinkage is realized by using proper joints, increasing reinforcement (steel or fibers) amounts, limiting concrete temperatures and hydration heat, increasing form-stripping time, and using adapted chemical and mineral in appropriate proportions admixtures [23,24].
The objectives of the present study are to evaluate the seasonal consistency of concrete quality in Southern Nevada, considering the strength and slump properties, as well as to assess the relationship of the seasonal air temperature variations to those of fresh concrete batched in this area. Southern Nevada has an arid hot summer and cold winter and these extreme weather conditions adversely affect both fresh and hardened concrete properties. Concrete properties were evaluated in various air temperature conditions and the optimum air temperature range to pour fresh concrete is recommended.
2. Methodology and Data Collection
2.1. Methodology
For the purpose of evaluating the seasonal consistency of concrete quality in Southern Nevada, the influence of the air and fresh concrete temperatures on the compressive strength and slump for various projects was studied. Moreover, the influence of air temperature on the temperature of fresh concrete on site, is assessed in this study. Field test conditions, such as ambient and concrete temperatures (ASTM C1064), sample date, water added on site (ASTM C1602), and field test results, notably slump (ASTM C143), were reported. In the present study, the air temperature and the concrete temperature recorded in the field were assumed to have been taken when concrete was poured on site. Hence, the temperature of concrete was assumed to be the temperature of the fresh concrete during pour. In order to conduct this research, the following information was obtained and analyzed:
- Design compressive strength (psi);
- Actual compressive strength f’c after testing of each sample; the average for each age is made afterwards (psi);
- Age of each sample testing (days);
- Fresh concrete temperature at the time of pouring (°F);
- Air temperature at the time of pouring (°F);
- Slump determined on site (in.);
- Water added on site (gal);
- Number of tested concrete cylinders;
- Diameters of tested concrete cylinders (in.).
The influence of air and fresh concrete temperatures on compressive strength and slump were analyzed and presented. At a given design strength, the compressive strength was plotted against air temperature, concrete temperature, and slump at each testing age. The slump was plotted against air and concrete temperatures, regardless of the testing age. In addition, the ratio of compressive strength f’c to design strength was plotted against slump and air and concrete temperatures at different testing ages, both with respect to and irrespective of the design strength. Indeed, a ratio was realized to normalize the results, that is to assess the effect of air and concrete temperatures on concrete strength regardless of the design strength. Additionally, a distinction of design strengths will be realized on the graphs to examine whether all data follow the same trend, regardless of the design strength. To assess the relationship of seasonal air temperature variations to that of the fresh concrete, the concrete temperature during pour was plotted against the air temperature during pour.
2.2. Raw Data Collection
In total, in this research, 380 raw data were collected from 45 various projects. The predominant design strengths in the records were 31 MPa (4500 psi) followed by 21 MPa (3000 psi). Table 1 presents the number of records corresponding to each design strength. Considering the testing age, regardless of the design strength, the samples were mainly tested at 7 and 28 days. The other testing ages, namely 4, 5, 8, 13, 14, 24, 56, and 105 days, all represent less than 10 records individually.
Table 2 presents the slump test records.
With regard to the above tables, the compressive strength was plotted at design strengths of 21 MPa (3000 psi) and 31 MPa (4500 psi) and at testing ages of 7 days and 28 days against slump and air and concrete temperatures. Similarly, the slump was plotted at design strengths of 21 MPa (3000 psi) and 31 MPa (4500 psi) against air and concrete temperatures. The ratios of compressive strength to design strength were plotted at 7 and 28 days against slump and air and concrete temperatures, both with respect to and irrespective of the design strength. Additionally, the concrete temperature was plotted against the air temperature, considering the testing age, and with respect to and irrespective of the design strength.
3. Analysis and Results
3.1. Compressive Strength
3.1.1. Relation between Compressive Strength and Air Temperature
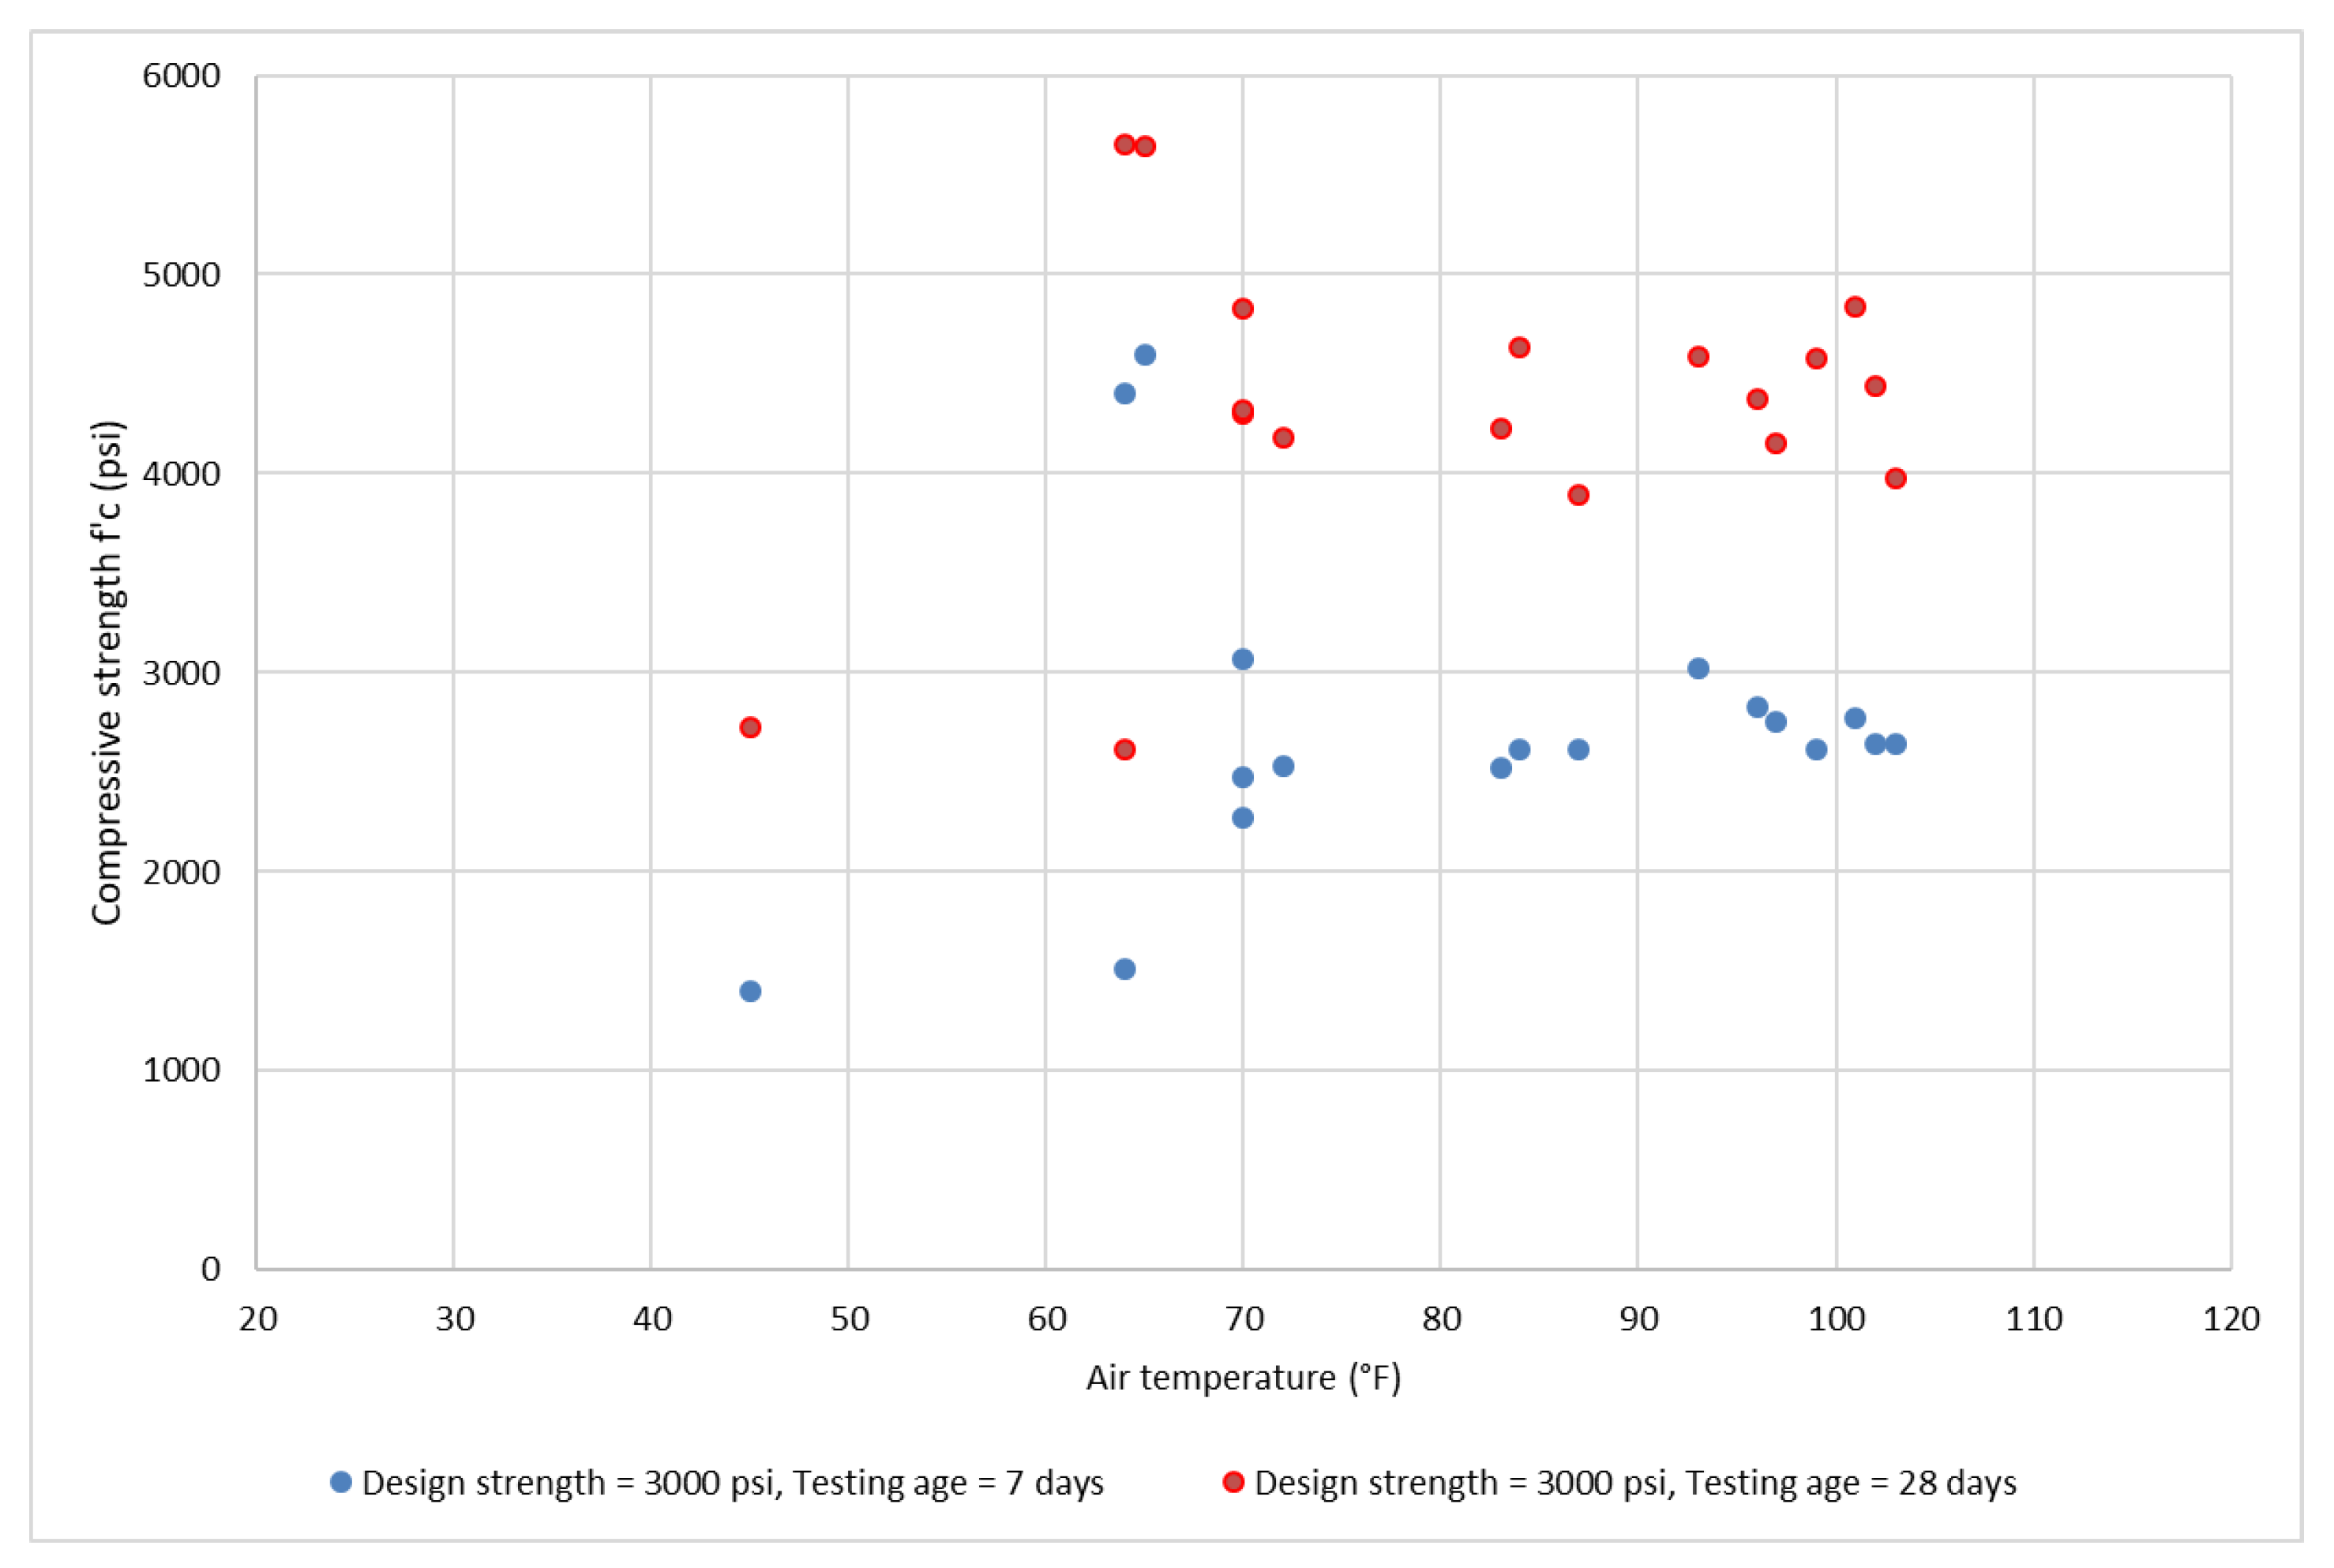
Figure 1 and Figure 2 present the correlation between the compressive strength and air temperature. As shown in Figure 1, for a design strength of 21 MPa (3000 psi), the compressive strength remained rather constant when the air temperature changed. A slight trend can be assumed in this case. Indeed, the compressive strength increased and then became constant when the air temperature was higher than 21 °C (70 °F). The highest compressive strength was obtained at around 18 °C (65 °F) for both 7 days and 28 days specimens, as illustrated in Figure 1.
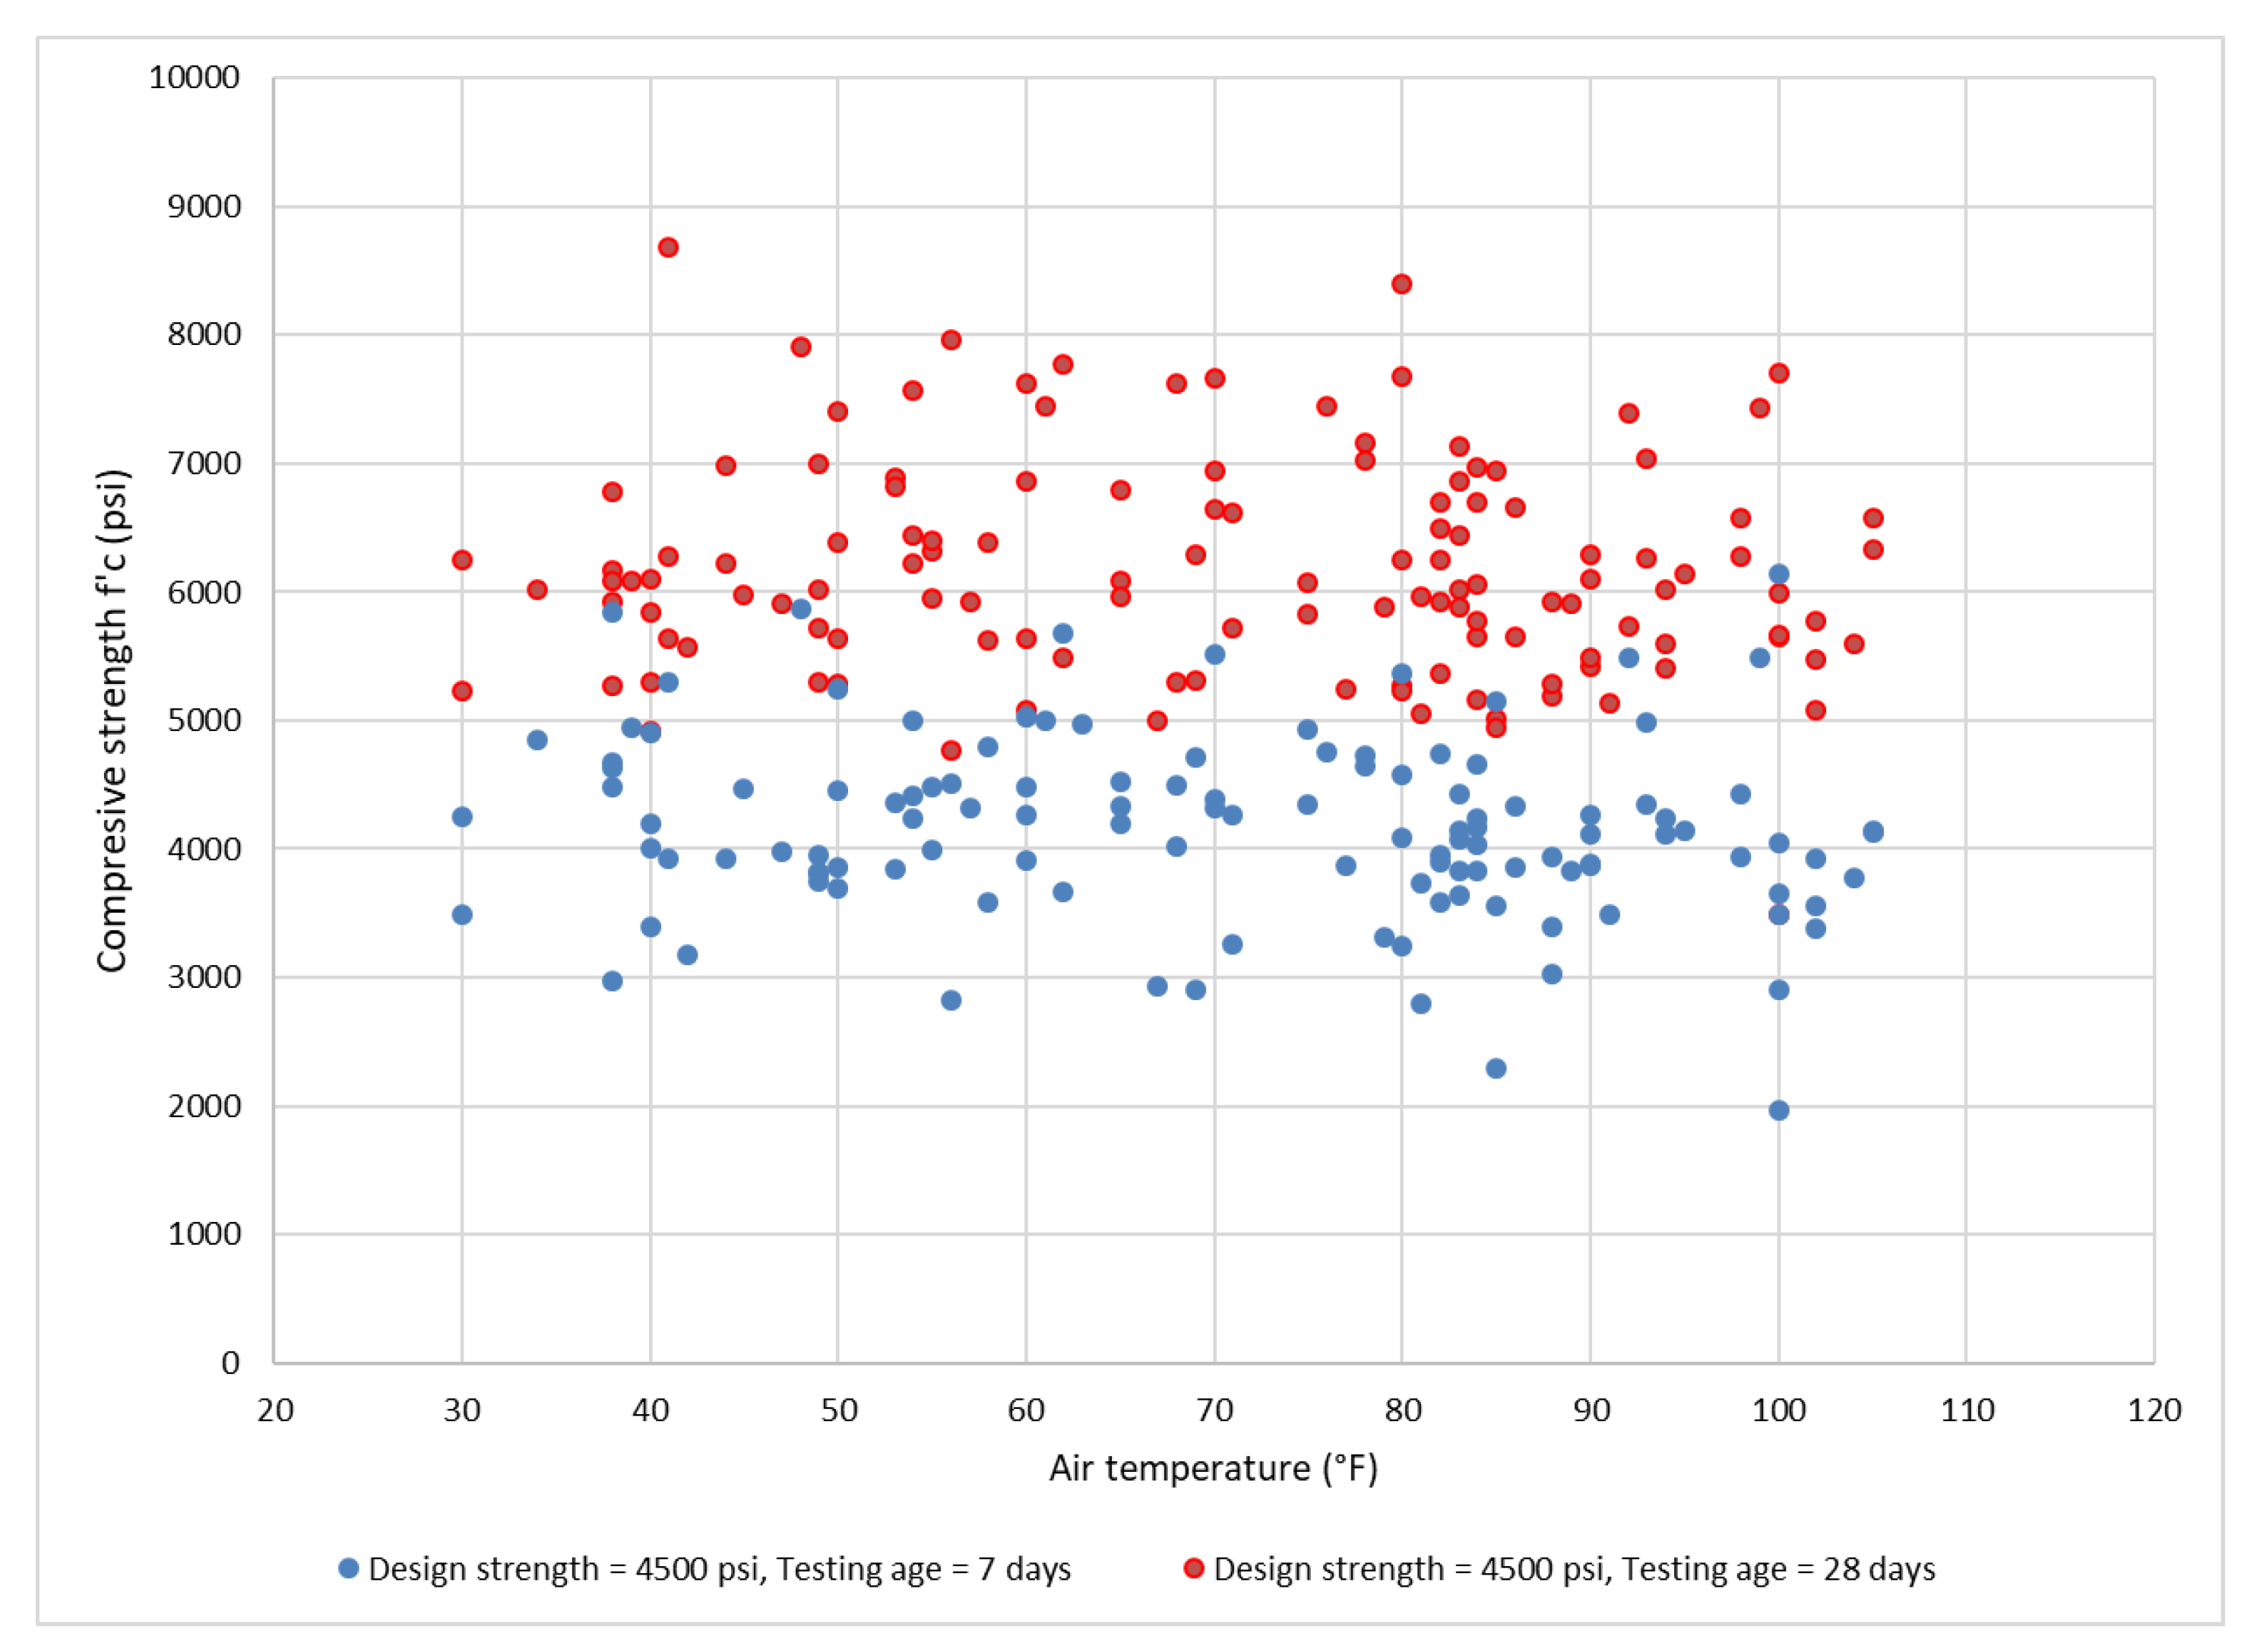
In regards to this relation at a design strength of 31 MPa (4500 psi), there was more data, as illustrated in Figure 2. It can be seen that the compressive strength fluctuated and scattered with the varying air temperature. This trend repeated for both 7 days and 28 days testing ages. It should be noted that although the air temperature reached above 38 °C (100 °F), the obtained strengths were significantly higher than the design strength and all results remained above the acceptable range with regard to local recommendations.
3.1.2. Relation between Compressive Strength and Concrete Temperature
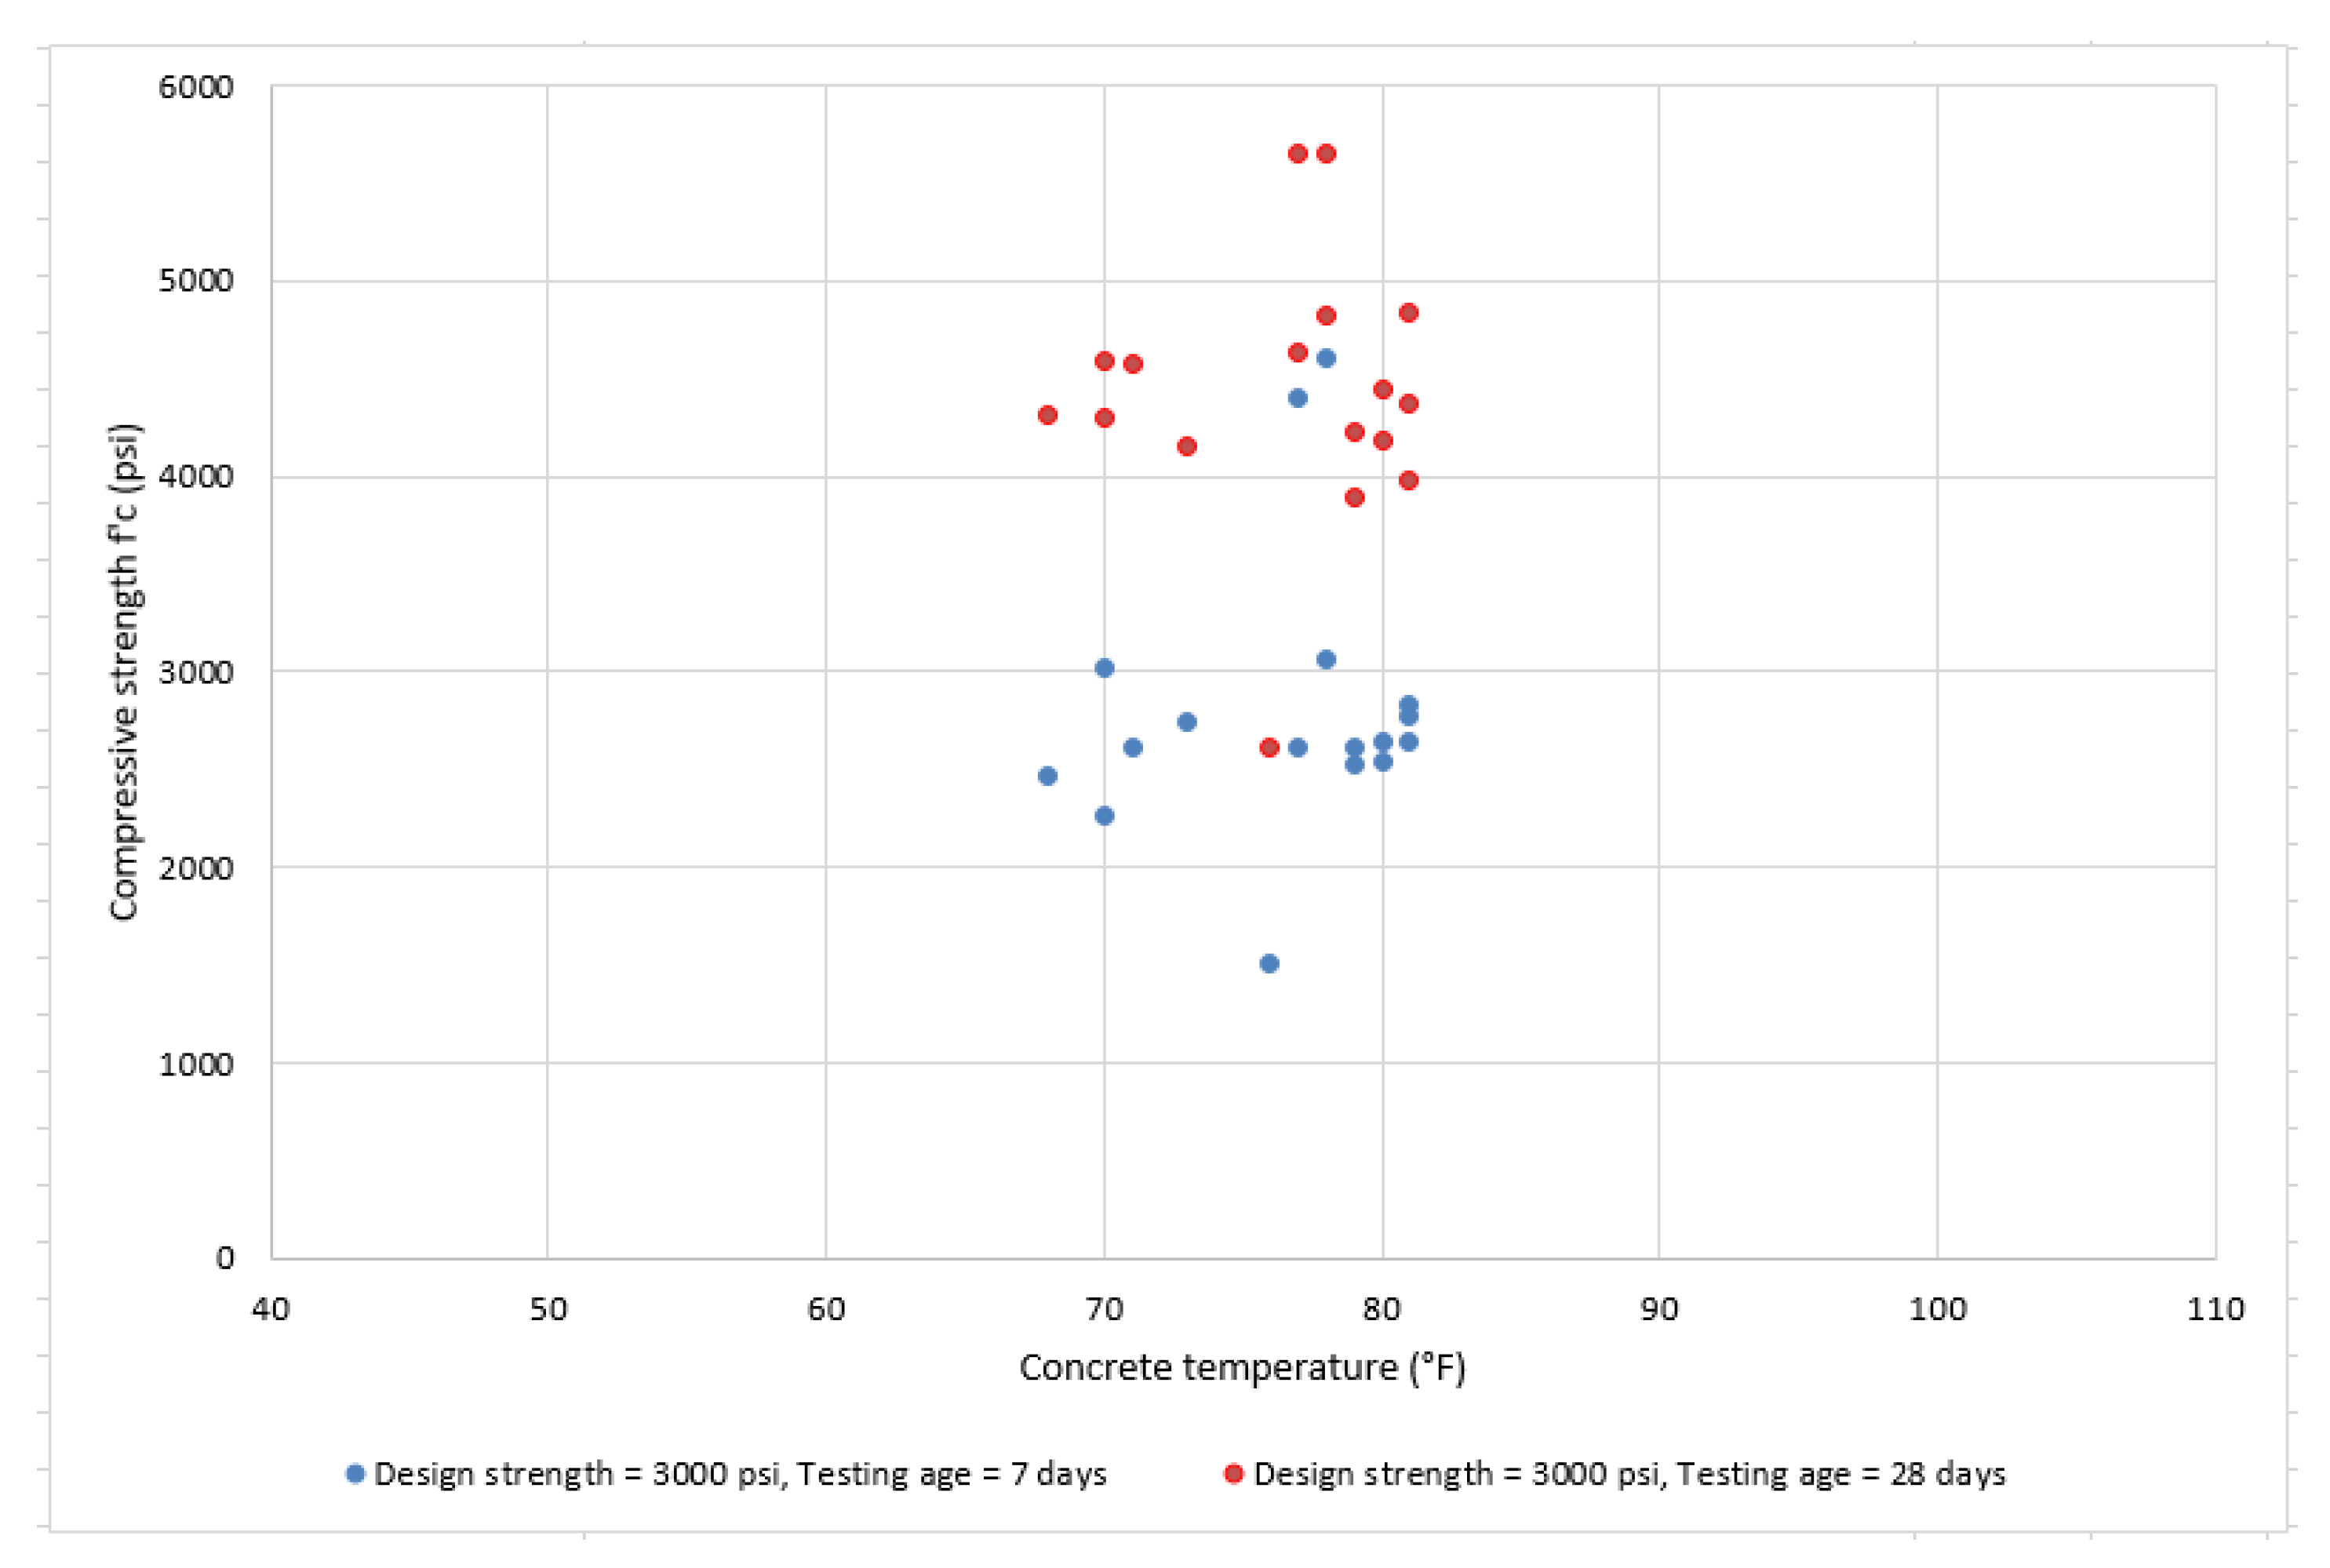
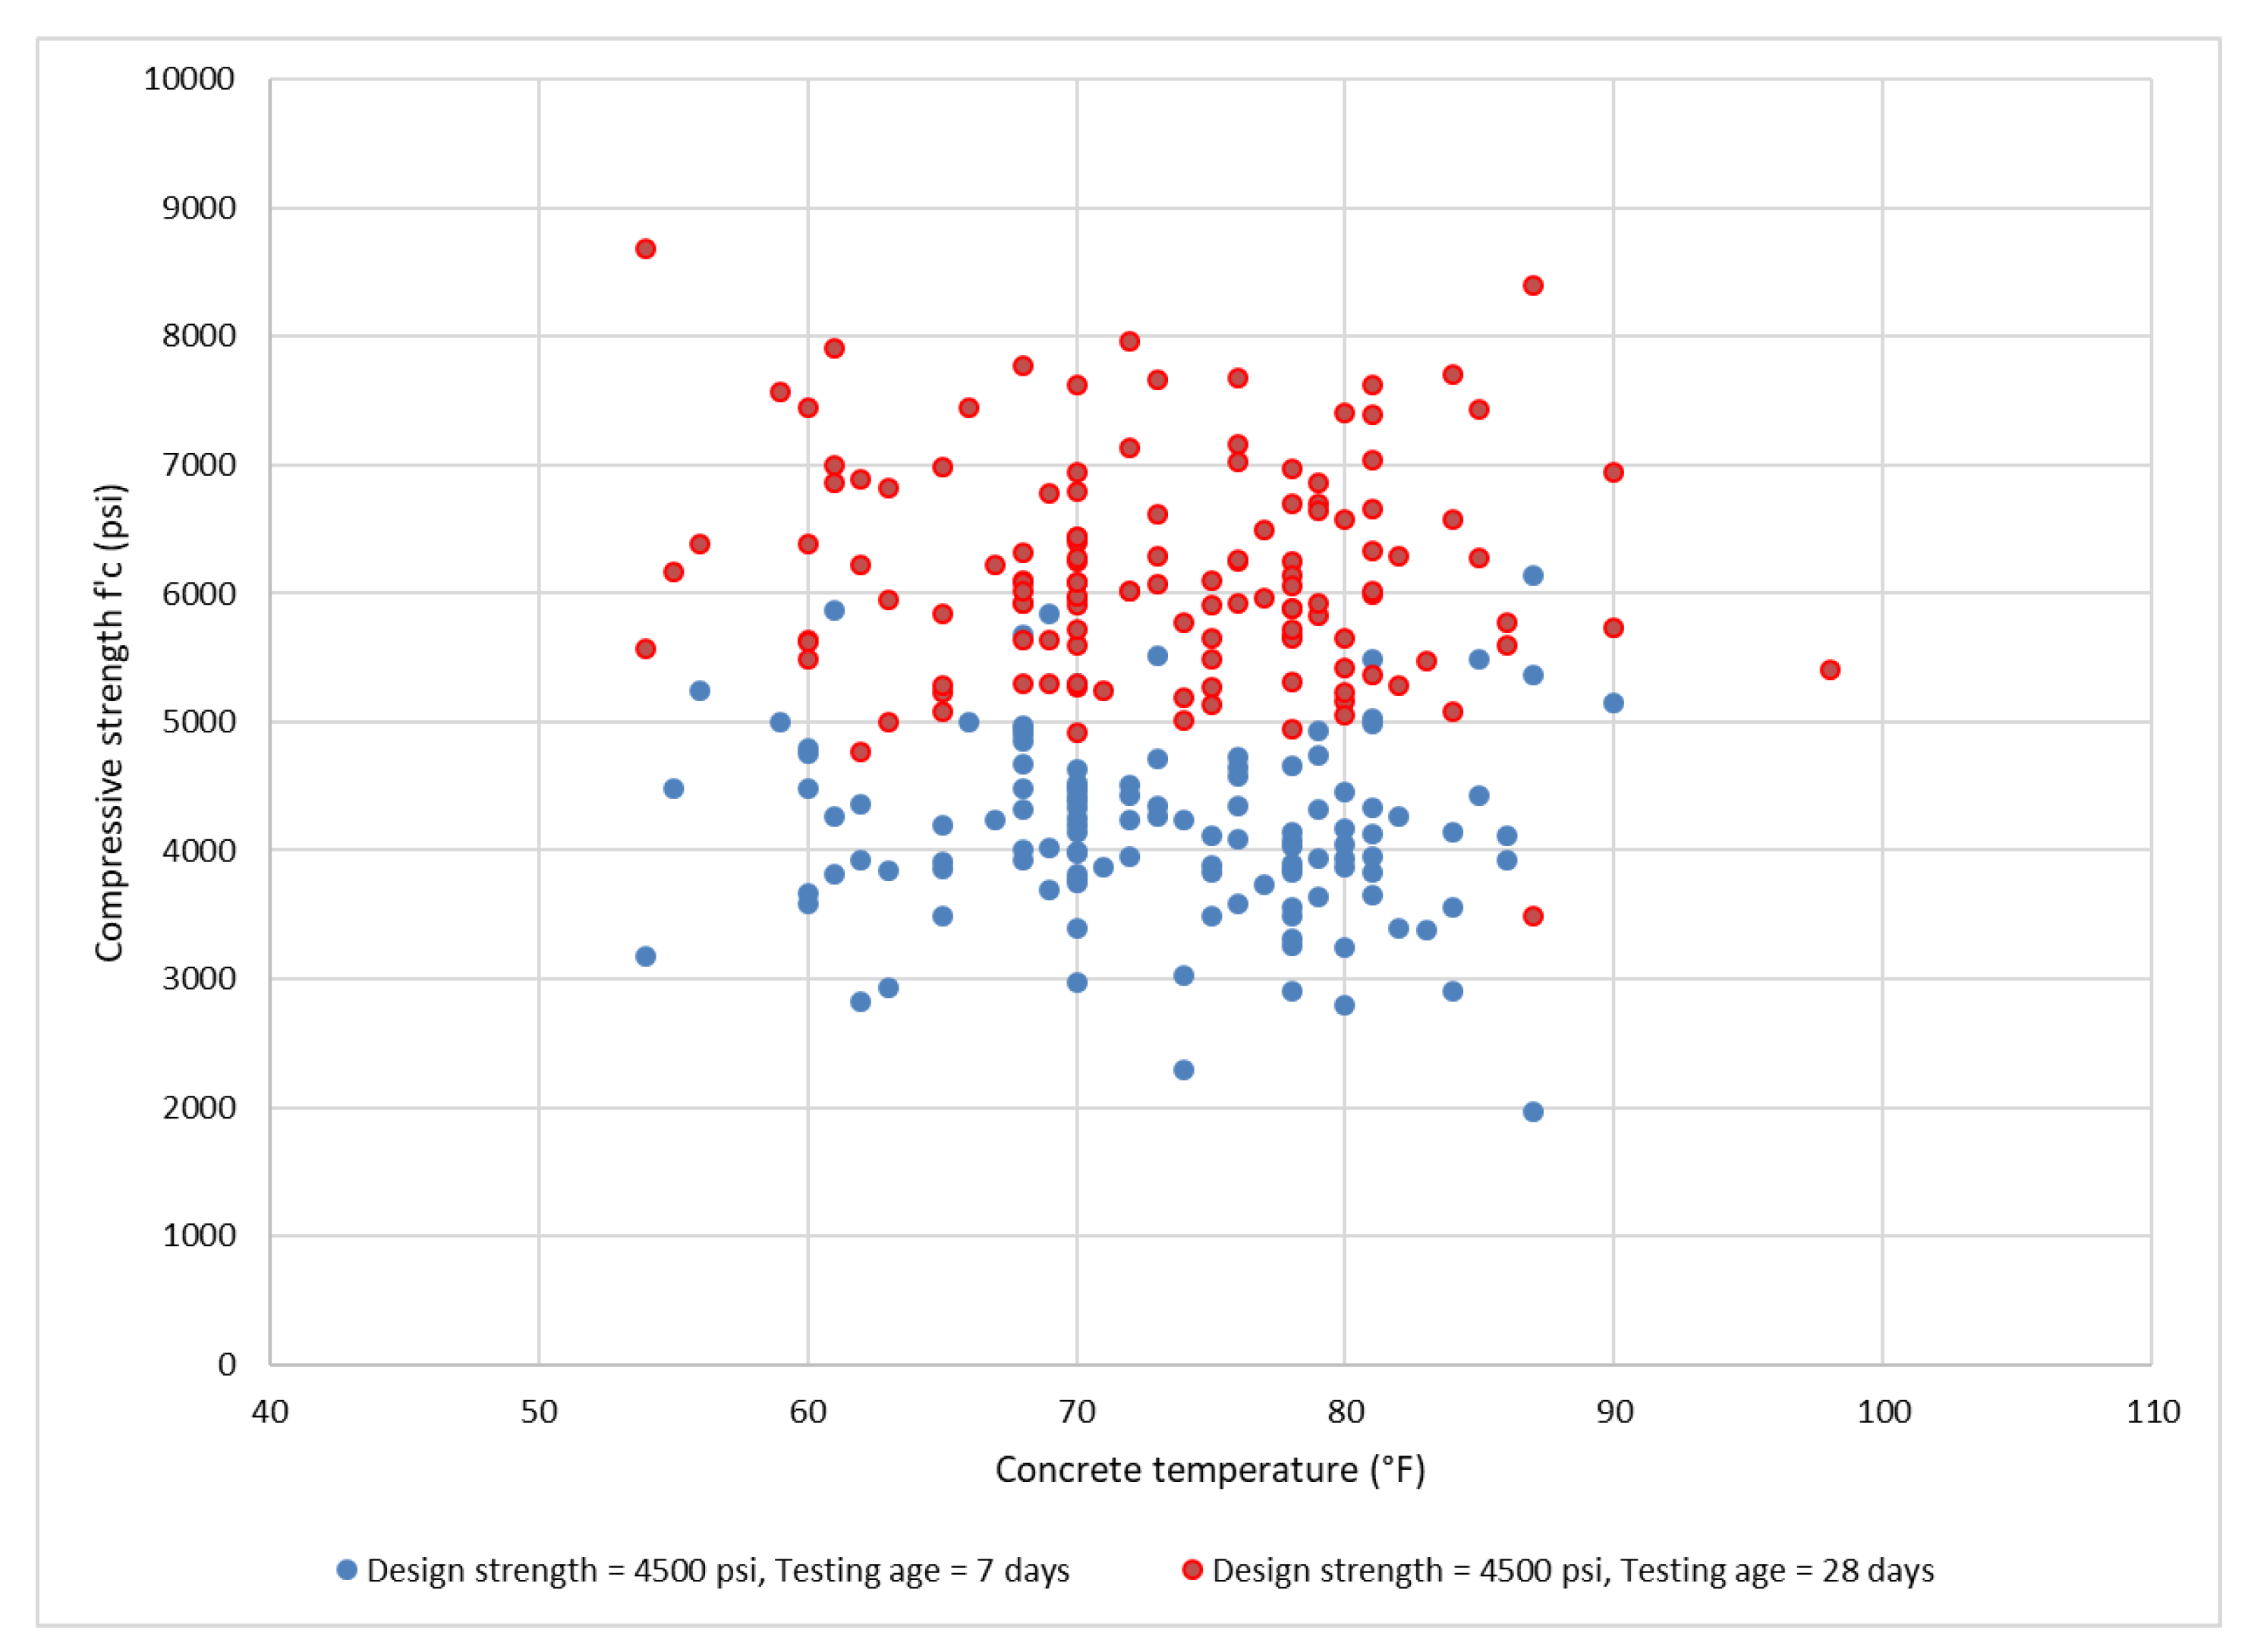
The relationships between the compressive strength and fresh concrete temperature are plotted in Figure 3 and Figure 4. It can be noted that, although the concrete temperature increased or decreased, the compressive strength remained rather constant. This consistency in the results for two different design strengths and at different testing ages shows good quality control of the material supplier transporting concrete from its factory to the work sites.
3.2. Ratio of Compressive Strength to Design Strength
A strength ratio was calculated to normalize the results, or to assess the effect of air and concrete temperatures on strength, regardless of design strength. Nonetheless, a distinction was realized on the design strength graph to check if all data follows the same trend, regardless of the design strength. Hence, the data was both analyzed irrespective of the design strength and with respect to the two predominant design strengths, 21 MPa and 31 MPa (3000 psi and 4500 psi).
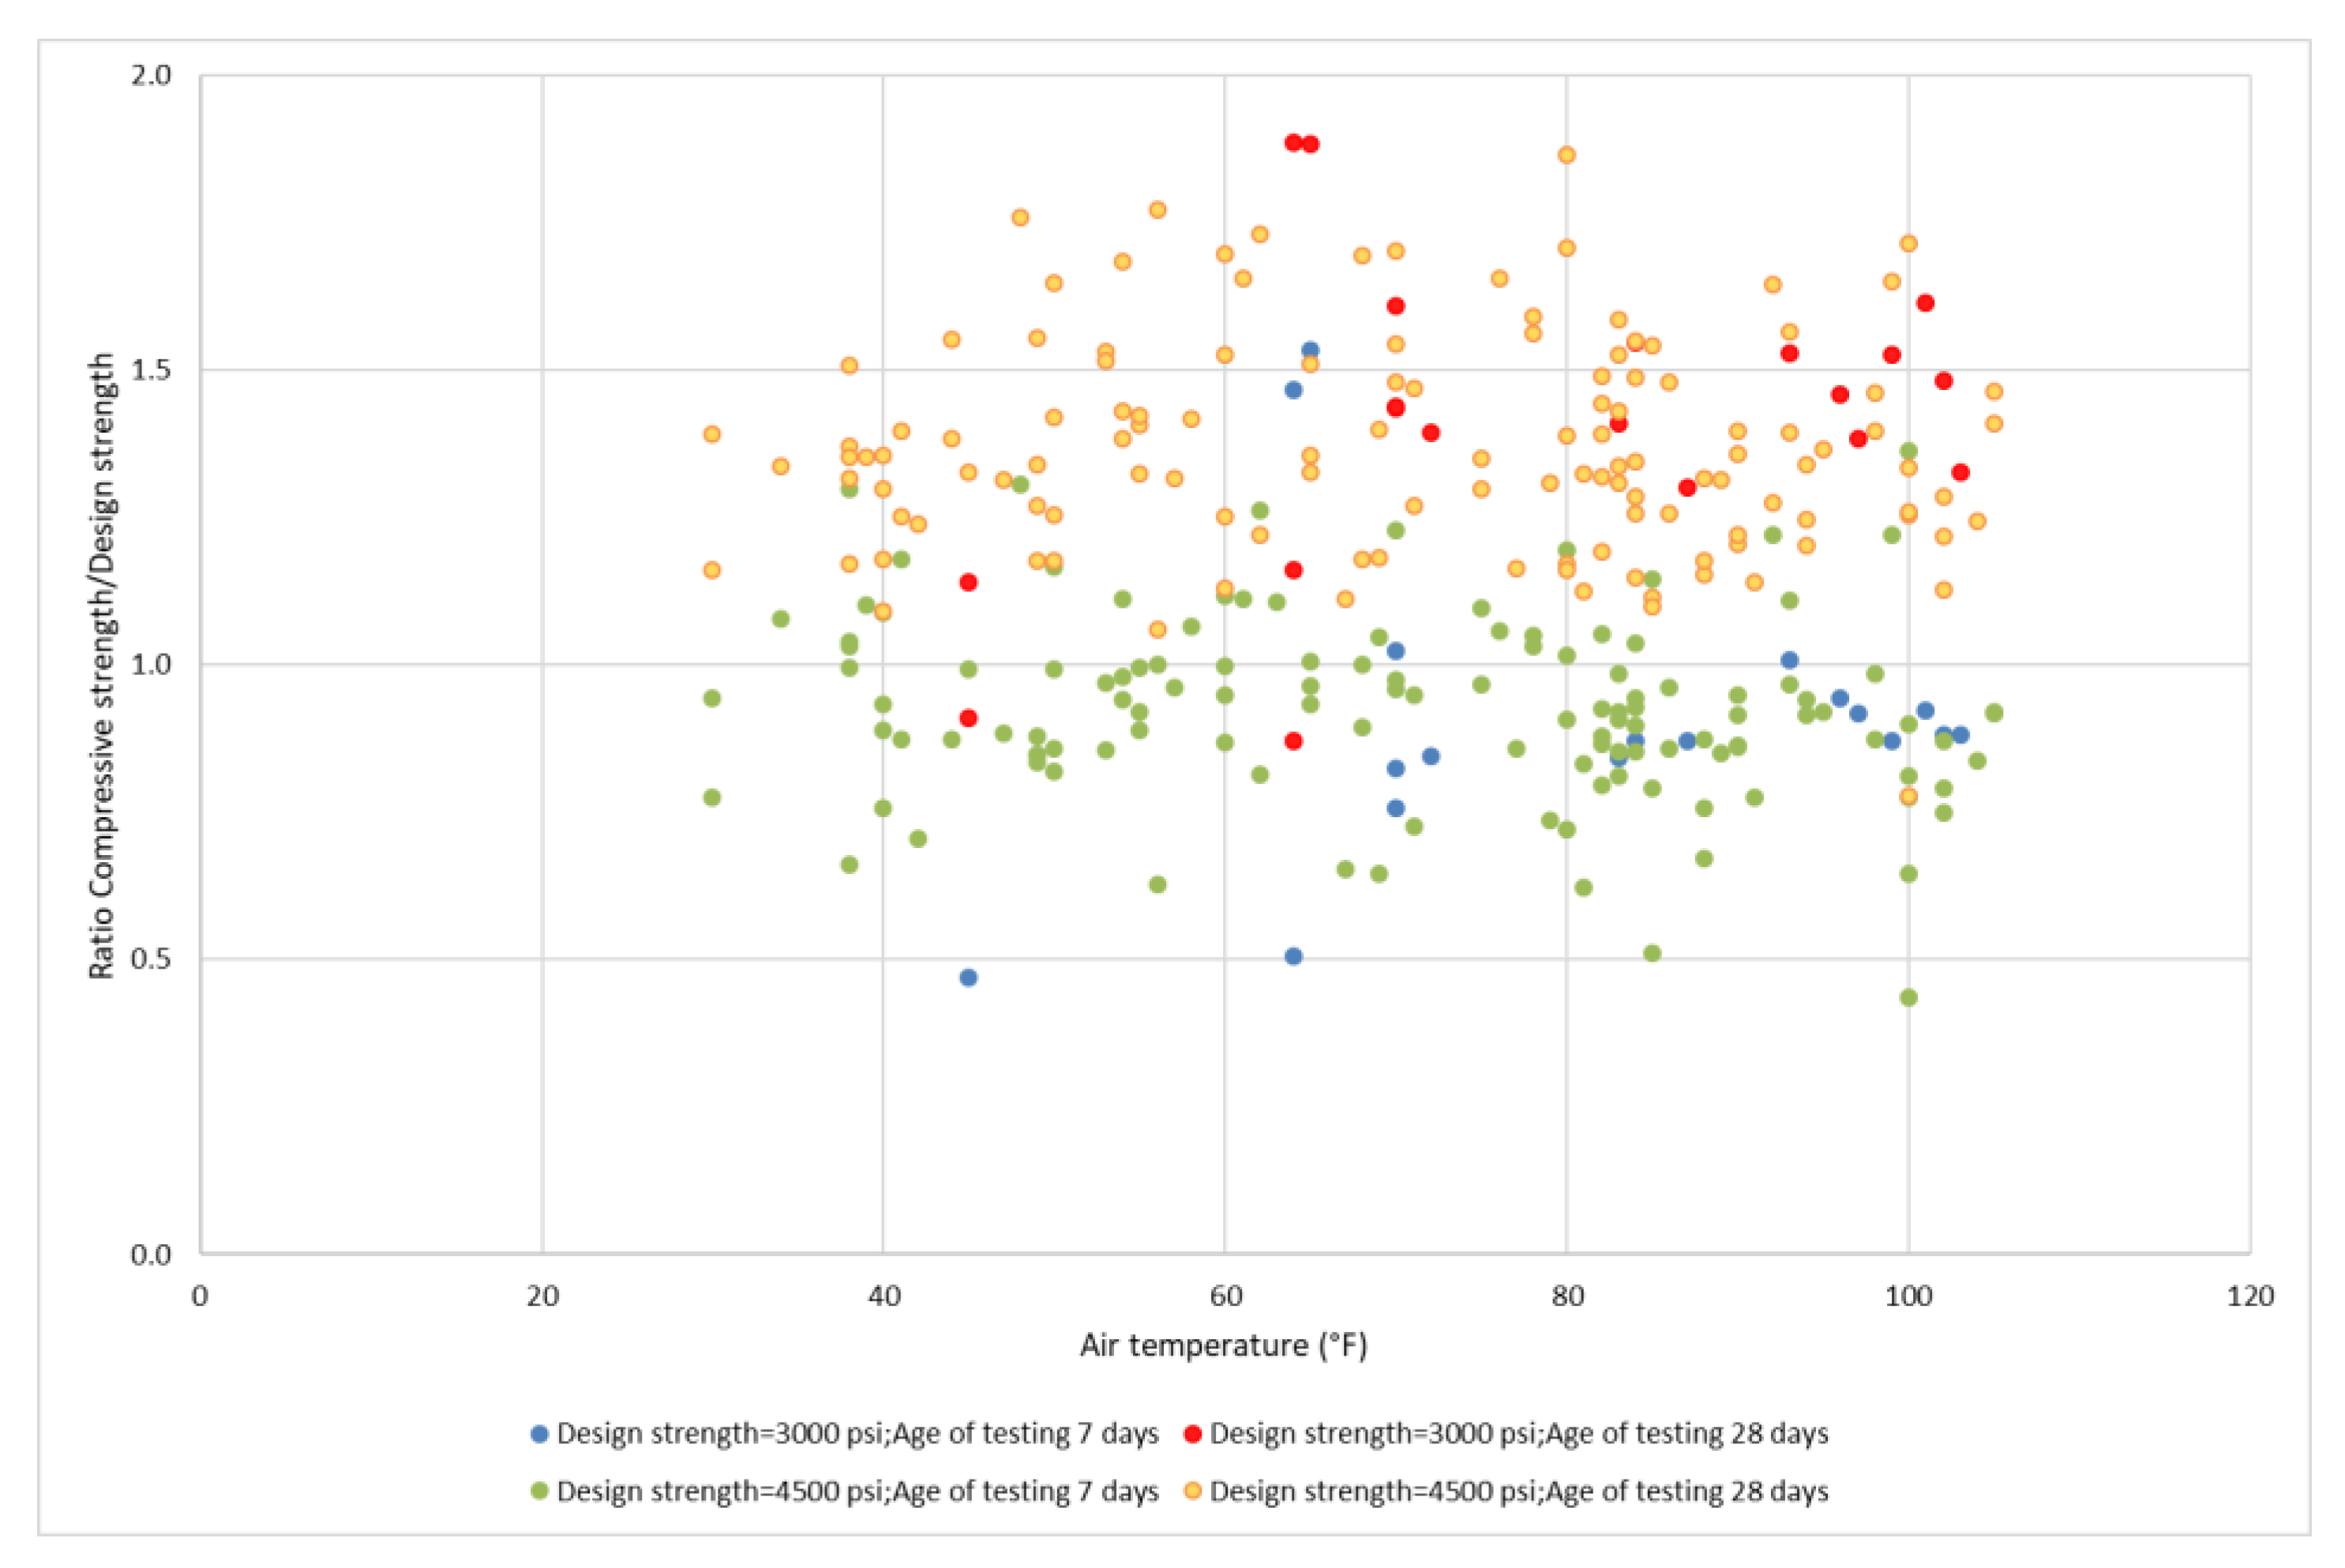
3.2.1. The Relationship between Compressive Strength to Design Strength and Air Temperature
It can be noted from Figure 5 that for any design strengths and testing ages of testing, an identical trend is observed in these graphs. Based on Figure 5, there are some outlined results. Other than that, the ratio fluctuated between 0.5 and 1.5. The ratio of compressive strength to design strength fluctuated but remained rather constant within this range with change in the air temperature. Hence, this ratio may be used to generalize this trend at every design strength. Overall, the air temperature’s effect on the strength of concrete was not significant. Both with respect to and irrespective of design strengths, the ratio of compressive strength to design strength was generally around 1.0 at 7 days and above 1.0 for 28 days specimens.
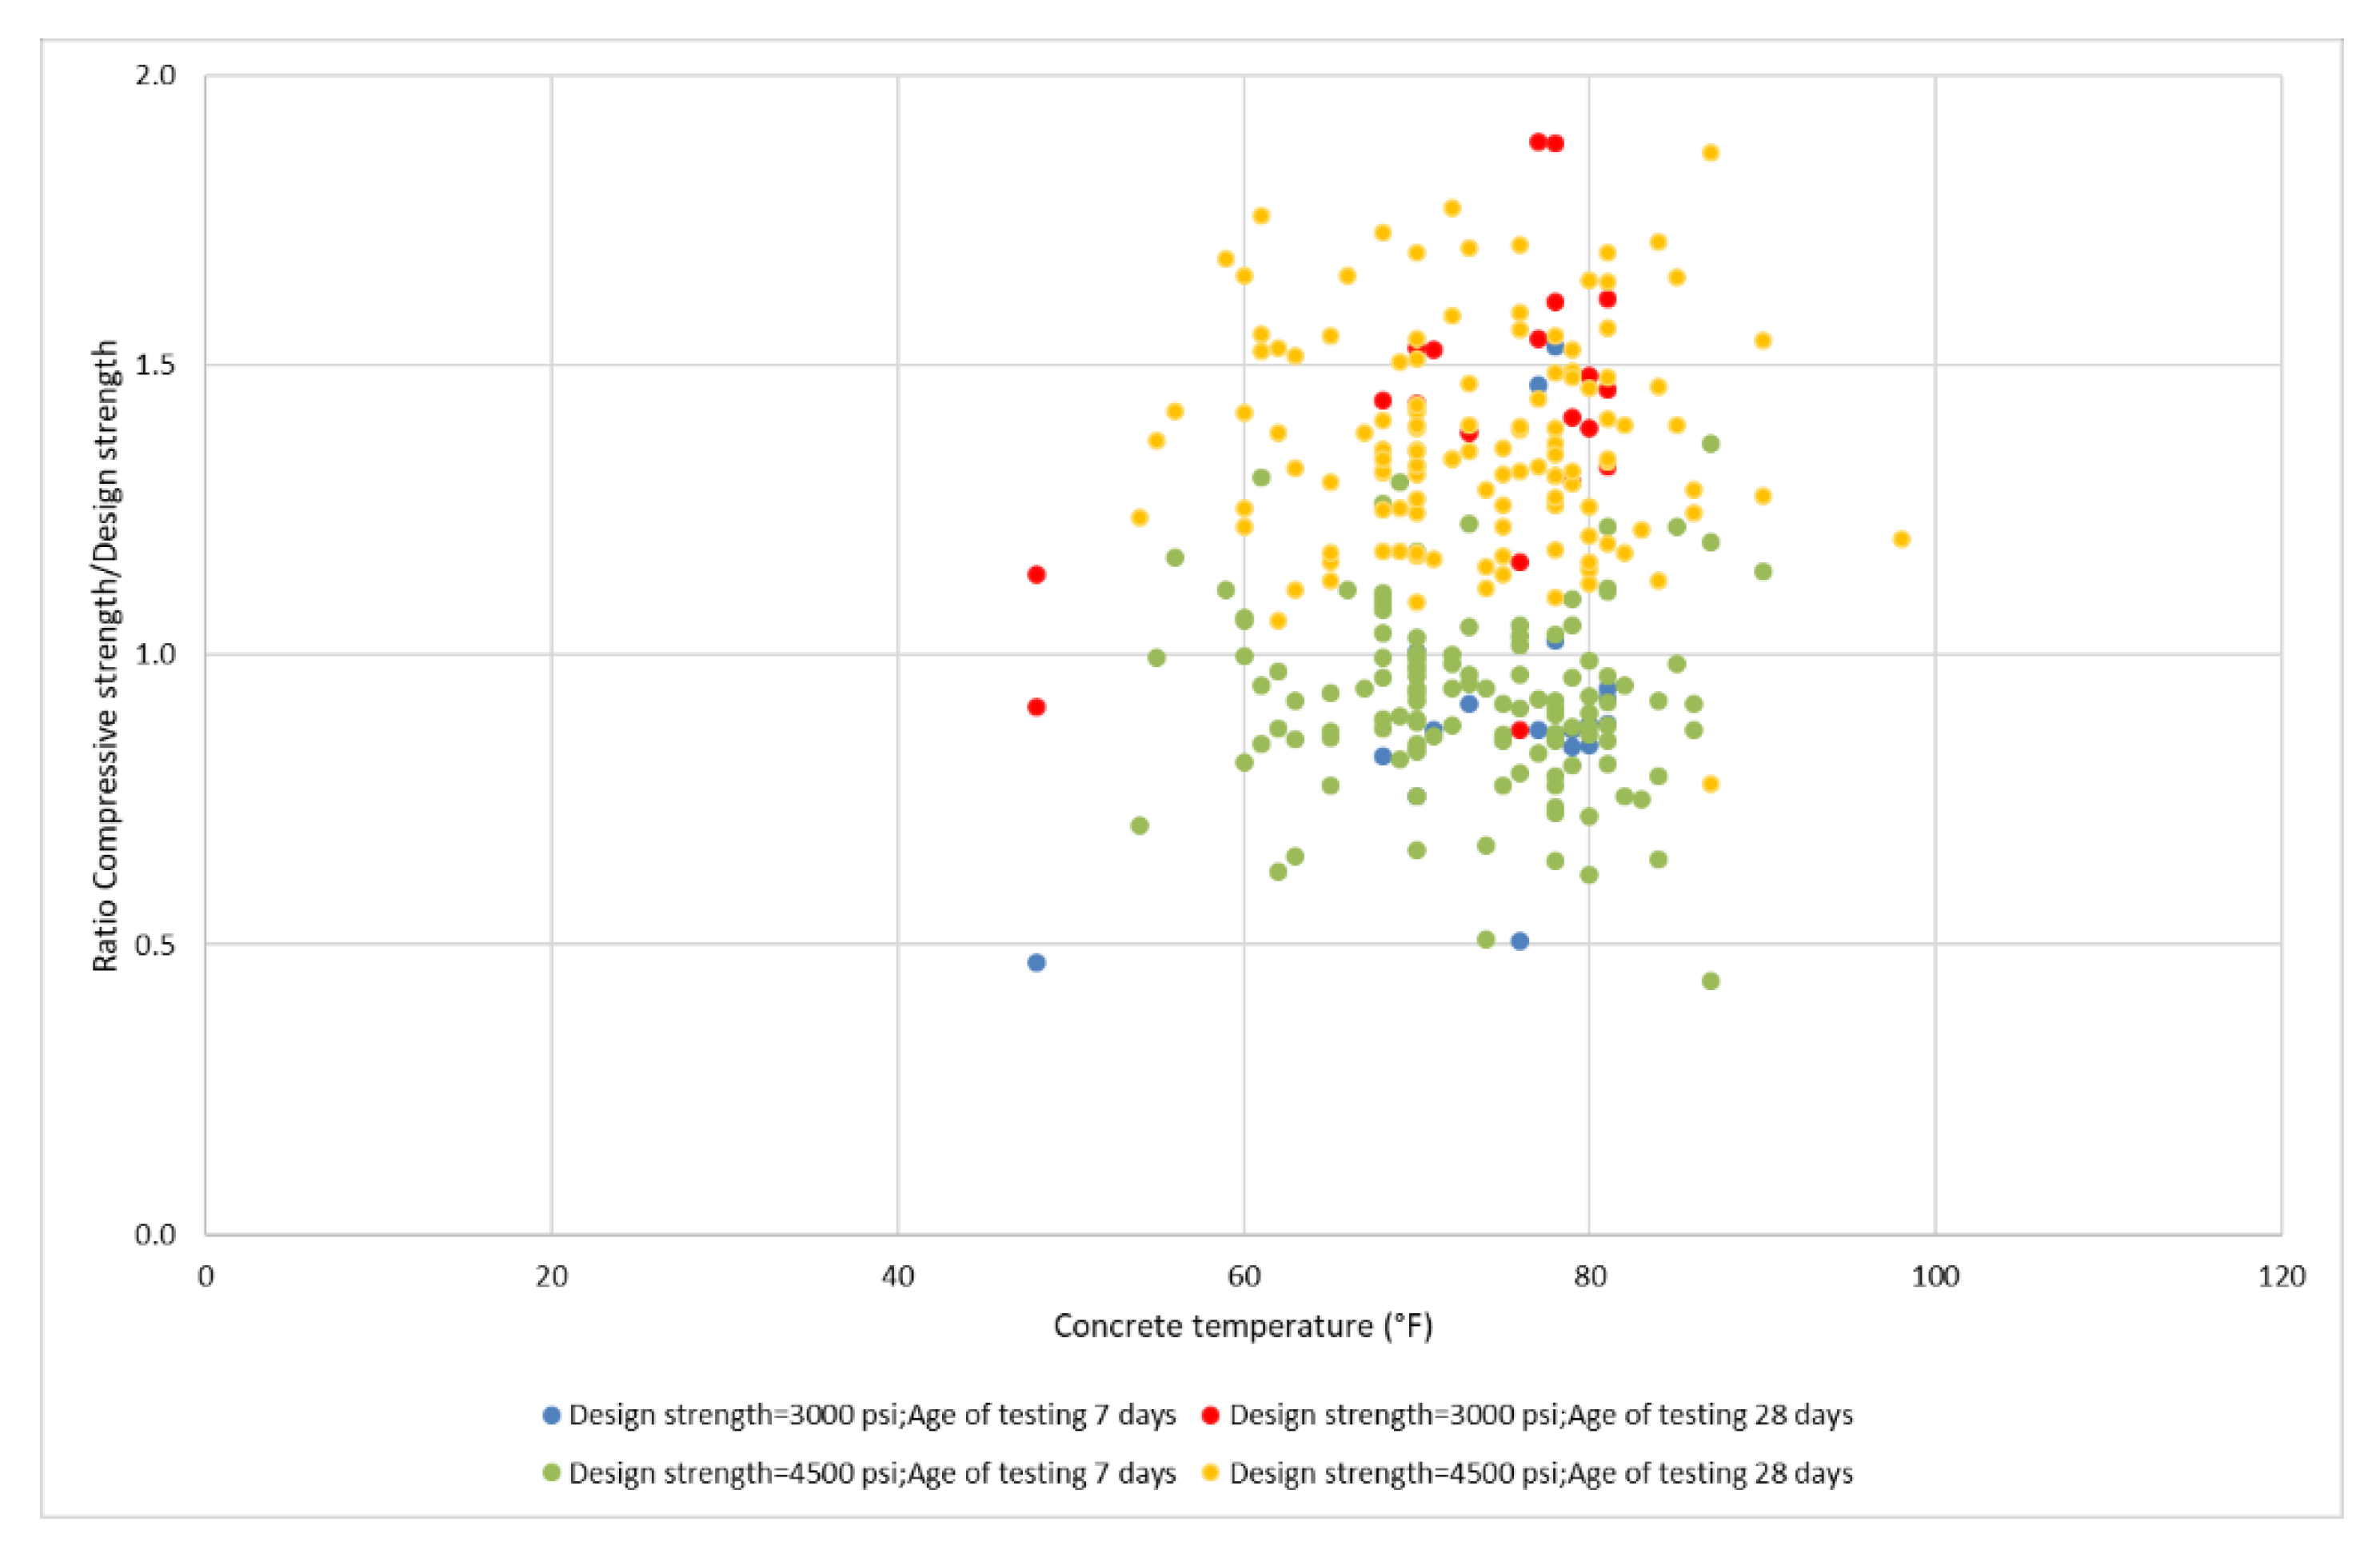
3.2.2. The Relationship between the Ratio of Compressive Strength to Design Strength and Concrete Temperature
Figure 6 indicates a scattered distribution for the compressive strength ratio. Although for the majority of the specimens the compressive strength ratio remains within 0.5 and 2, there are specimens with a ratio which is above 2. This higher ratio presented for 28-days specimens particularly. Figure 6 demonstrates a denser distribution. The compressive strength ratio was concentrated within 0.5 and 1.75 regardless of the air temperature variations.
3.3. Slump
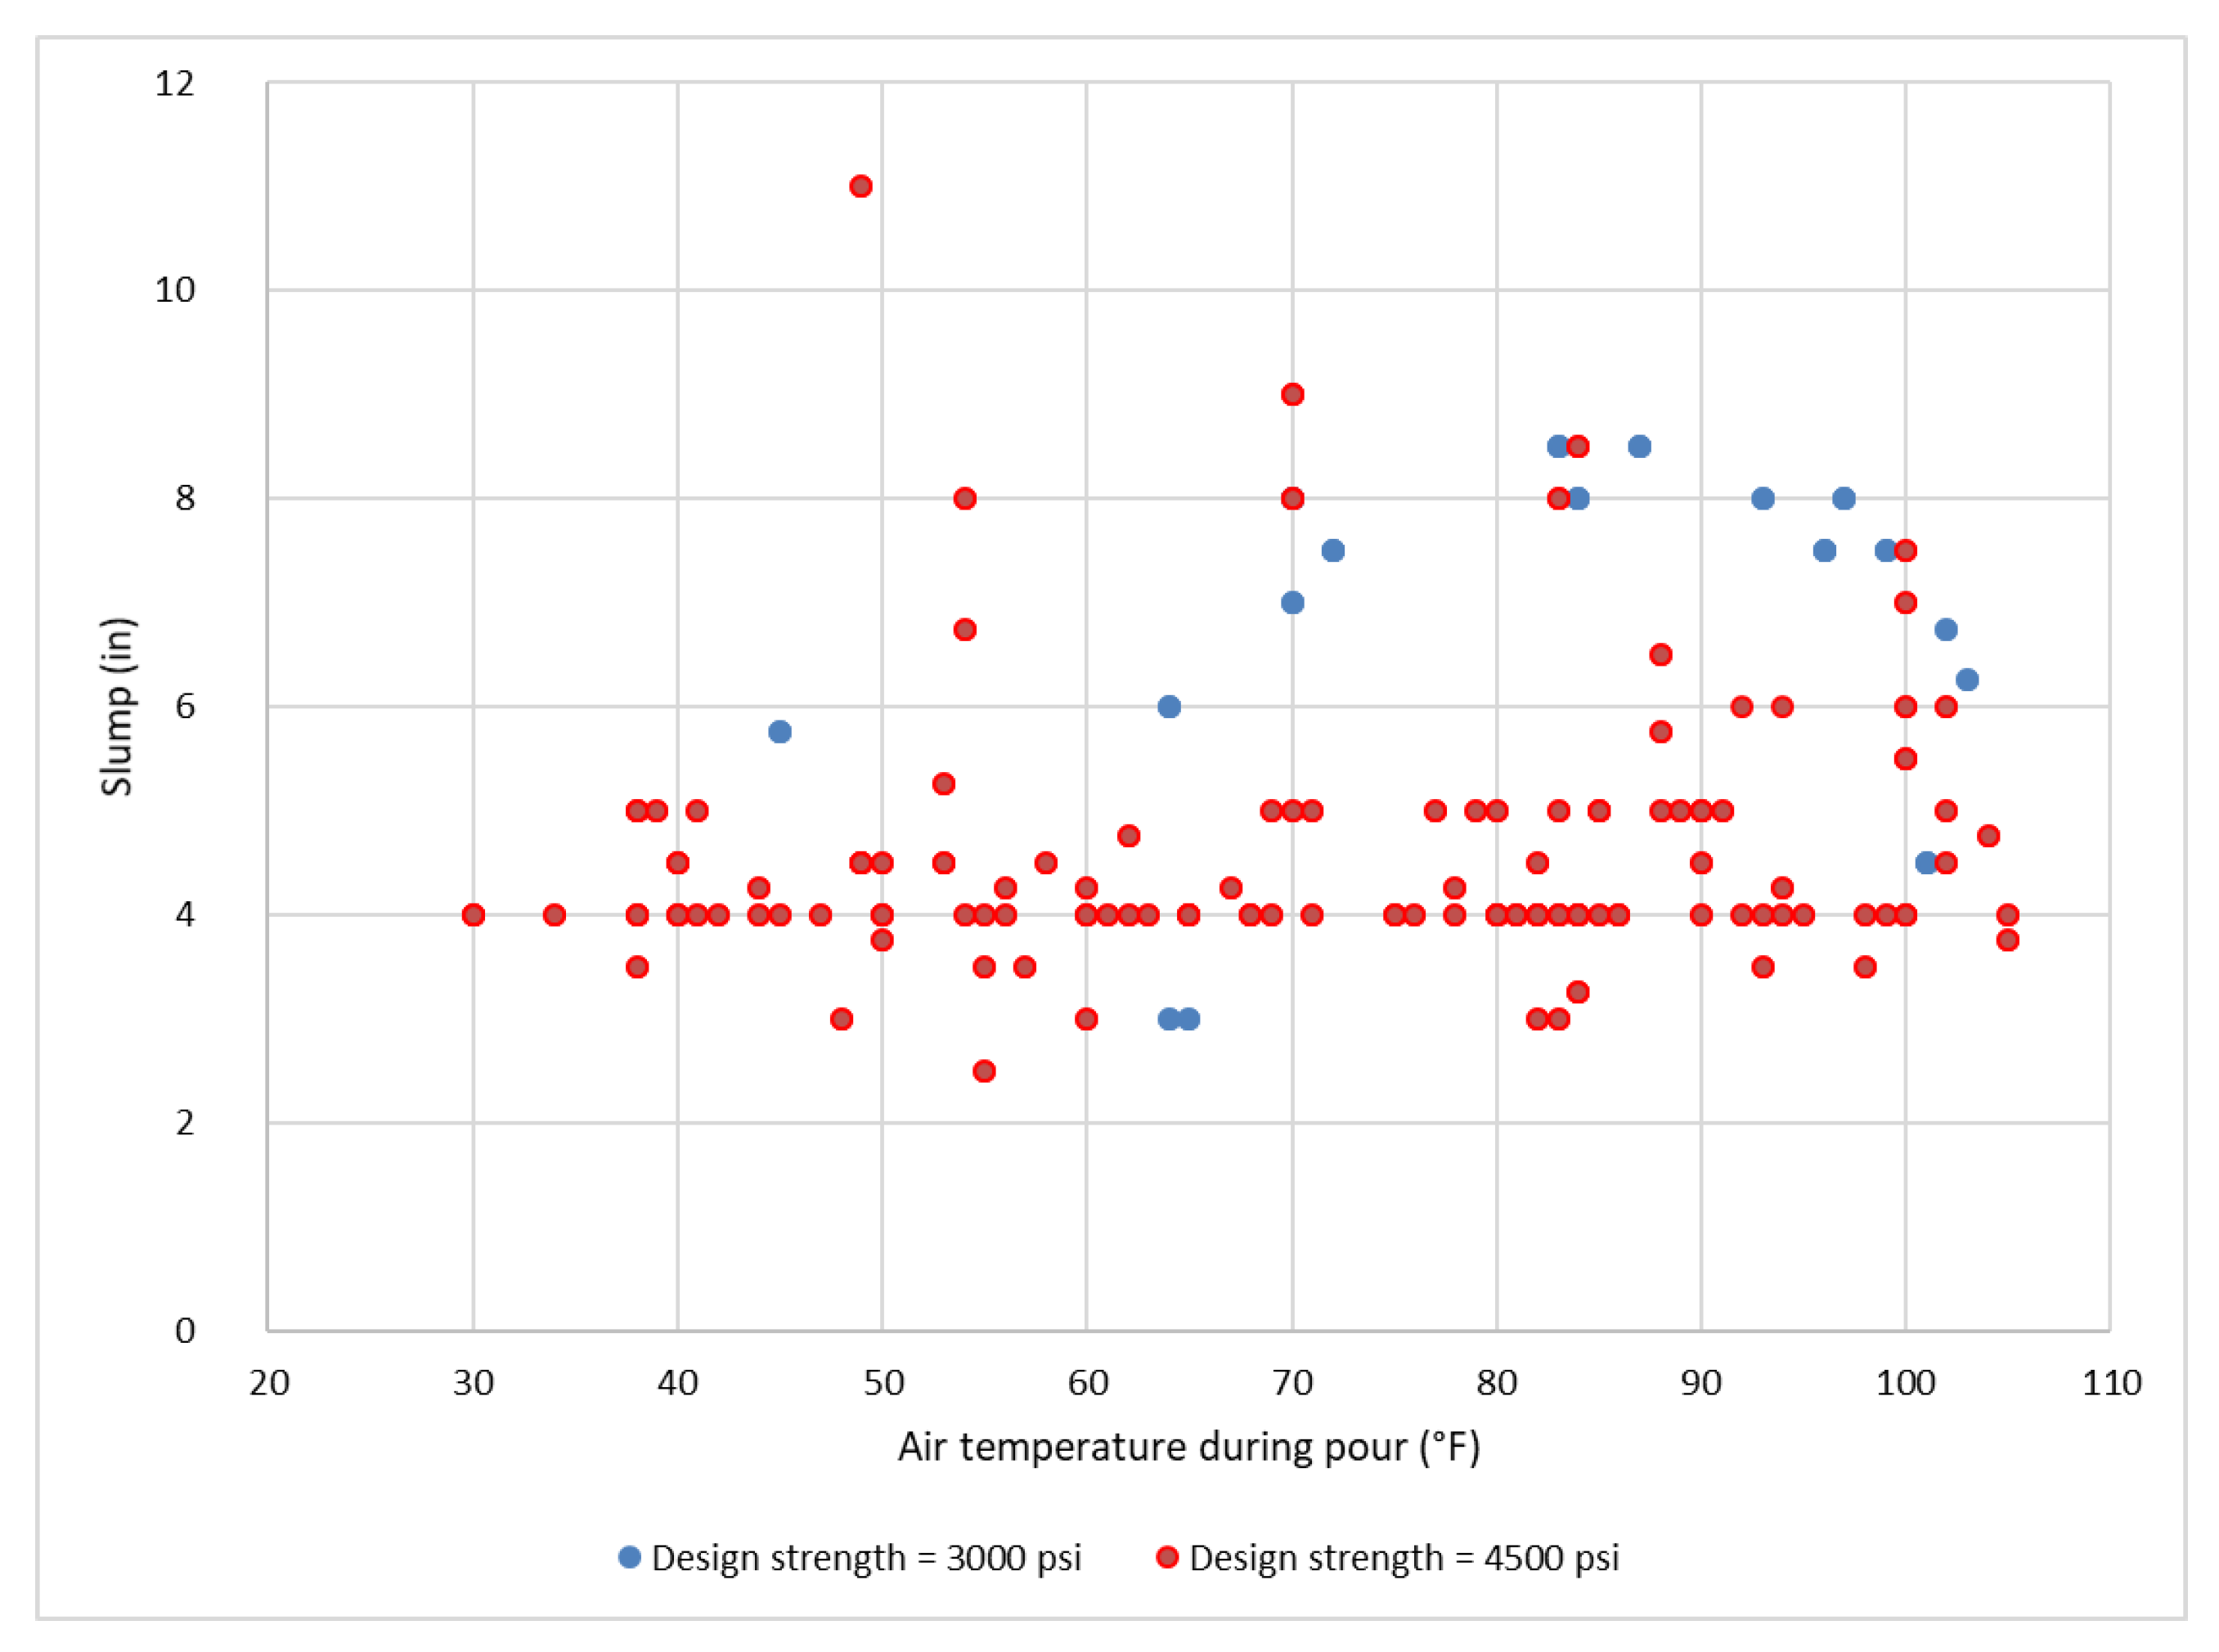
3.3.1. The Relationship between Slump in the Field and Air Temperature
Figure 7 demonstrates the slump test results versus air temperature. A close look at Figure 7 indicates a fluctuated slump results specifically for 21 MPa (3000 psi) specimens. The slump value increased as the air temperature increased from 4 °C (40 °F) to 27 °C (80 °F) and then decreased when the air temperature raised to 38 °C (100 °F). Previous studies demonstrate that the increase in air temperature decreases the workability and, therefore, the slump results for fresh concrete [25,26]. In addition, it seems that the slump value was higher than 10 cm (4 inch), which was the acceptable range. The highest value was recorded at 27 °C (80 °F) air temperature. For 31 MPa (4500 psi) specimens, despite having some scattered slump values above 15 cm (4 inch), for the majority of the specimens, results fluctuated around the acceptable range of 10 cm (4 inch).
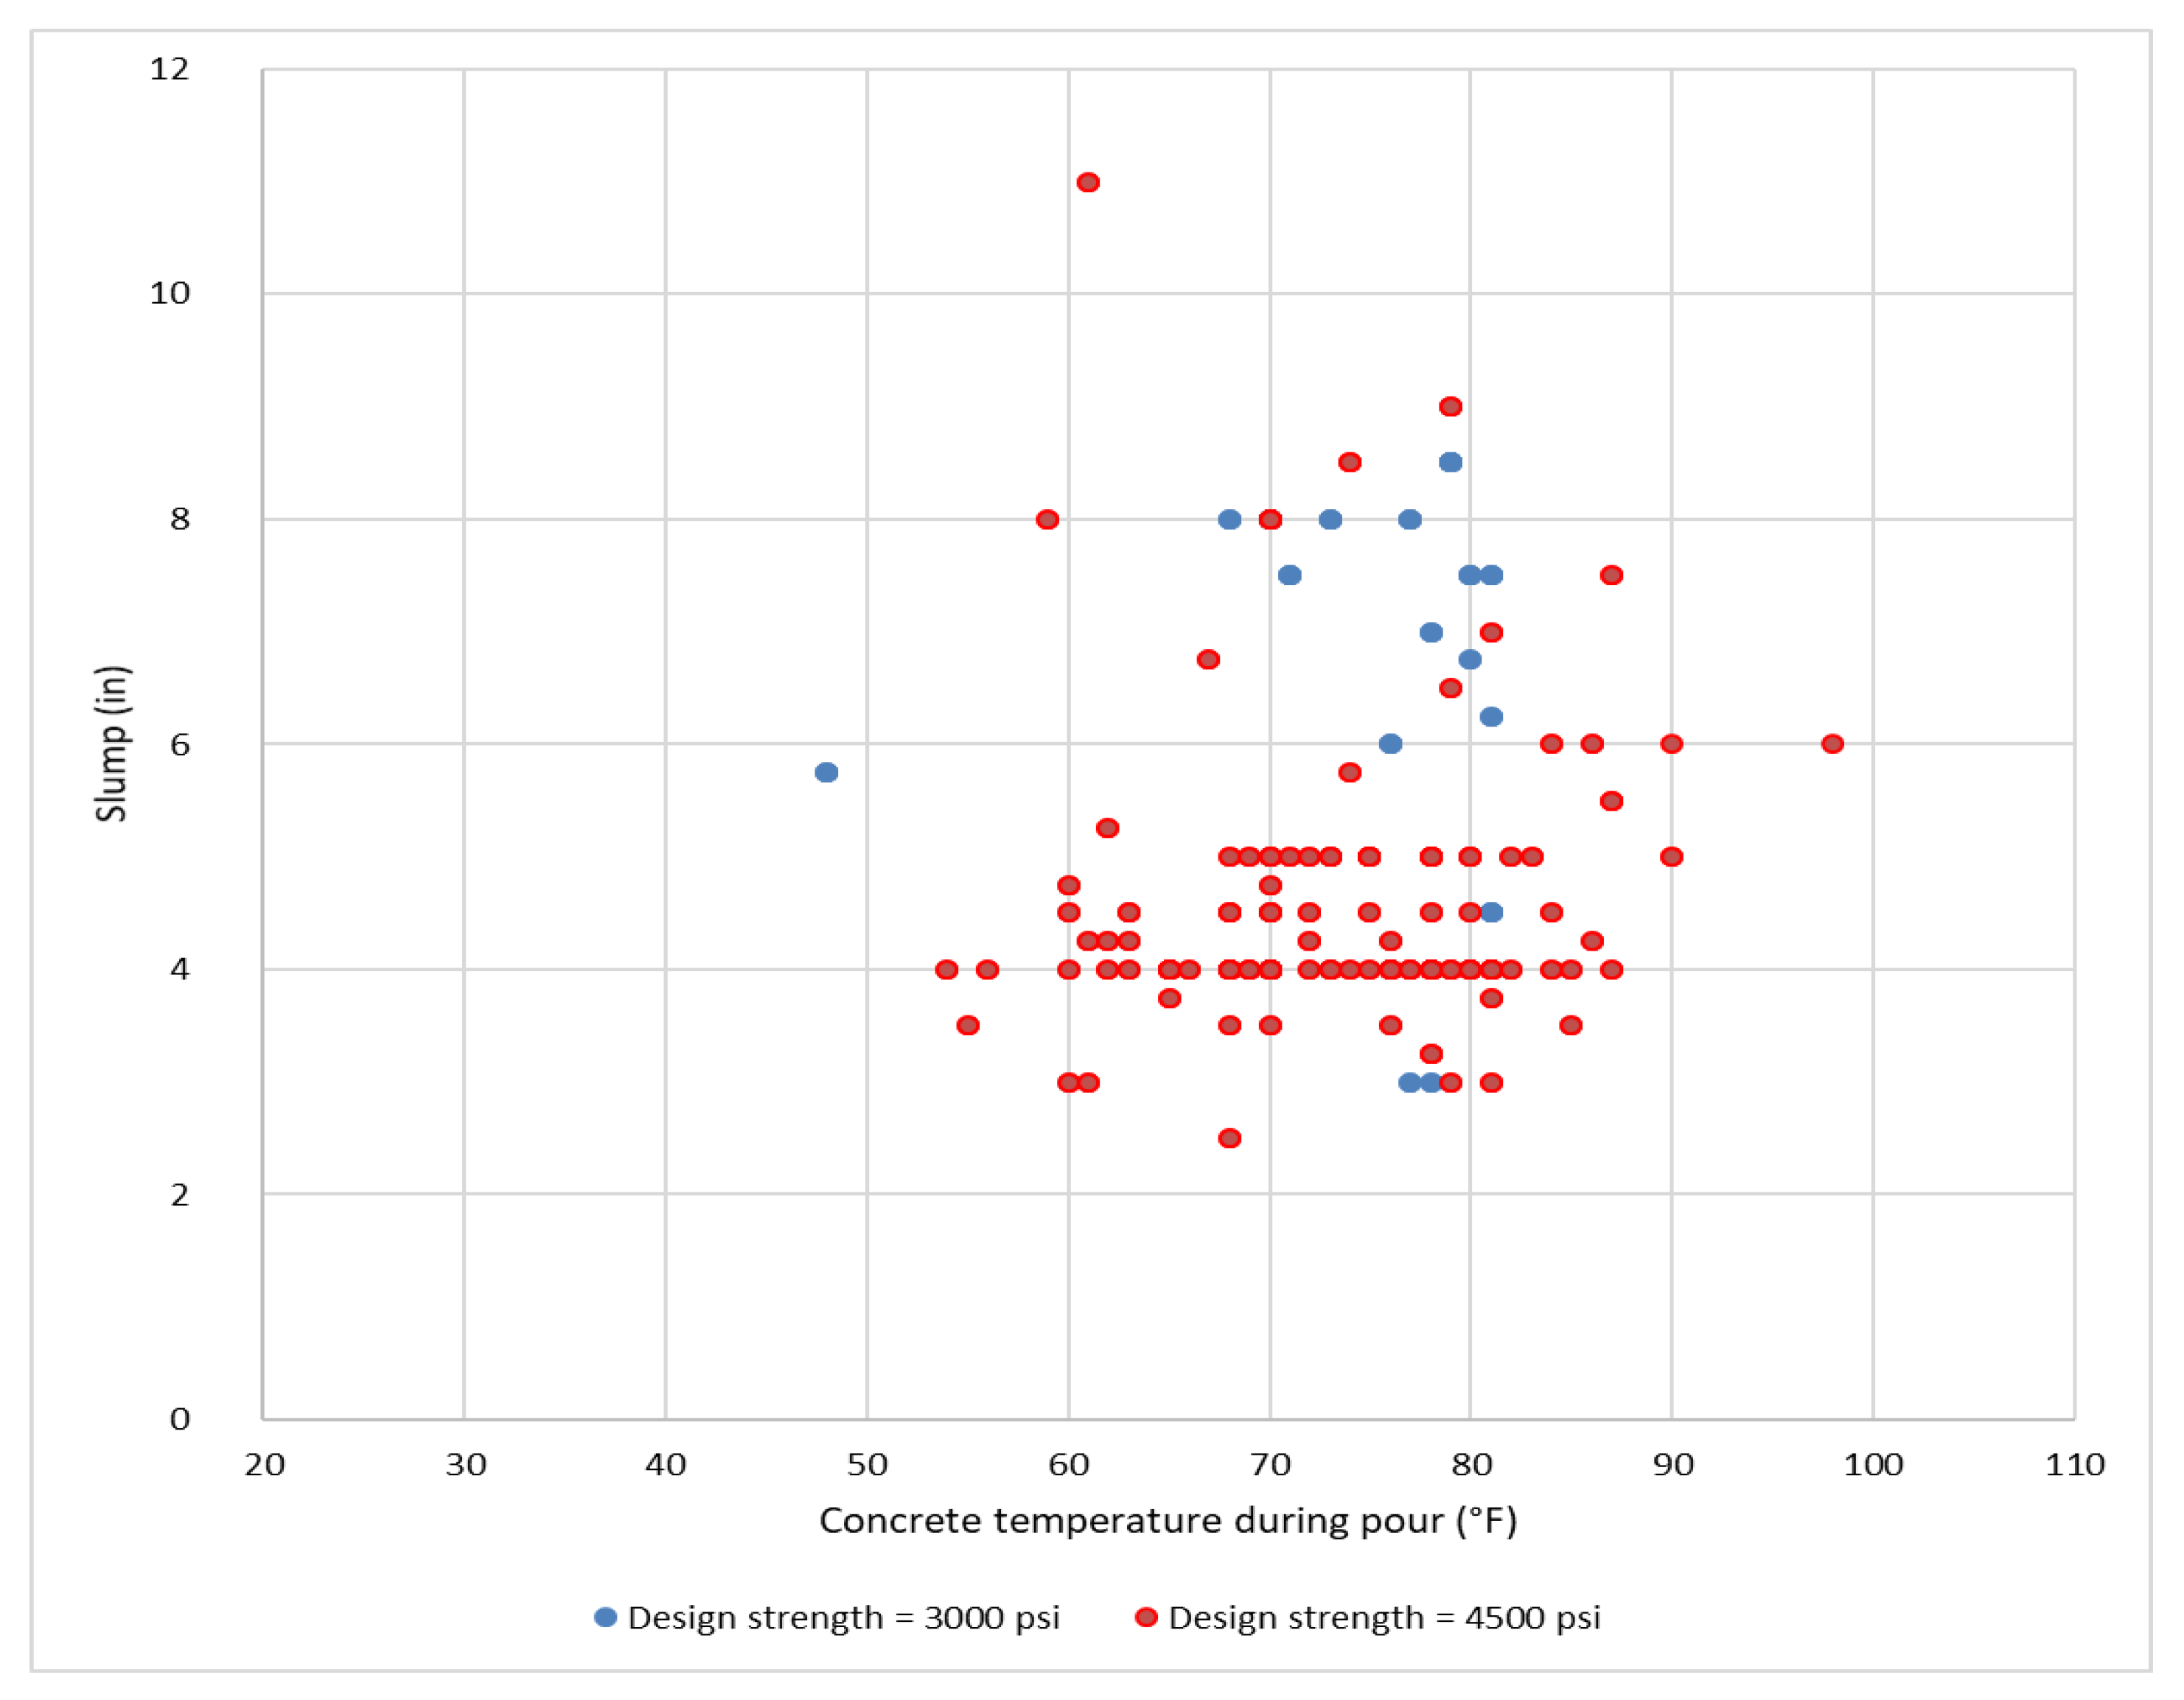
3.3.2. The Relationship between Slump in the Field and Concrete Temperature
First, it can be noted that the concrete temperature was tightly controlled, such that the temperature did not exceed 38 °C (100 °F) in the studied projects. In fact, when the concrete temperature during pour is too high, it can affect fresh concrete properties, such as workability and air content. Additionally, as can be seen, the slump fluctuated more for 21 MPa (3000 psi) specimens compared to 31 MPa (4500 psi) specimens. Overall, the 21 MPa (3000 psi) specimens demonstrated higher and more scattered slump values in comparison to 31 MPa (4500 psi) samples. The majority of 31 MPa (4500 psi) specimens illustrated slump values around 4 in.
3.4. Air versus Fresh Concrete Temperatures
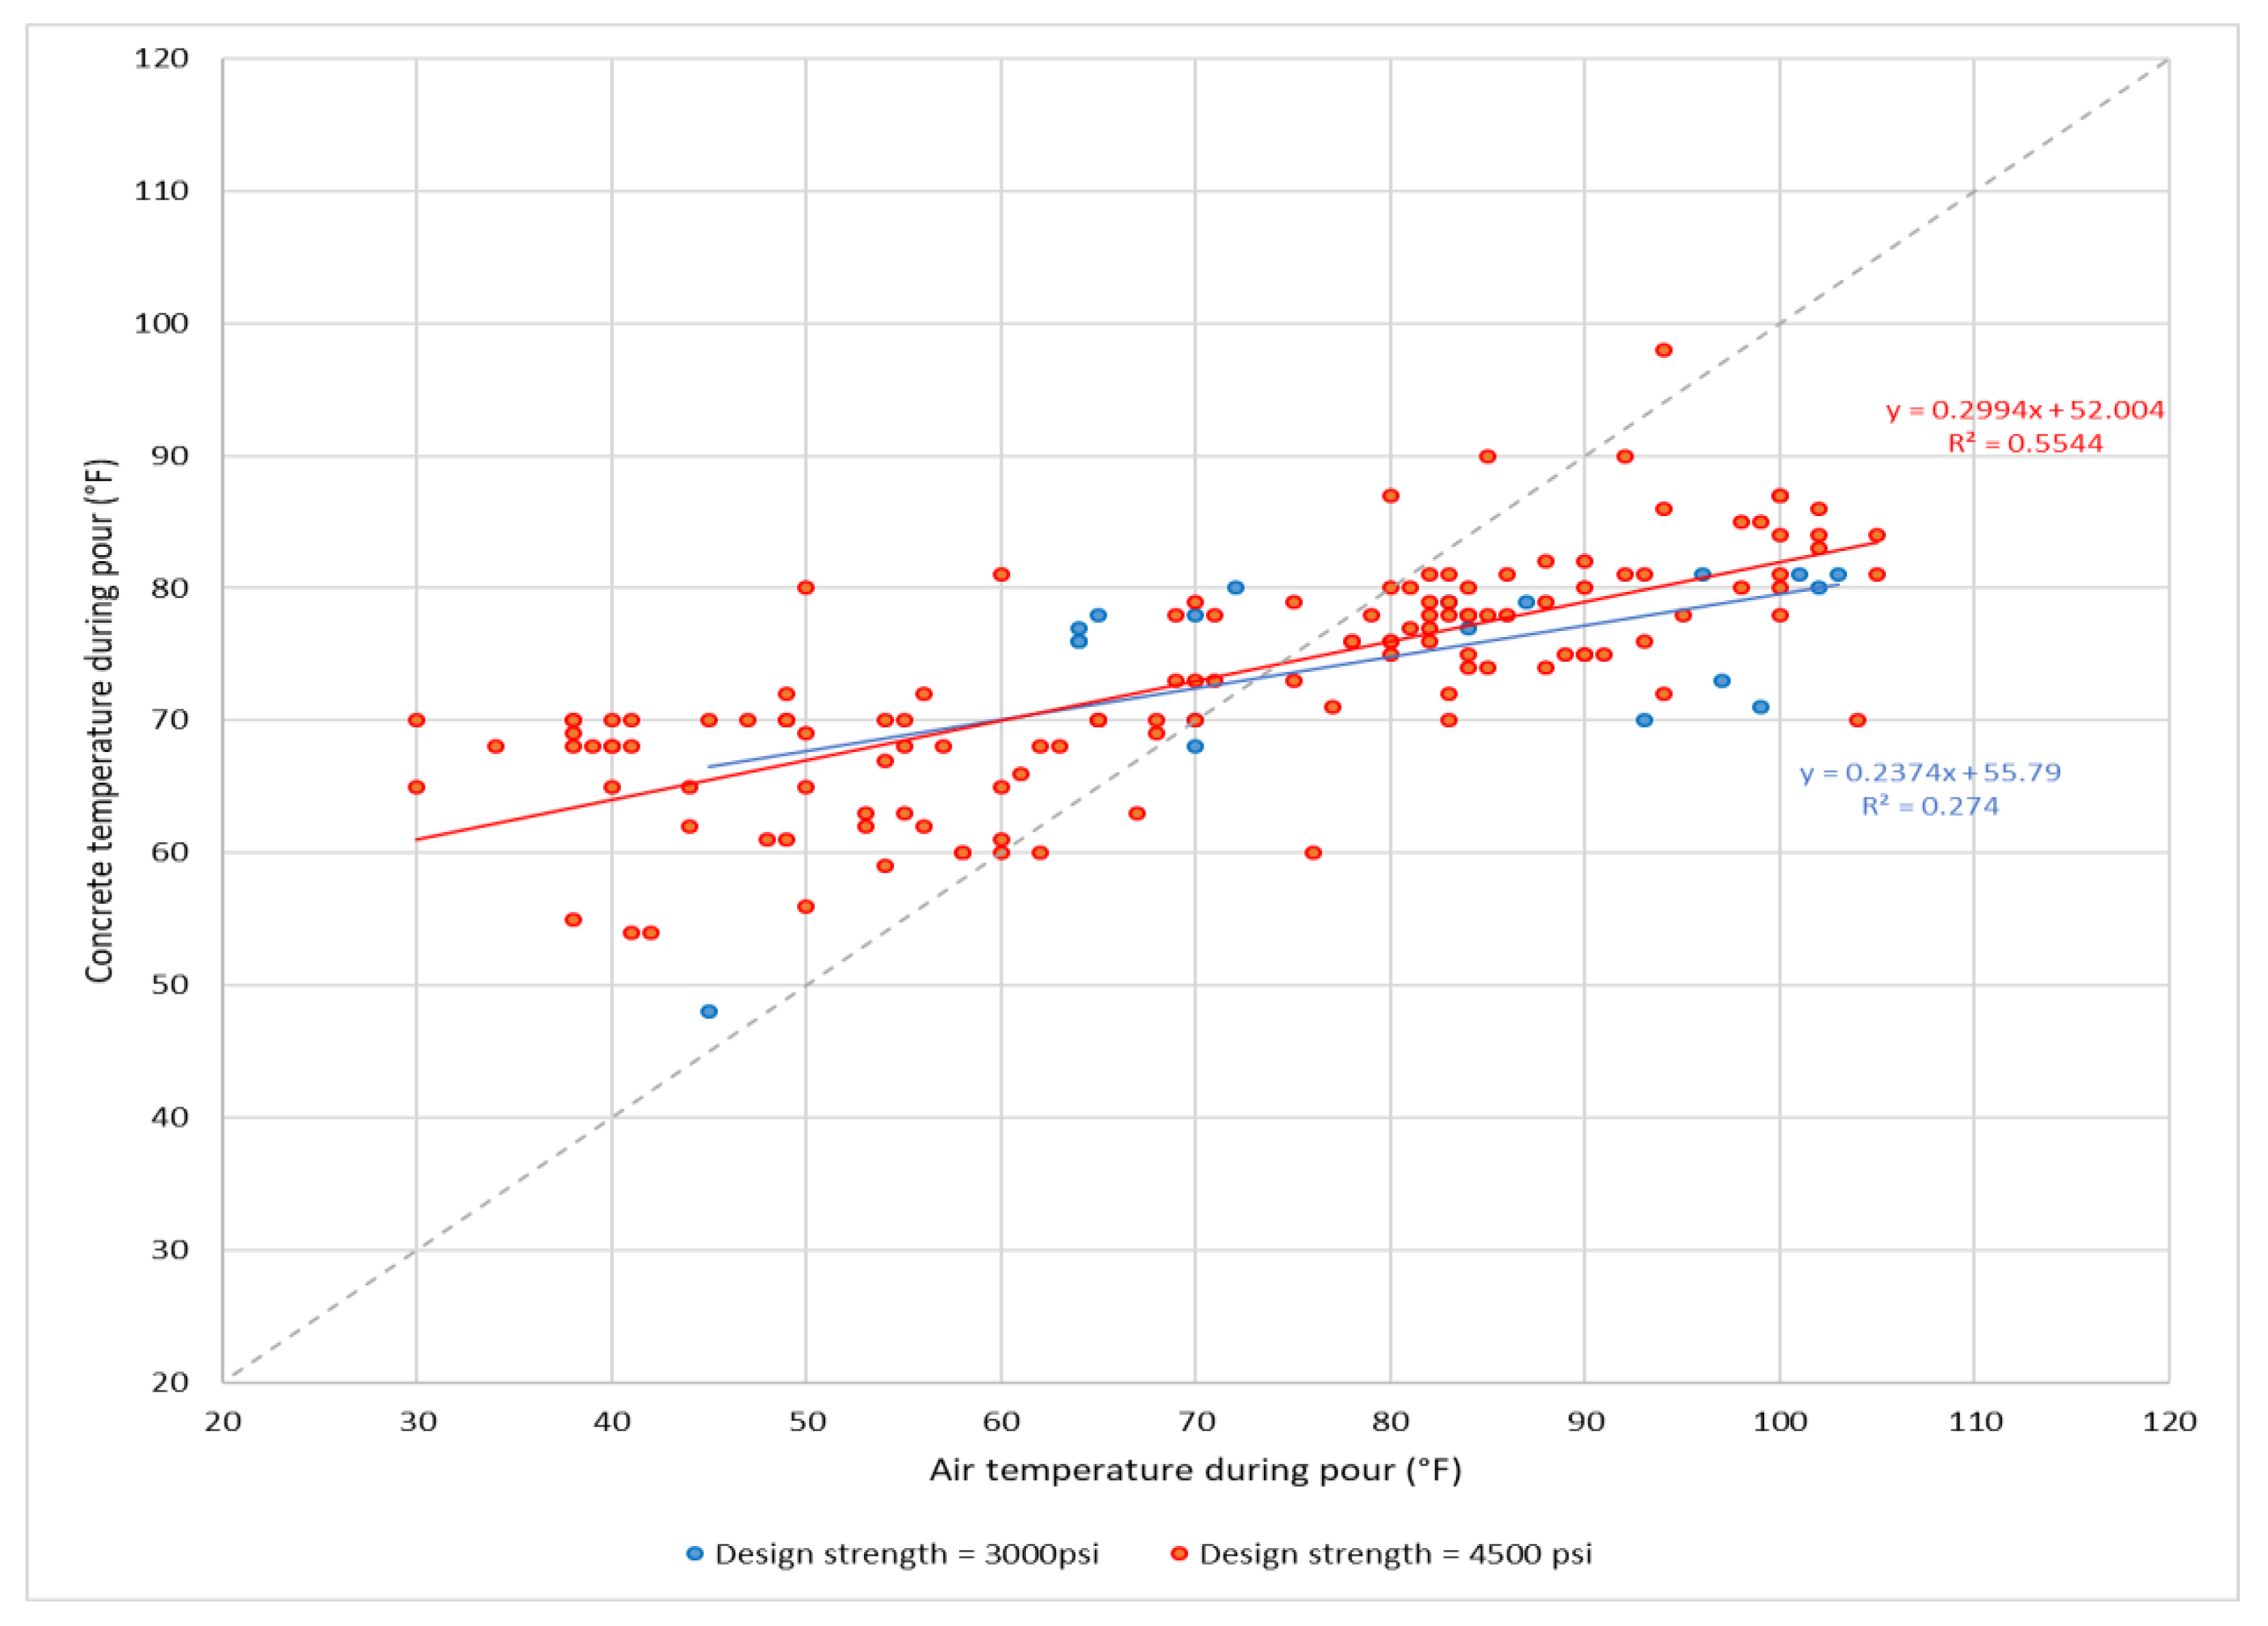
The concrete temperature was plotted against air temperature during pour both, with respect to and irrespective of the design strength. As presented in Figure 8 and Figure 9, the same trend seemed to be followed. Indeed, when the air temperature exceeded a certain temperature, the concrete temperature was lower than the air temperature, and vice versa. Since the trend was the same regardless of the design strength, a graph was realized using all of the data, regardless of the design strength.
Figure 9 shows the correlation between concrete temperature and air temperature. One can note that the relationships between concrete temperature and air temperature with respect to and irrespective of the design strength, the data could be approximated by a linear function. Indeed, when the air temperature exceeds a certain temperature, the concrete temperature becomes lower than the air temperature, and vice versa. When the air temperature is about this temperature, the concrete and air temperatures are similar. To determine this temperature, which is the intersection between the function y = x and the function of concrete temperature, the data can be approximated by a linear function in Excel. Afterward, knowing the linear equation, the intersection between the two functions can be determined. Both with respect to the two design strengths of 3000 psi and 4500 psi, and irrespective of the design strength, linear regressions were made. In addition, it can be noted that this point may also be considered as an inflection point of a nonlinear function, approximating the function of concrete temperature.
On the one hand, considering the design strength of 3000 psi, using the equation of linear regression, the intersection point between the two functions is at x = 73.2 °F. Similarly, considering the design strength of 4500 psi, using the equation of linear regression, the intersection point between the two functions is at x = 74.2 °F. On the other hand, regardless of the design strength, using the equation of linear regression, the intersection point between the two functions is at x = 74.1 °F. The coefficients of determination in the two regressions for design strength of 4500 psi was about 0.5. In regards to the design strength of 3000 psi, the coefficient of determination was about 0.3. This low coefficient of determination, relative to the larger coefficient obtained for the 4500 psi regression line, can be explained by the fact that there was less data for this design strength. As a result, when either considering or ignoring the design strength, the intersection point was about 70 °F ± 5 °F. In other words, when the air temperature equals 70 °F ± 5 °F, the concrete and air temperatures were approximately the same. When the air temperature was below 70 °F ± 5 °F, the concrete temperature was higher than the air temperature. When the air temperature was above 70 °F ± 5 °F, the concrete temperature was lower than the air temperature.
Another methodology would involve assuming a range for air temperatures through a study of the results. One can note that when the air temperature was between 60 °F and 80 °F, the points were close to the line defined by the equation y = x, both with respect to and irrespective of the design strength. Outside of this range, the points are above or below this line. Hence, it can be deduced that for an air temperature of 70 °F ± 10 °F, the concrete and air temperatures are similar. It can also be noted that even if the concrete temperature varies against the air temperature, the strength f’c and slump remain constant with the varying air and concrete temperatures. Hence, it illustrates the good quality concrete of the concrete suppliers. In conclusion, regardless of the design strength, it can be deduced that when the air temperature is at 70 °F ± 10 °F, the fresh concrete and air temperatures are similar. During the hot season, this temperature can be reached in the early morning or late at night. Therefore, concrete should be poured when the air temperature is in this range to avoid a significant variation of fresh concrete temperature, so that using additional water or admixtures to regulate water content and workability is not necessary.
4. Conclusions
In this research, the effect of the air temperature and fresh concrete temperature on the strength and properties of the concrete was tested and analyzed in Southern Nevada. On the basis of the information presented in this study, the following conclusions can be drawn:
- The air temperature in which the fresh concrete is poured has an effect on the compressive strength of the concrete. For a design compressive strength of 21 MPa (3000 psi), the highest compressive strength recorded for the specimens that were collected from the job site when the air temperature was around 18 °C (65 °F). For 31 MPa (4500 psi) design strength, the compressive strength fluctuated but did not show a significant trend.
- The ratio of the compressive strength over design strength fluctuated between 0.5 and 1.5 for the majority of the specimens when the local air temperature changed between 4 °C (40 °F) and 38 °C (100 °F).
- The ratio of the compressive strength to design strength was between 0.5 and 2.0 when the fresh concrete temperature was kept between 10° and 32 °C (50° and 90 °F).
- The slump value increased with the increase in the air temperature for the 21 MPa (3000 psi) design strength and fluctuated around 4 inch for 31 MPa (4500 psi) design strength.
- Fresh concrete’s temperature and air temperature are similar when they are in the range of 60 to 80 °F. Therefore, to limit the use of additional water or admixtures in, concrete should be poured when the air temperature during the pour is in the range of 16° and 27 °C (60° to 80 °F). This range implies a concrete temperature during pour between 60 to 80 °F, which is lower than the maximum allowable fresh concrete temperature specified in the ACI-305.1-06 “Specification for Hot Weather Concreting”.
Author Contributions
Data curation, M.S.; Formal analysis, M.S.; Methodology, M.S.; Supervision, M.K.; Validation, M.S; Writing – original draft, M.S. and K.J.; Writing – review & editing, M.S., K.J. and M.K. All authors have read and agreed to the published version of the manuscript.
Funding
This research received no external funding.
Data Availability Statement
All data was presented in the manuscript.
Conflicts of Interest
This paper does not have any conflict of interest.
References
- American Concrete Institute (ACI) Committee 305. Guide to Hot Weather Concreting, ACI 305R-10; American Concrete Institute: Farmington Hills, MI, USA, 2010. [Google Scholar]
- ASTM C1064/C1064M; Standard Test Method for Temperature of Freshly Mixed Hydraulic-Cement Concrete. ASTM International, American Society for Testing and Materials: West Conshohocken, PA, USA, 2017.
- Soroka, I.; Ravina, D. Hot weather concreting with admixtures. Cem. Concr. Compos. 1998, 20, 129–136. [Google Scholar] [CrossRef]
- Karakouzian, M.; Boehm, R.F.; Hudyma, N.; Harris, D.D. Effect of Reinforcement Temperature in Shrinkage Cracking of PC. Concr. Int. 1994, 16, 65–67. [Google Scholar]
- Ujhelyi, J.E.; Ibrahim, A.J. Hot weather concreting with hydraulic additives. Cem. Concr. Res. 1991, 21, 345–354. [Google Scholar] [CrossRef]
- Ahmadi, B.H. Initial and final setting time of concrete in hot weather. Mater. Struct. 2000, 33, 511–514. [Google Scholar] [CrossRef]
- Schindler, A.K.; Frank McCullough, B. Importance of Concrete Temperature Control During Concrete Pavement Construction in Hot Weather Conditions. Transp. Res. Rec. J. Transp. Res. Board 2002, 1813, 3–10. [Google Scholar] [CrossRef]
- American Concrete Institute (ACI) Committee 305. Hot Weather Conditioning, ACI 305R-99; American Concrete Institute: Farmington Hills, MI, USA, 1999. [Google Scholar]
- Almusallam, A.A. Effect of environmental conditions on the properties of fresh and hardened concrete. Cem. Concr. Compos. 2001, 23, 353–361. [Google Scholar] [CrossRef]
- FIP Commission on Practical Construction. Working Group on Concreting in Hot Weather, Fédération Internationale de la Précontrainte, & FIP Commission on Practical Construction. In Concrete Construction in Hot Weather; Thomas Telford Publishing: London, UK, 1986; Volume 54. [Google Scholar]
- Thomas, M.D.A. Optimizing the Use of Fly Ash in Concrete; Portland Cement Association: Skokie, IL, USA, 2007; Volume 5420. [Google Scholar]
- Malisch, W. Hot weather concreting tips. Concr. Constr. 1990, 35, 541–544. [Google Scholar]
- Gebremichael, N.N.; Karein, S.M.M.; Karakouzian, M.; Jadidi, K. Investigation of setting time and compressive strength of ready-mixed concrete blended with returned fresh concrete. Constr. Build. Mater. 2019, 197, 428–435. [Google Scholar] [CrossRef] [Green Version]
- Suh, Y.C.; McCullough, B.F. Factors Affecting Crack width of Continuously Reinforced Concrete Pavement. In Transportation Research Record; National Academy Press: Washington, DC, USA, 1994; Volume 1449. [Google Scholar]
- Al-Ani, S.H.; Al-Zaiwary, M.A. The effect of curing period and curing delay on concrete in hot weather. Mater. Struct. 1988, 21, 205–212. [Google Scholar] [CrossRef]
- Zeyad, A.M.; Johari MA, M.; Abutaleb, A.; Tayeh, B.A. The effect of steam curing regimes on the chloride resistance and pore size of high–strength green concrete. Constr. Build. Mater. 2021, 280, 122409. [Google Scholar] [CrossRef]
- Zeyad, A.M.; Johari MA, M.; Alharbi, Y.R.; Abadel, A.A.; Amran, Y.M.; Tayeh, B.A.; Abutaleb, A. Influence of steam curing regimes on the properties of ultrafine POFA-based high-strength green concrete. J. Build. Eng. 2021, 38, 102204. [Google Scholar] [CrossRef]
- Amin, M.; Zeyad, A.M.; Tayeh, B.A.; Agwa, I.S. Effects of Nano cotton stalk and palm leaf ashes on ultrahigh-performance concrete properties incorporating recycled concrete aggregates. Constr. Build. Mater. 2021, 302, 124196. [Google Scholar] [CrossRef]
- Jan, B. Benefits of slag and fly ash. Constr. Build. Mater. 1996, 10, 309–314. [Google Scholar]
- Nehdi, M.; Al-Martini, S. Coupled effects of high temperature, prolonged mixing time, and chemical admixtures on rheology of fresh concrete. ACI Mater. J. 2009, 106, 231. [Google Scholar]
- American Concrete Institute (ACI) Committee 305. Specification for Hot Weather Concreting, ACI 305.10-06; American Concrete Institute: Farmington Hills, MI, USA, 2006. [Google Scholar]
- Mindess, S.; Young, J.F.; Darwin, A. Concrete, 2nd ed.; Pearson Education Ltd.: London, UK, 2002. [Google Scholar]
- Yoo, D.Y.; Min, K.H.; Lee, J.H.; Yoon, Y.S. Shrinkage and cracking of restrained ultra-high-performance fiber-reinforced concrete slabs at early age. Constr. Build. Mater. 2014, 73, 357–365. [Google Scholar] [CrossRef]
- Behbahani, H.P.; Nematollahi, B.; Farasatpour, M. Steel Fiber Reinforced Concrete: A Review. In Proceedings of the International Conference on Structural Engineering Construction and Management, Kandy, Sri Lanka, 15–17 December 2011. [Google Scholar]
- Samarai, M.; Popovics, S.; Malhotra, V.M. Effects of High Temperatures on the Properties of Fresh and Hardened Concrete: A Bibliography (1915–1983). J. Proc. 1935, 30, 159–180. [Google Scholar]
- Ramakrishnan, V.; Perumalswamy, V. Effect of Hot Climate on Slump Loss and Setting Times for Superplasticized Concretes. In Transportation Research Board; US Army Corps of Engineers: Washington, DC, USA, 1983. [Google Scholar]
Figure 1.
Relation between compressive strength and air temperature for a design strength of 3000 psi.
Figure 1.
Relation between compressive strength and air temperature for a design strength of 3000 psi.

Figure 2.
Relation between compressive strength and air temperature for a design strength of 4500 psi.
Figure 2.
Relation between compressive strength and air temperature for a design strength of 4500 psi.

Figure 3.
Relation between compressive strength and concrete temperature for a design strength of 3000 psi.
Figure 3.
Relation between compressive strength and concrete temperature for a design strength of 3000 psi.

Figure 4.
Relation between compressive strength and concrete temperature for a design strength of 4500 psi.
Figure 4.
Relation between compressive strength and concrete temperature for a design strength of 4500 psi.

Figure 5.
The relationship between the ratio of compression strength to design strength and air temperature with respect to design strength.
Figure 5.
The relationship between the ratio of compression strength to design strength and air temperature with respect to design strength.

Figure 6.
The relationship between the ratio of compressive strength to design strength and concrete temperature with respect to design strength.
Figure 6.
The relationship between the ratio of compressive strength to design strength and concrete temperature with respect to design strength.

Figure 7.
The relationship between slump and air temperature.

Figure 8.
The relationship between slump and concrete temperature.

Figure 9.
The relationship between concrete temperature and air temperature with respect to design strength (linear regression).
Figure 9.
The relationship between concrete temperature and air temperature with respect to design strength (linear regression).


Table 1.
Record identifying the strength.
| Design Strength (psi) | Age of Testing (Days) | Number of Records |
|---|---|---|
| 3000 | 7 | 18 |
| 28 | 18 | |
| 4500 | 7 | 125 |
| 28 | 130 |
Table 2.
Record identifying slump.
| Design f’c | Air Temperature | Concrete Temperature | Slump |
|---|---|---|---|
| (a) | (b) | (c) | (d) |
(a) 3000 psi or 4500 psi; (b) air temperature (°F) during pour; (c) concrete temperature (°F) during pour; (d) slump (in.) measured in the field.
Publisher’s Note: MDPI stays neutral with regard to jurisdictional claims in published maps and institutional affiliations. |
© 2022 by the authors. Licensee MDPI, Basel, Switzerland. This article is an open access article distributed under the terms and conditions of the Creative Commons Attribution (CC BY) license (https://creativecommons.org/licenses/by/4.0/).
Share and Cite
MDPI and ACS Style
Saidi, M.; Jadidi, K.; Karakouzian, M. Assessment of Quality of Fresh Concrete Delivered at Varying Temperatures. CivilEng 2022, 3, 135-146. https://doi.org/10.3390/civileng3010009
AMA Style
Saidi M, Jadidi K, Karakouzian M. Assessment of Quality of Fresh Concrete Delivered at Varying Temperatures. CivilEng. 2022; 3(1):135-146. https://doi.org/10.3390/civileng3010009
Chicago/Turabian StyleSaidi, Maroua, Kazem Jadidi, and Moses Karakouzian. 2022. "Assessment of Quality of Fresh Concrete Delivered at Varying Temperatures" CivilEng 3, no. 1: 135-146. https://doi.org/10.3390/civileng3010009