
Continuous Flow Separation of Red Blood Cells and Platelets in a Y-Microfluidic Channel Device with Saw-Tooth Profile Electrodes via Low Voltage Dielectrophoresis

Abstract
:1. Introduction
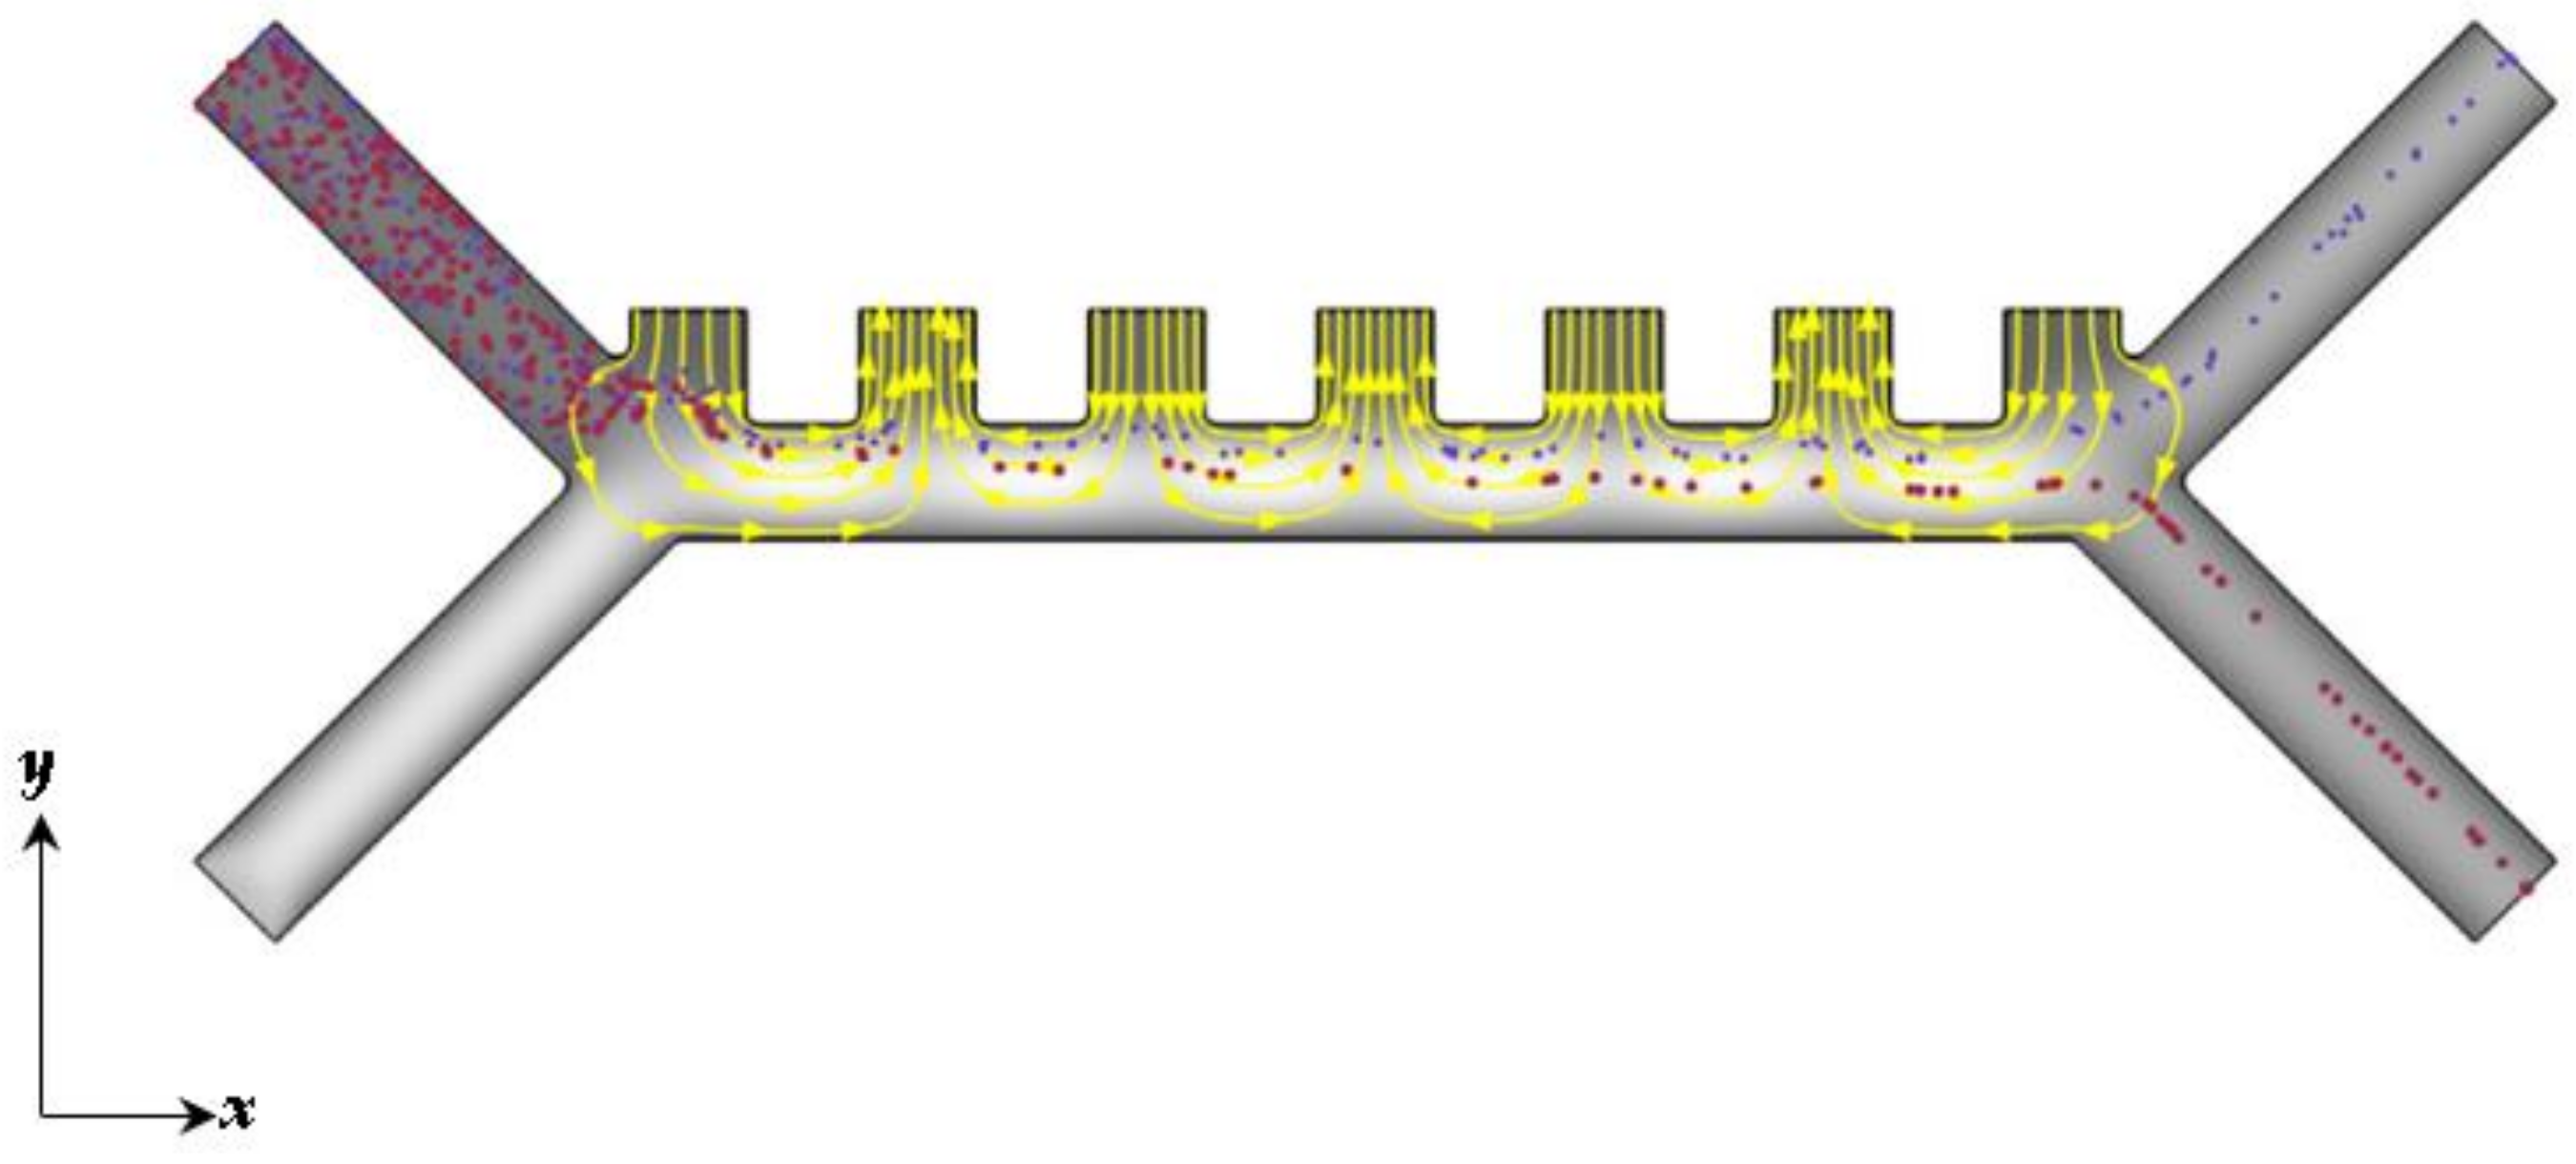
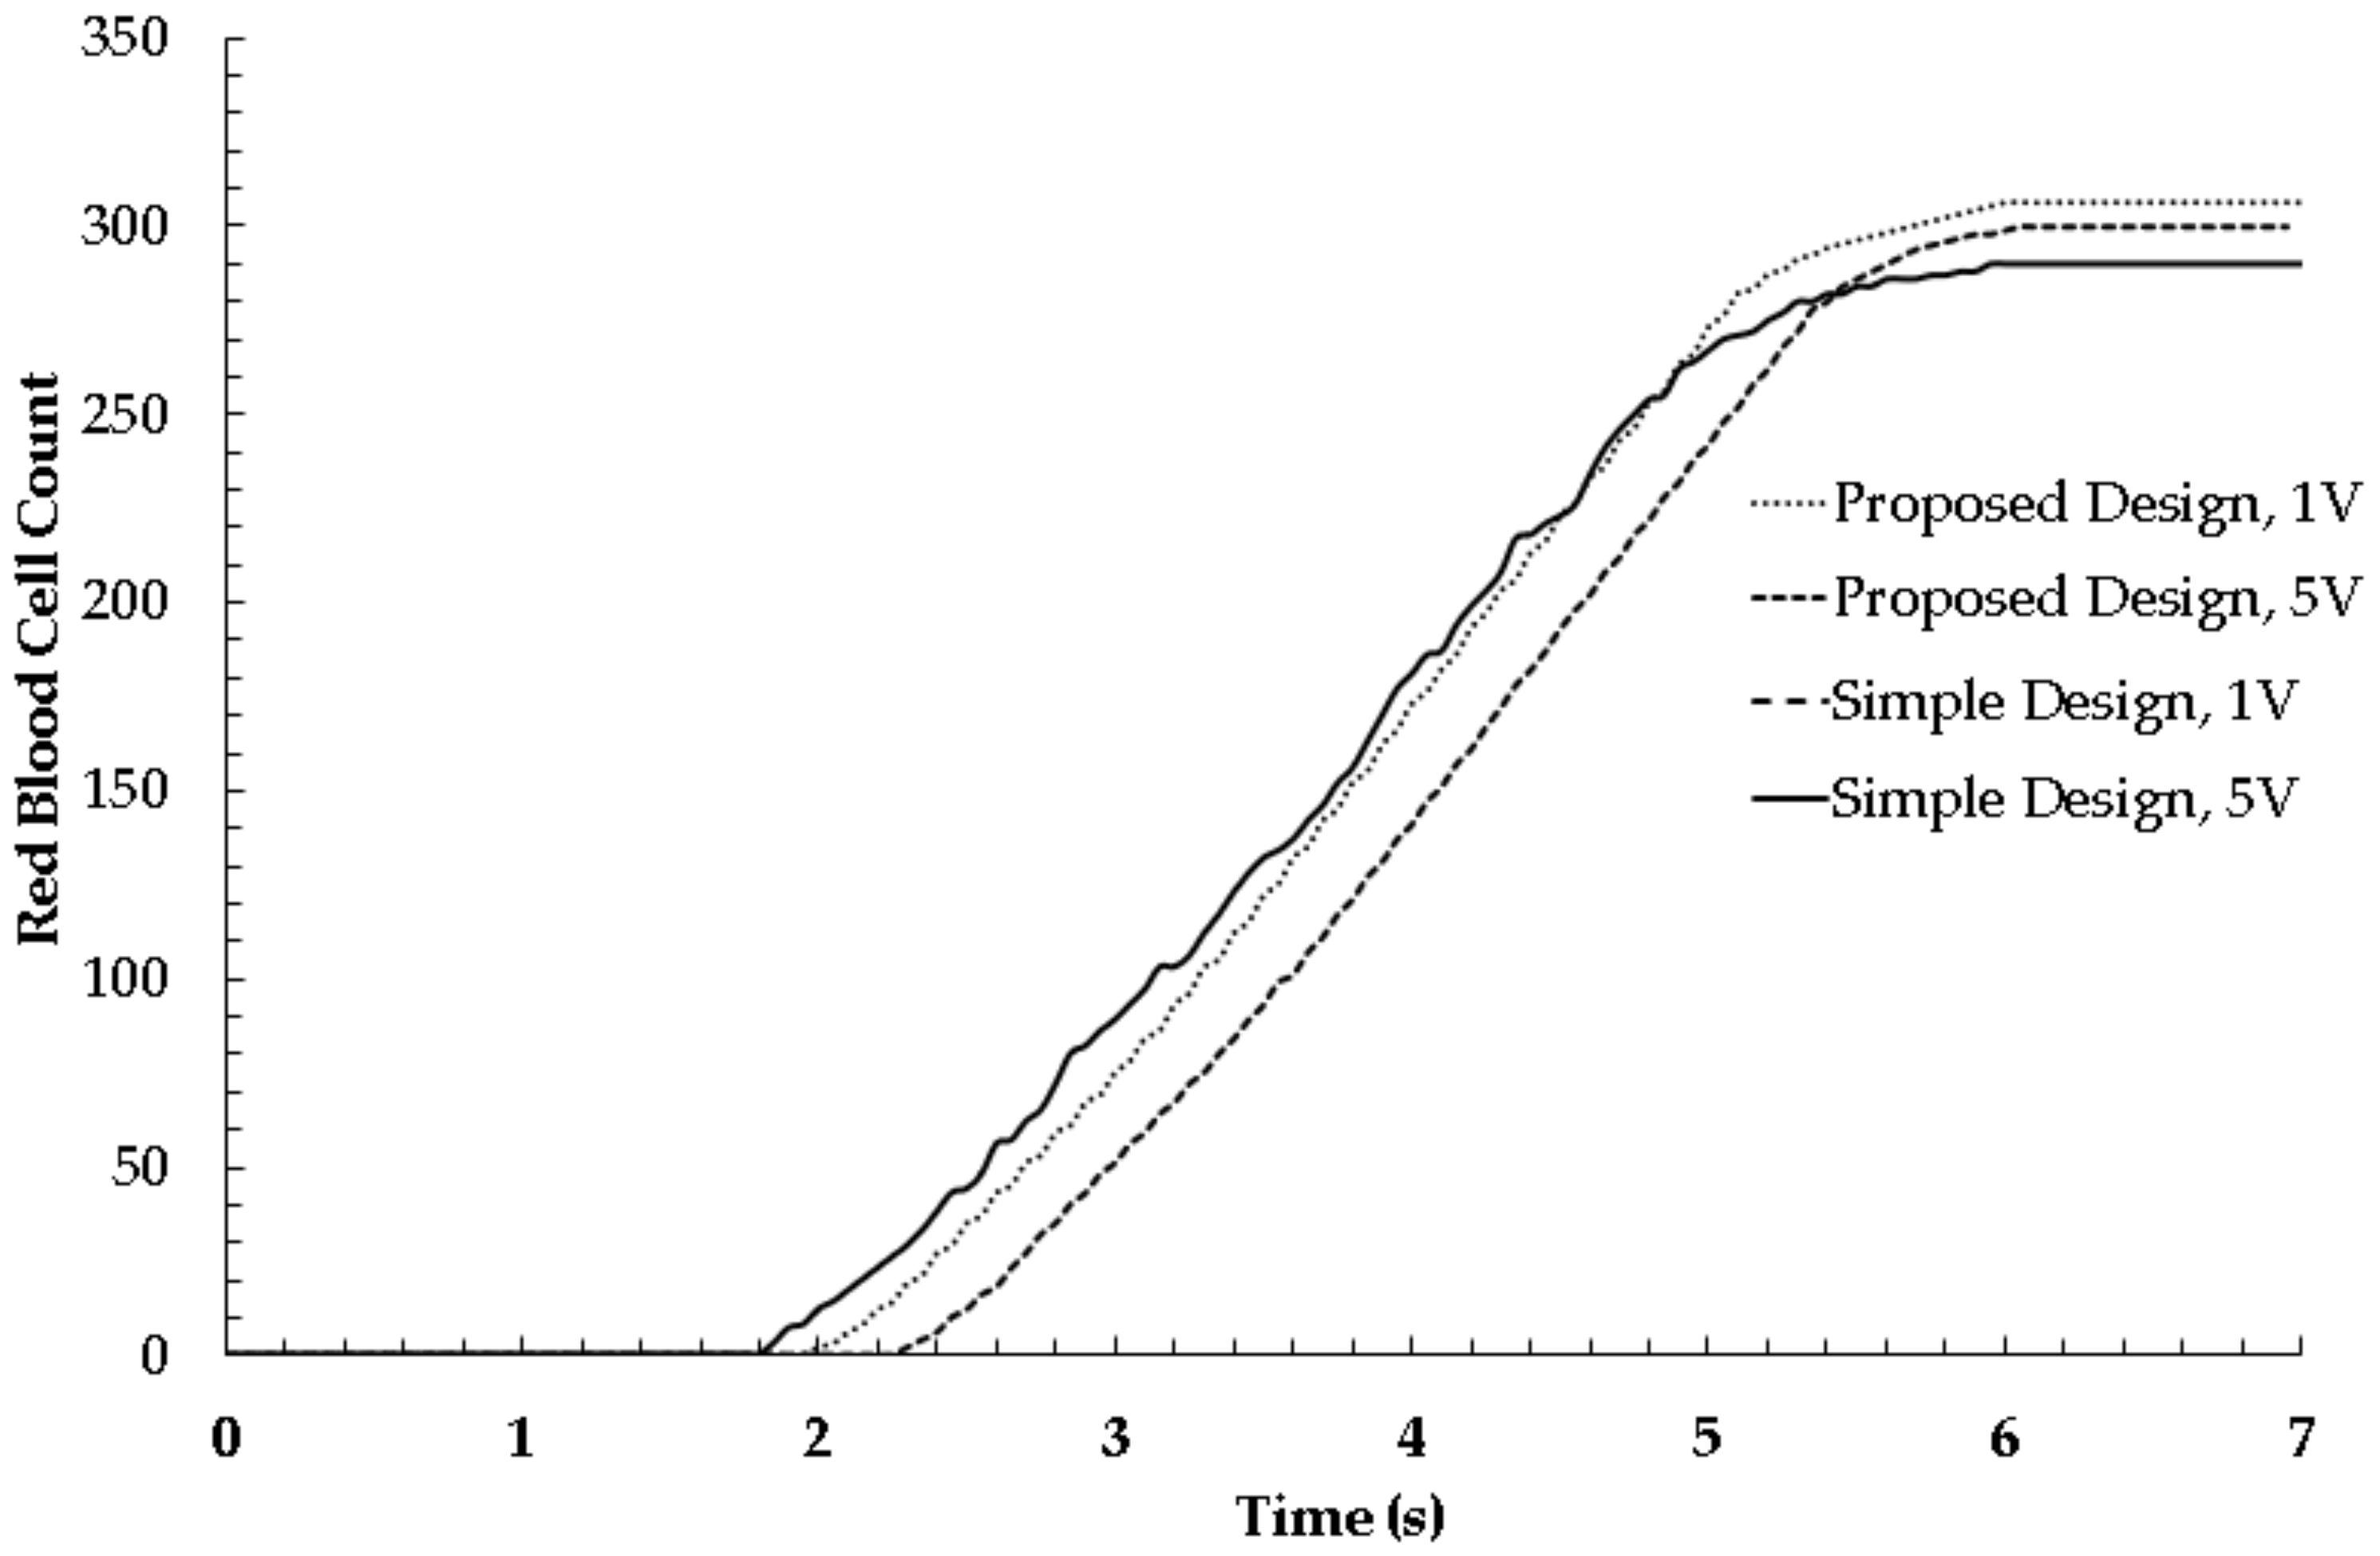
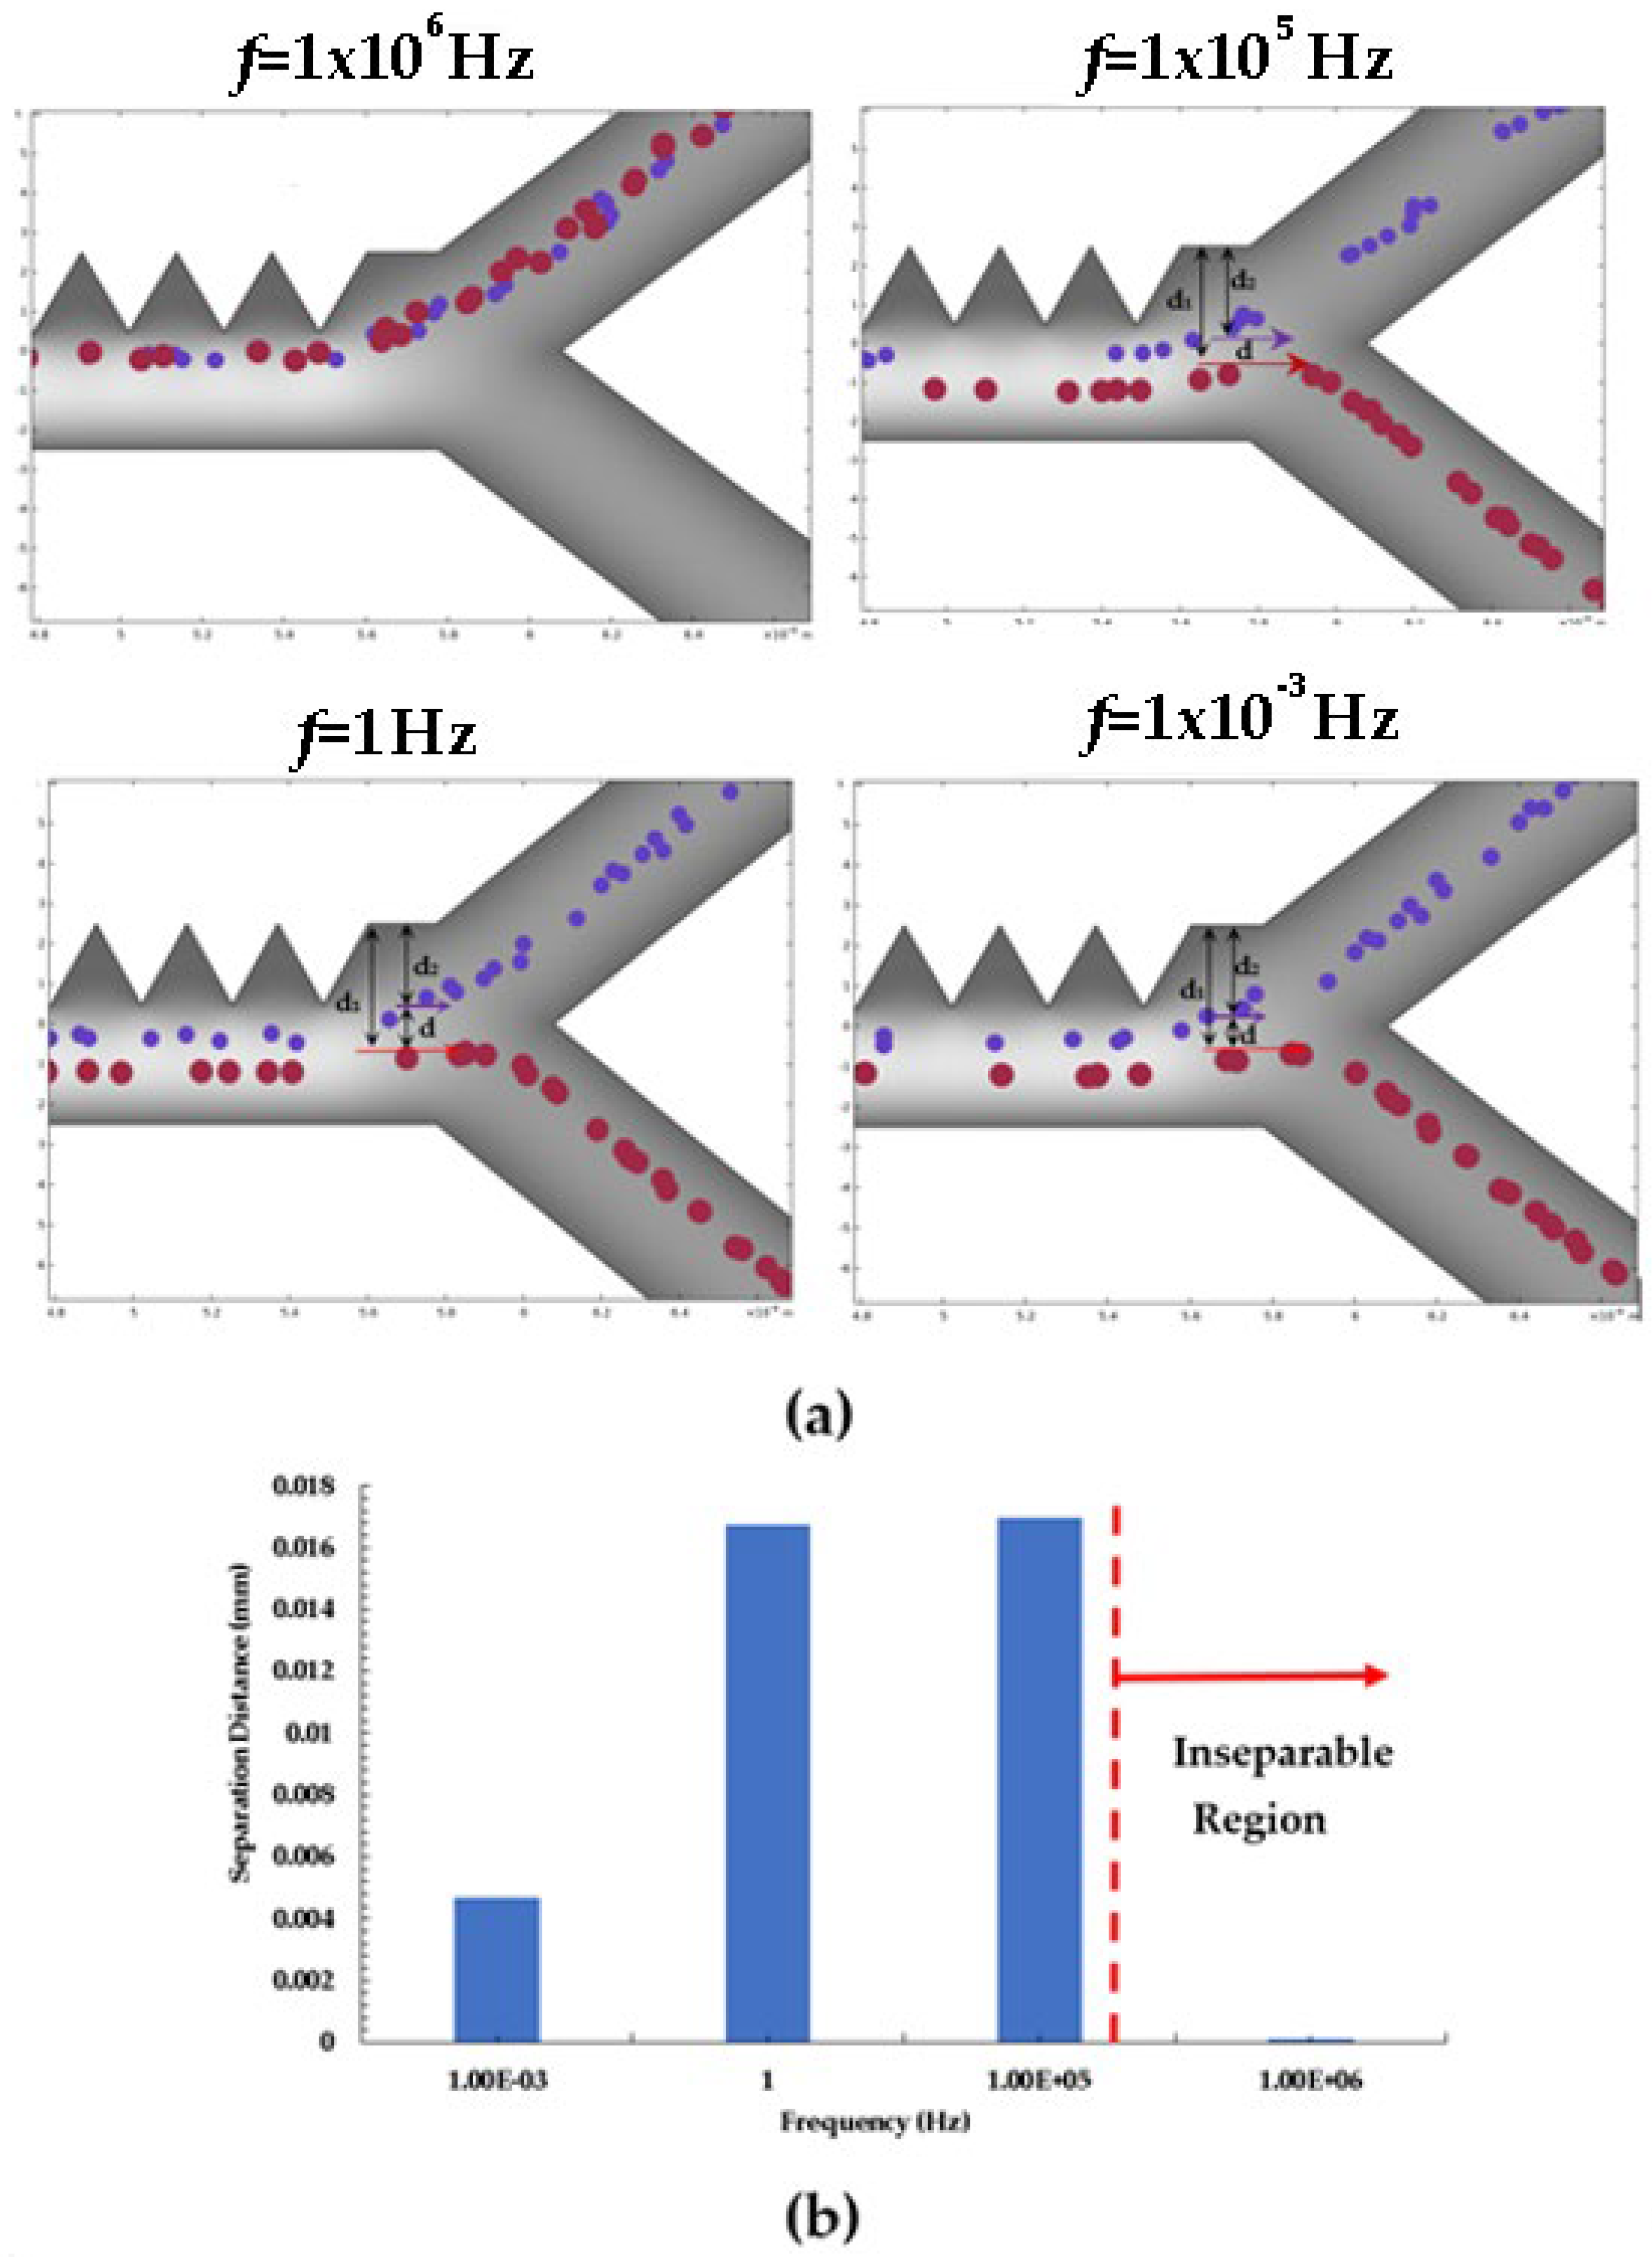
- The design reported in this work is an improvement over existing designs in that it can perform rapid separation of red blood cells (estimated 99% purification) of platelets in less than a total time of 6–7 s at a voltage setting of 1 V and at a minimum frequency of 1 Hz.
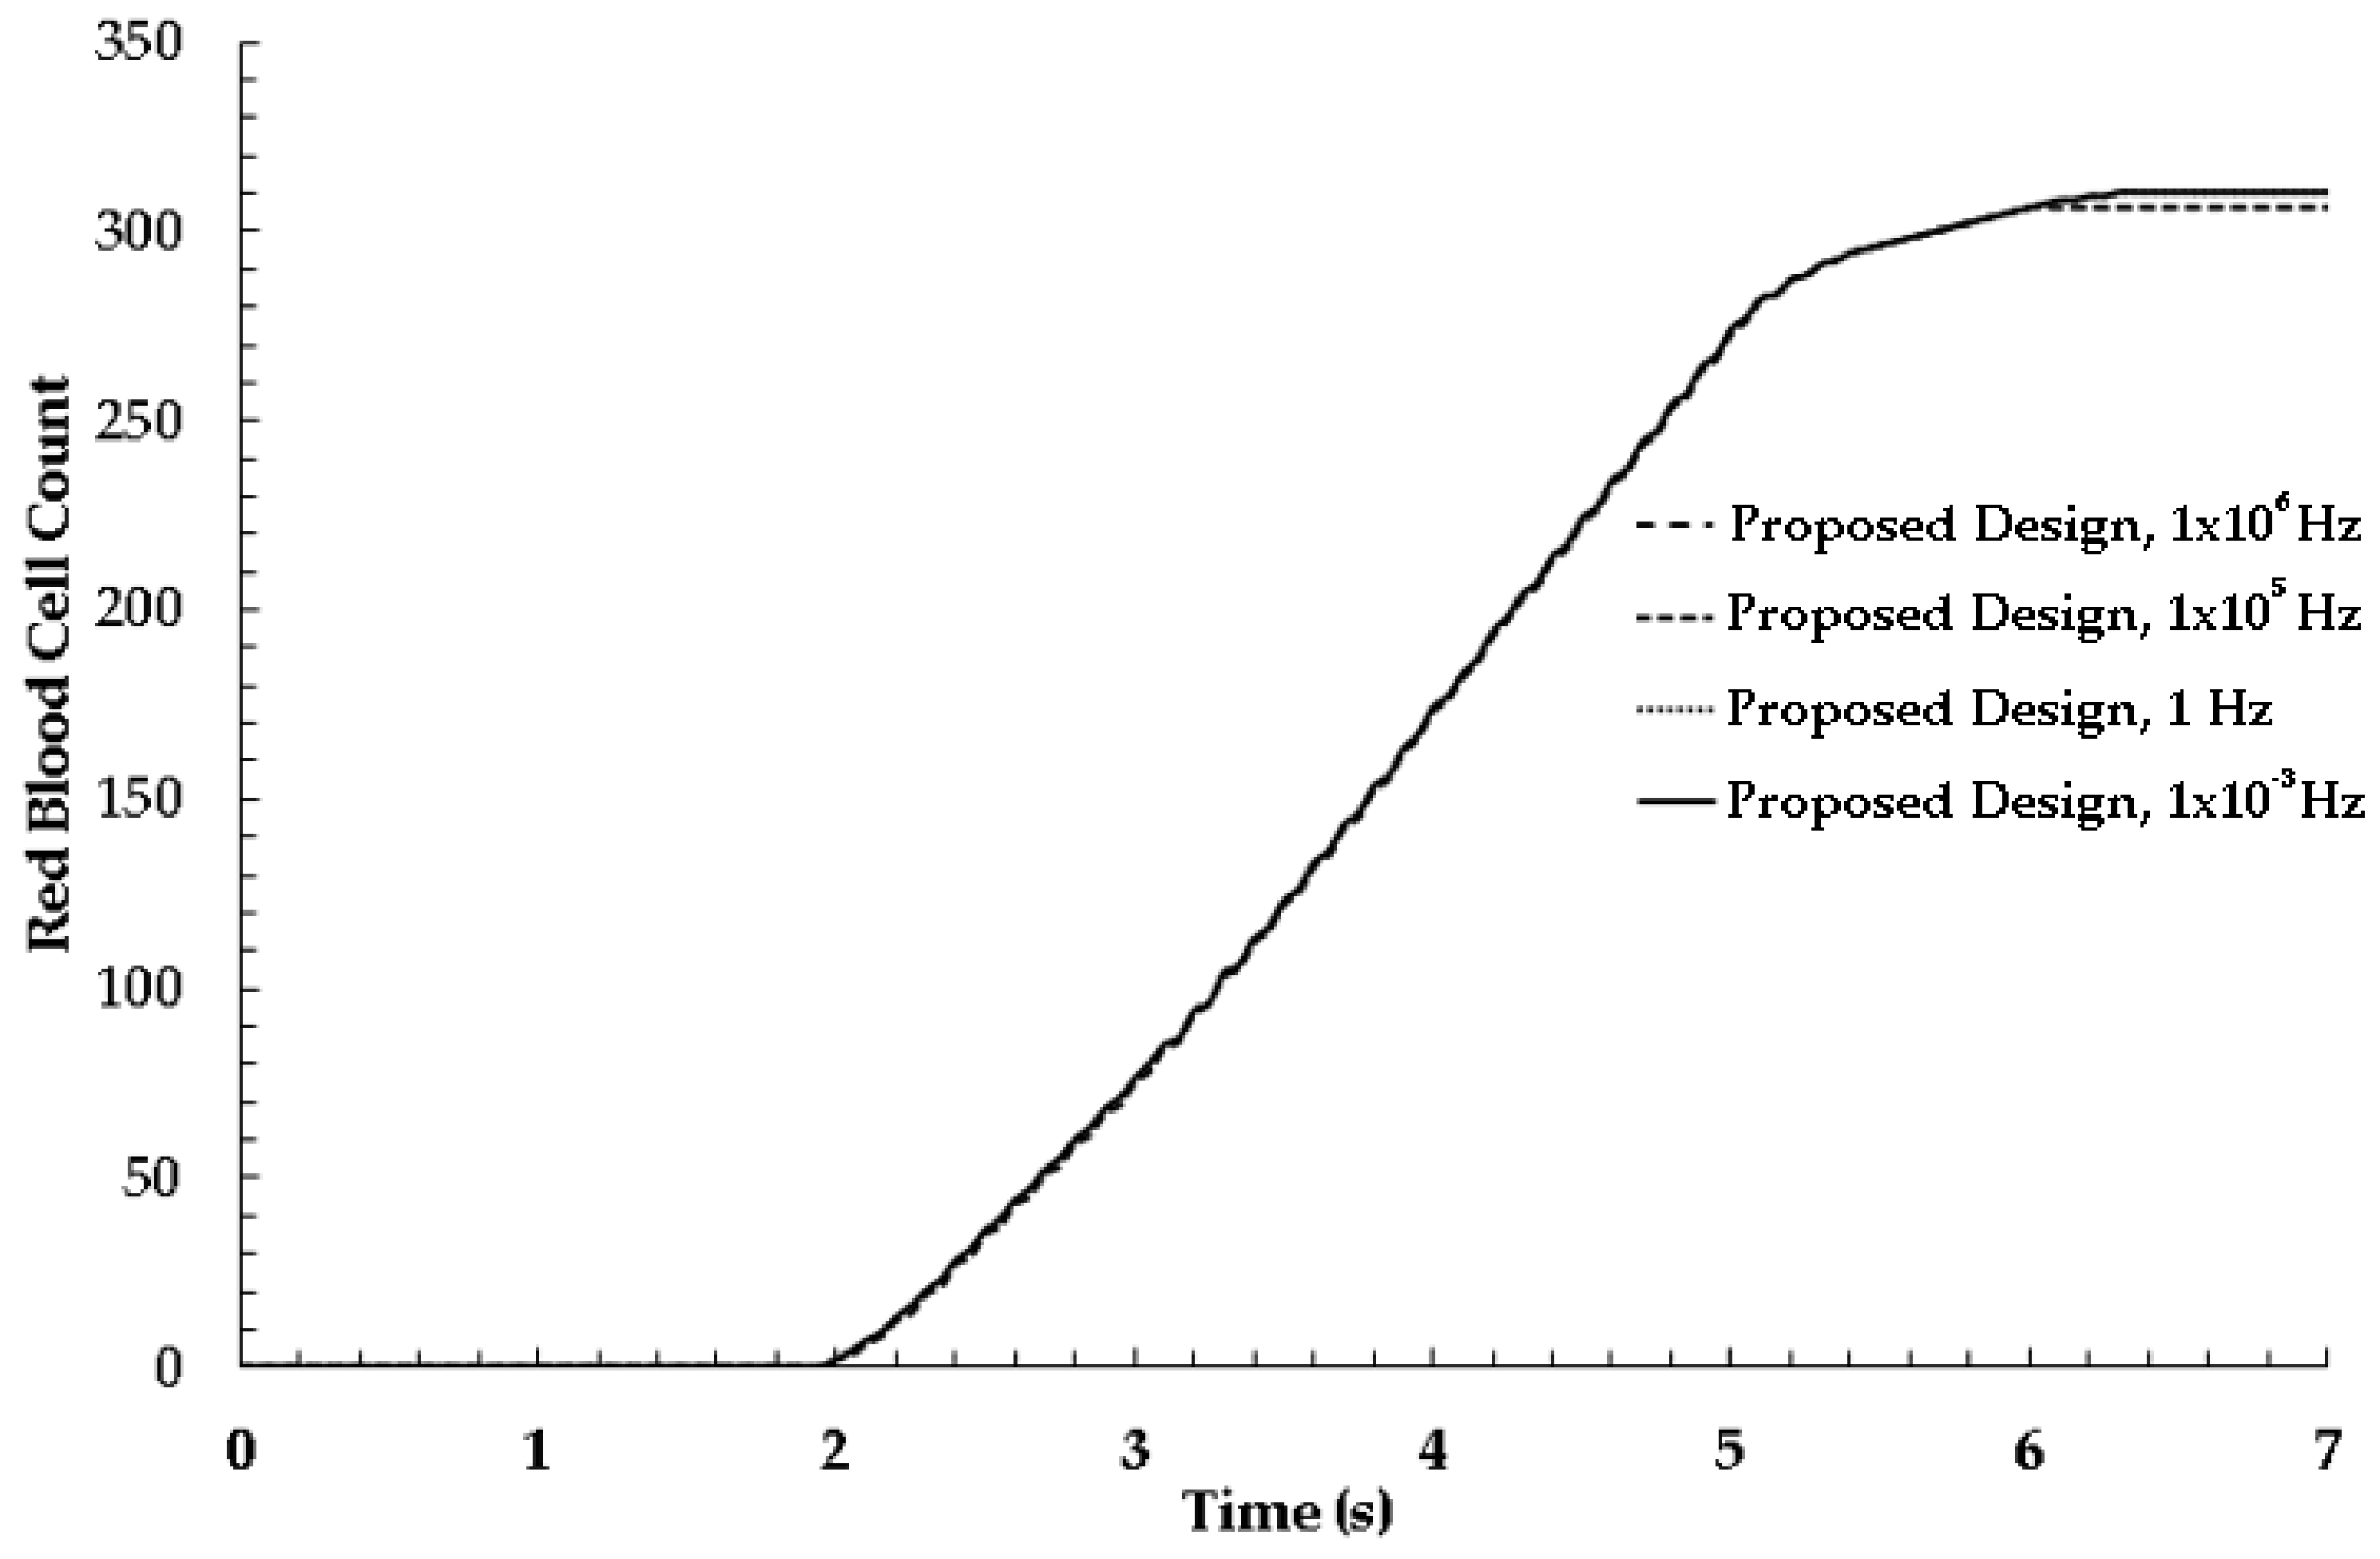
- The presentation of an operating parameter optimization study on driving parameters such as frequency and voltage settings.
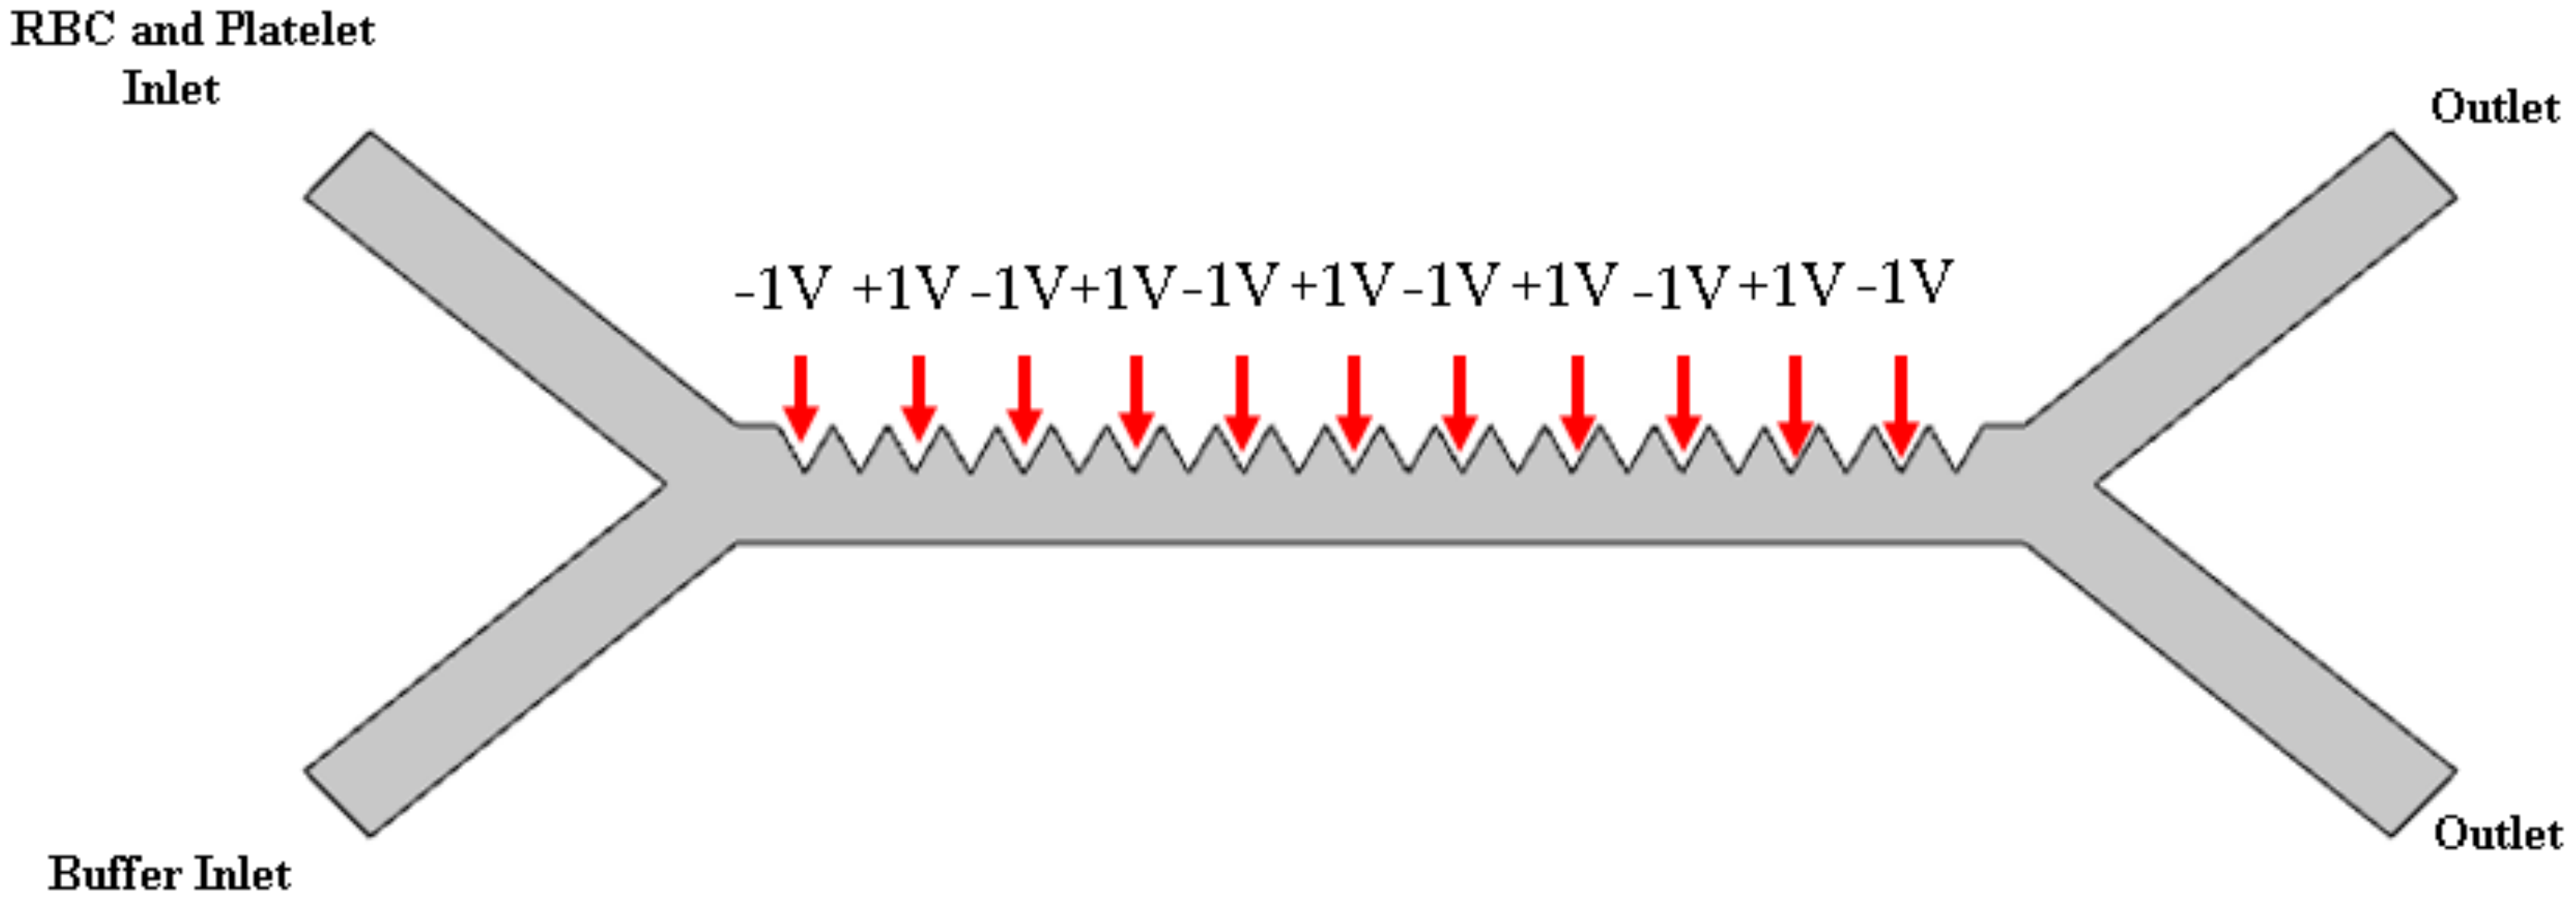
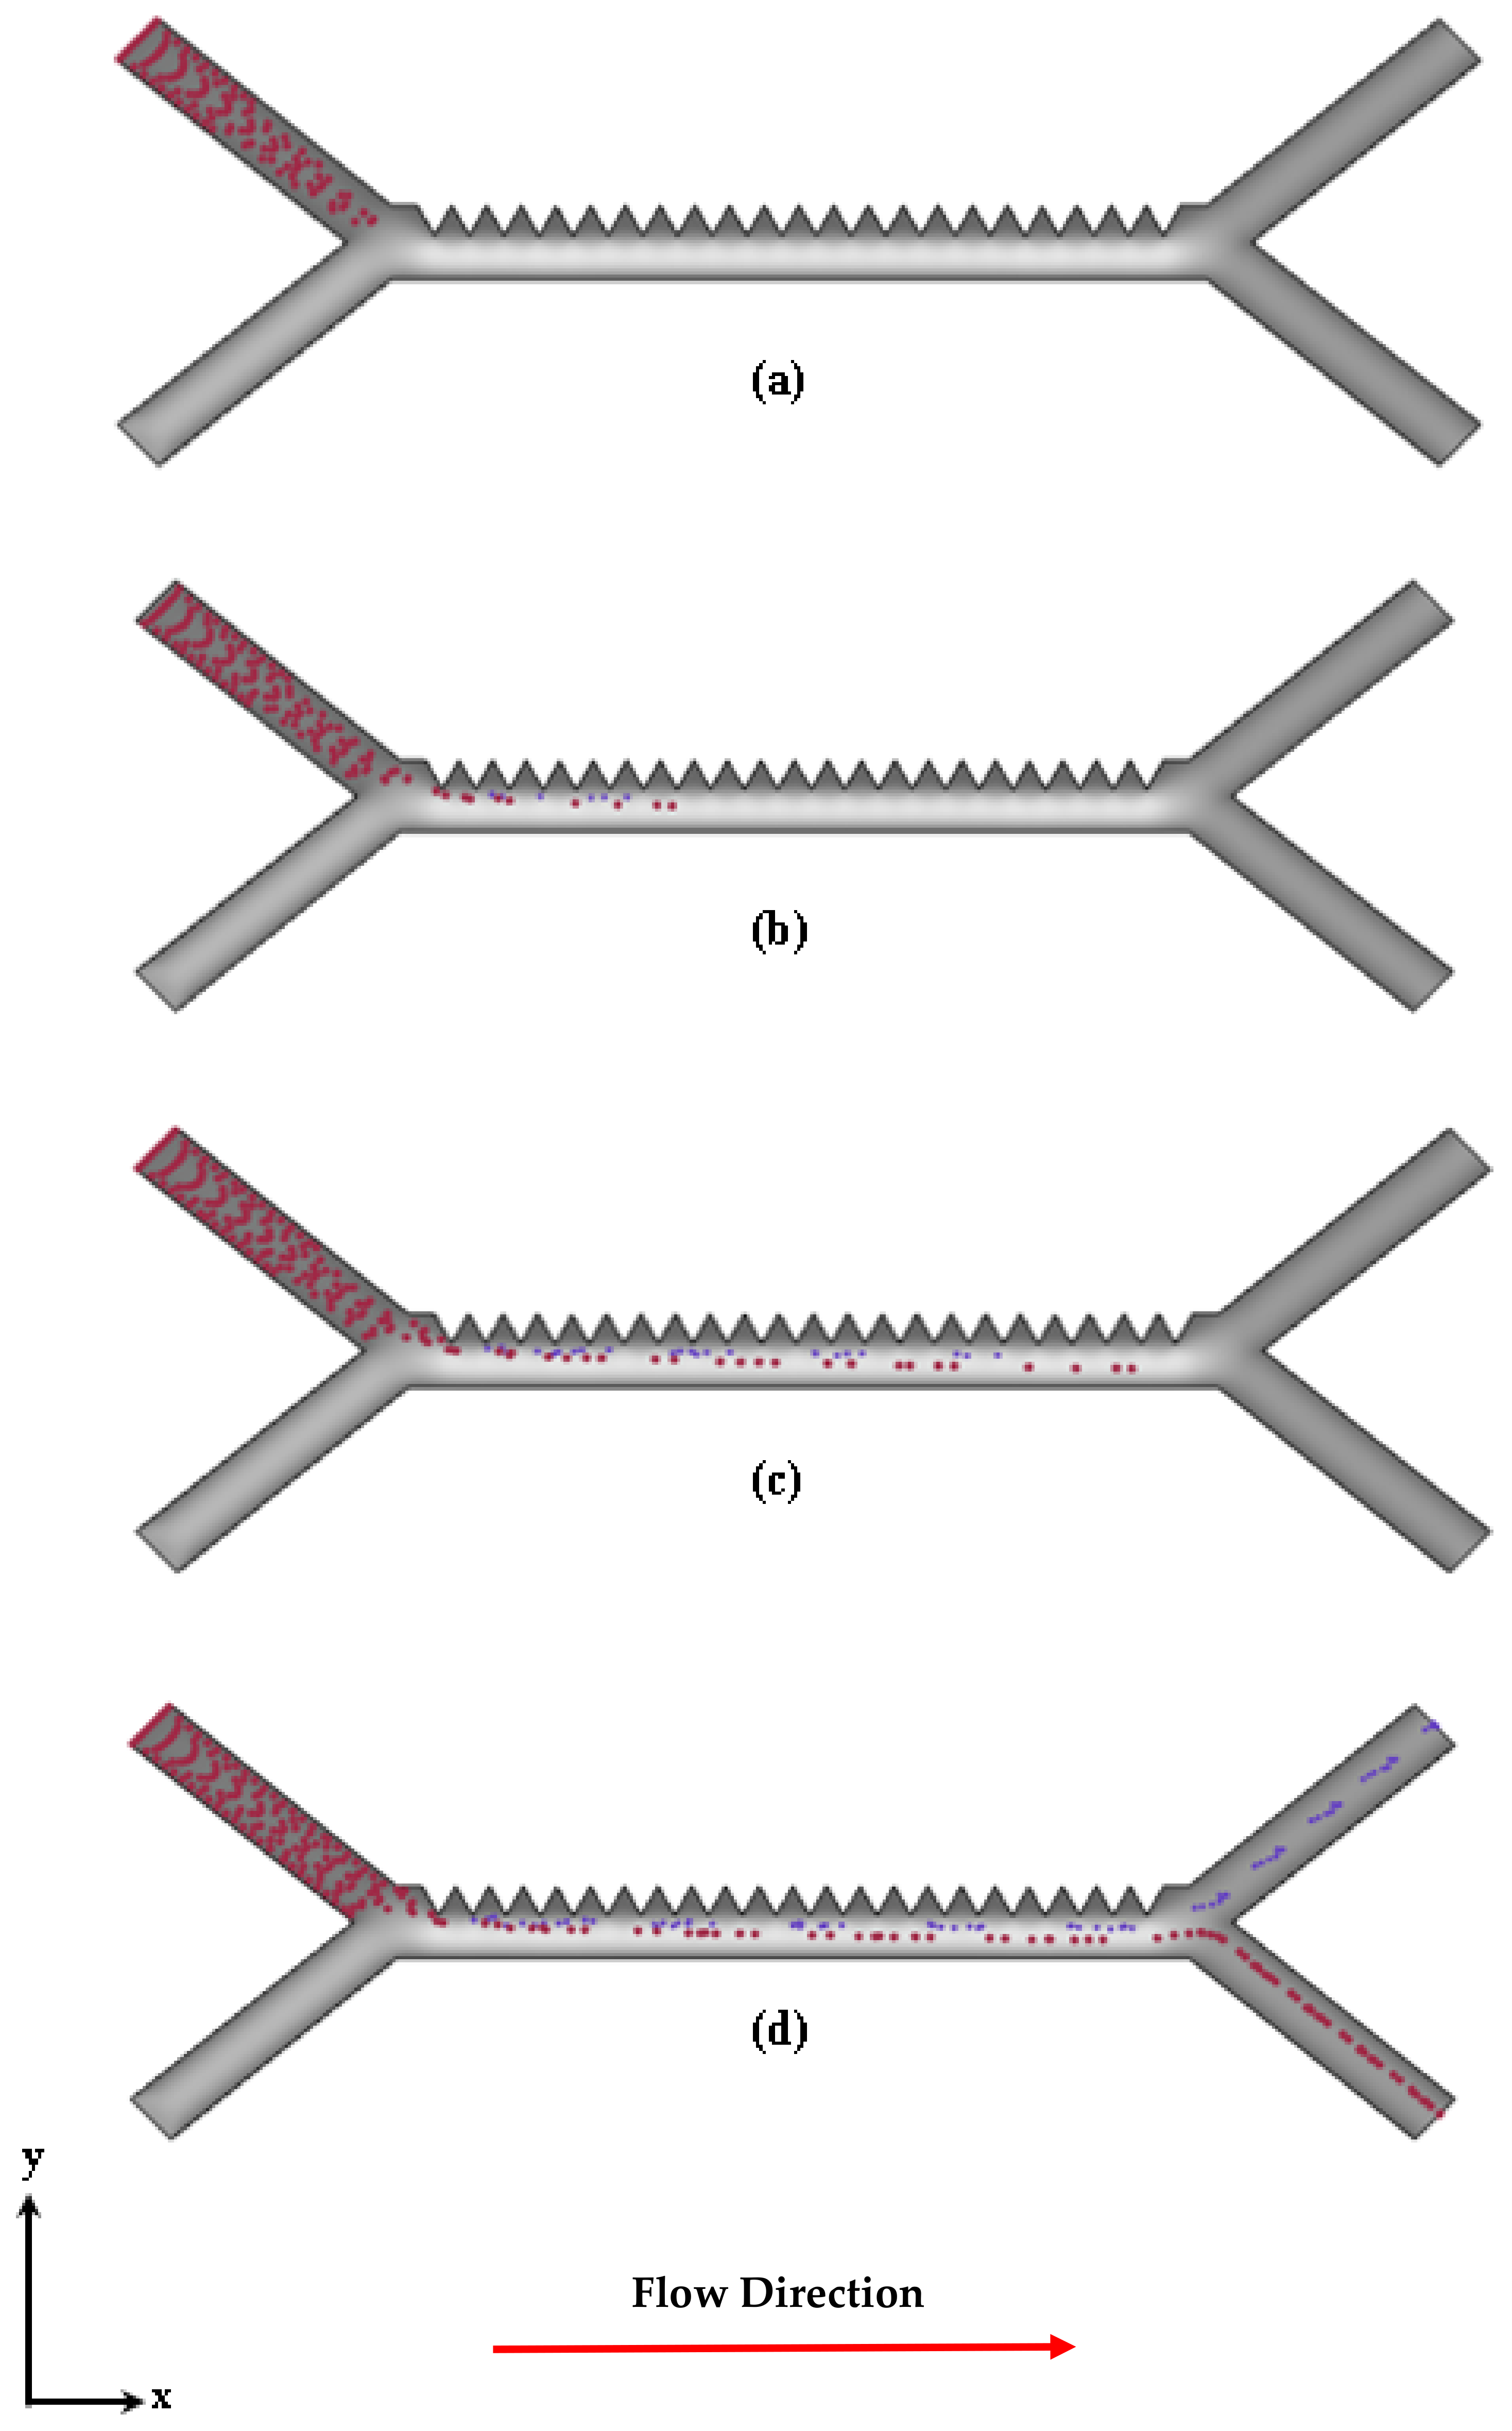
- The results of the simulation study suggest that the saw-tooth electrode design appears to be an improvement over existing designs in that the sharp corners reduced the required horizontal distance needed for separation to occur and contributed to a non-uniform DEP electric field.
- The results of this simulation study suggest that this DEP separation technique may potentially be applied to improve the efficiency of separation processes of biological sample scenarios and simultaneously increase the accuracy of diagnostic processes via cell counting and sorting.
2. Methodology
2.1. Laminar Microfluid Flow Modelling
2.2. Mesh Independence Evaluation Methodology
2.3. Electric Field Modelling Methodology
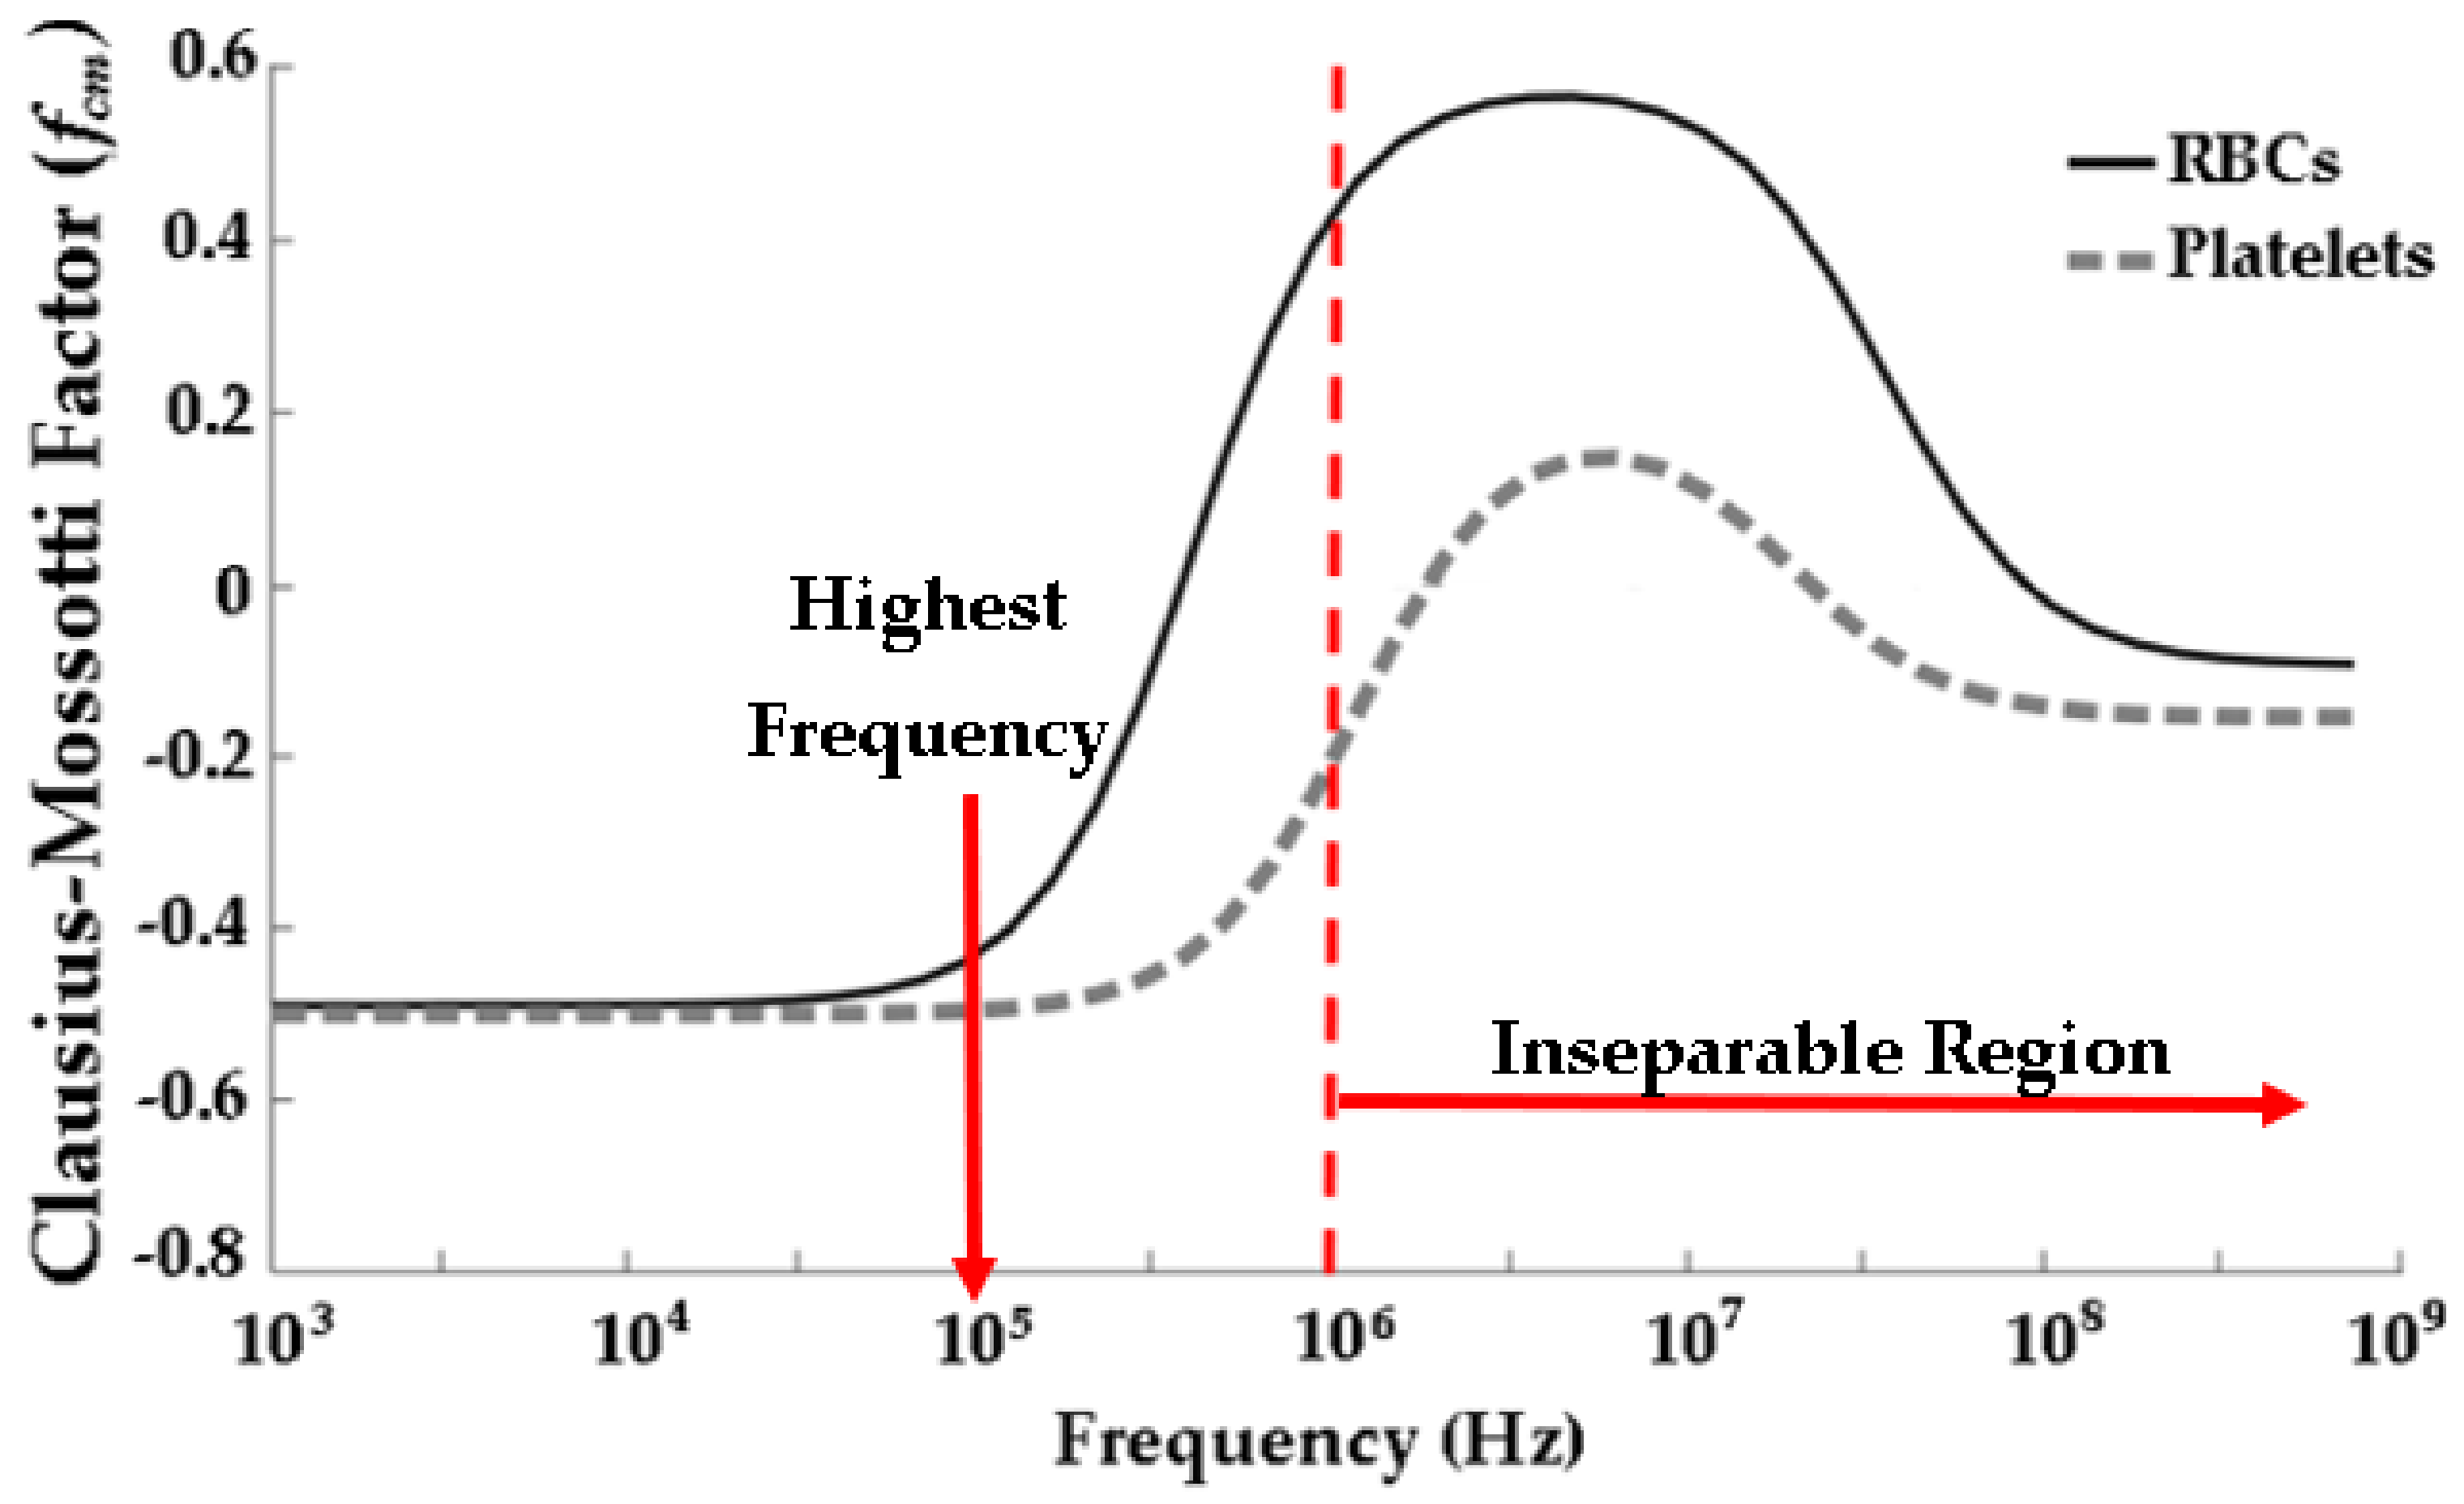
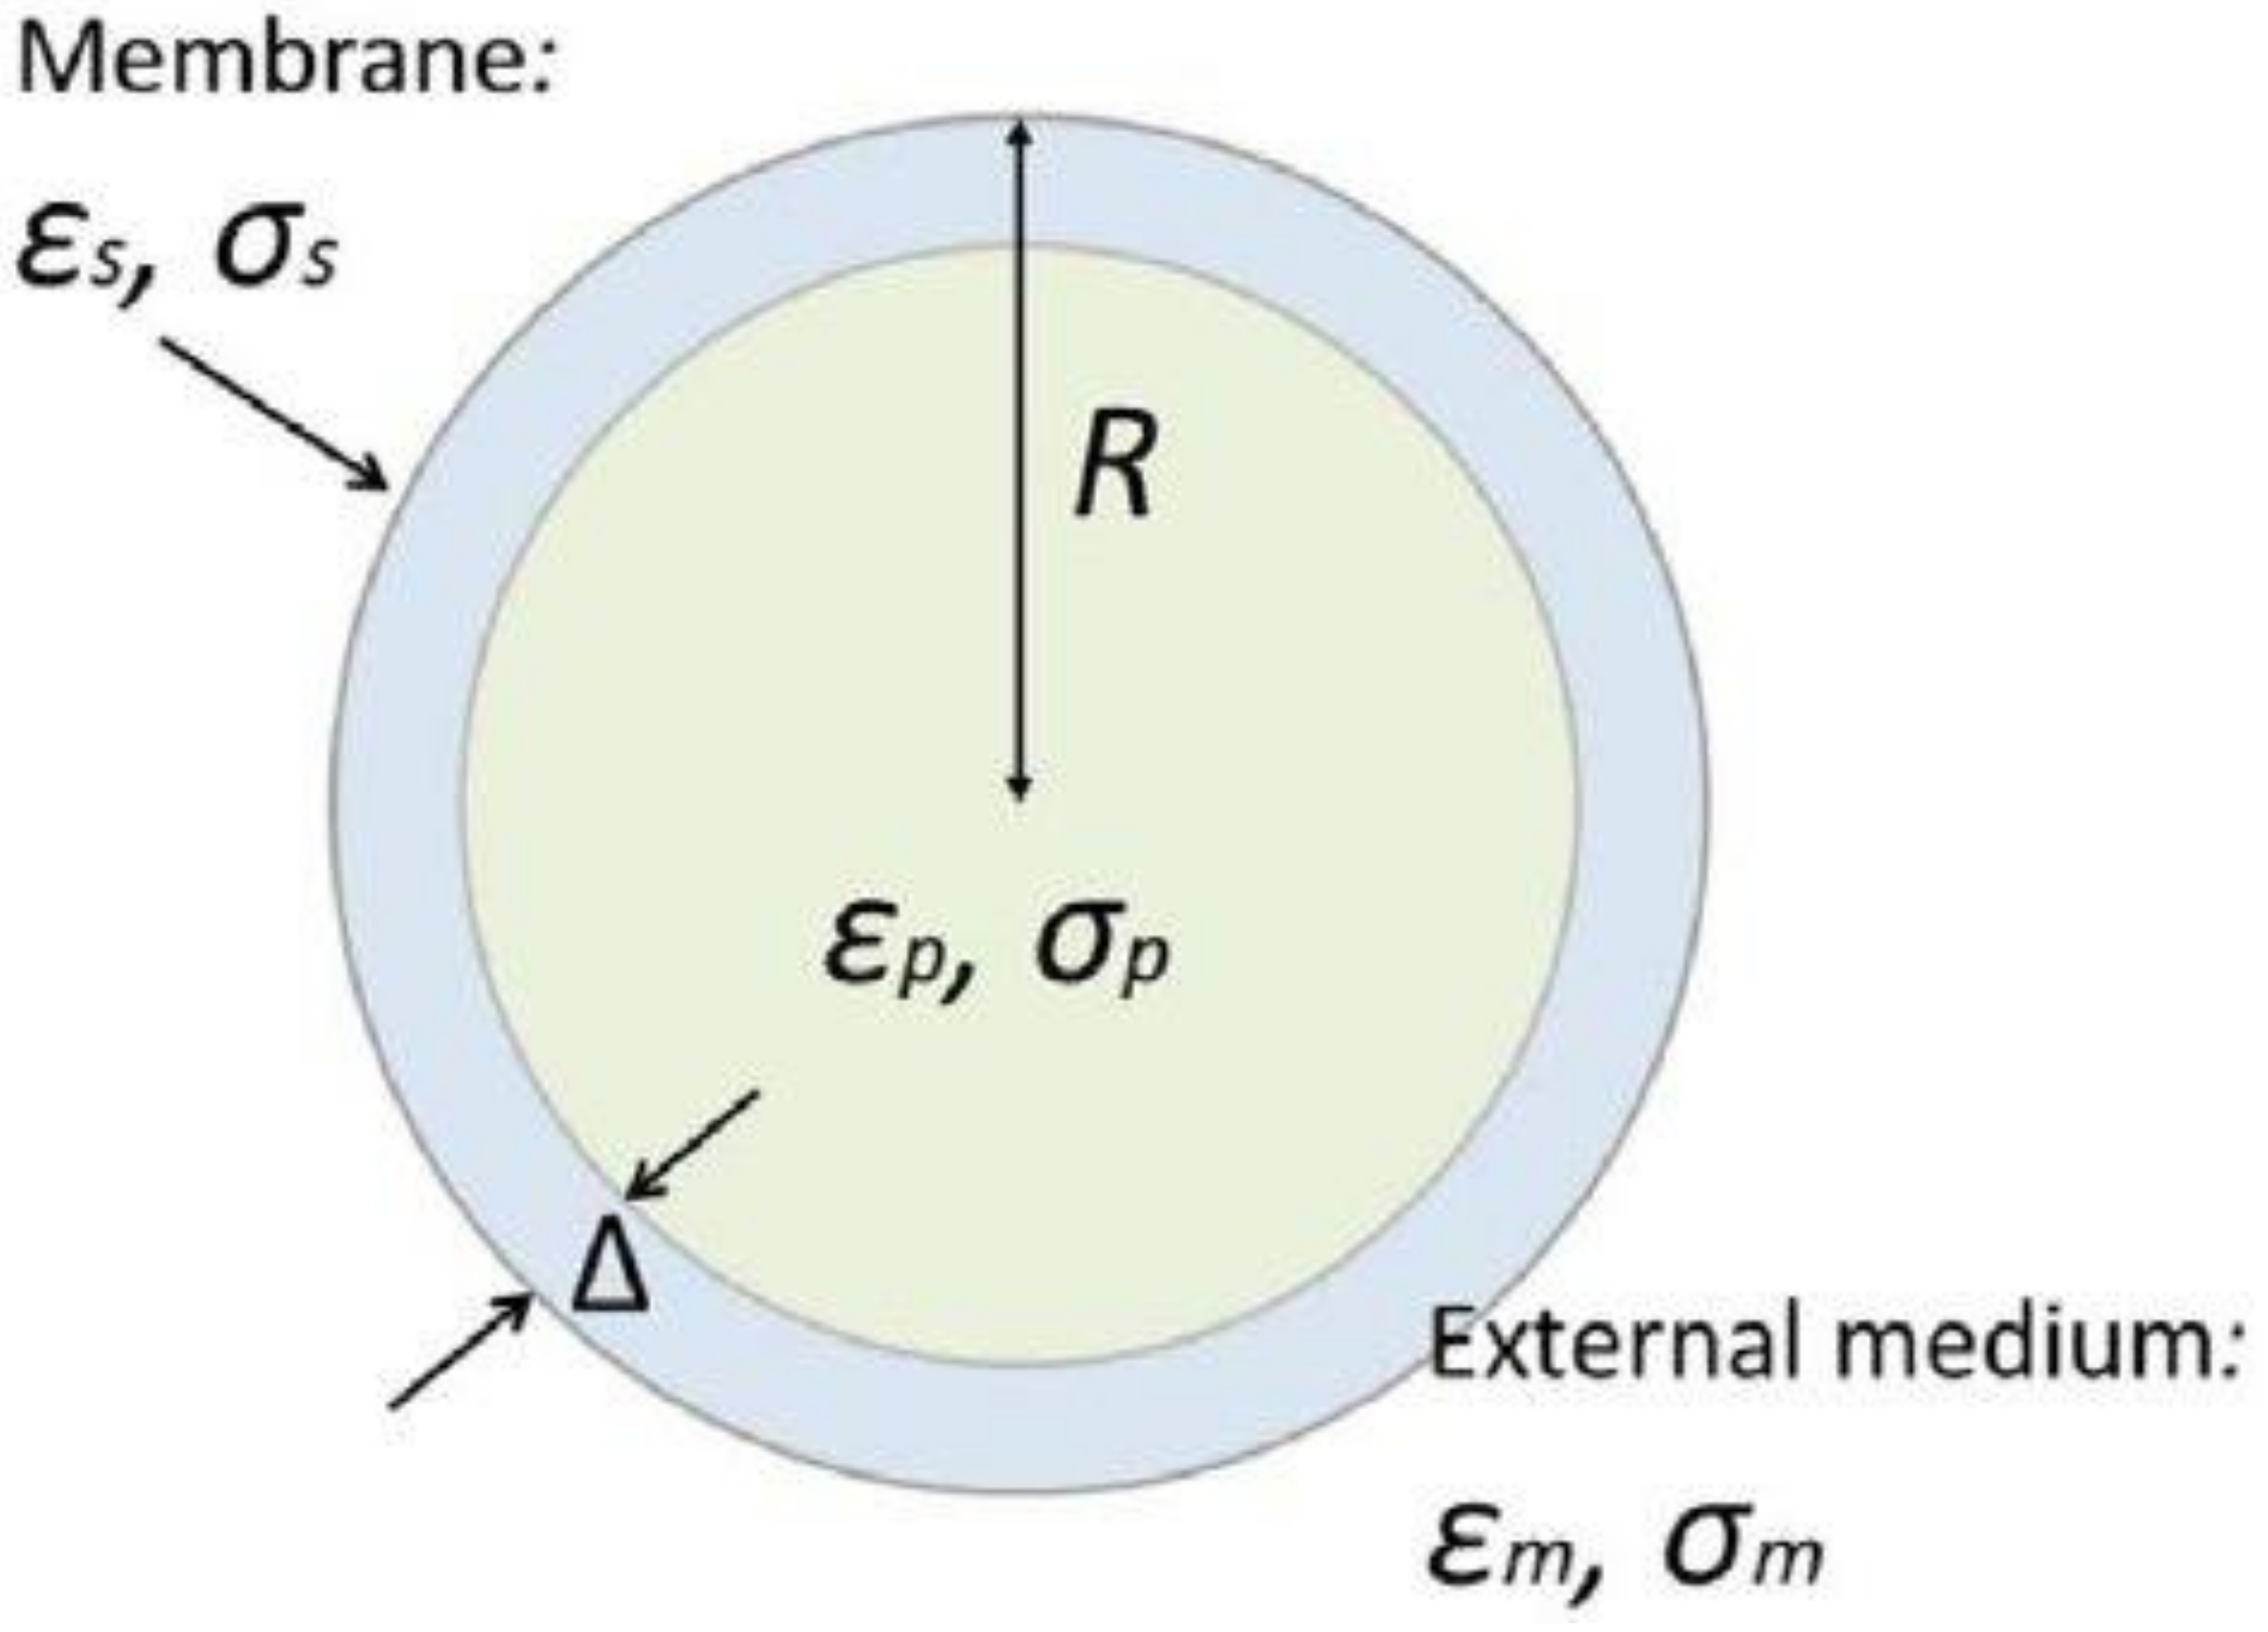
2.4. Dielectrophoresis Theory
2.5. Cell Trajectory Modelling
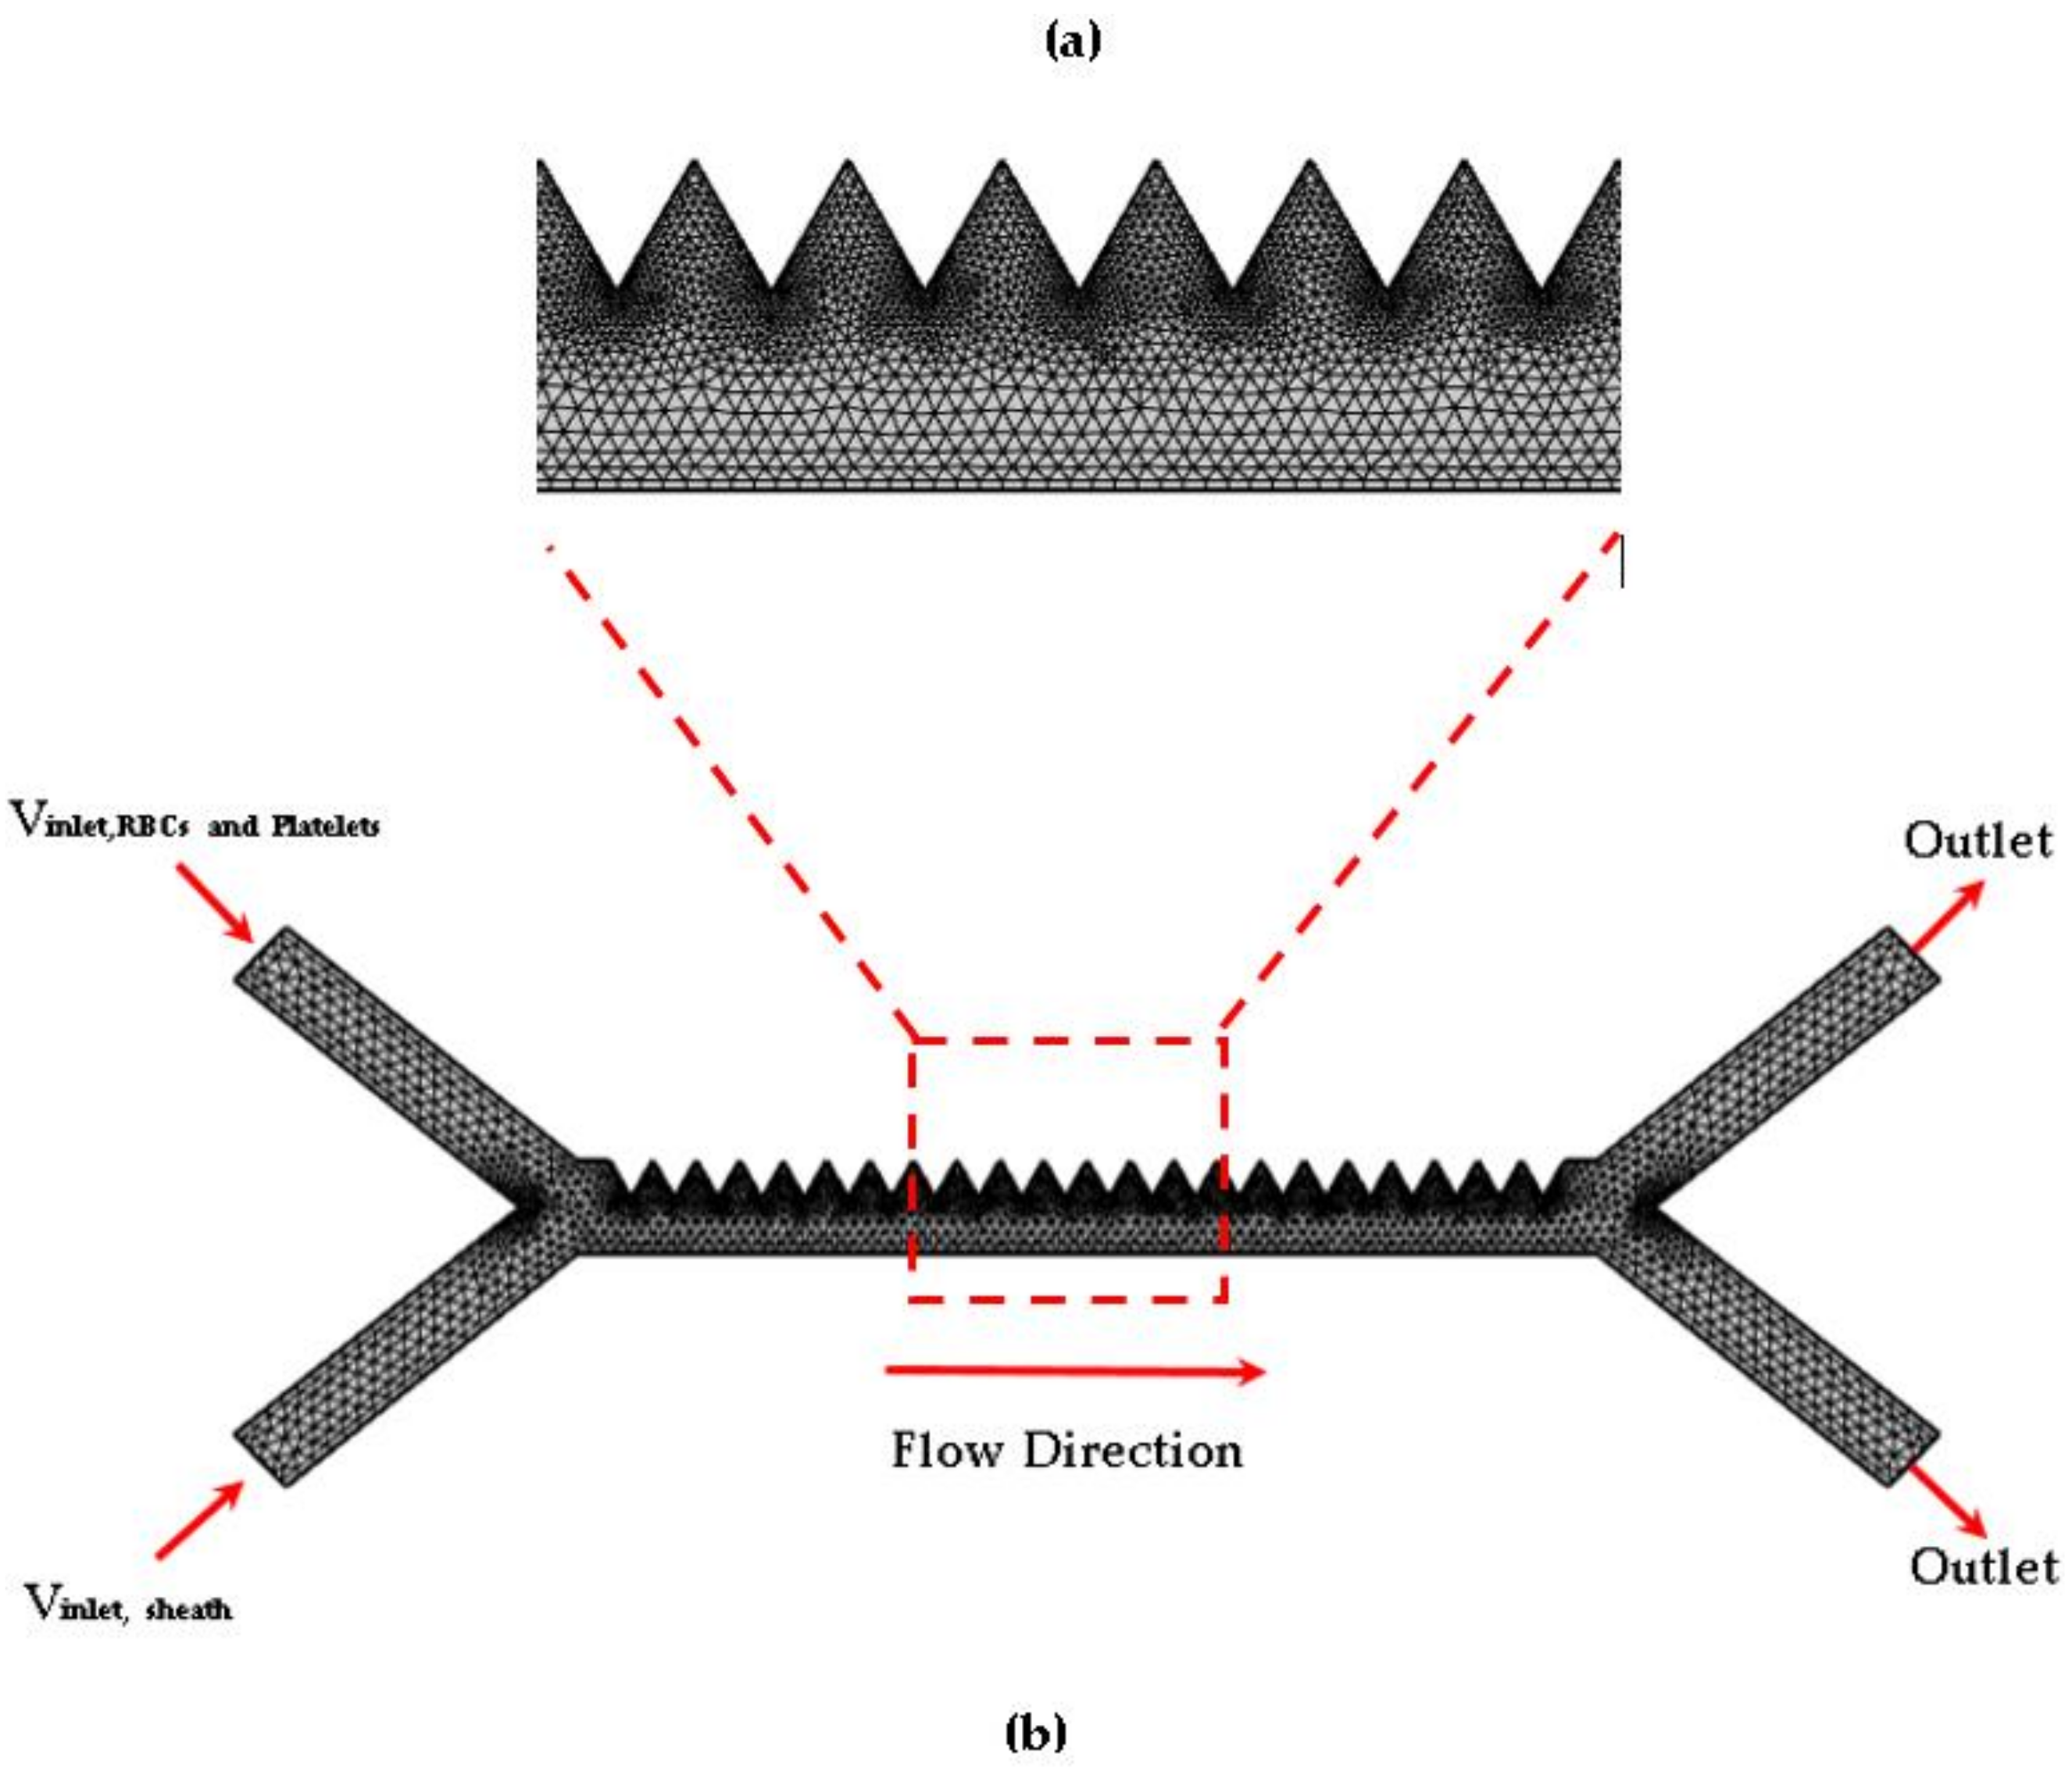
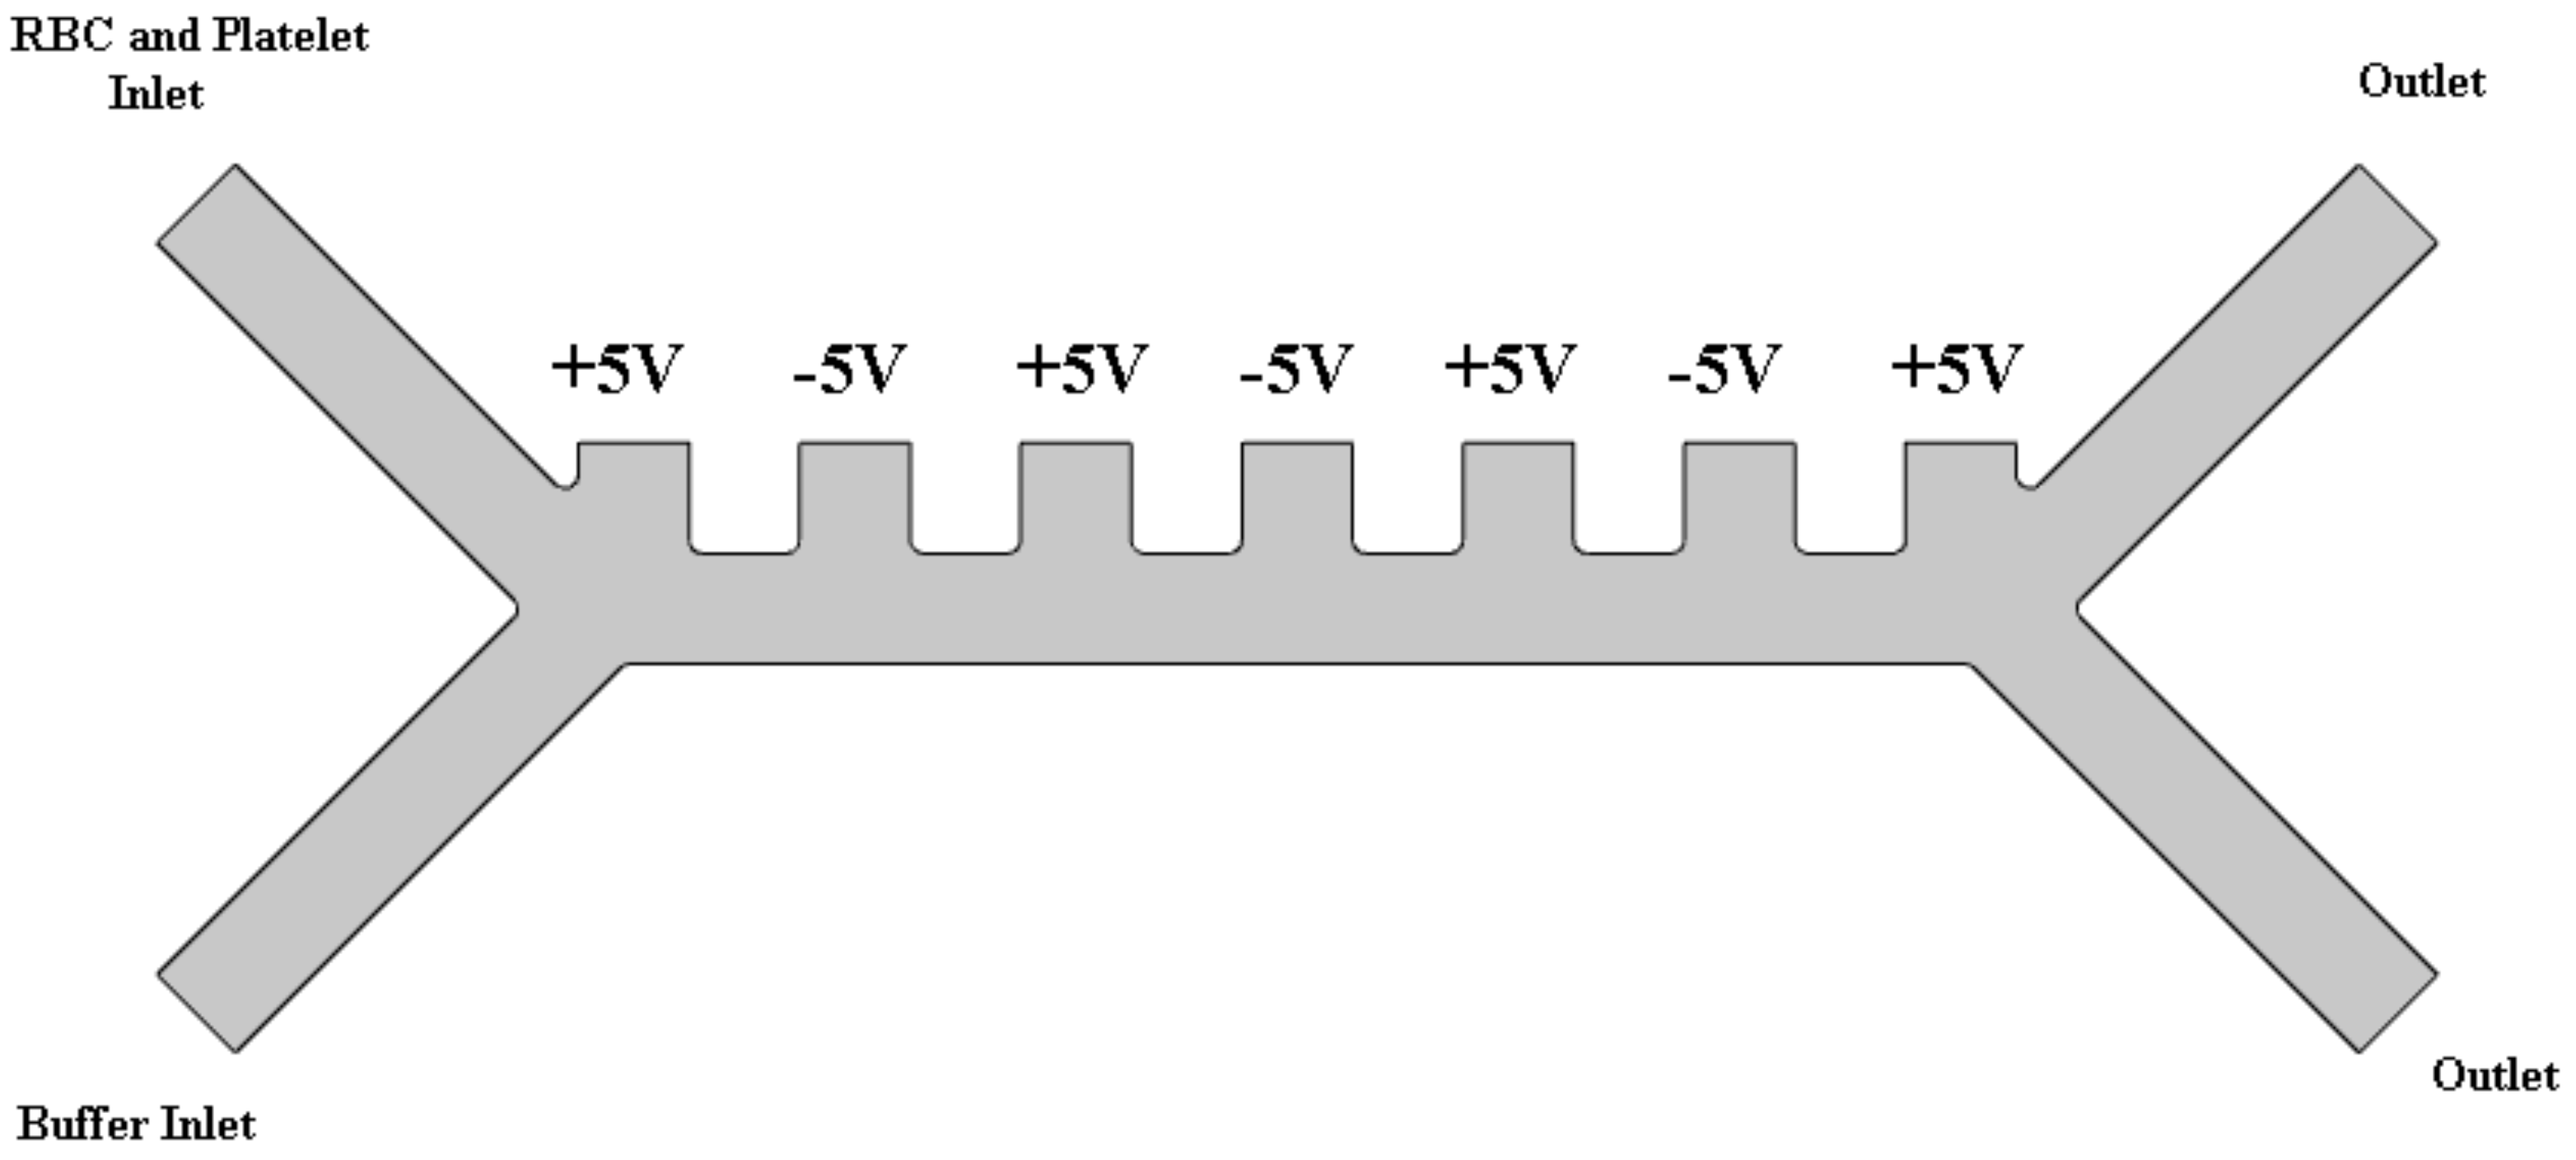
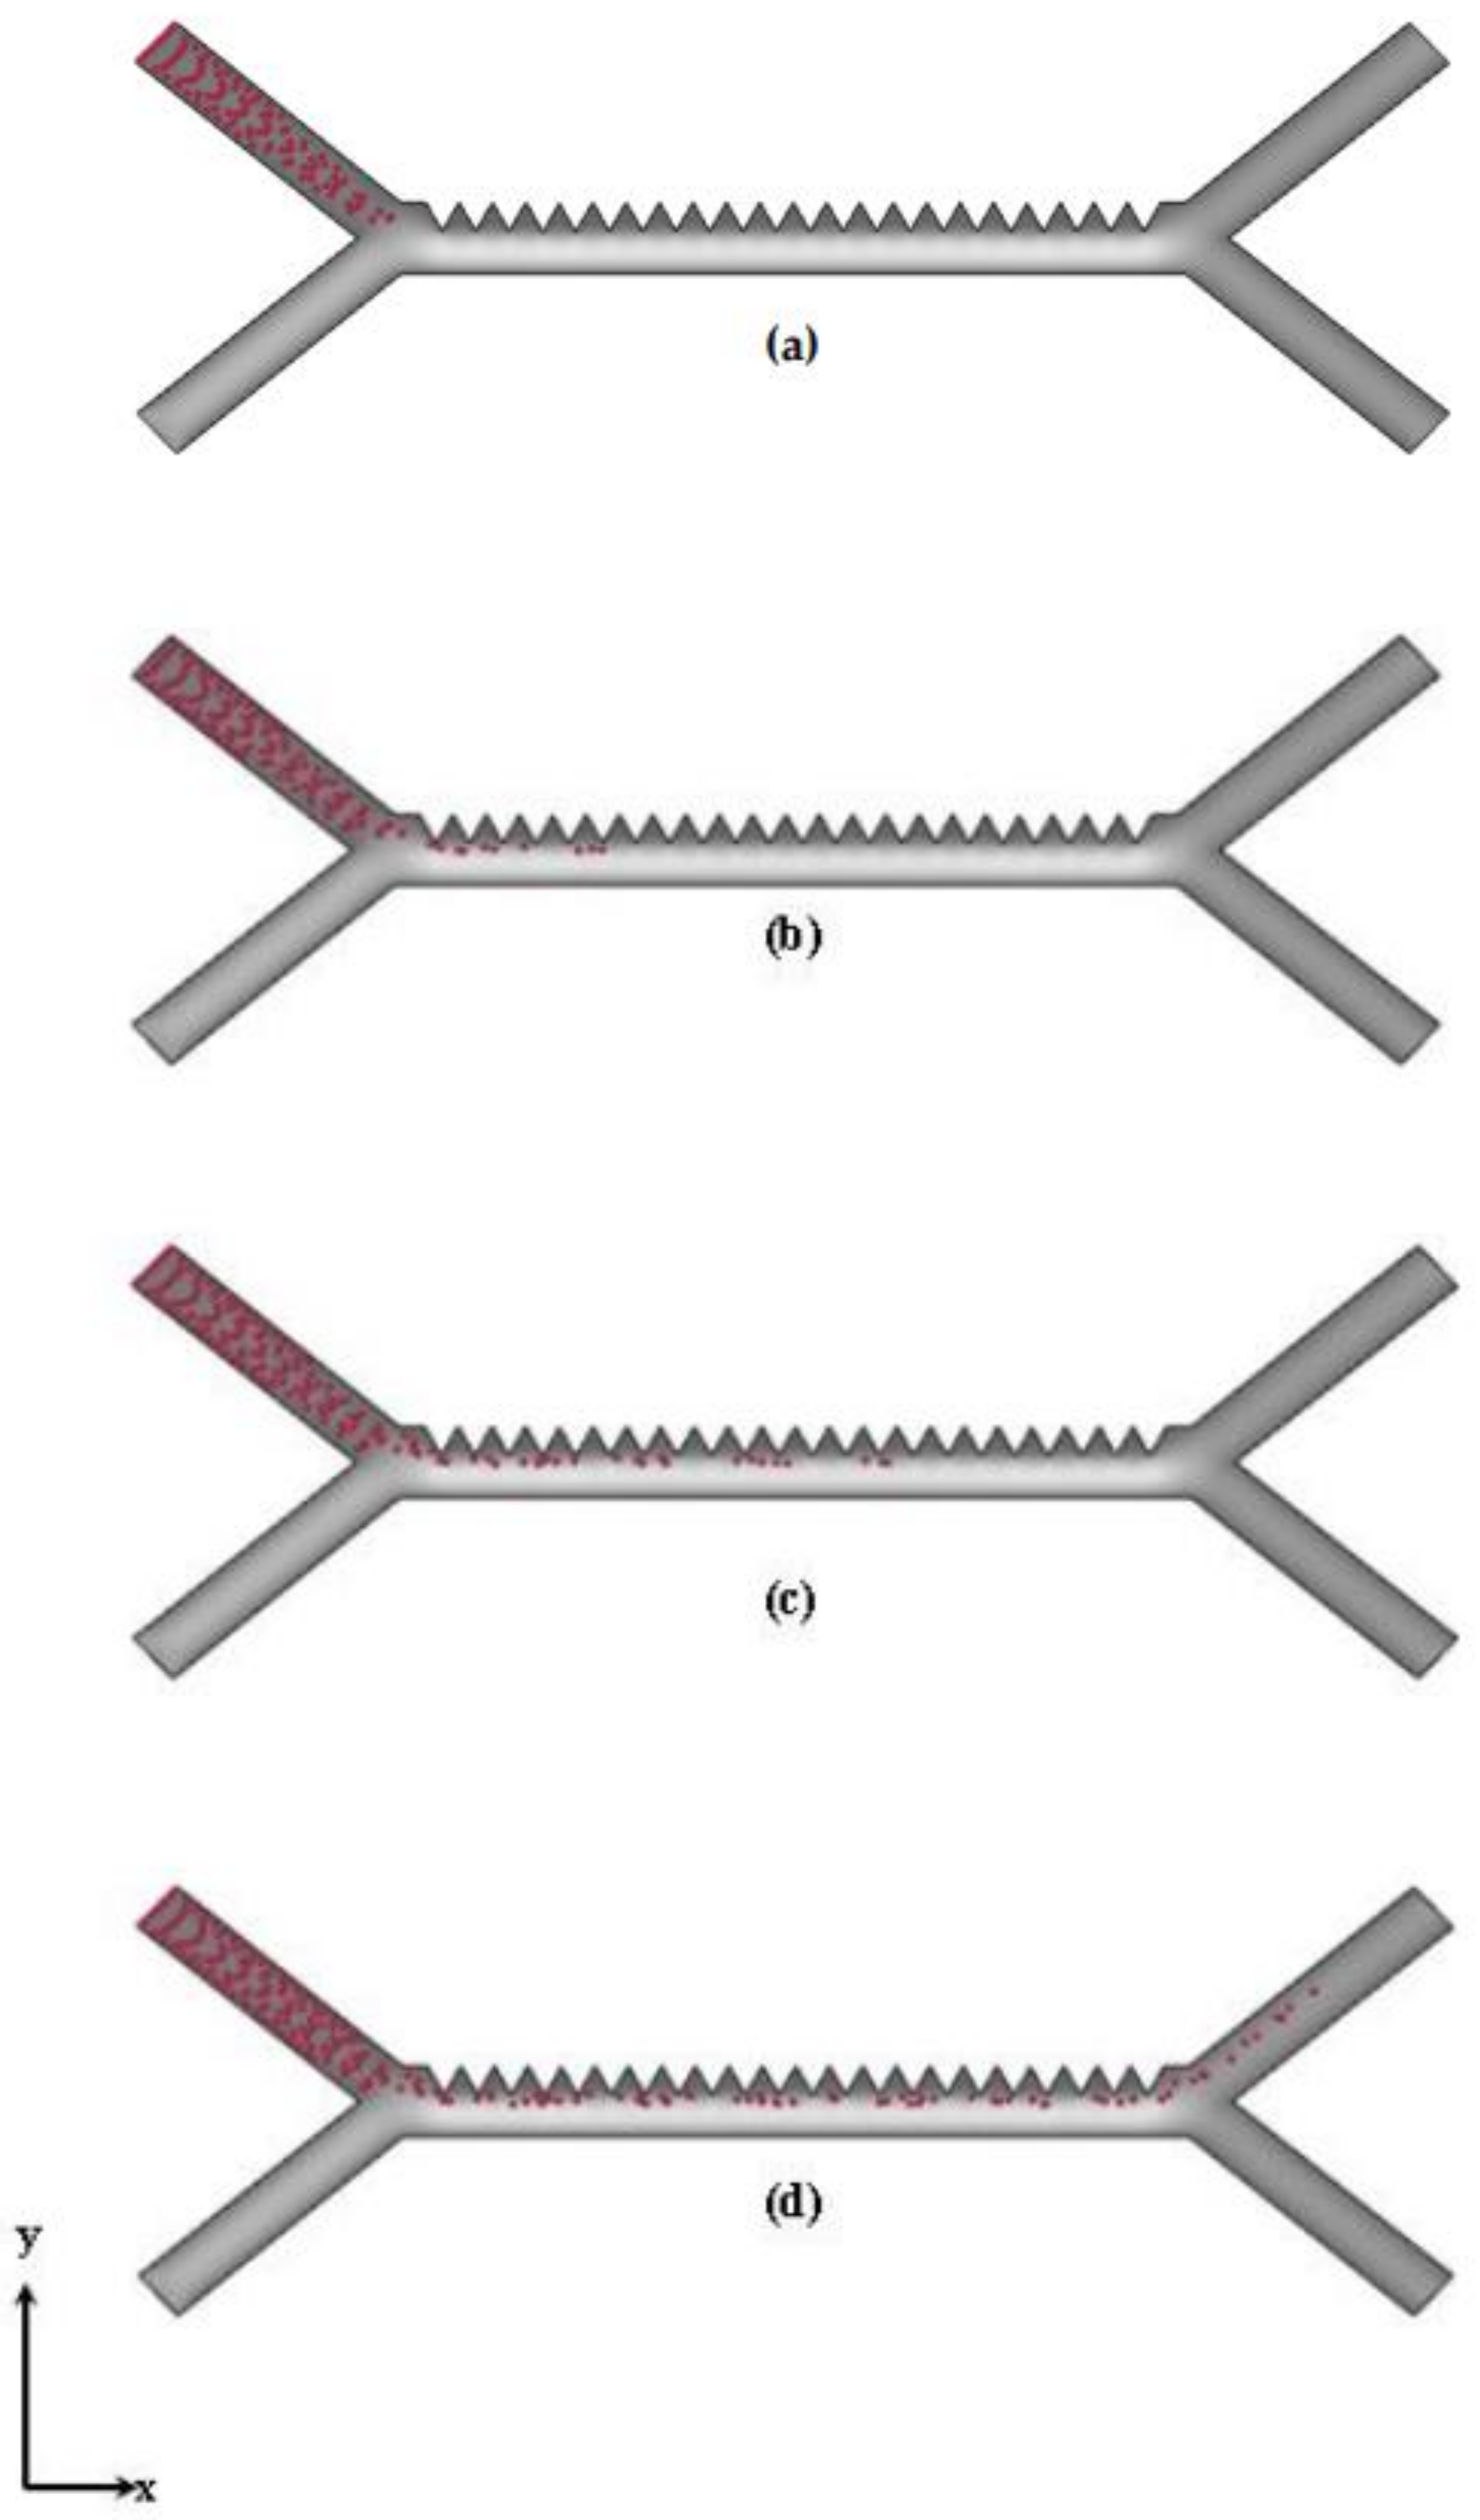
2.6. Device Geometric Modelling
3. Results
3.1. Model Validation Results Via Comparison to Previous Works
3.1.1. Verification of Computational Modelling through Model Comparisons
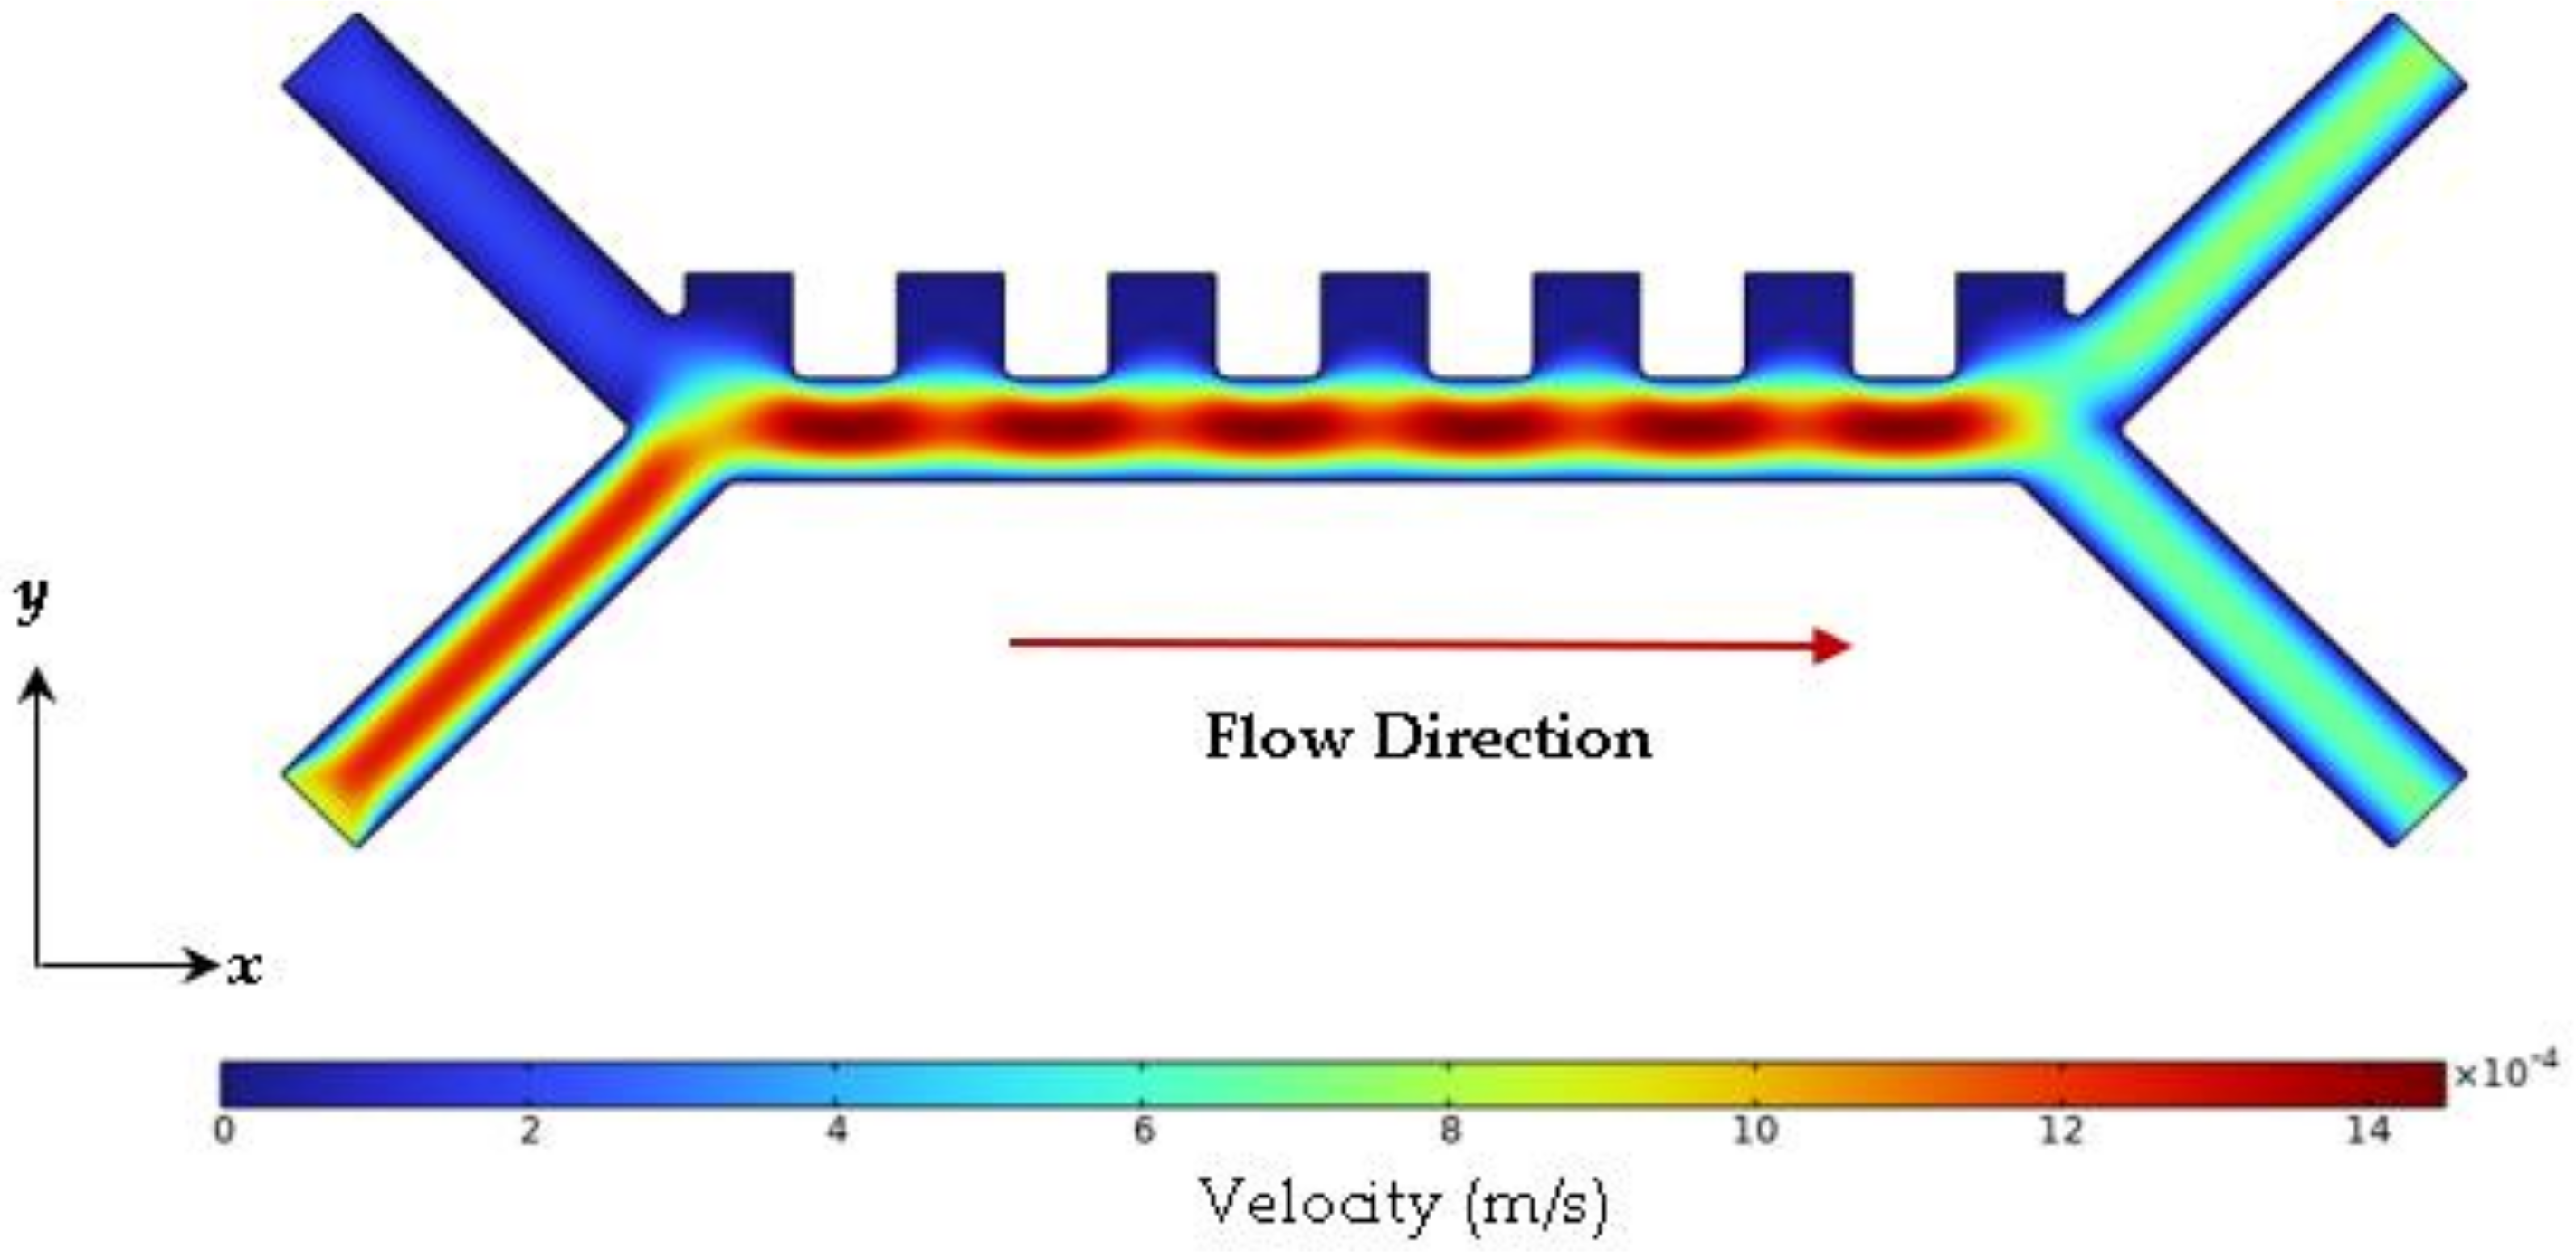
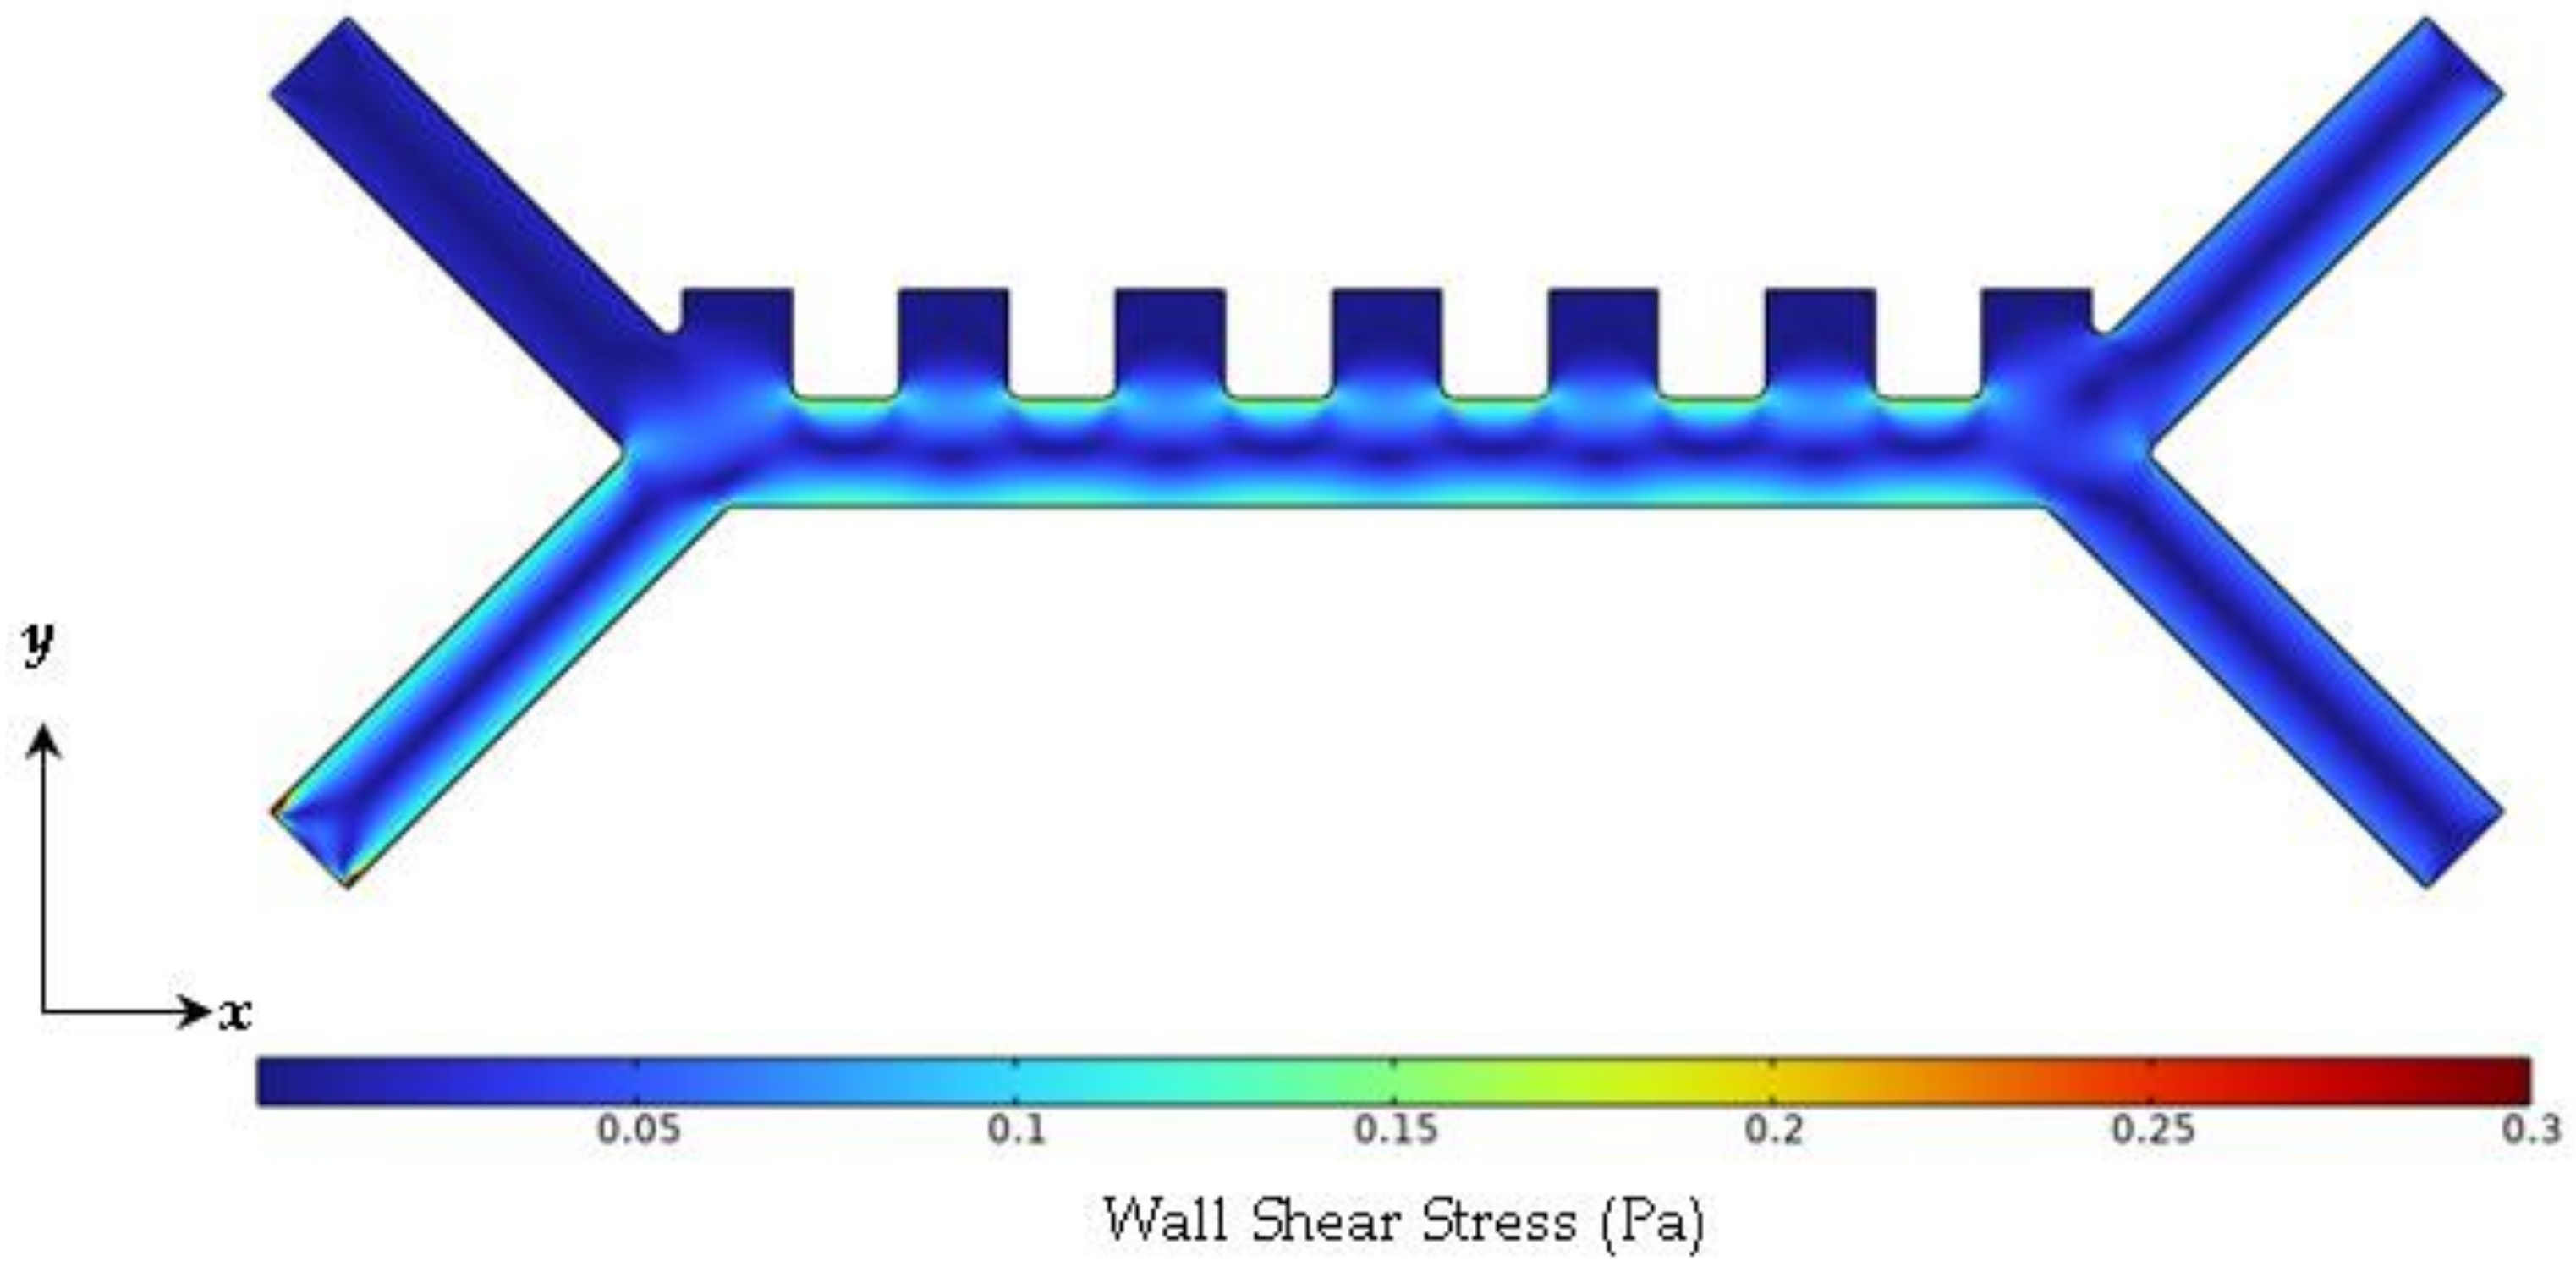
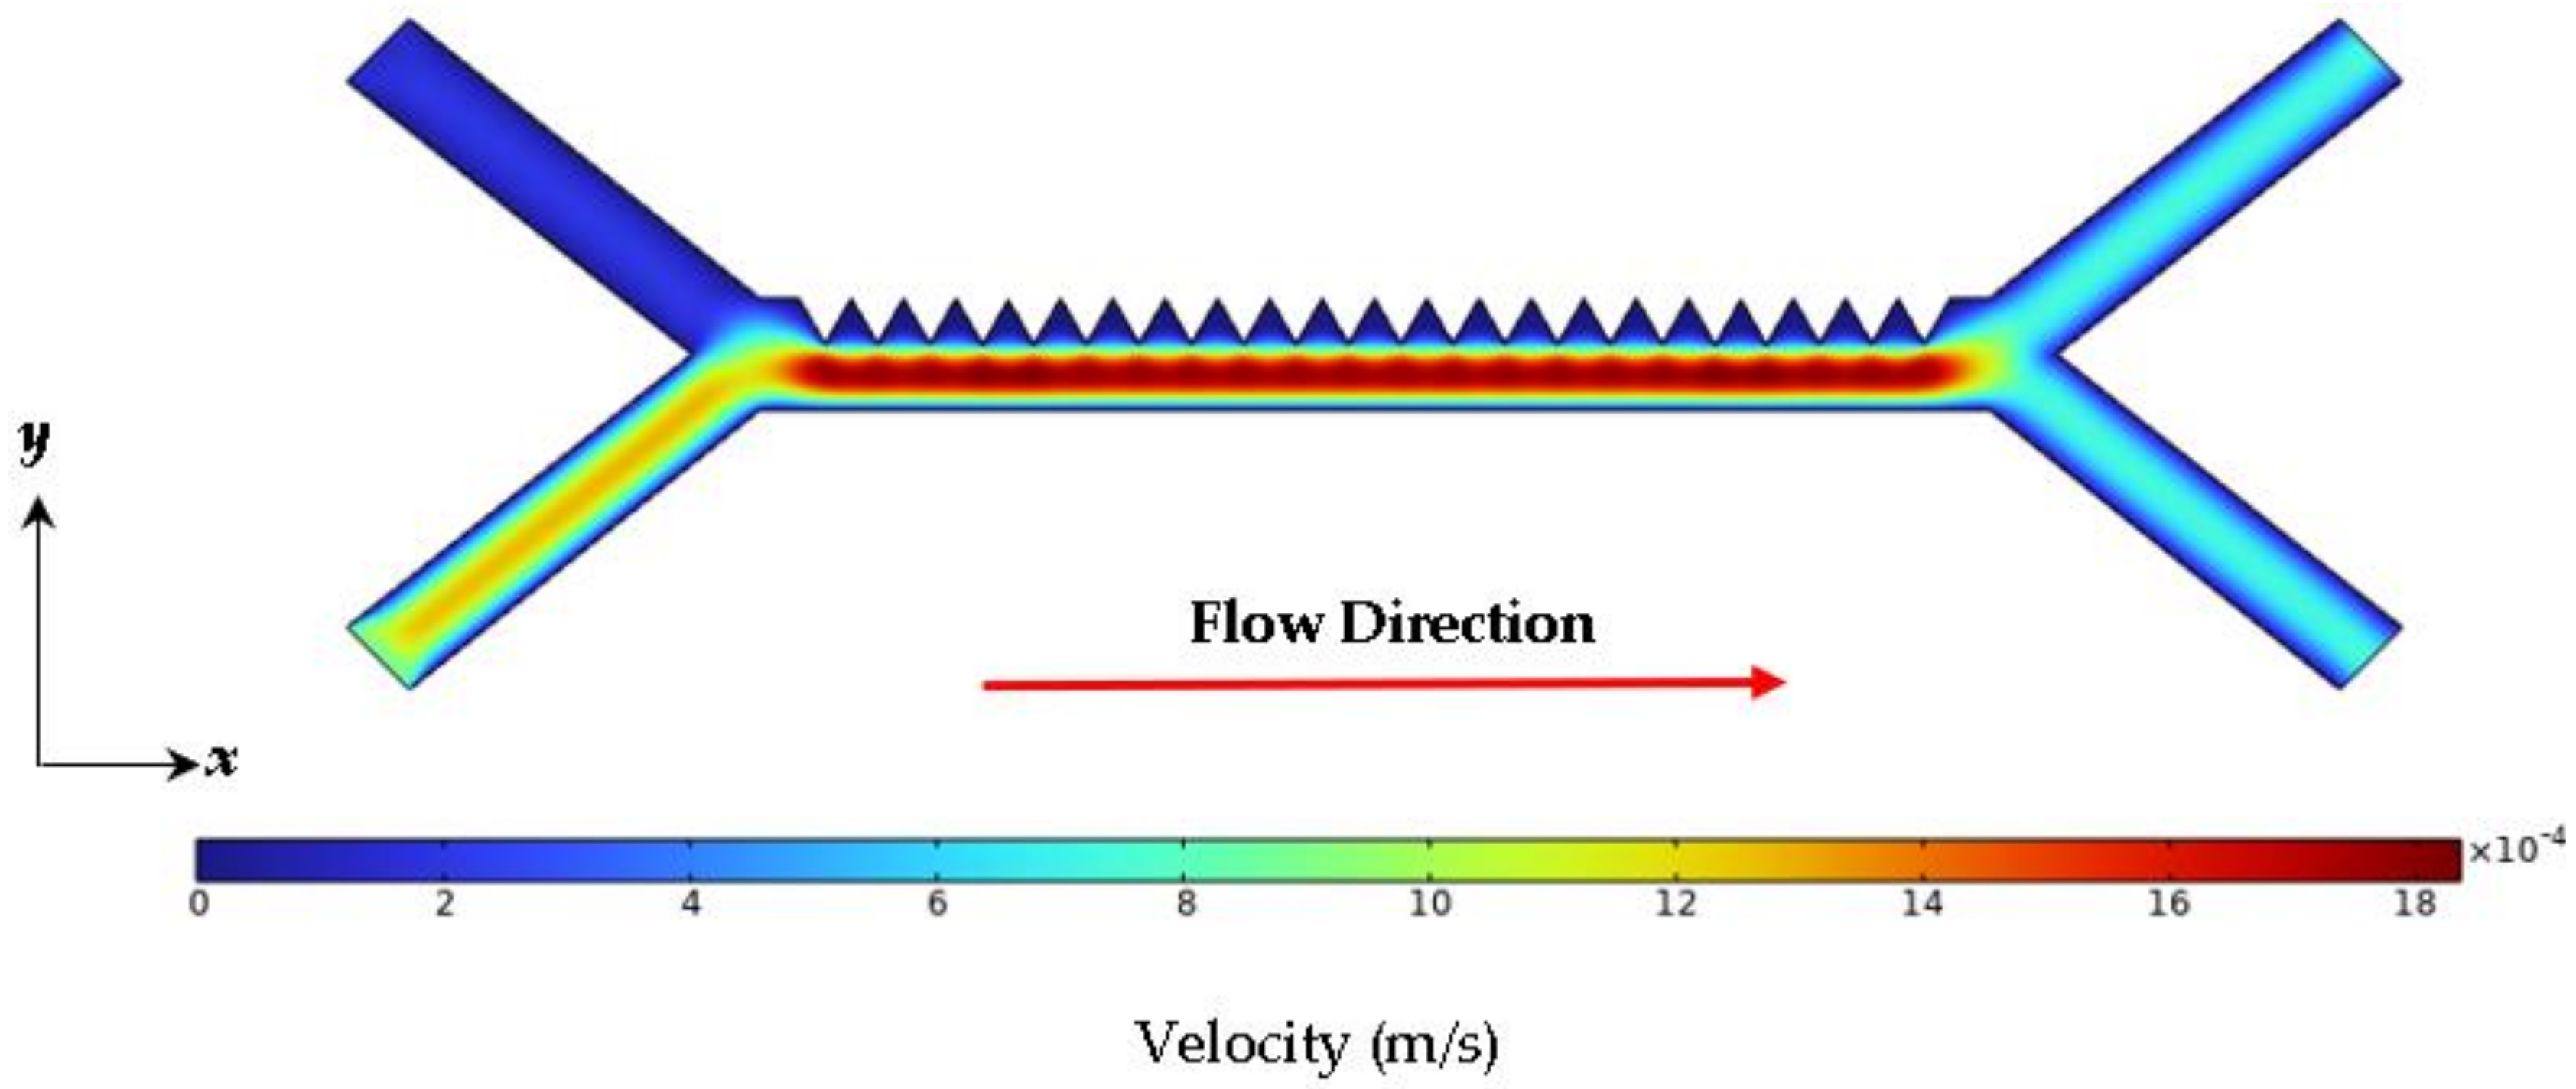
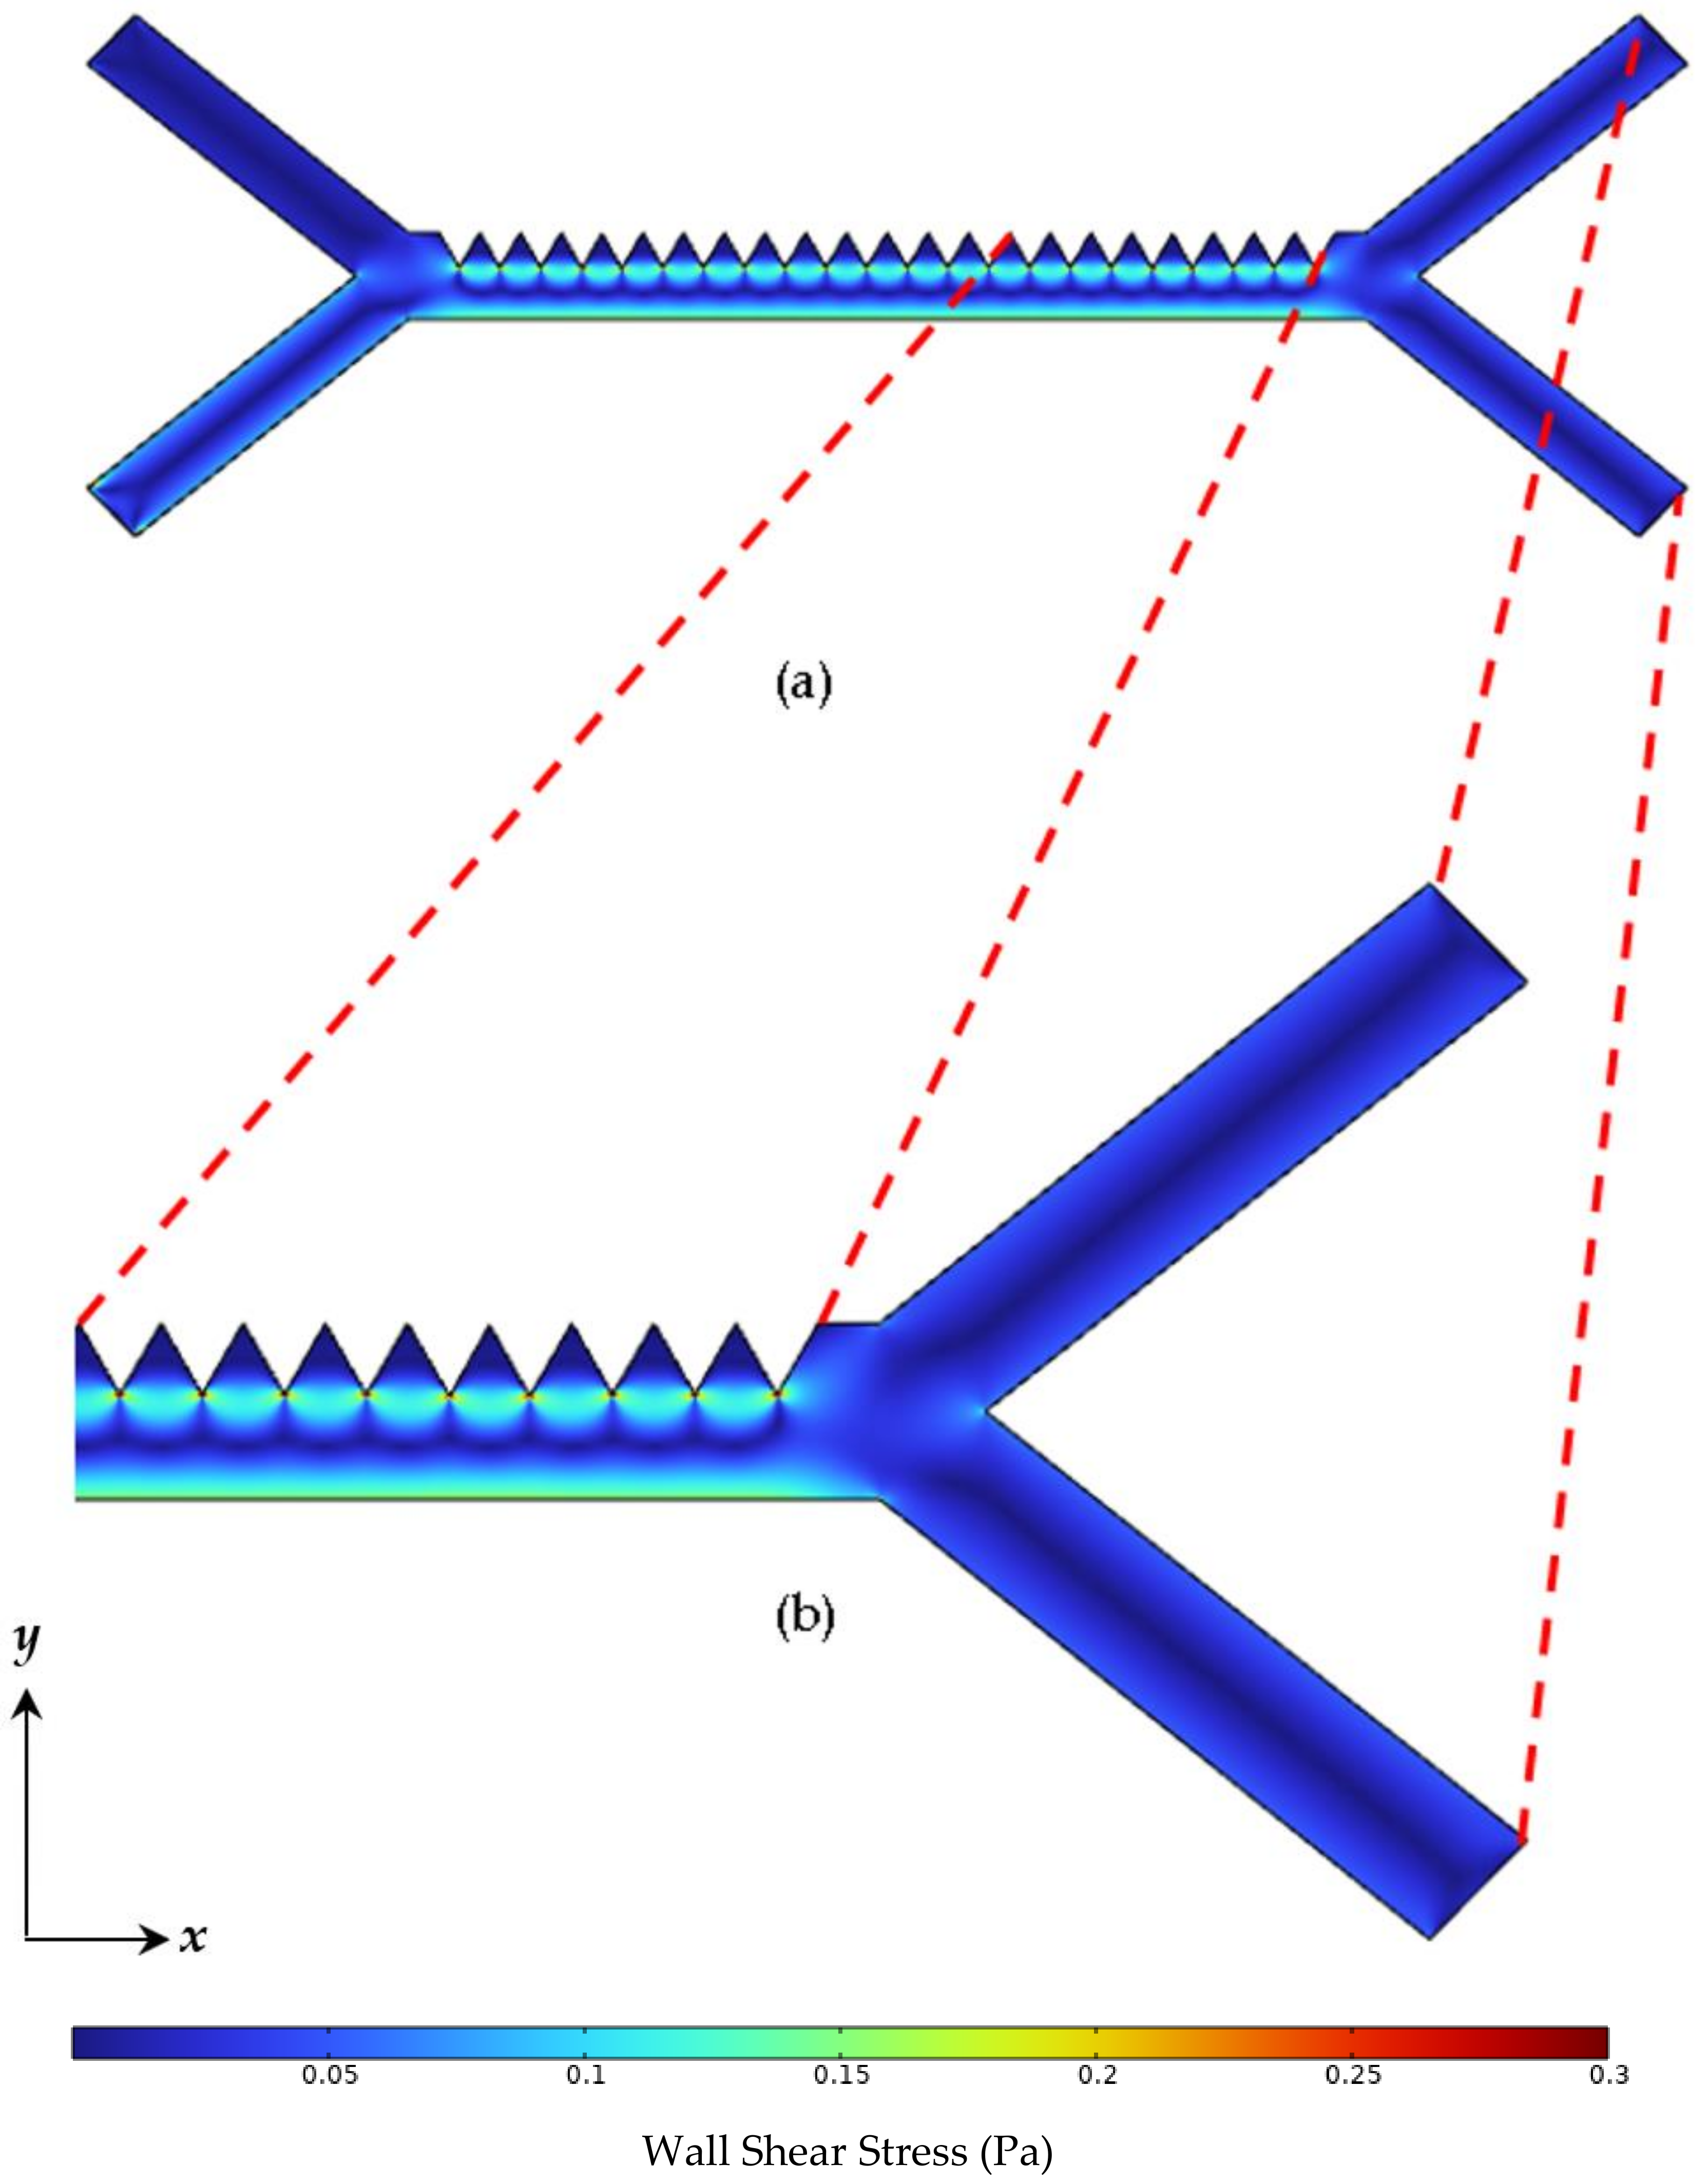
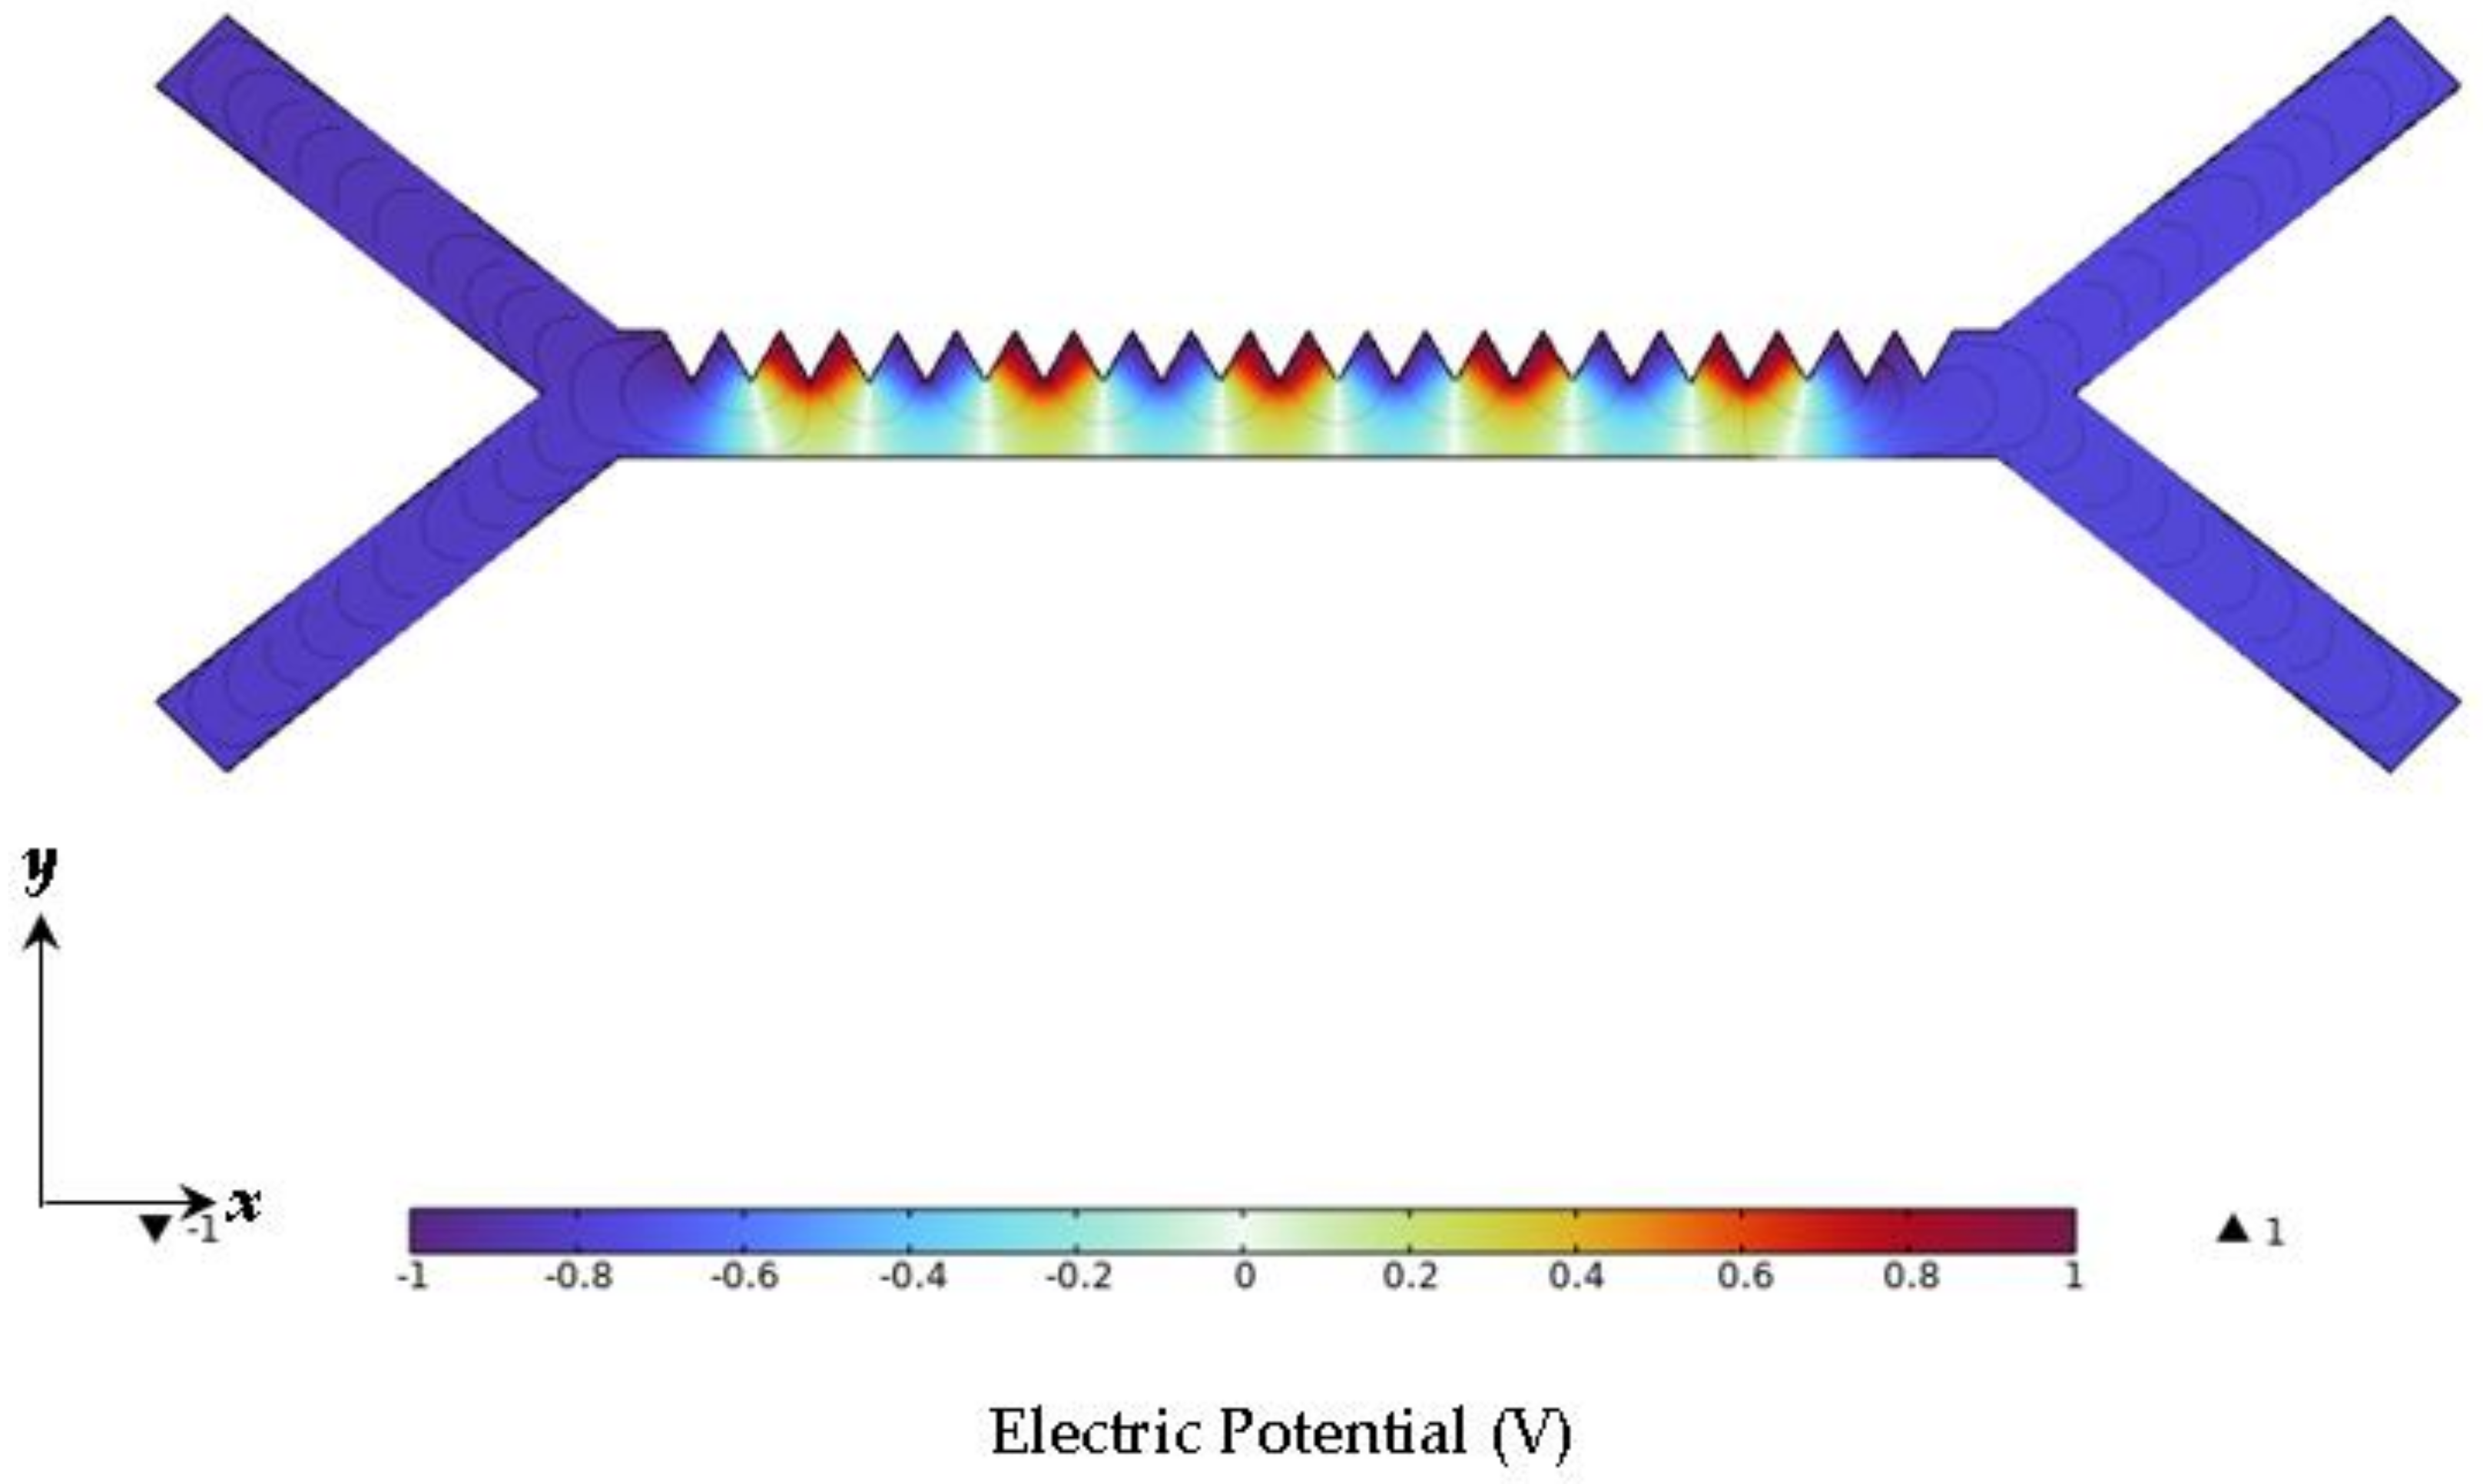
3.2. Simulation Results for the Saw-Tooth Electrode Design
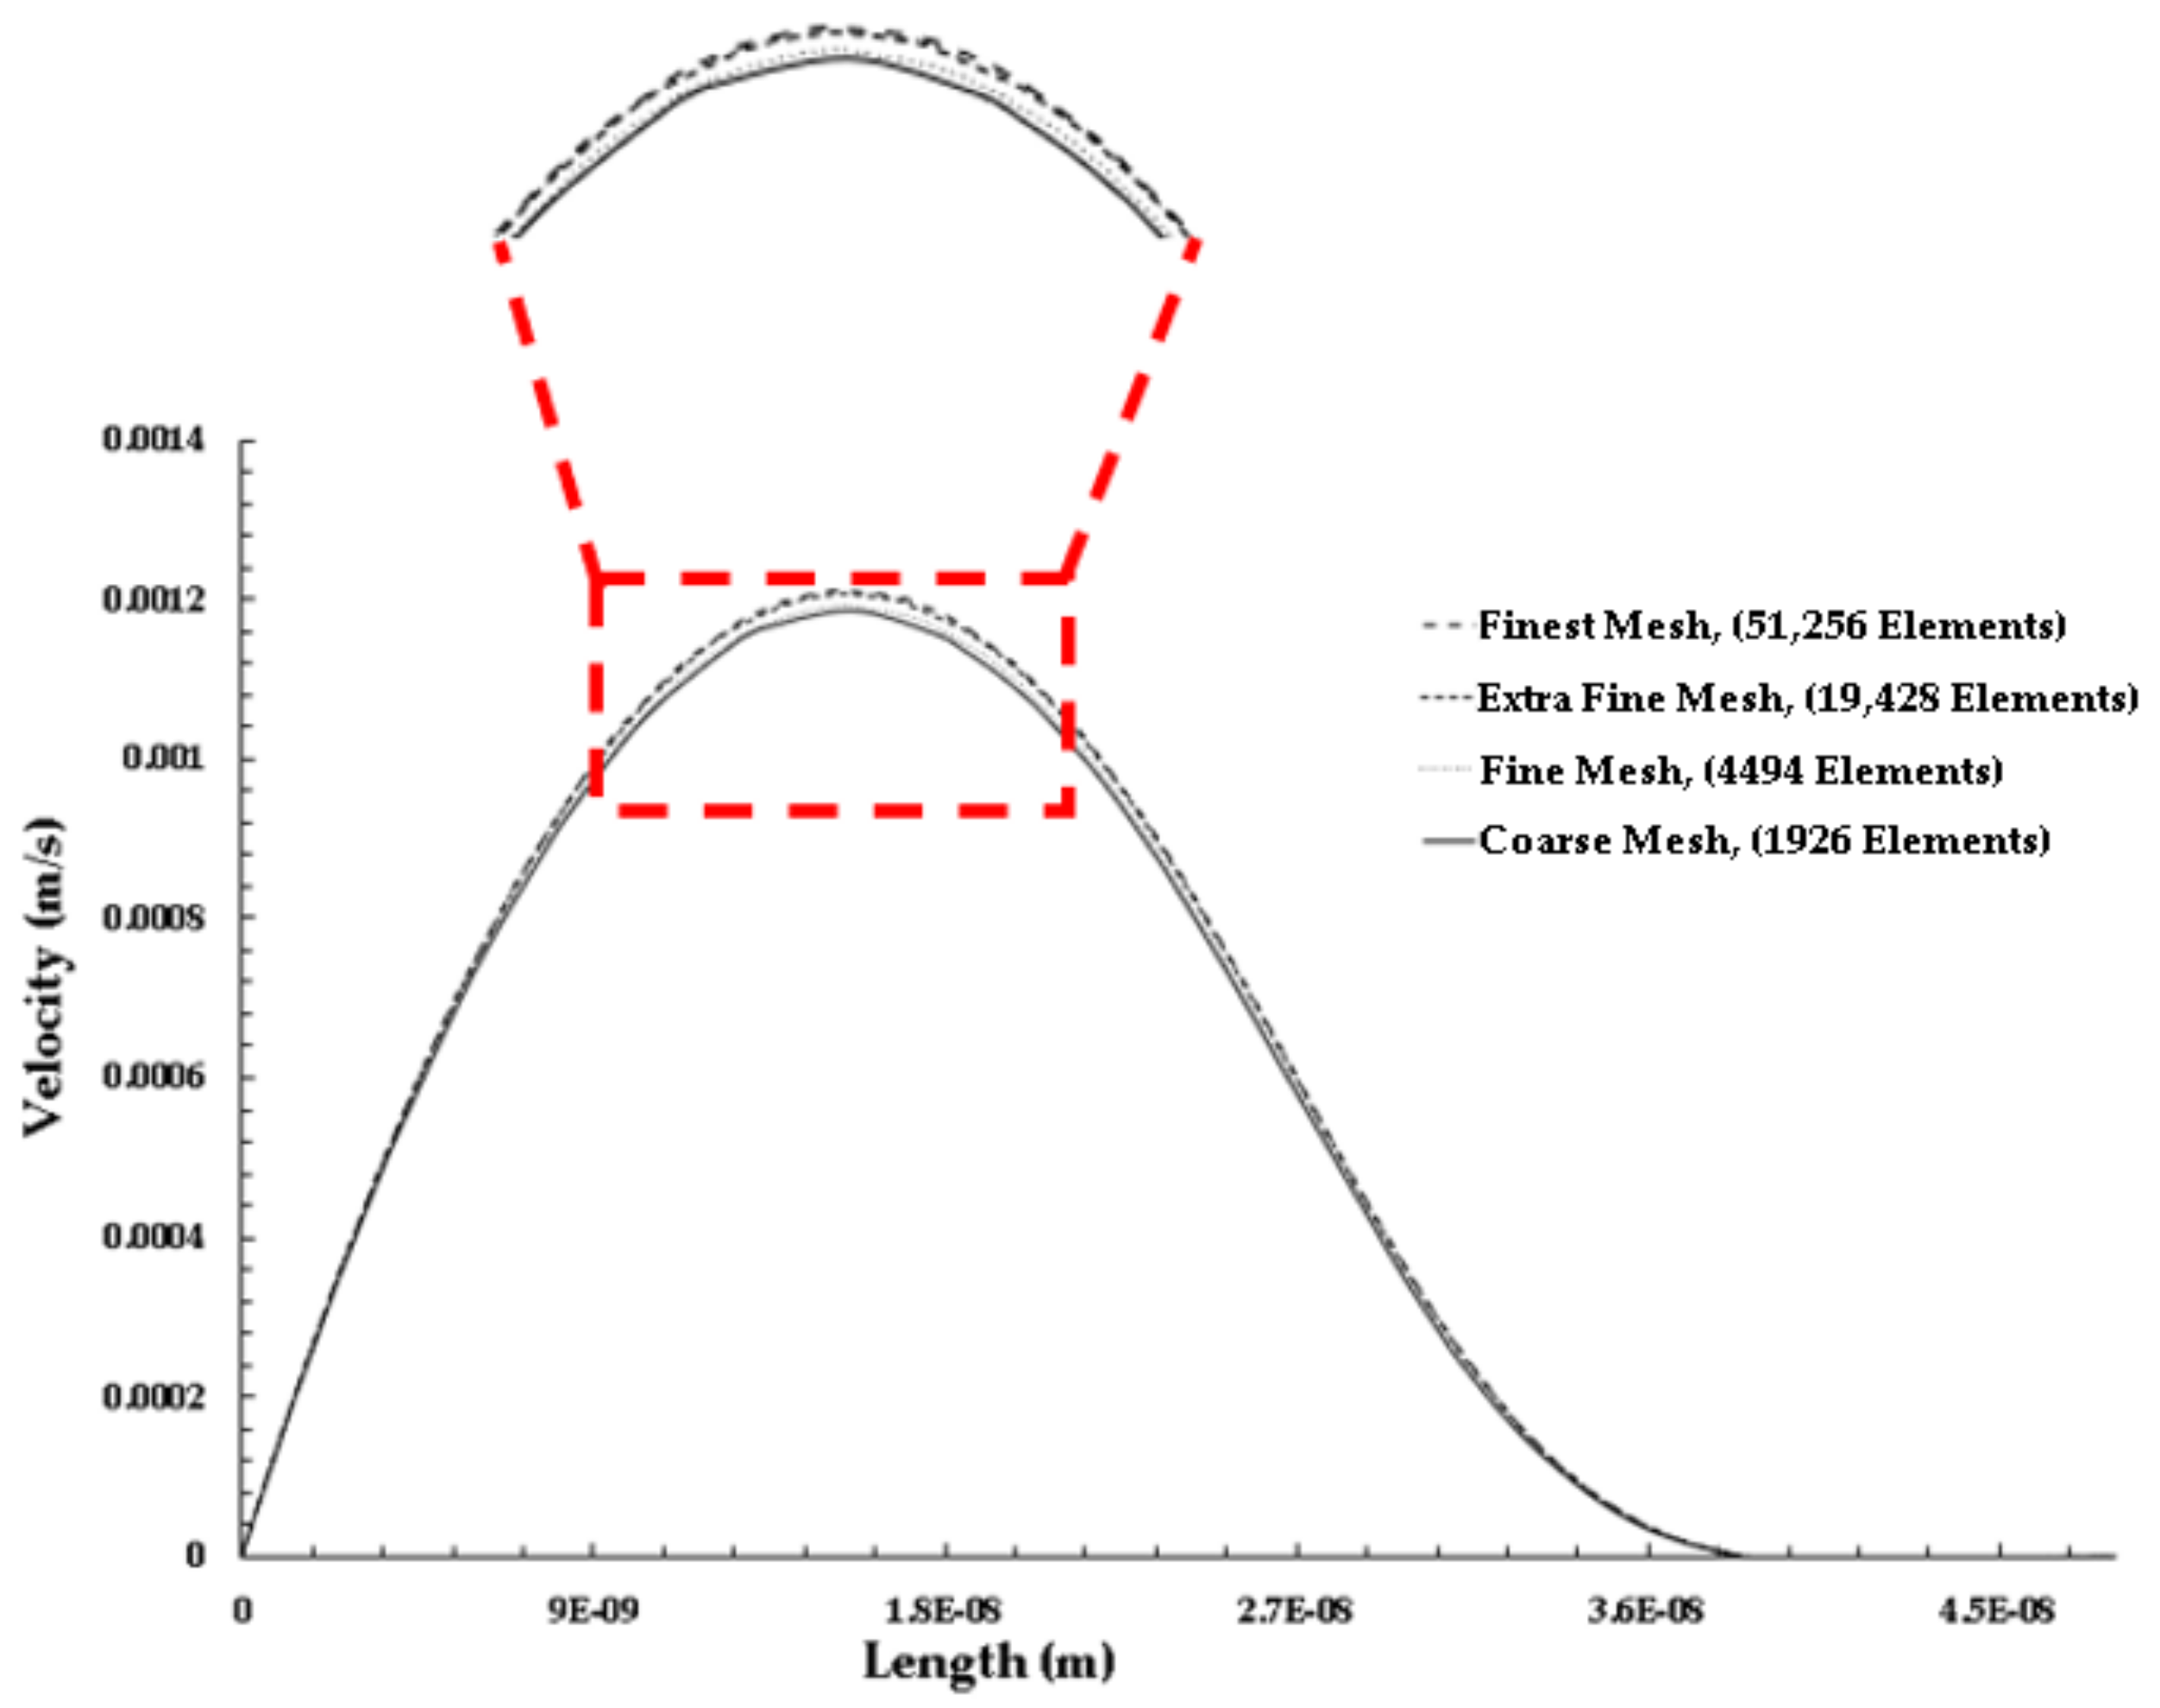
3.2.1. Mesh Independent Study
4. Conclusions
- The design reported in this work is an improvement over existing designs in that it can perform rapid separation of red blood cells (estimated 99% purification) of platelets in less than a total time of 6–7 s at a voltage setting of 1 V and at a minimum frequency of 1 Hz.
- The presentation of an operating parameter optimization study on driving parameters such as frequency and voltage settings.
- The results of the simulation study suggest that the saw-tooth electrode design appears to be an improvement over existing designs in that the sharp corners reduced the required horizontal distance needed for separation to occur and contributed to a non-uniform DEP electric field.
- The results of this simulation study suggest that this DEP separation technique may potentially be applied to improve the efficiency of separation processes of biological sample scenarios and simultaneously increase the accuracy of diagnostic processes via cell counting and sorting.
- Validating and verifying the proposed design in this work via cell flow experiments.
- Simulating design changes such as electrode dimensions and shape, electrode space dimensions, inlet velocity ratios, driving frequency, driving voltage, and outlet separation degree angle to find the optimum design specs for cell separation efficiency.
- Investigating the efficacy of the proposed design for cell separation efficiency using difference cell solutions.
Author Contributions
Funding
Institutional Review Board Statement
Informed Consent Statement
Data Availability Statement
Conflicts of Interest
References
- Pakhira, W.; Kumar, R.; Ibrahimi, K.M.; Bhattacharjee, R. Design and Analysis of a Microfluidic Lab-on-Chip Utilizing Dielectrophoresis Mechanism for Medical Diagnosis and Liquid Biopsy. J. Braz. Soc. Mech. Sci. Eng. 2022, 44, 482. [Google Scholar] [CrossRef]
- Zhang, Y.L.; Chen, X.Y. Dielectrophoretic Microfluidic Device for Separation of Red Blood Cells and Platelet: A Model-Based Study. J. Braz. Soc. Mech. Sci. Eng. 2020, 42, 89. [Google Scholar] [CrossRef]
- Spieler, V.; Valldorf, B.; Spieler, F.; Valldorf, V.; MaaB, B.; Huttenhain, S.H.; Kolmar, K. Stereoselective Reduction with Cofactor Regeneration on PhaC inclusion Bodies. Biotechnol. J. 2016, 11, 890–898. [Google Scholar] [CrossRef] [PubMed]
- Islinger, M.; Wildruber, R.; Voelkl, A. Preparative Free-Flow Electrophoresis, a Versatile Technology Complementing Gradient Centrifugation in the Isolation of Highly Purified Cell Organelles. Electrophoresis 2018, 39, 2288–2299. [Google Scholar] [CrossRef]
- Thi, Y.V.T.; Hoang, B.A.; Thanh, H.T.; Nguyen, T.H.; Ngoc, T.P.; Thu, H.B.; Hoang, N.N.; Bui, T.T.; Duc, T.C.; Quang, L.D. Design and Numerical Study on a Microfluidic System for Circulating Tumor Cells Separation from Whole Blood using Magnetophoresis and Dielectrophoresis Techniques. Biochem. Eng. J. 2022, 186, 108551. [Google Scholar]
- Chelakkot, C.; Ryu, J.; Kim, M.Y.; Kim, J.S.; Kim, D.; Hwang, J.; Bark, S.H.; Ko, S.B.; Park, J.W.; Jung, M.Y.; et al. An Immune-Magnetophoretic Device for the Selective and Precise Enrichment of Circulating Tumor Cells from Whole Blood. Micromachines 2020, 11, 560. [Google Scholar] [CrossRef]
- Nabovati, G.; Ghafar-Zadeh, E.; Letourneau, A.; Sawan, M. Towards High Throughput Cell Growth Screening: A New CMOS 8 × 8 Biosensor Array for Life Science Applications. IEEE Trans. Biomed. Circuits Syst. 2016, 11, 380–391. [Google Scholar] [CrossRef]
- Azizipour, N.; Avazpour, R.; Rosenzwieg, D.H.; Sawan, M.; Ajji, A. Evolution of Biochip Technology: A Review from Lab-on-a-Chip to Organ-on-a-Chip. Micromachines 2020, 11, 599. [Google Scholar] [CrossRef] [PubMed]
- Hewlin, R.L., Jr.; Tindal, J.M. Computational Assessment of Magnetic Nanoparticle Targeting Efficiency in a Simplified Circle of Willis Arterial Model. Int. J. Mol. Sci. 2023, 24, 2545. [Google Scholar] [CrossRef] [PubMed]
- Hewlin, R.L., Jr.; Ciero, A.; Kizito, J.P. Development of a Two-Way Coupled Eulerian-Lagrangian Computational Magnetic Nanoparticle Targeting Model for Pulsatile Flow in a Patient-Specific Diseased Left Carotid Bifurcation Artery. Cardiovasc. Eng. Tech. 2019, 10, 299–313. [Google Scholar] [CrossRef]
- Edwards, M.; Hewlin, R.L., Jr. A Computational Model for Analysis of Field and Force and Particle Dynamics in a Ferro-Magnetic Microfluidic System. In Proceedings of the ASME 2022 International Mechanical Engineering Congress and Exposition, Columbus, OH, USA, 30 October–3 November 2022; Biomedical and Biotechnology; Design, Systems, and Complexity. ASME: New York, NY, USA; Volume 4, p. V004T05A007. [Google Scholar]
- Yellen, B.B.; Erb, R.M.; Son, H.S.; Hewlin, R.L., Jr.; Shang, H.; Lee, G.U. Traveling Wave Magnetophoresis for High Resolution Chip Based Separations. Lab Chip 2007, 7, 1681–1688. [Google Scholar] [CrossRef]
- Gijs, M. Magnetic Bead Handling On-Chip: New Opportunities for Analytical Applications. Microfluid. Nanofluidics 2004, 1, 22–40. [Google Scholar] [CrossRef] [Green Version]
- Kang, Y.; Li, D.; Kalams, S.A.; Eid, J.E. DC-Dielectrophoretic Separation of Biological Cells by Size. Biomed. Microdevices 2008, 10, 243–249. [Google Scholar] [CrossRef]
- Chen, D.F.; Du, H.; Li, W.H. Bioparticle Separation and Manipulation Using Dielectrophoresis. Sens. Actuators A Phys. 2007, 133, 329–334. [Google Scholar] [CrossRef]
- Zao, K.; Li, D. Manipulation and Separation of Oil Droplets by Using Asymmetric Nano-Orifice Induced DC Dielectrophoretic Method. J. Colloid Interface Sci. 2018, 512, 389–397. [Google Scholar] [CrossRef] [PubMed] [Green Version]
- Zhao, K.; Li, D. Tunable Droplet Manipulation and Characterization by Ac-DEP. Interfaces 2018, 10, 36572–36581. [Google Scholar] [CrossRef]
- Gascoyne, P.R.C.; Vykoukal, J. Particle Separation by Dielectrophoresis. Electrophoresis 2002, 23, 1973. [Google Scholar] [CrossRef] [PubMed]
- Sajeesh, P.; Sen, A.L. Particle Separation and Sorting in Microfluidic Devices: A Review. Microfluid. Nanofluid 2014, 17, 1–52. [Google Scholar] [CrossRef]
- Zhao, K.; Peng, R.; Li, D. Separation of Nanoparticles by an Nano-Orifice Based DC-Dielectrophoresis Method in a Pressure-Driven Flow. Nanoscale 2016, 8, 18945–18955. [Google Scholar] [CrossRef] [Green Version]
- Yamashita, M.; Inoue, H.; Miyata, S. Platelet-Rich Plasma Purification by Dielectrophoresis and Fluid-Induced Shear Force. Bioelectricity 2022, 4, 190–197. [Google Scholar] [CrossRef]
- Zhao, K.; Zhao, P.; Dong, J.; Wei, Y.; Chen, B.; Wang, Y.; Pan, X.; Wang, J. Implementation of an Integrated Dielectrophoretic and Magnetophoretic Microfluidic Chit for CTC Isolation. Biosensors 2022, 12, 757. [Google Scholar] [CrossRef]
- Li, H.; Bashir, R. Dielectrophoretic Orientation, Manipulation and Separation of Live and Heat-Treated Cells of Listeria on Microfabricated Devices with Interdigitated Electrodes; Cambridge University Press: Cambridge, UK, 2002; Volume 729, pp. 1–6. [Google Scholar]
- Gascoyne, P.; Mahidol, C.; Ruchirawat, M.; Satayavivad, J.; Watcharasit, P.; Becker, F.F. Microsample Preparation by Dielectrophoresis: Isolation of Malaria. Lab Chip 2002, 2, 70–75. [Google Scholar] [CrossRef] [Green Version]
- Moon, H.S.; Kwon, K.; Kim, S.I.; Han, H.; Sohn, J.; Lee, S.; Jung, H.I. Continous Separation of Breast Cancer Cells from Blood Samples Using Multi-Orifice Flow Fractionation (MOFF) and Dielectrophoresis (DEP). Lab Chip 2011, 11, 1118–1125. [Google Scholar] [CrossRef]
- Song, H.; Rosano, J.M.; Wang, Y.; Garson, C.J.; Prabhakarpandian, B.; Pant, K.; Klarmann, G.J.; Perantoni, A.; Alvarez, L.M.; Lai, E. Continous-Flow Sorting of Stem Cells and Differentiation Products Based on Dielectrophoresis. Lab Chip 2015, 15, 1320–1328. [Google Scholar] [CrossRef]
- Wang, Y.; Wang, J.; Wu, X.; Jiang, Z.; Wang, W. Dielectrophoretic Separation of Microalgae Cells in Ballast Water in a Microfluidic Chip. Electrophoresis 2019, 40, 969–978. [Google Scholar] [CrossRef]
- Vahey, M.D.; Voldman, J. An Equilibrium Method for Continuous-Flow Cell Sorting Using Dielectrophoresis. Anal. Chem. 2008, 80, 3135–3143. [Google Scholar] [CrossRef] [PubMed]
- Cao, Z.; Zhu, Y.; Liu, Y.; Dong, S.; Chen, X.; Bai, F.; Song, S.; Fu, J. Dielectrophoresis-Based Protein Enrichment for a Highly Sensitive Immunoassay Using Ag/SiO2 Nanorod Assays. Small 2018, 14, 1703265. [Google Scholar] [CrossRef] [PubMed]
- Kung, Y.C.; Huang, K.W.; Chong, W.; Chio, P.Y. Tunnel Dielectrophoresis for Tunable, Single-Stream Cell Focusing in Physiological Buffers in High-Speed Microfluidic Flows. Small 2016, 12, 4343–4348. [Google Scholar] [CrossRef]
- Voldman, J. Electrical Forces for Microscale Cell Manipulation. Annu. Rev. Biomed. Eng. 2006, 8, 425–454. [Google Scholar] [CrossRef] [PubMed] [Green Version]
- Hewlin, R.L., Jr.; Kizito, J.P. Development of an Experimental and Digital Cardiovascular Arterial Model for Transient Hemodynamic and Postural Change Studies: “A Preliminary Framework Analysis”. Cariodvasc Eng. Tech. 2018, 9, 1–31. [Google Scholar] [CrossRef]
- Hewlin, R.L., Jr.; Kizito, J.P. Comparison of Carotid Bifurcation Hemodynamics in Patient-Specific Geometries at Rest and During Exercise. In Volume 1A, Symposia: Advances in Fluids Engineering Education; Advances in Numerical Modeling for Turbomachinery Flow Optimization; Applications in CFD; Bio-Inspired Fluid Mechanics; CFD Verification and Validation; Development and Applications of Immersed Boundary Methods; DNS, LES, and Hybrid RANS/LES Methods, Proceedings of the ASME 2013 Fluids Engineering Division Summer Meeting, Incline Village, NV, USA, 7–11 July 2013; ASME: New York, NY, USA; p. V01AT04A001.
- Hewlin, R.L., Jr. Transient Cardiovascular Hemodynamics in a Patient-Specific Arterial System. Ph.D. Thesis, North Carolina Agricultural and Technical State University, Greensboro, NC, USA, 2015. [Google Scholar]
- Hewlin, R.L., Jr.; Kizito, J.P. Evaluation of the Effect of Simplified and Patient-Specific Arterial Geometry on Hemodynamic Flow in Stenosed Carotid Bifurcation Arteries. ASME Early Career Tech. J. 2011, 10, 39–44. [Google Scholar]
- Stanley, N.; Ciero, A.; Timms, W.; Hewlin, R.L., Jr. Development of 3-D Printed Optically Clear Rigid Anatomical Vessels for Particle Image Velocimetry Analysis in Cardiovascular Flow. In Proceedings of the ASME 2019 International Mechanical Engineering Congress and Exposition, Salt Lake City, UT, USA, 11–14 November 2019; Fluids Engineering. ASME: New York, NY, USA; Volume 7, p. V007T08A004. [Google Scholar]
- Stanley, N.; Ciero, A.; Timms, W.; Hewlin, R.L., Jr. A 3-D Printed Optically Clear Rigid Diseased Carotid Bifurcation Arterial Mock Vessel model for Particle Image Velocimetry Analysis in Pulsatile Flow. ASME Open J. Eng. 2023, 2, 21010. [Google Scholar] [CrossRef]
- COMSOL General Single-Phase Flow Theory. Available online: https://doc.comsol.com/5.5/doc/com.comsol.help.comsol/comsol_ref_fluidflow.20.03.html#3450357 (accessed on 16 February 2023).
- Patki, S.E.A. Wireless EEG System with Real Time Impedance Monitoring and Active Electrodes. In Proceedings of the 2012 IEEE Biomedical Circuits and Systems Conference (BioCAS), Hsinchu, Taiwan, 28–30 November 2012; IEEE: Piscataway, NJ, USA, 2012. [Google Scholar]
- Phol, H.A. Dielectrophoresis: The Behavior of Neutral Matter in Non-Uniform Electric Field; Cambridge University Press: Cambridge, UK, 1978. [Google Scholar]
- Gimsa, J.; Marszalek, P.; Loewe, U.; Tsong, T.Y. Dielectrophoresis and electrorotation of neurospora slime and murine myeloma cells. Biophys J. 1991, 60, 749–760. [Google Scholar] [CrossRef] [PubMed] [Green Version]
- Chau, L.; Wenfend, L.; Florence, W.K.C.; Wing, K.L.; Wen, J.L.; Shih-Chi, C.; Gwo-Bin, L. Self-Rotation of Cells in an Irrotational AC E-Field in an Opto-Electrokinetics Chip. PLoS ONE 2014, 8, e51577. [Google Scholar] [CrossRef] [Green Version]
- Huang, Y.; Holzel, R.; Pethig, R.; Wang, X. Differences in the AC Electrodynamics of Viable and Non-Viable Yeast Cells Determined through Combined Dielectrophoresis and Electrorotation Studies. Phys. Med. Biol. 1992, 37, 1499–1517. [Google Scholar] [CrossRef]
- Piacentini, N.; Mernier, G.; Tornay, R.; Renaud, P. Separation of Platelets from Other Blood Cells in Continous-Flow by Dielectrophoresis Field-Flow-Fractionation. Biomicrofluidics 2011, 5, 34122. [Google Scholar] [CrossRef] [PubMed] [Green Version]
- Tornay, R.; Braschler, T.; Demierre, N.; Benedikt, S.; Finka, A.; Hofmann, H.; Hubell, A.; Renaud, P. Dielectrophoresis-based Particle Exchanger for the Manipulation and Surface Functionalization of Particles. Lab Chip 2007, 8, 267–273. [Google Scholar] [CrossRef] [PubMed]
- Leverett, L.B.; Hellums, J.D.; Alfrey, C.P.; Lynch, E.C. Red Blood Cell Damage by Shear Stress. Biophys J. 1972, 12, 257–273. [Google Scholar] [CrossRef] [Green Version]
- Pommer, M.S.; Zhang, Y.; Keerthi, N.; Chen, D.; Thomson, J.A.; Meinhart, C.D.; Soh, H.T. Dielectrophoretic Separation of Platelets from Diluted Whole Blood in Microfluidic Channels. Electrophoresis 2008, 29, 1213. [Google Scholar] [CrossRef] [PubMed]
- Lorenz, M.; Malangré, D.; Du, F.; Baune, M.; Thöming, J.; Pesch, G.R. High-Throughput Dielectrophoretic Filtration of Sub-micron and Micro Particles in Macroscopic Porous Materials. Anal. Bioanal. Chem. 2020, 412, 3903–3914. [Google Scholar] [CrossRef] [Green Version]


| Properties | RBC | Platelet | Fluid |
|---|---|---|---|
| Density (kg/m3) | 1050 | 1050 | 1060 |
| Viscosity (cp) | - | - | 1 |
| Particle diameter (µm) | 5 | 1.8 | - |
| Relative permittivity (F/m) | 59 | 50 | - |
| Relative Conductivity (S/m) | 0.31 | 0.25 | - |
Disclaimer/Publisher’s Note: The statements, opinions and data contained in all publications are solely those of the individual author(s) and contributor(s) and not of MDPI and/or the editor(s). MDPI and/or the editor(s) disclaim responsibility for any injury to people or property resulting from any ideas, methods, instructions or products referred to in the content. |
© 2023 by the authors. Licensee MDPI, Basel, Switzerland. This article is an open access article distributed under the terms and conditions of the Creative Commons Attribution (CC BY) license (https://creativecommons.org/licenses/by/4.0/).
Share and Cite
Hewlin, R.L., Jr.; Edwards, M. Continuous Flow Separation of Red Blood Cells and Platelets in a Y-Microfluidic Channel Device with Saw-Tooth Profile Electrodes via Low Voltage Dielectrophoresis. Curr. Issues Mol. Biol. 2023, 45, 3048-3067. https://doi.org/10.3390/cimb45040200
Hewlin RL Jr., Edwards M. Continuous Flow Separation of Red Blood Cells and Platelets in a Y-Microfluidic Channel Device with Saw-Tooth Profile Electrodes via Low Voltage Dielectrophoresis. Current Issues in Molecular Biology. 2023; 45(4):3048-3067. https://doi.org/10.3390/cimb45040200
Chicago/Turabian StyleHewlin, Rodward L., Jr., and Maegan Edwards. 2023. "Continuous Flow Separation of Red Blood Cells and Platelets in a Y-Microfluidic Channel Device with Saw-Tooth Profile Electrodes via Low Voltage Dielectrophoresis" Current Issues in Molecular Biology 45, no. 4: 3048-3067. https://doi.org/10.3390/cimb45040200