Article

TET2 Mutation and High miR-22 Expression as Biomarkers to Predict Clinical Outcome in Myelodysplastic Syndrome Patients Treated with Hypomethylating Therapy

1
Department of Internal Medicine, Division of Hemato-Oncology, Soonchunhyang University Bucheon Hospital, 170 Jomaru-ro, Wonmi-gu, Bucheon-si 14584, Gyeonggi-do, Korea
2
Department of Internal Medicine, Division of Hemato-Oncology, Soonchunhyang University Cheonan Hospital, 31, Suncheonhyang 6-gil, Dongnam-gu, Cheonan-si 31151, Chungcheongnam-do, Korea
3
Department of Internal Medicine, Division of Hemato-Oncology, Soonchunhyang University Seoul Hospital, 59, Daesagwan-ro, Yongsan-gu, Seoul 04401, Korea
*
Author to whom correspondence should be addressed.
The first authors.
Curr. Issues Mol. Biol. 2021, 43(2), 917-931; https://doi.org/10.3390/cimb43020065
Submission received: 22 June 2021 / Revised: 23 July 2021 / Accepted: 29 July 2021 / Published: 5 August 2021
(This article belongs to the Section Molecular Medicine)

Abstract

:
Tet methylcytosine dioxygenase 2 (TET2) is one of the most frequently mutated genes in myelodysplastic syndrome (MDS). TET2 is known to involve a demethylation process, and the loss of TET2 is thought to cause DNA hypermethylation. Loss of TET2 function is known to be caused by genetic mutations and miRNA, such as miR-22. We analyzed 41 MDS patients receiving hypomethylating therapy (HMT) to assess whether TET2 mutation status and miR-22 expression status were associated with their clinical characteristics and treatment outcomes. Responsiveness to HMT was not affected by both TET2 mutation (odds ratio (OR) 0.900, p = 0.909) and high miR-22 expression (OR 1.548, p = 0.631). There was a tendency for TET2 mutation to be associated with lower-risk disease based on IPSS (Gamma = −0.674, p = 0.073), lower leukemic transformation (OR 0.170, p = 0.040) and longer survival (Hazard ratio 0.354, p = 0.059). Although high miR-22 expression also showed a similar tendency, this tendency was weaker than that of TET2 mutation. In summary, the loss of TET2 function, including both TET2 mutation and high miR-22 expression, was not a good biomarker for predicting the response to HMT but may be associated with lower-risk disease based on IPSS, lower leukemic transformation and longer survival.

1. Introduction

Myelodysplastic syndromes (MDS) are clonal stem cell malignancies characterized by cytopenia, inefficient hematopoiesis, and dysplasia in one or more myeloid cell lineages and increased risk of development of acute myeloid leukemia (AML) [1]. In Korea, MDS is the third most common myeloid malignancy [2]. Until now, many types of genetic alteration, including chromosomal abnormalities and somatic mutations, have been found in MDS, some of which may be driver mutations underlying the development of MDS [3]. The driver genes frequ ently mutated in MDS include DNA methylation, chromatin modification and other discrete functional pathways. Specifically, genes involved in DNA methylation and chromatin modification are mutated in about 60–70% of MDS cases. Among these genes, Tet methylcytosine dioxygenase 2 (TET2) and DNA methyltransferase 3A (DNMT3A) are known to be the predominant targets. Mutations of these genes are known to be related to age-related clonal hematopoiesis, suggesting their role as founder mutations in the early development of MDS.
Functionally, mutations of genes involved in epigenetic modification induce epigenetic dysregulation, such as aberrant DNA hypermethylation in MDS [1]. Aberrant DNA hypermethylation is thought to contribute to clonal evolution in MDS by silencing the expression of tumor suppressor genes (TSGs). Therefore, hypomethylating agents, such as azacitidine (AZA) and decitabine (DAC), have been used to reverse aberrant DNA hypermethylation in MDS. As DNMT1 inhibitors, hypomethylating agents are expected to induce transient DNA hypomethylation to allow re-expression of TSGs, triggering the death or differentiation of MDS cells [4]. Although hypomethylating therapy (HMT) using AZA or DAC has emerged as a common frontline therapy for patients with MDS contraindicated for intensive chemotherapy, its efficacy is not robust in the majority of patients [5]. In addition, another disadvantage of HMT is that the response to these agents is usually seen after the fourth or sixth cycle of treatment [6]. Therefore, the expert panel recommends that patients should be treated initially for a minimum of four to six cycles in the absence of disease progression or unacceptable toxicity [7]. Under these circumstances, several studies have been conducted to identify markers for predicting patients who may benefit from HMT. For example, Kim et al. suggested that bone marrow (BM) microvessel density, one of the biomarkers of angiogenesis, may predict responsiveness to HMT [8].
TET2, which is involved in epigenetic modification, is one of the most frequently mutated genes in MDS [9]. Similar to other TET proteins, such as TET1 and TET3, TET2 is known to catalyze the oxidation of 5-methylcytosine into 5-hydroxymethylcytosine and then into 5-formylcytosine and 5-carboxylcytosine, which are repaired into unmethylated cytosines via active DNA demethylation in TET/TDG (thymine–DNA–glycosylase)/BER (base excision repair)-dependent pathway. In hematologic diseases, loss of TET2 may cause DNA hypermethylation in enhancer-like regions but not in CpG sites in promoters [10,11]. Furthermore, Rasmussen et al. reported that the loss of TET2 in hematopoietic cells resulted in the DNA hypermethylation of active enhancers and induction of leukemogenesis [10].
Loss of TET2 function is caused by genetic mutations, miRNA interference, and metabolites, such as 2-hydroxyglutarate. Cheng et al. identified > 30 miRNAs that inhibit TET2 expression [12]. They also demonstrated that forced expression of TET2-targeting miRNAs in vivo disrupts normal hematopoiesis, leading to hematopoietic expansion and/or myeloid differentiation bias. In addition, Song et al. reported that the oncogenic miR-22 also targets the TET2 to promote hematopoietic stem cell self-renewal and transformation [13].
Theoretically, the loss of TET2 is a good candidate for HMT. Indeed, some studies reported that TET2 mutation could predict the response to HMT [14,15]. In this study, we evaluated whether TET2 mutation and miRNA-22 expression are predictive markers of response to HMT. We evaluated TET2 mutation status and miRNA-22 expression level in BM cells of MDS patients and assessed their relationship with baseline characteristics and treatment outcomes of HMT (Figure 1).

2. Materials and Methods

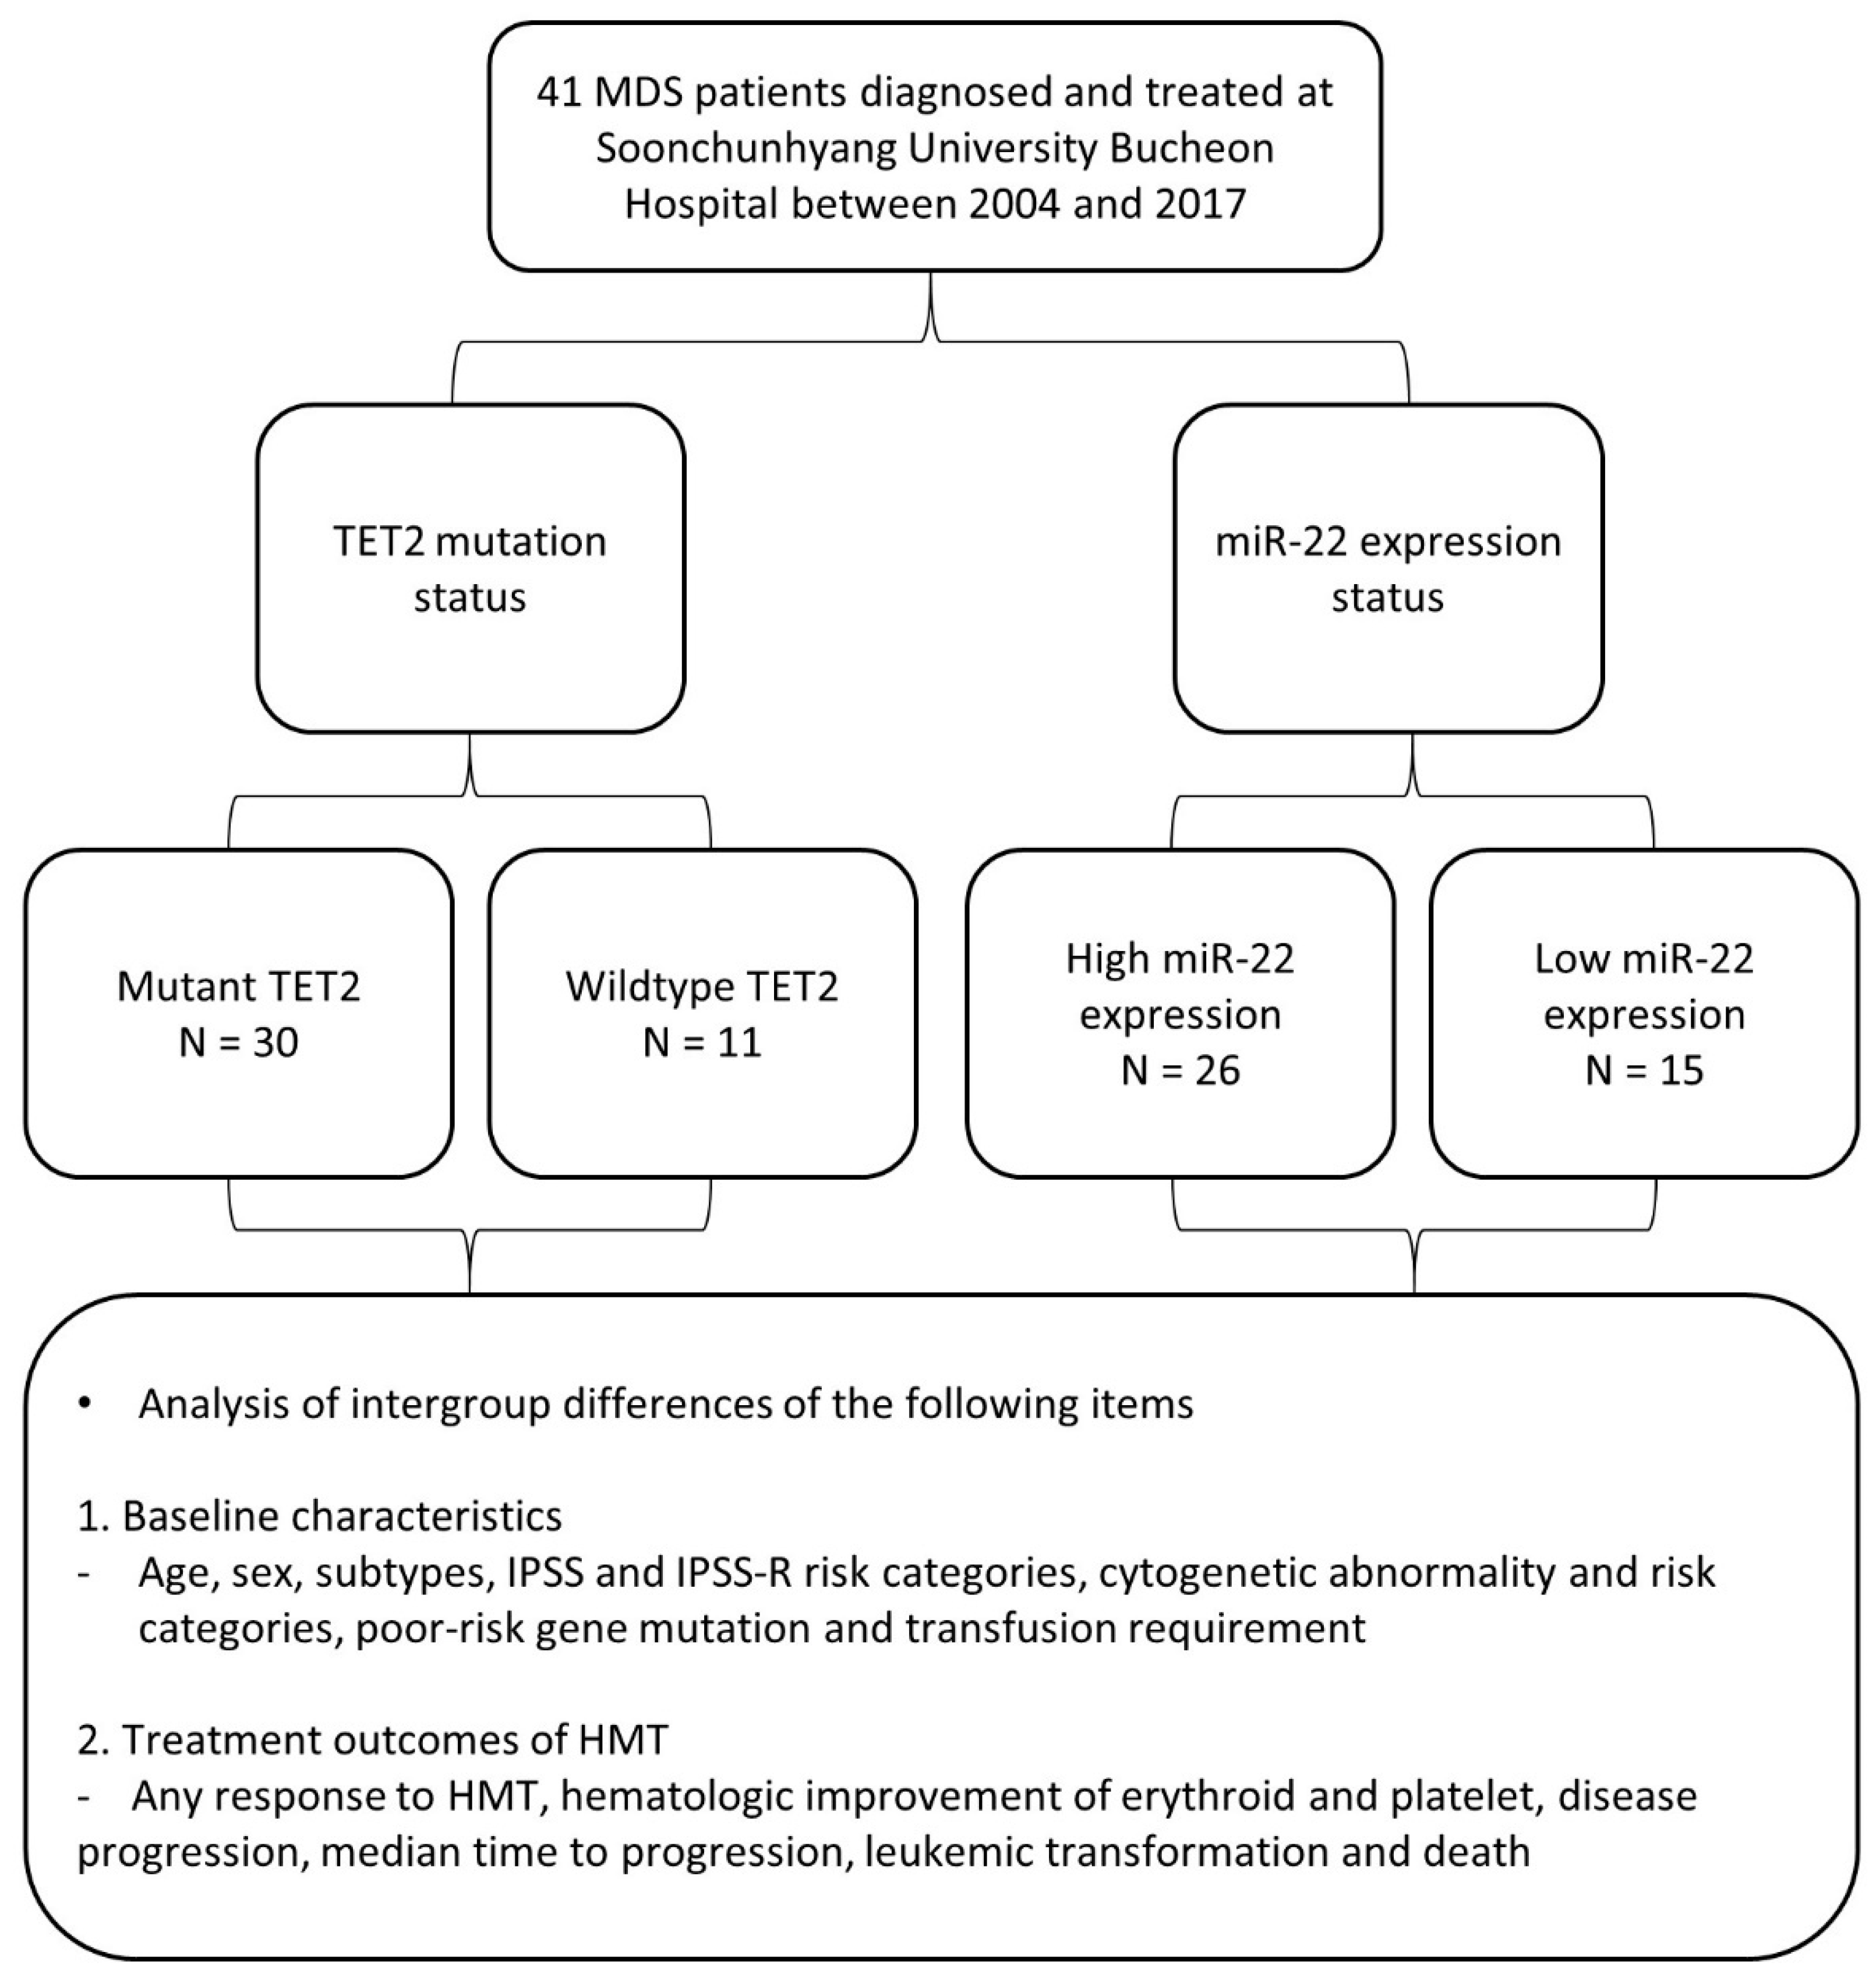
2.1. Patient Characteristics and Sample Preparations

A total of 41 MDS patients diagnosed and treated at Soonchunhyang University Bucheon Hospital between 2004 and 2017 were included in this study. Written informed consent was obtained from all patients. BM aspirates were collected from these patients. BM aspirates underwent RBC lysis (BD Pharm Lyse™ lysing solution, BD Bioscience, San Jose, CA, USA) and were cryopreserved for storage at the Soonchunhyang University Bucheon Hospital Clinical Laboratory, a tissue repository approved by the local Institutional Review Board.
All laboratory and clinical data were obtained at the time of diagnosis. MDS subtypes were defined according to the WHO classification [16]. Based on the IPSS (International Prognostic Scoring System) [17] and IPSS-R (Revised International Prognostic Scoring System) [18], patients were divided into lower-risk disease (IPSS low, intermediate-1; IPSS-R very low, low, intermediate) and higher-risk disease (IPSS intermediate-2, high; IPSS-R high, very high). The cytogenetic risk categories for MDS were defined according to IPSS-R. The cytogenetic risk categories were divided into lower-risk karyotype (IPSS-R very good, good) and higher-risk karyotype (IPSS-R intermediate, poor, very poor). All patients received HMT using either AZA or DEC. Response to HMT was assessed using the International Working Group response criteria revised in 2006 [19]. Patients showing either a complete response, partial response or hematologic improvement were considered as ‘responders’. Hematologic improvement was assessed based on erythroid and platelet responses.

2.2. Next-Generation Sequencing (NGS) for the Detection of Mutations in TET2 and Other Genes

DNA exon sequences in TET2, SF3B1, SRSF2, U2AF1, ZRSR2, IDH1, IDH2, DNMT3A, EZH2, ASXL1, SETBP1, TP53, PHF6, RUNX1, ETV6, CBL1, NRAS, KIT, JAK2, MPL and NPM1 were determined from cells in BM aspirates using NGS assay. Briefly, genomic DNA of BM aspirate cells was extracted using a DNeasy Blood & Tissue kit (Qiagen, Valencia, CA, USA). Random DNA fragments were generated from genomic DNA samples, and a barcode sequence and an adapter sequence for each sample were attached to each other to generate a library. Target enrichment process for TET2 and other genes was performed via oligonucleotide hybridization-based target capture. The flow cell was mounted on the large-scale sequencing equipment MiSeq system (Illumina, San Diego, CA, USA), followed by dispensing and sequencing of the sample library and reagents. The lower limit of detection of the assay was 5%, with a minimum depth of coverage of 500×. After acquiring the raw data (FASTQ file) from the equipment, the data was checked for quality and mapped to obtain the BAM file from which the mapping information was analyzed, and the VCF file was obtained through the variant calling process. Finally, the variant file was obtained via variant annotation and filtering to interpret the mutation status of TET2 and other genes. Variants were excluded from statistical analysis if they were labeled as benign/likely benign in ClinVar and/or COSMIC databases. Poor-risk gene mutation was defined by the presence of significant gene mutations, which are associated with a poor prognosis. Based on NCCN guidelines for MDS version 1.2021 [20] and the study of Hou et al. [21], genes such as TP53, EZH2, ASXL1, DNMT3A, SRSF2, IDH2 and NPM1 were designated as poor-risk genes.

2.3. Detection of TET2 Deletion Using Fluorescence In Situ Hybridization (FISH)

TET2 deletion was assessed using FISH. Briefly, FISH was conducted with the interphase nuclei of BM aspirate cells using BACs covering the TET2 gene (RP11-351K6 and RP11-16G16; BlueGnome, Cambridge, UK) and a commercially available TET2 probe (MetaSystems; Altlussheim, Germany). Both assays were validated using samples with TET2 deletions proven by SNP 6.0 DNA microarray analysis (Affymetrix, Santa Clara, CA, USA). Hybridization spots were obtained according to the manufacturer’s recommendations, and 200 nuclei were examined per sample. FISH analyses were automatically performed. TET2 deletion was considered a significant TET2 mutation.

2.4. Real-Time Quantitative PCR of miR-22

miRNAs were extracted from BM aspirate cells using a miRNeasy Mini kit (Qiagen, Valencia, CA, USA). RNA concentration was determined using a NanoDropTM 2000/2000c spectrophotometer (ThermoFisher Scientific, Rockford, IL, USA). cDNA was obtained with a Superscript II RT kit (Applied Biosystems, Waltham, MA, USA) and a miScript II RT Kit (Qiagen, Valencia, CA, USA).
The level of miR-22-3p expression was measured with 7500 Real-Time PCR System (Applied Biosystems, Waltham, MA, USA) using PowerUp SYBR Green Master Mix (Applied Biosystems, Waltham, MA, USA) and a miScript SYBR® Green PCR Kit (Qiagen, Valencia, CA, USA). Each value was normalized with RNU6B as an internal control of miR-22 expression. Patients were divided into two groups based on normalized miR-22 expression: ≥ 2.5 was considered high; <2.5 was considered low. The cut-off value was 2.5 based on the study results of Song et al. [11]. In this study, the reduction of TET2 expression by miR-22 was confirmed in both K562 and U937 cell lines, in which the value of miR-22 expression level normalized by RNU6B was about 2.5 to 3.5. Oligonucleotide sequences for miR-22 and RNU6B were obtained from miScript primer assays (Qiagen, Valencia, CA, USA). The PCR conditions were set as follows: 50 °C for 2 min (UDG activation step), 95 °C for 2 min, 40 cycles of 95 °C for 15 s, 60 °C for 60 s, and 95 °C for 15 min, 40 cycles of 94 °C for 15 s, 55 °C for 30 s, and 70 °C for 30 s.

2.5. Statistical Analysis

Statistical differences in demographic and clinical characteristics according to TET2 mutation status and miR-22 expression status were evaluated using the Chi-square test, Fisher’s exact test or linear-by-linear association test for categorical variables and Student’s t-test or Wilcoxon’s rank-sum test for continuous variables. Before the t-test, a Shapiro–Wilk test for normality and Levene’s homogeneity of variance test was conducted. The Chi-square test or Fisher’s exact test was also used to compare treatment outcomes, including response rate to HMT, disease progression rate, leukemic transformation and mortality, except for median time to progression. Median time to progression was calculated with the Kaplan–Meier method using intention-to-treat (ITT) analysis and was compared using a log-rank test. Univariate logistic regression analysis was conducted to identify clinical factors that affected responsiveness to HMT and leukemic transformation. Univariate Cox proportional hazards regression analysis was performed to analyze the association between clinical factors and overall survival (OS). Overall survival probabilities and curves were estimated with the Kaplan–Meier method using ITT analysis and were compared using a log-rank test. The strength of correlation between two categorical variables was analyzed using Goodman–Kruskal’s gamma. p < 0.05 was considered statistically significant. All statistical analyses were performed using IBM SPSS statistics version 26 for Windows.

3. Results

3.1. Comparison of Baseline Characteristics and Treatment Outcomes According to TET2 Mutation Status

Of 41 MDS patients, 30 had wild-type (WT) TET2, and 11 had mutant TET2. Baseline characteristics of patients according to TET2 mutation status are listed in Table 1. The median age and sex ratios were not significantly different between the two groups. The distribution of MDS subtypes was not different between the two groups. The distribution of IPSS and IPSS-R risk categories differed significantly between the two groups (p-values = 0.039 and 0.009, respectively). The patients in the mutant TET2 group tended to have lower-risk disease based on IPSS and IPSS-R compared with those in the WT TET2 group (p-values = 0.075 and 0.006, respectively). Cytogenetic abnormality tended to be less frequent in the mutant TET2 group than in the WT TET2 group but was not statistically significant (18.2% vs. 43.3%, p-value = 0.168). Interestingly, while all patients in the mutant TET2 group exhibited lower-risk karyotype, some patients in the WT TET2 group showed higher-risk karyotype. However, this difference was not statistically significant (p-value = 0.083). The presence of poor-risk gene mutation was not different between the two groups (43.3% vs. 36.4%, p-value = 0.736). The proportion of patients requiring transfusion was not different between the two groups (86.7% vs. 72.7%, p-value = 0.361).
The association of TET2 mutation status with various treatment outcomes of HMT was analyzed using the Chi-square test or Fisher’s exact test and the Kaplan–Meier method (Table 2). The rate of any response to HMT was 83.3% (25/30) in the WT TET2 group and 81.8% (9/11) in the mutant TET2 groups (p-value = 1.000). Specifically, both erythroid and platelet response rates were not significantly different between the two group (p-values = 0.491 and 0.272, respectively). Disease progression was more frequently observed in the WT TET2 group than in the mutant TET2 group (63.3% vs. 27.3%, p = 0.040). The median time to progression of the mutant TET2 group was significantly longer than that of the WT TET2 group (49.8 months vs. 19.3 months, p = 0.007). Leukemic transformation was also more frequent in the WT TET2 group than in the mutant TET2 group (56.7% vs. 18.2%, p = 0.029). With a median follow-up time of 27.1 months (range, 7.5 to 83.5 months) in the WT TET2 group and 27.2 months (range, 8.7 to 95.9 months) in the mutant TET2 groups, the mortality rate was 76.7% (23/30) in the WT TET2 group and 36.4% (4/11) in the mutant TET2 group (p-value = 0.026).

3.2. Comparison of Baseline Characteristics and Treatment Outcomes of MDS Patients According to miR-22 Expression Status

Of 41 MDS patients, miR-22 expression was low in 26 and high in 15 cases. The baseline characteristics of patients according to miR-22 expression status are listed in Table 3. The median age and sex ratios were not significantly different between the two groups. The subtypes of MDS varied in both groups (p-value = 0.061).
The distribution of IPSS risk categories was not significantly different between the two groups (p-value = 0.149). Although the patients in the high miR-22 expression group tended to have lower-risk disease based on IPSS compared with those in the low miR-22 expression group, it was not statistically significant (p-value = 0.091). The distribution of IPSS-R risk categories did not vary significantly between the two groups (p-value = 0.429). Cytogenetic abnormality was not significantly different between the two groups (34.6% vs. 40.0%, p-value = 0.730). The distribution of cytogenetic risk categories was also not significantly different between the two groups (p-value = 0.757). The prevalence of poor-risk gene mutation was not significantly different between the two groups (42.3% vs. 40.0%, p-value = 0.885). The proportion of patients requiring transfusion was not significantly different between the two groups (88.5% vs. 73.3%, p-value = 0.390).
The association between TET2 mutation status and miR-22 expression was analyzed. The mean expression level of miR-22 was slightly higher in the mutant TET2 group compared with the WT TET2 group but was not statistically significant (3.077 vs. 2.183, p-value = 0.179, data not shown). Categorically, there was no significant association between TET2 mutation status and miR-22 expression status (p-value = 0.491, data not shown).
The association of miR-22 expression status with treatment outcomes of HMT was analyzed using the Chi-square test or Fisher’s exact test and the Kaplan–Meier method (Table 4). The rate of any response to HMT was 80.8% (21/26) in the low miR-22 expression group and 86.7% (13/15) in the high miR-22 expression group (p-value = 1.000). Specifically, both erythroid and platelet response rates were not significantly different between the two groups (p-values = 0.317 and 0.730, respectively). The disease progression rate was not significantly different between the two groups (61.5% vs. 40.0%, p-value = 0.183). The median time to progression was also not significantly different between the two groups (23.1 vs. 25.9 months, p-value = 0.155). Leukemic transformation tended to occur less frequently in the high miR-22 expression group (26.7%, 4/15) than in the low miR-22 expression group (57.7%, 15/26), but not statistically significant (p-value = 0.055). With a median follow-up time of 28.3 months (range, 8.7 to 83.5 months) in the low miR-22 expression group and 27.1 months (range, 7.5 to 95.9 months) in the high miR-22 expression group, the mortality rate was 73.1% (19/26) in the low miR-22 expression group and 53.3% (8/15) in the high miR-22 expression group (p-value = 0.199).

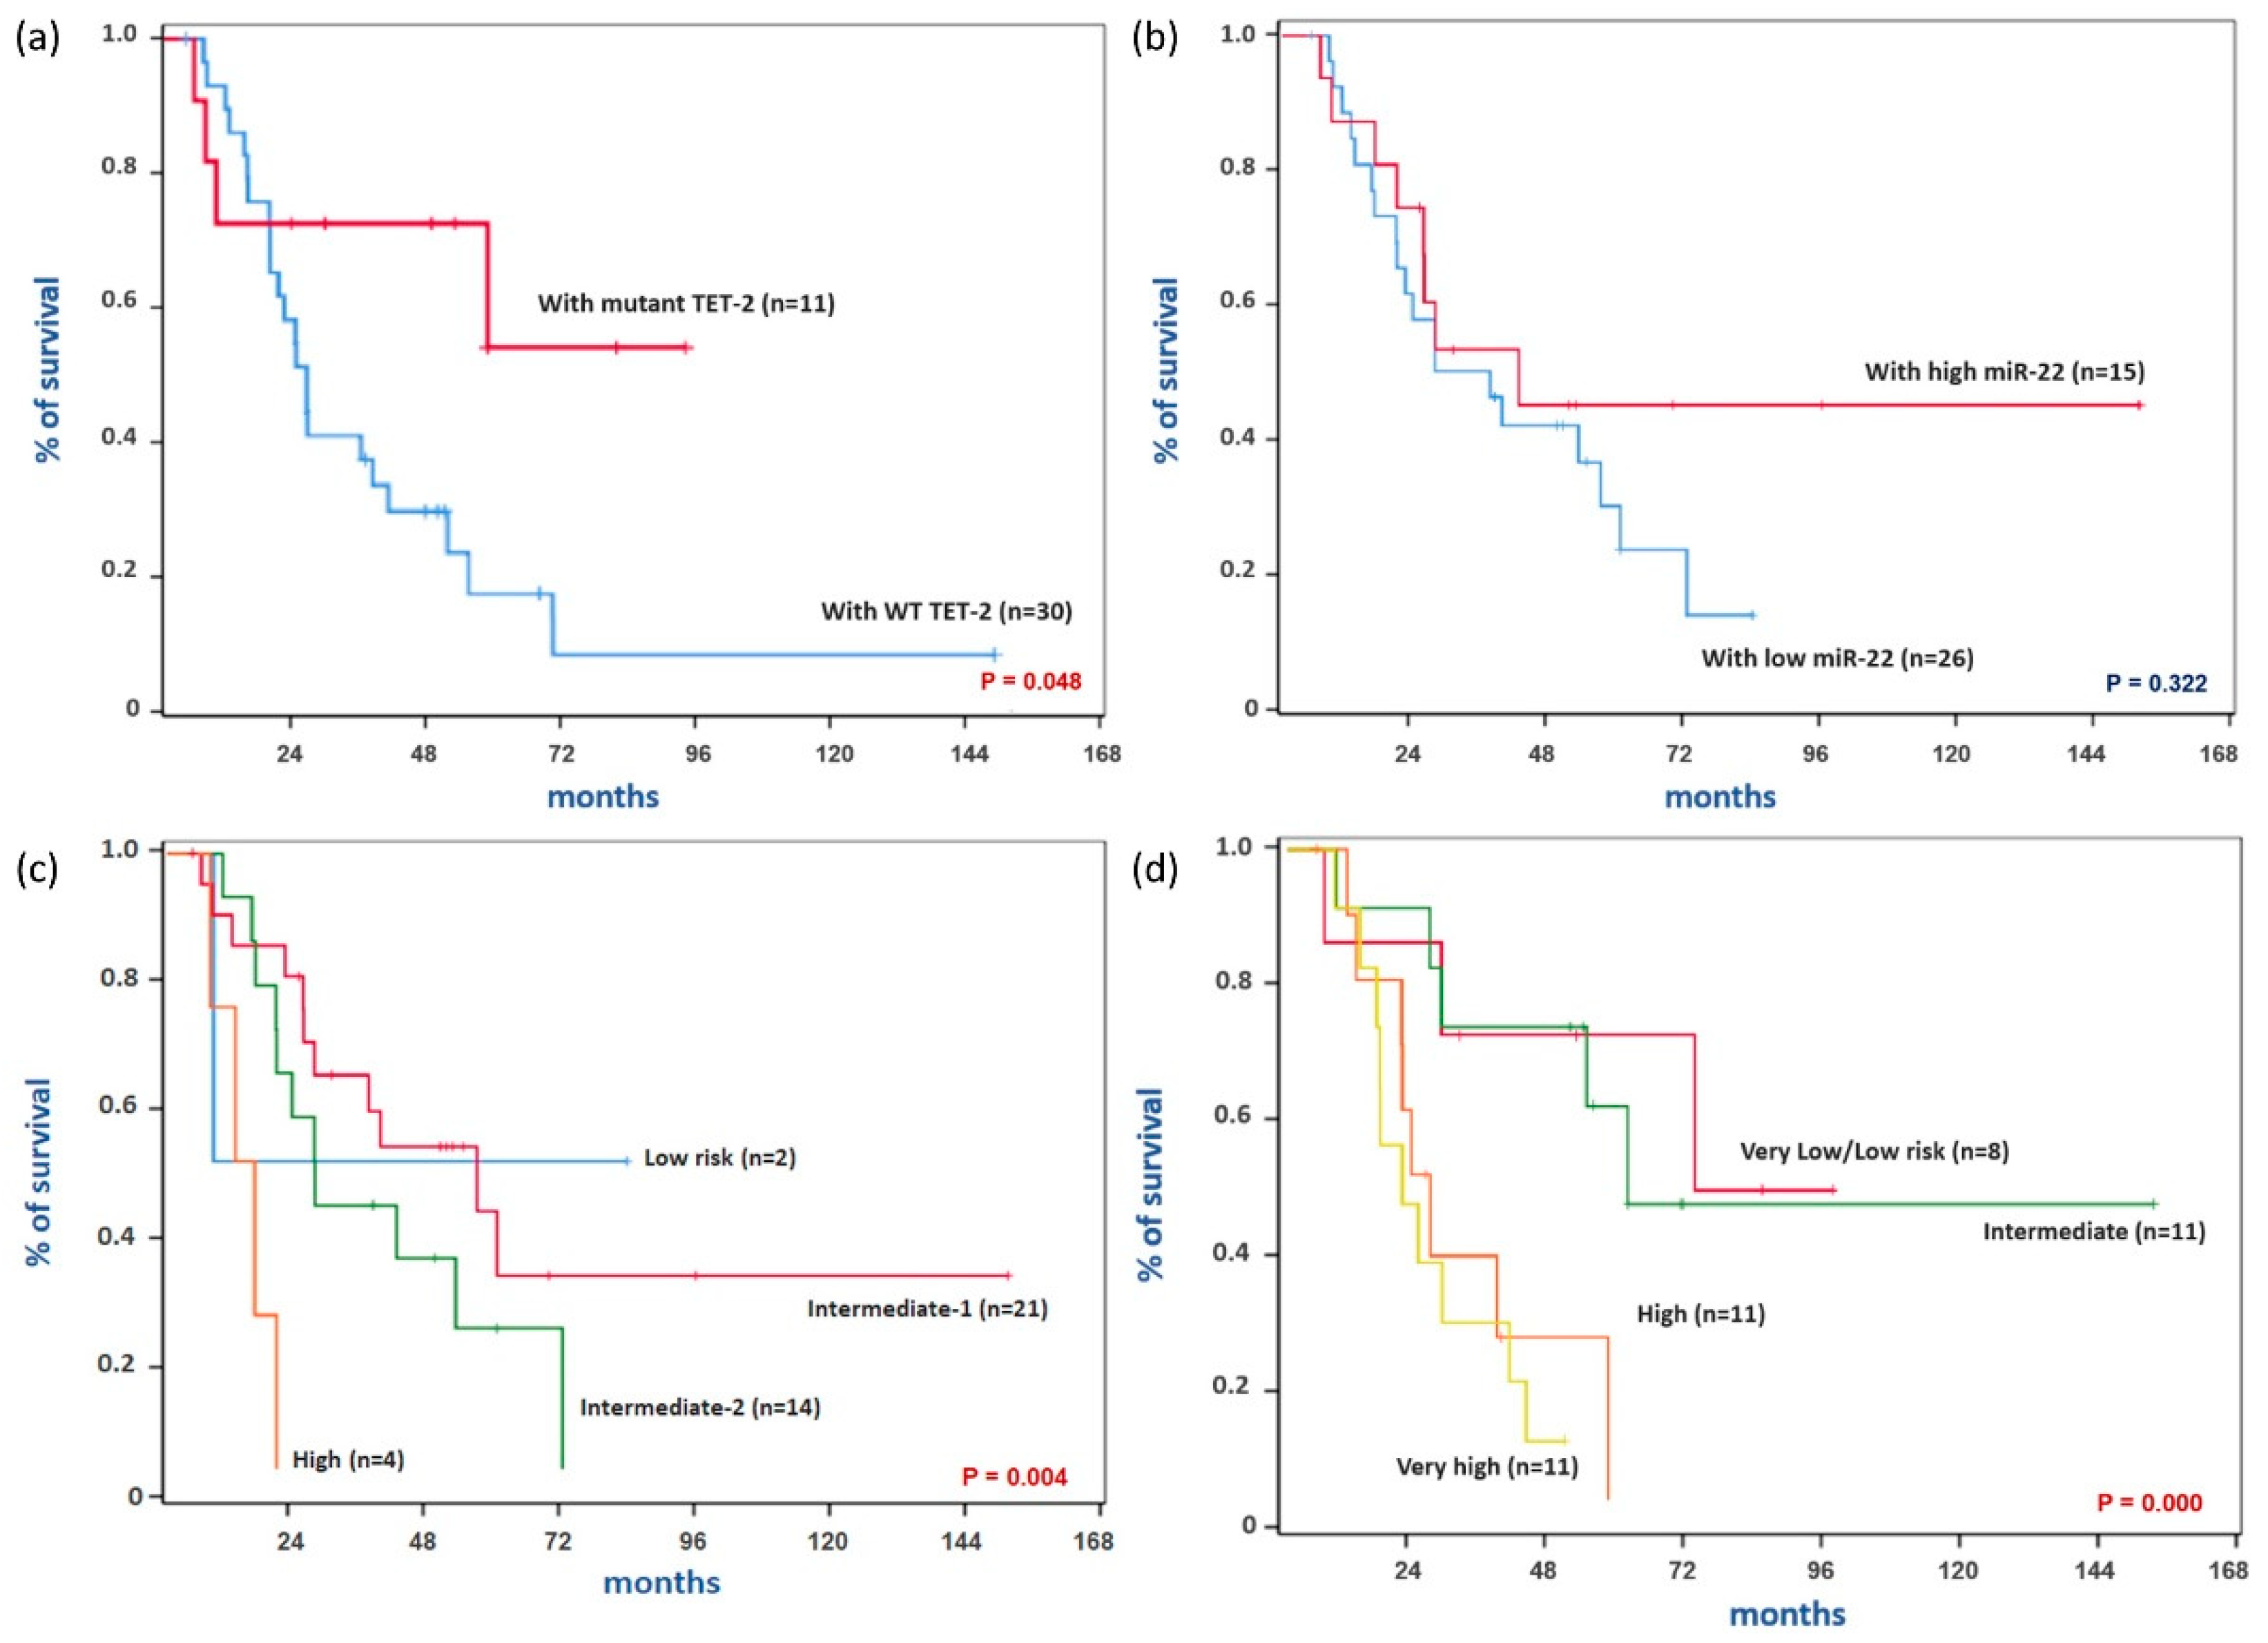
3.3. Association of Clinical Factors with Responsiveness to Hypomethylating Therapy, Leukemic Transformation, and Overall Survival

The association of various clinical factors with responsiveness to HMT was assessed via univariate logistic regression analysis. The odds ratios between various clinical factors and responsiveness to HMT are listed in Table 5. Similar to the results obtained using the Chi-square test or Fisher’s exact test, neither TET2 mutation nor high miR-22 expression was associated with responsiveness to HMT (p-value = 0.909, 0.631, respectively). In addition, responsiveness to HMT was not associated with other clinical factors, such as IPSS and IPSS-R risk, cytogenetic risk, the presence of poor-risk gene mutation and age above 70 years.
The association of various clinical factors with leukemic transformation was also assessed using univariate logistic regression analysis. The odds ratios between various clinical factors and leukemic transformation are listed in Table 6. Leukemic transformation tended to occur less frequently in the mutant TET2 group than in the WT TET2 group (OR= 0.170; 95% CI, 0.031–0.924; p-value = 0.040). Leukemic transformation tended to occur less frequently in the high miR-22 expression group than in the low miR-22 expression group but was not statistically significant (OR = 0.267; 95% CI, 0.067–1.064; p-value = 0.061). Patients with higher-risk disease based on IPSS tended to develop leukemic transformation more often than those with lower-risk disease based on IPSS (OR = 7.367; 95% CI, 1.836–29.544; p-value = 0.005). Higher-risk disease based on IPSS-R was also associated with increased leukemic transformation compared to lower-risk disease based on IPSS-R (OR = 4.900; 95% CI, 1.282–18.725; p = 0.020). The presence of any cytogenetic abnormality did not significantly increase the risk of leukemic transformation (OR = 2.400; 95% CI, 0.654–8.811; p = 0.187). Meanwhile, higher-risk karyotype based on IPSS-R was significantly associated with increased leukemic transformation compared to lower-risk karyotype (OR = 5.833; 95% CI, 1.038–32.797; p = 0.045). In addition, the incidence of leukemic transformation was significantly higher in patients with poor-risk gene mutation (OR = 17.733; 95% CI, 3.619–86.885; p-value = 0.000). Response to HMT and age above 70 years did not affect the incidence of leukemic transformation (p-value = 0.532, 0.477, respectively).
The association of various clinical factors with OS was analyzed using univariate Cox proportional hazards regression analysis (Table 7). TET2 mutation was associated with a trend toward better OS but was not statistically significant (HR = 0.354; 95% CI, 0.121–1.039; p-value = 0.059). High miR-22 expression was not associated with better OS (HR = 0.661; 95% CI, 0.289–1.513; p-value = 0.327). Patients with higher-risk disease based on IPSS tended to live shorter than those with lower-risk disease based on IPSS (HR = 2.093; 95% CI, 0.972–4.507; p-value = 0.059). Higher-risk disease based on IPSS-R was also associated with shorter OS compared to lower-risk disease based on IPSS-R (HR = 4.310; 95% CI, 1.724–10.776; p-value = 0.002). The presence of any cytogenetic abnormality was not significantly associated with OS (HR = 1.454; 95% CI, 0.666–3.173; p-value = 0.348). Meanwhile, higher-risk karyotype was associated with a trend toward poor OS compared to lower-risk karyotype but was not statistically significant (HR = 2.136; 95% CI, 0.905–5.041; p-value = 0.083). In addition, the presence of poor-risk gene mutation was significantly associated with poor OS (HR = 2.366; 95% CI, 1.093–5.120; p-value = 0.029). Response to HMT and age above 70 years did not significantly affect OS (p-value = 0.128, 0.206, respectively).
Kaplan–Meier survival curves according to various clinical factors were compared using a log-rank test (Figure 2). In this analysis, the mutant TET2 group showed significantly higher OS compared with the WT TET2 group (Figure 2a, p-value = 0.048). The estimated OS at 24 months was 55.2% (95% CI, 46.0–64.4%) in the WT TET2 group and 72.7% (95% CI, 59.3–86.1%) in the mutant TET2 group. OS was not significantly different between the high and low miR-22 expressing groups (Figure 2b, p-value = 0.322). The estimated OS at 24 months was 73.3% (95% CI, 61.9–84.7%) in the high miR-22 expression group and 56.0% (95% CI, 46.1–65.9%) in the low miR-22 expression group. Consistent with the results of univariate Cox proportional hazards regression analysis, the differences in OS according to IPSS and IPSS-R risk categories were statistically significant (Figure 2c,d, p-value = 0.004, 0.000, respectively). Interestingly, the survival curves according to TET2 mutation status showed a pattern similar to those of risk groups based on IPSS and IPSS-R. Therefore, the strength of correlation between TET2 mutation status and risk groups based on IPSS and IPSS-R was analyzed using Goodman–Kruskal’s gamma (data not shown). As expected, TET2 mutation was strongly correlated with higher-risk disease based on IPSS (Gamma = −0.674, p-value = 0.027) and IPSS-R (Gamma = −0.800, p-value = 0.003). Meanwhile, high miR-22 expression was not significantly correlated with higher-risk disease based on IPSS (Gamma = −0.525, p-value = 0.074) and IPSS-R (Gamma = −0.412, p-value = 0.177).

4. Discussion

We conducted this study to determine whether TET2 mutation and miR-22 expression represent biomarkers for predicting response to HMT. Since the response to HMT occurs after the fourth to sixth cycle of treatment and is achieved in only about 50% of patients with MDS [6], biomarkers for predicting response to HMT are needed. In our study, the response rate to HMT was not significantly different between the WT and mutant TET2 groups. Similarly, the response rate to HMT was not significantly different between the low and high miR-22 expression groups.
It is still debated whether TET2 mutation can serve as a marker for predicting response to HMT. Some studies reported that TET2 mutation was a predictive marker of response to HMT. Itzykson et al. first reported that the response rate to azacitidine was higher in the mutant TET2 group than in the WT TET2 group [14]. In the study of Bejar et al., mutant TET2 patients showed only a trend toward increased responsiveness to HMT compared with WT TET2 patients [15]. However, in many other studies, TET2 mutation status did not affect responsiveness to HMT in patients with MDS and other related neoplasms [22,23,24]. In the case of miR-22, no study has reported the relationship between miR-22 expression status and responsiveness to HMT.
This discrepancy may be due to the heterogeneity of DNA methylation patterns among patients with MDS regardless of TET2 mutation. Reilly et al. reported that MDS patients could be categorized into five distinct clusters according to DNA methylation patterns [25]. In this study, patients with TET2 mutations were classified into clusters B, C and E but enriched only in cluster D. Interestingly, the DNA methylation pattern was not significantly different between TET2 mutants and non-mutants within a single cluster. Furthermore, the comparison of TET2 mutants within a single cluster with TET2 mutants in other clusters revealed differences in methylation, which were consistent with global differences between clusters. These results suggest that TET2-mutant patients can diverge to different epigenetic states, potentially driven by patterns of coincident mutations or other factors, which may affect the responsiveness to HMT together with TET2 mutation.
Interestingly, in our study, patients in the mutant TET2 group had lower-risk disease than those in the WT TET2 group. Moreover, patients in the mutant TET2 group showed less leukemic transformation and better overall survival than those in the WT TET2 group. These results may be associated with chromosomal stability affected by DNA methylation. DNA methylation is known to play a key role in stabilizing heterochromatin by repressing translocations induced by the transcription of endogenous transposons and avoiding guanine quadruplexes-induced DNA breaks [4]. In our study, cytogenetic abnormality tended to be less frequent in the mutant TET2 group than in the WT TET2 group (18.2% vs. 43.3%, p-value = 0.168). Similarly, in the study of Bejar et al., patients in the mutant TET2 group tended to manifest fewer cytogenetic abnormalities and lower-risk disease than those in the WT TET2 group [15]. Itzykson et al. also reported that karyotype according to IPSS was more favorable in TET2-mutated patients compared with WT-TET2 patients, but IPSS risk was not significantly different between the two groups [14]. In addition, in the study of Smith et al., there was a limited tendency toward poor karyotype and higher-risk disease in the WT TET2 group compared with the mutant TET2 group but was not statistically significant [26]. Meanwhile, in our study, the frequency of cytogenetic abnormalities was not significantly different between the low and high miR-22 expression groups. Furthermore, although there was a tendency for high miR-22 expression to be associated with lower-risk disease based on IPSS, lower leukemic transformation and longer survival, this tendency was weak compared with that of mutant TET2.
It is also unclear whether the loss of TET2 affects leukemic transformation and survival in patients with MDS. Shiozawa et al. reported that TET2 mutation was enriched in the EMK subgroup, which showed better survival and lower leukemic transformation compared with the IMP subgroup [27]. However, in this study, TET2 mutation was not unique to the EMK subgroup but was slightly detected in the IMP subgroup. Reilly et al. also reported that TET2 mutation was enriched in, but not unique to, cluster D, which belongs to the low cluster risk group with better survival than the high cluster risk group [25]. However, Smith et al. reported no significant differences in leukemic transformation and survival between mutant and WT TET2 groups [26]. In addition, in other studies, there was no significant difference in survival between the mutant and WT TET2 groups [14,15,22,23]. Similar to HMT responsiveness, concurrent mutations or other factors may influence leukemic transformation and survival together with TET2 mutation.
The study has some limitations. First, the overall response rate of the entire cohort to HMT was nearly 80%, which is higher than the common response rate of 50% [6]. This high response rate may be attributed to the small size of the entire cohort. Second, the presence of TET2 mutation and high miR-22 expression cannot guarantee loss of TET2 function. In our analysis, it was not distinguished whether TET2 mutation is heterozygous or homozygous due to the small number of patients having TET2 mutation. Fortunately, Ko et al. reported that the global levels of 5hmC were significantly reduced in patients carrying either homozygous or heterozygous TET2 mutations compared with patients bearing WT TET2 [28]. This means that even if the TET2 mutation is heterozygous, it is in a sufficient loss-of-function state. However, unfortunately, we cannot be sure that there is no difference between the heterozygous and homozygous TET2 mutation. Indeed, heterozygous TET2 knockout in mice, which led to ~50% loss of TET2 gene expression, resulted in significant but slower and less frequent malignant transformation than double-allele knockout [29]. Moreover, AML patients with homozygous TET2 mutation showed significantly inferior event-free survival and a higher relapse rate compared with those with heterozygous TET2 mutation [30]. Meanwhile, in the case of miR-22 expression, Song et al. reported that some patients manifested both high levels of miR-22 and TET2 simultaneously [13]. Unfortunately, the expression of TET2 was not analyzed in our study. This may be why there was no difference in the frequency of cytogenetic abnormalities between the low and high miR-22 expression groups, and the tendency of high miR-22 expression to have lower-risk disease based on IPSS, lower leukemic transformation and longer survival was weaker than that of mutant TET-2.
In conclusion, TET2 mutation is not a good biomarker for predicting response to HMT. The miR-22 expression level is also not a good biomarker for predicting response to HMT. Responsiveness to HMT is thought to be affected by many other factors together with loss of TET2 function. Loss of TET2 function, including both TET2 mutation and high miR-22 expression, may be associated with lower-risk disease based on IPSS, lower leukemic transformation and longer survival. This may be associated with chromosomal stability affected by DNA methylation, which may contribute to the low frequency of cytogenetic abnormality in patients with mutant TET2 compared with those carrying WT TET2.

Author Contributions

J.Y. and Y.S.J. contributed as the first author, including writing the manuscript; J.Y., S.H.L., S.H.K., C.K.K., S.B.B., J.H.W. and S.K.P. participated in the IRB approval process, and collected clinical data of patients; With the help of G.H.J., Y.S.J. commissioned the NGS test and FISH for TET2 detection, and performed RT-PCR of miR-22; J.Y. and Y.S.J. analyzed and interpreted the data; S.K.P. designed the study and reviewed the manuscript. All authors have read and agreed to the published version of the manuscript.

Funding

This study was supported by a grant from the R&D project of the HK inno. N. [CS2018_0009] and the Soonchunhyang University Research Fund [10210023], South Korea.

Institutional Review Board Statement

The study was conducted according to the guidelines of the Declaration of Helsinki, and approved by the Institutional Review Board (IRB 2018-05-018) of Soonchunhyang University Bucheon Hospital.

Informed Consent Statement

Informed consent was obtained from all subjects involved in the study.

Conflicts of Interest

The authors declare that they have no known competing financial interests or personal relationships that could have appeared to influence the work reported in this paper.

References

  1. Visconte, V.; Tiu, R.V.; Rogers, H.J. Pathogenesis of myelodysplastic syndromes: An overview of molecular and non-molecular aspects of the disease. Blood Res. 2014, 49, 216–227. [Google Scholar] [CrossRef] [PubMed]
  2. Park, E.H.; Lee, H.; Won, Y.J.; Ju, H.Y.; Oh, C.M.; Ingabire, C.; Kong, H.J.; Park, B.K.; Yoon, J.Y.; Eom, H.S.; et al. Nationwide statistical analysis of myeloid malignancies in Korea: Incidence and survival rate from 1999 to 2012. Blood Res. 2015, 50, 204–217. [Google Scholar] [CrossRef] [Green Version]
  3. Ogawa, S. Genetics of MDS. Blood 2019, 133, 1049–1059. Available online: https://www.ncbi.nlm.nih.gov/pmc/articles/PMC6587668/ (accessed on 3 August 2021). [CrossRef] [Green Version]
  4. Itzykson, R.; Fenaux, P. Epigenetics of myelodysplastic syndromes. Leukemia 2014, 28, 497–506. [Google Scholar] [CrossRef]
  5. Woods, B.A.; Levine, R.L. The role of mutations in epigenetic regulators in myeloid malignancies. Immunol. Rev. 2015, 263, 22–35. [Google Scholar] [CrossRef] [PubMed]
  6. Santini, V. How I treat MDS after hypomethylating agent failure. Blood 2019, 133, 521–529. [Google Scholar] [CrossRef] [Green Version]
  7. Kim, Y.J.; Jang, J.H.; Kwak, J.Y.; Lee, J.H.; Kim, H.J. Use of azacitidine for myelodysplastic syndromes: Controversial issues and practical recommendations. Blood Res. 2013, 48, 87–98. [Google Scholar] [CrossRef] [PubMed] [Green Version]
  8. Kim, C.K.; Han, D.H.; Ji, Y.S.; Lee, M.S.; Min, C.W.; Park, S.K.; Kim, S.H.; Yun, J.; Kim, H.J.; Kim, K.H.; et al. Biomarkers of angiogenesis as prognostic factors in myelodysplastic syndrome patients treated with hypomethylating agents. Leuk. Res. 2016, 50, 21–28. [Google Scholar] [CrossRef]
  9. Rasmussen, K.D.; Helin, K. Role of TET enzymes in DNA methylation, development, and cancer. Genes Dev. 2016, 30, 733–750. [Google Scholar] [CrossRef]
  10. Rasmussen, K.D.; Jia, G.; Johansen, J.V.; Pedersen, M.T.; Rapin, N.; Bagger, F.O.; Porse, B.T.; Bernard, O.A.; Christensen, J.; Helin, K. Loss of TET2 in hematopoietic cells leads to DNA hypermethylation of active enhancers and induction of leukemogenesis. Genes Dev. 2015, 29, 910–922. [Google Scholar] [CrossRef] [Green Version]
  11. Yamazaki, J.; Jelinek, J.; Lu, Y.; Cesaroni, M.; Madzo, J.; Neumann, F.; He, R.; Taby, R.; Vasanthakumar, A.; Macrae, T.; et al. TET2 mutations affect Non-CpG island DNA methylation at enhancers and transcription factor-binding sites in chronic myelomonocytic Leukemia. Cancer Res. 2015, 75, 2833–2843. [Google Scholar] [CrossRef] [PubMed] [Green Version]
  12. Cheng, J.; Guo, S.; Chen, S.; Mastriano, S.J.; Liu, C.; D’Alessio, A.C.; Hysolli, E.; Guo, Y.; Yao, H.; Megyola, C.M.; et al. An Extensive Network of TET2-Targeting MicroRNAs Regulates Malignant Hematopoiesis. Cell Rep. 2013, 5, 471–481. [Google Scholar] [CrossRef] [Green Version]
  13. Song, S.J.; Ito, K.; Ala, U.; Kats, L.; Webster, K.; Sun, S.M.; Jongen-Lavrencic, M.; Manova-Todorova, K.; Teruya-Feldstein, J.; Avigan, D.E.; et al. The Oncogenic MicroRNA miR-22 Targets the TET2 Tumor Suppressor to Promote Hematopoietic Stem Cell Self-Renewal and Transformation. Cell Stem Cell 2013, 13, 87–101. Available online: https://linkinghub.elsevier.com/retrieve/pii/S1934590913002610 (accessed on 3 August 2021). [CrossRef] [PubMed] [Green Version]
  14. Itzykson, R.; Kosmider, O.; Cluzeau, T.; Mansat-De Mas, V.; Dreyfus, F.; Beyne-Rauzy, O.; Quesnel, B.; Vey, N.; Gelsi-Boyer, V.; Raynaud, S.; et al. Impact of TET2 mutations on response rate to azacitidine in myelodysplastic syndromes and low blast count acute myeloid leukemias. Leukemia 2011, 25, 1147–1152. [Google Scholar] [CrossRef] [PubMed] [Green Version]
  15. Bejar, R.; Lord, A.; Stevenson, K.; Bar-Natan, M.; Pérez-Ladaga, A.; Zaneveld, J.; Wang, H.; Caughey, B.; Stojanov, P.; Getz, G.; et al. TET2 mutations predict response to hypomethylating agents in myelodysplastic syndrome patients. Blood 2014, 124, 2705–2712. [Google Scholar] [CrossRef]
  16. Vardiman, J.W.; Thiele, J.; Arber, D.A.; Brunning, R.D.; Borowitz, M.J.; Porwit, A.; Harris, N.L.; Le Beau, M.M.; Hellström-Lindberg, E.; Tefferi, A.; et al. The 2008 revision of the World Health Organization (WHO) classification of myeloid neoplasms and acute leukemia: Rationale and important changes. Blood 2009, 114, 937–951. [Google Scholar] [CrossRef] [Green Version]
  17. Greenberg, P.; Cox, C.; LeBeau, M.M.; Fenaux, P.; Morel, P.; Sanz, G.; Sanz, M.; Vallespi, T.; Hamblin, T.; Oscier, D.; et al. International scoring system for evaluating prognosis in myelodysplastic syndromes. Blood 1997, 89, 2079–2088. [Google Scholar] [CrossRef]
  18. Greenberg, P.; Cox, C.; LeBeau, M.M.; Fenaux, P.; Morel, P.; Sanz, G.; Sanz, M.; Vallespi, T.; Hamblin, T.; Oscier, D.; et al. Revised international prognostic scoring system for myelodysplastic syndromes. Blood 2012, 120, 2454–2465. [Google Scholar] [CrossRef] [PubMed]
  19. Cheson, B.D.; Greenberg, P.L.; Bennett, J.M.; Lowenberg, B.; Wijermans, P.W.; Nimer, S.D.; Pinto, A.; Beran, M.; De Witte, T.M.; Stone, R.M.; et al. Clinical application and proposal for modification of the International Working Group (IWG) response criteria in myelodysplasia. Blood 2006, 108, 419–425. [Google Scholar] [CrossRef] [PubMed] [Green Version]
  20. Myelodysplastic Syndromes. National Comprehensive Cancer Network Clinical Practice Guidelines in Oncology-V1.2021, National Comprehensive Cancer Network. Available online: https://www.nccn.org/professionals/physician_gls/pdf/mds.pdf (accessed on 11 September 2020).
  21. Hou, H.A.; Tsai, C.H.; Lin, C.C.; Chou, W.C.; Kuo, Y.Y.; Liu, C.Y.; Tseng, M.H.; Peng, Y.L.; Liu, M.C.; Liu, C.W.; et al. Incorporation of mutations in five genes in the revised International Prognostic Scoring System can improve risk stratification in the patients with myelodysplastic syndrome. Blood Cancer J. 2018, 8, 39. [Google Scholar] [CrossRef]
  22. Braun, T.; Itzykson, R.; Renneville, A.; de Renzis, B.; Dreyfus, F.; Laribi, K.; Bouabdallah, K.; Vey, N.; Toma, A.; Recher, C.; et al. Molecular predictors of response to decitabine in advanced chronic myelomonocytic leukemia: A phase 2 trial. Blood 2011, 118, 3824–3831. [Google Scholar] [CrossRef] [Green Version]
  23. Traina, F.; Visconte, V.; Elson, P.; Tabarroki, A.; Jankowska, A.M.; Hasrouni, E.; Sugimoto, Y.; Szpurka, H.; Makishima, H.; O’keefe, C.L.; et al. Impact of molecular mutations on treatment response to DNMT inhibitors in myelodysplasia and related neoplasms. Leukemia 2014, 28, 78–87. [Google Scholar] [CrossRef]
  24. Jung, S.H.; Kim, Y.J.; Yim, S.H.; Kim, H.J.; Kwon, Y.R.; Hur, E.H.; Goo, B.K.; Choi, Y.S.; Lee, S.H.; Chung, Y.J.; et al. Somatic mutations predict outcomes of hypomethylating therapy in patients with myelodysplastic syndrome. Oncotarget 2016, 7, 55264–55275. [Google Scholar] [CrossRef] [Green Version]
  25. Reilly, B.; Tanaka, T.N.; Diep, D.; Yeerna, H.; Tamayo, P.; Zhang, K.; Bejar, R. DNA methylation identifies genetically and prognostically distinct subtypes of myelodysplastic syndromes. Blood Adv. 2019, 3, 2845–2858. [Google Scholar] [CrossRef]
  26. Smith, A.E.; Mohamedali, A.M.; Kulasekararaj, A.; Lim, Z.; Gäken, J.; Lea, N.C.; Przychodzen, B.; Mian, S.A.; Nasser, E.E.; Shooter, C.; et al. Next-generation sequencing of the TET2 gene in 355 MDS and CMMLpatients reveals low-abundance mutant clones with early origins, but indicates no definite prognostic value. Blood 2010, 116, 3923–3932. [Google Scholar] [CrossRef] [Green Version]
  27. Shiozawa, Y.; Malcovati, L.; Gallì, A.; Pellagatti, A.; Karimi, M.; Sato-Otsubo, A.; Sato, Y.; Suzuki, H.; Yoshizato, T.; Yoshida, K.; et al. Gene expression and risk of leukemic transformation in myelodysplasia. Blood 2017, 130, 2642–2653. [Google Scholar] [CrossRef]
  28. Ko, M.; Huang, Y.; Jankowska, A.M.; Pape, U.J.; Tahiliani, M.; Bandukwala, H.S.; An, J.; Lamperti, E.D.; Koh, K.P.; Ganetzky, R.; et al. Impaired hydroxylation of 5-methylcytosine in myeloid cancers with mutant TET2. Nature 2010, 468, 839–843. [Google Scholar] [CrossRef] [PubMed] [Green Version]
  29. Li, Z.; Cai, X.; Cai, C.L.; Wang, J.; Zhang, W.; Petersen, B.E.; Yang, F.C.; Xu, M. Deletion of Tet2 in mice leads to dysregulated hematopoietic stem cells and subsequent development of myeloid malignancies. Blood 2011, 118, 4509–4518. [Google Scholar] [CrossRef] [PubMed] [Green Version]
  30. Ahn, J.S.; Kim, H.J.; Kim, Y.K.; Jung, S.H.; Yang, D.H.; Lee, J.J.; Lee, I.K.; Kim, N.Y.; Minden, M.D.; Jung, C.W.; et al. Adverse prognostic effect of homozygous TET2 mutation on the relapse risk of acute myeloid leukaemia in patients of normal karyotype. Haematologica 2015, 100, e351. [Google Scholar] [CrossRef] [PubMed] [Green Version]
Figure 1. Flow chart of this retrospective study. Abbreviations: HMT, hypomethylating therapy; MDS, myelodysplastic syndrome; TET2, Tet methylcytosine dioxygenase 2; IPSS, International Prognostic Scoring System; IPSS-R, Revised International Prognostic Scoring System.
Cimb 43 00065 g001
Figure 2. Kaplan–Meier survival curves according to various clinical factors. (a) Survival curves according to TET2 mutation status. (b) Survival curves according to miR-22 expression status. (c) Survival curves according to IPSS risk categories. (d) Survival curves according to IPSS-R risk categories. Abbreviations: TET2, Tet methylcytosine dioxygenase 2; IPSS, International Prognostic Scoring System; IPSS-R, Revised International Prognostic Scoring System. p-values were calculated using a log-rank test.
Cimb 43 00065 g002
Table 1. Baseline characteristics according to TET2 mutation status.
WT TET2 (n = 30)Mutant TET2 (n = 11)p-Value
Median age63 (23–86)65 (38–82)0.835
Sex (M/F)18/128/30.716
Disease subtypes 0.434
 MDS-SLD2 (6.7)0 (0.0)
 MDS-MLD6 (20.0)4 (36.4)
 MDS-EB19 (30.0)2 (18.2)
 MDS-EB28 (26.7)3 (27.3)
 MDS-U1 (3.3)0 (0.0)
 CMML4 (13.3)1 (9.1)
 5q-syndrome0 (0.0)1 (9.1)
IPSS risk categories
 Low
 Intermediate-1
 Intermediate-2
 High
 Lower-risk disease *
 Higher-risk disease *

1 (3.3)
13 (43.3)
12 (40.0)
4 (13.3)
14 (46.7)
16 (53.3)

1 (9.1)
8 (72.7)
2 (18.2)
0 (0.0)
9 (81.8)
2 (18.2)
0.039


0.075
IPSS-R risk categories
 Very low
 Low
 Intermediate
 High
 Very high
 Lower-risk group *
 Higher-risk group *

1 (3.3)
3 (10.0)
6 (20.0)
9 (30.0)
11 (36.7)
10 (33.3)
20 (66.7)

0 (0.0)
4 (36.4)
5 (45.5)
2 (18.2)
0 (0.0)
9 (81.8)
2 (18.2)
0.009


0.006
Cytogenetic abnormality13 (43.3)2 (18.2)0.168
Cytogenetic risk categories
 Very good2 (6.7)0 (0.0)0.102
 Good19 (63.3)11 (100.0)
 Intermediate2 (6.7)0 (0.0)
 Poor2 (6.7)0 (0.0)
 Very poor5 (16.7)0 (0.0)
 Lower-risk karyotype ◊21 (70.0)11 (100.0)0.083
 Higher-risk karyotype ◊9 (30.0)0 (0.0)
Poor-risk gene mutation13 (43.3)4 (36.4)0.736
Transfusion requirement26 (86.7)8 (72.7)0.361
Abbreviations: CMML, chronic myelomonocytic leukemia; IPSS, International Prognostic Scoring System; IPSS-R, Revised International Prognostic Scoring System; MDS-SLD, MDS-single lineage dysplasia; MDS-MLD, MDS-multilineage dysplasia; MDS-EB1, MDS-excess blasts-1; MDS-EB2, MDS-excess blasts-2; MDS-U, MDS-unclassified; TET2, Tet methylcytosine dioxygenase 2; WT, wild-type. * Based on the IPSS and IPSS-R, patients are divided into lower-risk disease (IPSS low, intermediate-1; IPSS-R very low, low, intermediate) and higher-risk disease (IPSS Intermediate-2, high; IPSS-R high, very high) groups. ◊ Based on the IPSS-R, cytogenetic risk categories are divided into lower-risk karyotype (IPSS-R very good, good) and higher-risk karyotype (IPSS-R intermediate, poor, very poor).
Table 2. Treatment outcomes of HMT according to TET2 mutation status.
VariablesWT TET2 (n = 30)Mutant TET2 (n = 11)p-Value
Any response to HMT25 (83.3)9 (81.8)1.000
Hematologic improvement
-
Erythroid
20 (66.7)6 (54.5)0.491
-
Platelet
21 (70.0)5 (45.5)0.272
Disease progression19 (63.3)3 (27.3)0.040
Median time to progression (m) *19.3 (5.5–47.8)49.8 (6.7–95.9)0.007
Leukemic transformation17 (56.7)2 (18.2)0.029
Death23 (76.7)4 (36.4)0.026
Abbreviations: HMT, hypomethylating therapy; m, month; TET2, Tet methylcytosine dioxygenase 2; WT, wild-type. * Median time to progression was calculated with Kaplan–Meier method using intention-to-treat (ITT) analysis. A log-rank test was used to compare TTP.
Table 3. Baseline characteristics according to miR-22 expression status.
Low miR-22 Expression (n = 26)High miR-22 Expression (n = 15)p-Value
Median age63 (42–86)60 (23–79)0.422
Sex (M/F)16/1010/50.743
 Disease subtypes 0.061
 MDS-SLD1 (3.8)1 (6.7)
 MDS-MLD4 (15.4)6 (40.0)
 MDS-EB15 (19.2)6 (40.0)
 MDS-EB29 (34.6)2 (13.3)
 MDS-U1 (3.8)0 (0.0)
 CMML5 (19.2)0 (0.0)
 5q-syndrome1 (3.8)0 (0.0)
IPSS risk categories
 Low
 Intermediate-1
 Intermediate-2
 High
 Lower-risk disease *
 Higher-risk disease *

2 (7.7)
10 (38.5)
10 (38.5)
4 (15.4)
12 (46.2)
14 (53.8)

0 (0.0)
11 (73.3)
4 (26.7)
0 (0.0)
11 (73.3)
4 (26.7)
0.149


0.091
IPSS-R risk categories 0.429
 Very low1 (3.8)0 (0.0)
 Low3 (11.5)4 (26.7)
 Intermediate6 (23.1)5 (33.3)
 High9 (34.6)2 (13.3)
 Very high7 (26.9)4 (26.7)0.183
 Lower-risk disease *10 (38.5)9 (60.0)
 Higher-risk disease *16 (61.5)6 (40.0)
Cytogenetic abnormality9 (34.6)6 (40.0)0.730
Cytogenetic risk categories
 Very good1 (3.8)1 (6.7)0.757
 Good20 (76.9)10 (66.7)
 Intermediate1 (3.8)1 (6.7)
 Poor1 (3.8)1 (6.7)
 Very poor3 (11.5)2 (13.3)
 Lower-risk karyotype ◊21 (80.8)11 (73.3)0.701
 Higher-risk karyotype ◊5 (19.2)4 (26.7)
Poor-risk gene mutation11 (42.3)6 (40.0)0.885
Transfusion requirement23 (88.5)11 (73.3)0.390
Abbreviations: CMML, chronic myelomonocytic leukemia; IPSS, International Prognostic Scoring System; IPSS-R, Revised International Prognostic Scoring System; MDS-SLD, MDS-single lineage dysplasia; MDS-MLD, MDS-multilineage dysplasia; MDS-EB1, MDS-excess blasts-1; MDS-EB2, MDS-excess blasts-2; MDS-U, MDS-unclassified. * Based on IPSS and IPSS-R, patients are divided into lower-risk disease (IPSS low, intermediate-1; IPSS-R very low, low, intermediate) and higher-risk disease (IPSS Intermediate-2, high; IPSS-R high, very high) groups. ◊ Based on the IPSS-R, cytogenetic risk categories are divided into lower-risk karyotype (IPSS-R very good, good) and higher-risk karyotype (IPSS-R intermediate, poor, very poor).
Table 4. Treatment outcomes of HMT according to miR-22 expression status.
VariablesLow miR-22 Expression
(n = 26)
High miR-22 Expression
(n = 15)
p-Value
Any response to HMT21 (80.8)13 (86.7)1.000
Hematologic improvement
-
Erythroid
15 (57.7)11 (73.3)0.317
-
Platelet
17 (65.4)9 (60.0)0.730
Disease progression16 (61.5)6 (40.0)0.183
Median time to progression (m) *23.1 (5.5–67.1)25.9 (6.7–95.9)0.155
Leukemic transformation15 (57.7)4 (26.7)0.055
Death19 (73.1)8 (53.3)0.199
Abbreviations: HMT, hypomethylating therapy; m, month. * Median time to progression was calculated with the Kaplan–Meier method using intention-to-treat (ITT) analysis. A log-rank test was used to compare TTP.
Table 5. Association of various clinical factors with overall response to hypomethylating therapy.
VariablesAny Response to HMT
Odds Ratio (95% CI)p-Value a
TET2 mutation0.900 (0.148–5.489)0.909
High miR-22 expression1.548 (0.261–9.175)0.631
IPSS (higher-risk to lower-risk disease) b2.222 (0.377–13.082)0.377
IPSS-R (higher-risk to lower-risk disease) b1.689 (0.327–8.732)0.532
Cytogenetic abnormality4.200 (0.454–38.843)0.206
Cytogenetic risk categories1.846 (0.193–17.700)0.595
(higher-risk to lower-risk karyotype) c
Poor-risk gene mutation0.933 (0.180–4.838)0.935
Elderly (≥70)0.933 (0.180–4.838)0.935
Abbreviations: CI, confidence interval; HMT, hypomethylating therapy; IPSS, International Prognostic Scoring System; IPSS-R, Revised International Prognostic Scoring System; TET2, Tet methylcytosine dioxygenase 2. a p-value was calculated via univariate logistic regression analysis. b Based on the IPSS and IPSS-R, patients are divided into lower-risk disease (IPSS low, intermediate-1; IPSS-R very low, low, intermediate) and higher-risk disease (IPSS Intermediate-2, high; IPSS-R high, very high) groups. c Based on the IPSS-R, cytogenetic risk categories are divided into lower-risk karyotype (IPSS-R very good, good) and higher-risk karyotype (IPSS-R intermediate, poor, very poor).
Table 6. Association of various clinical factors with leukemic transformation.
VariablesLeukemic Transformation
Odds Ratio (95% CI)p-Value a
TET2 mutation0.170 (0.031–0.924)0.040
High miR-22 expression0.267 (0.067–1.064)0.061
IPSS (higher-risk to lower-risk disease) b7.367 (1.836–29.554)0.005
IPSS-R (higher-risk to lower-risk disease) b4.900 (1.282–18.725)0.020
Cytogenetic abnormality2.400 (0.654–8.811)0.187
Cytogenetic risk categories5.833 (1.038–32.797)0.045
(higher-risk vs. lower-risk karyotype) c
Poor-risk gene mutation17.733 (3.619–86.885)0.000
Response to HMT0.592 (0.115–3.061)0.532
Elderly (≥70)1.575 (0.451–5.504)0.477
Abbreviations: CI, confidence interval; HMT, hypomethylating therapy; IPSS, International Prognostic Scoring System; IPSS-R, Revised International Prognostic Scoring System; TET2, Tet methylcytosine dioxygenase 2. a p-value was calculated via univariate logistic regression analysis. b Based on the IPSS and IPSS-R, patients are divided into lower-risk disease (IPSS low, intermediate-1; IPSS-R very low, low, intermediate) and higher-risk disease (IPSS Intermediate-2, high; IPSS-R high, very high) groups. c Based on the IPSS-R, cytogenetic risk categories are divided into lower-risk karyotype (IPSS-R very good, good) and higher-risk karyotype (IPSS-R intermediate, poor, very poor).
Table 7. Association of various clinical factors with overall survival.
VariablesOverall Survival
Hazard Ratio (95% CI)p-Value a
TET2 mutation0.354 (0.121–1.039)0.059
High miR-22 expression0.661 (0.289–1.513)0.327
IPSS (higher-risk vs. lower-risk disease) b2.093 (0.972–4.507)0.059
IPSS-R (higher-risk vs. lower-risk disease) b4.310 (1.724–10.776)0.002
Cytogenetic abnormality1.454 (0.666–3.173)0.348
Cytogenetic risk categories2.136 (0.905–5.041)0.083
(higher-risk vs. lower-risk karyotype) c
Poor-risk gene mutation2.366 (1.093–5.120)0.029
Response to HMT0.490 (0.196–1.228)0.128
Elderly (≥70)1.639 (0.762–3.525)0.206
Abbreviations: CI, confidence interval; HMT, hypomethylating therapy; IPSS, International Prognostic Scoring System; IPSS-R, Revised International Prognostic Scoring System; TET2, Tet methylcytosine dioxygenase 2. a p-value was calculated via univariate Cox proportional hazards regression analysis. b Based on the IPSS and IPSS-R, patients are divided into lower-risk disease (IPSS low, intermediate-1; IPSS-R very low, low, intermediate) and higher-risk disease (IPSS Intermediate-2, high; IPSS-R high, very high) groups. c Based on the IPSS-R, cytogenetic risk categories are divided into lower-risk karyotype (IPSS-R very good, good) and higher-risk karyotype (IPSS-R intermediate, poor, very poor).
Publisher’s Note: MDPI stays neutral with regard to jurisdictional claims in published maps and institutional affiliations.

