
Effects of Nutrition, and Physical Activity Habits and Perceptions on Body Mass Index (BMI) in Children Aged 12–15 Years: A Cross-Sectional Study Comparing Boys and Girls


 , ,
, ,
Abstract
:1. Introduction
2. Materials and Methods
2.1. Measurement
2.2. Questionnaires
2.3. Statistical Analysis
3. Results
3.1. Sample Characteristics
3.2. Results of Partial Proportional Odds Models
3.2.1. Partial Proportional Odds Models (PPOM): Boys
3.2.2. Partial Proportional Odds Models (PPOM): Girls
4. Discussion
5. Conclusions
Author Contributions
Funding
Institutional Review Board Statement
Informed Consent Statement
Data Availability Statement
Acknowledgments
Conflicts of Interest
Appendix A


| Regions | Prefectures | % of Sample |
|---|---|---|
| Eastern Macedonia Thrace | Drama | 1.10 |
| Evros | 1.10 | |
| Kavala | 1.10 | |
| Xanthi | 1.10 | |
| Rodopi | 1.10 | |
| Central Macedonia | Thessaloniki (2 regional units) | 10.40 |
| Imathia | 1.10 | |
| Kilkis | 1.10 | |
| Pella | 1.10 | |
| Pieria | 1.10 | |
| Serres | 2.20 | |
| Halkidiki | 1.10 | |
| Western Macedonia | Kastoria | 1.10 |
| Kozani | 2.20 | |
| Florina | 1.10 | |
| Epirus | Arta | 1.10 |
| Thesprotia | 1.10 | |
| Ιoannina | 2.20 | |
| Preveza | 1.10 | |
| Thessalia | Magnesia | 2.00 |
| Larissa | 2.70 | |
| Trikala | 1.50 | |
| Ionian Islands | Zakynthos | 1.00 |
| Corfu | 1.10 | |
| Kefallinia | 1.00 | |
| Western Greece | Aetoloakarnania | 2.50 |
| Ahaia | 3.20 | |
| Viotia | 1.80 | |
| Evia | 2.00 | |
| Fthiotida | 1.70 | |
| Attiki | Athens (6 regional units) | 20.80 |
| Piraeus | 6.30 | |
| Peloponnese | Argolida | 1.10 |
| Arkadia | 1.10 | |
| Corinthοs | 1.10 | |
| Laconia | 1.10 | |
| Messenia | 2.20 | |
| North Aegean | Lesvos | 1.10 |
| Samos | 1.10 | |
| Chios | 1.10 | |
| South Aegean | Cyclades (Samos, Santorini) | 2.20 |
| Dodecanese (Rhodes, Kastelorizo) | 2.20 | |
| Crete | Heraklion | 2.60 |
| Lasithi | 1.00 | |
| Rethymno | 1.00 |
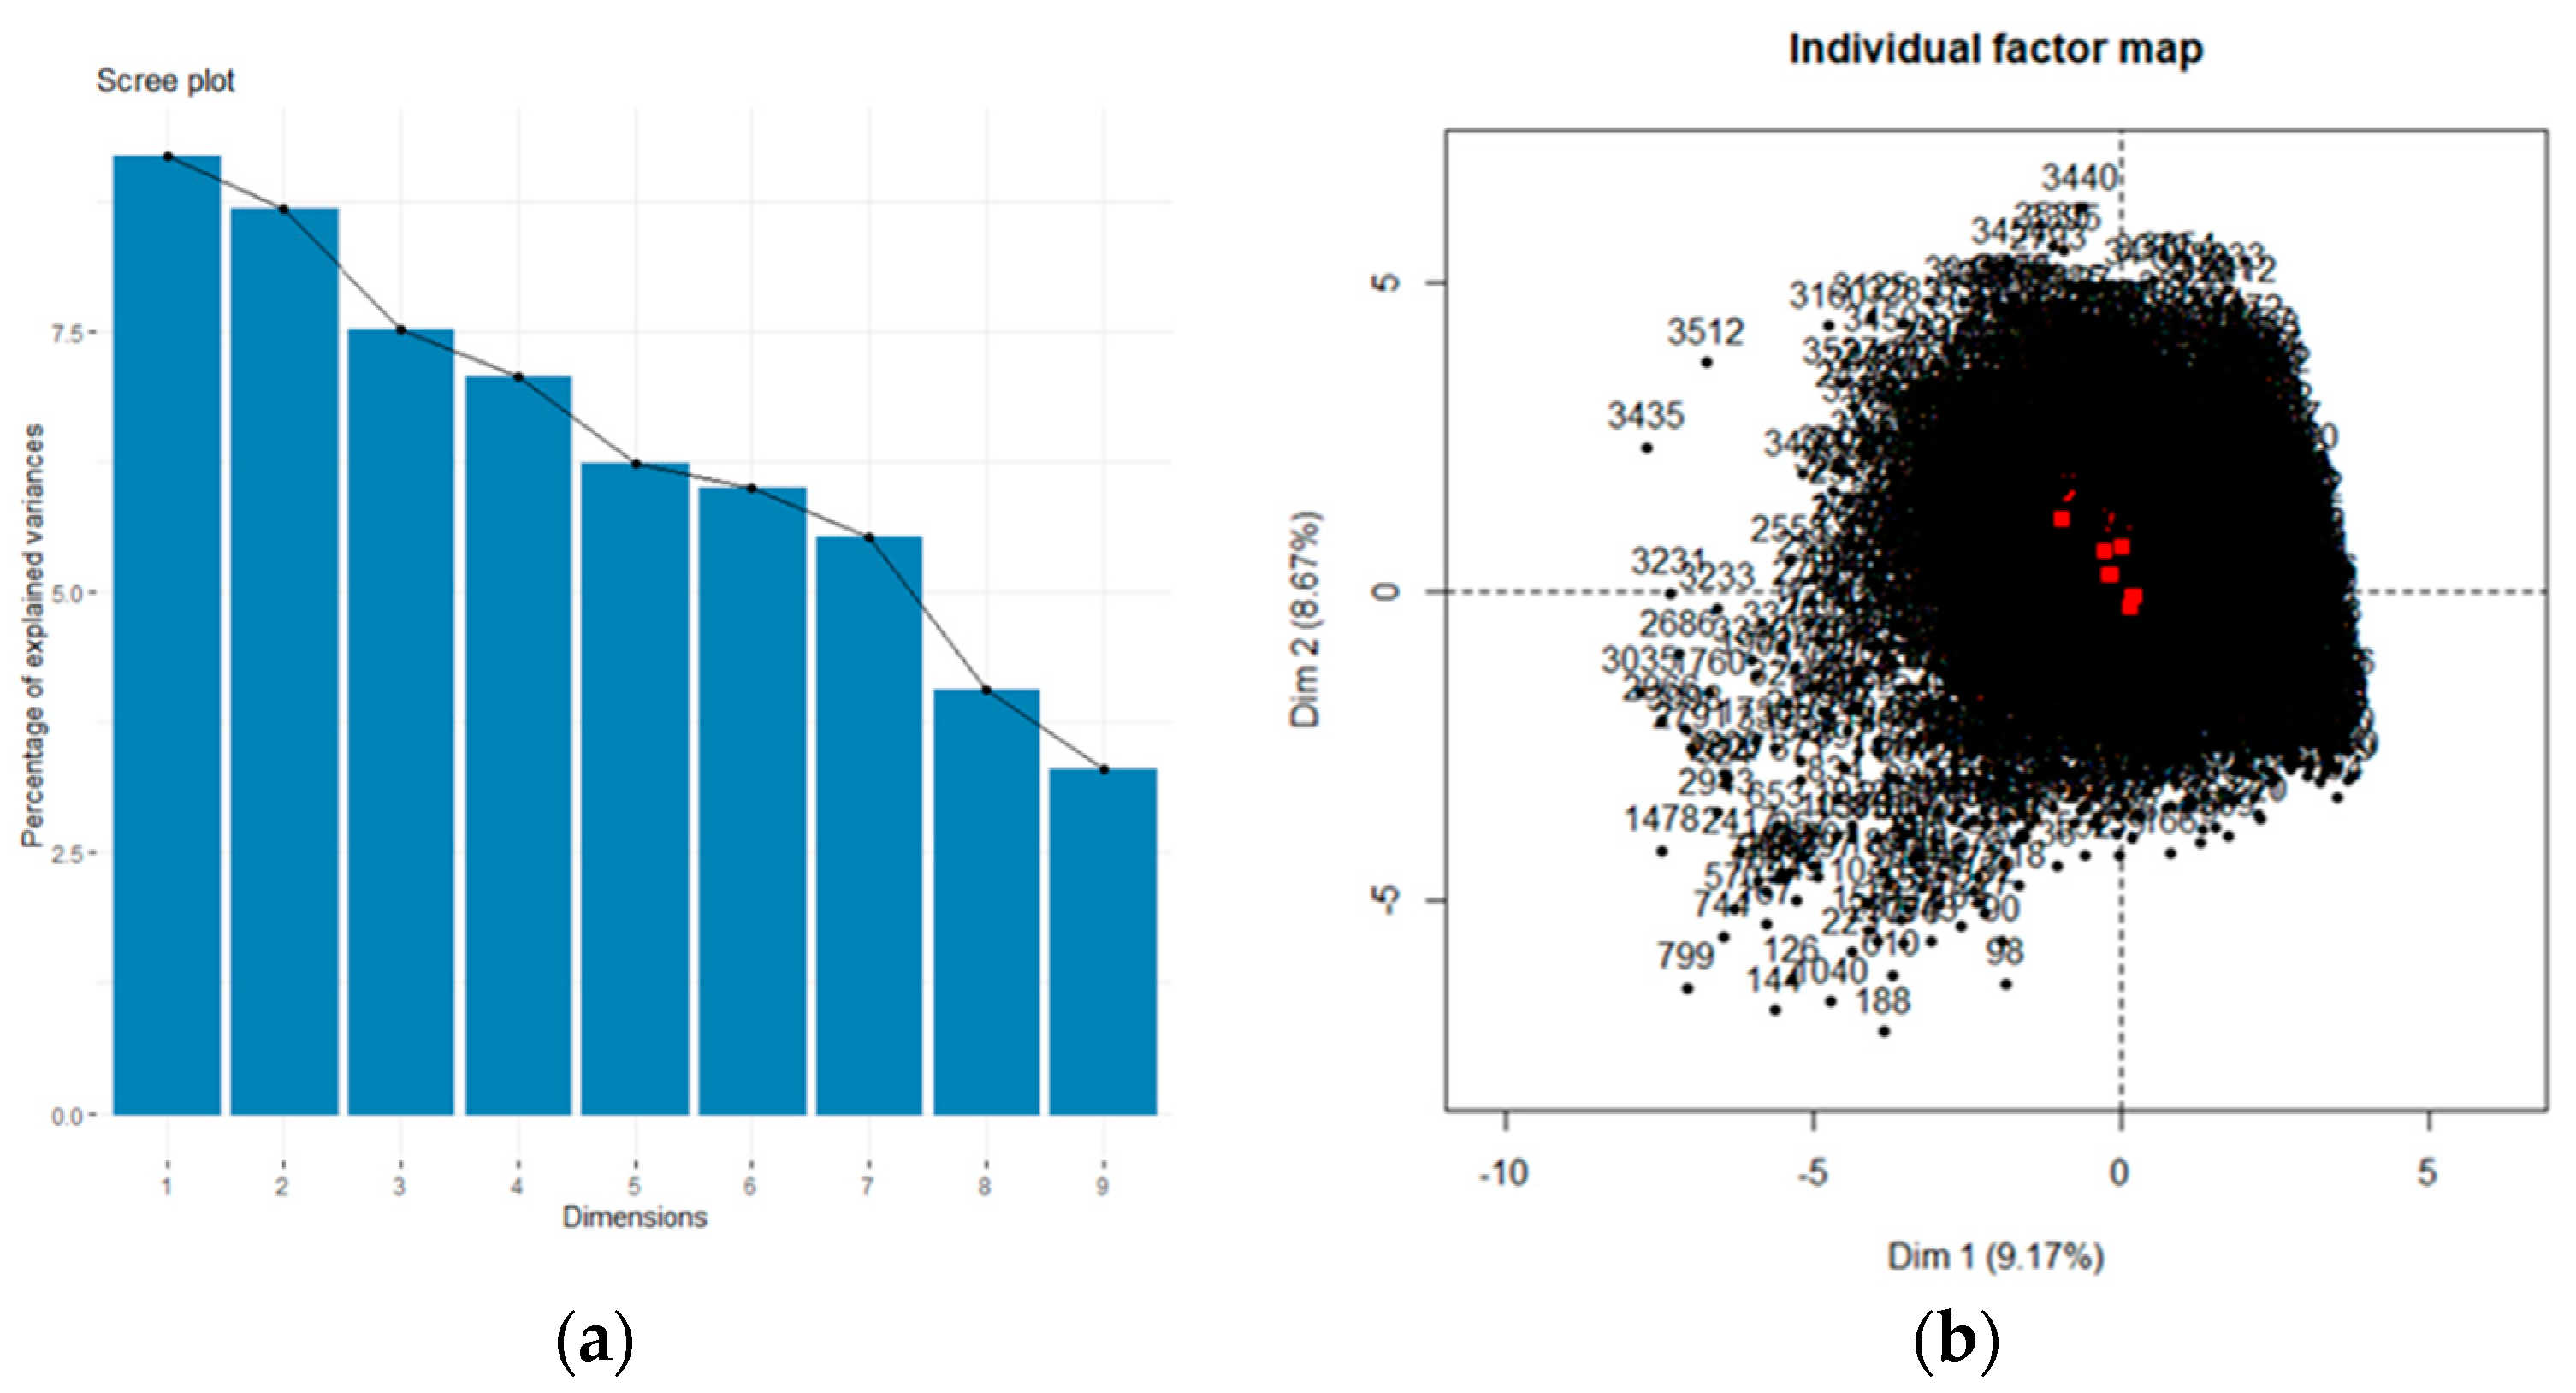
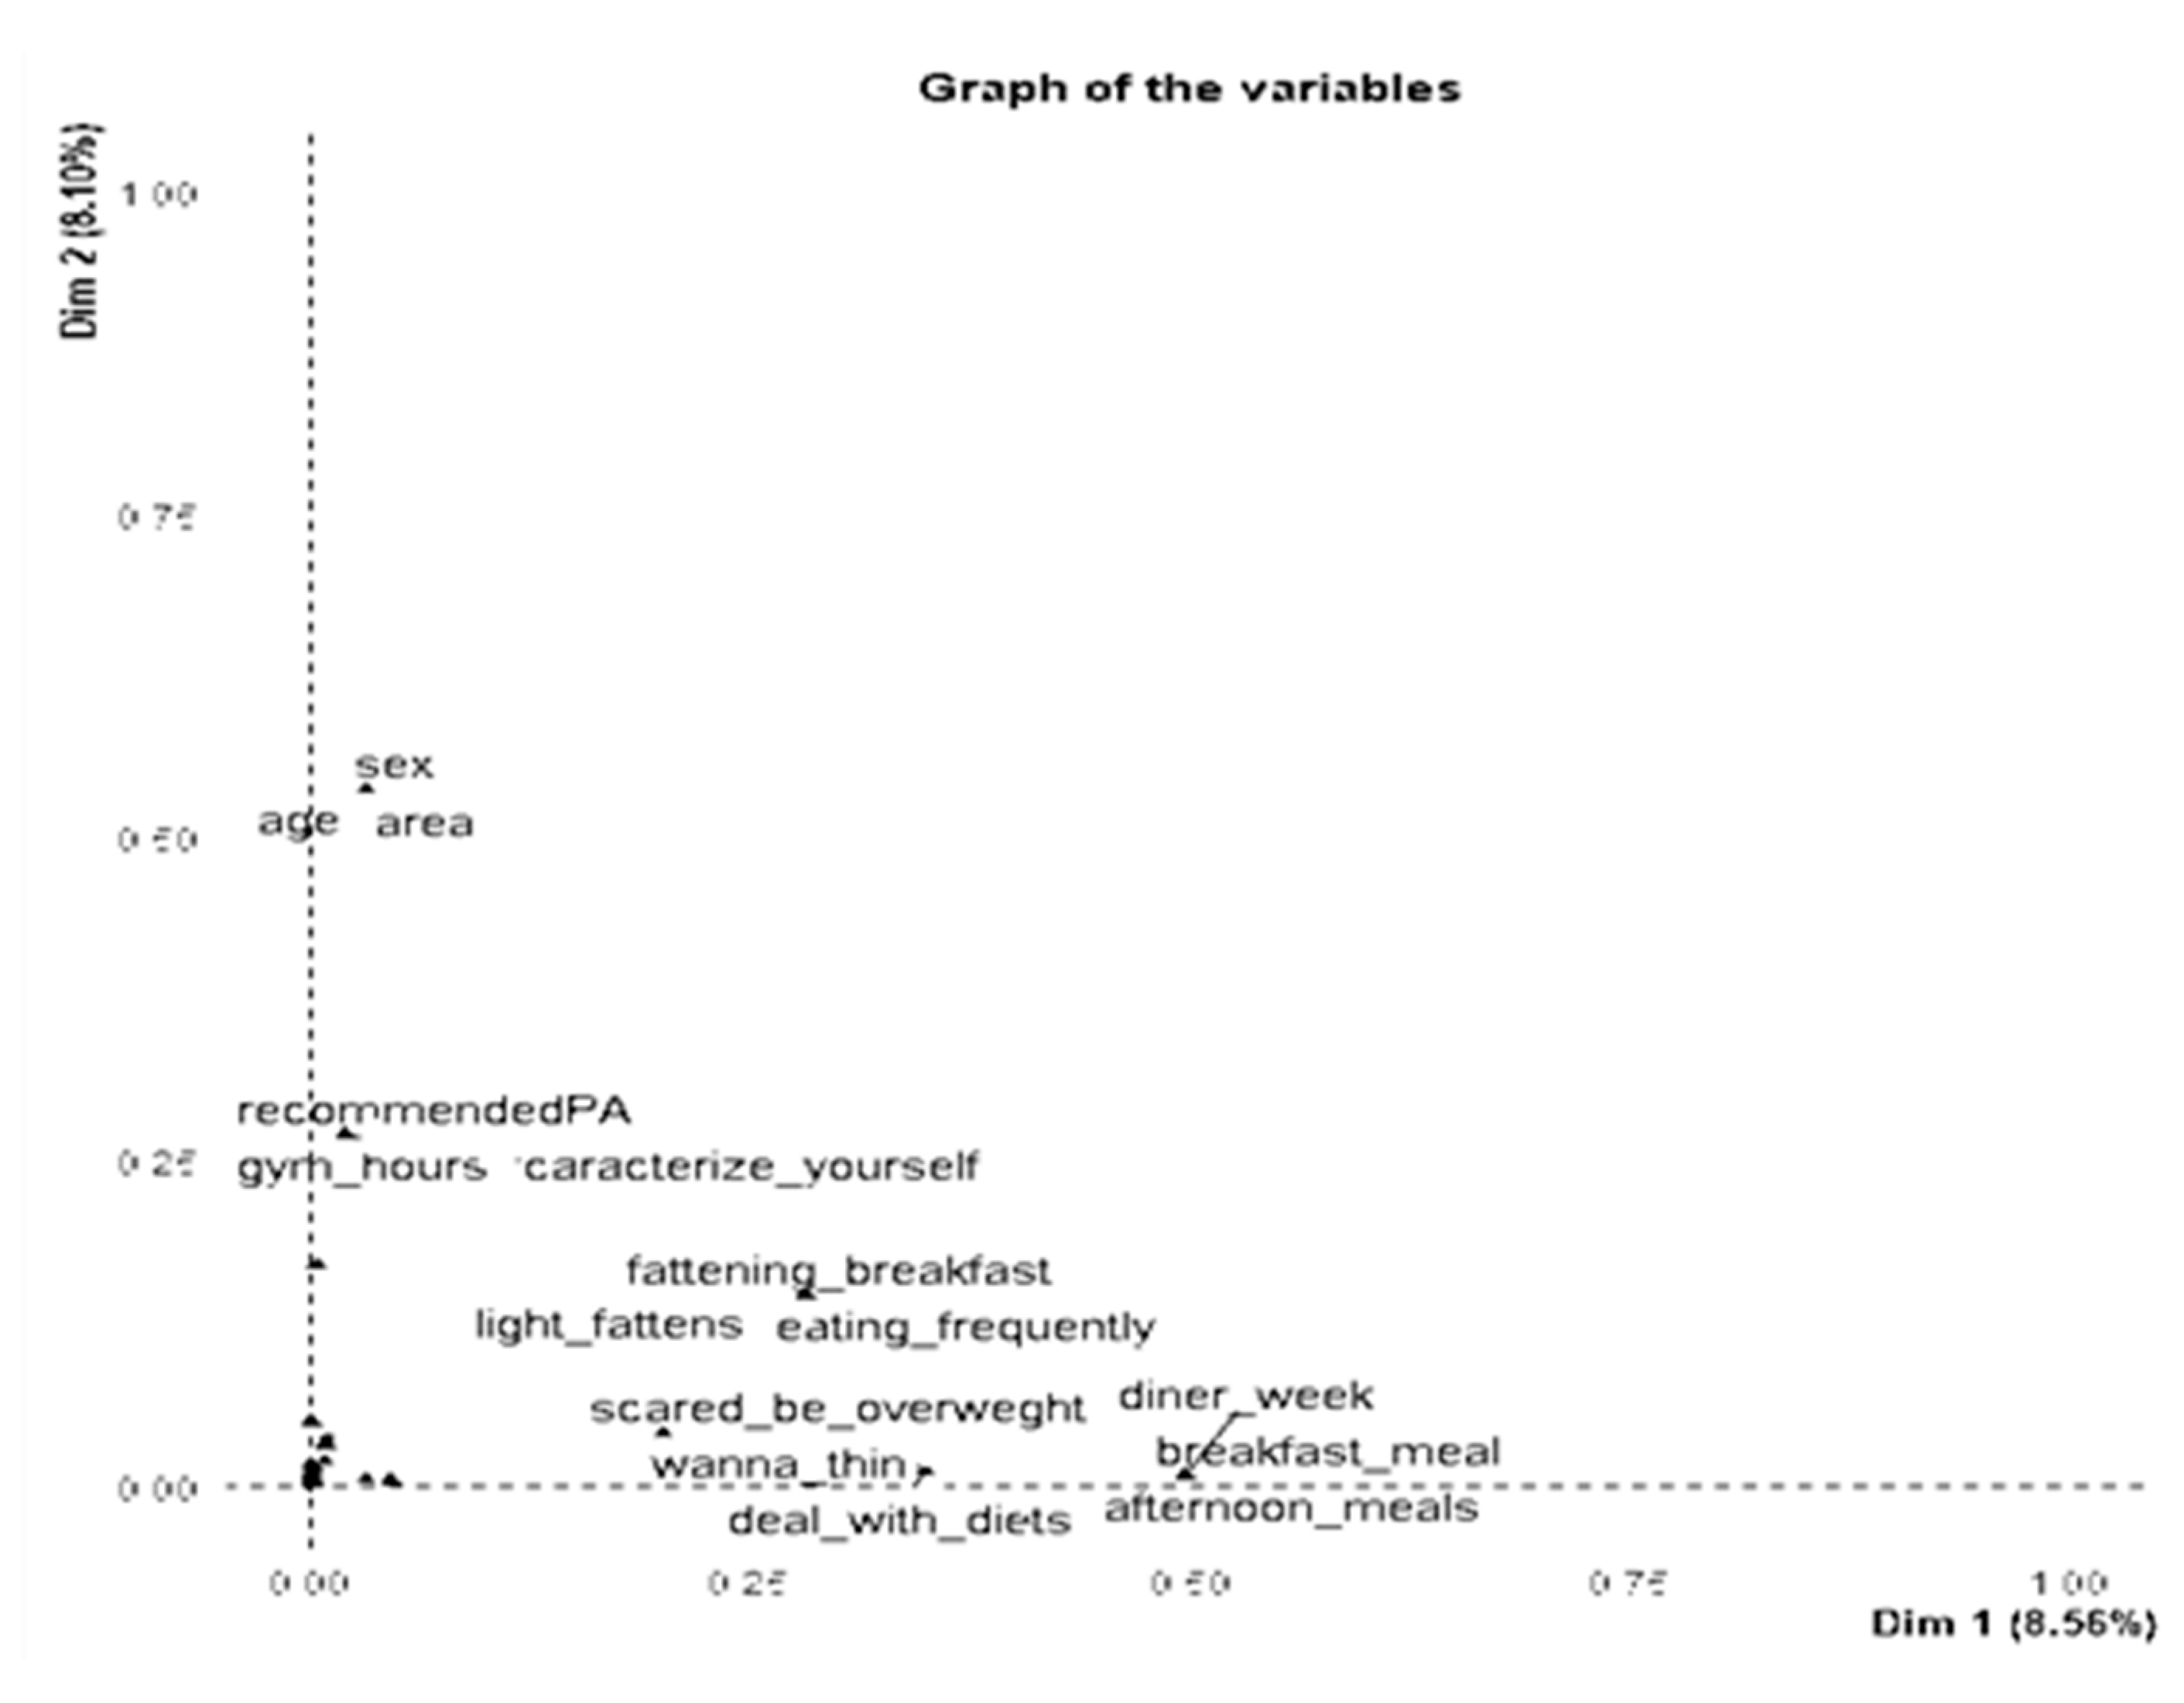
| Compounds | Eigenvalues | % Cumulative Variance | Description | Variable Labels | Variable Names |
|---|---|---|---|---|---|
| comp 1 | 3.85 | 9.167 | Meals frequency and perceptions of fattening | Number of afternoon meals/week | afternoon_meals |
| Frequency of dinner meals per week | diner_week | ||||
| Frequency of breakfast consumption per week | breakfast_meal | ||||
| Eating 5 meals per day is: | five_meals_per_day | ||||
| Eating frequently (without order) fattens | eating_frequently | ||||
| Skipping breakfast fattens | fattening_breakfast | ||||
| Eating light products fattens | light_fattens | ||||
| comp 2 | 3.643 | 17.839 | Sociodemographic factors | Age | age |
| Area | area | ||||
| Sex | sex | ||||
| Comp 3 | 3.155 | 25.45 | Body images and behaviors against obesity and fattening | I want to be thin | wanna_be_thin |
| I deal with diets | deal_with_diets | ||||
| I’m scared to be overweight | scared_be_overweght | ||||
| Comp 4 | 2.969 | 32.55 | Perceptions about physical activity | Self evaluation of physical activity | caracterize_yourself |
| The recommended physical activity is 1 h | recommendedPA | ||||
| The gym hours and breaks at school are enough to be physically active | gym_hours | ||||
| Comp 5 | 2.613 | 38.6 | Foods/snacks eaten at meals and after meals | Bread at brunch | bread_brunch |
| Cheese pie at breakfast | pie _ cheese | ||||
| Fruit after diner | fruit_afterdiner | ||||
| Comp 6 | 2.517 | 44.6 | Drinks consumed for breakfast | Whole milk at breakfast per week | whole_milk |
| Cocoa milk at breakfast per week | cocoa_milk | ||||
| Fresh juice per week | freshjuice | ||||
| Compound 7 | 2.319 | 50.31 | Organized physical activity | Football per week | football |
| Basket per week | basket | ||||
| Track and field per week | track_field | ||||
| Dance per week | danse_week | ||||
| Comp 8 | 1.703 | 54.71 | Purchase criteria/choice of food and socioeconomic status | Buying products according to their price | importance_of_low_cost |
| Buying products according to their calories | count_calories | ||||
| ses | ses | ||||
| comp 9 | 1.583 | 58.51 | Sedentary behaviors and eating | Meals in front of PC per week | pc_food |
| Snack (salty) in front of PC/tv per week | tv_snack | ||||
| Snack (sweet) in front of pc(TV) per week | pc_snack |
| Variables (Codes) | Boys N = 2527 (49.00) | Girls N = 2617 (51.00) | p-Value 1 |
|---|---|---|---|
| N (%) | N (%) | ||
| BMI | |||
| Underweight/Normal Weight (0) | 1574 (62.3) | 1824 (69.7) | <0.001 |
| Overweight (1) | 661 (26.2) | 574 (21.9) | |
| Obese (2) | 209 (8.2) | 130 (5.0) | |
| Missing | 83 (3.3) | 89 (3.4) | |
| Area | |||
| Rural (0) | 610 (24.1) | 633 (24.2) | 0.753 |
| Semi urban (1) | 462 (18.3) | 492 (18.8) | |
| Urban (2) | 1455 (57.6) | 1492 (57.0) | |
| Track and field per week | |||
| Never (0) | 1699 (67.2) | 1809 (69.1) | 0.037 |
| 1 time (1) | 319 (12.6) | 271 (10.4) | |
| At least 2–3 times (2) | 342 (13.6) | 341 (13.0) | |
| Missing | 167 (6.6) | 196 (7.5) | |
| Characterize yourself in relation to physical activity | |||
| No active/Not much either a little (1) | 606 (24.0) | 1067 (40.8) | <0.001 |
| Quite/very active (2) | 1921 (76.0) | 1550 (59.2) | |
| The gym hours and breaks at school are enough for me to be physically active | |||
| Strongly disagree/disagree (0) | 1176 (46.5) | 1300 (49.7) | 0.001 |
| Undecided (1) | 559 (22.1) | 628 (24.0) | |
| Agree/strongly agree (2) | 740 (29.3) | 647 (24.7) | |
| Missing | 52 (2.1) | 42 (0.6) | |
| Eating cheese pie at breakfast | |||
| Νever/rarely (0) | 1439 (56.9) | 1764 (67.4) | <0.001 |
| Sometimes/often (1) | 847 (33.5) | 629 (24.0) | |
| Daily (2) | 68 (2.8) | 29 (1.1) | |
| Missing | 173 (6.8) | 195 (7.5) | |
| I deal with diets | |||
| Always (0) | 64 (2.5) | 111 (4.2) | <0.001 |
| Sometimes/often (1) | 243 (9.6) | 337 (12.9) | |
| Rarely (2) | 608 (24.1) | 798 (30.5) | |
| Never (3) | 1529 (60.5) | 1299 (49.6) | |
| Missing | 83 (3.3) | 72 (2.8) | |
| I am scared to get overweight | |||
| Always (0) | 1065 (42.1) | 1463 (55.9) | <0.001 |
| Sometimes/often (1) | 681 (26.9) | 623 (23.8) | |
| Rarely (2) | 440 (17.4) | 345 (13.2) | |
| Never (3) | 272 (10.9) | 134 (5.1) | |
| Missing | 69 (2.7) | 52 (2.0) | |
| I want to be thin | |||
| Always (0) | 453 (17.9) | 762 (29.1) | <0.001 |
| Sometimes/often (1) | 476 (18.8) | 567 (21.7) | |
| Rarely (2) | 634 (25.1) | 610 (23.3) | |
| Never (3) | 894 (35.4) | 632 (24.1) | |
| Missing | 70 (2.8) | 46 (1.8) | |
| Drinking whole milk at breakfast | |||
| Never/rarely | 732 (29.0) | 876 (33.5) | <0.001 |
| Sometimes/Often | 648 (25.6) | 606 (23.2) | |
| Daily | 933 (36.9) | 912 (34.8) | |
| Missing | 214 (8.5) | 223 (8.5) | |
| Eating bread at brunch | |||
| Never | 635 (25.1) | 643 (24.6) | 0.079 |
| Sometimes | 1071 (42.4) | 1201 (45.9) | |
| Often/always | 629 (24.9) | 607 (23.2) | |
| Missing | 192 (7.6) | 166 (6.3) | |
| Eating fruit after dinner | |||
| Never | 608 (24.0) | 701 (26.8) | 0.023 |
| 1–2 times | 675 (26.7) | 734 (28.0) | |
| 3–4 times | 553 (21.9) | 507 (19.4) | |
| >4 times | 623 (24.7) | 610 (23.3) | |
| Missing | 68 (2.7) | 65 (2.5) | |
| Buying products according to their calories | |||
| Not or little important | 833 (33.0) | 732 (28.0) | <0.001 |
| Enough Important | 726 (28.7) | 610 (23.3) | |
| Very Important | 858 (34.0) | 1198 (45.8) | |
| Missing | 110 (4.4) | 77 (2.9) | |
| Eating five meals per day is | |||
| Very bad/ bad | 338 (13.4) | 221 (8.4) | <0.001 |
| Neither good or bad | 560 (22.2) | 519 (19.8) | |
| Good/very good | 1540 (60.9) | 1813 (69.4) | |
| Missing | 89 (3.5) | 64 (2.4) | |
| Eating light products is fattening | |||
| Strongly disagree/disagree | 1137 (45.0) | 1220 (46.6) | 0.574 |
| Undecided | 781 (30.9) | 805 (30.8) | |
| Agree /Strongly agree | 506 (20.0) | 503 (19.2) | |
| Missing | 103 (4.1) | 89 (3.4) | |
| Skipping breakfast is fattening | |||
| Strongly disagree/disagree | 1501 (59.4) | 1386 (53.0) | <0.001 |
| Undecided | 449 (17.8) | 446 (17.0) | |
| Agree/strongly agree | 485 (19.2) | 722 (27.6) | |
| Missing | 92 (3.6) | 63 (2.4) | |
| Frequency of breakfast consumption per week | 3.82 (1.37) | 3.76 (1.43) | 0.102 |
| Frequency of dinner meals per week | 4.03 (1.13) | 3.80 (1.23) | <0.001 |
| Number of afternoon meals/week | 3.56 (1.26) | 3.57 (1.28) | 0.839 |
| Cocoa milk for breakfast per week | 3.82 (1.26) | 1.71 (1.20) | <0.001 |
| Age | 13.55 (0.94) | 13.54 (0.94) | 0.845 |
| Variables (Codes) | Boys N = 2527 (49.00) | Girls N = 2617 (51.00) | p-Value 1 |
|---|---|---|---|
| Boys | Girls | ||
| The recommended physical activity is 1 h | |||
| Strongly disagree/disagree (0) | 356 (14.1) | 221 (8.4) | <0.001 |
| Undecided (1) | 1256 (49.7) | 1344 (51.4) | |
| Agree/strongly agree (2) | 831 (32.9) | 984 (37.6) | |
| Missing | 84 (3.3) | 68 (2.6) | |
| Buying products according to their price | |||
| Not or little important (0) | 1828 (72.3) | 2154 (82.3) | <0.001 |
| Enough Important (1) | 401 (15.9) | 255 (9.7) | |
| Very Important (2) | 199 (7.9) | 133 (5.1) | |
| Missing | 99 (3.9) | 75 (2.9) | |
| Football per week | |||
| Never (0) | 763 (30.1) | 2027 (77.5) | <0.001 |
| 1 time (1) | 328 (13.0) | 361 (13.8) | |
| At least 2–3 times (2) | 1414 (56.0) | 219 (8.3) | |
| Missing | 22 (0.9) | 10 (0.4) | |
| Basket per week | |||
| Never (0) | 862 (34.1) | 1445 (55.2) | <0.001 |
| 1 time (1) | 600 (23.7) | 429 (16.4) | |
| At least 2–3 times (2) | 754 (29.9) | 291 (11.1) | |
| Missing | 311 (12.3) | 452 (17.3) | |
| Dance per week | |||
| Never (0) | 1824 (72.2) | 936 (35.8) | <0.001 |
| 1 time (1) | 222 (8.8) | 547 (20.9) | |
| At least 2–3 times (2) | 86 (3.4) | 768 (29.3) | |
| Missing | 395 (15.6) | 366 (14.0) | |
| Meals in front of PC per week | 2.32 (1.087) | 2.06 (1.066) | 0.015 |
| Snack (salty) in front of PC per week | 1.990 (1.056) | 1.910 (1.092) | <0.001 |
| Snack (sweet) in front of TV per week | 1.980 (1.079) | 2.480 (1.054) | <0.001 |
| SES | 6.330 (1.841) | 6.870 (0.900) | <0.001 |
| Fresh juice per week | 3.140 (1.315) | 3.040 (1.310) | 0.008 |
Appendix B
| Partial Proportional Odds Model PPOM | Generalized Ordered Logit Model GOLM | |||
|---|---|---|---|---|
| Boys | Girls | Boys | Girls | |
| Log Likelihood (null) | −886.01 | −708.56 | −886.01 | −708.56 |
| Log Likelihood (model) | −599.02 | −540.91 | −585.40 | −536.60 |
| Likelihood Ratio chi2 | 573.96 | 335.38 | 580.60 | 339.44 |
| p-value | <0.001 | <0.001 | <0.001 | <0.001 |
| Akaike’s Information Criterion | 1442.06 | 1237.82 | 1455.30 | 1244.71 |
| Bayesian Information Criterion | 2046.29 | 1619.05 | 2064.45 | 1616.08 |
| Predictors | p > |z| | Odds Ratio (95% CI) | ||
|---|---|---|---|---|
| Overweight/Obese Versus other BMI Categories | ||||
| Characterize yourself in relation to physical activity | Boys | Girls | ||
| Quite/very active | 0.001 | 0.001 | 0.691(0.550–0.868) | 0.714(0.582–0.877) |
| I think eating frequently (without order) is fattening | ||||
| Undecided | 0.845 | NS 1 | 0.938 (0.294–1.166) | NS |
| Strongly agree / agree | 0.031 | NS | 0.508 (0.275–0.940) | NS |
| Eating bread for brunch | ||||
| Sometimes/Rarely | 0.002 | 0.065 | 0.453 (0.274–0.747) | 0.468 (0.209–1.048) |
| Often/always | 0.236 | 0.034 | 0.573 (0.228–1.439) | 0.382 (0.157–0.932) |
| Eating five meals per day is | ||||
| Neither good or bad | 0.493 | 0.232 | 1.198 (0.716–2.000) | 1.376 (0.815–2.323) |
| Good/very good | 0.384 | 0.012 | 1.231(0.771–1.966) | 0.241(0.079–0.735) |
| Area | Boys | Girls | Boys | Girls |
| Semi-urban | 0.972 | 0.293 | 1.009 (0.601–1.697) | 0.767 (0.468–1.257) |
| Urban | 0.327 | 0.387 | 0.816 (0.544–1.225) | 0.837(0.560–1.252) |
| Frequency of breakfast consumption per week | 0.373 | <0.001 | 0.849 (0.359–2.011) | 0.537 (0.408–0.711) |
| Frequency of dinner meals per week | 0.089 | 0.045 | 0.955 (0.845–1.195) | 0.863 (0.748–0.997) |
| Eating cheese pie (breakfast) | ||||
| Sometimes/often | 0.402 | 0.072 | 1.204 (0.780–1.860) | 0.810 (0.644–1.019) |
| Daily | 0.005 | 0.081 | 4.465 (1.567–10.724) | 0.319 (0.088–1.153) |
| I am scared to get overweight | ||||
| Sometimes/often | 0.080 | 0.365 | 1.669 (0.941–2.959) | 1.455 (0.890–2.379) |
| Rarely | 0.010 | <0.001 | 2.504 (1.242 5.048) | 3.829 (2.080–7.047) |
| Never | 0.021 | 0.005 | 2.070 (1.118–3.831) | 2.438(1.305–4.554) |
| I want to be thin | ||||
| Usually/often | 0.005 | 0.001 | 0.445 (0.251–0.788) | 0.641(0.491–0.836) |
| Sometimes/rarely | <0.001 | <0.001 | 0.272 (0.159–0.596) | 0.476 (0.351–0.646) |
| Never | <0.001 | <0.001 | 0.246 (0.149–0.496) | 0.315 (0.136–0.271) |
| Frequency of track and field per week | ||||
| 1 time per week | 0.704 | 0.140 | 0.909(0.555–1.488) | 0.669(0.392–1.141) |
| At least 2–3 times/week | 0.016 | 0.437 | 0.454(0.239–0.864) | 0.777 (0.412–1.468) |
| Cocoa milk for breakfast per week | 0.014 | NS | 0.314 (0.125–0.792) | NS |
| I deal with diets | ||||
| Sometimes/often | 0.581 | 0.878 | 0.718(0.22198–2.325) | 1.071 (0.444–2.582) |
| Rarely | 0.858 | 0.551 | 0.901 (0.288–2.819) | 1.324(0.526–3.331) |
| Never | 0.018 | 0.377 | 0.258(0.084–0.592) | 1.324(0.526–3.331) |
| Number of afternoon meals/week | <0.001 | 0.311 (0.809–1.947) | 0.203 (0.088–0.468) | 1.255(0.809–1.947) |
| Eating light products is fattening | ||||
| Undecided | 0.392 | NS | 1.307 (0.708–2.415) | NS |
| Agree /Strongly agree | <0.001 | NS | 1.902 (1.139–3.175) | NS |
| Skipping breakfast is fattening | ||||
| Undecided | 0.384 | 0.013 | 1.231 (0.771–1.966) | 1.376 (0.815–2.323) |
| Agree/strongly agree | 0.493 | 0.232 | 1.197(0.716–2.000) | 0.241(0.078–0.734) |
| The gym hours and breaks at school are enough for me to be physically active | ||||
| Undecided | ΝS | 0.121 | ΝS | 0.352 (0.699–2.154) |
| Agree/strongly agree | ΝS | 0.004 | ΝS | 2.509(1.338–4.704) |
| Age | <0.001 | NS | 0.668(0.548–0.813) | |
| Drinking whole milk at breakfast | ||||
| Sometimes/often | 0.244 | 0.467 | 0.394 (0.798–2.422) | 0.895 (0.508–1.578) |
| Daily | 0.247 | 0.187 | 0.725 (0.451–1.168) | 0.765 (0.486–1.204) |
| Buying products according to their calories | ||||
| Enough Important | NS | 0.041 | NS | 2.871 (1.042–7.901) |
| Very Important | NS | 0.810 | NS | 0.926 (0.495–1.731) |
| Eating fruit after dinner | ||||
| 1–2 times | 0.560 | 0.712 | 0.919 (0.585–1.441) | 1.151 (0.717–1.849) |
| 3–4 times | 0.803 | 0.997 | 1.001 (0.616–1.626) | 1.071 (0.625–1.836) |
| >4 times | 0.352 | 0.232 | 0.679(0.360–1.281) | 0.727 (0.539–1.848) |
| Predictors | p > |z| | Odds Ratio (95% CI) | ||
|---|---|---|---|---|
| Obese Versus other BMI Categories | ||||
| Characterize yourself in relation to physical activity | ||||
| Quite/very active | 0.001 | 0.004 | 0.691 (0.550–0.868) | 0.714 (0.582–0.877) |
| I think eating frequently (without order) is fattening | ||||
| Undecided | 0.845 | NS | 0.938 (0.294–1.166) | NS |
| Strongly agree/agree | 0.031 | NS | 0.508 (0.275–0.940) | NS |
| Eating bread for brunch | ||||
| Sometimes | 0.002 | 0.065 | 0.453 (0.274–0.747) | 0.468 (0.209–1.048) |
| Often/always | 0.236 | 0.034 | 0.573 (0.228–1.439) | 0.382 (0.157–0.932) |
| Eating five meals per day is | ||||
| Neither good or bad | 0.493 | 0.232 | 1.198 (0.716–2.000) | 1.376 (0.815–2.323) |
| Good/very good | 0.384 | 0.012 | 1.231 (0.771–1.966) | 0.241 (0.079–0.735) |
| Area | Boys | Girls | Boys | Girls |
| Semi-urban | 0.972 | 0.293 | 1.009 (0.601–1.697) | 0.767 (0.468–1.257) |
| Urban | 0.327 | 0.005 | 0.816 (0.544–1.225) | 0.332 (0.154–0.712) |
| Frequency of breakfast consumption per week | 0.373 | <0.001 | 0.849 (0.359–2.011) | 0.537 (0.408–0.711) |
| Frequency of dinner meals per week | 0.089 | 0.045 | 0.955 (0.845–1.195) | 0.863 (0.748–0.997) |
| Eating cheese pie (breakfast) | ||||
| Sometimes/often | 0.402 | 0.072 | 1.204 (0.780–1.860) | 0.810 (0.644–1.019) |
| Daily | 0.005 | 0.081 | 4.465 (1.567–10.724) | 0.319 (0.088–1.153) |
| I am scared to get overweight | ||||
| sometimes/often | 0.080 | 0.365 | 1.669 (0.941–2.959) | 1.455 (0.890–2.379) |
| rarely | 0.010 | <0.001 | 2.504 (1.242–5.048) | 3.829 (2.080–7.047) |
| Never | 0.021 | 0.005 | 2.070 (1.118–3.831) | 2.438 (1.305–4.554) |
| I want to be thin | ||||
| Usually/often | 0.005 | 0.001 | 0.445 (0.251–0.788) | 0.641 (0.491–0.836) |
| Sometimes/rarely | <0.001 | <0.001 | 0.272 (0.149–0.496) | 0.476 (0.351–0.646) |
| Never | <0.001 | <0.001 | 0.246 (0.149–0.496) | 0.315 (0.136–0.271) |
| Frequency of track and field per week | ||||
| 1 time per week | 0.704 | 0.140 | 0.909 (0.555–1.488) | 0.669 (0.392–1.141) |
| At least 2–3 times/week | 0.016 | 0.437 | 0.454 (0.239–0.864) | 0.777 (0.412–1.468) |
| Cocoa milk for breakfast per week | 0.014 | NS | 0.314 (0.125–0.792) | NS |
| I deal with diets | ||||
| Sometimes/often | 0.581 | 0.878 | 0.718 (0.22198–2.325) | 1.071 (0.444–2.582) |
| Rarely | 0.858 | 0.551 | 0.901 (0.288–2.819) | 1.324 (0.526–3.331) |
| Never | 0.018 | 0.377 | 0.258 (0.084–0.792) | 1.324 (0.526–3.331) |
| Number of afternoon meals/week | <0.001 | 0.311 (0.809–1.947) | 0.203 (0.088–0.468) | 1.255 (0.809–1.947) |
| Eating light products is fattening | ||||
| Undecided | 0.392 | NS | 1.307 (0.708–2.415) | NS |
| Agree /Strongly agree | <0.001 | NS | 3.815 (1.927–7.554) | NS |
| The gym hours and breaks at school are enough for me to be physically active | ||||
| Undecided | ΝS | 0.121 | ΝS | 0.352 (0.699–2.154) |
| Agree/strongly agree | ΝS | 0.004 | ΝS | 2.509 (1.338–4.704) |
| Drinking whole milk at breakfast | ||||
| Sometimes/often | 0.244 | 0.467 | 0.394 (0.798–2.422) | 0.895 (0.508–1.578) |
| Daily | 0.247 | 0.031 | 0.725 (0.451–1.168) | 2.483 (1.088–5.668) |
| Age | NS | 0.861 | NS | 0.967 (0.663–1.410) |
| Buying products according to their calories | ||||
| Enough Important | NS | 0.203 | NS | 1.478 (0.810–2.697) |
| Very Important | NS | 0.810 | NS | 0.926 (0.495–1.731) |
| Eating fruit after dinner | ||||
| 1–2 times | 0.560 | 0.712 | 0.919 (0.585–1.441) | 1.151 (0.717–1.849) |
| 3–4 times | 0.047 | 0.997 | 0.440 (0.196–0.988) | 1.071 (0.625–1.836) |
| >4 times | 0.352 | 0.232 | 0.679 (0.360–1.281) | 0.727 (0.539–1.848) |
References
- Golden, N.H.; Schneider, M.; Wood, C.; Daniels, S.; Abrams, S.; Corkins, M.; De Ferranti, S.; Magge, S.N.; Schwarzenberg, S.; Critch, J.; et al. Preventing obesity and eating disorders in adolescents. Pediatrics 2016, 138. [Google Scholar] [CrossRef] [PubMed] [Green Version]
- WHO. World Health Organization Report of the Commission on Ending Childhood Obesity; WHO: Geneva, Switzerland, 2017. [Google Scholar]
- Spinelli, A.; Buoncristiano, M.; Kovacs, V.A.; Yngve, A.; Spiroski, I.; Obreja, G.; Starc, G.; Pérez, N.; Rito, A.I.; Kunešová, M.; et al. Prevalence of severe obesity among primary school children in 21 European countries. Obes. Facts 2019, 12, 244–258. [Google Scholar] [CrossRef]
- Kumar, S.; Kelly, A.S. Review of Childhood Obesity: From Epidemiology, Etiology, and Comorbidities to Clinical Assessment and Treatment. Mayo Clin. Proc. 2017, 92, 251–265. [Google Scholar] [CrossRef] [Green Version]
- Campbell, M.K. Biological, environmental, and social influences on childhood obesity. Pediatr. Res. 2016, 79, 205–211. [Google Scholar] [CrossRef] [Green Version]
- Magge, S.N.; Goodman, E.; Armstrong, S.C. The Metabolic Syndrome in Children and Adolescents: Shifting the Focus to Cardiometabolic Risk Factor Clustering. Pediatrics 2017, 140, e20171603. [Google Scholar] [CrossRef] [Green Version]
- Tirosh, A.; Shai, I.; Afek, A.; Dubnov-Raz, G.; Ayalon, N.; Gordon, B.; Derazne, E.; Tzur, D.; Shamis, A.; Vinker, S.; et al. Adolescent BMI Trajectory and Risk of Diabetes versus Coronary Disease. N. Engl. J. Med. 2011, 364, 1315–1325. [Google Scholar] [CrossRef] [Green Version]
- Govindan, M.; Gurm, R.; Mohan, S.; Kline-Rogers, E.; Corriveau, N.; Goldberg, C.; Du Russel-Weston, J.; Eagle, K.A.; Jackson, E.A. Gender differences in physiologic markers and health behaviors associated with childhood obesity. Pediatrics 2013, 132, 468–474. [Google Scholar] [CrossRef] [PubMed] [Green Version]
- Bartholdy, S.; Allen, K.; Hodsoll, J.; O’Daly, O.G.; Campbell, I.C.; Banaschewski, T.; Bokde, A.L.W.; Bromberg, U.; Büchel, C.; Quinlan, E.B.; et al. Identifying disordered eating behaviours in adolescents: How do parent and adolescent reports differ by sex and age? Eur. Child Adolesc. Psychiatry 2017, 26, 691–701. [Google Scholar] [CrossRef] [Green Version]
- Trompeter, N.; Bussey, K.; Hay, P.; Griffiths, S.; Murray, S.B.; Mond, J.; Lonergan, A.; Pike, K.M.; Mitchison, D. Fear of negative evaluation among eating disorders: Examining the association with weight/shape concerns in adolescence. Int. J. Eat. Disord. 2019, 52, 261–269. [Google Scholar] [CrossRef] [PubMed]
- Barstad, L.H.; Júlíusson, P.B.; Johnson, L.K.; Hertel, J.K.; Lekhal, S.; Hjelmesæth, J. Gender-related differences in cardiometabolic risk factors and lifestyle behaviors in treatment-seeking adolescents with severe obesity. BMC Pediatr. 2018, 18. [Google Scholar] [CrossRef] [Green Version]
- Wang, V.H.; Min, J.; Xue, H.; Du, S.; Xu, F.; Wang, H.; Wang, Y. Factors contributing to sex differences in childhood obesity prevalence in China. Public Health Nutr. 2018, 21, 2056–2064. [Google Scholar] [CrossRef] [Green Version]
- Cole, T.J.; Lobstein, T. Extended international (IOTF) body mass index cut-offs for thinness, overweight and obesity. Pediatr. Obes. 2012, 7, 284–294. [Google Scholar] [CrossRef]
- Carayanni, V.; Vlachopapadopoulou, E.; Psaltopoulou, T.; Koutsouki, D.; Bogdanis, G.; Karachaliou, F.; Manios, Y.; Kapsali, A.; Papadopoulou, A.; Hatzakis, A.; et al. Validity and Reliability of Three New Instruments for Parents and Children Assessing Nutrition and Physical Activity Behaviors, Environment and Knowledge and Health in Childhood and Adolescence in Greece During the Economic Recession: Data from the National Action Plan for Public Health (MIS301205). Value Health 2016, 19, A395. [Google Scholar] [CrossRef]
- Moschonis, G.; Mavrogianni, C.; Karatzi, K.; Iatridi, V.; Chrousos, G.P.; Lionis, C.; Manios, Y. Increased physical activity combined with more eating occasions is beneficial against dyslipidemias in children. The Healthy Growth Study. Eur. J. Nutr. 2013, 52, 1135–1144. [Google Scholar] [CrossRef]
- Escofi, B.; Pagès, J. Cours et Études de cas Analyses Factorielles Simples et Multiples; Dunod: Paris, France, 2008. [Google Scholar]
- Husson, F.; Lê, S.; Pagès, J. Exploratory Multivariate Analysis by Example Using R; CRC Press: Boca Raton, FL, USA, 2010; ISBN 97814398358. [Google Scholar]
- Pagès, J.; Husson, F. Multiple factor analysis: Presentation of the method using sensory data. Mathe-Matical Stat. Methods Food Sci. Technol. 2014, 87, 102. [Google Scholar]
- Child, D. The Essentials of Factor Analysis—Google Books. Available online: https://www.bloomsbury.com/uk/the-essentials-of-factor-analysis-9780826480002/ (accessed on 1 February 2021).
- Costello, A.B.; Osborne, J. Best practices in exploratory factor analysis: Four recommendations for getting the most from your analysis. Res. Eval. Pract. Assess. Res. Eval. 2005, 10, 7. [Google Scholar] [CrossRef]
- Roberts, L.D.; Koulman, A.; Griffin, J.L. Towards metabolic biomarkers of insulin resistance and type 2 diabetes: Progress from the metabolome. Lancet Diabetes Endocrinol. 2014, 2, 65–75. [Google Scholar] [CrossRef]
- Ruiz, L.D.; Zuelch, M.L.; Dimitratos, S.M.; Scherr, R.E. Adolescent Obesity: Diet Quality, Psychosocial Health, and Cardiometabolic Risk Factors. Nutrients 2020, 12, 43. [Google Scholar] [CrossRef] [Green Version]
- Xing, L. Applied Ordinal Logistic Regression; Sage Publications: Thousand Oaks, CA, USA, 2016; ISBN 978-1-4833-1975-9. [Google Scholar]
- Hilbe, J.M. Logistic Regression Models (Chapman & Hall/CRC Texts in Statistical Science); CRC Press: Boca Raton, FL, USA, 2011. [Google Scholar]
- Kassie, G.W.; Workie, D.L. Determinants of under-nutrition among children under five years of age in Ethiopia. BMC Public Health 2020, 20, 1–11. [Google Scholar] [CrossRef]
- Block, J.P.; Condon, S.K.; Kleinman, K.; Mullen, J.; Linakis, S.; Rifas-Shiman, S.; Gillman, M.W. Consumers’ estimation of calorie content at fast food restaurants: Cross sectional observational study. BMJ 2013, 346, 1–10. [Google Scholar] [CrossRef] [PubMed] [Green Version]
- Manippa, V.; Giuliani, F.; Brancucci, A. Healthiness or calories? Side biases in food perception and preference. Appetite 2020, 147, 104552. [Google Scholar] [CrossRef]
- Dallacker, M.; Hertwig, R.; Mata, J. The frequency of family meals and nutritional health in children: A meta-analysis. Obes. Rev. 2018, 19, 638–653. [Google Scholar] [CrossRef]
- Marangoni, F.; Martini, D.; Scaglioni, S.; Sculati, M.; Donini, L.M.; Leonardi, F.; Agostoni, C.; Castelnuovo, G.; Ferrara, N.; Ghiselli, A.; et al. Snacking in nutrition and health. Int. J. Food Sci. Nutr. 2019, 70, 909–923. [Google Scholar] [CrossRef]
- Ramires, V.V.; Dumith, S.C.; Gonçalves, H. Longitudinal association between physical activity and body fat during adolescence: A systematic review. J. Phys. Act. Health 2015, 12, 1344–1358. [Google Scholar] [CrossRef]
- Loth, K.A.; Tate, A.D.; Trofholz, A.; Fisher, J.O.; Miller, L.; Neumark-Sztainer, D.; Berge, J.M. Ecological momentary assessment of the snacking environments of children from racially/ethnically diverse households. Appetite 2020, 145, 104497. [Google Scholar] [CrossRef]
- Styne, D.M.; Arslanian, S.A.; Connor, E.L.; Farooqi, I.S.; Murad, M.H.; Silverstein, J.H.; Yanovski, J.A. Pediatric obesity-assessment, treatment, and prevention: An endocrine society clinical practice guideline. J. Clin. Endocrinol. Metab. 2017, 102, 709–757. [Google Scholar] [CrossRef]
- De Cássia Ribeiro-Silva, R.; Fiaccone, R.L.; da Conceição-Machado, M.E.P.; Ruiz, A.S.; Barreto, M.L.; Santana, M.L.P. Body image dissatisfaction and dietary patterns according to nutritional status in adolescents. J. Pediatr. 2018, 94, 155–161. [Google Scholar] [CrossRef]
- Kohlmann, C.W.; Eschenbeck, H.; Heim-Dreger, U.; Hock, M.; Platt, T.; Ruch, W. Fear of being laughed at in children and adolescents: Exploring the importance of overweight, underweight, and teasing. Front. Psychol. 2018, 9, 1–15. [Google Scholar] [CrossRef]
- Murphy, M.M.; Douglass, J.S.; Johnson, R.K.; Spence, L.A. Drinking flavored or plain milk is positively associated with nutrient intake and is not associated with adverse effects on weight status in US children and adolescents. J. Am. Diet Assoc. 2008, 108, 631–639. [Google Scholar] [CrossRef]
- Bengoechea, E.G.; Sabiston, C.M.; Ahmed, R.; Farnoush, M. Exploring links to unorganized and organized physical activity during adolescence: The role of gender, socioeconomic status, weight status, and enjoyment of physical education. Res. Q. Exerc. Sport 2010, 81, 7–16. [Google Scholar] [CrossRef] [PubMed]
- Carayanni, V.; Vlachopadopoulou, E.; Koutsouki, D.; Bogdanis, G.C.; Psaltopoulou Manios, Y.T.; Karachaliou, F.; Hatzakis, A.; Michalacos, S. Effects of Body Mass Index (BMI), demographic and socioeconomic factors on organized physical activity (OPA) participation in children aged 6-15 years: A cross-sectional study comparing primary and secondary school children in Greece. BMC Pediatrics 2020, 20, 1–11. [Google Scholar] [CrossRef]
- Sweeting, H.N. Gendered dimensions of obesity in childhood and adolescence. Nutr. J. 2008, 7, 1–14. [Google Scholar] [CrossRef] [Green Version]
Publisher’s Note: MDPI stays neutral with regard to jurisdictional claims in published maps and institutional affiliations. |
© 2021 by the authors. Licensee MDPI, Basel, Switzerland. This article is an open access article distributed under the terms and conditions of the Creative Commons Attribution (CC BY) license (https://creativecommons.org/licenses/by/4.0/).
Share and Cite
Carayanni, V.; Vlachopapadopoulou, E.; Koutsouki, D.; Bogdanis, G.C.; Psaltopoulou, T.; Manios, Y.; Karachaliou, F.; Hatzakis, A.; Michalacos, S. Effects of Nutrition, and Physical Activity Habits and Perceptions on Body Mass Index (BMI) in Children Aged 12–15 Years: A Cross-Sectional Study Comparing Boys and Girls. Children 2021, 8, 277. https://doi.org/10.3390/children8040277
Carayanni V, Vlachopapadopoulou E, Koutsouki D, Bogdanis GC, Psaltopoulou T, Manios Y, Karachaliou F, Hatzakis A, Michalacos S. Effects of Nutrition, and Physical Activity Habits and Perceptions on Body Mass Index (BMI) in Children Aged 12–15 Years: A Cross-Sectional Study Comparing Boys and Girls. Children. 2021; 8(4):277. https://doi.org/10.3390/children8040277
Chicago/Turabian StyleCarayanni, Vilelmine, Elpis Vlachopapadopoulou, Dimitra Koutsouki, Gregory C. Bogdanis, Theodora Psaltopoulou, Yannis Manios, Feneli Karachaliou, Angelos Hatzakis, and Stefanos Michalacos. 2021. "Effects of Nutrition, and Physical Activity Habits and Perceptions on Body Mass Index (BMI) in Children Aged 12–15 Years: A Cross-Sectional Study Comparing Boys and Girls" Children 8, no. 4: 277. https://doi.org/10.3390/children8040277