
Relationship between Birth Order and Postnatal Growth until 4 Years of Age: The Japan Environment and Children’s Study
 , , , , , , and
Abstract
:
1. Introduction
2. Materials and Methods
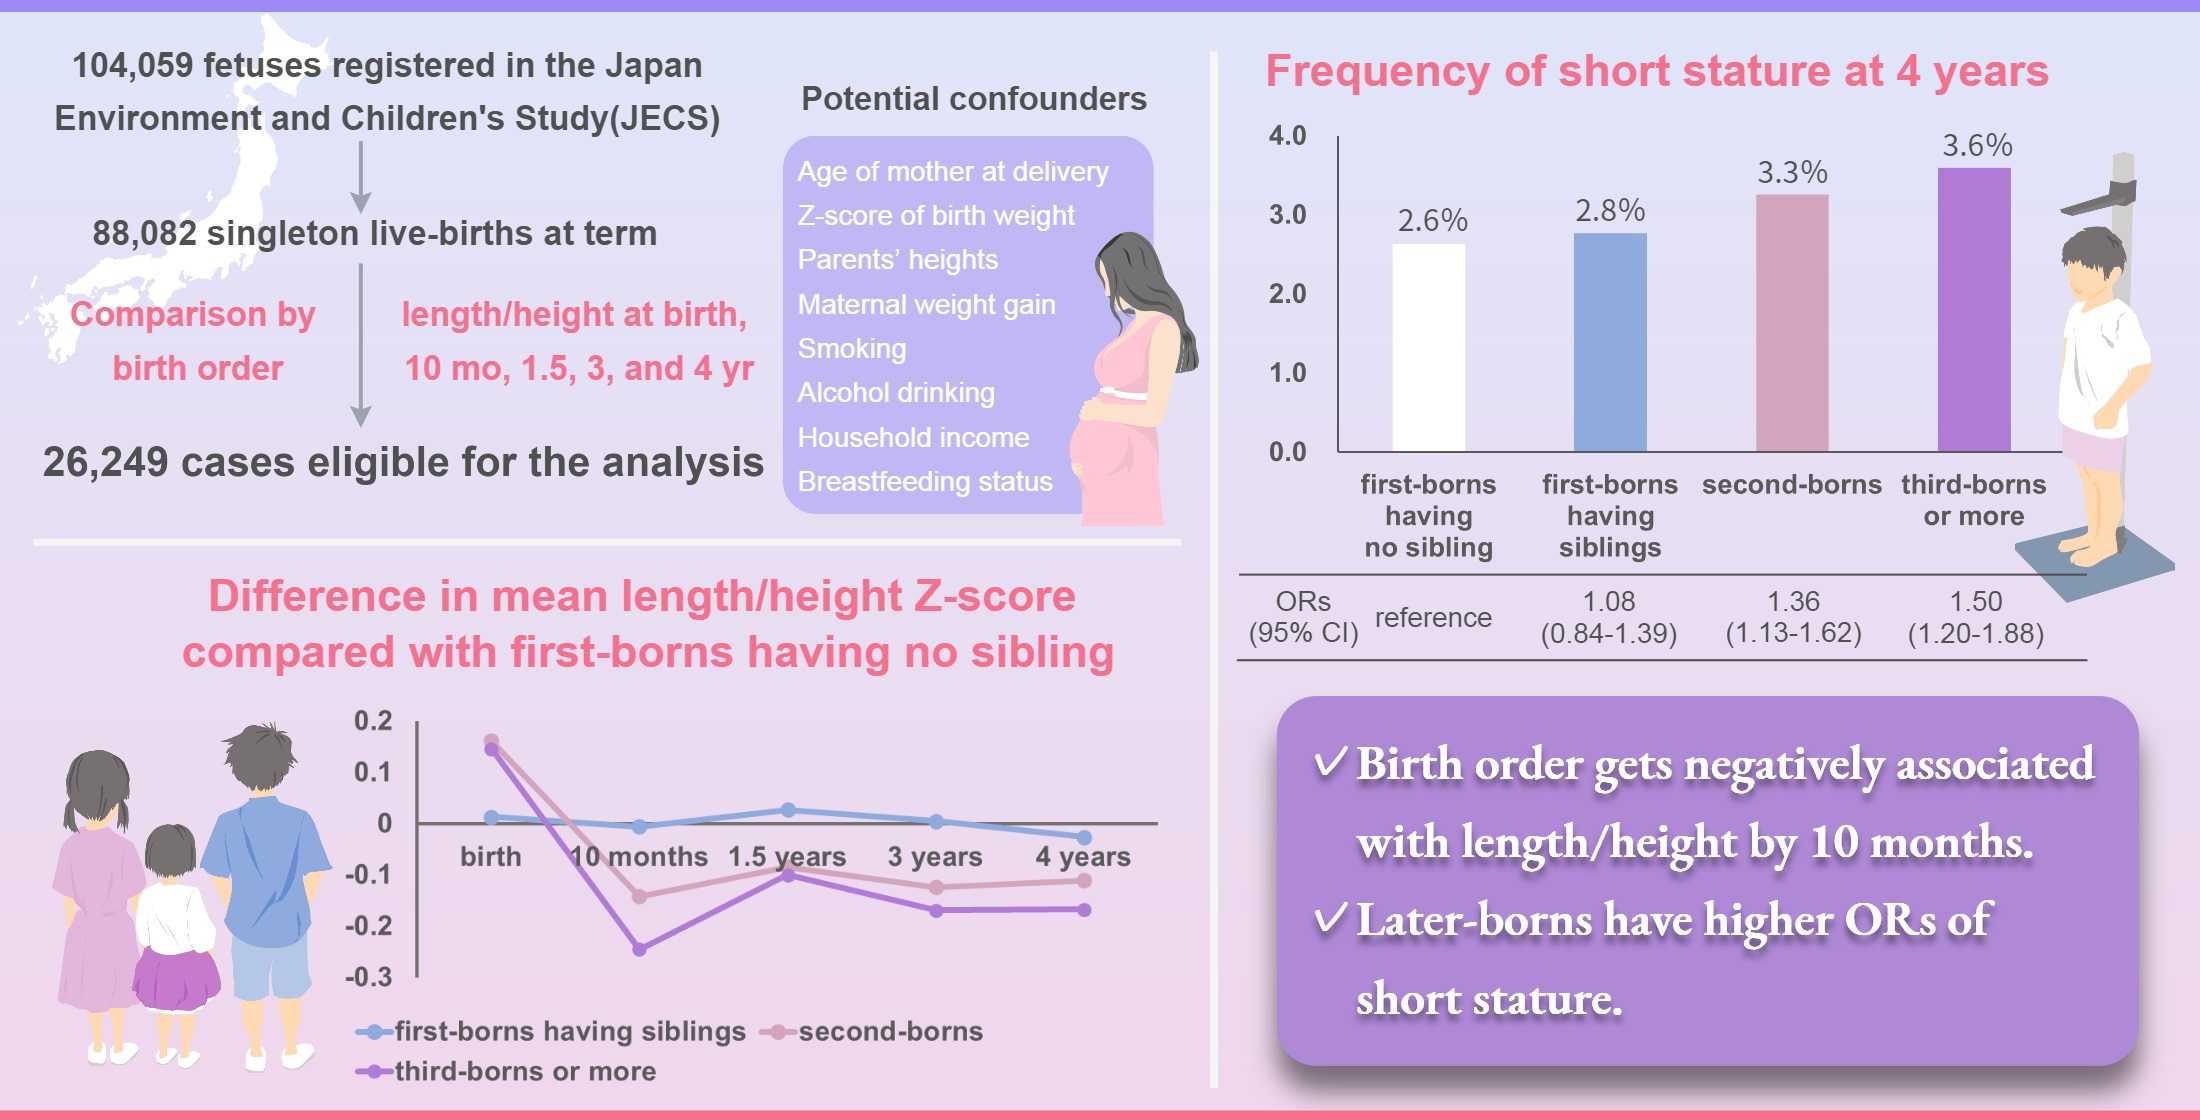
2.1. Study Participants
2.2. Birth Order
2.3. Z-Score of Length/Height and Short Stature
2.4. Covariates
2.5. Statistical Analysis
3. Results
3.1. Participant Characteristics
3.2. Adjusted Mean Z-Score of Length/Height from Birth to 4 Years According to Birth Order
3.3. Association between Birth Order and Short Stature at 4 Years of Age
3.4. Stratified Analyses by SGA, AGA, and LGA
4. Discussion
5. Conclusions
Author Contributions
Funding
Institutional Review Board Statement
Informed Consent Statement
Data Availability Statement
Acknowledgments
Conflicts of Interest
Appendix A
References
- Bents, D.; Groth, D.; Satake, T. The secular trend and network effects on height of male Japanese students from 1955 to 2015. Anthr. Anz. 2018, 74, 423–429. [Google Scholar] [CrossRef] [PubMed]
- Morisaki, N.; Urayama, K.Y.; Yoshii, K.; Subramanian, S.V.; Yokoya, S. Ecological analysis of secular trends in low birth weight births and adult height in Japan. J. Epidemiol. Community Health 2017, 71, 1014–1018. [Google Scholar] [CrossRef] [PubMed]
- Stabler, B.; Clopper, R.R.; Siegel, P.T.; Stoppani, C.; Compton, P.G.; Underwood, L.E. Academic achievement and psychological adjustment in short children. The national cooperative growth study. J. Dev. Behav. Pediatr. 1994, 15, 1–6. [Google Scholar] [CrossRef] [PubMed]
- Voss, L.D. Short normal stature and psychosocial disadvantage: A critical review of the evidence. J. Pediatr. Endocrinol. Metab. 2001, 14, 701–711. [Google Scholar] [CrossRef]
- Nüesch, E.; Dale, C.; Palmer, T.M.; White, J.; Keating, B.J.; van Iperen, E.P.; Goel, A.; Padmanabhan, S.; Asselbergs, F.W.; Verschuren, W.; et al. Adult height, coronary heart disease and stroke: A multi-locus Mendelian randomization meta-analysis. Int. J. Epidemiol. 2016, 45, 1927–1937. [Google Scholar] [CrossRef] [PubMed]
- Emerging Risk Factors Collaboration. Adult height and the risk of cause-specific death and vascular morbidity in 1 million people: Individual participant meta-analysis. Int. J. Epidemiol. 2012, 41, 1419–1433. [Google Scholar] [CrossRef] [PubMed]
- Wannamethee, S.G.; Shaper, A.G.; Whincup, P.H.; Walker, M. Adult height, stroke, and coronary heart disease. Am. J. Epidemiol. 1998, 148, 1069–1076. [Google Scholar] [CrossRef] [PubMed]
- Ogawa, K.; Morisaki, N.; Saito, S.; Sato, S.; Fujiwara, T.; Sago, H. Association of shorter height with increased risk of ischaemic placental disease. Paediatr. Perinat. Epidemiol. 2017, 31, 198–205. [Google Scholar] [CrossRef]
- Kozuki, N.; Katz, J.; Lee, A.C.; Vogel, J.P.; Silveira, M.F.; Sania, A.; Stevens, G.A.; Cousens, S.; Caulfield, L.E.; Christian, P.; et al. Short maternal stature increases risk of small-for-gestational-age and preterm births in low- and middle-income countries: Individual participant data meta-analysis and population attributable fraction. J. Nutr. 2015, 145, 2542–2550. [Google Scholar] [CrossRef]
- Han, Z.; Lutsiv, O.; Mulla, S.; McDonald, S.D. Maternal Height and the Risk of Preterm Birth and Low Birth Weight: A Systematic Review and Meta-Analyses. J. Obstet. Gynaecol. Can. 2012, 34, 721–746. [Google Scholar] [CrossRef]
- Krishna, A.; Oh, J.; Perkins, J.M.; Lee, H.Y.; Heo, J.; Lee, J.K.; Subramanian, S.V. Is there a female disadvantage in child undernutrition in South India?: Exploring gender differences in height in infancy, childhood, and adolescence in Andhra Pradesh and Telangana. Am. J. Hum. Biol. 2019, 31, e23153. [Google Scholar] [CrossRef] [PubMed]
- Jayachandran, S.; Pandi, R. Why are Indian children so short? The role of birth order and son preference. Am. Econ. Rev. 2017, 107, 2600–2629. [Google Scholar] [CrossRef] [PubMed]
- Liu, Y.X.; Jalil, F.; Karlberg, J. Risk factors for impaired length growth in early life viewed in terms of the infancy-childhood-puberty (ICP) growth model. Acta Paediatr. 1998, 87, 237–243. [Google Scholar] [CrossRef] [PubMed]
- Tse, W.Y.; Hindmarsh, P.C.; Brook, C.G. The infancy-childhood-puberty model of growth: Clinical aspects. Acta Paediatr. Scand 1989, 356, 38–43, discussion 44–35. [Google Scholar] [CrossRef] [PubMed]
- Karlberg, J. On the construction of the infancy-childhood-puberty growth standard. Acta Paediatr. Scand 1989, 356, 26–37. [Google Scholar] [CrossRef]
- Dhingra, S.; Pingali, P.L. Effects of short birth spacing on birth-order differences in child stunting: Evidence from India. Proc. Natl. Acad. Sci. USA 2021, 118, e2017834118. [Google Scholar] [CrossRef]
- Savage, T.; Derraik, J.G.; Miles, H.L.; Mouat, F.; Cutfield, W.S.; Hofman, P.L. Birth order progressively affects childhood height. Clin. Endocrinol. 2013, 79, 379–385. [Google Scholar] [CrossRef]
- Stradford, L.; van Poppel, F.; Lumey, L.H. Can resource dilution explain differences in height by birth order and family size? A study of 389,287 male recruits in twentieth-century Netherlands. Hist. Fam. 2017, 22, 214–235. [Google Scholar] [CrossRef]
- Myrskylä, M.; Silventoinen, K.; Jelenkovic, A.; Tynelius, P.; Rasmussen, F. The association between height and birth order: Evidence from 652,518 Swedish men. J. Epidemiol. Community Health 2013, 67, 571–577. [Google Scholar] [CrossRef]
- Ghosh, J.R.; Bandyopadhyay, A.R. Income, birth order, siblings, and anthropometry. Hum. Biol. 2006, 78, 733–741. [Google Scholar] [CrossRef]
- Wells, J.C.; Hallal, P.C.; Reichert, F.F.; Dumith, S.C.; Menezes, A.M.; Victora, C.G. Associations of birth order with early growth and adolescent height, body composition, and blood pressure: Prospective birth cohort from Brazil. Am. J. Epidemiol. 2011, 174, 1028–1035. [Google Scholar] [CrossRef] [PubMed]
- Ong, K.K.; Preece, M.A.; Emmett, P.M.; Ahmed, M.L.; Dunger, D.B.; ALSPAC Study Team. Size at birth and early childhood growth in relation to maternal smoking, parity and infant breast-feeding: Longitudinal birth cohort study and analysis. Pediatr. Res. 2002, 52, 863–867. [Google Scholar] [CrossRef] [PubMed]
- Cole, T.J.; Wright, C.M. A chart to predict adult height from a child’s current height. Ann. Hum. Biol. 2011, 38, 662–668. [Google Scholar] [CrossRef] [PubMed]
- Lawson, D.W.; Mace, R. Sibling configuration and childhood growth in contemporary British families. Int. J. Epidemiol. 2008, 37, 1408–1421. [Google Scholar] [CrossRef]
- Kawamoto, T.; Nitta, H.; Murata, K.; Toda, E.; Tsukamoto, N.; Hasegawa, M.; Yamagata, Z.; Kayama, F.; Kishi, R.; Ohya, Y.; et al. Rationale and study design of the Japan environment and children’s study (JECS). BMC Public Health 2014, 14, 25. [Google Scholar] [CrossRef]
- Michikawa, T.; Nitta, H.; Nakayama, S.F.; Yamazaki, S.; Isobe, T.; Tamura, K.; Suda, E.; Ono, M.; Yonemoto, J.; Iwai-Shimada, M.; et al. Baseline profile of participants in the Japan Environment and Children’s Study (JECS). J. Epidemiol. 2018, 28, 99–104. [Google Scholar] [CrossRef]
- Ijzerman, R.G.; Stehouwer, C.D.; van Weissenbruch, M.M.; de Geus, E.J.; Boomsma, D.I. Intra-uterine and genetic influences on the relationship between size at birth and height in later life: Analysis in twins. Twin Res. 2001, 4, 337–343. [Google Scholar] [CrossRef]
- Ferguson, E.C.; Wright, N.P.; Gibson, A.T.; Carney, S.; Wright, A.; Wales, J.K. Adult height of preterm infants: A longitudinal cohort study. Arch. Dis. Child. 2017, 102, 503–508. [Google Scholar] [CrossRef]
- Isojima, T.; Kato, N.; Ito, Y.; Kanzaki, S.; Murata, M. Growth standard charts for Japanese children with mean and standard deviation (SD) values based on the year 2000 national survey. Clin. Pediatr. Endocrinol. 2016, 25, 71–76. [Google Scholar] [CrossRef]
- Itabashi, K.; Miura, F.; Uehara, R.; Nakamura, Y. New Japanese neonatal anthropometric charts for gestational age at birth. Pediatr. Int. 2014, 56, 702–708. [Google Scholar] [CrossRef]
- Yokoyama, T. Manual for Evaluation of Infant and Child Physical Development (In Japanese). 2012, Japan. Available online: https://www.niph.go.jp/soshiki/07shougai/hatsuiku/index.files/katsuyou_2021_3R.pdf (accessed on 26 May 2022).
- Iwai-Shimada, M.; Nakayama, S.F.; Isobe, T.; Michikawa, T.; Yamazaki, S.; Nitta, H.; Takeuchi, A.; Kobayashi, Y.; Tamura, K.; Suda, E.; et al. Questionnaire results on exposure characteristics of pregnant women participating in the Japan Environment and Children Study (JECS). Environ. Health Prev. Med. 2018, 23, 45. [Google Scholar] [CrossRef] [PubMed]
- Savage, T.; Derraik, J.G.; Miles, H.L.; Mouat, F.; Hofman, P.L.; Cutfield, W.S. Increasing maternal age is associated with taller stature and reduced abdominal fat in their children. PLoS ONE 2013, 8, e58869. [Google Scholar] [CrossRef] [PubMed]
- Luo, Z.C.; Albertsson-Wikland, K.; Karlberg, J. Target height as predicted by parental heights in a population-based study. Pediatr. Res. 1998, 44, 563–571. [Google Scholar] [CrossRef]
- Chiavaroli, V.; Hopkins, S.A.; Biggs, J.B.; Rodrigues, R.O.; Seneviratne, S.N.; Baldi, J.C.; McCowan, L.M.E.; Cutfield, W.S.; Hofman, P.L.; Derraik, J.G.B. The associations between maternal BMI and gestational weight gain and health outcomes in offspring at age 1 and 7 years. Sci. Rep. 2021, 11, 20865. [Google Scholar] [CrossRef]
- Karvonen, M.; Saari, A.; Sund, R.; Sankilampi, U. Maternal smoking during pregnancy and offspring head growth in comparison to height and weight growth UP to 6 years of age: A longitudinal study. Clin. Epidemiol. 2021, 13, 959–970. [Google Scholar] [CrossRef] [PubMed]
- O’Keeffe, L.M.; Kearney, P.M.; Greene, R.A.; Zuccolo, L.; Tilling, K.; Lawlor, D.A.; Howe, L.D. Maternal alcohol use during pregnancy and offspring trajectories of height and weight: A prospective cohort study. Drug Alcohol Depend. 2015, 153, 323–329. [Google Scholar] [CrossRef] [PubMed]
- Van Rossem, R.; Pannecoucke, I. Poverty and a child’s height development during early childhood: A double disadvantage? A study of the 2006–2009 birth cohorts in Flanders. PLoS ONE 2019, 14, e0209170. [Google Scholar] [CrossRef]
- Patro-Gołąb, B.; Zalewski, B.M.; Polaczek, A.; Szajewska, H. Duration of breastfeeding and early growth: A systematic review of current evidence. Breastfeed. Med. 2019, 14, 218–229. [Google Scholar] [CrossRef]
- Kwok, M.K.; Leung, G.M.; Schooling, C.M. Associations of birth order with early adolescent growth, pubertal onset, blood pressure and size: Evidence from Hong Kong’s “children of 1997” birth cohort. PLoS ONE 2016, 11, e0153787. [Google Scholar] [CrossRef]
- Morisaki, N.; Yoshii, K.; Yamaguchi, T.O.; Tamamitsu, A.M.; Kato, N.; Yokoya, S. Preschool-children’s height, trend, and causes: Japanese national surveys 1990–2010. Clin. Pediatr. Endocrinol. 2022, 31, 10–17. [Google Scholar] [CrossRef]
- Munabi, I.G.; Byamugisha, J.; Luboobi, L.; Luboga, S.A.; Mirembe, F. Relationship between maternal pelvis height and other anthropometric measurements in a multisite cohort of Ugandan mothers. Pan Afr. Med. J. 2016, 24, 257. [Google Scholar] [CrossRef]
- Flatley, C.; Sole-Navais, P.; Vaudel, M.; Helgeland, O.; Modzelewska, D.; Johansson, S.; Jacobsson, B.; Njolstad, P. Placental weight centiles adjusted for age, parity and fetal sex. Placenta 2022, 117, 87–94. [Google Scholar] [CrossRef] [PubMed]
- Balihallimath, R.L.; Shirol, V.S.; Gan, A.M.; Tyagi, N.K.; Bandankar, M.R. Placental morphometry determines the birth weight. J. Clin. Diagn. Res. 2013, 7, 2428–2431. [Google Scholar] [CrossRef] [PubMed]
- Kresovich, J.K.; Harmon, Q.E.; Xu, Z.; Nichols, H.B.; Sandler, D.P.; Taylor, J.A. Reproduction, DNA methylation and biological age. Hum. Reprod. 2019, 34, 1965–1973. [Google Scholar] [CrossRef] [PubMed]
- Chatterjee, S.; Ouidir, M.; Tekola-Ayele, F. Genetic and in utero environmental contributions to DNA methylation variation in placenta. Hum. Mol. Genet. 2021, 30, 1968–1976. [Google Scholar] [CrossRef] [PubMed]
- Ibanez, L.; Ong, K.; Dunger, D.B.; de Zegher, F. Early development of adiposity and insulin resistance after catch-up weight gain in small-for-gestational-age children. J. Clin. Endocrinol. Metab. 2006, 91, 2153–2158. [Google Scholar] [CrossRef]
- Hyatt, M.A.; Budge, H.; Walker, D.; Stephenson, T.; Symonds, M.E. Effects of maternal parity and late gestational nutrition on mRNA abundance for growth factors in the liver of postnatal sheep. Am. J. Physiol. Regul. Integr. Comp. Physiol. 2007, 292, R1934–R1942. [Google Scholar] [CrossRef]
- Nnaji, H.C.; Asimadu, E.E.; Aniebue, U.U. The effect of short interpregnancy interval on birthweight and other pregnancy outcomes in Enugu, Southeast Nigeria. J. Obstet. Gynaecol. 2022, 42, 244–247. [Google Scholar] [CrossRef]


| First-Borns, Sibling (−) | First-Borns, Sibling (+) | Second-Borns | Third-Borns or More | |
|---|---|---|---|---|
| (n = 9657) | (n = 3463) | (n = 9240) | (n = 3889) | |
| Sex of child, n (%) | ||||
| Male | 4804 (49.7) | 1800 (52.0) | 4757 (51.5) | 1959 (50.4) |
| Female | 4853 (50.3) | 1663 (48.0) | 4483 (48.5) | 1930 (49.6) |
| Z-score of birth weight | 0.08 ± 0.98 | 0.09 ± 0.99 | 0.03 ± 0.91 | 0.10 ± 0.96 |
| Age of mother at delivery (years) | 31.68 ± 4.88 | 29.43 ± 4.21 | 32.66 ± 4.30 | 33.78 ± 3.94 |
| Maternal weight gain during pregnancy (kg) | 10.39 ± 3.78 | 10.69 ± 3.69 | 9.86 ± 3.58 | 9.92 ± 3.55 |
| Smoking status during pregnancy, n (%) | ||||
| Never smoked | 6347 (65.7) | 2311 (66.7) | 5853 (63.3) | 2364 (60.8) |
| Quit smoking before recognizing pregnancy | 1904 (19.7) | 624 (18.0) | 2490 (26.9) | 1078 (27.7) |
| Quit smoking after finding out pregnancy | 1231 (12.7) | 452 (13.1) | 714 (7.7) | 313 (8.0) |
| Currently smoking | 175 (1.8) | 76 (2.2) | 183 (2.0) | 134 (3.4) |
| Drinking status during pregnancy, n (%) | ||||
| Never drinker | 3042 (31.5) | 1063 (30.7) | 3355 (36.3) | 1409 (36.2) |
| Former drinker | 6485 (67.2) | 2354 (68.0) | 5624 (60.9) | 2276 (58.5) |
| Current drinker | 130 (1.3) | 46 (1.3) | 261 (2.8) | 204 (5.2) |
| Household income, n (%) | ||||
| <2 million JPY | 285 (3.0) | 121 (3.5) | 255 (2.8) | 147 (3.8) |
| 2–5 million JPY | 6187 (64.1) | 2241 (64.7) | 6159 (66.7) | 2603 (66.9) |
| 6–10 million JPY | 2725 (28.2) | 928 (26.8) | 2433 (26.3) | 961 (24.7) |
| ≥10 | 460 (4.8) | 173 (5.0) | 393 (4.3) | 178 (4.6) |
| Breastfeeding status at 2 yr, n (%) | ||||
| Currently breastfeeding | 1797 (18.6) | 88 (2.5) | 1842 (19.9) | 947 (24.4) |
| Stopped breastfeeding before | 6934 (71.8) | 3086 (89.1) | 6705 (72.6) | 2595 (66.7) |
| Never breastfed | 926 (9.6) | 289 (8.3) | 693 (7.5) | 347 (8.9) |
| Height of mother (cm) | 158.33 ± 5.32 | 158.41 ± 5.24 | 158.35 ± 5.27 | 158.16 ± 5.22 |
| Height of father (cm) | 171.90 ± 5.77 | 171.97 ± 5.81 | 172.10 ± 5.77 | 171.74 ± 5.67 |
| Age | Group IA: First-Borns, Sibling (−) | Group IB: First-Borns, Sibling (+) | Group II: Second-Borns | Group III: Third-Borns or More | p for Linear Trend † | p for Post Hoc Test Using Bonferroni | |||||
|---|---|---|---|---|---|---|---|---|---|---|---|
| IA vs. IB | IA vs. II | IA vs. III | IB vs. II | IB vs. III | II vs. III | ||||||
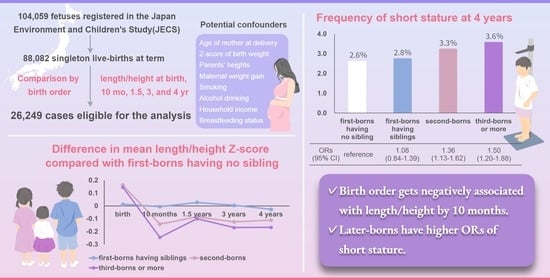
| Birth | −0.026 (−0.041; −0.011) | −0.013 (−0.039; 0.013) | 0.136 (0.120; 0.151) | 0.120 (0.097; 0.144) | <0.01 | 0.99 | <0.01 | <0.01 | <0.01 | <0.01 | 0.99 |
| 10 months | −0.324 (−0.343; −0.304) | −0.330 (−0.364; −0.297) | −0.466 (−0.486; −0.446) | −0.569 (−0.600; −0.538) | <0.01 | 0.99 | <0.01 | <0.01 | <0.01 | <0.01 | <0.01 |
| 1.5 years | −0.558 (−0.580; −0.537) | −0.531 (−0.568; −0.494) | −0.642 (−0.664; −0.620) | −0.658 (−0.692; −0.623) | <0.01 | 0.99 | <0.01 | <0.01 | <0.01 | <0.01 | 0.99 |
| 3 years | −0.171 (−0.188; −0.154) | −0.166 (−0.195; −0.137) | −0.295 (−0.312; −0.277) | −0.340 (−0.367; −0.312) | <0.01 | 0.99 | <0.01 | <0.01 | <0.01 | <0.01 | <0.05 |
| 4 years | −0.156 (−0.173; −0.140) | −0.182 (−0.210; −0.153) | −0.267 (−0.284; −0.250) | −0.323 (−0.350; −0.296) | <0.01 | 0.82 | <0.01 | <0.01 | <0.01 | <0.01 | <0.01 |
| First-Borns, Sibling (−) | First-Borns, Sibling (+) | Second-Borns | Third-Borns or More | p for Linear Trend | |
|---|---|---|---|---|---|
| (n = 9657) | (n = 3463) | (n = 9240) | (n = 3889) | ||
| Short stature at 4 yr, n (%) | 255 (2.6) | 96 (2.8) | 301 (3.3) | 140 (3.6) | |
| Crude odds ratio | Reference | 1.05 (0.83; 1.33) | 1.24 (1.05; 1.47) | 1.38 (1.12; 1.70) | <0.01 |
| Model 1 | 0.99 (0.78; 1.26) | 1.28 (1.08; 1.52) | 1.46 (1.18; 1.81) | <0.01 | |
| Model 2 | 0.99 (0.78; 1.26) | 1.27 (1.07; 1.51) | 1.52 (1.23; 1.89) | <0.01 | |
| Model 3 | 1.03 (0.80; 1.33) | 1.34 (1.12; 1.60) | 1.49 (1.20; 1.86) | <0.01 | |
| Model 4 | 1.08 (0.84; 1.39) | 1.36 (1.13; 1.62) | 1.50 (1.20; 1.88) | <0.01 |
| First-Borns, Sibling (−) | First-Borns, Sibling (+) | Second-Borns | Third-Borns or More | p for Linear Trend | p for Interaction | |
|---|---|---|---|---|---|---|
| Small for gestational age (n = 1915) | 0.62 | |||||
| (n = 732) | (n = 241) | (n = 659) | (n = 283) | |||
| Short stature at 4 yr, n (%) | 63 (8.6) | 24 (10.0) | 67 (10.2) | 27 (9.5) | ||
| Crude odds ratio | Reference | 1.17 (0.72; 1.93) | 1.20 (0.84; 1.73) | 1.12 (0.70; 1.80) | 0.43 | |
| Adjusted odds ratio | 1.17 (0.68; 2.03) | 1.63 (1.09; 2.43) | 1.57 (0.93; 2.66) | <0.05 | ||
| Appropriate for gestational age (n = 21,717) | ||||||
| (n = 7905) | (n = 2840) | (n = 7789) | (n = 3183) | |||
| Short stature at 4-yr, n (%) | 186 (2.4) | 69 (2.4) | 225 (2.9) | 111 (3.5) | ||
| Crude odds ratio | Reference | 1.03 (0.78; 1.37) | 1.23 (1.01;1.50) | 1.50 (1.18; 1.90) | <0.01 | |
| Adjusted odds ratio | 1.02 (0.76; 1.37) | 1.30 (1.05; 1.60) | 1.54 (1.20; 1.99) | <0.01 | ||
| Large for gestational age (n = 2917) | ||||||
| (n = 1020) | (n = 382) | (n = 792) | (n = 423) | |||
| Short stature at 4 yr, n (%) | 6 (0.6) | 3 (0.8) | 9 (1.1) | 2 (0.5) | ||
| Crude odds ratio | Reference | 1.34 (0.33; 5.38) | 1.94 (0.69; 5.48) | 0.80 (0.16; 3.99) | 0.65 | |
| Adjusted odds ratio | 1.99 (0.45; 8.95) | 2.01 (0.68; 6.00) | 1.09 (0.21; 5.77) | 0.46 | ||
Disclaimer/Publisher’s Note: The statements, opinions and data contained in all publications are solely those of the individual author(s) and contributor(s) and not of MDPI and/or the editor(s). MDPI and/or the editor(s) disclaim responsibility for any injury to people or property resulting from any ideas, methods, instructions or products referred to in the content. |
© 2023 by the authors. Licensee MDPI, Basel, Switzerland. This article is an open access article distributed under the terms and conditions of the Creative Commons Attribution (CC BY) license (https://creativecommons.org/licenses/by/4.0/).
Share and Cite
Yoshida, A.; Kaneko, K.; Aoyama, K.; Yamaguchi, N.; Suzuki, A.; Kato, S.; Ebara, T.; Sugiura-Ogasawara, M.; Kamijima, M.; Saitoh, S.; et al. Relationship between Birth Order and Postnatal Growth until 4 Years of Age: The Japan Environment and Children’s Study. Children 2023, 10, 557. https://doi.org/10.3390/children10030557
Yoshida A, Kaneko K, Aoyama K, Yamaguchi N, Suzuki A, Kato S, Ebara T, Sugiura-Ogasawara M, Kamijima M, Saitoh S, et al. Relationship between Birth Order and Postnatal Growth until 4 Years of Age: The Japan Environment and Children’s Study. Children. 2023; 10(3):557. https://doi.org/10.3390/children10030557
Chicago/Turabian StyleYoshida, Aya, Kayo Kaneko, Kohei Aoyama, Naoya Yamaguchi, Atsushi Suzuki, Sayaka Kato, Takeshi Ebara, Mayumi Sugiura-Ogasawara, Michihiro Kamijima, Shinji Saitoh, and et al. 2023. "Relationship between Birth Order and Postnatal Growth until 4 Years of Age: The Japan Environment and Children’s Study" Children 10, no. 3: 557. https://doi.org/10.3390/children10030557