
Impedimetric Biosensor Coated with Zinc Oxide Nanorods Synthesized by a Modification of the Hydrothermal Method for Antibody Detection
 , , , , and
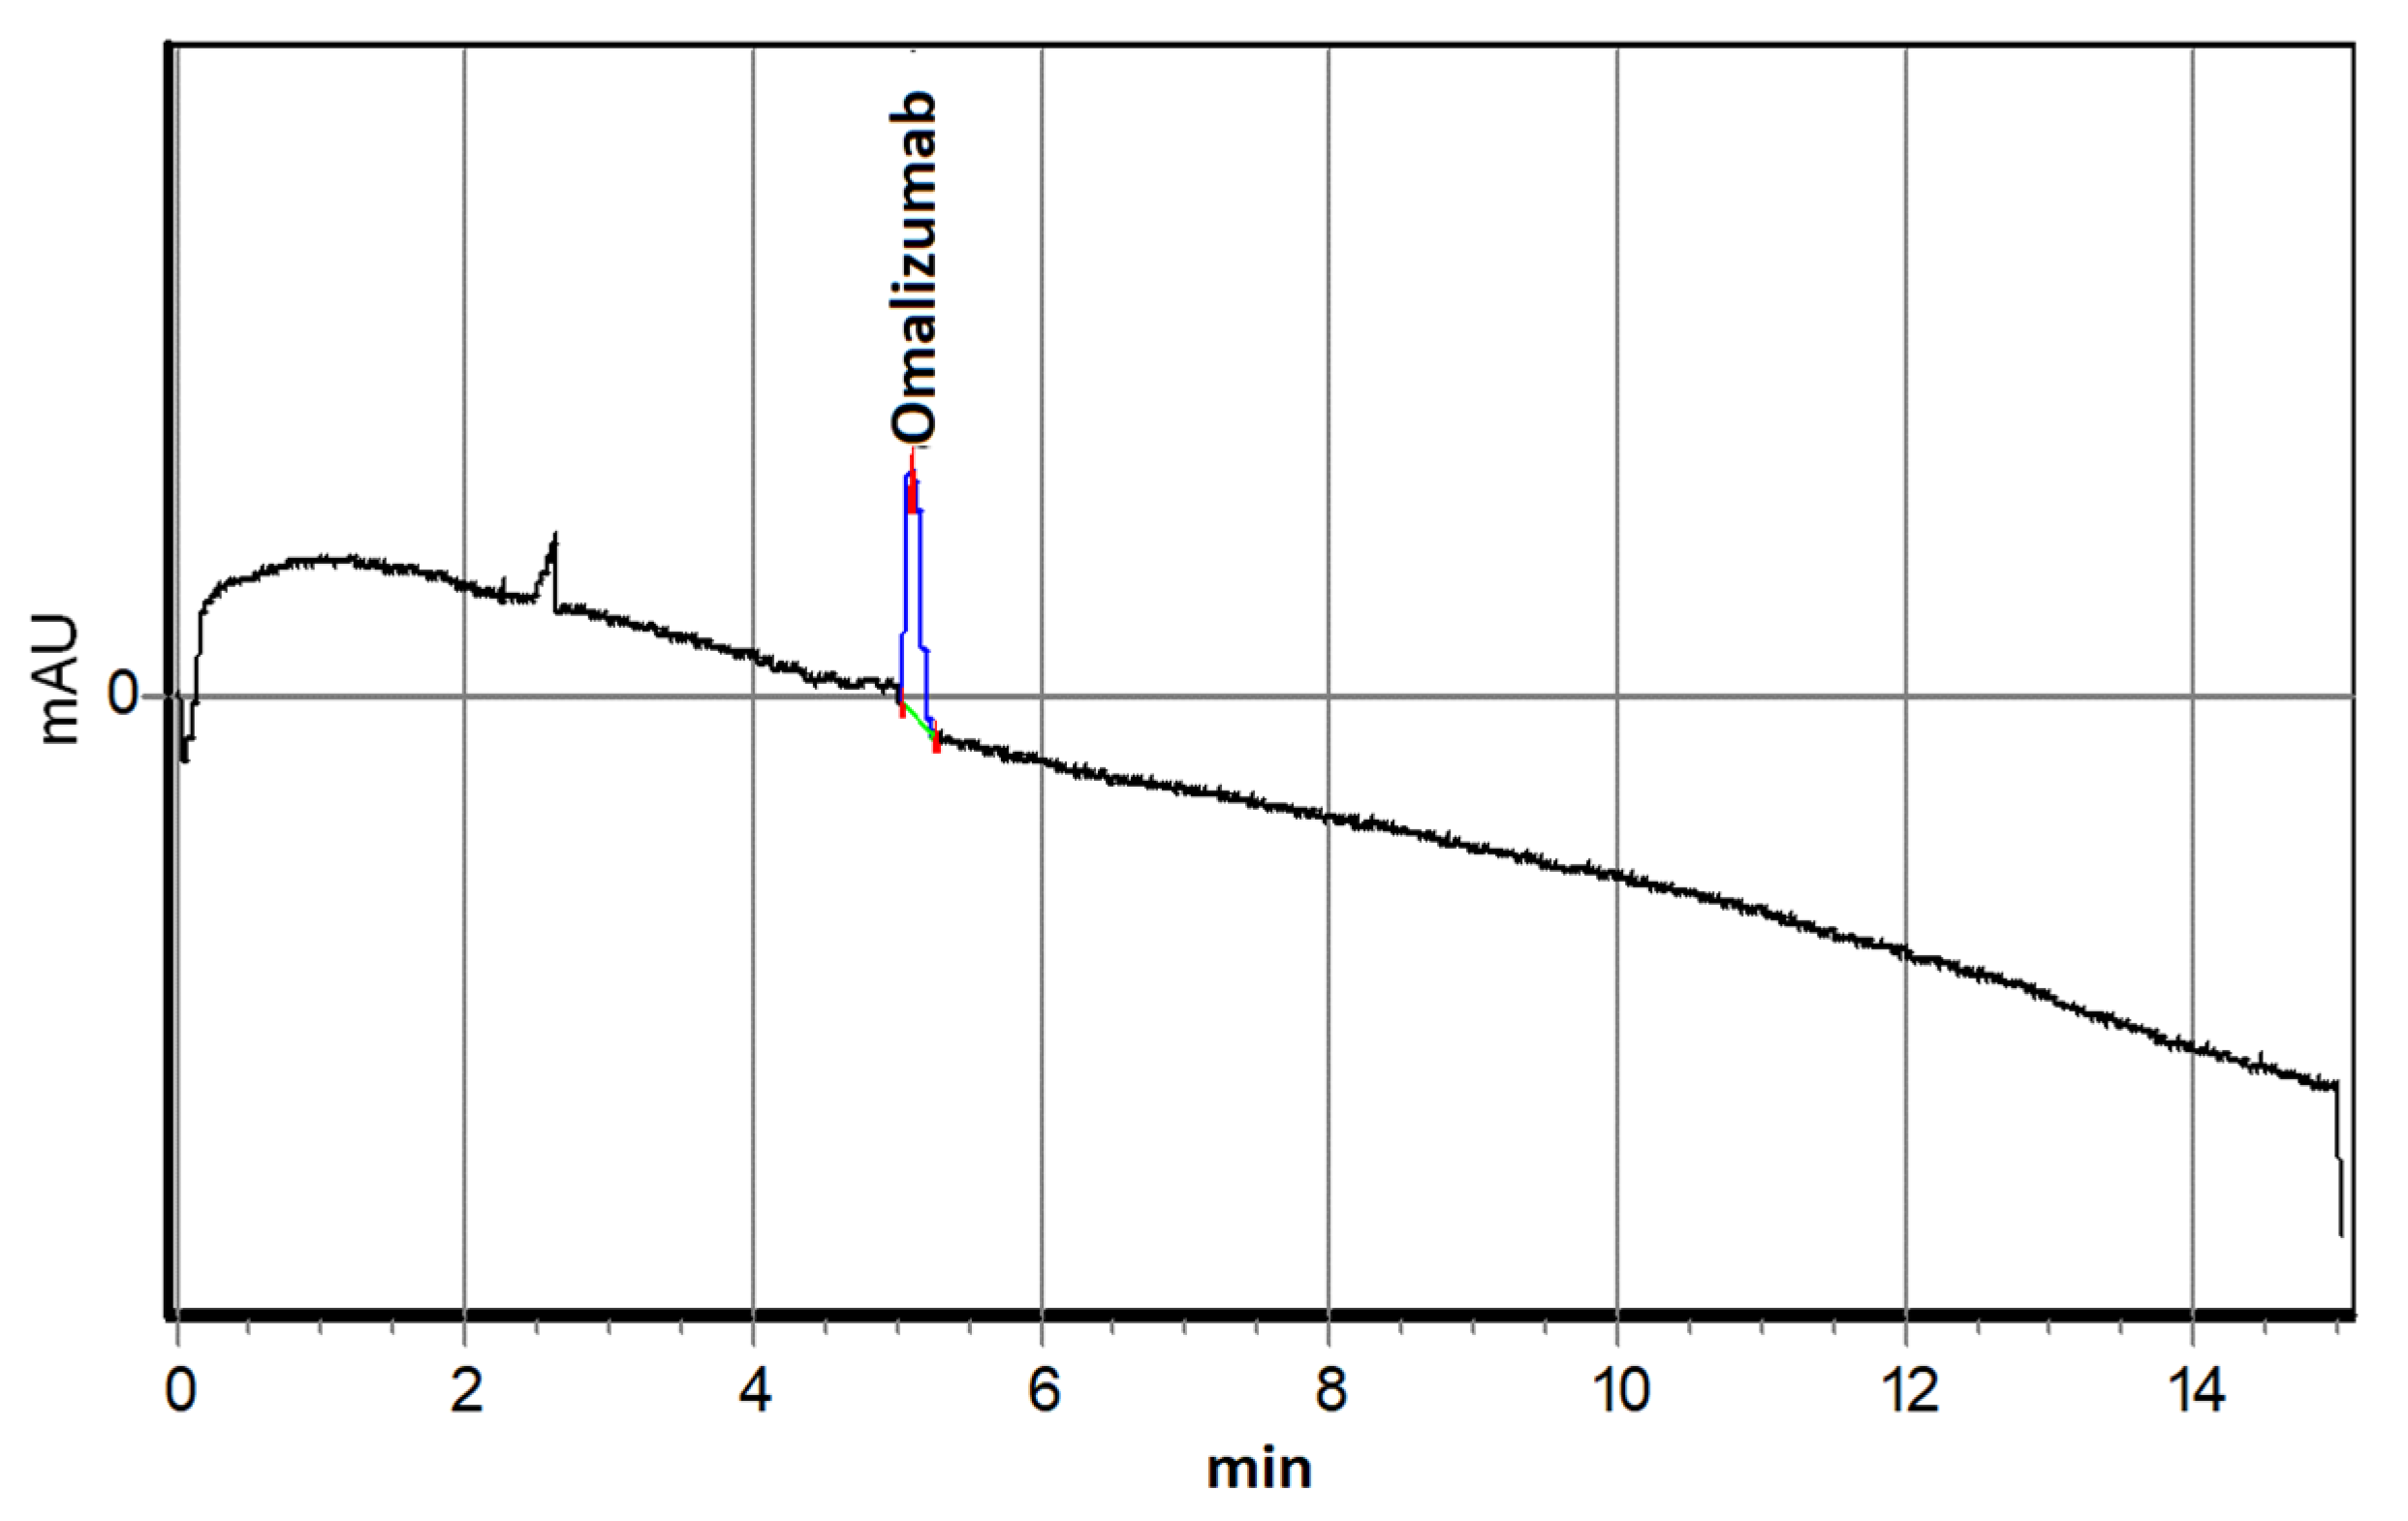
Abstract
:1. Introduction
2. Materials and Methods
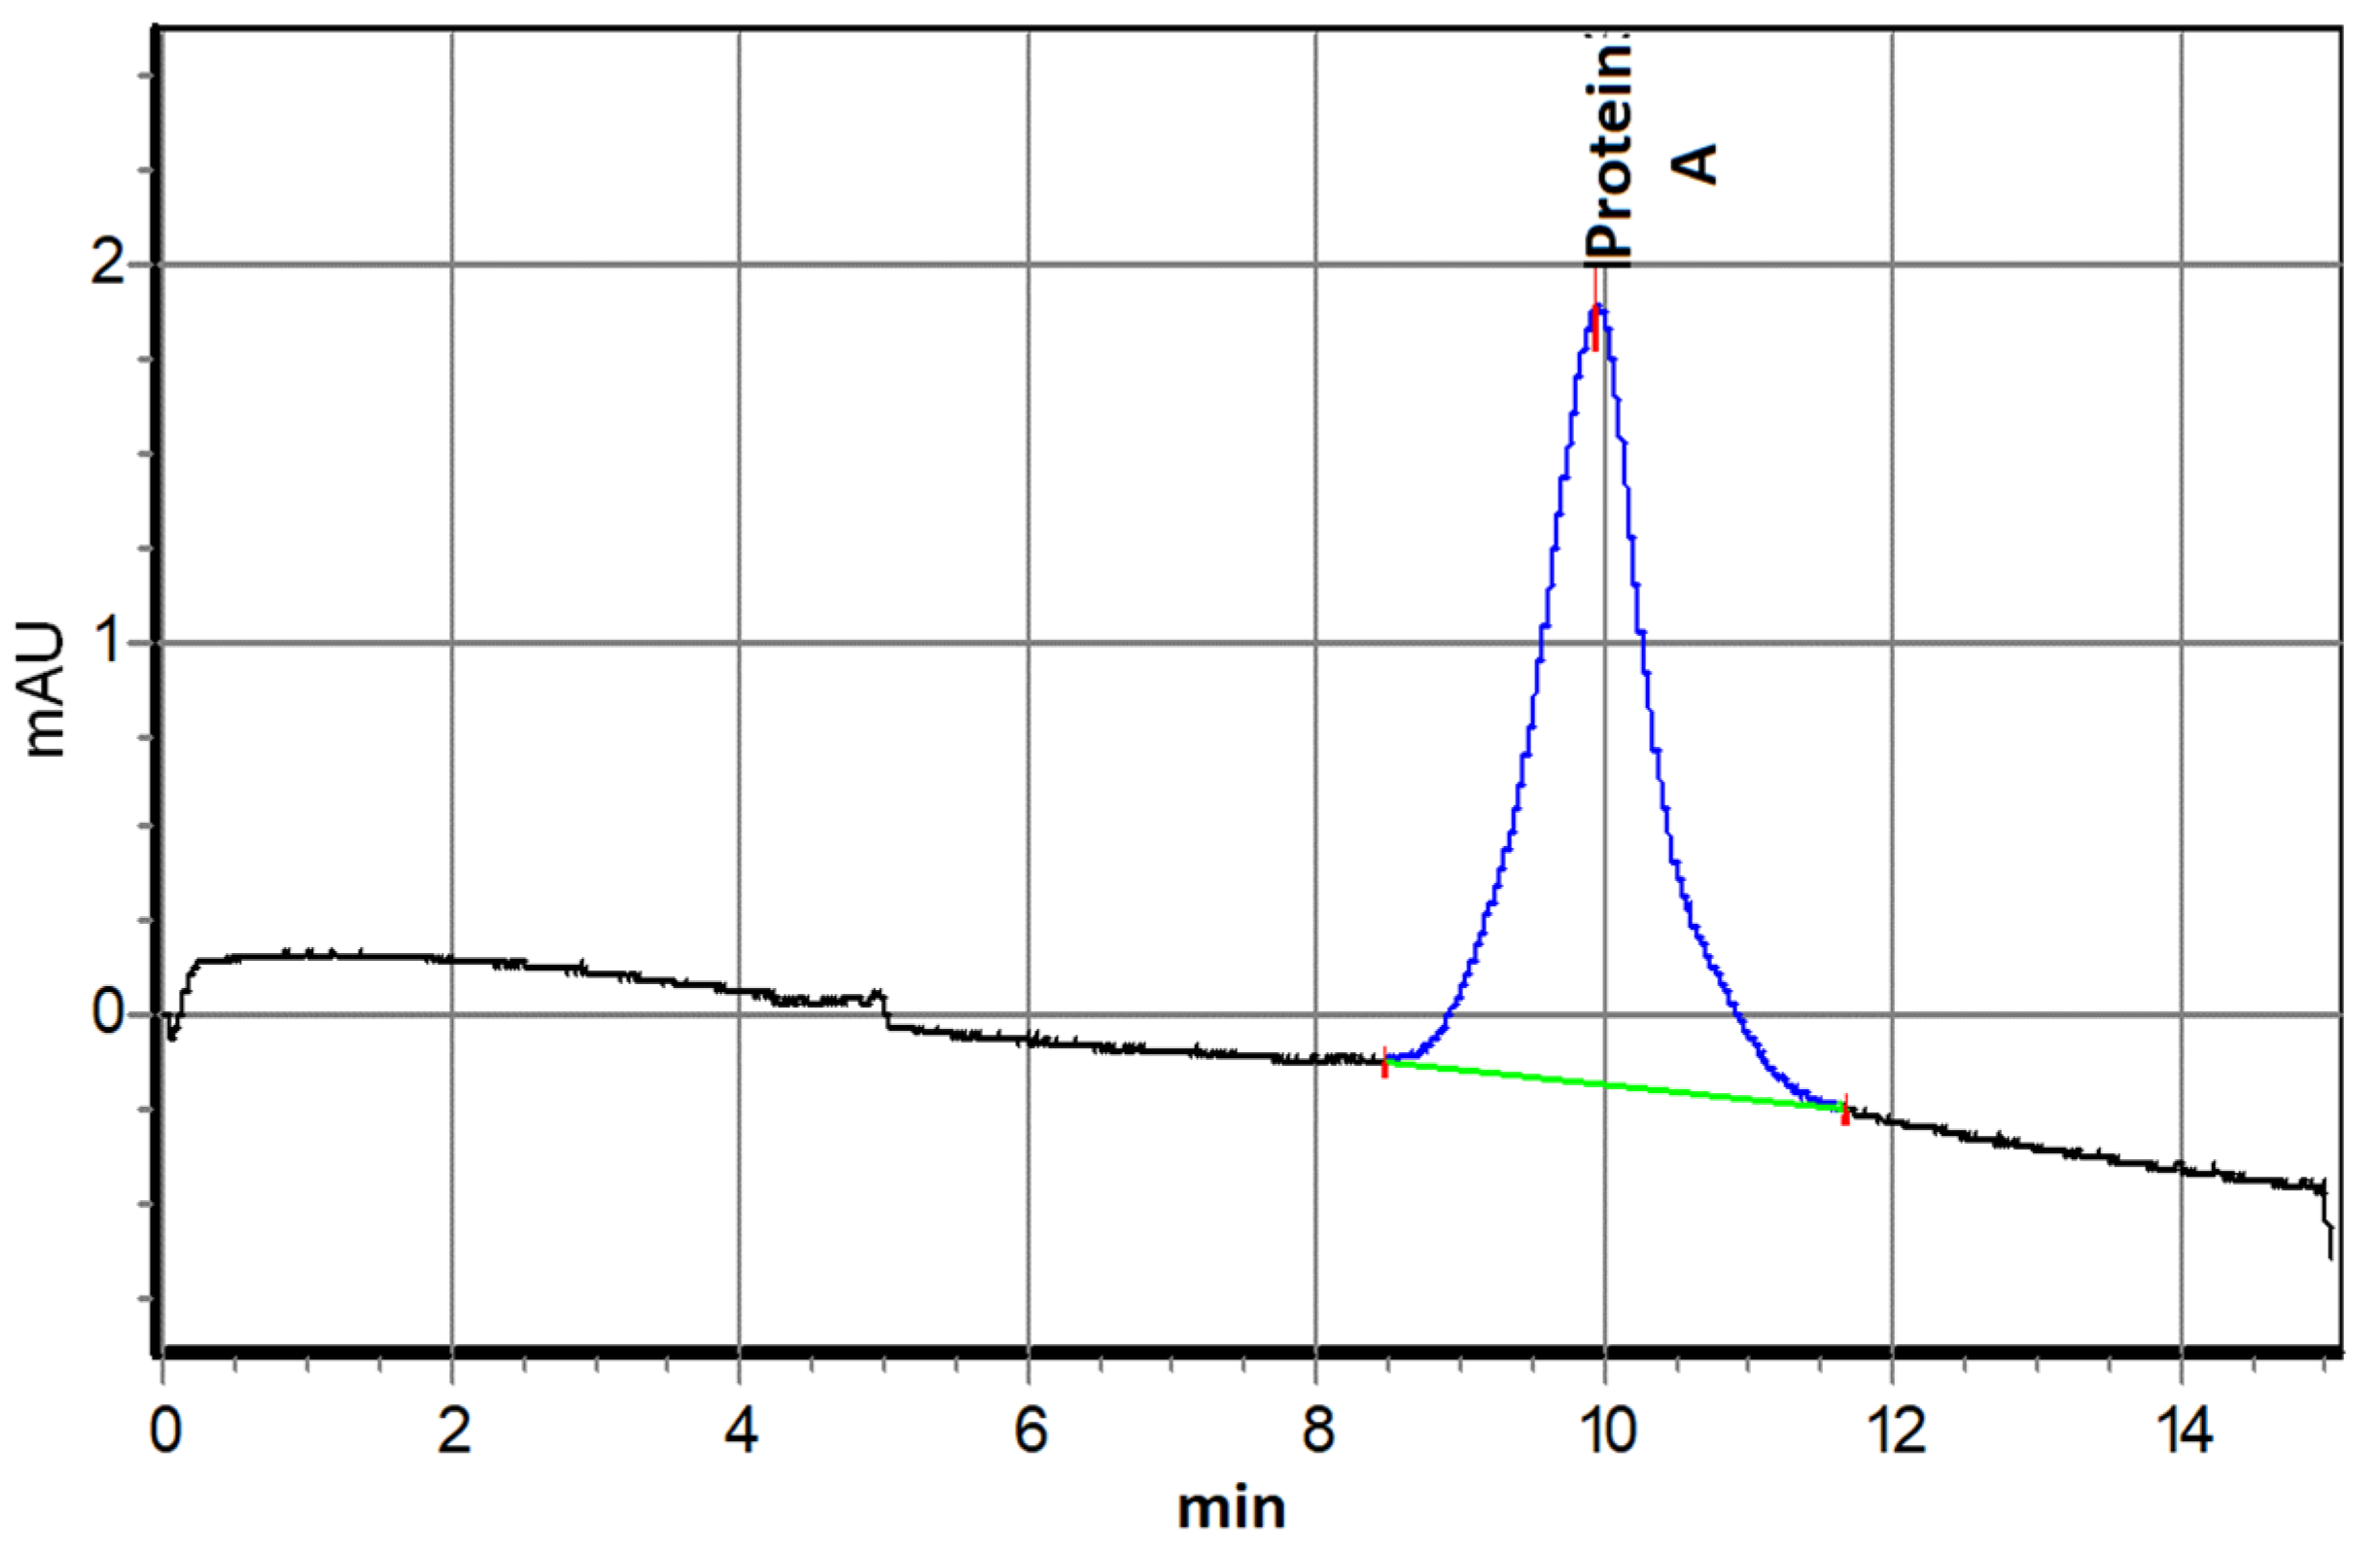
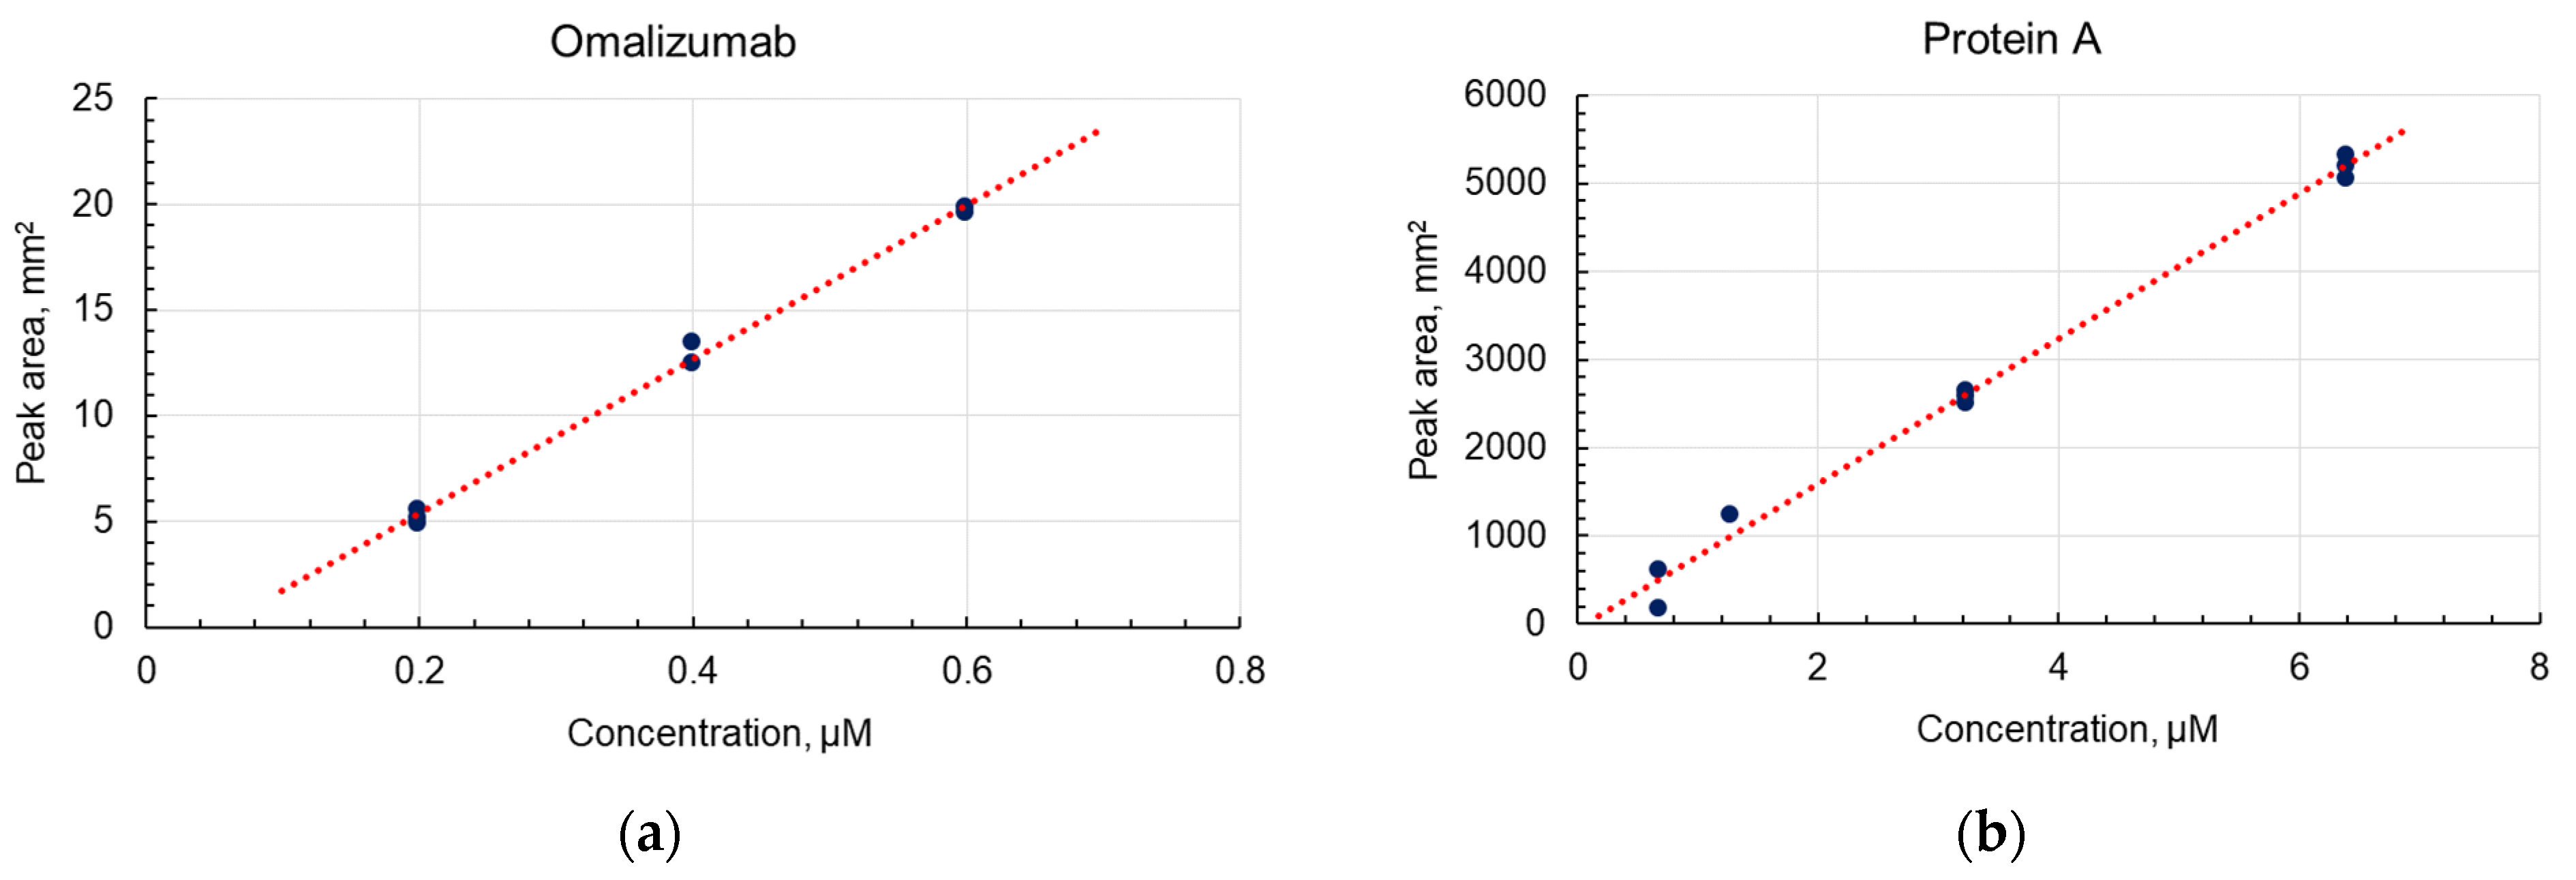
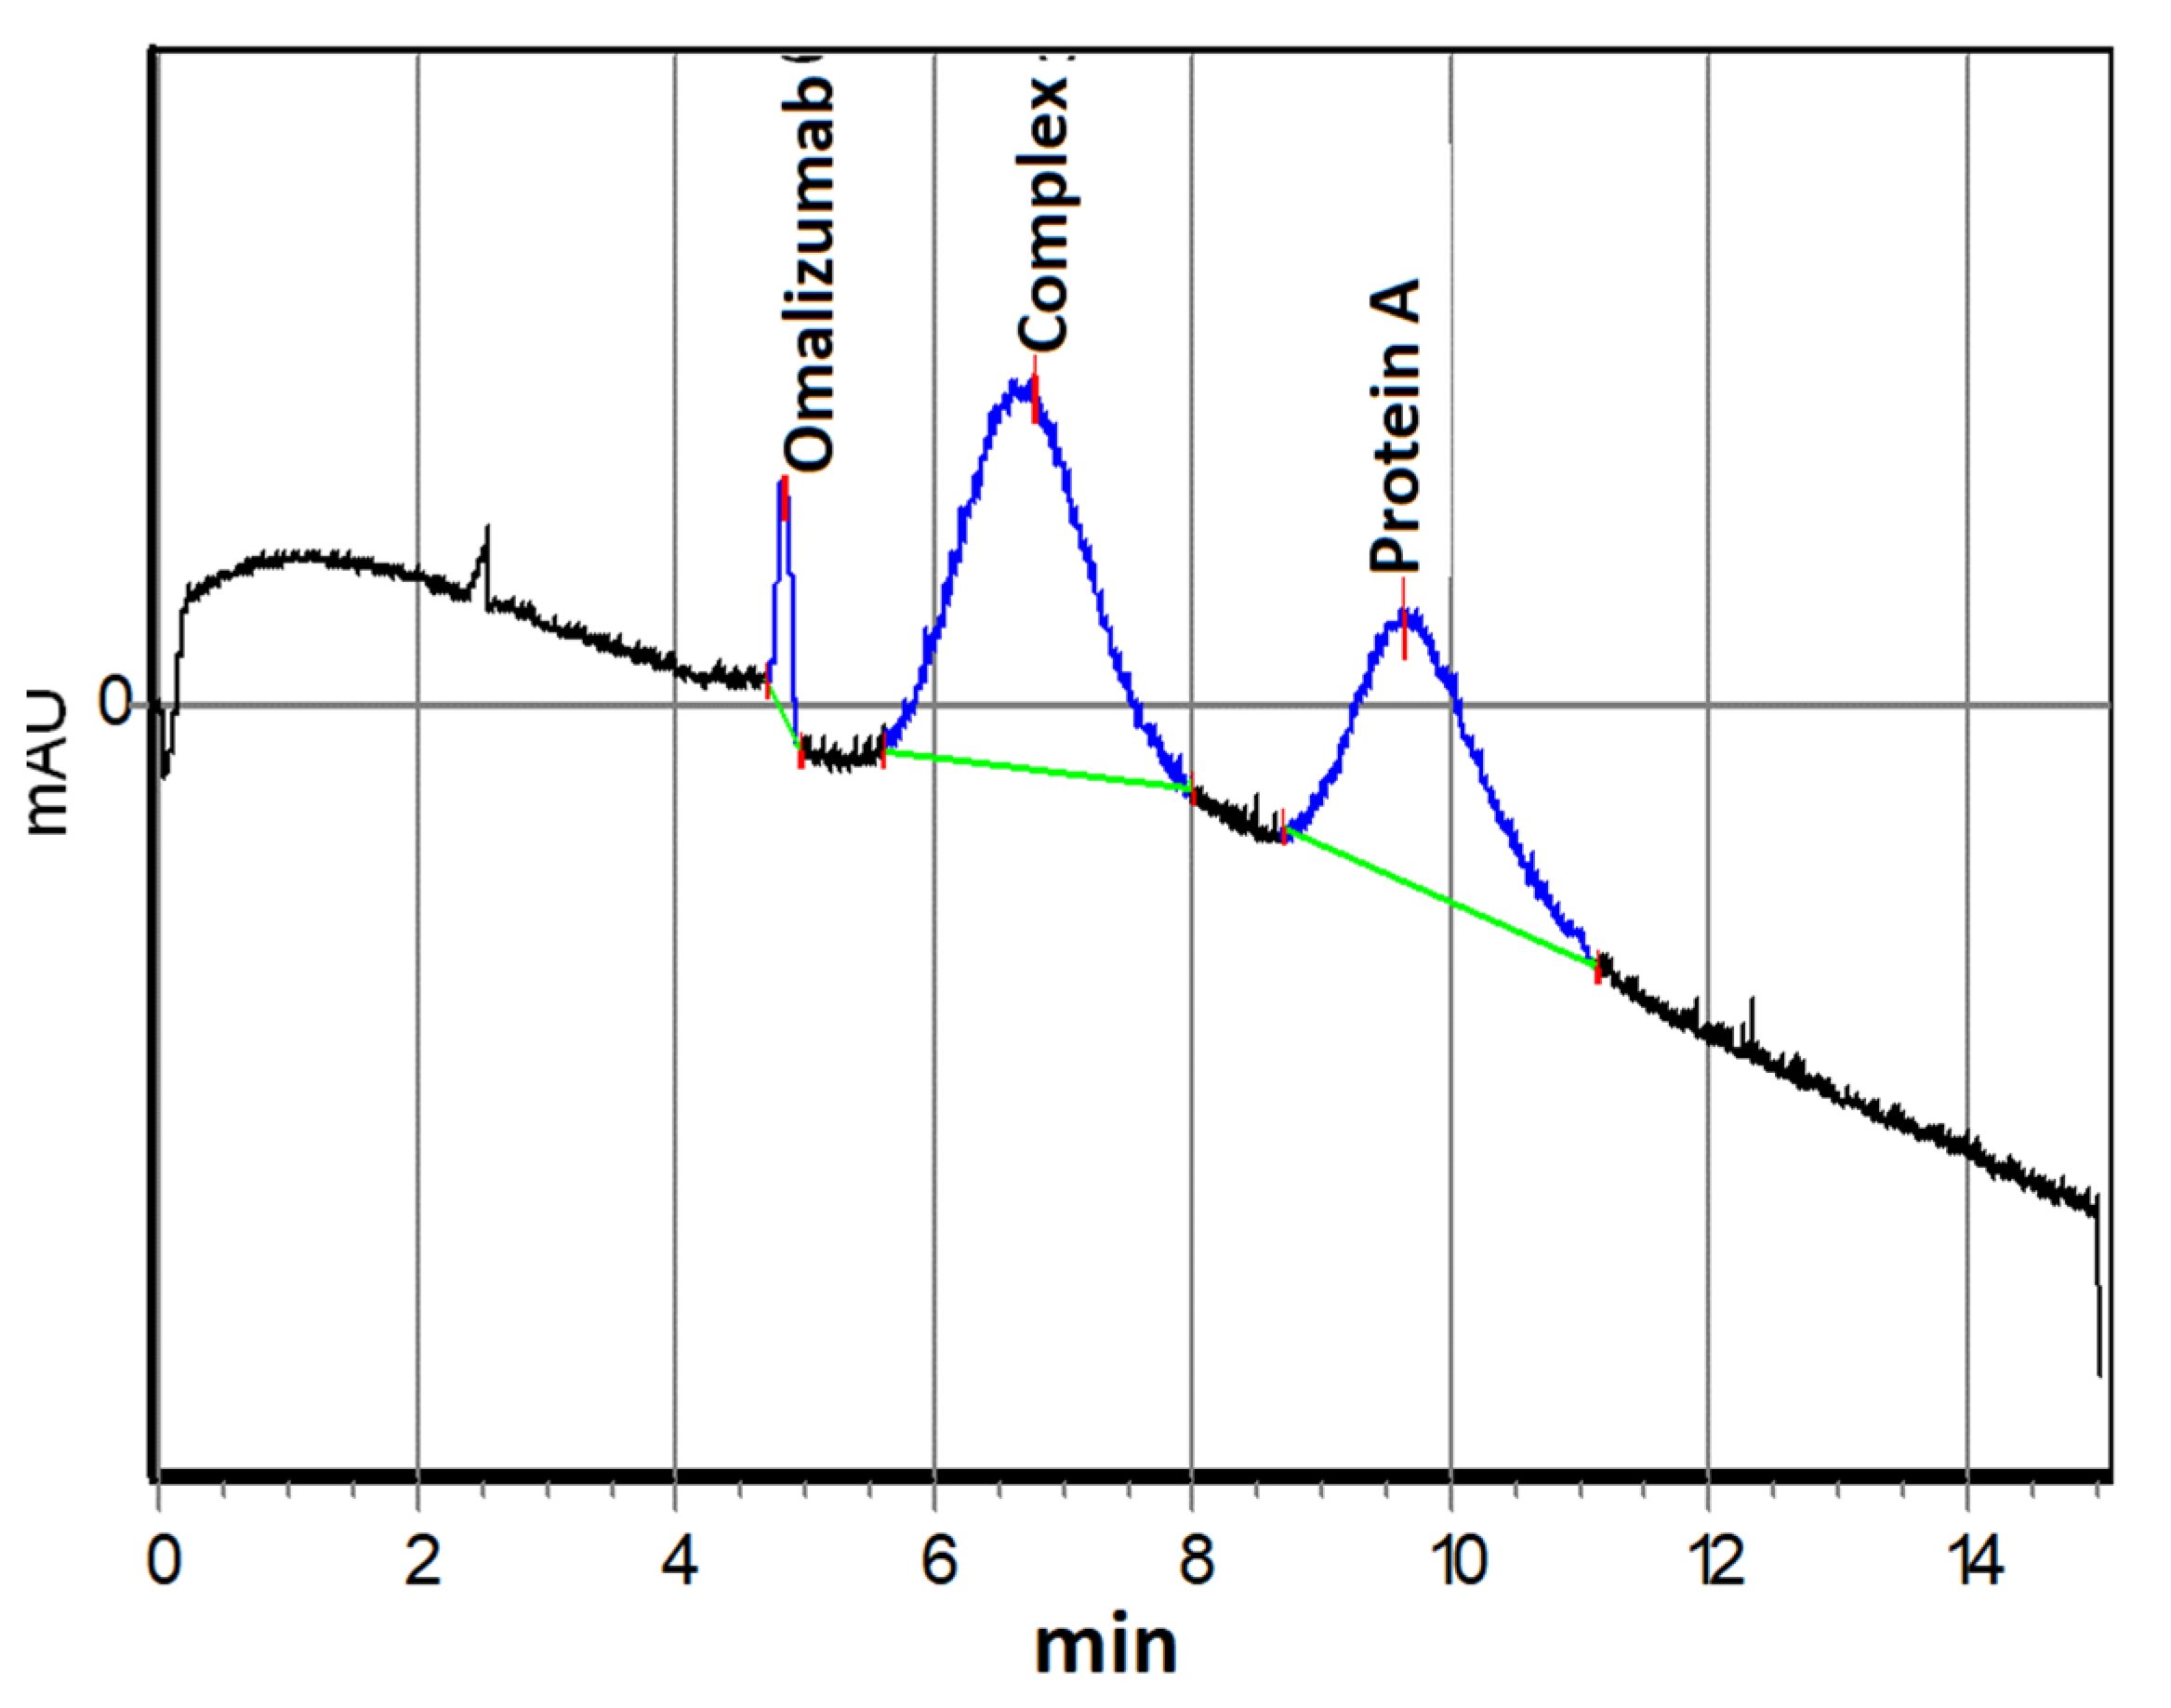
2.1. In Vitro Study of Complex Formation between Protein A and Omalizumab
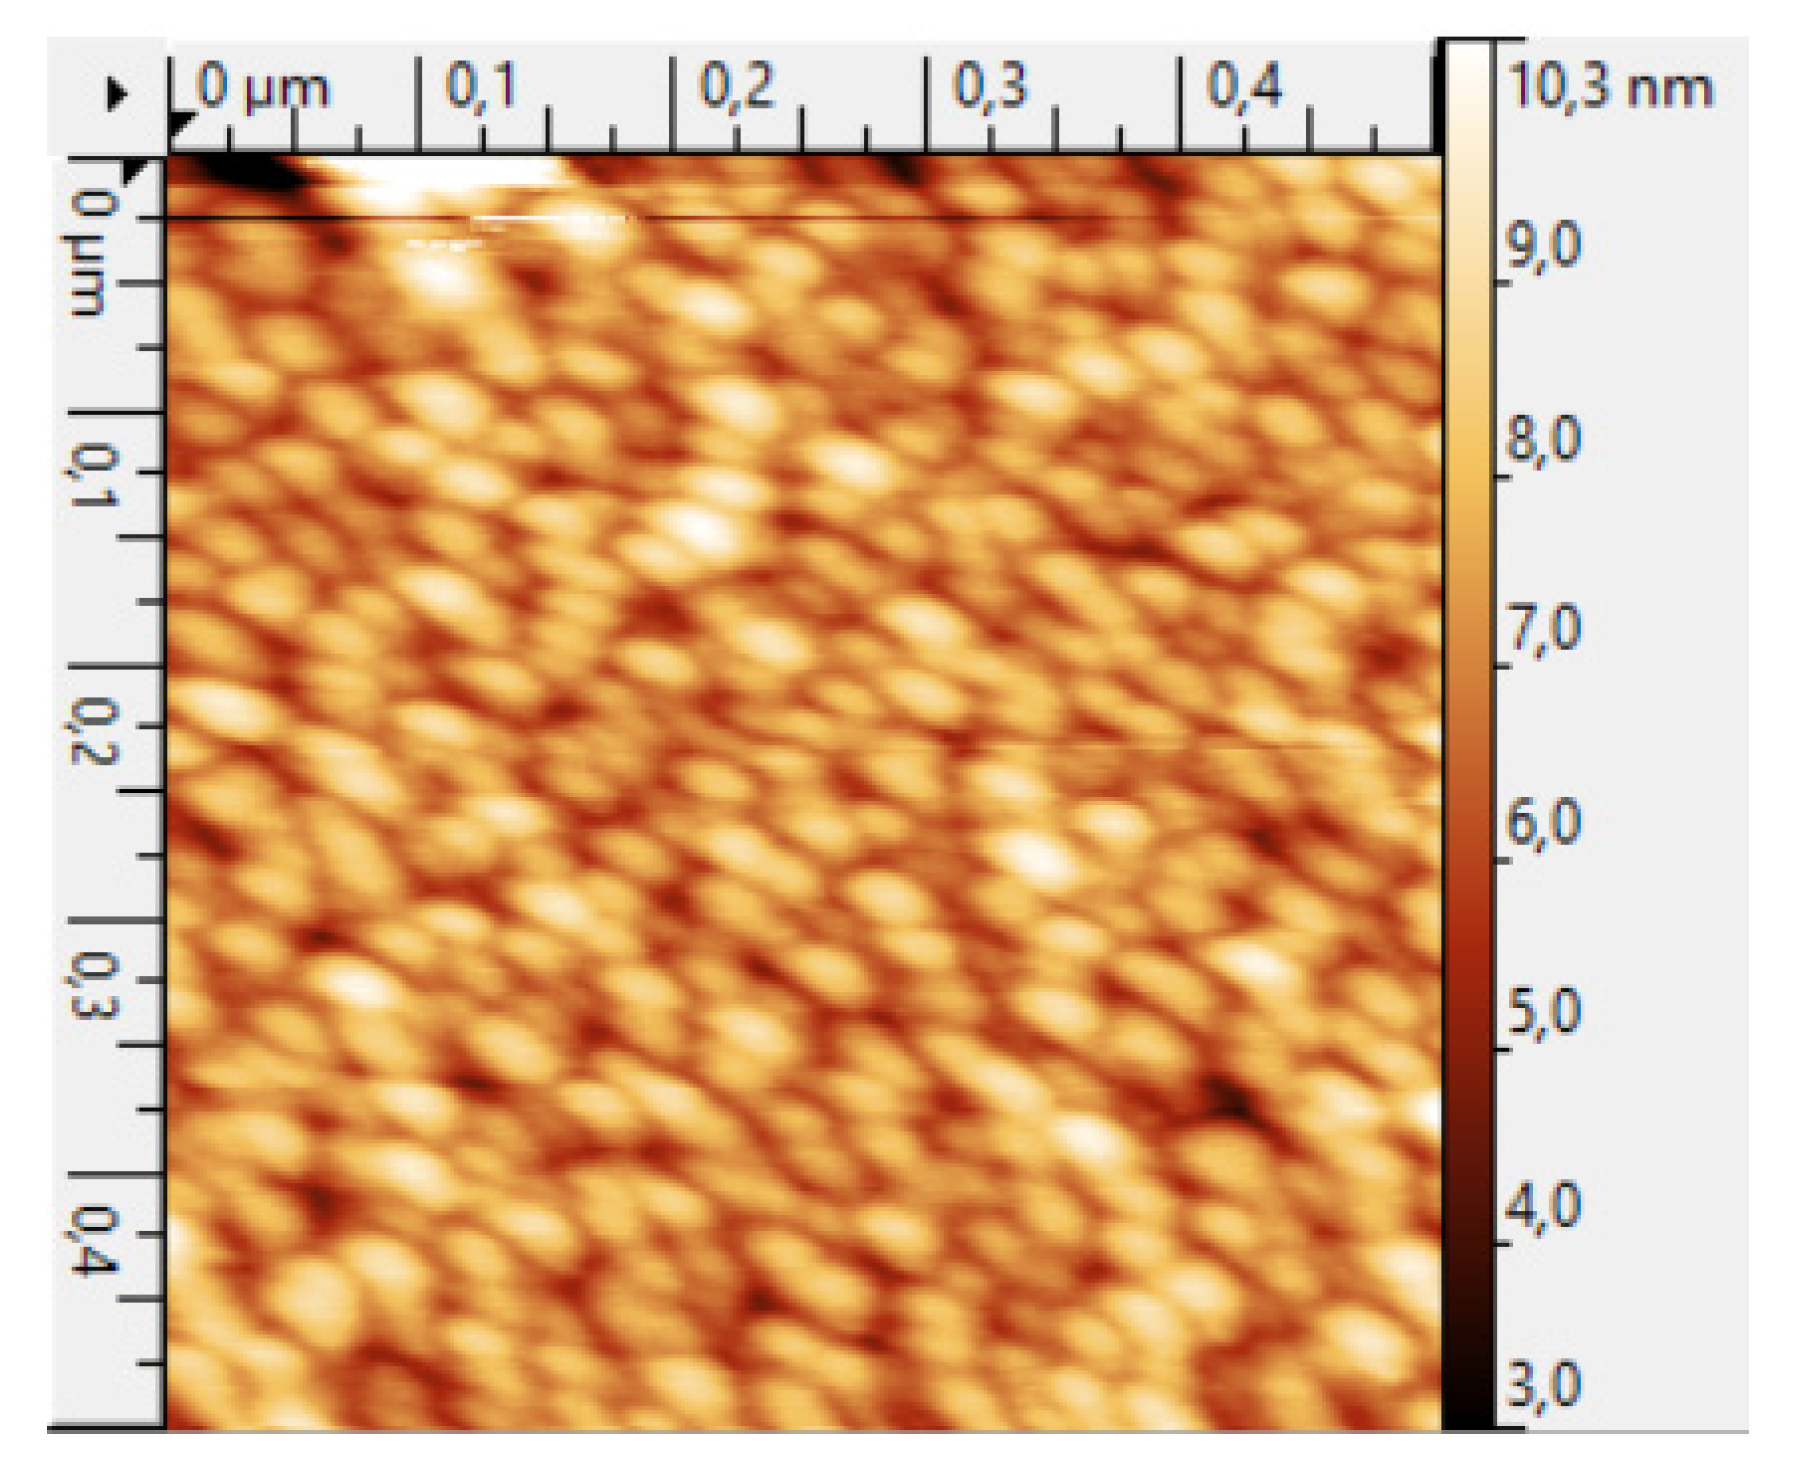
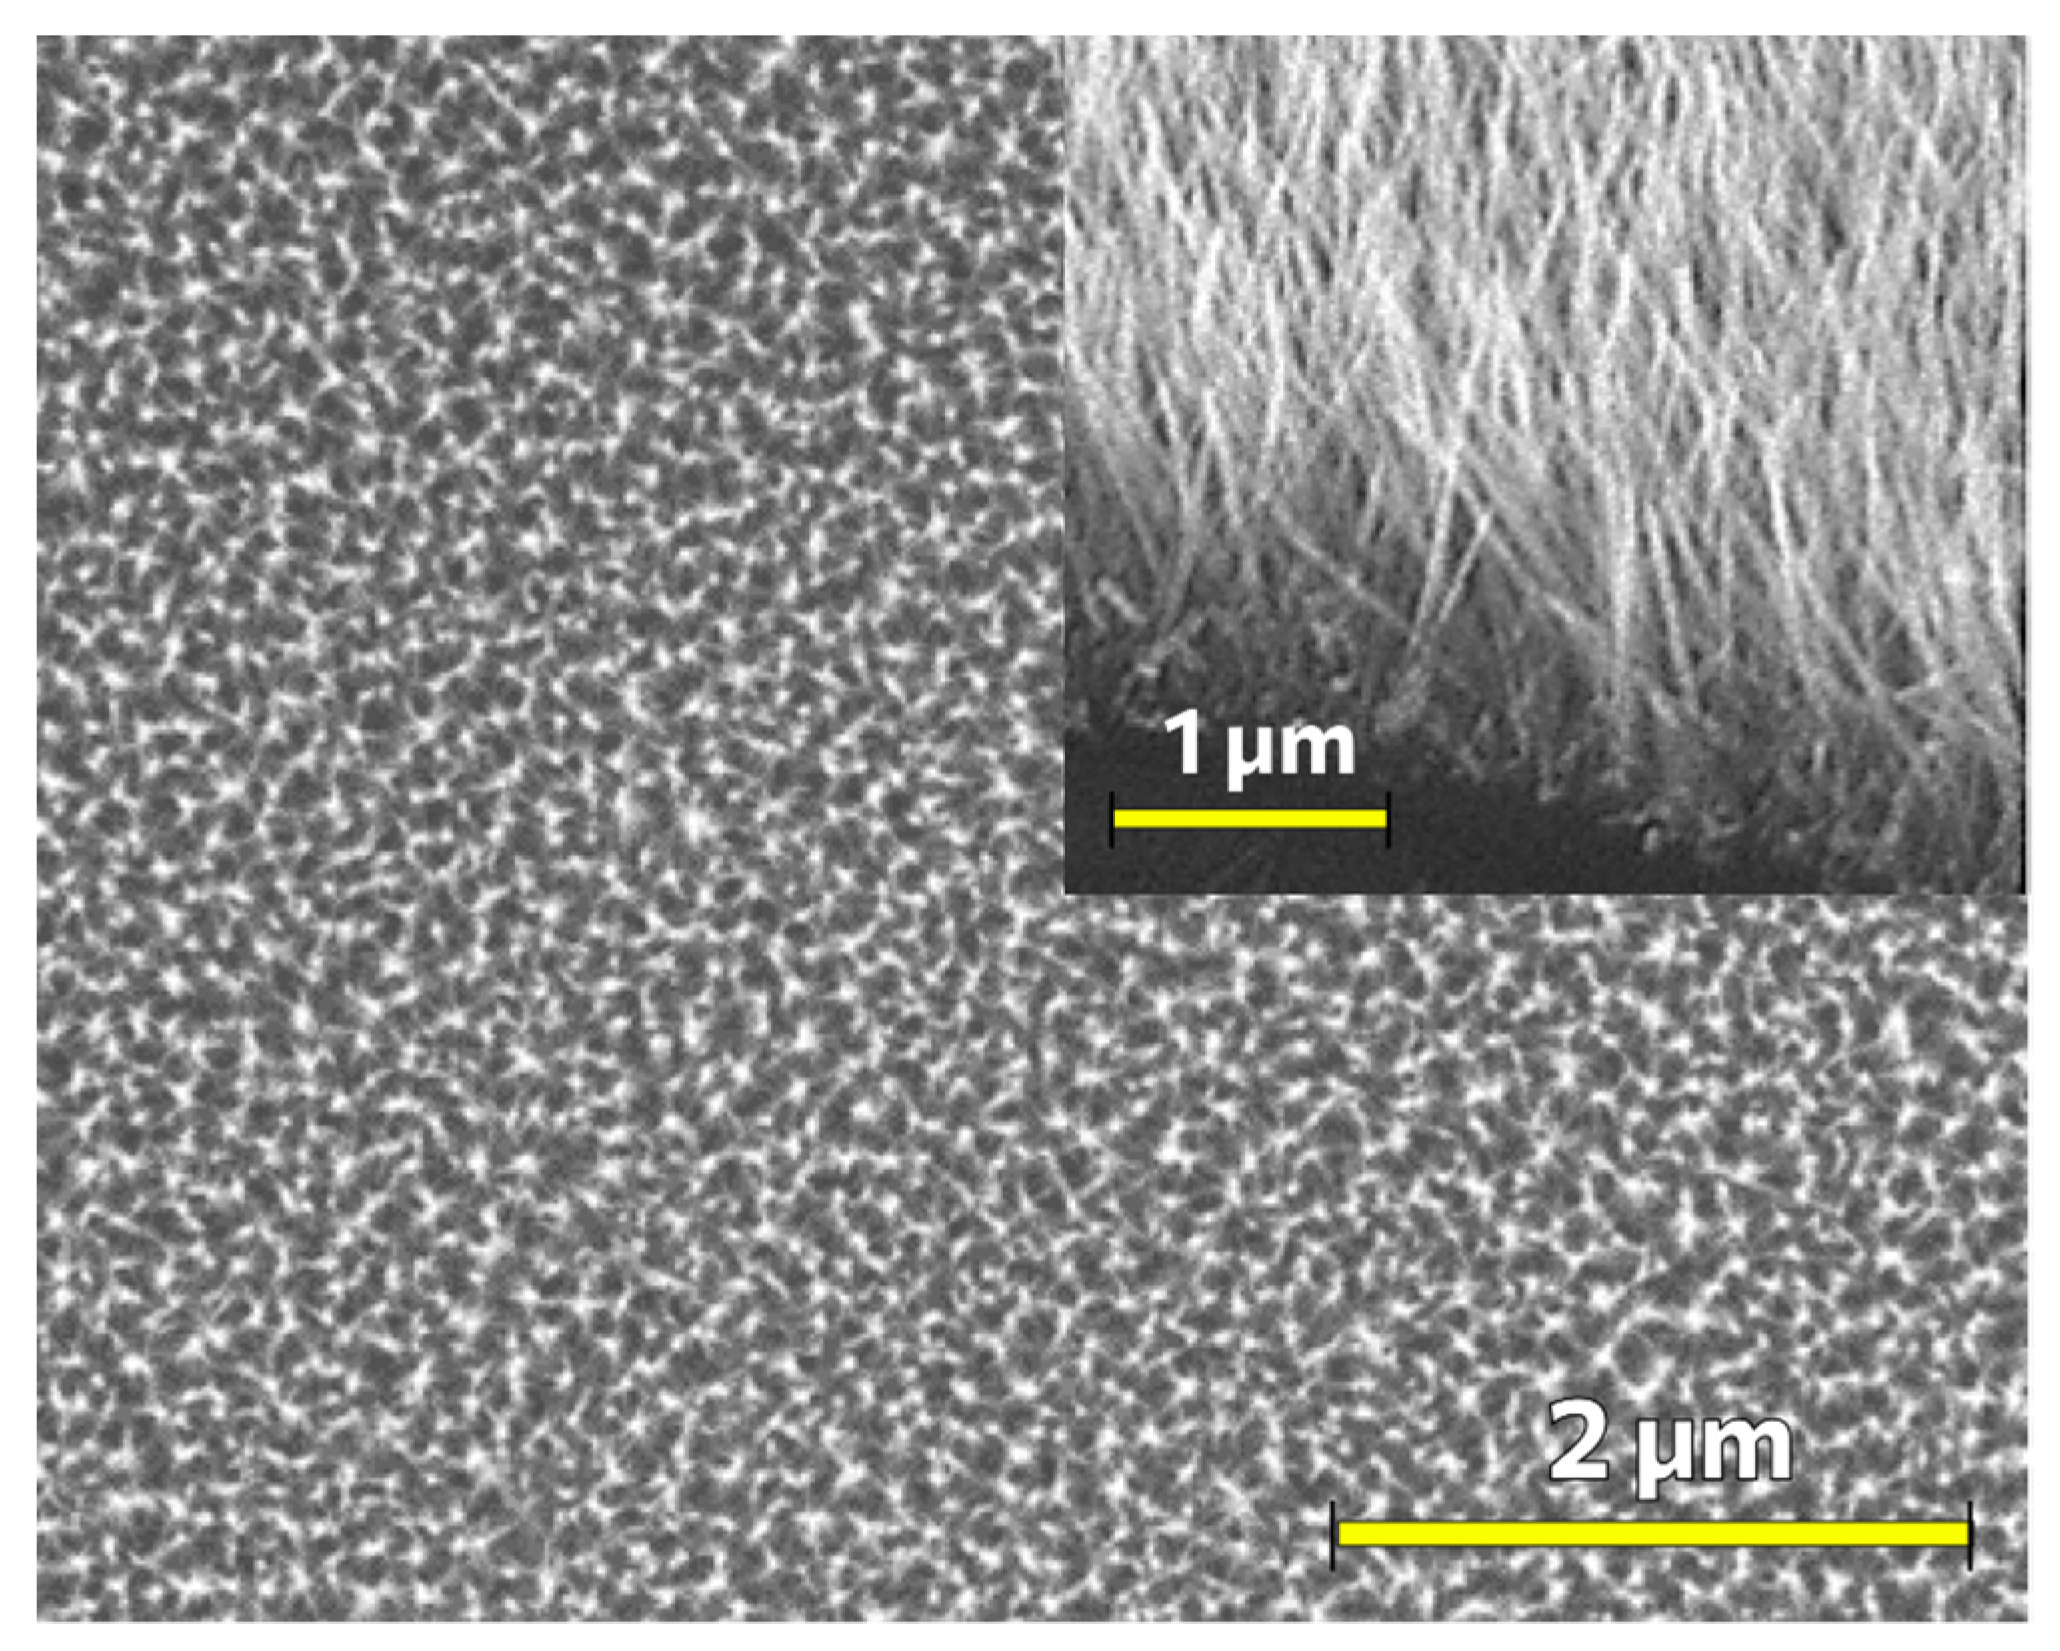
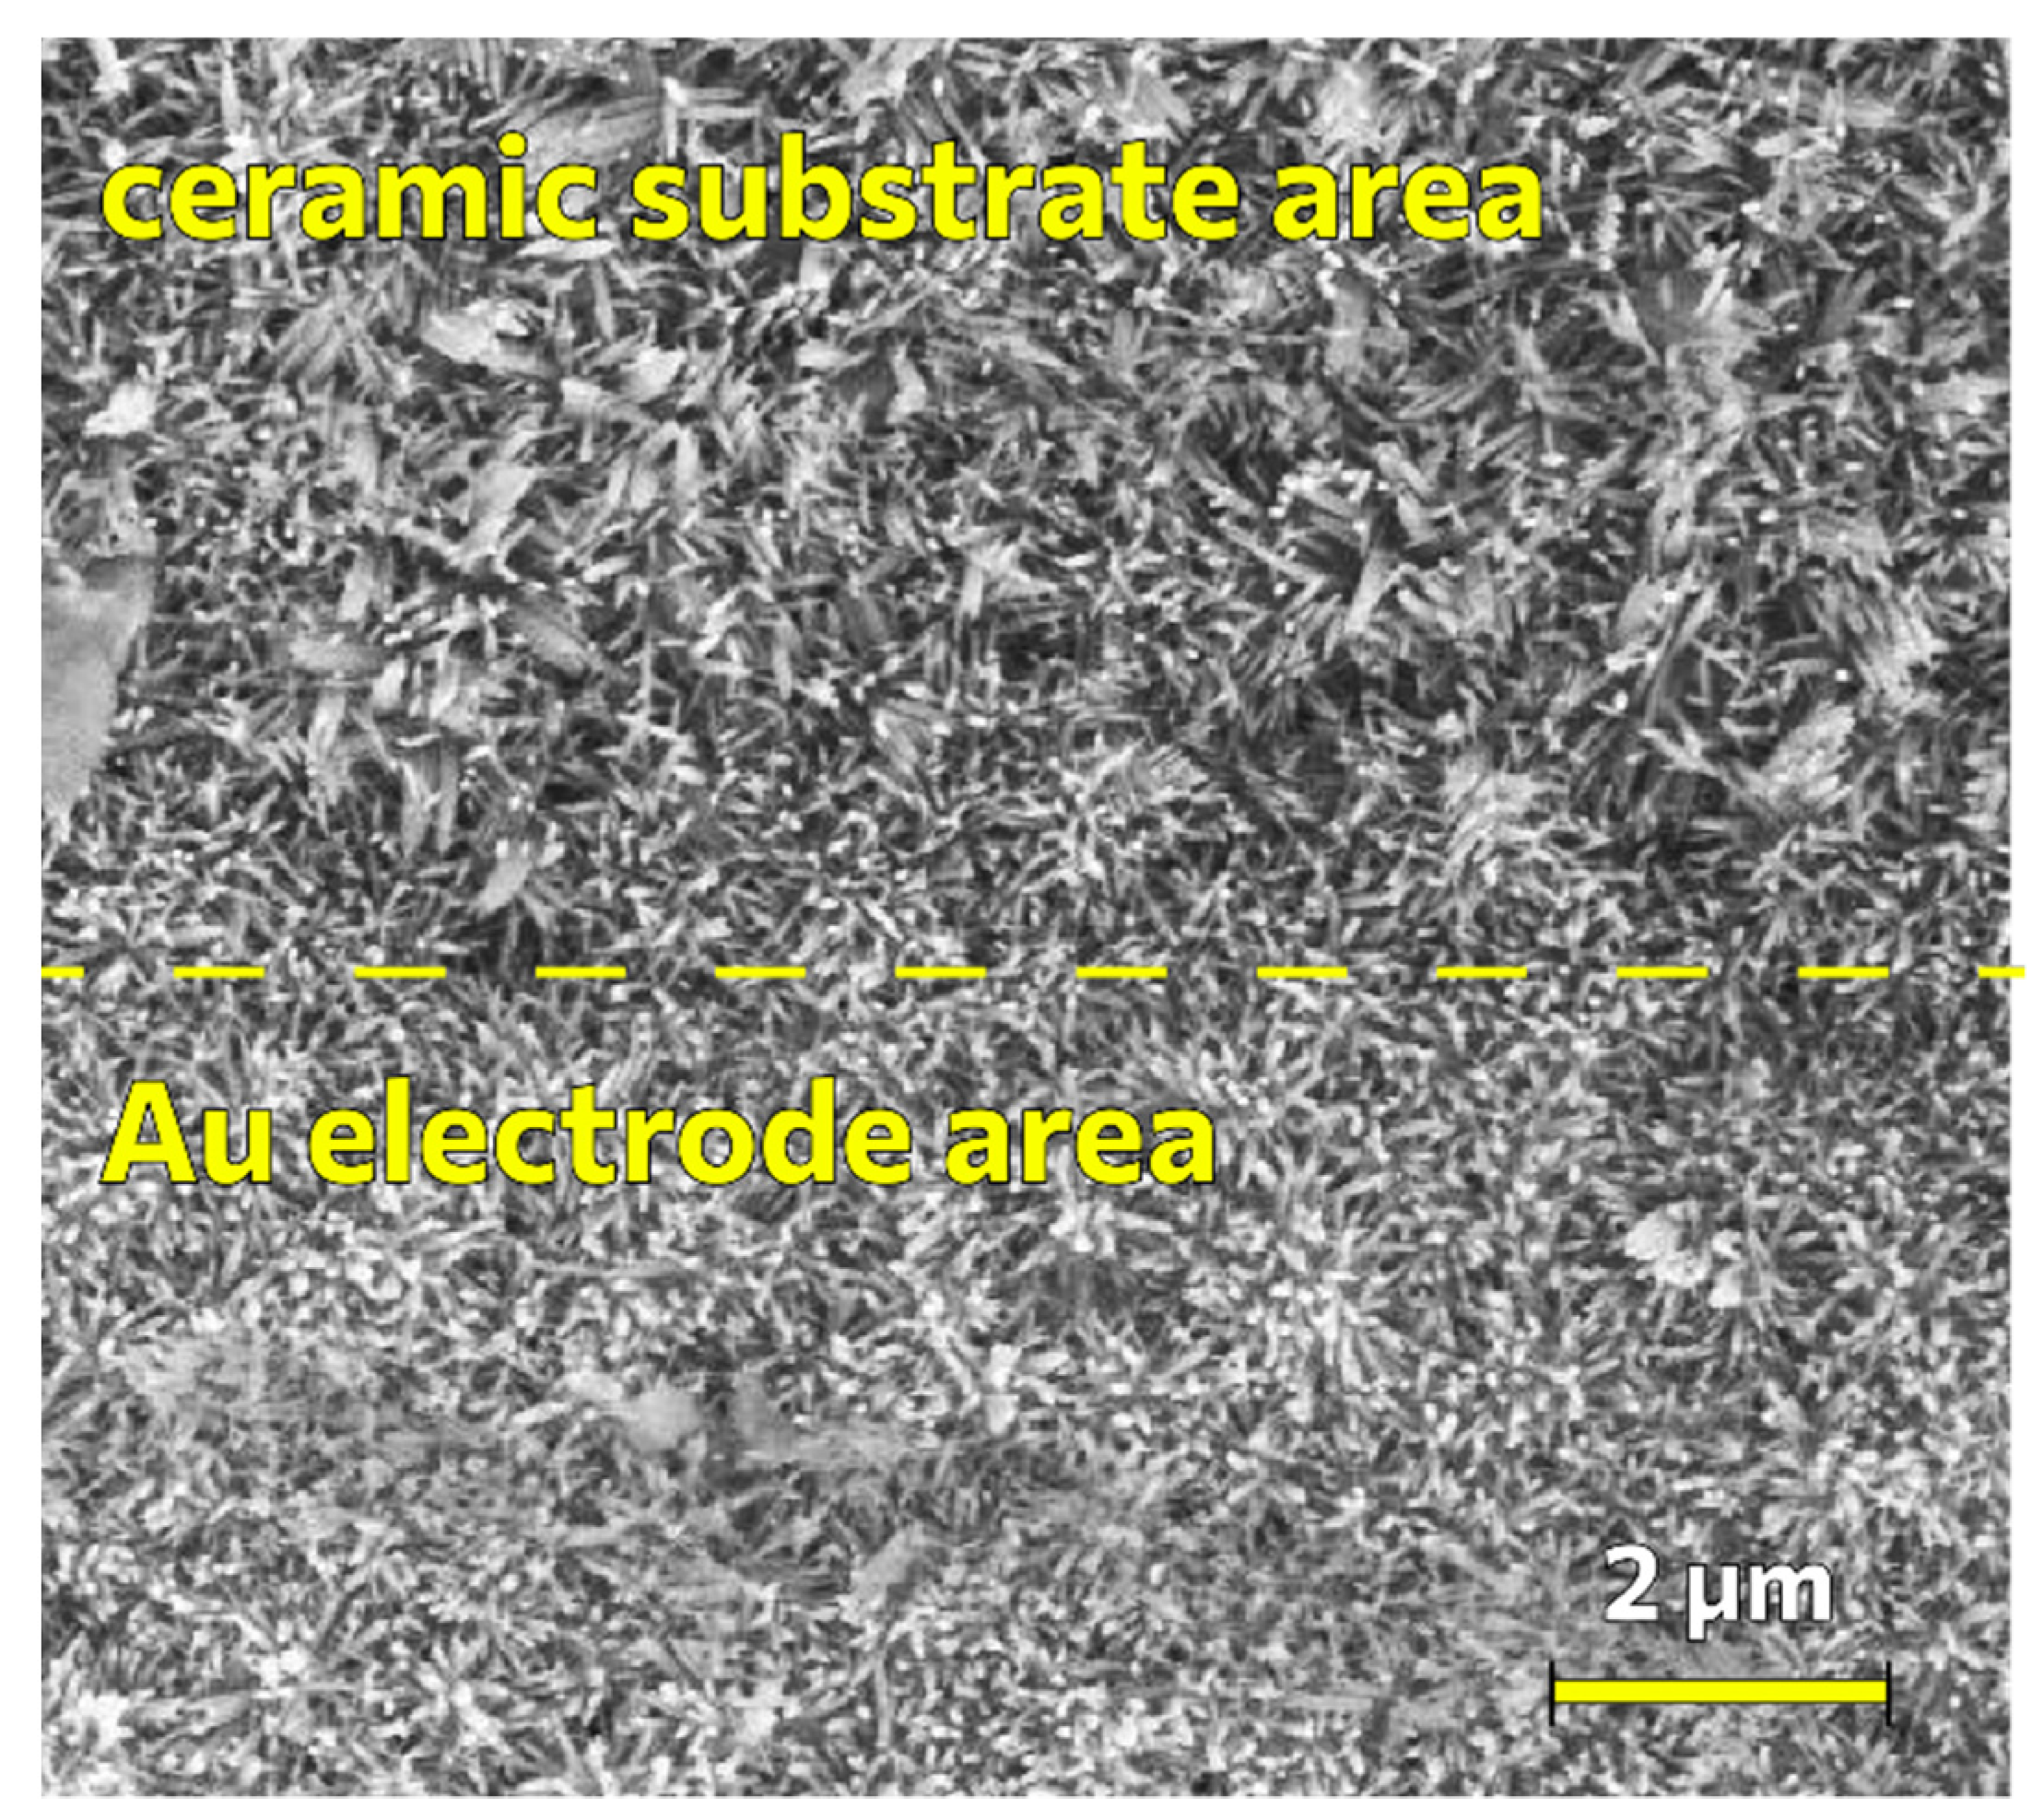
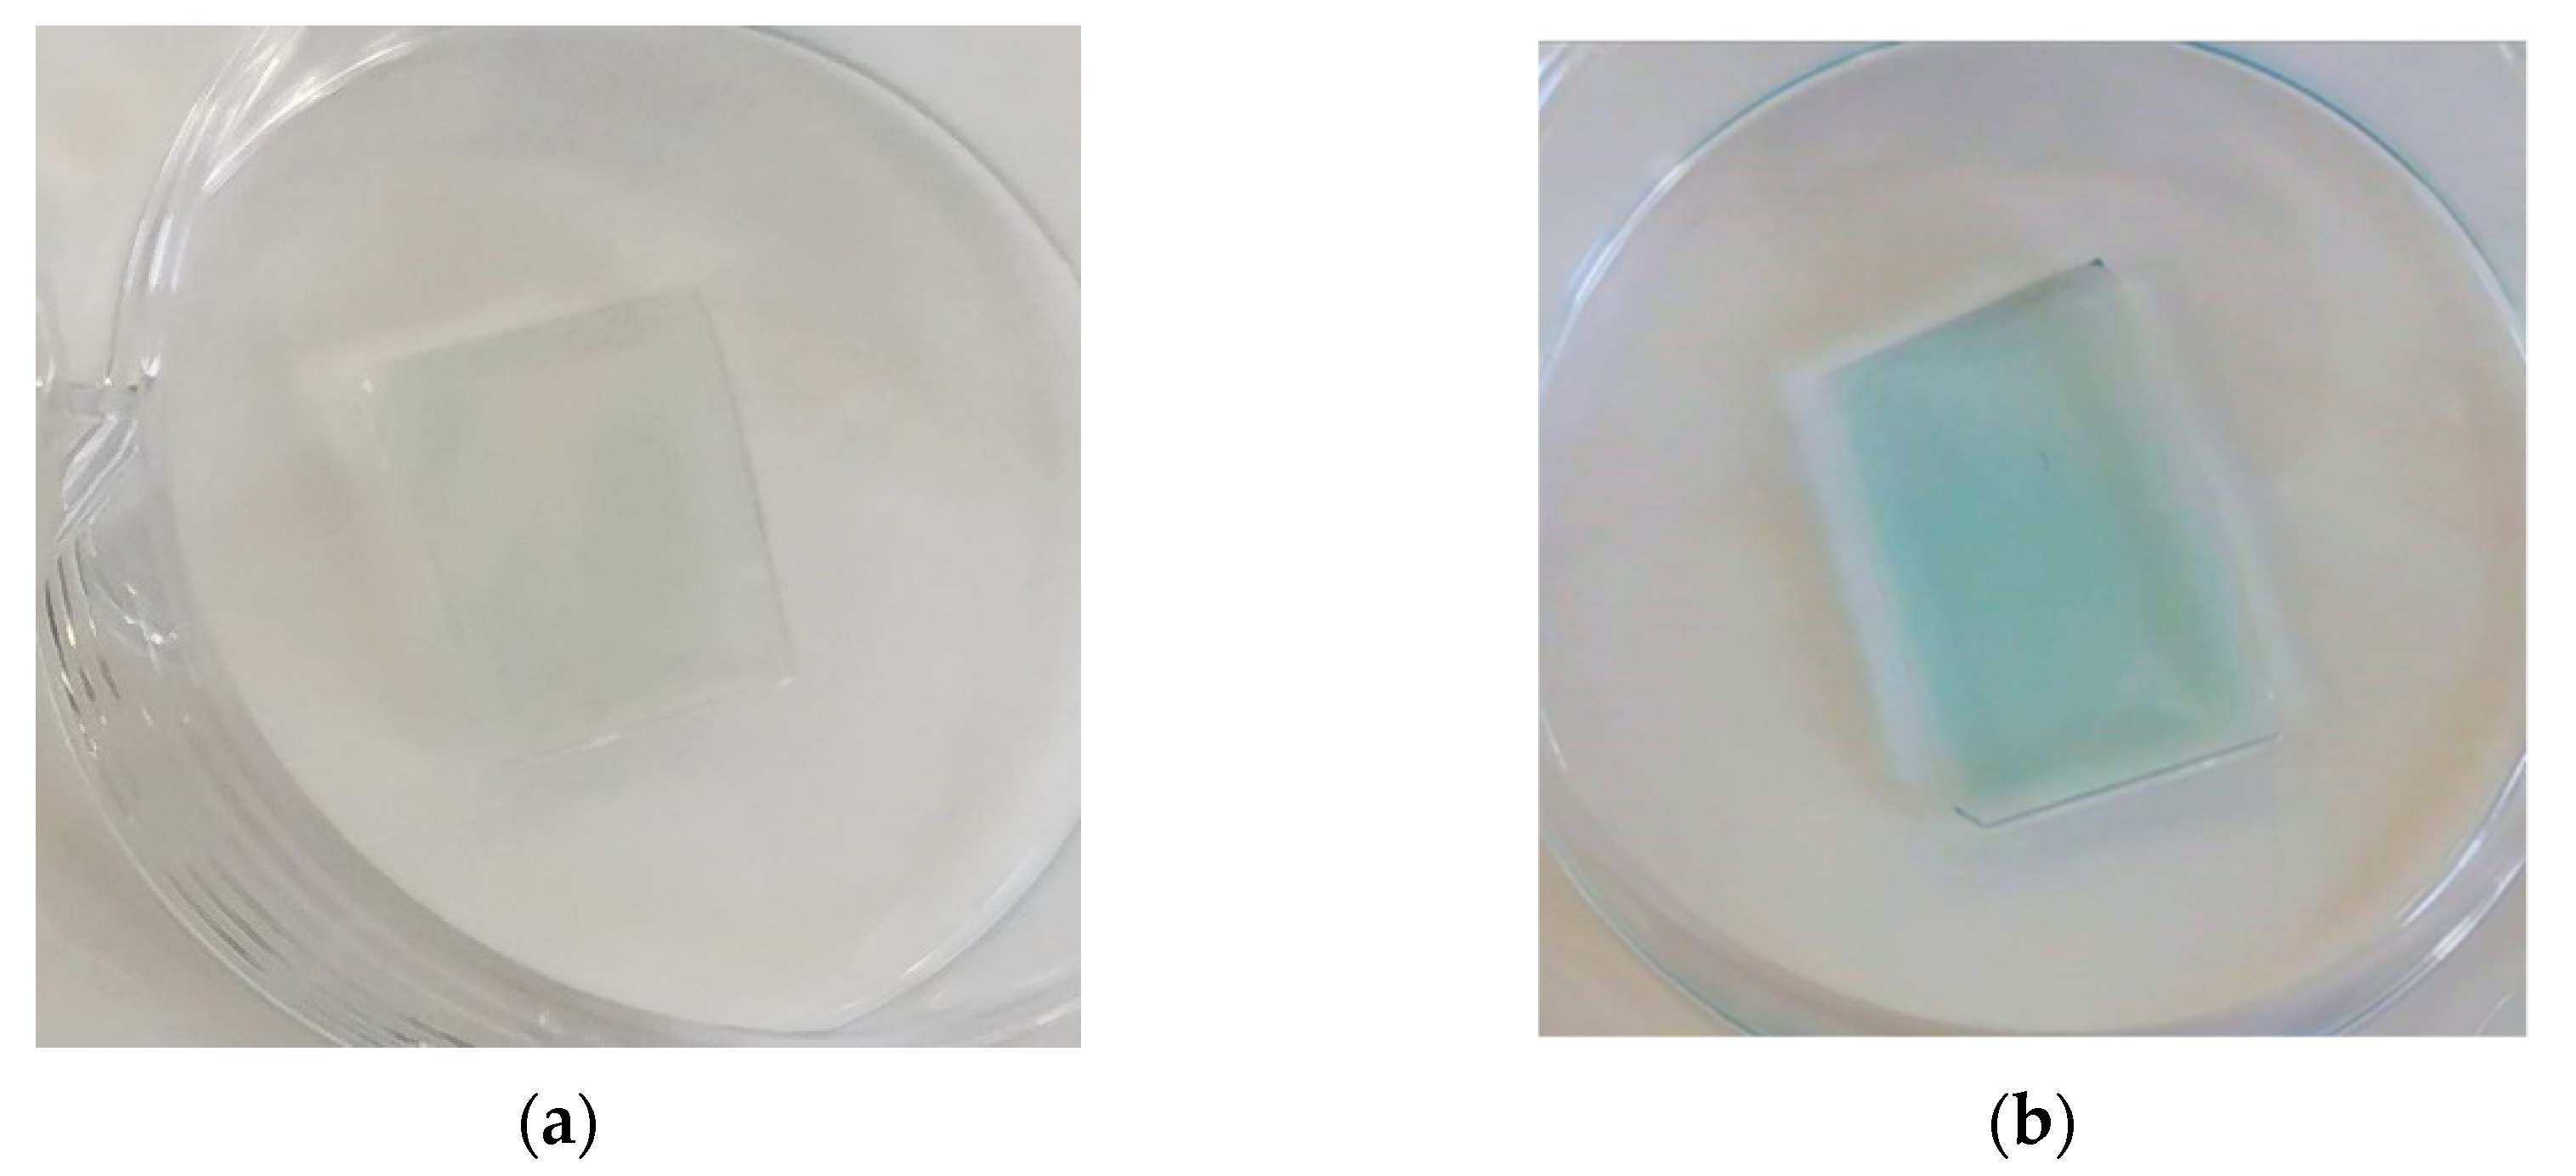
2.2. Formation of an Electrode Coating from ZnO Nanorods
2.3. Immobilization of Ligands on ZnO Nanorods
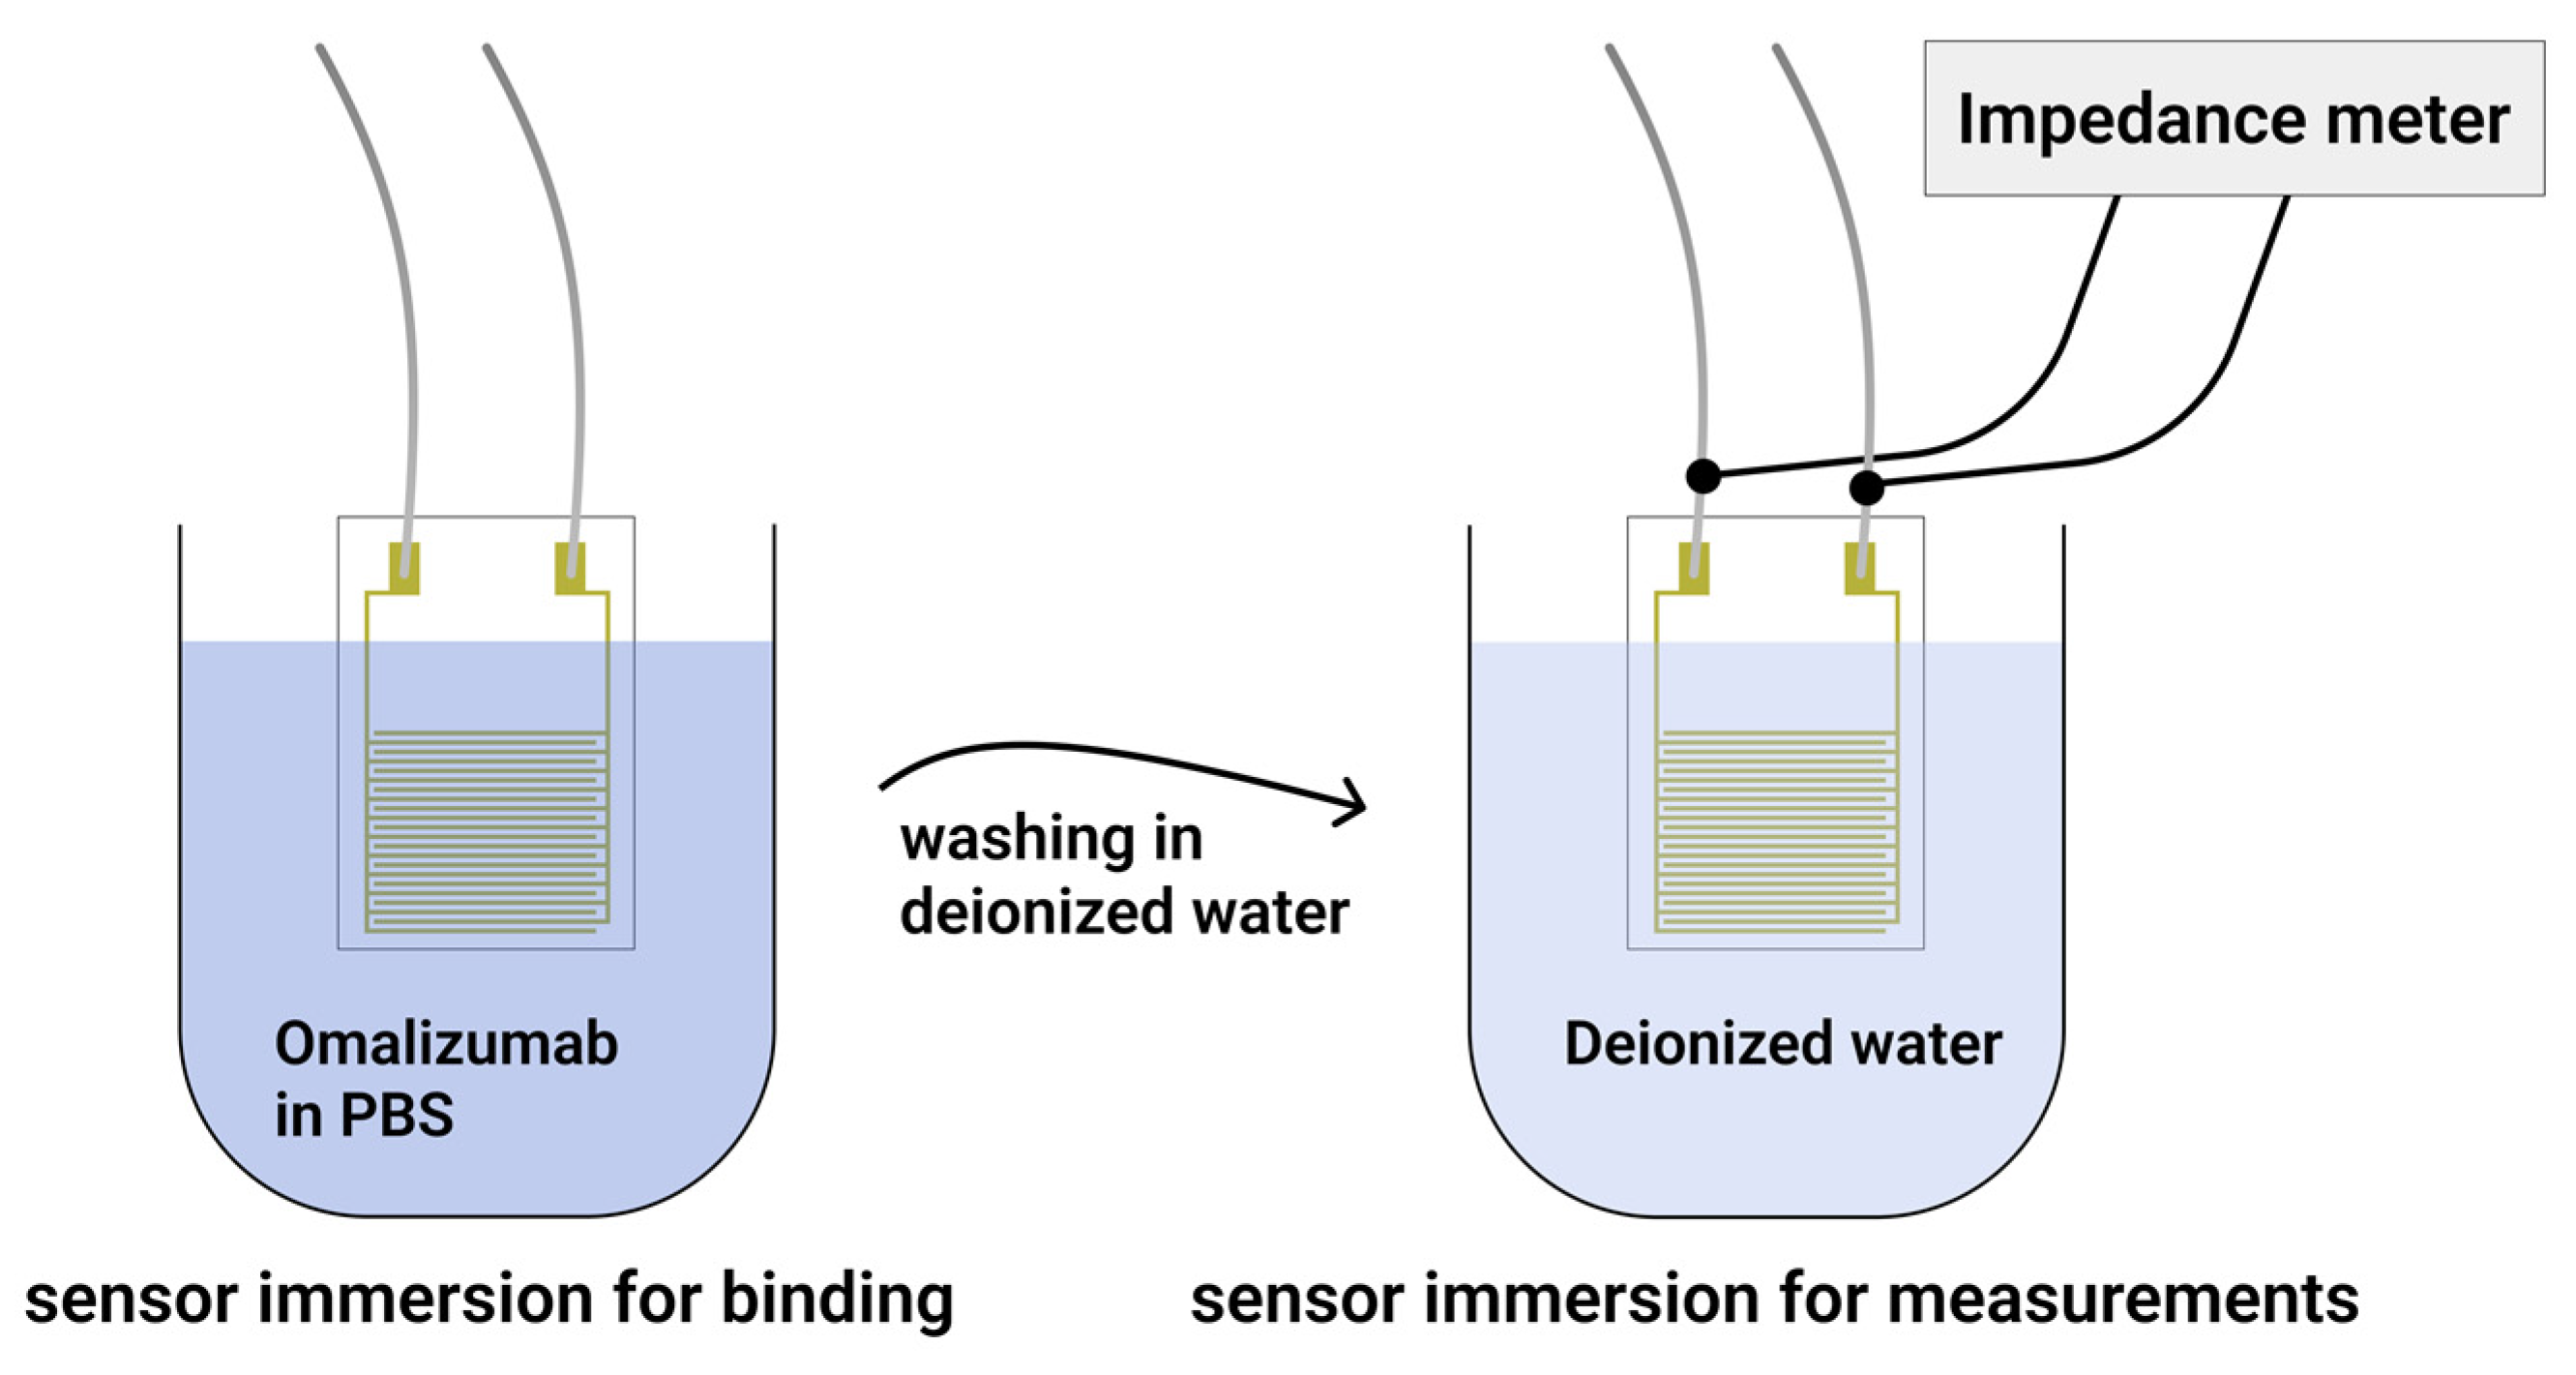
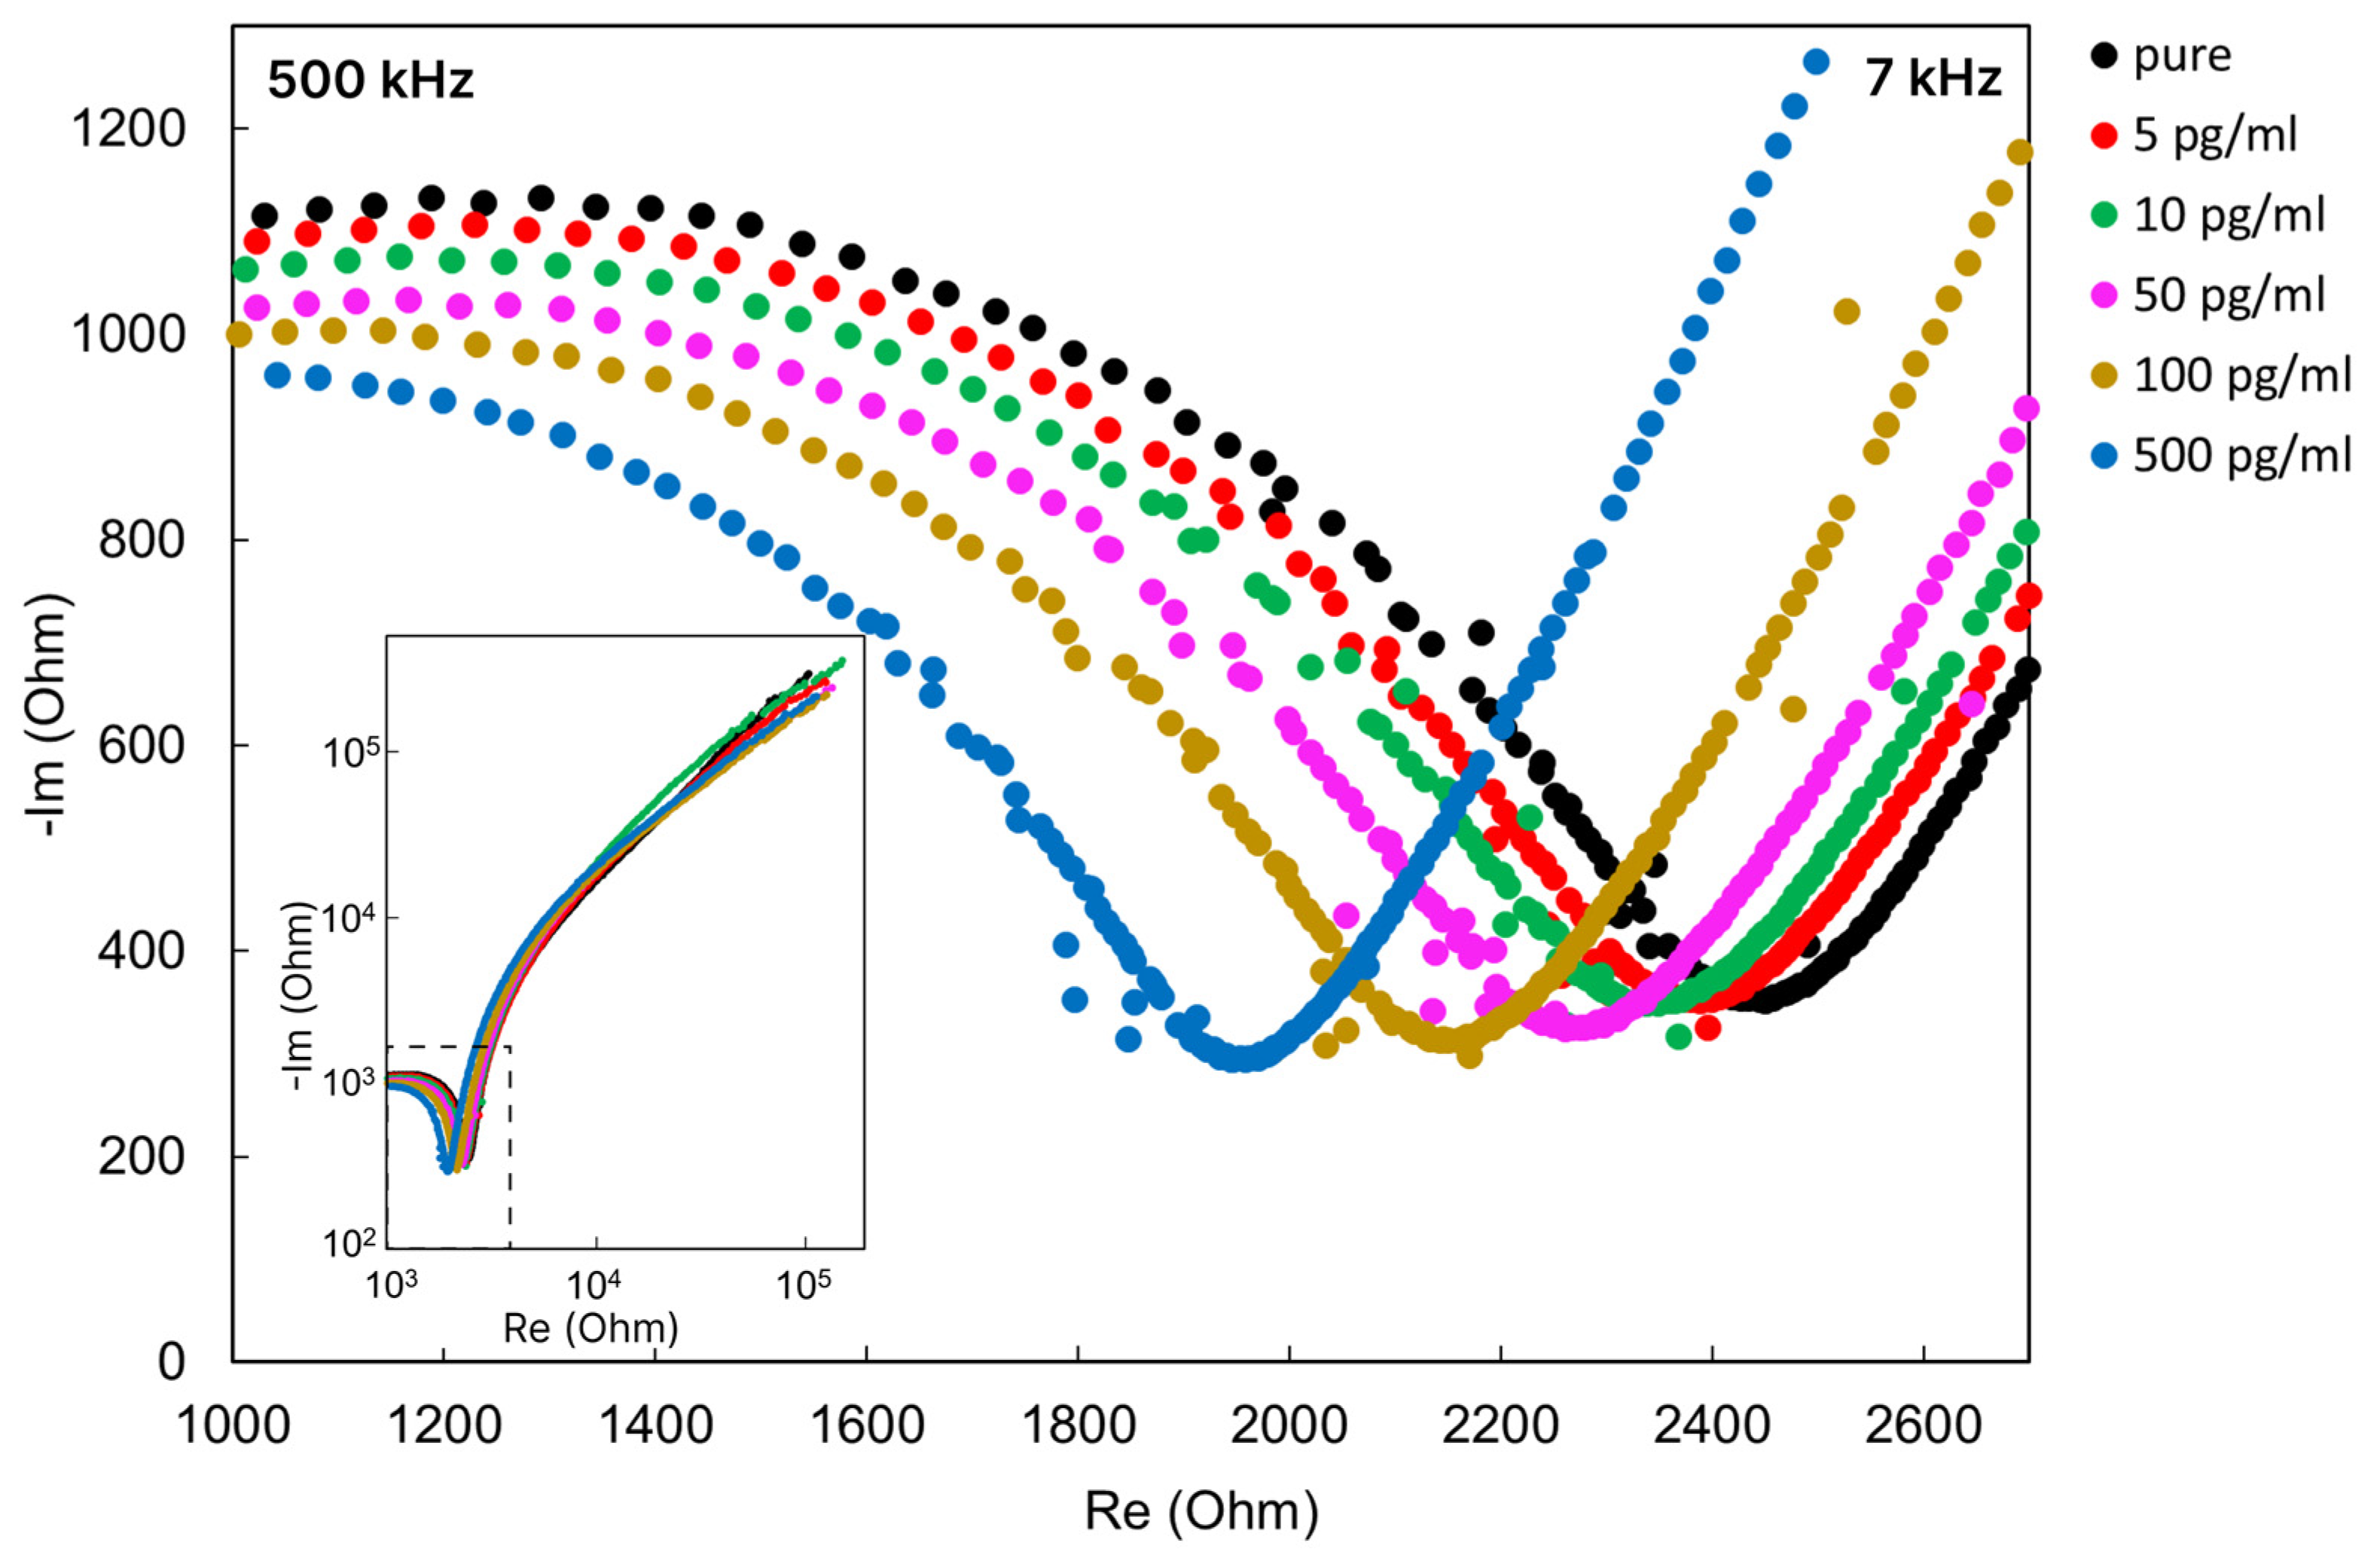
2.4. Impedance Spectroscopy
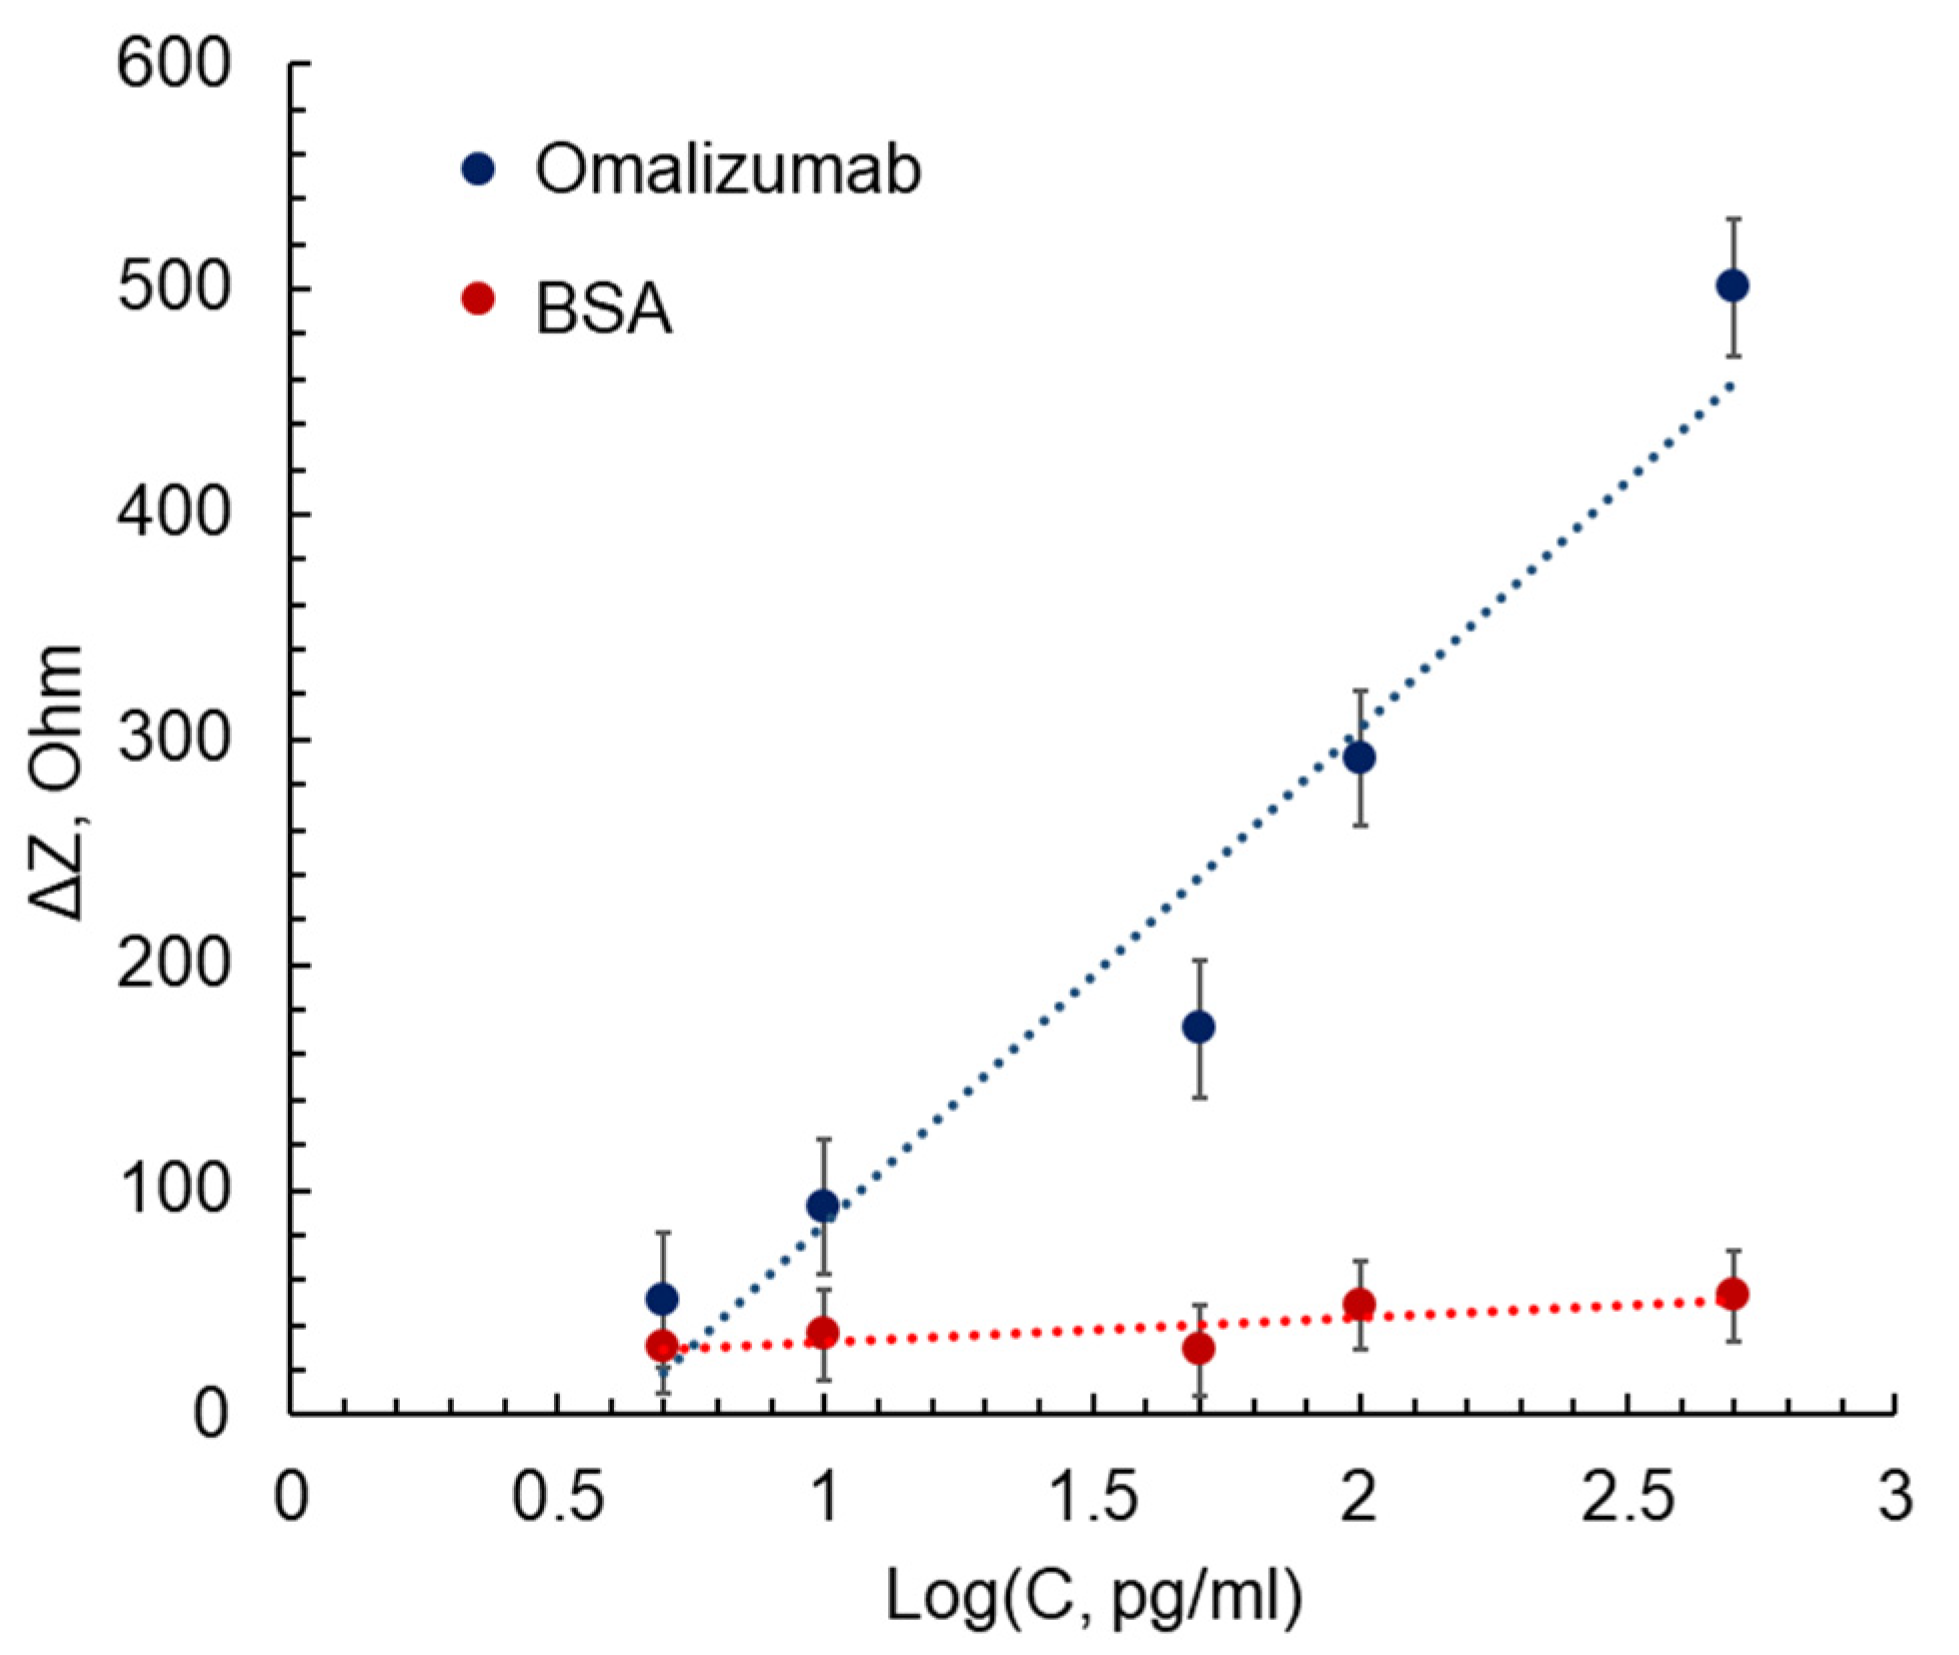
3. Results and Discussion
4. Conclusions
Author Contributions
Funding
Institutional Review Board Statement
Informed Consent Statement
Data Availability Statement
Acknowledgments
Conflicts of Interest
References
- Samuel, V.; Rao, K.J. A Review on Label Free Biosensors. Biosens. Bioelectron. X 2022, 11, 100216. [Google Scholar] [CrossRef]
- Sohrabi, H.; Bolandi, N.; Hemmati, A.; Eyvazi, S.; Ghasemzadeh, S.; Baradaran, B.; Oroojalian, F.; Reza Majidi, M.; de la Guardia, M.; Mokhtarzadeh, A. State-of-the-Art Cancer Biomarker Detection by Portable (Bio) Sensing Technology: A Critical Review. Microchem. J. 2022, 177, 107248. [Google Scholar] [CrossRef]
- Alhalaili, B.; Popescu, I.N.; Rusanescu, C.O.; Vidu, R. Microfluidic Devices and Microfluidics-Integrated Electrochemical and Optical (Bio)Sensors for Pollution Analysis: A Review. Sustainability 2022, 14, 12844. [Google Scholar] [CrossRef]
- Dkhar, D.S.; Kumari, R.; Malode, S.J.; Shetti, N.P.; Chandra, P. Integrated Lab-On-a-Chip Devices: Fabrication Methodologies, Transduction System for Sensing Purposes. J. Pharm. Biomed. Anal. 2023, 223, 115120. [Google Scholar] [CrossRef] [PubMed]
- Jaisankar, A.; Krishnan, S.; Rangasamy, L. Recent Developments of Aptamer-Based Lateral Flow Assays for Point-of-Care (POC) Diagnostics. Anal. Biochem. 2022, 655, 114874. [Google Scholar] [CrossRef] [PubMed]
- Sitkov, N.; Zimina, T.; Kolobov, A.; Sevostyanov, E.; Trushlyakova, V.; Luchinin, V.; Krasichkov, A.; Markelov, O.; Galagudza, M.; Kaplun, D. Study of the Fabrication Technology of Hybrid Microfluidic Biochips for Label-Free Detection of Proteins. Micromachines 2022, 13, 20. [Google Scholar] [CrossRef]
- Calidonio, J.M.; Hamad-Schifferli, K. Biophysical and Biochemical Insights in the Design of Immunoassays. Biochim. Biophys. Acta (BBA)—Gen. Subj. 2023, 1867, 130266. [Google Scholar] [CrossRef]
- Warren, A.D.; Kwong, G.A.; Wood, D.K.; Lin, K.Y.; Bhatia, S.N. Point-of-Care Diagnostics for Noncommunicable Diseases Using Synthetic Urinary Biomarkers and Paper Microfluidics. Proc. Natl. Acad. Sci. USA 2014, 111, 3671–3676. [Google Scholar] [CrossRef] [Green Version]
- Serin, M.; Kara, P. Biosensing Strategies (Approaches) for Diagnosis and Monitoring of Multiple Sclerosis. Talanta 2023, 252, 123794. [Google Scholar] [CrossRef]
- Avgerinos, K.I.; Ferrucci, L.; Kapogiannis, D. Effects of Monoclonal Antibodies against Amyloid-β on Clinical and Biomarker Outcomes and Adverse Event Risks: A Systematic Review and Meta-Analysis of Phase III RCTs in Alzheimer’s Disease. Ageing Res. Rev. 2021, 68, 101339. [Google Scholar] [CrossRef]
- Banerjee, S.; Drapkin, R.; Richardson, D.L.; Birrer, M. Targeting NaPi2b in Ovarian Cancer. Cancer Treat. Rev. 2023, 112, 102489. [Google Scholar] [CrossRef] [PubMed]
- Roberts, A.; Gandhi, S. A Brief Review on Novel Biomarkers Identified and Advanced Biosensing Technologies Developed for Rapid Diagnosis of Japanese Encephalitis Virus. Proc. Indian Natl. Sci. Acad. 2022, 88, 617–662. [Google Scholar] [CrossRef]
- Chen, C.; Lehr, J. Label-free Selective Detection of Protein Markers in the Picomolar Range via a Convenient Voltammetric Sensing Strategy. Electroanalysis 2021, 33, 563–567. [Google Scholar] [CrossRef]
- Qureshi, A.; Gurbuz, Y.; Niazi, J.H. Biosensors for Cardiac Biomarkers Detection: A Review. Sens. Actuators B Chem. 2012, 171–172, 62–76. [Google Scholar] [CrossRef] [Green Version]
- Kimura, H.; Asano, R. Strategies to Simplify Operation Procedures for Applying Labeled Antibody-Based Immunosensors to Point-of-Care Testing. Anal. Biochem. 2022, 654, 114806. [Google Scholar] [CrossRef]
- Menon, S.; Mathew, M.R.; Sam, S.; Keerthi, K.; Kumar, K.G. Recent Advances and Challenges in Electrochemical Biosensors for Emerging and Re-Emerging Infectious Diseases. J. Electroanal. Chem. 2020, 878, 114596. [Google Scholar] [CrossRef]
- Alshanski, I.; Sukhran, Y.; Mervinetsky, E.; Unverzagt, C.; Yitzchaik, S.; Hurevich, M. Electrochemical Biosensing Platform Based on Complex Biantennary N-Glycan for Detecting Enzymatic Sialylation Processes. Biosens. Bioelectron. 2021, 172, 112762. [Google Scholar] [CrossRef]
- Zeng, J.; Duarte, P.A.; Ma, Y.; Savchenko, O.; Shoute, L.; Khaniani, Y.; Babiuk, S.; Zhuo, R.; Abdelrasoul, G.N.; Charlton, C.; et al. An Impedimetric Biosensor for COVID-19 Serology Test and Modification of Sensor Performance via Dielectrophoresis Force. Biosens. Bioelectron. 2022, 213, 114476. [Google Scholar] [CrossRef]
- Soma, F.N.; Khoris, I.M.; Chowdhury, A.D.; Boonyakida, J.; Park, E.Y. Impedimetric Biosensor of Norovirus with Low Variance Using Simple Bioconjugation on Conductive Polymer-Au Nanocomposite. SSRN Electron. J. 2022. [Google Scholar] [CrossRef]
- Solaimuthu, A.; Vijayan, A.N.; Murali, P.; Korrapati, P.S. Nano-Biosensors and Their Relevance in Tissue Engineering. Curr. Opin. Biomed. Eng. 2020, 13, 84–93. [Google Scholar] [CrossRef]
- Zimina, T.M.; Sitkov, N.O.; Gareev, K.G.; Fedorov, V.; Grouzdev, D.; Koziaeva, V.; Gao, H.; Combs, S.E.; Shevtsov, M. Biosensors and Drug Delivery in Oncotheranostics Using Inorganic Synthetic and Biogenic Magnetic Nanoparticles. Biosensors 2022, 12, 789. [Google Scholar] [CrossRef] [PubMed]
- Eivazzadeh-Keihan, R.; Bahojb Noruzi, E.; Chidar, E.; Jafari, M.; Davoodi, F.; Kashtiaray, A.; Ghafori Gorab, M.; Masoud Hashemi, S.; Javanshir, S.; Ahangari Cohan, R.; et al. Applications of Carbon-Based Conductive Nanomaterials in Biosensors. Chem. Eng. J. 2022, 442, 136183. [Google Scholar] [CrossRef]
- Sanguino, P.; Monteiro, T.; Bhattacharyya, S.R.; Dias, C.J.; Igreja, R.; Franco, R. ZnO Nanorods as Immobilization Layers for Interdigitated Capacitive Immunosensors. Sens. Actuators B Chem. 2014, 204, 211–217. [Google Scholar] [CrossRef]
- Yang, W.-C.; Liao, S.-Y.; Phan, T.L.; Van Hieu, N.; Chu, P.-Y.; Yi, C.-C.; Wu, H.-J.; Chang, K.-M.; Ching, C.T.-S. An Immunosensor for the Detection of ULBP2 Biomarker. Micromachines 2020, 11, 568. [Google Scholar] [CrossRef]
- Shanmugam, N.R.; Muthukumar, S.; Selvam, A.P.; Prasad, S. Electrochemical Nanostructured ZnO Biosensor for Ultrasensitive Detection of Cardiac Troponin-T. Nanomedicine 2016, 11, 1345–1358. [Google Scholar] [CrossRef]
- Cao, L.; Kiely, J.; Piano, M.; Luxton, R. Facile and Inexpensive Fabrication of Zinc Oxide Based Bio-Surfaces for C-Reactive Protein Detection. Sci. Rep. 2018, 8, 12687. [Google Scholar] [CrossRef]
- Dong, S.; Zhang, D.; Cui, H.; Huang, T. ZnO/Porous Carbon Composite from a Mixed-Ligand MOF for Ultrasensitive Electrochemical Immunosensing of C-Reactive Protein. Sens. Actuators B Chem. 2019, 284, 354–361. [Google Scholar] [CrossRef]
- Gasparotto, G.; Costa, J.P.C.; Costa, P.I.; Zaghete, M.A.; Mazon, T. Electrochemical Immunosensor Based on ZnO Nanorods-Au Nanoparticles Nanohybrids for Ovarian Cancer Antigen CA-125 Detection. Mater. Sci. Eng. C 2017, 76, 1240–1247. [Google Scholar] [CrossRef] [Green Version]
- Jaiswal, N.; Pandey, C.M.; Solanki, S.; Tiwari, I.; Malhotra, B.D. An Impedimetric Biosensor Based on Electrophoretically Assembled ZnO Nanorods and Carboxylated Graphene Nanoflakes on an Indium Tin Oxide Electrode for Detection of the DNA of Escherichia Coli O157:H7. Microchim. Acta 2019, 187, 1. [Google Scholar] [CrossRef]
- Khosravi-Nejad, F.; Teimouri, M.; Jafari Marandi, S.; Shariati, M. The Highly Sensitive Impedimetric Biosensor in Label Free Approach for Hepatitis B Virus DNA Detection Based on Tellurium Doped ZnO Nanowires. Appl. Phys. A 2019, 125, 616. [Google Scholar] [CrossRef]
- Özgür, Ü.; Alivov, Y.I.; Liu, C.; Teke, A.; Reshchikov, M.A.; Doğan, S.; Avrutin, V.; Cho, S.-J.; Morkoç, H. A Comprehensive Review of ZnO Materials and Devices. J. Appl. Phys. 2005, 98, 041301. [Google Scholar] [CrossRef] [Green Version]
- Bobkov, A.; Varezhnikov, A.; Plugin, I.; Fedorov, F.S.; Trouillet, V.; Geckle, U.; Sommer, M.; Goffman, V.; Moshnikov, V.; Sysoev, V. The Multisensor Array Based on Grown-On-Chip Zinc Oxide Nanorod Network for Selective Discrimination of Alcohol Vapors at Sub-Ppm Range. Sensors 2019, 19, 4265. [Google Scholar] [CrossRef] [PubMed] [Green Version]
- Ryabko, A.A.; Nalimova, S.S.; Maximov, A.I.; Moshnikov, V.A. Investigation of the Gas Sensitivity of Nanostructured Layers Based on Zinc Oxide Nanorods under Ultraviolet Irradiation. In Proceedings of the 2021 IEEE Conference of Russian Young Researchers in Electrical and Electronic Engineering (ElConRus), Moscow, Russia, 26–29 January 2021. [Google Scholar] [CrossRef]
- De Almeida, J.C.; Corrêa, M.T.; Koga, R.H.; Del Duque, D.M.S.; Lopes, O.F.; da Silva, G.T.S.T.; Ribeiro, C.; de Mendonça, V.R. Crystallization Time in ZnO: The Role of Surface OH Groups in Its Photoactivity. New J. Chem. 2020, 44, 18216–18224. [Google Scholar] [CrossRef]
- Al-Sabahi, J.; Bora, T.; Al-Abri, M.; Dutta, J. Controlled Defects of Zinc Oxide Nanorods for Efficient Visible Light Photocatalytic Degradation of Phenol. Materials 2016, 9, 238. [Google Scholar] [CrossRef] [Green Version]
- Redkin, A.N.; Ryzhova, M.V.; Yakimov, E.E.; Gruzintsev, A.N. Aligned Arrays of Zinc Oxide Nanorods on Silicon Substrates. Semiconductors 2013, 47, 252–258. [Google Scholar] [CrossRef]
- Kawakami, M.; Hartanto, A.B.; Nakata, Y.; Okada, T. Synthesis of ZnO Nanorods by Nanoparticle Assisted Pulsed-Laser Deposition. Jpn. J. Appl. Phys. 2003, 42 Pt 2, L33–L35. [Google Scholar] [CrossRef]
- Wu, J.-J.; Liu, S.-C. Low-Temperature Growth of Well-Aligned ZnO Nanorods by Chemical Vapor Deposition. Adv. Mater. 2002, 14, 215–218. [Google Scholar] [CrossRef]
- Kim, S.-W.; Fujita, S.; Fujita, S. ZnO Nanowires with High Aspect Ratios Grown by Metalorganic Chemical Vapor Deposition Using Gold Nanoparticles. Appl. Phys. Lett. 2005, 86, 153119. [Google Scholar] [CrossRef] [Green Version]
- Tien, L.C.; Norton, D.P.; Pearton, S.J.; Wang, H.-T.; Ren, F. Nucleation Control for ZnO Nanorods Grown by Catalyst-Driven Molecular Beam Epitaxy. Appl. Surf. Sci. 2007, 253, 4620–4625. [Google Scholar] [CrossRef]
- Li, G.-R.; Dawa, C.-R.; Bu, Q.; Zhen, F.; Lu, X.-H.; Ke, Z.-H.; Hong, H.-E.; Yao, C.-Z.; Liu, P.; Tong, Y.-X. Electrochemical Synthesis of Orientation-Ordered ZnO Nanorod Bundles. Electrochem. Commun. 2007, 9, 863–868. [Google Scholar] [CrossRef]
- Di Mauro, A.; Zimbone, M.; Fragalà, M.E.; Impellizzeri, G. Synthesis of ZnO Nanofibers by the Electrospinning Process. Mater. Sci. Semicond. Processing 2016, 42, 98–101. [Google Scholar] [CrossRef]
- Joo, J.; Chow, B.Y.; Prakash, M.; Boyden, E.S.; Jacobson, J.M. Face-Selective Electrostatic Control of Hydrothermal Zinc Oxide Nanowire Synthesis. Nat. Mater. 2011, 10, 596–601. [Google Scholar] [CrossRef] [Green Version]
- Xu, S.; Wang, Z.L. One-Dimensional ZnO Nanostructures: Solution Growth and Functional Properties. Nano Res. 2011, 4, 1013–1098. [Google Scholar] [CrossRef] [Green Version]
- Zhang, Y.; Zhang, Z.; Rong, S.; Yu, H.; Gao, H.; Sha, Q.; Ding, P.; Pan, H.; Chang, D. A Sandwich-Type ECL Immunosensor Based on Signal Amplification Using a ZnO Nanorods-L-Cysteine-Luminol Nano-composite for Ultrasensitive Detection of Prostate Specific Antigen. Anal. Chim. Acta 2020, 1109, 98–106. [Google Scholar] [CrossRef] [PubMed]
- Eveness, J.; Cao, L.; Kiely, J.; Luxton, R. Equivalent Circuit Model of a Non-Faradaic Impedimetric ZnO Nano-Crystal Biosensor. J. Electroanal. Chem. 2022, 906, 116003. [Google Scholar] [CrossRef]
- McCarthy, M.W.; Aguilar-Zapata, D.; Petraitis, V.; Walsh, T.J. Diagnosis, Classification, and Therapeutic Interventions for Sinopulmonary Aspergillosis. Expert Rev. Respir. Med. 2017, 11, 229–238. [Google Scholar] [CrossRef] [PubMed]
- Hober, S.; Nord, K.; Linhult, M. Protein A Chromatography for Antibody Purification. J. Chromatogr. B 2007, 848, 40–47. [Google Scholar] [CrossRef]
- Ryabko, A.A.; Maximov, A.I.; Verbitskii, V.N.; Levitskii, V.S.; Moshnikov, V.A.; Terukov, E.I. Two-Stage Synthesis of Structured Microsystems Based on Zinc-Oxide Nanorods by Ultrasonic Spray Pyrolysis and the Low-Temperature Hydrothermal Method. Semiconductors 2020, 54, 1496–1502. [Google Scholar] [CrossRef]
- Khan, S.; Rasheed, M.A.; Rafiq, M.A.; Shah, G.B.; Rehman, W.; Jamil, A.; Khan, Y. Silanization of ZnO Nanofibers by Tetraethoxysilane. J. Appl. Polym. Sci. 2017, 134, 45378. [Google Scholar] [CrossRef]
- García Núñez, C.; Sachsenhauser, M.; Blashcke, B.; García Marín, A.; Garrido, J.A.; Pau, J.L. Effects of Hydroxylation and Silanization on the Surface Properties of ZnO Nanowires. ACS Appl. Mater. Interfaces 2015, 7, 5331–5337. [Google Scholar] [CrossRef] [Green Version]
- Kondratev, V.M.; Morozov, I.A.; Vyacheslavova, E.A.; Kirilenko, D.A.; Kuznetsov, A.; Kadinskaya, S.A.; Nalimova, S.S.; Moshnikov, V.A.; Gudovskikh, A.S.; Bolshakov, A.D. Silicon Nanowire-Based Room-Temperature Multi-Environment Ammonia Detection. ACS Appl. Nano Mater. 2022, 5, 9940–9949. [Google Scholar] [CrossRef]
- Erickson, H.P. Size and Shape of Protein Molecules at the Nanometer Level Determined by Sedimentation, Gel Filtration, and Electron Microscopy. Biol. Proced. Online 2009, 11, 32–51. [Google Scholar] [CrossRef] [PubMed] [Green Version]
- Iaiche, S.; Djelloul, A. ZnO/ZnAl2O4Nanocomposite Films Studied by X-ray Diffraction, FTIR, and X-Ray Photoelectron Spectroscopy. J. Spectrosc. 2015, 2015, 836859. [Google Scholar] [CrossRef] [Green Version]
- Kwoka, M.; Kulis-Kapuscinska, A.; Zappa, D.; Comini, E.; Szuber, J. Novel Insight on the Local Surface Properties of ZnO Nanowires. Nanotechnology 2020, 31, 465705. [Google Scholar] [CrossRef] [PubMed]
- Al-Gaashani, R.; Radiman, S.; Daud, A.R.; Tabet, N.; Al-Douri, Y. XPS and Optical Studies of Different Morphologies of ZnO Nanostructures Prepared by Microwave Methods. Ceram. Int. 2013, 39, 2283–2292. [Google Scholar] [CrossRef]
- Grånäs, E.; Busch, M.; Arndt, B.; Creutzburg, M.; Semione, G.D.L.; Gustafson, J.; Schaefer, A.; Vonk, V.; Grönbeck, H.; Stierle, A. Role of Hydroxylation for the Atomic Structure of a Non-Polar Vicinal Zinc Oxide. Commun. Chem. 2021, 4, 7. [Google Scholar] [CrossRef]
- Heinhold, R.; Allen, M.W. Polarity-Dependent Photoemission of in Situ Cleaved Zinc Oxide Single Crystals. J. Mater. Res. 2012, 27, 2214–2219. [Google Scholar] [CrossRef]
- Schipani, F.; Miller, D.R.; Ponce, M.A.; Aldao, C.M.; Akbar, S.A.; Morris, P.A.; Xu, J.C. Conduction Mechanisms in SnO2 Single-Nanowire Gas Sensors: An Impedance Spectroscopy Study. Sens. Actuators B Chem. 2017, 241, 99–108. [Google Scholar] [CrossRef]
- Mei, B.-A.; Munteshari, O.; Lau, J.; Dunn, B.; Pilon, L. Physical Interpretations of Nyquist Plots for EDLC Electrodes and Devices. J. Phys. Chem. C 2017, 122, 194–206. [Google Scholar] [CrossRef]
- Tran, D.T.; Vermeeren, V.; Grieten, L.; Wenmackers, S.; Wagner, P.; Pollet, J.; Janssen, K.P.F.; Michiels, L.; Lammertyn, J. Nano-crystalline Diamond Impedimetric Aptasensor for the Label-Free Detection of Human IgE. Biosens. Bioelectron. 2011, 26, 2987–2993. [Google Scholar] [CrossRef]
- Narang, J.; Malhotra, N.; Singh, G.; Pundir, C.S. Electrochemical Impediometric Detection of Anti-HIV Drug Taking Gold Nano-rods as a Sensing Interface. Biosens. Bioelectron. 2015, 66, 332–337. [Google Scholar] [CrossRef]
- Schmidt-Speicher, L.M.; Länge, K. Microfluidic Integration for Electrochemical Biosensor Applications. Curr. Opin. Electrochem. 2021, 29, 100755. [Google Scholar] [CrossRef]
- Nah, J.S.; Barman, S.C.; Zahed, M.A.; Sharifuzzaman, M.; Yoon, H.; Park, C.; Yoon, S.; Zhang, S.; Park, J.Y. A Wearable Microfluidics-Integrated Impedimetric Immunosensor Based on Ti3C2T MXene Incorporated Laser-Burned Graphene for Noninvasive Sweat Cortisol Detection. Sens. Actuators B Chem. 2021, 329, 129206. [Google Scholar] [CrossRef]
- Upasham, S.; Banga, I.K.; Jagannath, B.; Paul, A.; Lin, K.-C.; Muthukumar, S.; Prasad, S. Electrochemical Impedimetric Biosensors, Featuring the Use of Room Temperature Ionic Liquids (RTILs): Special Focus on Non-Faradaic Sensing. Biosens. Bioelectron. 2021, 177, 112940. [Google Scholar] [CrossRef] [PubMed]
- Antiochia, R. Electrochemical Biosensors for SARS-CoV-2 Detection: Voltametric or Impedimetric Transduction? Bioelectrochemistry 2022, 147, 108190. [Google Scholar] [CrossRef]
- Magar, H.S.; Hassan, R.Y.A.; Mulchandani, A. Electrochemical Impedance Spectroscopy (EIS): Principles, Construction, and Biosensing Applications. Sensors 2021, 21, 6578. [Google Scholar] [CrossRef]
- Sitkov, N.; Zimina, T.; Kolobov, A.; Karasev, V.; Romanov, A.; Luchinin, V.; Kaplun, D. Toward Development of a Label-Free Detection Technique for Microfluidic Fluorometric Peptide-Based Biosensor Systems. Micromachines 2021, 12, 691. [Google Scholar] [CrossRef]
- Karasev, V. Data on the Application of the Molecular Vector Machine Model: A Database of Protein Pentafragments and Computer Software for Predicting and Designing Secondary Protein Structures. Data Brief 2020, 28, 104815. [Google Scholar] [CrossRef]


Disclaimer/Publisher’s Note: The statements, opinions and data contained in all publications are solely those of the individual author(s) and contributor(s) and not of MDPI and/or the editor(s). MDPI and/or the editor(s) disclaim responsibility for any injury to people or property resulting from any ideas, methods, instructions or products referred to in the content. |
© 2023 by the authors. Licensee MDPI, Basel, Switzerland. This article is an open access article distributed under the terms and conditions of the Creative Commons Attribution (CC BY) license (https://creativecommons.org/licenses/by/4.0/).
Share and Cite
Sitkov, N.; Ryabko, A.; Kolobov, A.; Maximov, A.; Moshnikov, V.; Pshenichnyuk, S.; Komolov, A.; Aleshin, A.; Zimina, T. Impedimetric Biosensor Coated with Zinc Oxide Nanorods Synthesized by a Modification of the Hydrothermal Method for Antibody Detection. Chemosensors 2023, 11, 66. https://doi.org/10.3390/chemosensors11010066
Sitkov N, Ryabko A, Kolobov A, Maximov A, Moshnikov V, Pshenichnyuk S, Komolov A, Aleshin A, Zimina T. Impedimetric Biosensor Coated with Zinc Oxide Nanorods Synthesized by a Modification of the Hydrothermal Method for Antibody Detection. Chemosensors. 2023; 11(1):66. https://doi.org/10.3390/chemosensors11010066
Chicago/Turabian StyleSitkov, Nikita, Andrey Ryabko, Alexey Kolobov, Alexsandr Maximov, Vyacheslav Moshnikov, Stanislav Pshenichnyuk, Alexei Komolov, Andrey Aleshin, and Tatiana Zimina. 2023. "Impedimetric Biosensor Coated with Zinc Oxide Nanorods Synthesized by a Modification of the Hydrothermal Method for Antibody Detection" Chemosensors 11, no. 1: 66. https://doi.org/10.3390/chemosensors11010066