Article

Sr2TiSi2O8 (STS) Polar Glass-Ceramics: Effect of Na2O and CaO Additions in the Parent Glass on the Crystallization Mechanism and on the Piezoelectric Properties

1
Materials Institute, University of Mons, Rue de l’Epargne 56, 7000 Mons, Belgium
2
Faculty of Science and Technology, University of Guelma, BP 401, Guelma 24000, Algeria
3
Belgian Ceramic Research Center, Avenue Gouverneur Cornez 4, 7000 Mons, Belgium
*
Author to whom correspondence should be addressed.
Ceramics 2023, 6(1), 1-15; https://doi.org/10.3390/ceramics6010001
Submission received: 21 November 2022 / Revised: 16 December 2022 / Accepted: 3 January 2023 / Published: 6 January 2023
(This article belongs to the Special Issue Advances in Ceramics)

Abstract

:
Glass-ceramics containing pyroelectric Sr2TiSi2O8 (STS) crystals are produced from parent glasses of compositions STS + 0.8 SiO2 + (0.2 − x) Na2O + x CaO, with x = 0; 0.05; 0.10; and 0.15. The aim of this work is to investigate the effect of the additions to the stoichiometric STS composition on the crystallization mechanisms and on the piezoelectric properties of the glass-ceramic. The DSC analyses evidence that the glass transition temperatures Tg, the onset temperature of the crystallization peak To and the temperature Tc of the maximum of this peak increase with the CaO/Na2O ratio. On the basis of the DSC data, the crystallization of the parent glass samples was operated by thermal treatment. The observation of the cross-sections of the heat-treated samples highlights that the competition between the surface and volume crystallization mechanisms is influenced by the CaO/Na2O ratio and the temperature. For all the samples, the XRD analyses performed on the surfaces as obtained after the crystallization treatment evidenced a preferential orientation of the STS crystals with the plans (00l) parallel to the surface. The XRD analyses performed after grinding the surface show that only the surface crystallized layers are preferentially oriented. Moreover, changes in preferential orientation to plans (202) or (201) are observed over the depth, depending on the composition and the temperature of the thermal treatment. These changes influence the polarization of the surface crystallized layer and, consequently, its piezoelectric charge coefficient d33. The highest values of d33 were measured on the glass-ceramic samples exhibiting mainly a (202) preferential orientation over their thickness.

1. Introduction

Piezoelectric ceramics are functional materials widely used for the design of sensors, actuators, transducers, resonators, etc. [1]. In most cases, these ceramics are composed of crystalline phases belonging to the pyroelectric ferroelectric group, such as barium titanate BaTiO3 and lead zirconate titanate PZT [2,3]. Ferroelectric crystals are divided into polar domains in which all the dipole moments show the same orientation. They exhibit high piezoelectric performances due to the large contribution of the motion of the wall domains to the electromechanical response. However, to be used in piezoelectric devices, ferroelectrics are firstly poled by applying a strong external electric field, which leads to a remanent polarization. The consequence is an out of equilibrium state, and, subsequently, a slow depolarization over time leading to the degradation of the piezoelectric characteristics [4]. The depolarization accelerates as the temperature comes close to the Curie temperature so that the maximum service temperature of a ferroelectric is about one-half of its Curie temperature [5]. A few pyroelectric compounds are not divided in polar domains, and thus, are not ferroelectric. These can be used in a piezoelectric device only in the form of single crystals or, alternatively, preferentially oriented polycrystalline materials. In addition, due to the absence of the contribution of the wall domains’ motion, the piezoelectric properties of these compounds are significantly lower than those of ferroelectrics. On the other hand, their piezoelectric properties are highly stable over time even at high temperatures.
In the early 1980s, Halliyal et al. studied the synthesis of polar materials by the glass-ceramics route [6,7,8,9]. They showed that a preferential orientation of the crystal growth can be obtained with non-ferroelectric pyroelectric crystals. Among the non-ferroelectric pyroelectric compounds are the fresnoite type barium titanium silicate Ba2TiSi2O8 (BTS) and strontium titanium silicate Sr2TiSi2O8 (STS). They both crystallize in the tetragonal system (space group P4bm) and their lattice parameters are a = 852.91 pm, c = 521.10 pm and a = 832.18 pm, c = 502.92 pm, respectively [10,11,12]. The electric dipole of the unit cell is parallel to the c-axis. Numerous works have been published on fresnoite glass-ceramics and are detailed in the review of Wolfgang Wisniewski et al. [13]. This review highlights a piezoelectric charge coefficient d33 within the range 10–15 pC/N, and a high stability up to temperatures over 1000 °C. Therefore, fresnoite glass-ceramics must be considered as promising materials for high-temperature piezoelectric devices. In their paper, Davis et al. [14] highlight the potential of these glass-ceramics for applications such as accelerometers for turbine engines or pressure sensors. In a previous paper [15], we demonstrated the ability of an STS glass-ceramic to generate and propagate SAW up to a temperature of 900 °C.
As pyroelectric but non-ferroelectric polycrystalline materials, fresnoite glass-ceramics must possess a textured microstructure (i.e., preferential orientation of the polar crystal direction) to show a macroscopic piezoelectric behavior [7,16]. With the glass-ceramics process, the final microstructure is controlled by the crystallization treatment. Generally, a preferential orientation of the crystal growth in glasses is observed when devitrification occurs from the surfaces [17,18]. However, the competition between surface and volume crystallization is a complex phenomenon depending on many parameters such as the glass composition, surface state and thermal treatment parameters. As well as studies on the influence of the composition of the parent glass on the crystallization mechanism, specific crystallization conditions have also been tested to promote the preferential orientation of the crystals’ growth: thermal gradient [7,19]; electrochemical nucleation [20,21,22]; and ultrasonic surface treatment with crystalline fresnoite particles [23]. The literature highlights that polar STS glass-ceramics can be obtained from suitable parent glass compositions that lead to a surface crystallization mechanism that favors a preferential orientation of the crystal growth by kinetic selection. A silica excess with respect to the STS stoichiometry is needed to successfully melt the parent glass and avoid a strong volume crystallization during the devitrification treatment [22]. At the surface, a preferential orientation of the STS (00l) plans is usually observed but is rarely kept in the bulk [24]. N. Maury et al. [25] investigated the synthesis STS glass-ceramics from parent glasses in the SrO–TiO2–SiO2–K2O–B2O3 system. All the compositions tested showed a surface crystallization mechanism during an isothermal heat treatment at 900 °C. This led to the preferential orientation of the (002) plans at the surfaces. However, only glasses with a low content of K2O kept this preferential orientation in the bulk. From a parent glass of composition 2 SrO 1 TiO2 2.75 SiO2, Patschger et al. [26] also highlighted the preferential orientation of the STS (002) plans at the surfaces. However, the preferential orientation changes the benefit of the (201) plans in depth. They also showed that the piezoelectric coefficient d33 of the (201) oriented glass-ceramic is high and is dependent on the initial (002) orientation at the surface. Wisniewski et al. explained the preferential orientation of the (00l) plans at the surface from the crystal structure and the diffusion rates of the atoms in the parent glass [27]. The lattice planes with the highest number of network formers per area are parallel to the surfaces. The change in the preferential orientation occurring in the bulk is related to the fastest growing crystallographic direction. M-S. Renoirt et al. [28,29] investigated the crystallization of STS from parent glasses belonging to the SrO–TiO2–SiO2–Al2O3–K2O system. The composition 2 SrO 1 TiO2 3.3 SiO2 0.2 K2O 0.1 Al2O3, crystallized at 900 °C, shows the best crystal orientation but reproducibility tests highlight that the (002) preferential orientation observed at the surface most of the time changes to (201) after a depth of about 300 µm. Despite this, the charge coefficient d33 reaches 11 to 12 pC/N and is not significantly influenced by the preferential orientation (002) or (201). In addition, high-temperature XRD shows the stability of the STS phase in this glass-ceramic up to 1000 °C. This glass-ceramic was used by Dupla et al. to demonstrate the possibility to realize and operate a SAW device at high temperature [15].
In the present paper, we investigate the synthesis of STS glass-ceramics from parent glasses of compositions STS + 0.8 SiO2 + (0.2 − x) Na2O + x CaO, with x = 0; 0.05; 0.10; and 0.15 (i.e., CaO/Na2O = 0; 0.33; 1; and 3). Our aim is to study the influence of the additions to the stoichiometric STS composition on the surface or volume crystallization mechanisms and the changes in the preferential orientation of STS crystals over depth. The piezoelectric properties of these glass-ceramics are discussed with respect to the polarization induced by the preferential orientation.

2. Materials and Methods

Four parent glass compositions (Table 1) were prepared according to the procedure presented in reference [28]. Reagent grade SrCO3 (Alfa Aesar, Karlsruhe, Germany, 99.99%), TiO2 (VWR, Fontenay sous Bois, France, 99.99%), SiO2 (Sigrano, Maastricht, The Netherlands, 97–99.98%), CaCO3 and Na2CO3 (VWR, Fontenay sous Bois, France, +99%) were wet-mixed in isopropanol. After complete evaporation of the isopropanol, the melting of the powder mix was realized in a Pt/Au 95/5 crucible at 1500 °C for 2 h, thanks to a furnace Nabertherm HT 16/18. The melt was cast in 70 × 70 × 6 mm3 plates, in a steel mold. To release internal stresses and avoid cracks, these plates were annealed for 2 h at 700 °C, before slow cooling inside the turned off furnace. Each glass plate was surface polished (grade 220) and cut in parallelepipeds of 20 × 20 × 5 mm3.
Glass transition temperatures (Tg) of parent glasses are obtained from DSC analyses performed on a NETZSCH STA 449 F3 Jupiter (Erich NETZSCH GmbH & Co. Holding KG, Selb, Germany) with a heating rate of 10 °C/min. DSC is also used for the characterization of the crystallization by the measurement of the onset temperature To and the temperature Tc of the maximum of the crystallization. Analyses are realized on 30–40 mg of parent glass powders (sieved at 40 µm).
A TOMMI optical dilatometer (Fraunhofer Institut Silicatforschung, Wertheim, Germany) is also used to characterize the beginning of the crystallization on paralepidid samples (about 20 × 20 × 5 mm3) of the parent glasses. The principle is to follow-up the opacification of the glass by the measurement of the normalized transmitted intensity by the analysis of images taken from the camera of the equipment as illustrated in Figure 1.
The crystallization treatments were performed in air in a furnace Nabertherm LT 40/12. The following temperature schedule was applied:
-
5 °C/min from room temperature to targeted temperature;
-
Dwell times from 0.5 of 20 h;
-
Slow cooling in switch-off furnace.
Assuming that after the crystallization treatment all the strontium and titanium atoms are in the STS crystals, the theoretical weight fraction of STS in the final glass-ceramic is about 87% for all the compositions.
Crystalline phase analyses were carried out by XRD with a Siemens D5000 θ-2θ diffractometer, in the Bragg–Brentano configuration, using a Co Kα radiation source and an Fe filter. Possible preferential orientations of STS crystals were qualitatively evaluated by comparing the relative intensities of the peaks with those of the reference card PDF # 00-39-0228 [30]. Considering that the absorption of X-rays by the analyzed sample follows the Beer–Lambert law, in the case of a Bragg–Brentano configuration (Figure 2), the intensity Iλ(z) of the radiation emerging out of the sample after diffraction at a depth z is given by the relation (1):
I λ ( z ) = I λ 0 e x p ( μ · 2 z s i n θ )
with μ the linear absorption coefficient of the material and I λ 0 the intensity of the incident radiation.
The relative contribution R(z) of emerging radiation for depth > z to intensity diffracted signal is given by (2):
R ( z ) = z e x p ( μ · 2 z s i n θ ) 0 e x p ( μ · 2 z s i n θ ) = e x p ( μ · 2 z s i n θ )
Considering their composition and density, the linear absorption coefficient µ of the studied glass-ceramics for the Co kα radiation is about 0.0430 µm−1. Figure 3 shows that the contribution to the diffracted intensity mostly comes from the first 10 µm and becomes negligible for depths above 20 µm.
The piezoelectric charge coefficients d33 of the glass-ceramics are measured by means of a PIEZOTESTER PM 300 (Piezotest Pte. Ltd., Singapore).
Optical microscope images of the polished cross-sections of the samples are realized thanks to a digital microscope HIROX KH-8700 3D (Hirox Co.,Ltd., Tokyo, Japan).
Parent glasses and glass-ceramics densities are calculated by Archimedes method in water with specimens of about 10 g and using a 0.001 accurate scale. Each measurement is repeated three times on three specimens of the same type.

3. Results

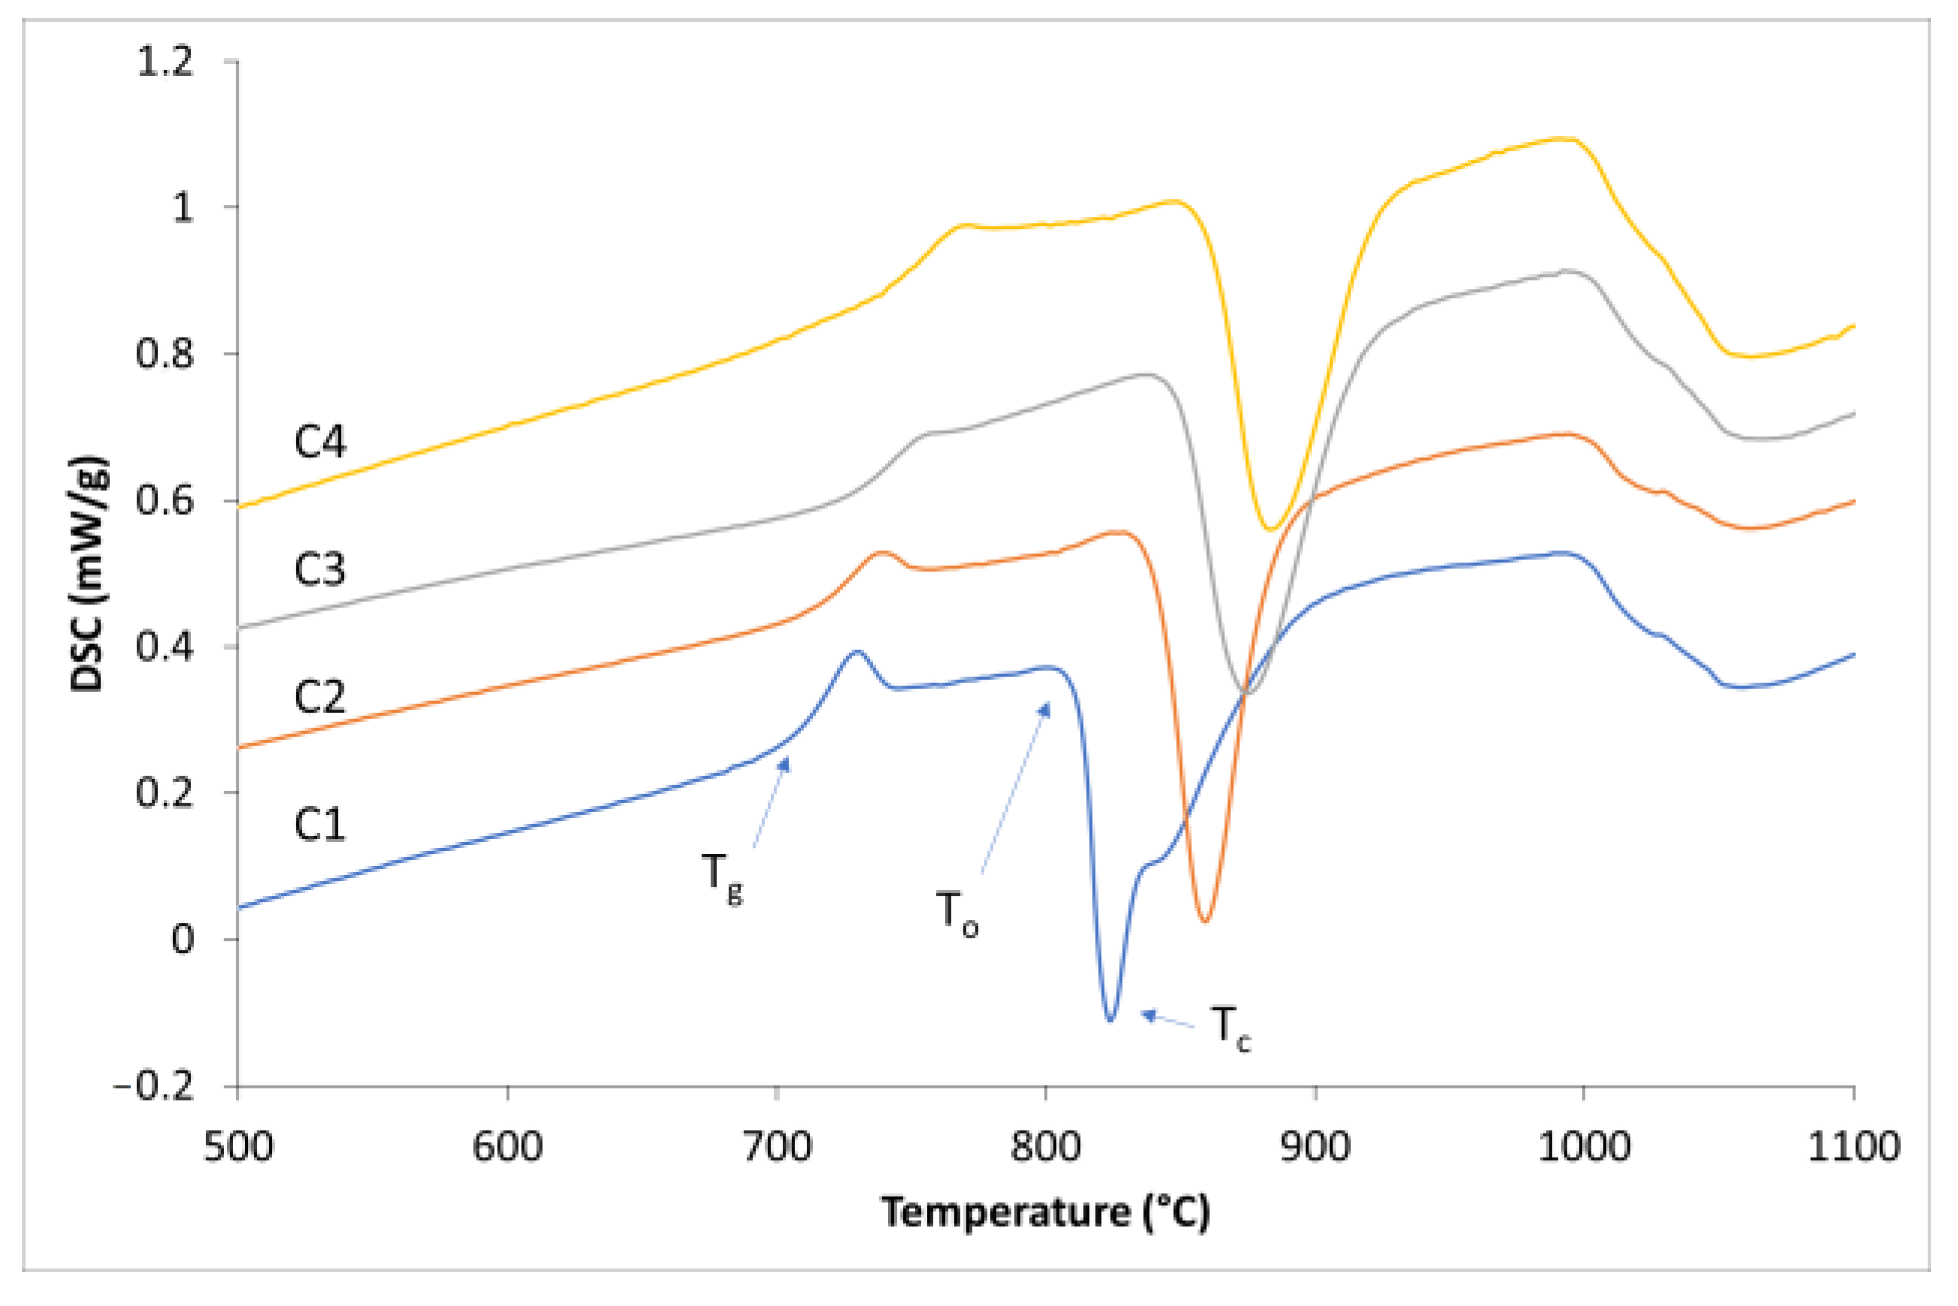
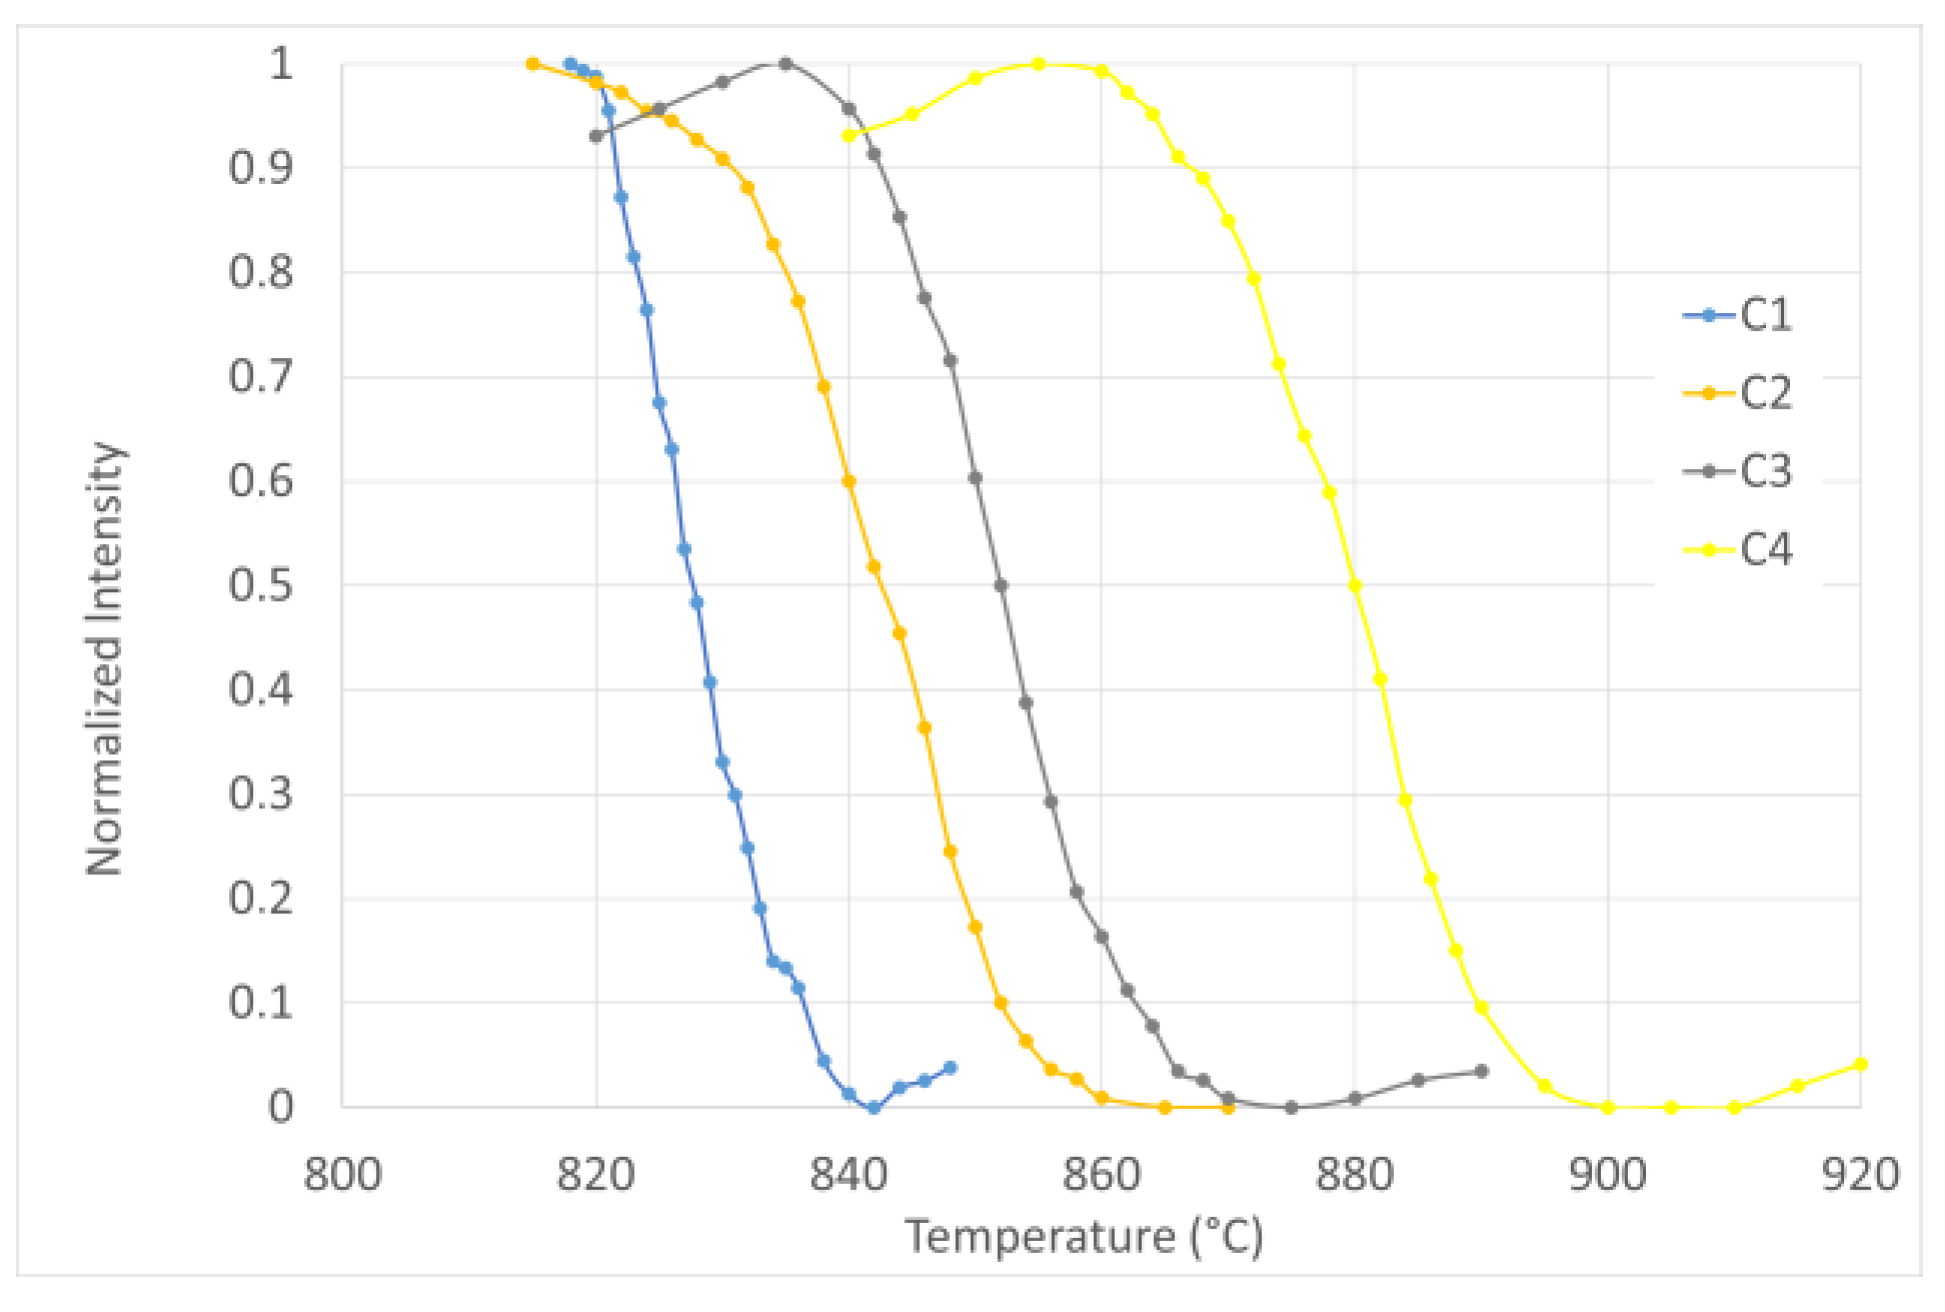
3.1. Characterization of the Parent Glasses

The XRD patterns of the parent glasses are shown in Figure 4. For the four compositions, the absence of diffraction peaks confirms the amorphous structure.
The densities of the parent glasses show only weak variations with the composition (Table 2). The glass transition temperatures Tg determined from the DSC curves (Figure 5) increase with the CaO/Na2O ratio in the glass (i.e., from composition C1 to composition C4). This is also the case for the onset temperature To and the temperature Tc of the maximum of the crystallization peak. The temperature at the beginning of the crystallization is also determined by observing the opacification of a monolithic sample of the parent glass with the temperature rise (Figure 6). The interest in using this second unusual method is that the analysis is performed on a large sample and in conditions that are close to that of a glass sheet heat treated in the crystallization furnace. This analysis confirms that a minimum temperature of 850 °C is required to initiate the crystallization of the four compositions.

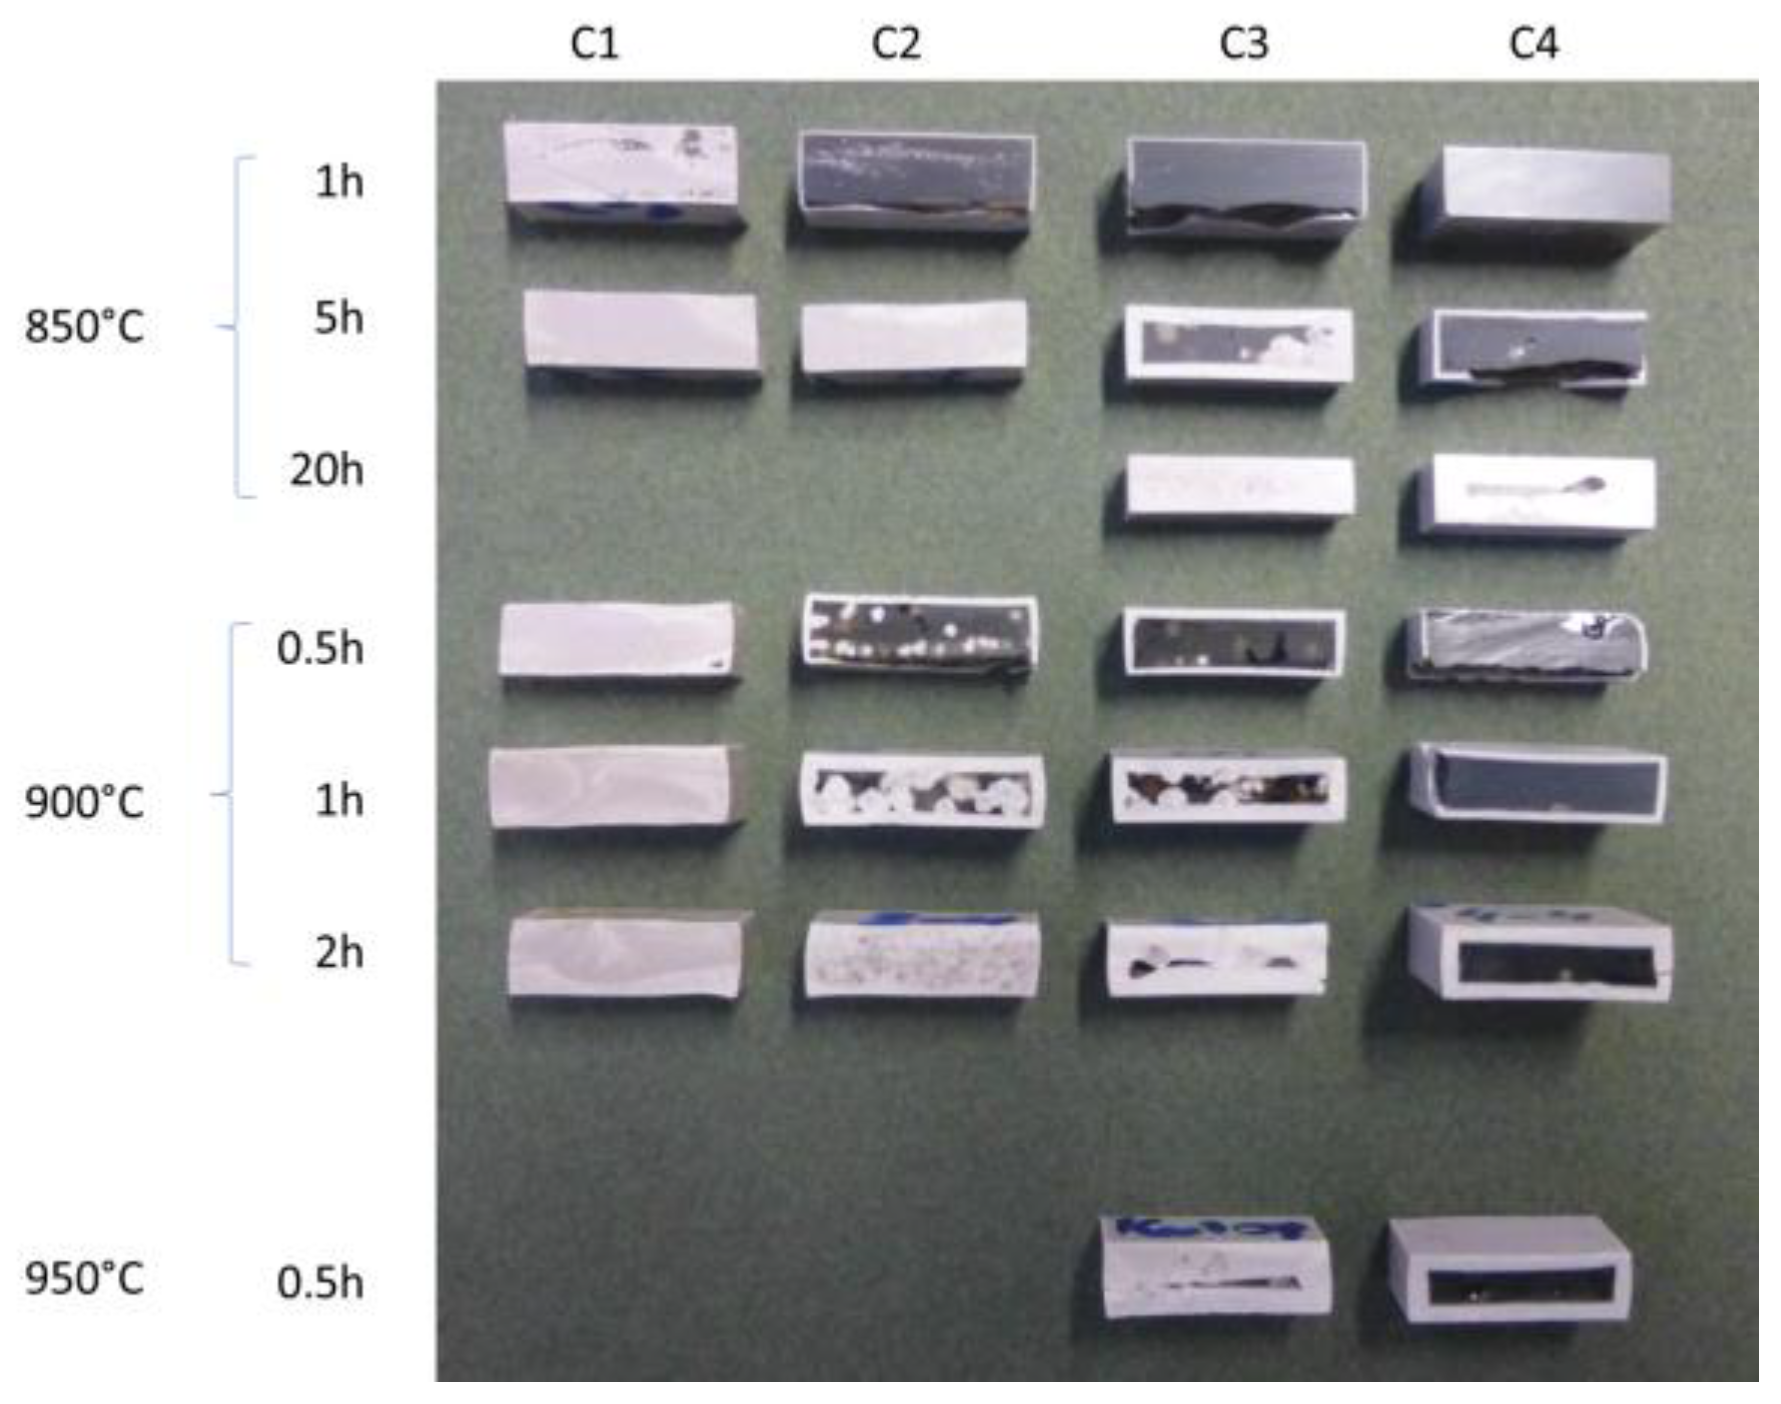
3.2. Characterization of the Heat-Treated Glasses

On the basis of the crystallization temperatures determined from the DSC analyses and the optical dilatometer images, samples of the parent glasses were heat treated at 850 °C, 900 °C and 950 °C for various holding times and with a heating ramp of 5 °C/min. Cross-sections of the samples were realized to characterize the crystallization mechanism (surface or volume). Figure 7 shows these cross-sections: the light parts correspond to the crystallized parts; the dark parts correspond to the parent glass. Some of the samples, such as those of glass C4, clearly show a surface crystallization mechanism for all tested temperatures. This surface mechanism leads to a crystalized layer surrounding the uncrystallized parent glass. The thickness of this layer increases with the holding time. For some other samples, all of the cross-section is crystalized, which can be the result either of a very fast crystallization from the surface or a volume crystallization. Optical microscope observations were performed for a closer investigation.

3.2.1. Parent Glass C1

The optical microscope image of the samples treated at 850 °C for 1 h shows a surface crystalized layer about 370 µm thick and also a strong volume crystallization (Figure 8a). For a holding time of 5 h, the surface crystalized layer is not significantly thicker and is irregular, which indicates that the volume crystallization stopped the surface mechanism (Figure 8b). The cross-sections of the sample heat treated for 0.5 h at 900 °C give a similar image (Figure 8c). XRD analyses of the surfaces of the glasses heat treated at 850 °C and 900 °C evidence the crystallization of Sr2TiSi2O8 (Figure 9). For the two temperatures, the relative intensity of the (002) peak is stronger than expected for a randomly orientated structure, which is explained by a preferential orientation of the (002) plans parallel to the analyzed surfaces.

3.2.2. Parent Glass C2

The cross-section image of the sample heat treated for 1 h at 850 °C shows a 250–300 µm thick surface crystallization layer and also some spots of volume crystallization (Figure 10a). When the holding time is raised to 5 h, a strong volume crystallization is observed and stops the growth of the surface crystallized layer to an irregular thickness of about 750–1000 µm (Figure 10b). When the crystallization temperature is 900 °C, the growth of the surface crystallization layer is faster, but the volume crystallization occurs earlier so that the surface crystallized layer is not significantly thicker (about 1200 µm) as shown in Figure 10c for a holding time of 2 h. As for the parent glass C1, XRD analyses of the surfaces of the glasses heat treated at 850 °C and 900 °C evidence the crystallization of Sr2TiSi2O8 (Figure 11) with a preferential orientation of the (002) plans parallel to the analyzed surfaces.

3.2.3. Parent Glass C3

For most thermal treatments, the cross-section images (Figure 7) show a surface crystallization and the not yet crystallized parent glass in the bulk, although one notices a few spots of volume crystallization, probably initiated on defects. Figure 12 shows the optical microscope image of the sample heat treated for 20 h at 850 °C, 2 h at 900 °C and 0.5 h at 950 °C. Only the sample heat treated at 850 °C shows that volume crystallization finally occurred and stopped the surface crystallized layer. As for the parent glasses C1 and C2, the XRD analyses evidence a preferential orientation of the (002) plans of Sr2TiSi2O8 parallel to the analyzed surfaces (Figure 13).

3.2.4. Parent Glass C4

All the thermal treatments led to a surface crystallization (Figure 7). However, the durations of the temperature plateau were too short to achieve the meeting of the crystallization fronts at the middle of the sample. The optical microscope images of the samples heat treated for 20 h at 850 °C, 2 h at 900 °C and 0.5 h at 950 °C evidence the absence of volume crystallization (Figure 14). Once again, the XRD analyses show a preferential orientation of the (002) plans of Sr2TiSi2O8 parallel to the analyzed surfaces (Figure 15).
This analysis of the cross-sections of the heat-treated samples highlights that the parent glass composition and the temperature of the plateau strongly influence the competition between the surface and volume crystallization mechanisms (Table 3). The early occurrence of volume crystallization cannot be avoided with compositions C1 and C2. For composition C3, it occurs later at 850 °C and is avoided if the temperature plateau is increased to 900 °C. For the three temperatures tested, volume crystallization never occurred for composition C4.
From the measurement of the thickness of the surface crystallized layer, one can calculate the speed of the progress of the crystallization front from the surface (Table 4). This measurement is less accurate when volume crystallization occurs.

3.3. Synthesis and Characterization of Glass-Ceramics from Parent Glass Compositions C3 and C4

From the information resulting in the characterization of the heat-treated glasses, four glass-ceramics were prepared from the parent glass compositions C3 and C4 (Table 5). The conditions for the thermal treatments were chosen to favor the surface crystallization, and to obtain a crystallization over the whole thickness (about 5 mm). For each glass-ceramic, two samples of 20 mm × 20 mm × 5 mm3 were prepared
The densities of the glass-ceramic samples were measured by Archimedes’ method. For a given composition, no difference with temperature is evidenced (Table 5). The change in density with respect to the parent glasses (Table 2) is very low and leads to a volume shrinkage of about 1% (i.e., linear shrinkage of about 0.03%).
All the samples were cut into two halves along their median plan (Figure 16). Each half corresponds to the part of the sample that crystallized from one of the two main outer surfaces. The inner faces were grinded until reaching a similar thickness of 1.6 mm for all the half samples.

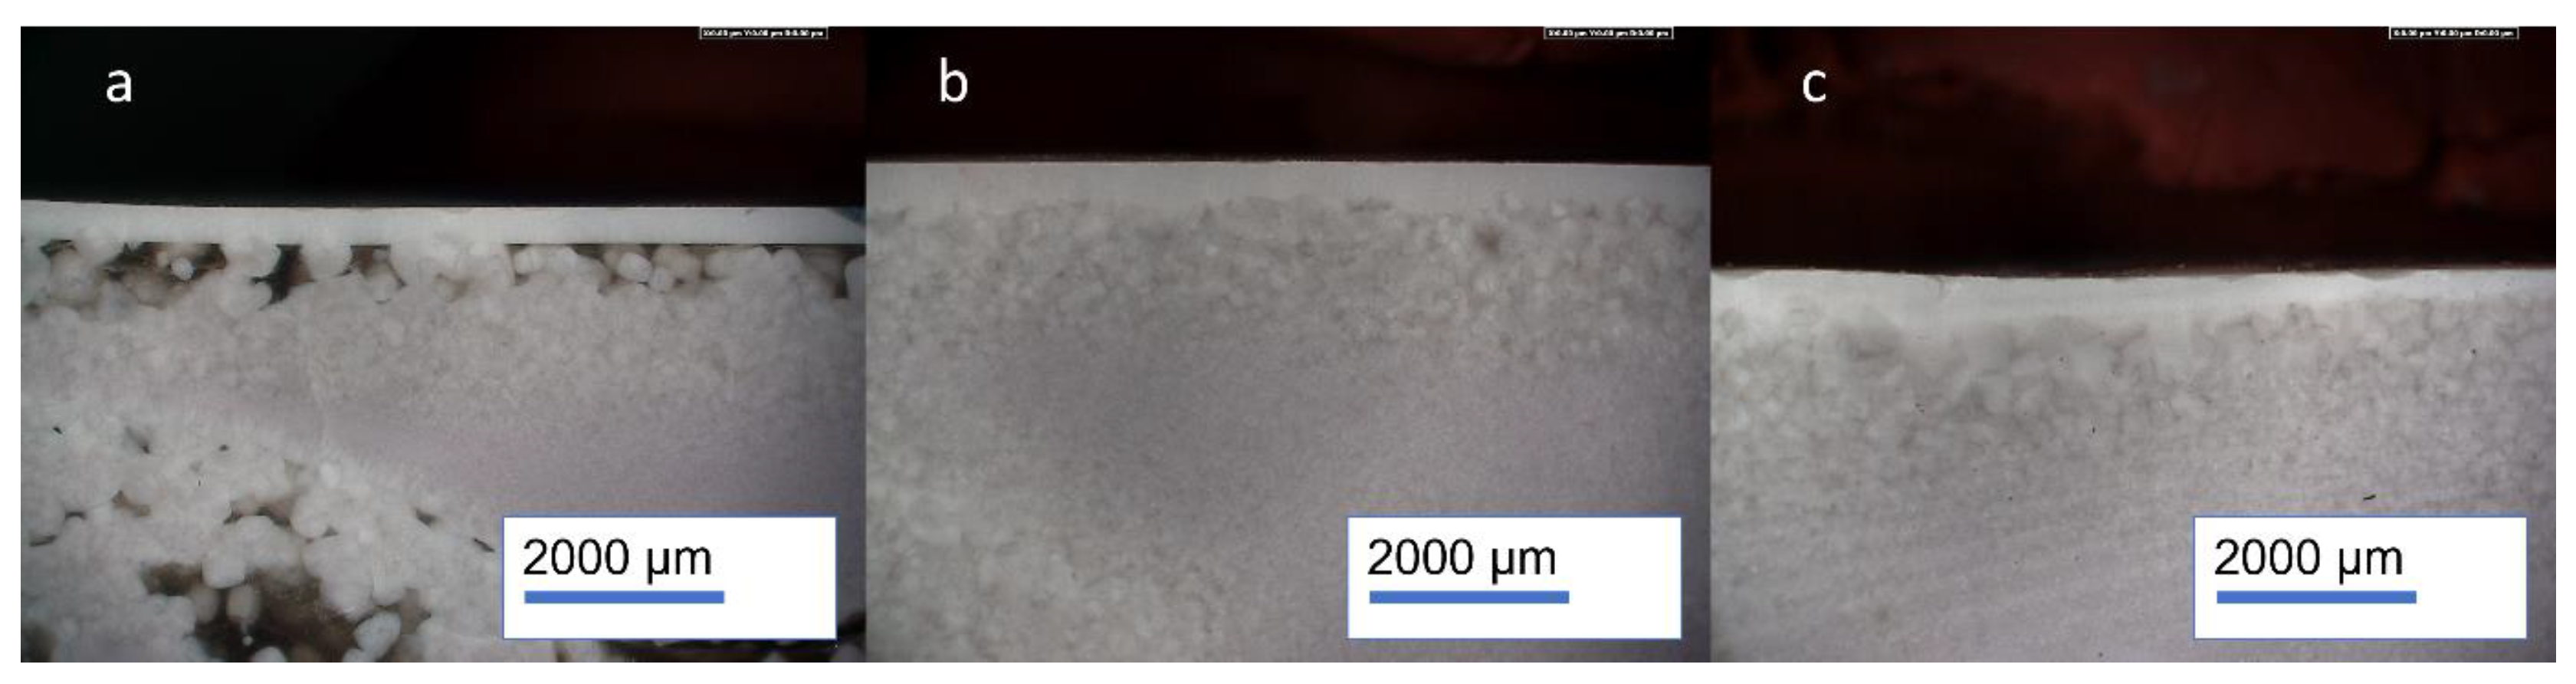
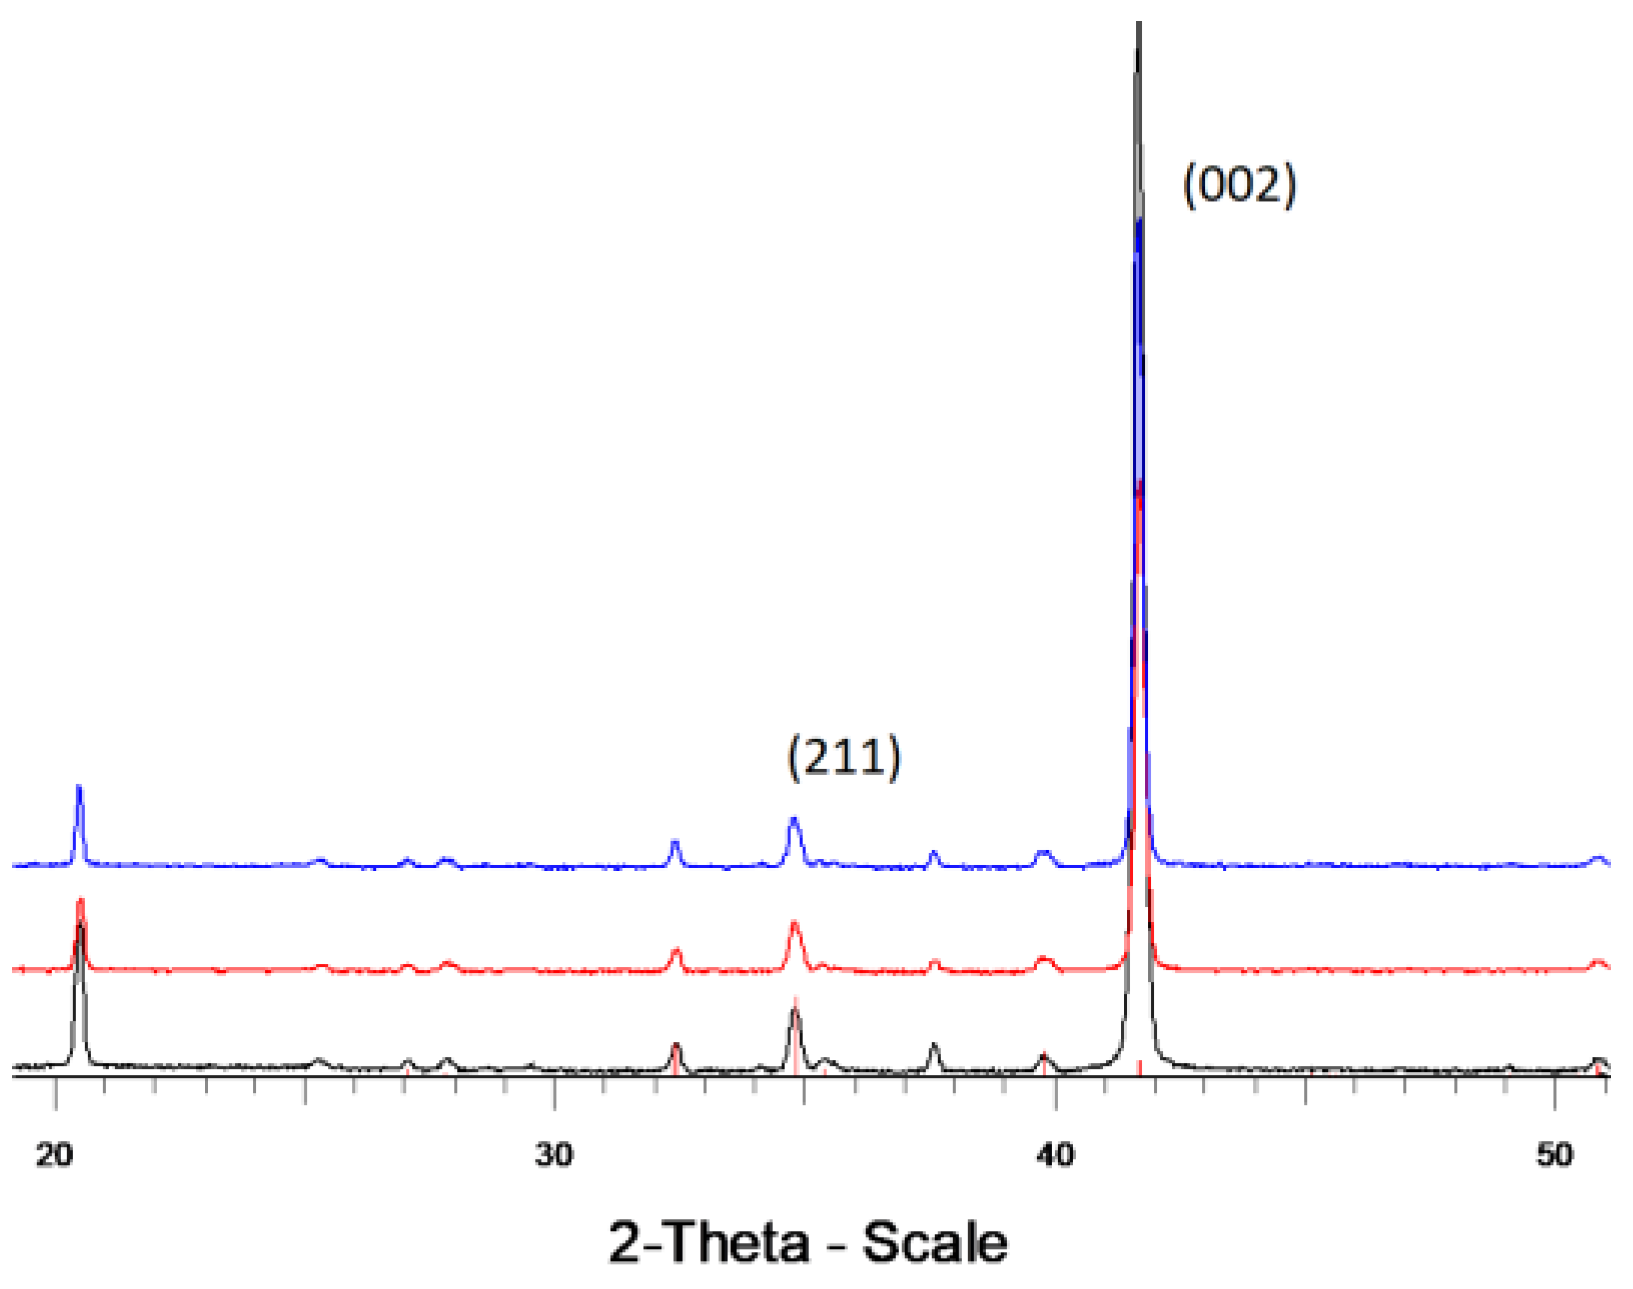
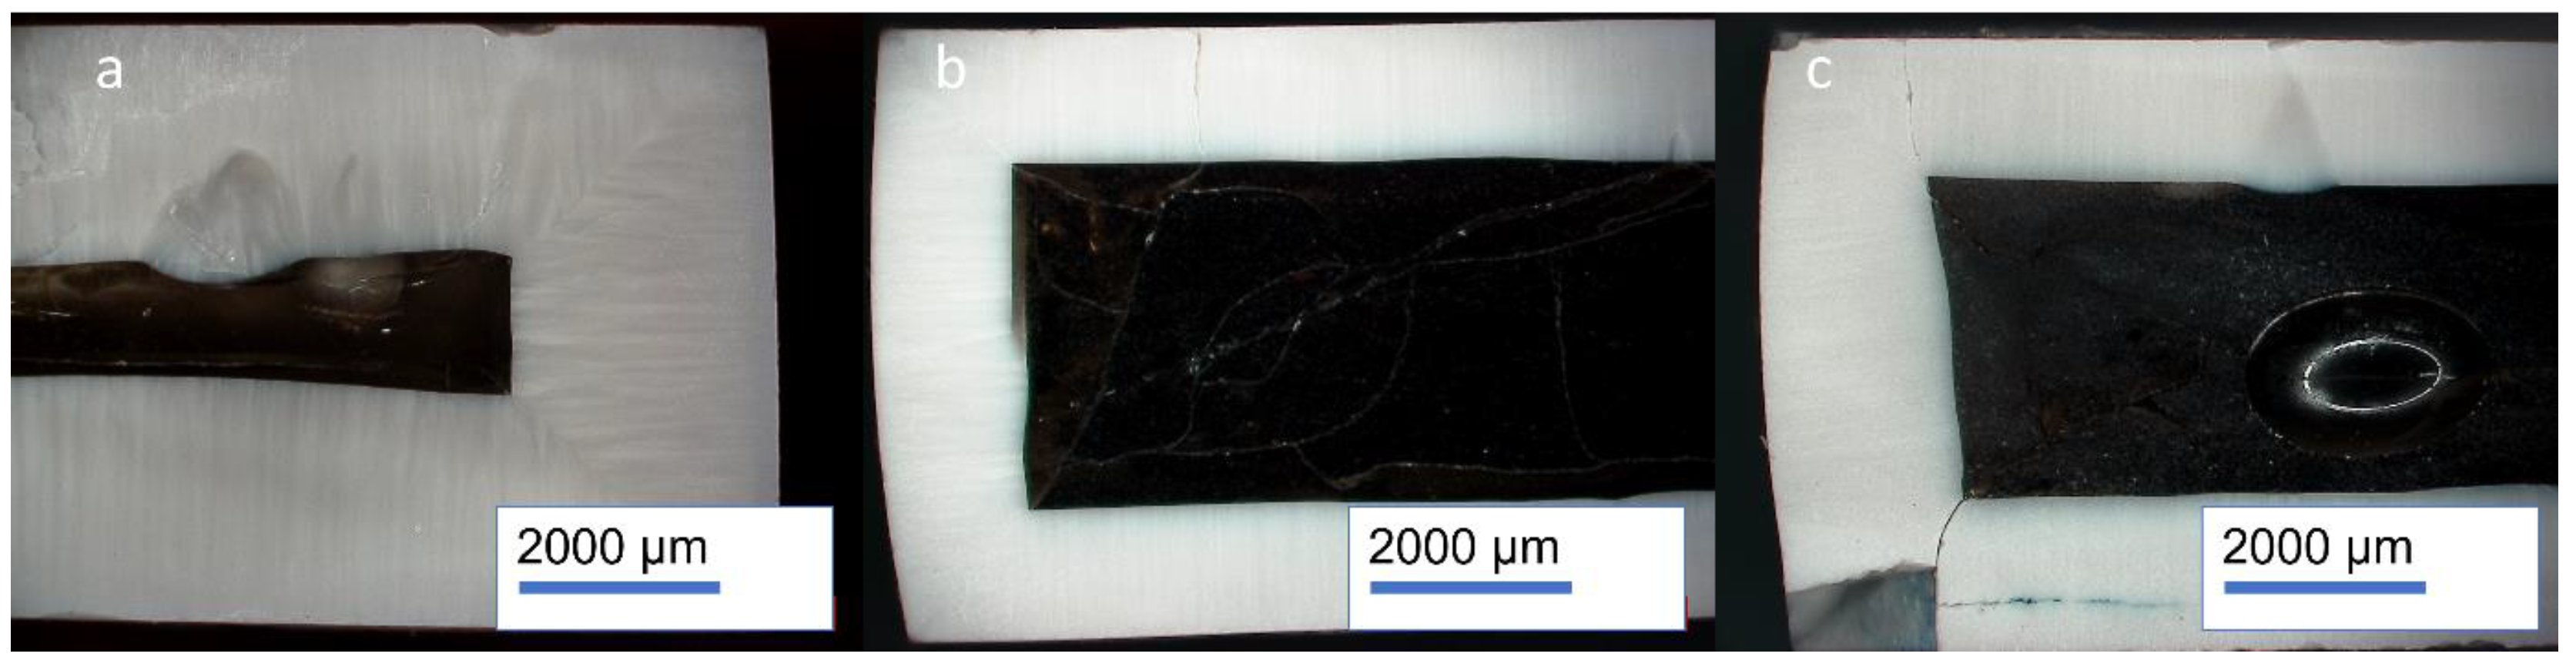
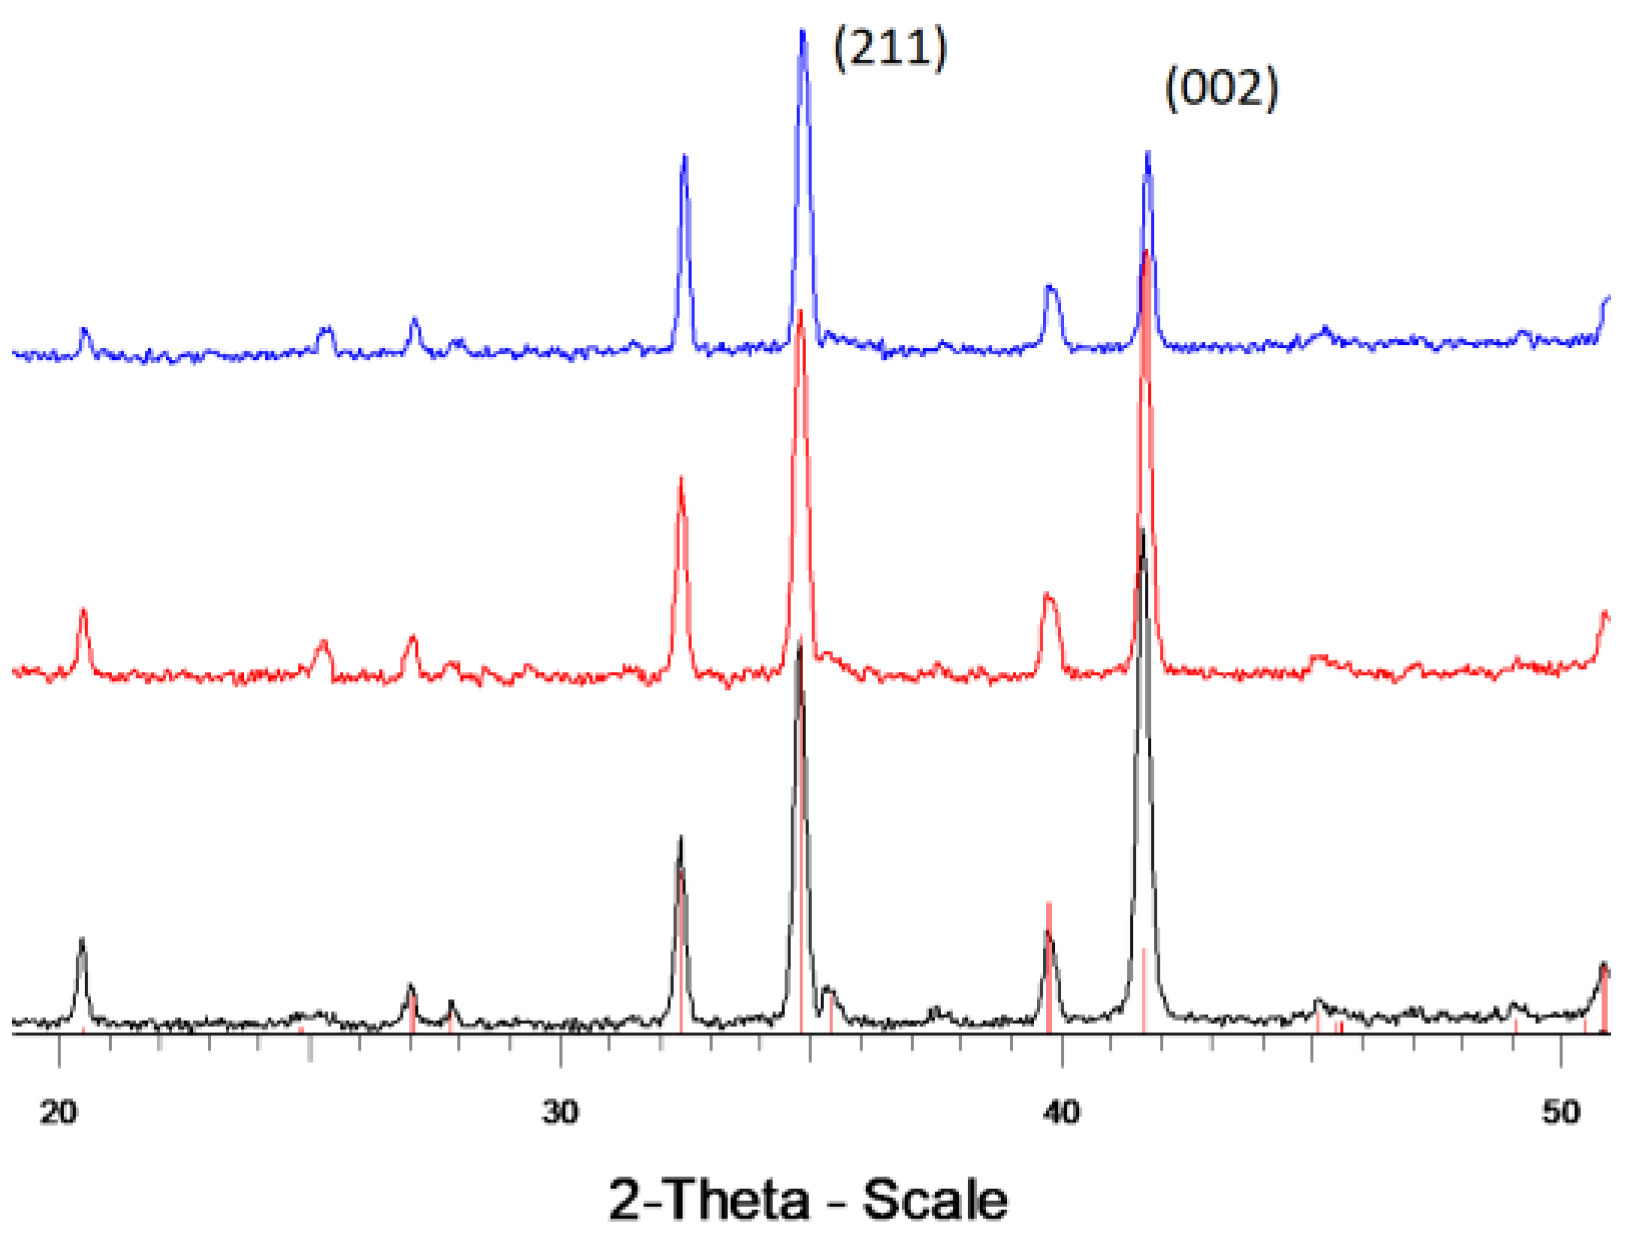
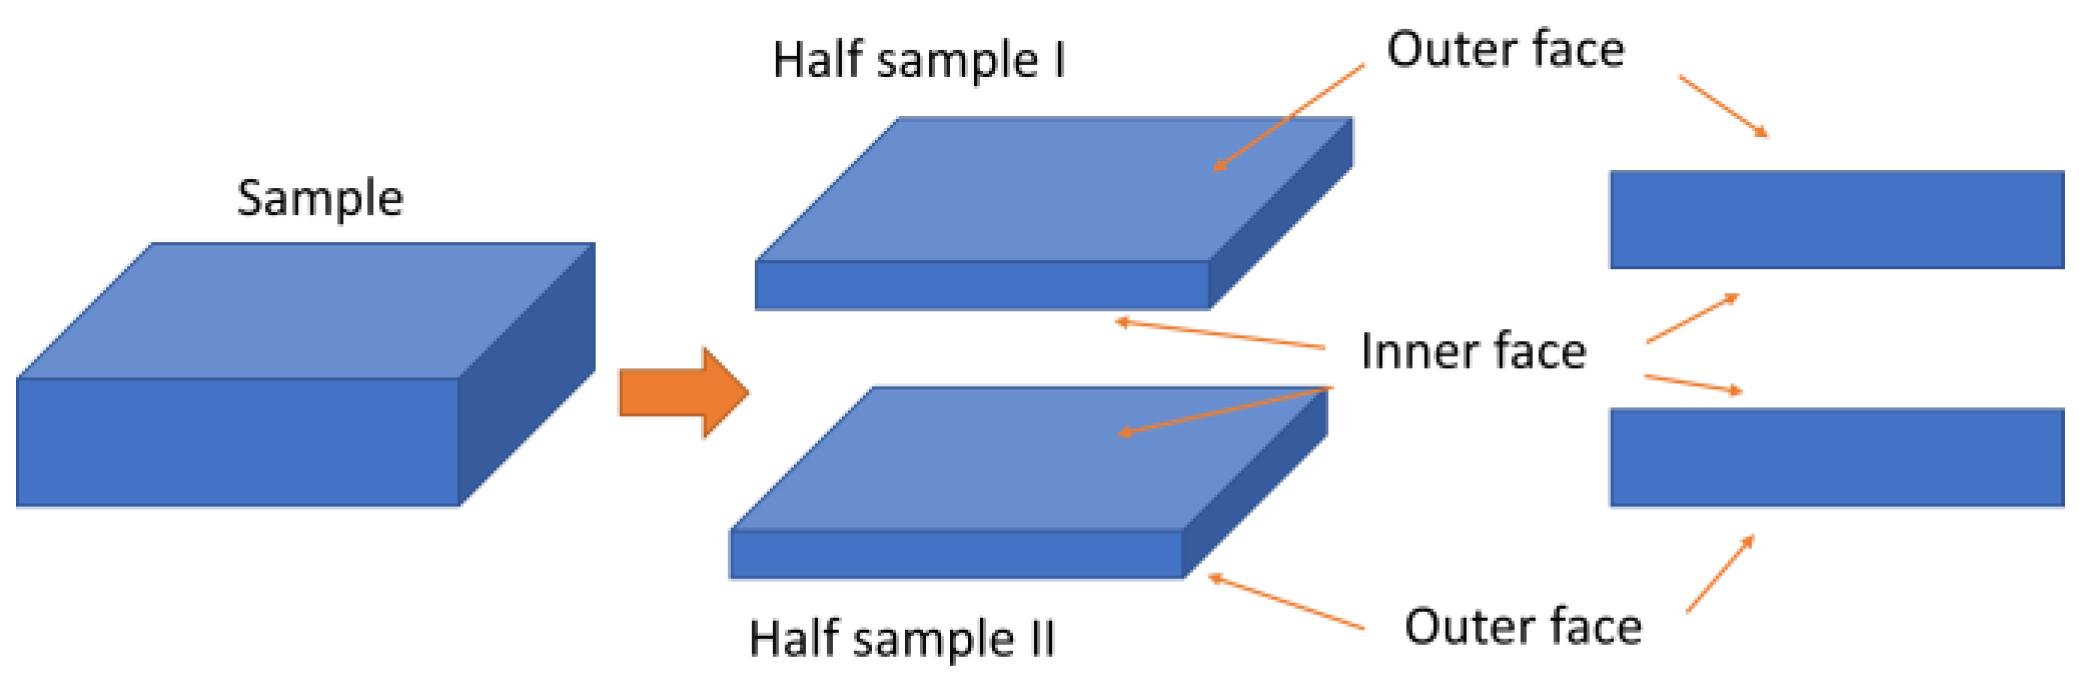
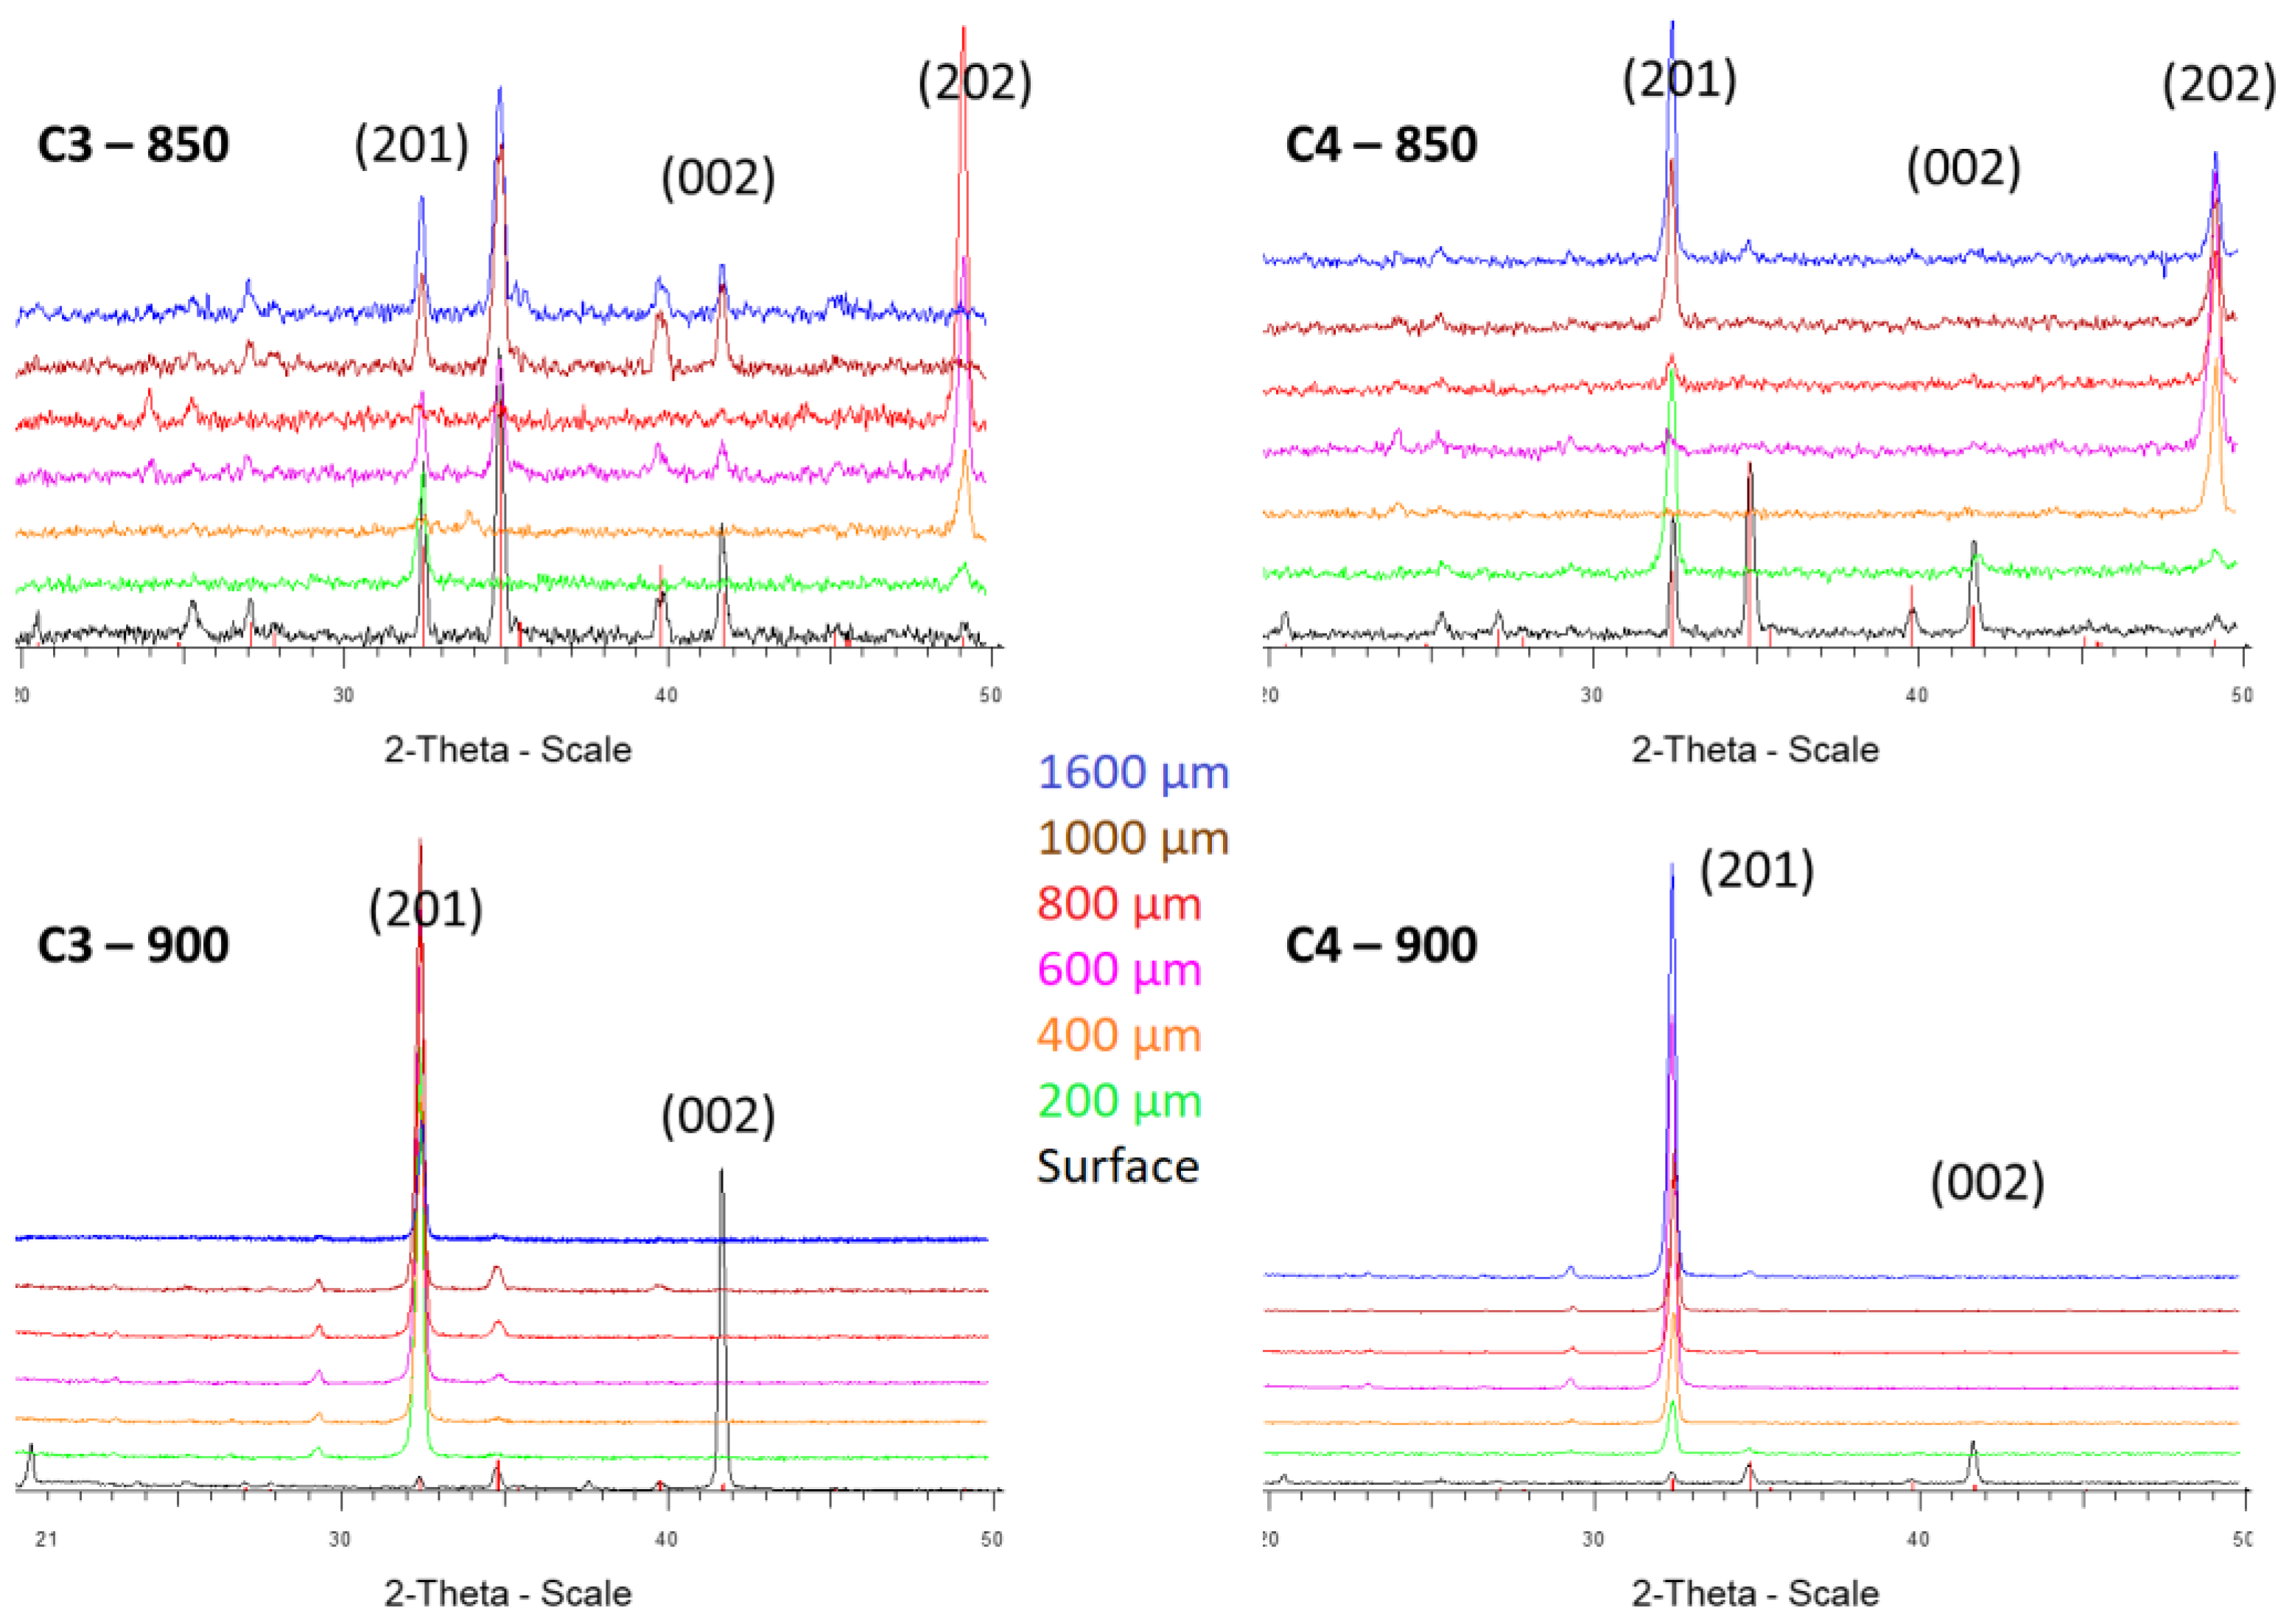
3.3.1. Characterization of the Evolution of the Crystallization over the Depth

After preparation, four half samples were available for each glass-ceramic. One of these was used to follow the evolution of the crystallization over the depth. To do so, XRD analyses were first realized on the outer and inner faces (the inner surface corresponds to a surface taken at a depth of 1600 µm). Next, additional XRD analyses were performed after grinding steps of the outer face to obtain information at depths of −200 µm, −400 µm, −600 µm, −800 µm and −1000 µm. Figure 17 show all the diffraction patterns obtained for the four glass-ceramics.
For all of the X-ray patterns, the diffraction peaks correspond to the STS crystals. However, significant differences in the relative intensities are observed. For convenience, Table 6 gives, for each pattern, the main diffraction peak showing a stronger relative intensity with respect to the reference.
At the surface of the glass-ceramics, as obtained with the thermal treatments described in Section 3.2, a stronger intensity of the diffraction peak (002) is observed for all the glass-ceramics. This highlights the preferential orientation of the (002) plans parallel to the surface.
In depth, in the case of the two glass-ceramics obtained by thermal treatment at 900 °C (C3-900 and C4-900), a very strong intensity of the peaks corresponding to the plans (201) is observed for all the depths. The evolution is more complex for the glass-ceramic resulting from thermal treatment at 850 °C (C3-850 and C4-850). A preferential orientation of the (201) plans is first observed for a depth of 200 µm. For depths between 400 and 800 µm, new changes in the relative intensities highlights preferential orientation of the plans (202). Finally, for a depth of 1000 µm and 1600 µm, no orientation is observed for the glass-ceramic C3-850, whereas both (202) and (201) diffraction peaks are strong for the glass-ceramic C4-850.

3.3.2. Piezoelectric Charge Coefficient d33

For correlating crystallization to piezoelectric properties, the piezoelectric charge coefficient was measured on samples corresponding to four different thickness ranges obtained by grinding the outer and/or inner sides of the samples (Table 7).

4. Discussion

The characterization of the parent glasses shows that the glass transition temperature and crystallization temperature increase with the CaO/Na2O ratio (Table 2); the temperature difference is about + 50 °C between the compositions C1 (CaO/Na2O = 0) and C4 (CaO/Na2O = 3). Consequently, the viscosity of the glass at a given temperature increases with the CaO/Na2O ratio. This is explained by the strong action of the fluxing agent Na2O by comparison to CaO that behaves as a stabilizer for its part. This effect on the viscosity influences the diffusion rate and thereby the respective rates of the surface and volume crystallization mechanisms. The speed at which the surface crystallization front propagates into the sample increases with the decrease in viscosity (Table 4) but, simultaneously, the occurrence of the volume crystallization comes earlier (Table 3). This competition means that surface crystallization is rapidly stopped by the volume crystallization for the glass compositions C1 and C2 (i.e., for CaO/Na2O = 0 and 0.33). Conversely, only the surface mechanism is observed with the compositions C3 and C4 (i.e., for CaO/Na2O = 1 and 3) heat treated at 900 °C and 950 °C. In the case of the glass composition C3, it is clearly shown that an increase in temperature favors a rapid surface mechanism.
The XRD analyses performed on the glass-ceramics produced from the parent glass compositions C3 and C4 heat treated at 850 °C or 900 °C shows that the surface crystallization mechanism induces preferential orientation of the STS crystals. This orientation is not significantly influenced by the parent glass composition. Conversely, it strongly depends on the temperature. The change in preferential orientation from the STS plans (002) to the plans (201) mentioned in the literature [24,26,28] is clearly observed when the crystallization treatment is operated at 900 °C. For the two glass compositions, the relative intensity of the (201) diffraction peak is very high for all the depths above 200 µm (Table 6). This shows a strong level of preferential orientation of these plans. When the crystallization is operated at 850 °C, several changes in preferential orientation are observed over depth (Table 6). Moreover, the relative intensities of the preferentially orientated plans are much lower than for the glass-ceramics obtained by thermal treatment at 900 °C (Figure 17). These differences might be related to the speed of the surface crystallization (Table 4). For the two compositions C3 and C4, the propagation of the surface crystallization front is much faster when crystallization is operated at 900 °C (> 700 µm/h) compared with 850 °C (<250 µm/h). This seems to favor the constant and strong (201) preferential orientation.
Despite a low level of preferential orientation of the STS crystals, the glass-ceramics C3-850 and C4-850 exhibit the highest values for the piezoelectric charge coefficient d33 (Table 7). It reaches about 7 pC/N for composition C3 and 8 pC/N for composition C4 when the samples are machined in a way to measure the d33 over a thickness corresponding to a stable preferential orientation of the plans (202) (i.e., for depths between 200 µm and 1000 µm. However, the d33 values obtained are not as high as the 10–15 pC/N given in the review of Wolfgang Wisniewski et al. [13]. One can also compare these values to our own results on STS glass-ceramics synthesized from parent glasses belonging to the SrO-TiO2-SiO2-K2O-Al2O3 system [15,28,29]. In this latter case, piezoelectric charge coefficients d33 of 11–12 pC/N were obtained with a strong preferential orientation of plans (002) or (201) of the STS crystals.
Surprisingly, the strong crystal texture of the glass-ceramics crystallized at 900 °C does not lead to high piezoelectric charge coefficients d33. We might indeed expect that a strong preferential orientation favors the alignment of the electric dipoles, and, consequently, the polarization. However, in the present case, the d33 values are lower than those of the two less orientated glass-ceramics obtained by thermal treatment at 850 °C (Table 7). We also notice an opposite sign for the piezoelectric charge coefficient. All the measurements were realized by taking care of always placing the outer side of the sample up and the inner side down. The opposite sign indicates that polarization points out in a reverse direction. We have then to consider not only the relation between the orientation of the STS crystals and the alignment of the c-axis polar direction, but also the two possible random 180 °C rotations of the polarization of the crystals. For preferential orientation of the (201) STS crystal plans parallel to the surface of the sample, the possible directions of the c-axis form a cone open at about 50° around the normal to the surface (Figure 18). However, the polarization can point out in two opposite ways along this axis. We can assume that the low d33 values obtained for the glass-ceramics C3-900 and C4-900 are due to a more random direction of the polar direction.
It is concluded that the temperature at which the crystallization is operated influences the orientation of the polarization with respect to the propagation direction of crystallization. Moreover, for a given temperature, the polarization of the crystals can show opposite directions, which lowers the global polarization of the glass-ceramic and, consequently, its piezoelectric properties.

Author Contributions

Investigation, T.Z., S.S., H.S., M.G. and S.A.; methodology, T.Z., S.S. and M.G.; supervision, M.G.; writing—original draft S.S. and M.G.; writing—review and editing, M.G. All authors have read and agreed to the published version of the manuscript.

Funding

This research received no external funding.

Institutional Review Board Statement

Not applicable.

Informed Consent Statement

Not applicable.

Data Availability Statement

Not applicable.

Conflicts of Interest

The authors declare no conflict of interest.

References

  1. Heywang, W.; Lubitz, K.; Wersing, W. Piezoelectricity Evolution and Future of a Technology; Springer: Berlin/Heidelberg, Germany, 2008. [Google Scholar]
  2. Uchino, K. Advanced Piezoelectric Materials: Science and Technology; Woodhead Publishing Limited: Cambridge, UK, 2010. [Google Scholar]
  3. Hemangi, K.; Deore, H.A.; Pranita, P. Review on Advanced Piezoelectric Materials (BaTiO3, PZT). J. Emerg. Technol. Innov. Res. 2008, 6, 950–957. [Google Scholar]
  4. Lupascu, D.C.; Genenko, Y.A.; Balke, N. Aging in ferroelectrics. J. Am. Ceram. Soc. 2006, 89, 224–229. [Google Scholar] [CrossRef]
  5. Turner, R.C.; Fuierer, P.A.; Newnham, R.E.; Shrout, T.R. Materials for high-temperature acoustic and vibration sensors—A review. Appl. Acoust. 1994, 41, 299–324. [Google Scholar] [CrossRef]
  6. Halliyal, A.; Bhalla, A.S.; Newnham, R.E. Polar glass ceramics—A new family of electroceramic materials: Tailoring the piezoelectric and pyroelectric properties. Mater. Res. Bull. 1983, 18, 1007–1019. [Google Scholar] [CrossRef]
  7. Halliyal, A.; Safari, A.; Bhalla, A.S.; Newnham, R.E.; Cross, L.E. Grain-oriented glass-ceramics for piezoelectric devices. J. Am. Ceram. Soc. 1984, 67, 331–335. [Google Scholar] [CrossRef]
  8. Halliyal, A.; Bhalla, S.A.; Cross, L.E.; Newnham, R.E. Dielectric, piezoelectric and pyroelectric properties of Sr2TiSi2O8 polar glass-ceramic: A new polar material. J. Mater. Sci. 1985, 20, 3745–3749. [Google Scholar] [CrossRef]
  9. Halliyal, A.; Bhalla, S.A.; Newnham, R.E.; Cross, E. Glass-ceramics for piezoelectric and pyroelectric devices. In Glass and Glass-Ceramics; Lewis, M.H., Ed.; Springer: Dordrecht, The Netherlands, 1989; pp. 272–315. [Google Scholar]
  10. Höche, T.; Rüssel, C.; Neumann, W. Incommensurate modulations in Ba2TiSi2O8, Sr2TiSi2O8, and Ba2TiGe2O8. Solid State Commun. 1999, 110, 651–656. [Google Scholar] [CrossRef]
  11. Moore, P.B.; Louisnathan, J. The crystal structure of fresnoite, Ba(TiO)Si2O7. Z. Krist. 1969, 130, 438–448. [Google Scholar] [CrossRef]
  12. Höche, T.; Neumann, W.; Esmaeilzadeh, S.; Uecker, R.; Lentzen, M.; Rüssel, C. The crystal structure of Sr2TiSi2O8. J. Solid State Chem. 2002, 166, 15–23. [Google Scholar] [CrossRef]
  13. Wisniewski, W.; Thieme, K.; Rüssel, C. Fresnoite glass-ceramics—A review. Prog. Mater. Sci. 2018, 98, 68–107. [Google Scholar] [CrossRef]
  14. Davis, M.J.; Vullo, P.; Kocher, M.; Hovhannisyan, M.; Letz, M. Piezoelectric glass-ceramic for high-temperature applications. J. Non Cryst. Solids 2018, 501, 159–166. [Google Scholar] [CrossRef]
  15. Dupla, F.; Renoirt, M.-S.; Gonon, M.; Smagin, N.; Duquennoy, M.; Martic, G.; Erauw, J.-P. A lead-free non-ferroelectric piezoelectric glass-ceramic for high temperature surface acoustic wave devices. J. Eur. Ceram. Soc. 2020, 40, 3759–3765. [Google Scholar] [CrossRef]
  16. Gerace, K.S.; Mauro, J.C.; Randall, C.A. Piezoelectric glass-ceramics: Crystal chemistry, orientation mechanisms, and emerging applications. J. Am. Ceram. Soc. 2021, 104, 1915–1944. [Google Scholar] [CrossRef]
  17. Müller, R.; Zanotto, E.D.; Fokin, W.M. Surface crystallization of silicates glasses: Nucleation and kinetics. J. Non Cryst. Solids 2000, 274, 208–231. [Google Scholar] [CrossRef]
  18. Schmelzer, J.; Pascova, R.; Möller, J.; Gutzow, I. Surface-induced devitrification of glasses: The influence of elastic strains. J. Non Cryst. Solids 1993, 162, 26–39. [Google Scholar] [CrossRef]
  19. Ochi, Y.; Meguro, T.; Kakegawa, K. Orientated crystallization of fresnoite glass-ceramics by using a thermal gradient. J. Eur. Ceram. Soc. 2006, 26, 627–630. [Google Scholar] [CrossRef]
  20. Keding, R.; Rüssel, C. Oriented glass-ceramic containing fresnoite prepared by electrochemical nucleation of a BaO-TiO2-SiO2-B2O3 melt. J. Non Cryst. Solids 2000, 278, 7–12. [Google Scholar] [CrossRef]
  21. Höche, T.; Keding, R.; Rüssel, C. Microstructural characterization of grain-oriented glass ceramics in the system Ba2TiSi2O8. J. Mater. Sci. 1999, 34, 195–208. [Google Scholar] [CrossRef]
  22. Masai, H.; Tsuji, S.; Fujiwara, T.; Benino, Y.; Komatsu, T. Structure and non-linear optical properties of BaO-TiO2-SiO2 glass containing Ba2TiSi2O8 crystal. J. Non Cryst. Solids 2007, 353, 2258–2262. [Google Scholar] [CrossRef]
  23. Ding, Y.; Masuda, N.; Miura, Y.; Osaka, A. Preparation of polar oriented Sr2TiSi2O8 films by surface crystallization of glass and second harmonic generation. J. Non Cryst. Solids 1996, 203, 88–95. [Google Scholar] [CrossRef]
  24. Wisniewski, W.; Dimitrijevic, J.; Rüssel, C. Oriented nucleation and crystal growth of Sr-fresnoite (Sr2TiSi2O8) in 2SrO·TiO2·2SiO2 glasses with additional SiO2. CrystEngComm 2018, 20, 3234–3245. [Google Scholar] [CrossRef]
  25. Maury, N.; Cambier, F.; Gonon, M. Bulk crystallisation of (00l) oriented fresnoite Sr2TiSi2O8 in glass-ceramics of the Sr-Ti-Si-K-B-O system. J. Non Cryst. Solids 2011, 357, 1079–1084. [Google Scholar] [CrossRef]
  26. Patschger, M.; Wisniewski, W.; Rüssel, C. Piezoelectric glass-ceramics produced via oriented growth of Sr2TiSi2O8 fresnoite: Thermal annealing of surface modified quenched glasses. CrystEngComm 2012, 14, 7368–7373. [Google Scholar] [CrossRef]
  27. Wisniewski, W.; Rüssel, C. Oriented surface nucleation in inorganic glasses—A review. Prog. Mater. Sci. 2021, 118, 100758. [Google Scholar] [CrossRef]
  28. Renoirt, M.-S.; Maury, N.; Dupla, F.; Gonon, M. Structure and Properties of Piezoelectric Strontium Fresnoite Glass-Ceramics Belonging to the Sr-Ti-Si-Al-K-O System. Ceramics 2019, 2, 86–97. [Google Scholar] [CrossRef] [Green Version]
  29. Renoirt, M.-S. Control of Crystallization and Properties of Strontium-Fresnoite Based Piezoelectric Glass-ceramics and Potential Application as Surface Acoustic Waves Devices. Ph.D. Thesis, University of Mons, Mons, Belgium, 24 June 2020. [Google Scholar]
  30. Gates-Rector, S.; Blanton, T. The Powder Diffraction File: A Quality Materials Characterization Database. Powder Diffr. 2019, 34, 352–360. [Google Scholar] [CrossRef]
Figure 1. Principle of measurement of opacification due to the crystallization of a parent glass during the temperature rise by means of an optical dilatometer.
Ceramics 06 00001 g001
Figure 2. Absorption of the radiation in a Bragg–Brentano configuration.
Ceramics 06 00001 g002
Figure 3. Relative contribution R(z) of emerging radiation for depth > z to intensity diffracted signal for the studied glass-ceramics.
Ceramics 06 00001 g003
Figure 4. XRD patterns of the parent glasses.
Ceramics 06 00001 g004
Figure 5. DSC curves of the parent glasses.
Ceramics 06 00001 g005
Figure 6. Follow-up of the opacification of the parent glasses with the rise in temperature by mean of the optical dilatometer. Curves show the variation in the normalized transmitted intensity.
Ceramics 06 00001 g006
Figure 7. Cross-sections of the samples of parent glasses C1, C2, C3 and C4 heat treated at 850 °C, 900 °C and 950 °C for various holding times.
Ceramics 06 00001 g007
Figure 8. Optical microscope images of samples of parent glass C1 heat treated at 850 °C for 1 h (a) and 5 h (b) and at 900 °C for 0.5 h (c).
Ceramics 06 00001 g008
Figure 9. XRD patterns of samples of parent glass C1 heat treated at 850 °C for 5 h (black pattern) and 900 °C for 1 h (red pattern).
Ceramics 06 00001 g009
Figure 10. Optical microscope images of samples of parent glass C2 heat treated at 850 °C for 1 h (a) and 5 h (b) and 900 °C for 2 h (c).
Ceramics 06 00001 g010
Figure 11. XRD patterns of samples of parent glass C2 heat treated at 850 °C for 5 h (black pattern) and 900 °C for 1 h (red pattern).
Ceramics 06 00001 g011
Figure 12. Optical microscope images of samples of parent glass C3 heat treated at 850 °C for 20 h (a), 900 °C for 2 h (b) and 950 °C for 0.5 h (c).
Ceramics 06 00001 g012
Figure 13. XRD patterns of samples of parent glass C3 heat treated at 850 °C for 5 h (black pattern), 900 °C for 1 h (red pattern) and 950 °C for 0.5 h (blue pattern).
Ceramics 06 00001 g013
Figure 14. Optical microscope images of samples of parent glass C4 heat-treated at 850 °C for 20 h (a), 900 °C for 2 h (b) and 950 °C for 0.5 h (c).
Ceramics 06 00001 g014
Figure 15. XRD patterns of samples of parent glass C4 heat treated at 850 °C for 5 h (black pattern), 900 °C for 1 h (red pattern) and 950 °C for 0.5 h (blue pattern).
Ceramics 06 00001 g015
Figure 16. Preparation of the samples.
Ceramics 06 00001 g016
Figure 17. X-ray diffraction patterns of the glass-ceramics. Analyses of the surfaces and over depths by successive grinding steps.
Ceramics 06 00001 g017
Figure 18. Schematic representation of possible directions of the c-axis with respect to the (201) plans of STS.
Ceramics 06 00001 g018
Table 1. Compositions of the parent glasses.
RefSTSExcess to STSCaO/Na2O
SrOTiO2SiO2SiO2Na2OCaO
C12120.80.2000
C20.150.051/3
C30.100.101
C40.050.153
Table 2. Properties of the parent glasses C1, C2, C3 and C4.
RefDensity
g/cm3
Tg
°C
To
°C
Tc
°C
Delta Cp
J·g−1·K−1
C13.53 ± 0.017018058240.359
C23.54 ± 0.017218288590.257
C33.55 ± 0.017388358740.290
C43.58 ± 0.017588458840.346
Table 3. Summary of the results of the thermal treatments for the four compositions from the point of view of the competition between surface and volume crystallization.
Temperature of CrystallizationC1C2C3C4
850 °CVolume crystallization occurs before 1 h
Surface crystalized layer: 300–400 µm
Volume crystallization occurs between 1 and 5 h
Surface crystalized layer: 500–1000 µm
Volume crystallization between 5 and 20 h
Surface crystalized layer: 800–1200 µm
Only surface crystallization
900 °CVolume crystallization occurs before 0.5 h
Surface crystalized layer: 300–1000 µm
Volume crystallization occurs between 1 and 2 h
Surface crystalized layer: 900–1300 µm
Only surface crystallizationOnly surface crystallization
950 °C--Only surface crystallizationOnly surface crystallization
Table 4. Surface crystallization speed in µm/h.
CompositionTemperature
850 °C900 °C950 °C
C1300–400
C2250–3001400–1500
C3200–2501400–15005800–6000
C4100–125700–8003400–3500
Table 5. Conditions of synthesis of the glass-ceramic samples.
Reference of the Glass-CeramicParent Glass CompositionTemperature Tmax of Crystallization
(°C)
Holding Time at Tmax
(h)
Number of SamplesSize of the Samples
(mm3)
Density
(g/cm3)
C3–850C385020220 × 20 × 53.59 ± 0.01
C4–850C485040220 × 20 × 53.61 ± 0.01
C3–900C39003220 × 20 × 53.59 ± 0.01
C4–900C49006220 × 20 × 53.61 ± 0.01
Table 6. Summary of the STS diffraction peaks showing a stronger relative intensity with respect to the reference file PDF 00-39-0228 [30].
Depth (µm)C3–850C4–850C3–900C4–900
0(002)(002)(002)(002)
200(201)(201)(201)(201)
400(202)(202)(201)(201)
600(202)(202)(201)(201)
800(202)(202)(201)(201)
1000none(201) (202)(201)(201)
1600none(201) (202)(201)(201)
Table 7. Piezoelectric charge coefficient.
Ref MeasurementThickness (µm)Thickness Ranged33 (pC/N)
TopBottomC3–850C4–850C3–900C4–900
D11600Surface−1600 µm4.87.5−1.5−4.8
D21000Surface−1000 µm7.57.7−1.7−5.0
D3600−200 µm−800 µm8.87.5−2.8−5.3
D4600−400 µm−1000 µm8.57.2−2.0−5.3
Disclaimer/Publisher’s Note: The statements, opinions and data contained in all publications are solely those of the individual author(s) and contributor(s) and not of MDPI and/or the editor(s). MDPI and/or the editor(s) disclaim responsibility for any injury to people or property resulting from any ideas, methods, instructions or products referred to in the content.

