Article

Characterisation of a Complex CaZr0.9Ce0.1Ti2O7 Glass–Ceramic Produced by Hot Isostatic Pressing

by
Malin C. J. Dixon Wilkins
,
Clémence Gausse
,
Luke T. Townsend
,
Laura J. Gardner
and
Claire L. Corkhill
*
NucleUS Immobilisation Science Laboratory, Department of Materials Science and Engineering, University of Sheffield, Sheffield S1 3JD, UK
*
Author to whom correspondence should be addressed.
Ceramics 2022, 5(4), 1035-1050; https://doi.org/10.3390/ceramics5040074
Submission received: 10 October 2022 / Revised: 10 November 2022 / Accepted: 17 November 2022 / Published: 19 November 2022
(This article belongs to the Special Issue Zirconolite Ceramic and Glass-Ceramic Wasteforms)

Abstract

:
The behaviour of Ce-containing zirconolites in hot isostatically pressed (HIPed) materials is complex, characterised by redox interactions between the metallic HIP canister that result in reduction of Ce4+ to Ce3+. In this work, a glass–ceramic of composition 70 wt.% CaZr0.9Ce0.1Ti2O7 ceramic in 30 wt.% Na2Al2Si6O16 glass was produced by HIP (approx. 170 cm3 canister) to examine the extent of the material–canister interaction. A complex material with six distinct regions was produced, with the extent of Ce reduction varying depending on the distance from the canister. Notably, the innermost bulk regions (those approximately 7 mm from the canister) contained only Ce4+, demonstrating that a production-scale HIPed glass–ceramic would indeed have a bulk region unaffected by the reducing environment induced by a ferrous HIP canister despite the flow of glass at the HIP temperature. Each of the six regions was characterised by XRD (including Rietveld method refinements), SEM/EDX and linear combination fitting of Ce L3-edge XANES spectra. Regions in the lower part of the canister were found to contain a significantly higher fraction of Ce4+ compared to the upper regions. Though zirconolite-2M was the major crystalline phase observed in all regions, the relative abundances of minor phases (including sphene, baddeleyite, rutile and perovskite) were higher in the outermost regions, which comprised a significantly reduced Ce inventory.

1. Introduction

As of 2020, the UK has a stockpile of civil separated Pu of approximately 140 tonnes equivalent heavy metal (teHM) [1], and though the current governmental policy is reuse, it is likely that some fraction of this material will need immobilisation and disposal [2,3]. The disposal of Pu and other high Pu content wastestreams will require highly durable wasteforms, both with respect to aqueous dissolution and resistance to radiation induced damage, that can safely contain the contained Pu over extended timescales. Zirconolite (prototypically CaZrTi2O7) is one candidate wasteform material [4], with synthetic zirconolites being both highly durable to aqueous attack [5,6,7] and extremely tolerant of irradiation [7,8,9]. Hot isostatic pressing (HIP) is a candidate thermal processing technique for the production of glass–ceramic nuclear wasteforms as it has many advantages compared to a simple cold-press and sintering route, including elimination of off-gas and the need for off-gas scrubbing, improved isotopic accountancy as a result of the use of sealed canisters, reduced material–equipment contact and the fact that a wide range of wastes can be processed in one HIP facility [10,11,12,13].
Due to the difficulties of handling Pu, both in terms of legislation and safety, initial formulation work often utilises chemical surrogates for Pu, with Ce being the most commonly utilised. Due to its inherent nonradioactive nature and similar chemistry to Pu (the presence in oxides of 3+ and 4+ oxidation states only, similar ionic radii, etc.), Ce is the most popular surrogate [4,14]. Though the behaviour of Ce is well established in zirconolite ceramics, Ce–zirconolite glass–ceramic composites have received comparatively little attention.
Kong et al. reported a systematic investigation into the formation of CaZr1-xCexTi2O7 (x = 0–0.5, Δx = 0.1) within the borate–albite glass Na2Al1.6B0.4Si6O16 (approx. 70 wt.% ceramic in 30 wt.% glass). To encourage formation of the target ceramic phases, an excess of CaO was added, resulting in a final CaO:glass:ceramic ratio of 1:4:12 by weight. Zirconolite was the major crystalline product at all levels of Ce substitution, with minor perovskite ((Ca,Ce)TiO3) also observed [15]. Thornber et al. reported a HIPed zirconolite glass–ceramic of target composition CaZr0.8Ce0.2Ti2O7 in albite glass Na2Al2Si6O16 (70 wt.% ceramic, 30 wt.% glass). Alongside the major zirconolite-2M phase, this material contained a significant fraction of perovskite and a number of other minor phases (CaTiSiO5 sphene, m-ZrO2 baddeleyite, ZrSiO4 zircon, TiO2 rutile and CeO2 ceria) [16]. Importantly, it was reported that Ce3+ was the predominant Ce oxidation state, likely stemming from the reducing influence of the stainless steel HIP canister [16,17].
The majority of HIP canisters utilised for development of nuclear wasteforms are made of stainless steel, which exerts a mild reducing atmosphere at HIP temperatures. Previous work has examined the interactions of the ferrous canister with zirconolite or high zirconolite content ceramics, with the major observations being that formation of Cr oxides (usually approximately 20 μm thick) is the major product of reaction with the canister, with the zirconolite phase compositions varying based on their proximity to the canister (often enriched in Fe and/or Cr, usually approximately 60 μm thick) [18,19,20].
In the current work, a glass–ceramic of target composition 70 wt.% CaZr0.9Ce0.1Ti2O7 in 30 wt.% Na2Al2Si6O16 was produced by hot isostatic pressing (HIP) to examine the extent of material–HIP canister interaction and as a larger-scale comparison to an analogous Pu-containing glass–ceramic (70 wt.% CaZr0.9Pu0.1Ti2O7 in 30 wt.% Na2Al2Si6O16) previously reported [11]. The HIPed Pu glass–ceramic comprised only fine-grained zirconolite (both zirconolite-2M and -3T were identified by XRD) in Na2Al2Si6O16 glass, with no other phases identified by XRD or BSE contrast SEM images.

2. Materials and Methods

2.1. Materials Synthesis

For comparison with a previously reported HIPed CaZr0.9Pu0.1Ti2O7:Na2Al2Si6O16 (70:30 wt.%) glass–ceramic, the target composition produced here was the Ce analogue: 70 wt.% CaZr0.9Ce0.1Ti2O7 ceramic in 30 wt.% Na2Al2Si6O16 glass.
Prior to size reduction, CeO2 and CaTiO3 were dried overnight at 800 °C and ZrO2, TiO2, Na2SiO3, Al2O3 and SiO2 at 180 °C. A glass precursor was produced by mixing stoichiometric amounts of SiO2, Na2SiO3 and Al2O3 by hand in a mortar and pestle and then calcining the mixture at 600 °C to remove volatiles and adsorbed water. The resulting precursor powder cake was then broken up and further homogenised by hand in a mortar and pestle.
Stoichiometric amounts of the ceramic-forming oxides (CaTiO3, CeO2, ZrO2 and TiO2) and the glass precursor (70 wt.% ceramic to 30 wt.% glass) were weighed and milled. Material was milled using yttria-stabilised ZrO2 pots and milling media with isopropanol as a carrier fluid in a Fritsch Pulverisette 7 planetary mill. The powder was milled for an hour at 500 rpm, with the direction of milling reversing in 15 min intervals. The milled slurry was dried at 90 °C, and the resulting powder cake was broken up by hand in a mortar and pestle. Small aliquots of the milled material (approx. 0.5 g) were pressed into 10 mm diameter pellets under 2.5 t uniaxial pressure (approx. 300 MPa). Pellets were heat treated in a tube furnace at 1250 °C for 4 h under Ar and 5% H2/95% N2 atmospheres.
The remainder of the powder was calcined at 600 °C for 6 h in air prior to being packed into a stainless-steel HIP canister (60 mm tall × 60 mm diameter, approx. 170 cm3) under 2.5 t uniaxial pressure. The powder was added in four stages and compacted after each addition. The canister lid was then welded on and the canister evacuated until a vacuum of less than 50 mTorr (approx. 6666 Pa) was achieved. The canister was then heated to 300 °C under vacuum, again until a vacuum of less than 50 mTorr was achieved. The evacuation tube was then welded closed and the canister placed within the furnace of the HIP.
The canister was heated at 1250 °C for 4 h under 103 MPa (15000 PSI) pressure. The heating and cooling rates were 10 °C min−1, and the pressure was increased and decreased smoothly during the heating and cooling steps. To obtain material for characterisation, the HIPed canister was removed by cutting with a cubic BN blade on a high-speed saw, with the glass–ceramic further sectioned into different regions for analysis.

2.2. Material Characterisation

Each region of the produced material was characterised by powder X-ray diffraction (XRD), scanning electron microscopy coupled with energy-dispersive X-ray spectroscopy (SEM–EDX) and Ce L3-edge X-ray absorption near-edge spectroscopy (XANES).
XRD was utilised to examine the crystalline phase assemblages produced in each material, with Rietveld method refinements performed to quantify the relative amounts of each crystalline phase. XRD was performed on a Bruker D2 Phaser diffractometer with Ni-filtered Cu Kα radiation, equipped with a Lynxeye position sensitive detector. Data were collected over the range 10° ≤ 2θ ≤ 75° with a step size of 0.02°. Phase analysis was conducted by matching the observed reflections to phases in the PDF4+ database [21]. Rietveld refinements were performed utilising the TOPAS and JEdit software packages [22,23].
Backscattered electron scanning electron microscopy coupled with energy-dispersive X-ray spectroscopy (SEM–EDX) was used to examine the microstructures and phase assemblages produced and was performed on a Hitachi TM3030 SEM with a Bruker Quantax 70 EDX system. Samples were prepared for SEM analysis by mounting in cold-set epoxy resin before grinding and polishing to an optical finish using progressively finer grades of SiC grit paper and diamond suspensions (up to 1 μm). Prior to analysis, samples were sputter coated with a thin layer of conductive carbon and conductive tracks drawn using a silver-based paint to prevent sample charge build-up under the electron beam.
Ce L3-edge XANES was utilised to examine the average bulk Ce oxidation state within the HIPed material. The spectra of Ce3+ and Ce4+ in oxide materials exhibit considerably different spectra, and the average Ce oxidation state can be estimated by linear combination fitting (LCF) utilising spectra of reference compounds of known Ce oxidation state and coordination. Spectra were collected at beamline 6BM of the National Synchrotron Light Source II, Brookhaven National Laboratory, USA. Samples were prepared by mixing sufficient material to form one absorption length with (poly)ethylene glycol as an inert binder before pressing into 13 mm discs. Measurements were conducted at room temperature in transmission mode using a Si (111) monochromator, a Rh/Pt-coated paraboloid collimating mirror and a flat Si strike harmonic rejection mirror. The beam size was defined using slits to give a beam size of 1 mm (v) by 5 mm (h). Signal intensity of the incident and transmitted X-rays were measured using ionisation chambers operating in a stable region of their current vs. voltage curve. The spectra of the HIPed Ce-bearing materials were collected, alongside reference compounds of different Ce oxidation state and coordination number (C.N.), including CeO2 (Ce4+, 8 C.N.), CePO4 (Ce3+, 9 C.N.), CeAlO3 (Ce3+, 12 C.N.) and SrCeO3 (Ce4+, 6 C.N.). Data reduction and analysis was performed in Athena, which is part of the Demeter suite [24]. Linear combination fitting was performed using CeO2 and CePO4 standards as the Ce coordination in these materials is close to that expected for Ce in the zirconolite structure (8 C.N. if located on the Ca site and 7 C.N. if on the Zr site).

3. Results

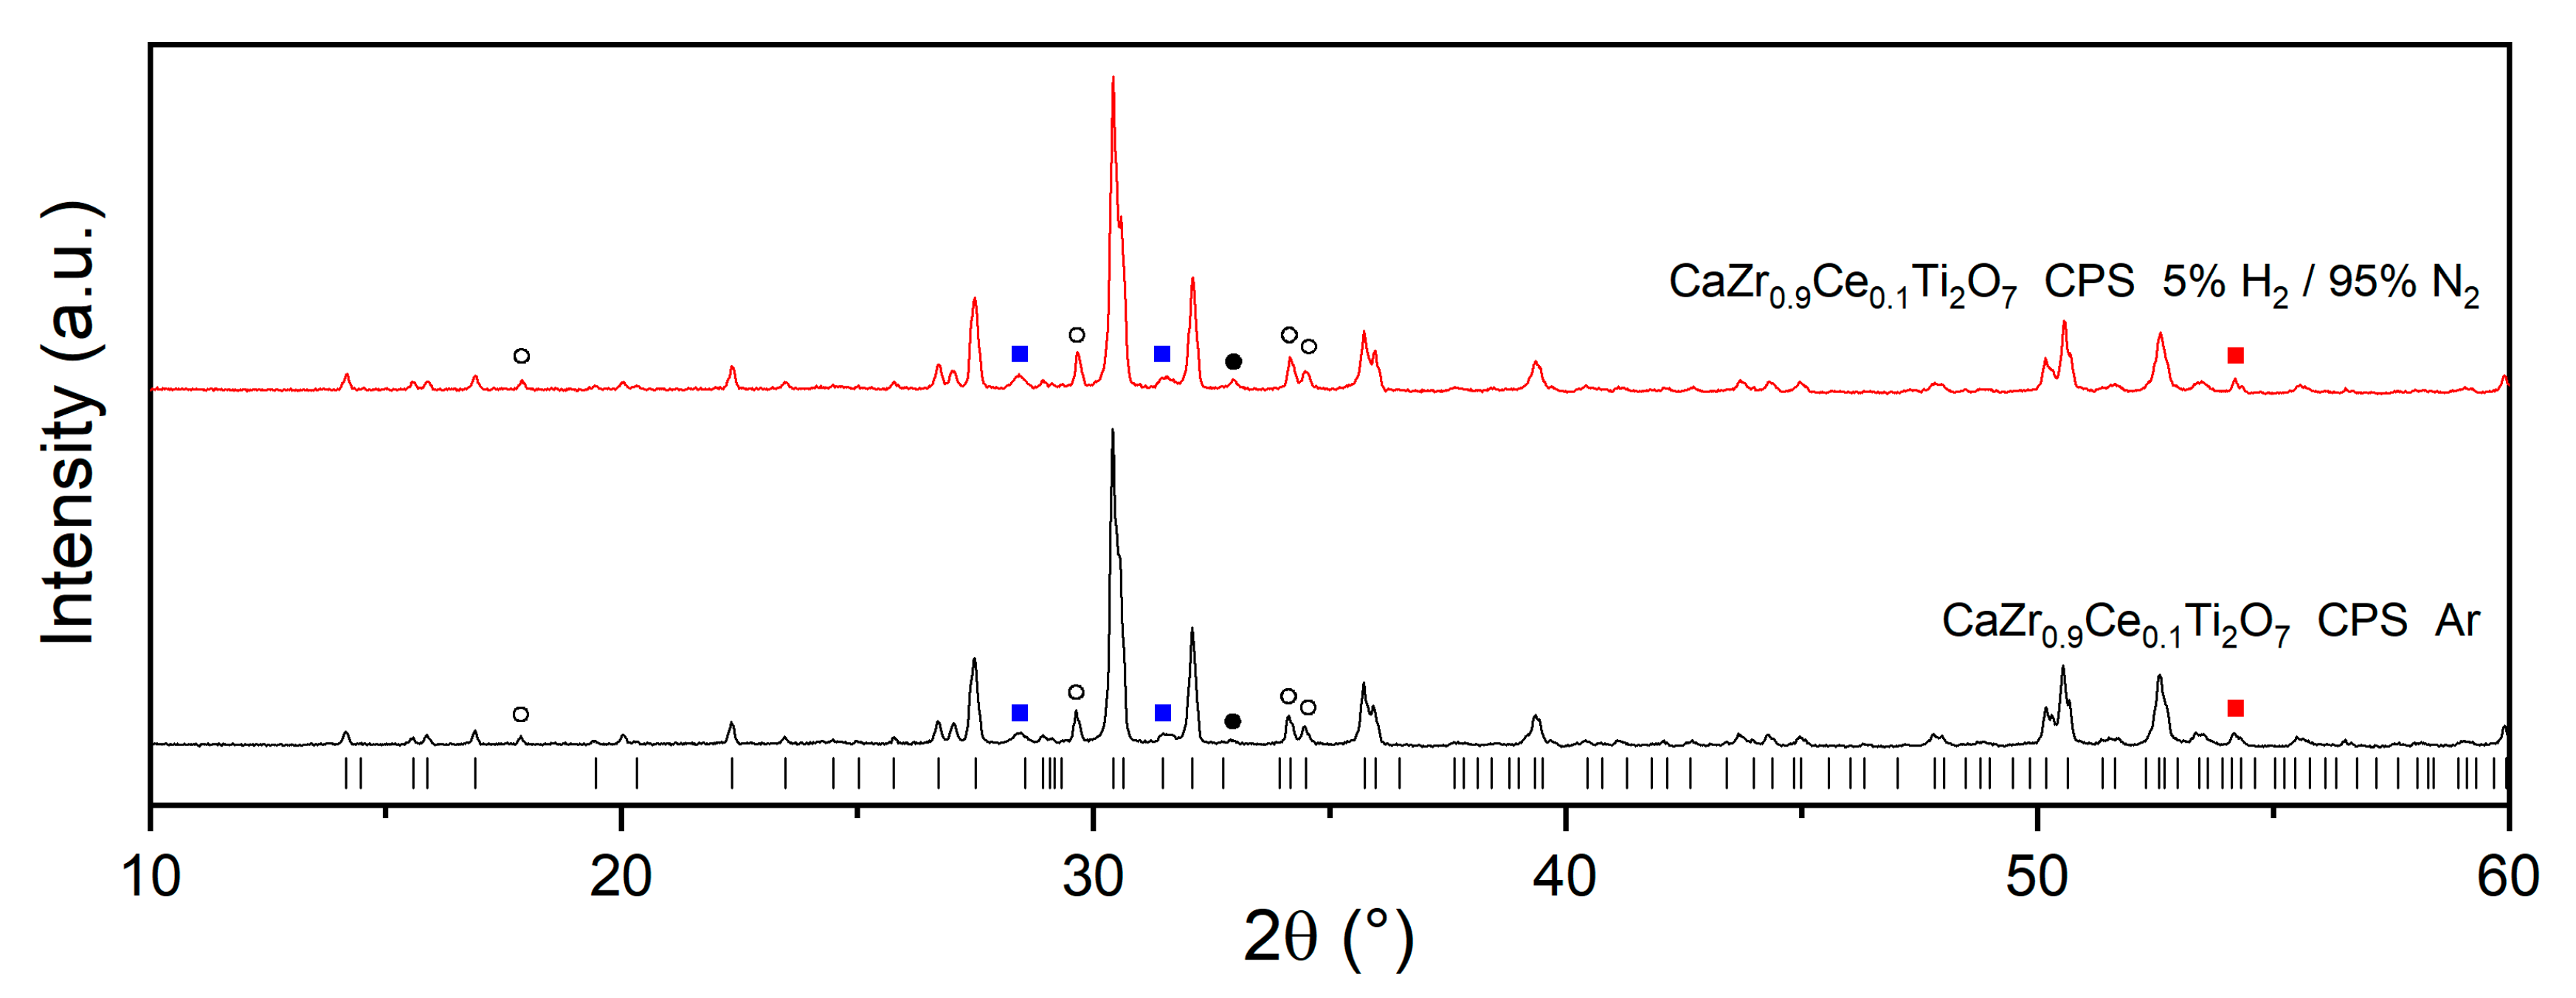
3.1. Cold-Pressed and Sintered Materials

Two preliminary glass–ceramic samples were prepared by a cold-press and sinter route, heated to 1250 °C for 4 h under Ar and 5% H2/95% N2 atmospheres. Diffuse scattering relating to the presence of the amorphous phase was not observed in the diffraction patterns (shown in Figure 1) as a result of the high fraction of crystalline phases present. As such, the refined phase abundances quoted herein are as wt.% of the overall crystalline content rather than as fractions of the overall glass–ceramic composites.
The cold-pressed and sintered samples formed complex multiphase glass–ceramic products in both cases. Zirconolite-2M (PDF card no. 04-002-4312) was the major ceramic phase produced in each material, alongside sphene (CaTiSiO5, PDF card no. 04-012-1794), rutile (TiO2, PDF card no. 01-070-7347), perovskite (prototypically CaTiO3, PDF card no. 01-077-9808), baddeleyite (m-ZrO2, PDF card no. 04-010-6452) and zircon (ZrSiO4, PDF card no. 00-006-0266).
The material heated under Ar comprised zirconolite-2M (68.6(3) wt.% of the crystalline phases) as the major crystalline phase with a significant fraction of sphene (20.1(2) wt.%). Rutile (4.0(2) wt.%), baddeleyite (3.1(2) wt.%), zircon (2.5(1) wt.%) and perovskite (1.7(1) wt.%) were also observed.
The material heated under 5% H2/95% N2 comprised a very similar phase assemblage, with zirconolite-2M (69.4(3) wt.% of the crystalline phases) and sphene (18.5(2) wt.%) as the major crystalline phases. Rutile (5.3(2) wt.%), baddeleyite (3.2(1) wt.%), zircon (2.7(1) wt.%) and perovskite (0.9(1) wt.%) were also observed in this material.
The observation of perovskite in both products is notable as it has been reported to contain a significant fraction of Ce3+ in similar systems and is significantly less durable than the targeted zirconolite phase [16,25]. The phase assemblages observed are in accordance with those expected from previous reports of a similar air-fired glass–ceramic system (CaO:Na2Al1.6B0.4Si6O16 glass:CaZr0.9Ce0.1Ti2O7 ceramic in a 1:4:12 ratio by weight) and a HIPed glass–ceramic of target composition 70 wt.% CaZr0.8Ce0.2Ti2O7 in 30 wt.% Na2Al2Si6O16 glass [15,16]. Though these materials were produced under Ar and 5% H2/95% N2 so as best to examine what may happen within the mildly reducing atmosphere exerted by ferrous HIP cans, it is expected that firing material of the same composition in air would improve the produced phase assemblage with a higher fraction of zirconolite-2M and lower fractions of the minor products.

3.2. HIPed Material

The HIP canister material was removed using a BN high-speed saw and the monolithic product sectioned, forming a vertical slice that was then further sectioned to form a half cross section (see Figure 2). On examination of the cross section, it was noted that the glass–ceramic had formed a complex product with six distinct regions, referred to hereon as the lower (A, in contact with the base of the HIP canister), lower bulk (B), upper bulk (C), upper (D, in contact with the lid of the HIP canister), upper side (E) and lower side (F) (see Figure 2). To obtain material for analysis, a sample of each region was then sectioned from the bulk, with care taken to avoid transitional areas between neighbouring regions.

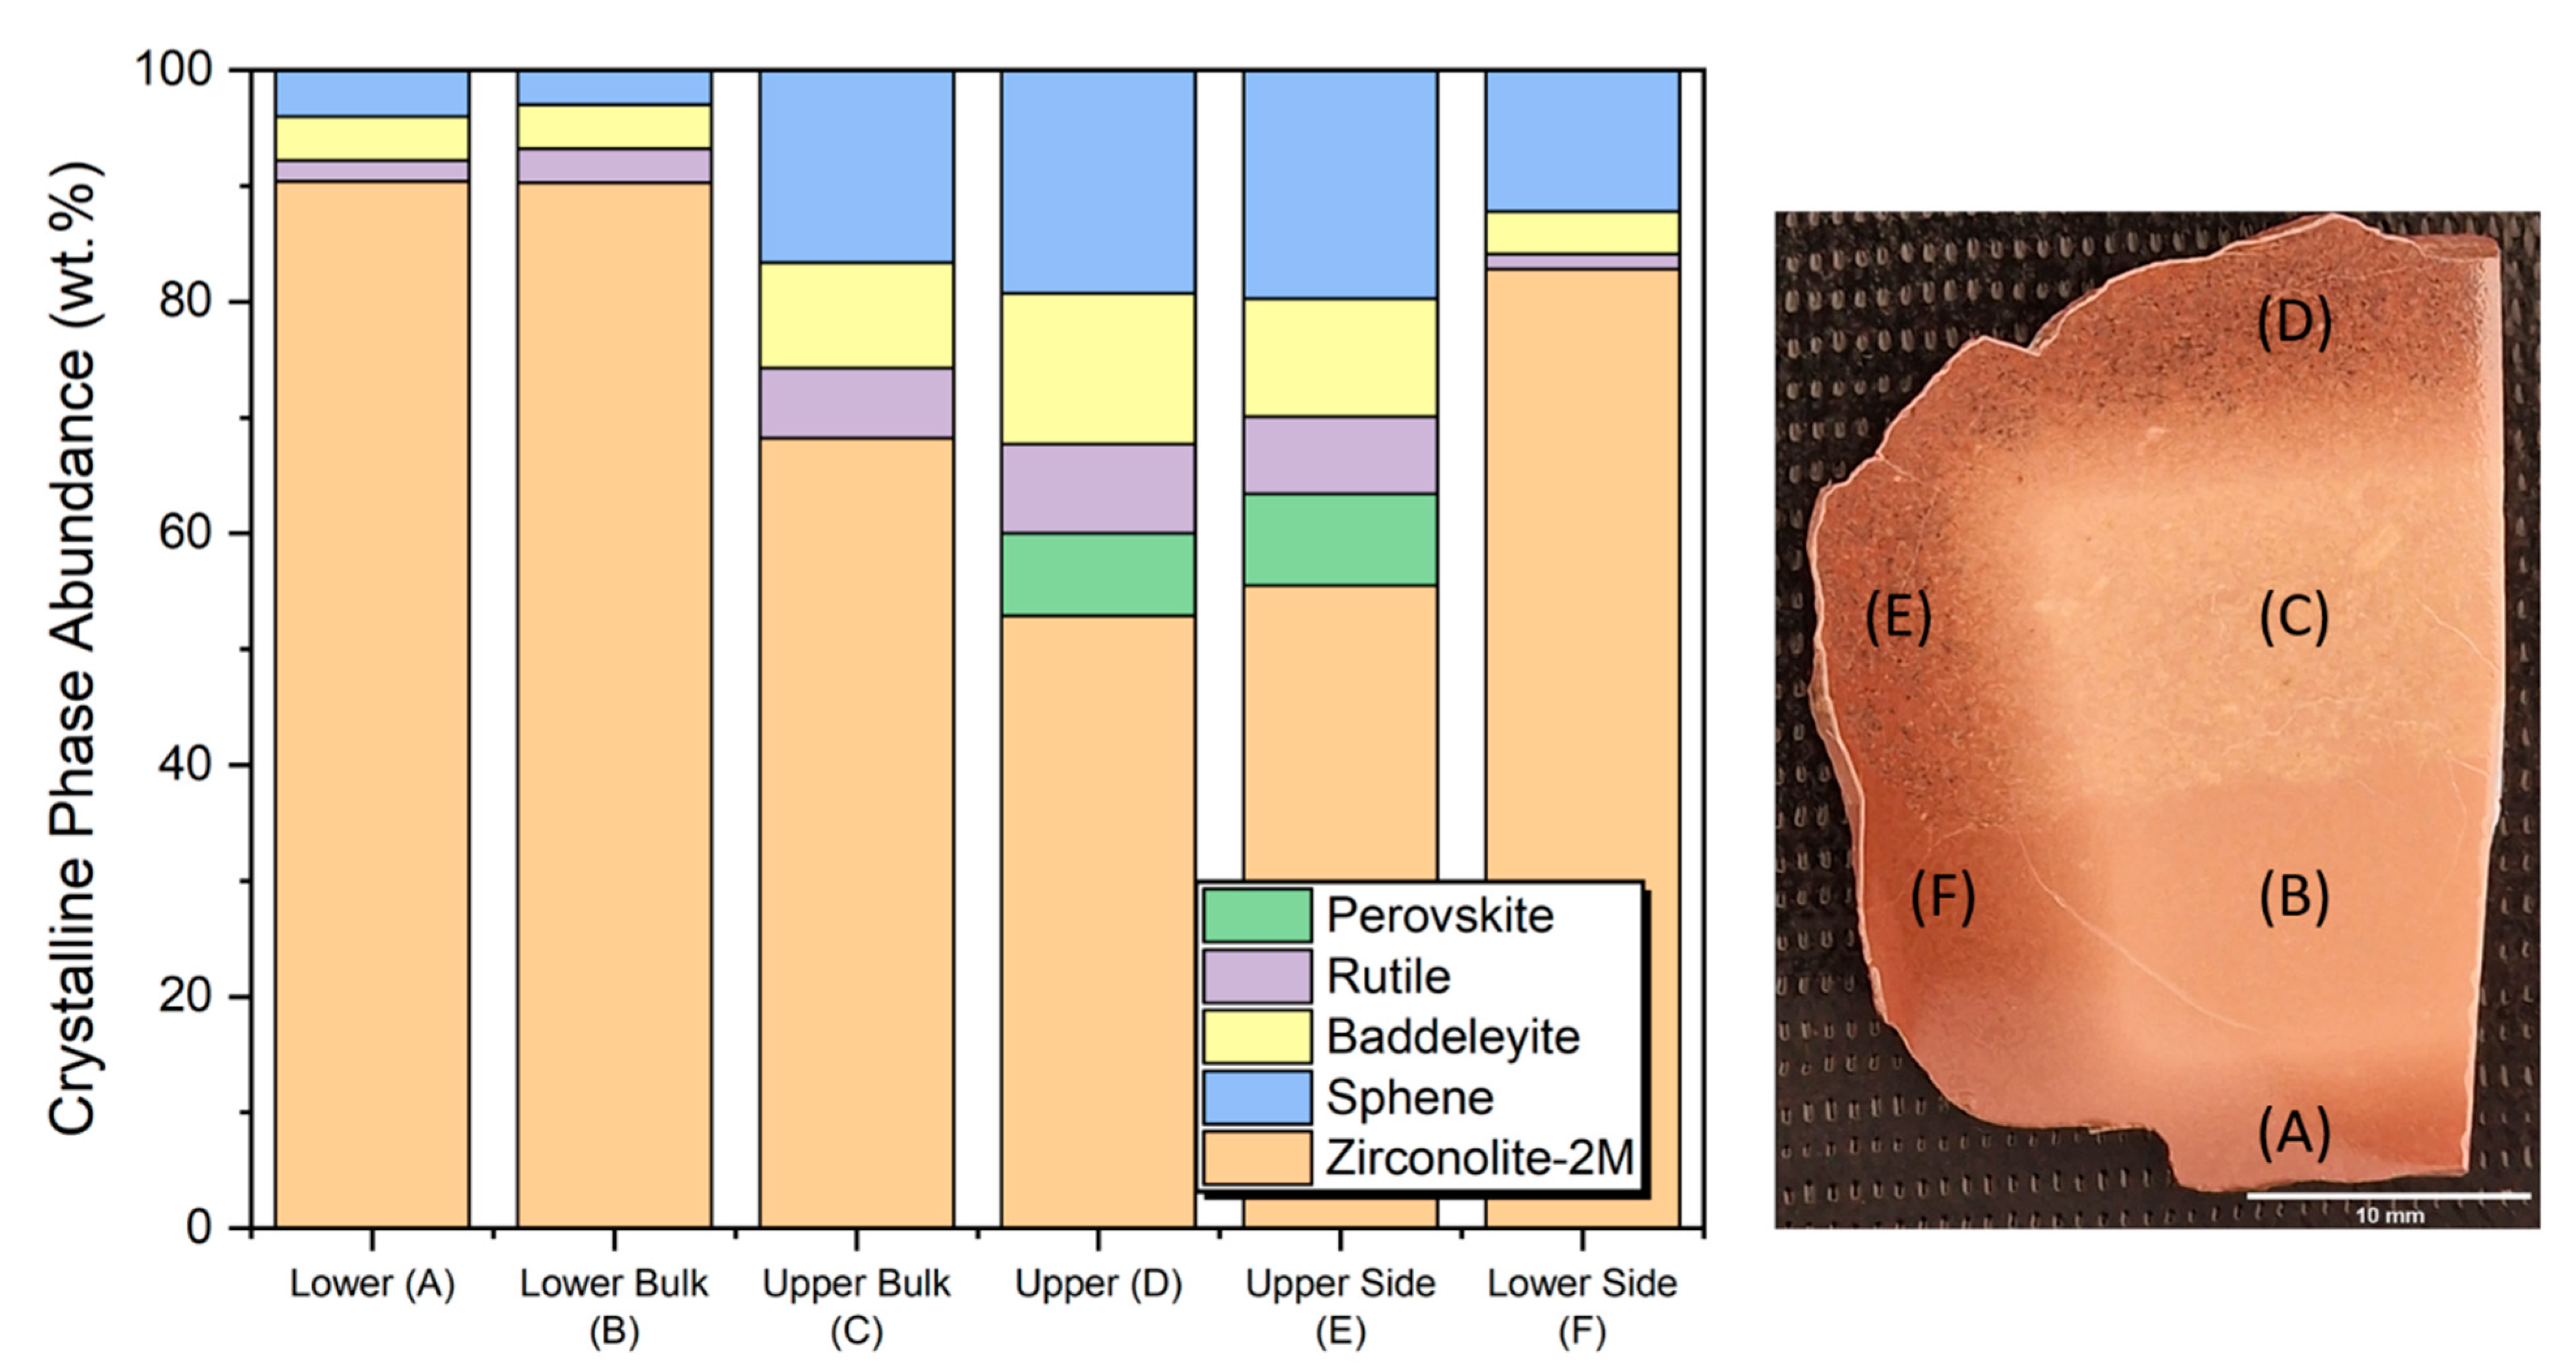
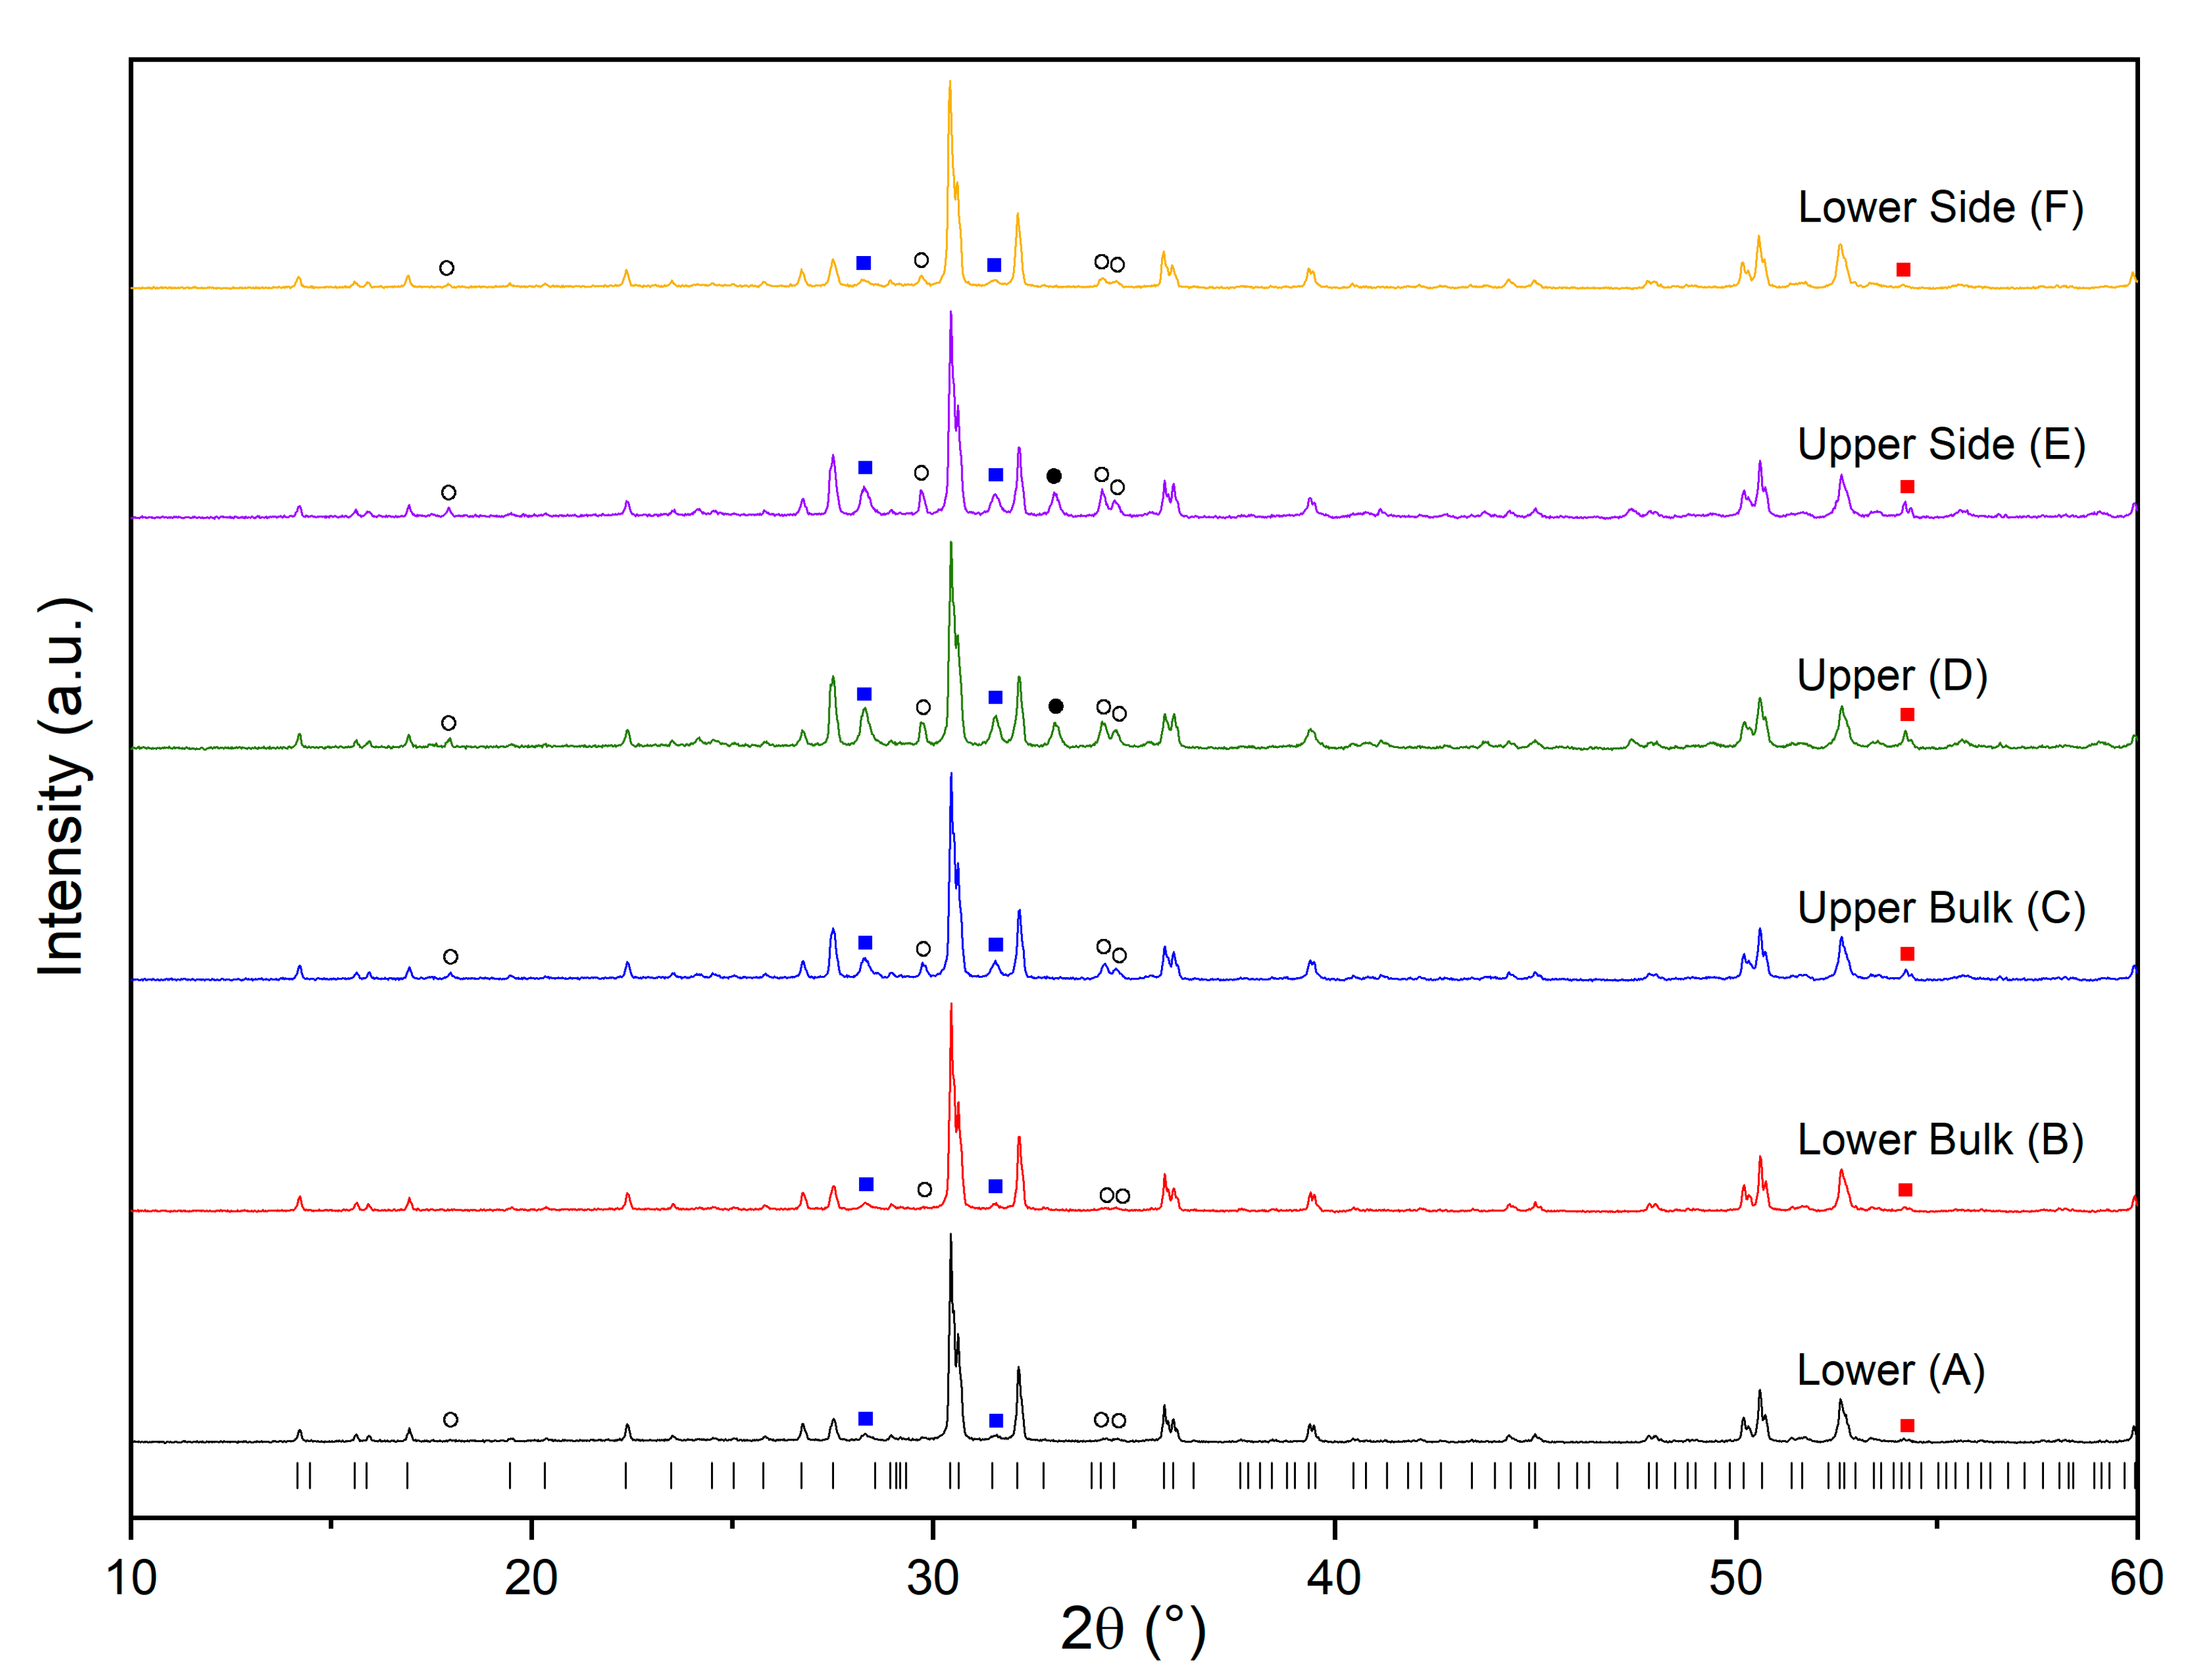
3.2.1. X-ray Diffraction

As expected from the preliminary analysis of cold-pressed and sintered materials of the same composition detailed above, zirconolite-2M and glass were the major phases in all regions of the HIPed material, with no zirconolite-3T being observed. The major differences between the regions were the apparent Ce oxidation states and relative abundances of the minority phases observed. All regions contained varying amounts of sphene (CaTiSiO5), rutile (TiO2) and baddeleyite (m-ZrO2), with two regions also containing perovskite (prototypically CaTiO3), as shown in Figure 3. The crystalline phase abundances were examined by Rietveld method refinements of the XRD patterns and are detailed in Figure 2 and Table 1.

Lower Bulk and Upper Bulk Regions

The lower bulk (region B) and upper bulk (region C) contained significant differences in crystalline phase assemblage. The lower bulk (B) contained a higher fraction of zirconolite-2M (90.3(4) wt.% of the overall crystalline phase assemblage), alongside baddeleyite (m-ZrO2, 3.8(2) wt.%), sphene (CaTiSiO5, 3.0(4) wt.%) and rutile (TiO2, 2.9(2) wt.%). In comparison, the upper bulk (C) contained significantly less zirconolite-2M (68.2(4) wt.%) and higher fractions of each of the three minority phases.

Lower and Upper Regions

The lower (A) and upper (D) regions were located adjacent to the top and bottom of the canister and contained significant fractions of Ce3+ compared to the lower bulk and upper bulk (see below). The lower region (A) contained the most significant fraction of zirconolite-2M of any region (90.4 (4) wt.%), alongside smaller fractions of (in descending order of abundance) sphene, baddeleyite and rutile, with overall crystalline phase abundances being very similar to those of the lower bulk. The upper region (D) contained the smallest fraction of zirconolite-2M of any region (52.9(3) wt.%) with high fractions of sphene (19.3 (4) wt.%), baddeleyite (13.0 (2) wt.%) and rutile (7.7 (2) wt.%). Notably, the upper region (D) contained a significant fraction of perovskite (prototypically CaTiO3, PDF card no. 01-077-8908, 7.1 (2) wt.%), likely as a result of the lower average Ce oxidation state. Perovskite was also observed in the cold-pressed and sintered (CPS) glass–ceramics of the same composition, both of which were also expected to contain Ce3+ as the dominant Ce oxidation state, though at a smaller fraction (e.g., 1.7(2) wt.% when heated in Ar).

Lower Side and Upper Side Regions

The crystalline phase assemblages of the lower side (F) and upper side (E) regions followed the same trends as the upper/lower and upper/lower bulk regions. The lower side region (F) contained a larger fraction of zirconolite-2M (82.8 (5) wt.%) than the upper side (E, 55.5 (3) wt.%) with correspondingly lower fractions of sphene (12.2 (4) vs. 19.7 (3) wt.%), baddeleyite (3.7 (2) vs. 10.2 (2) wt.%) and rutile (1.3 (2) vs. 6.7 (2) wt.%). As for the upper region (D), a relatively large fraction of perovskite was observed (7.9(2) wt.%), again due to the lower overall Ce oxidation state.

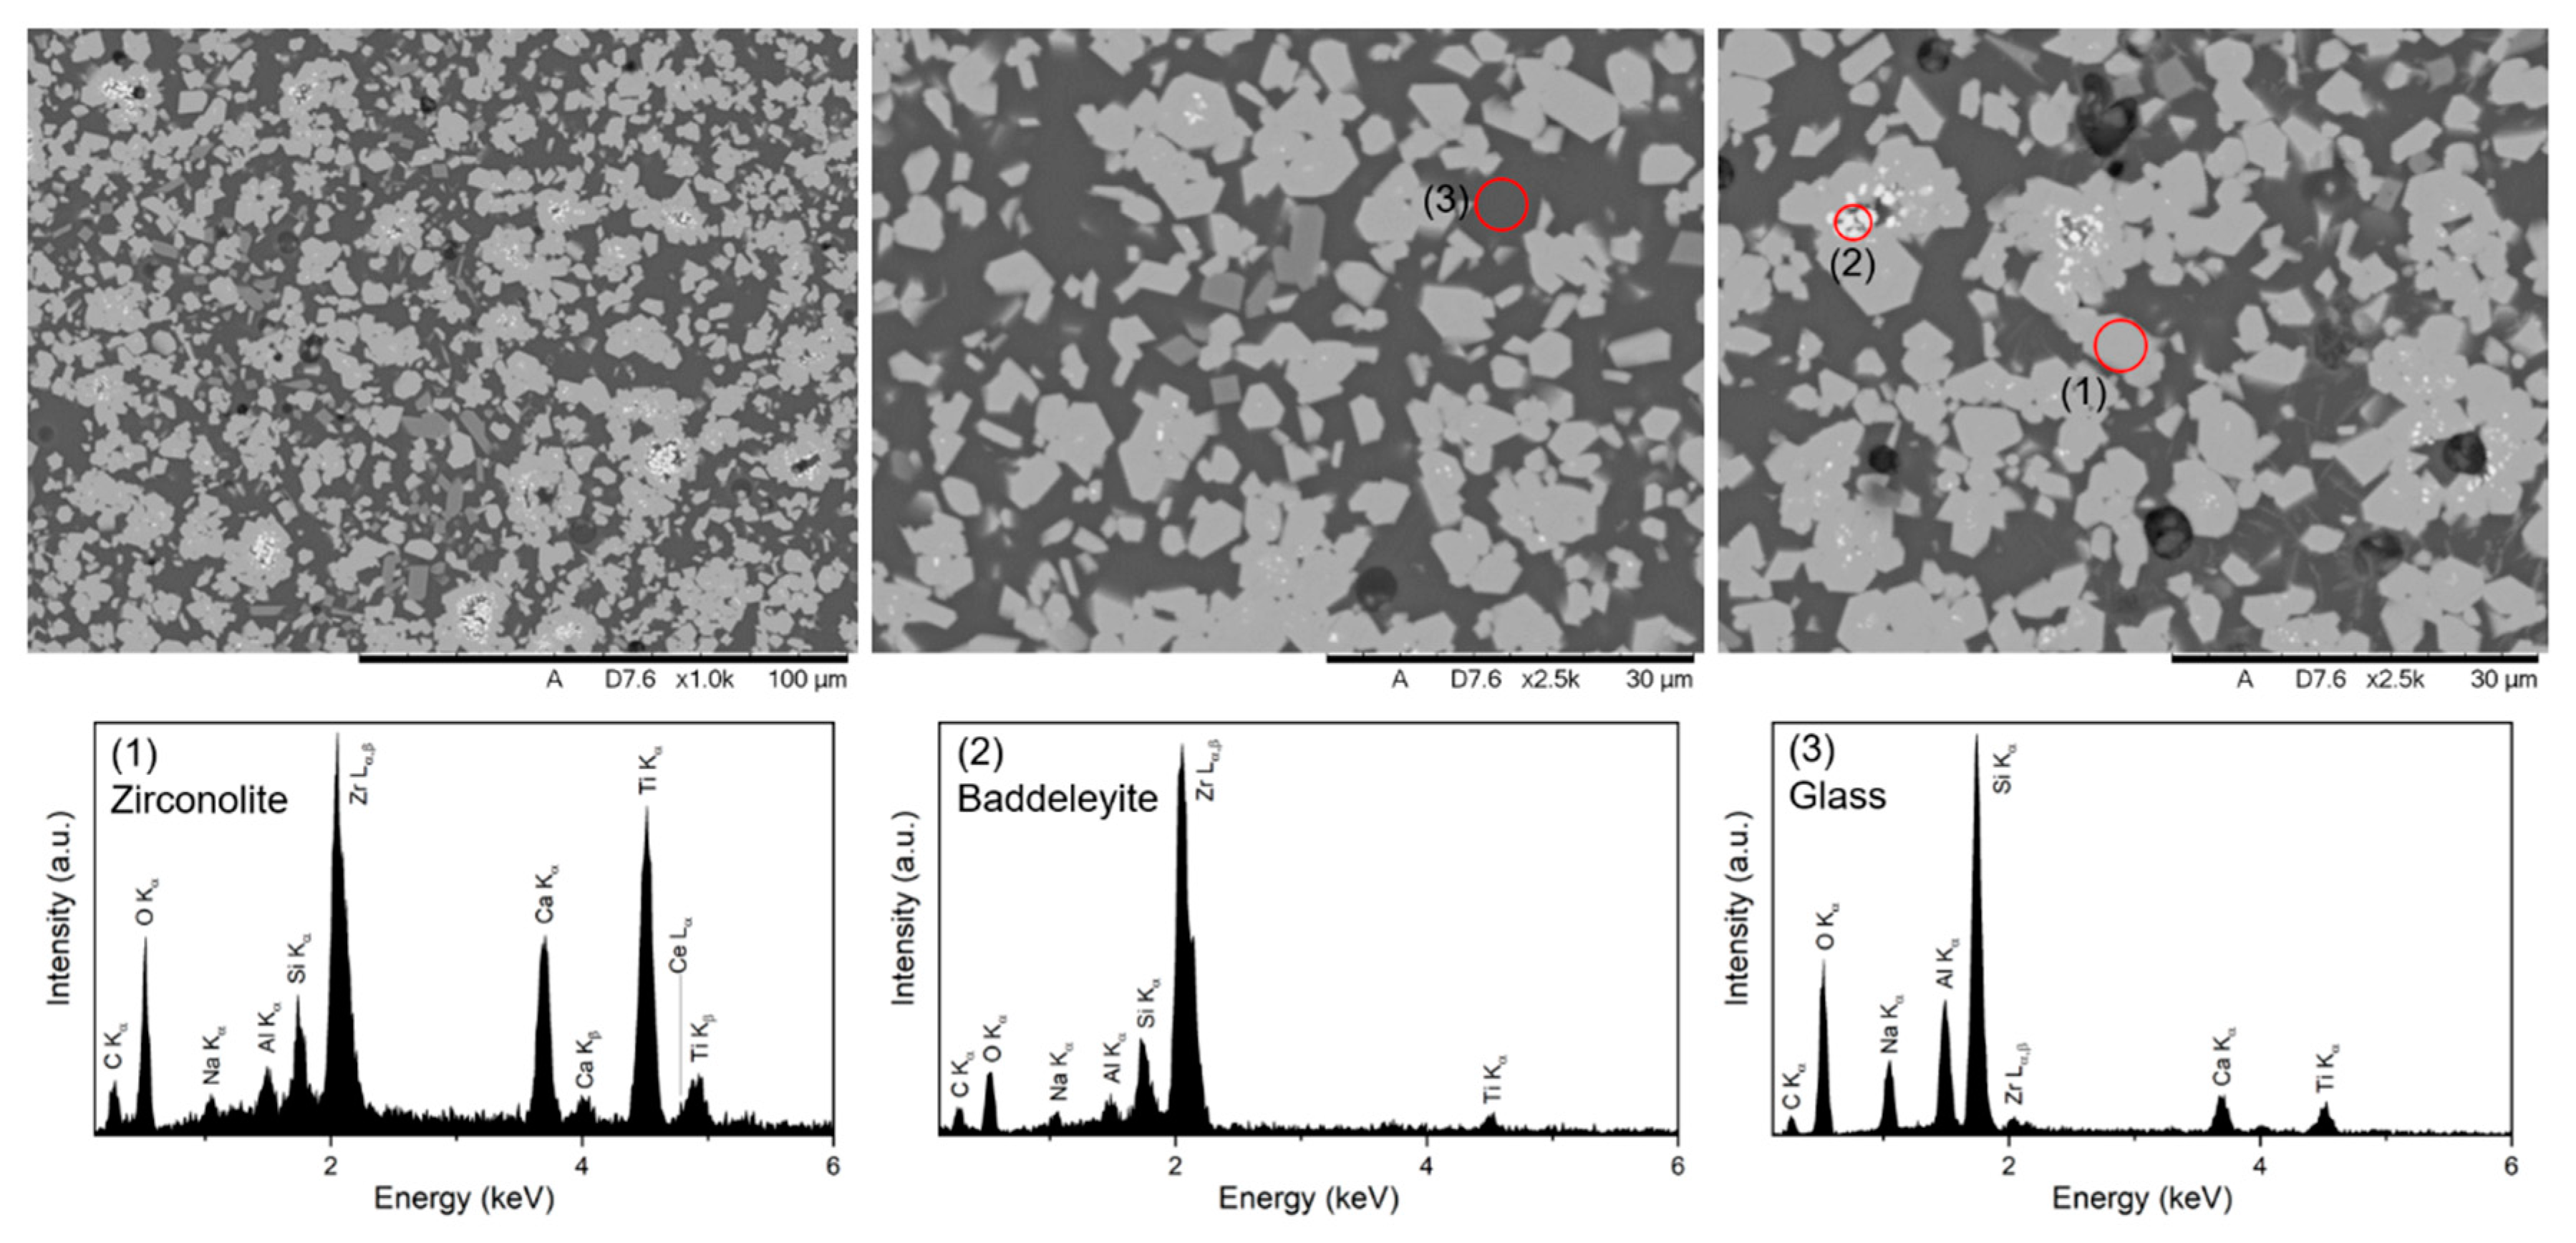
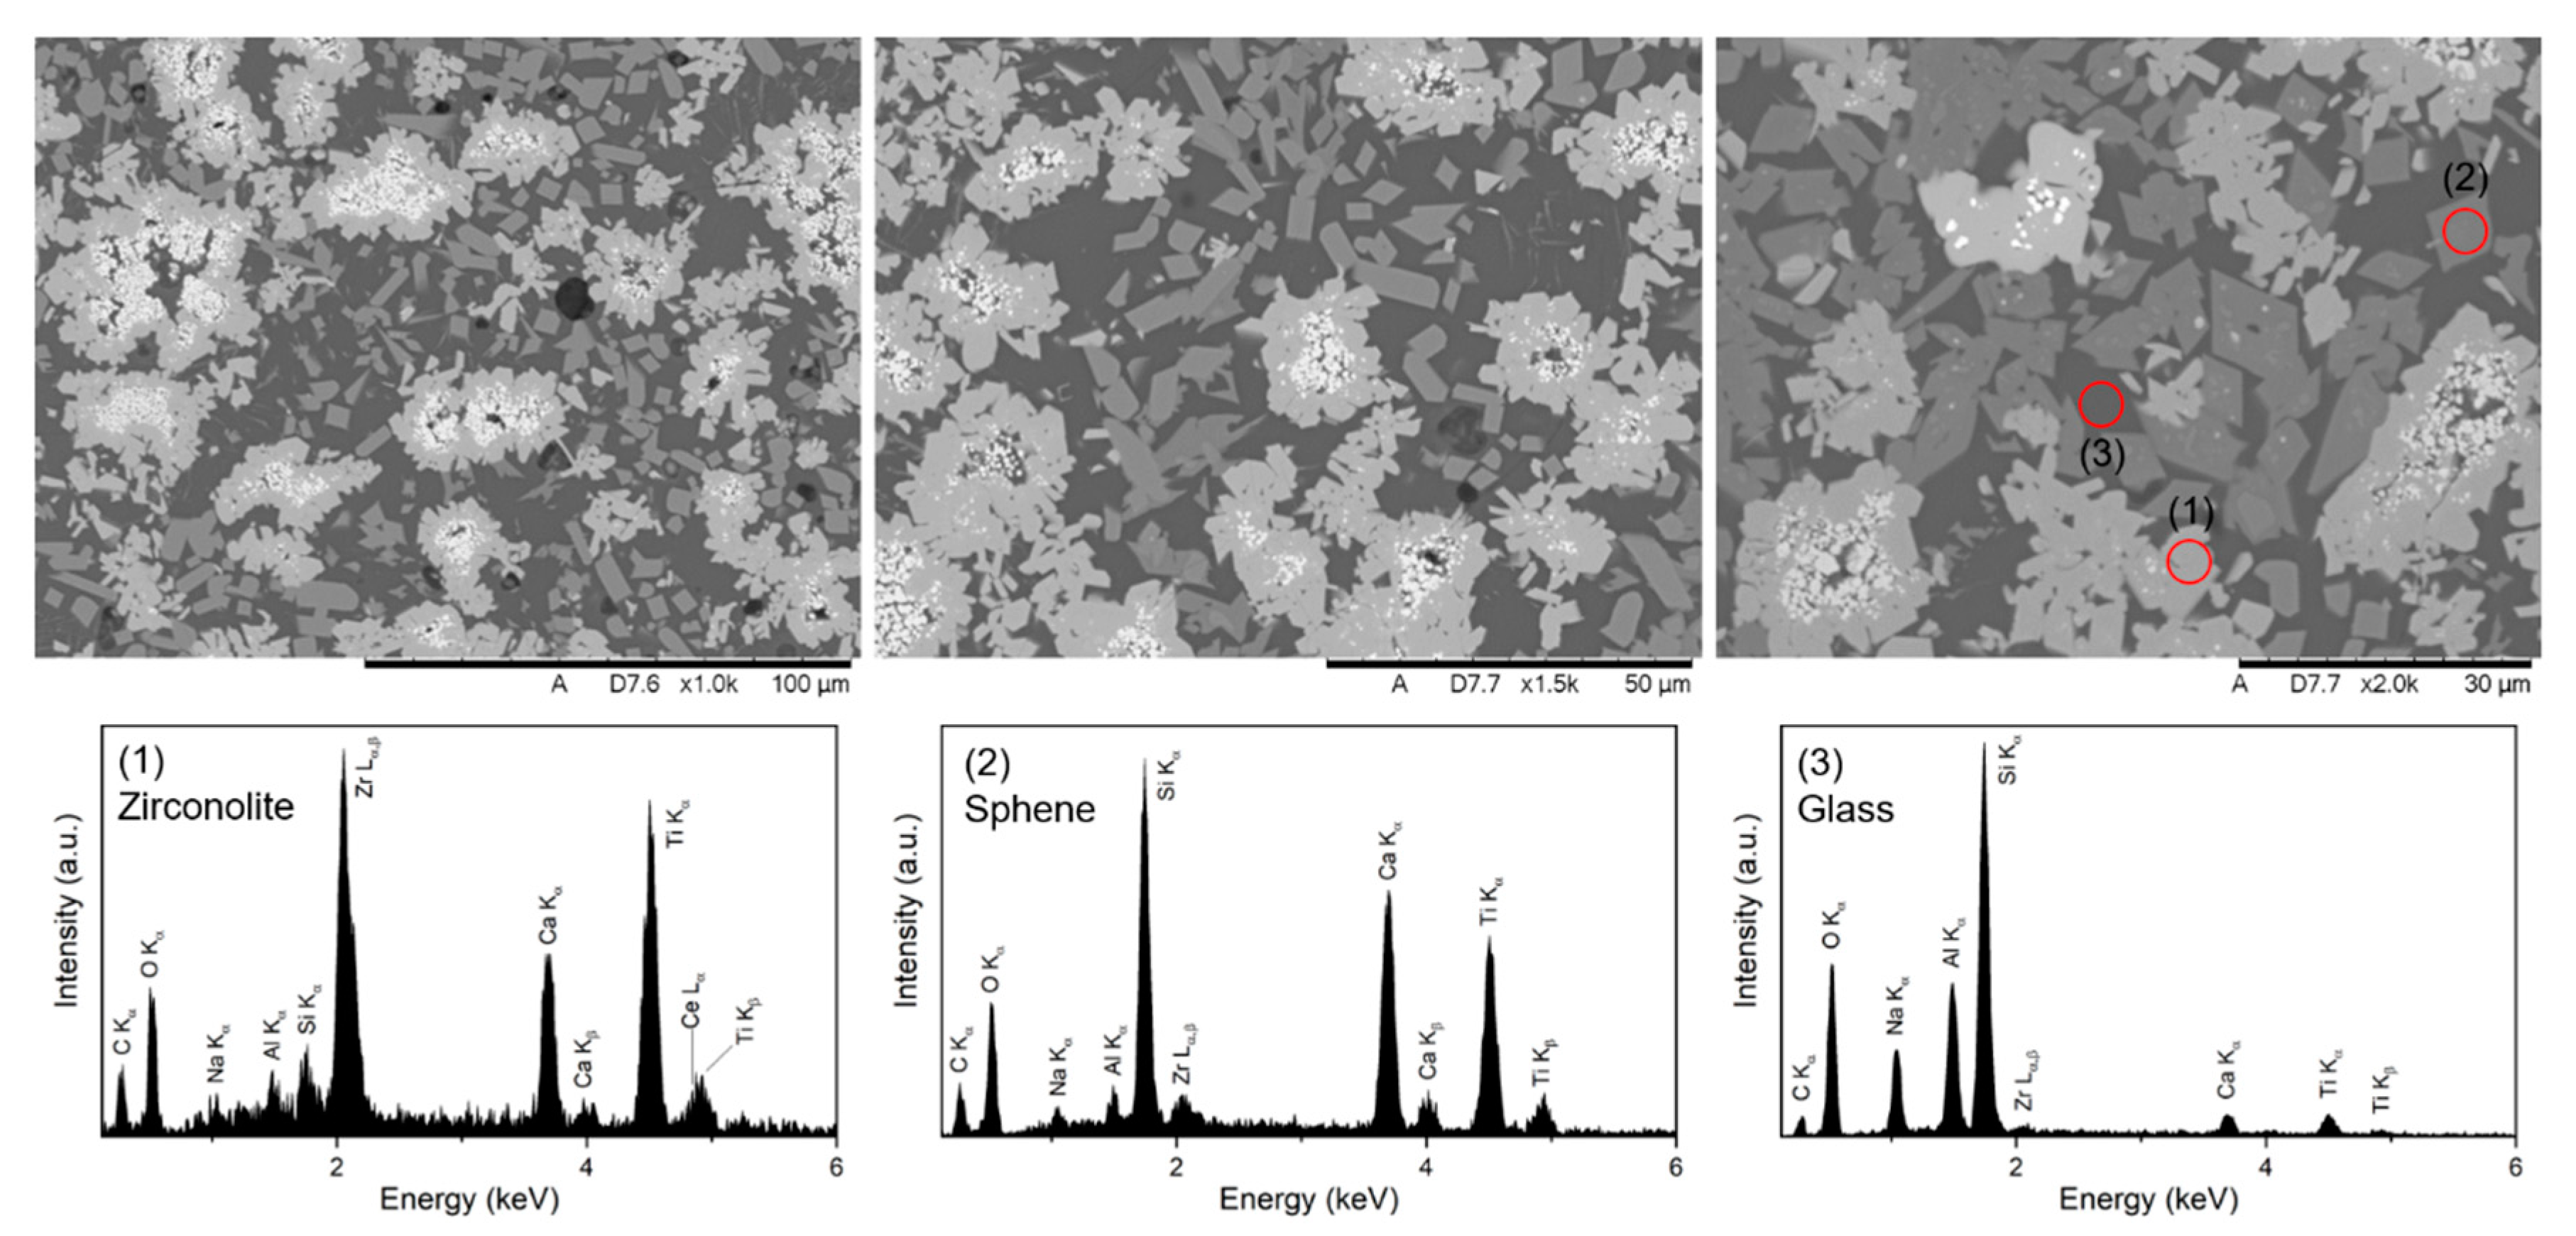
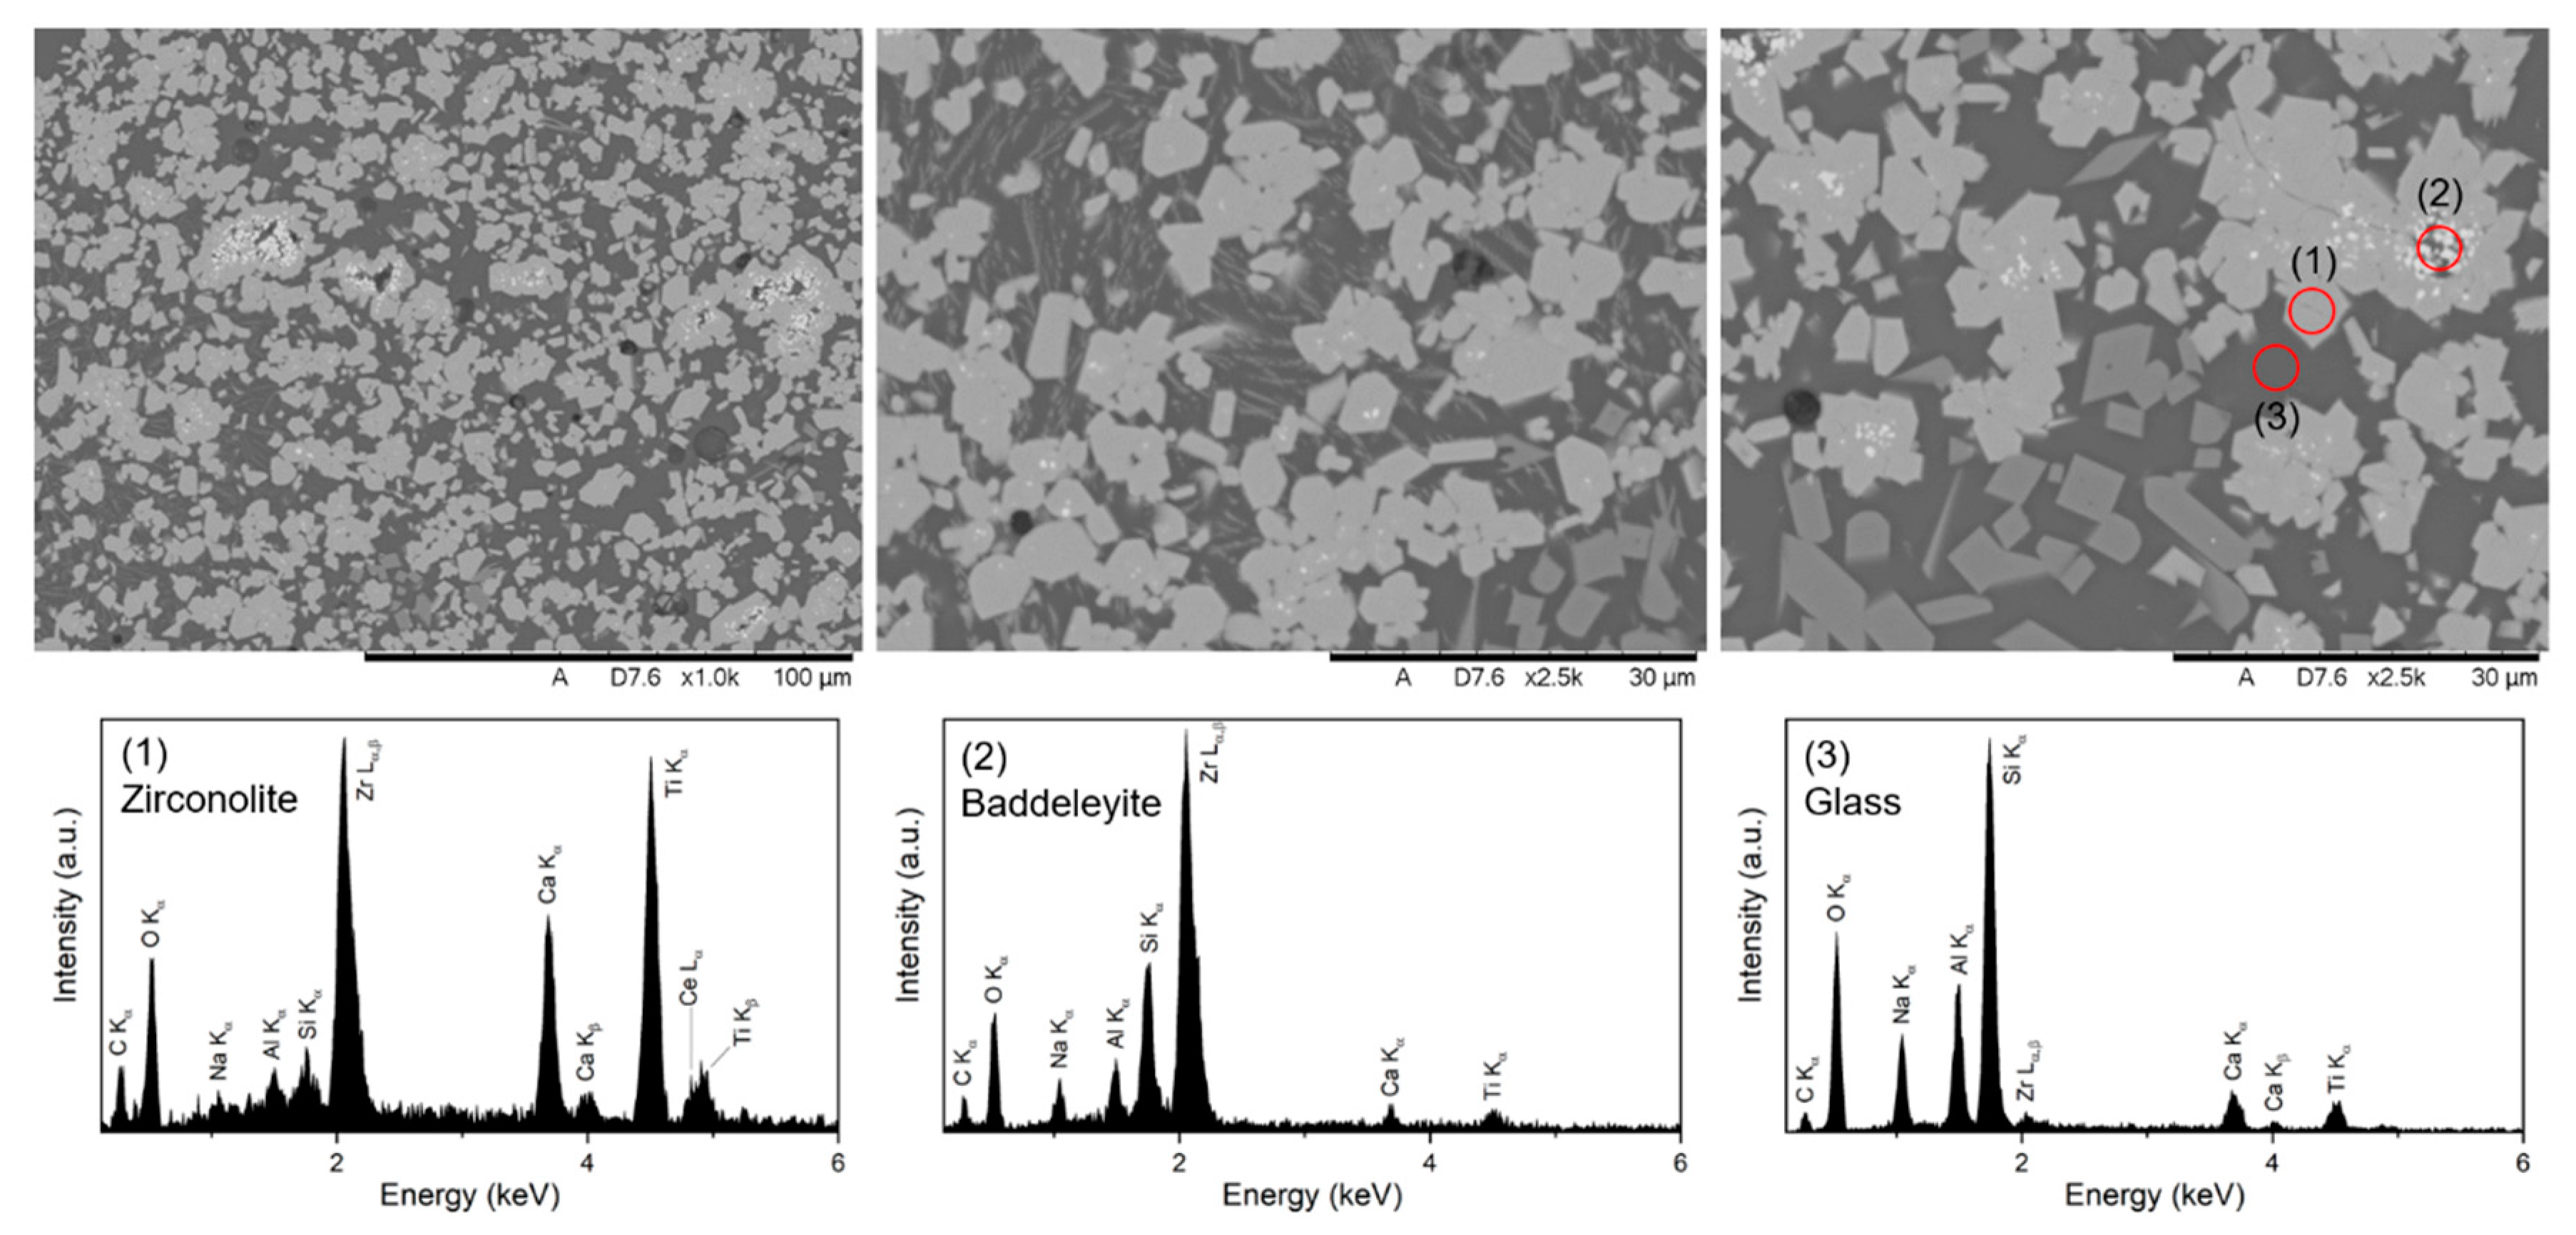
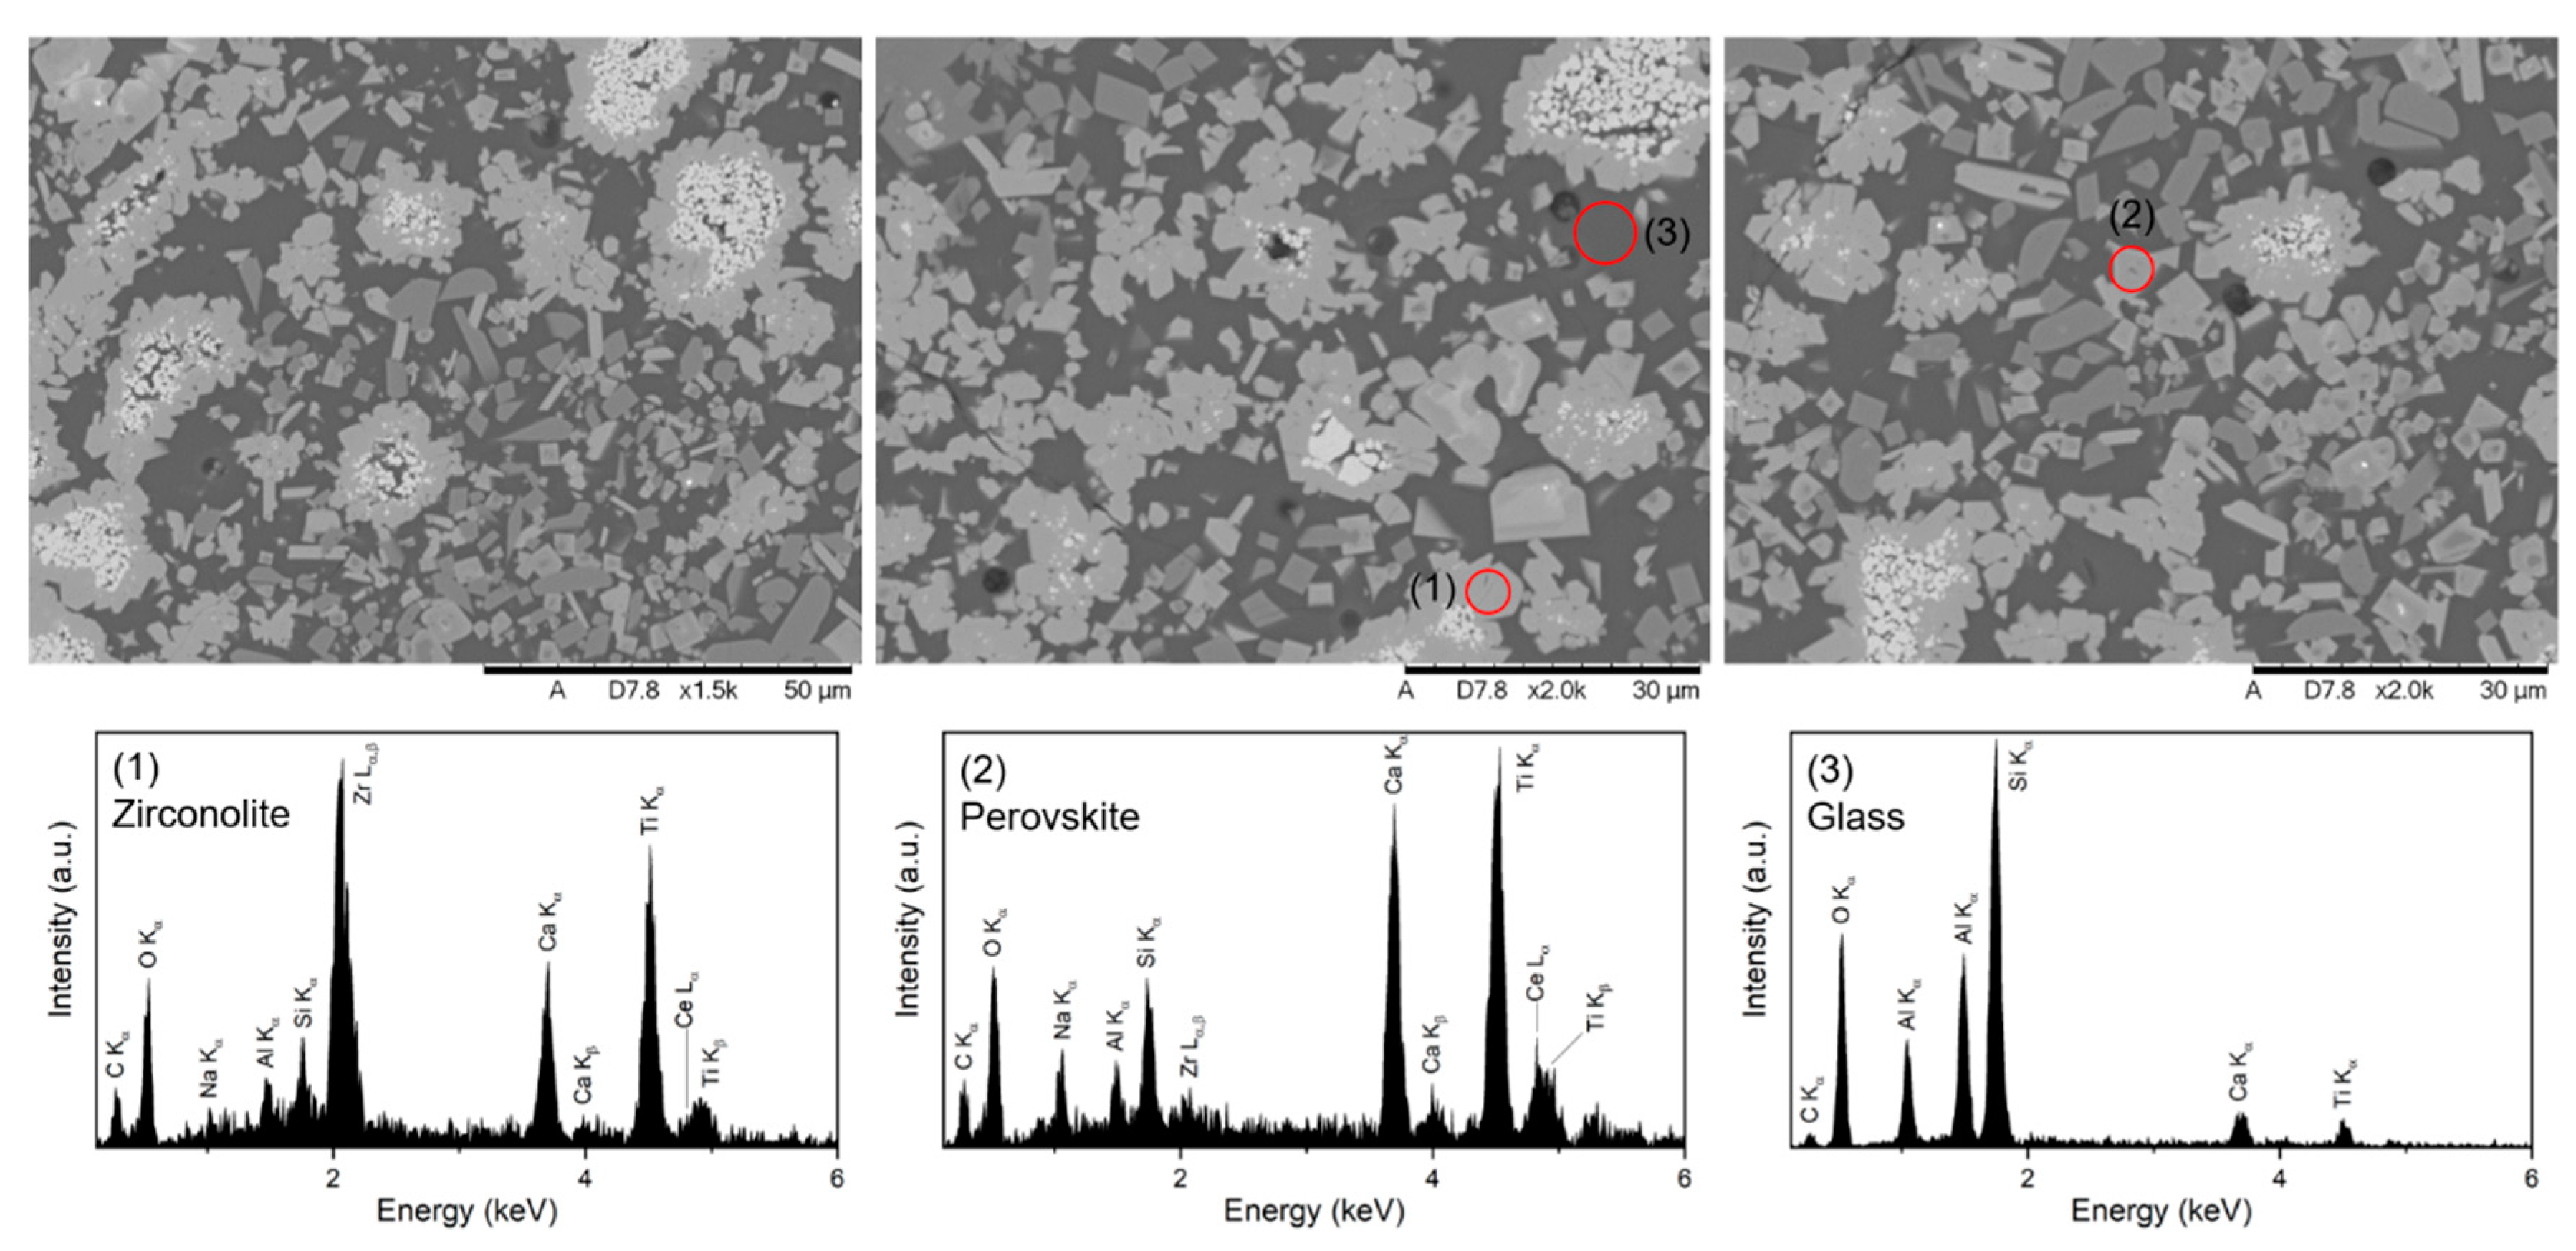
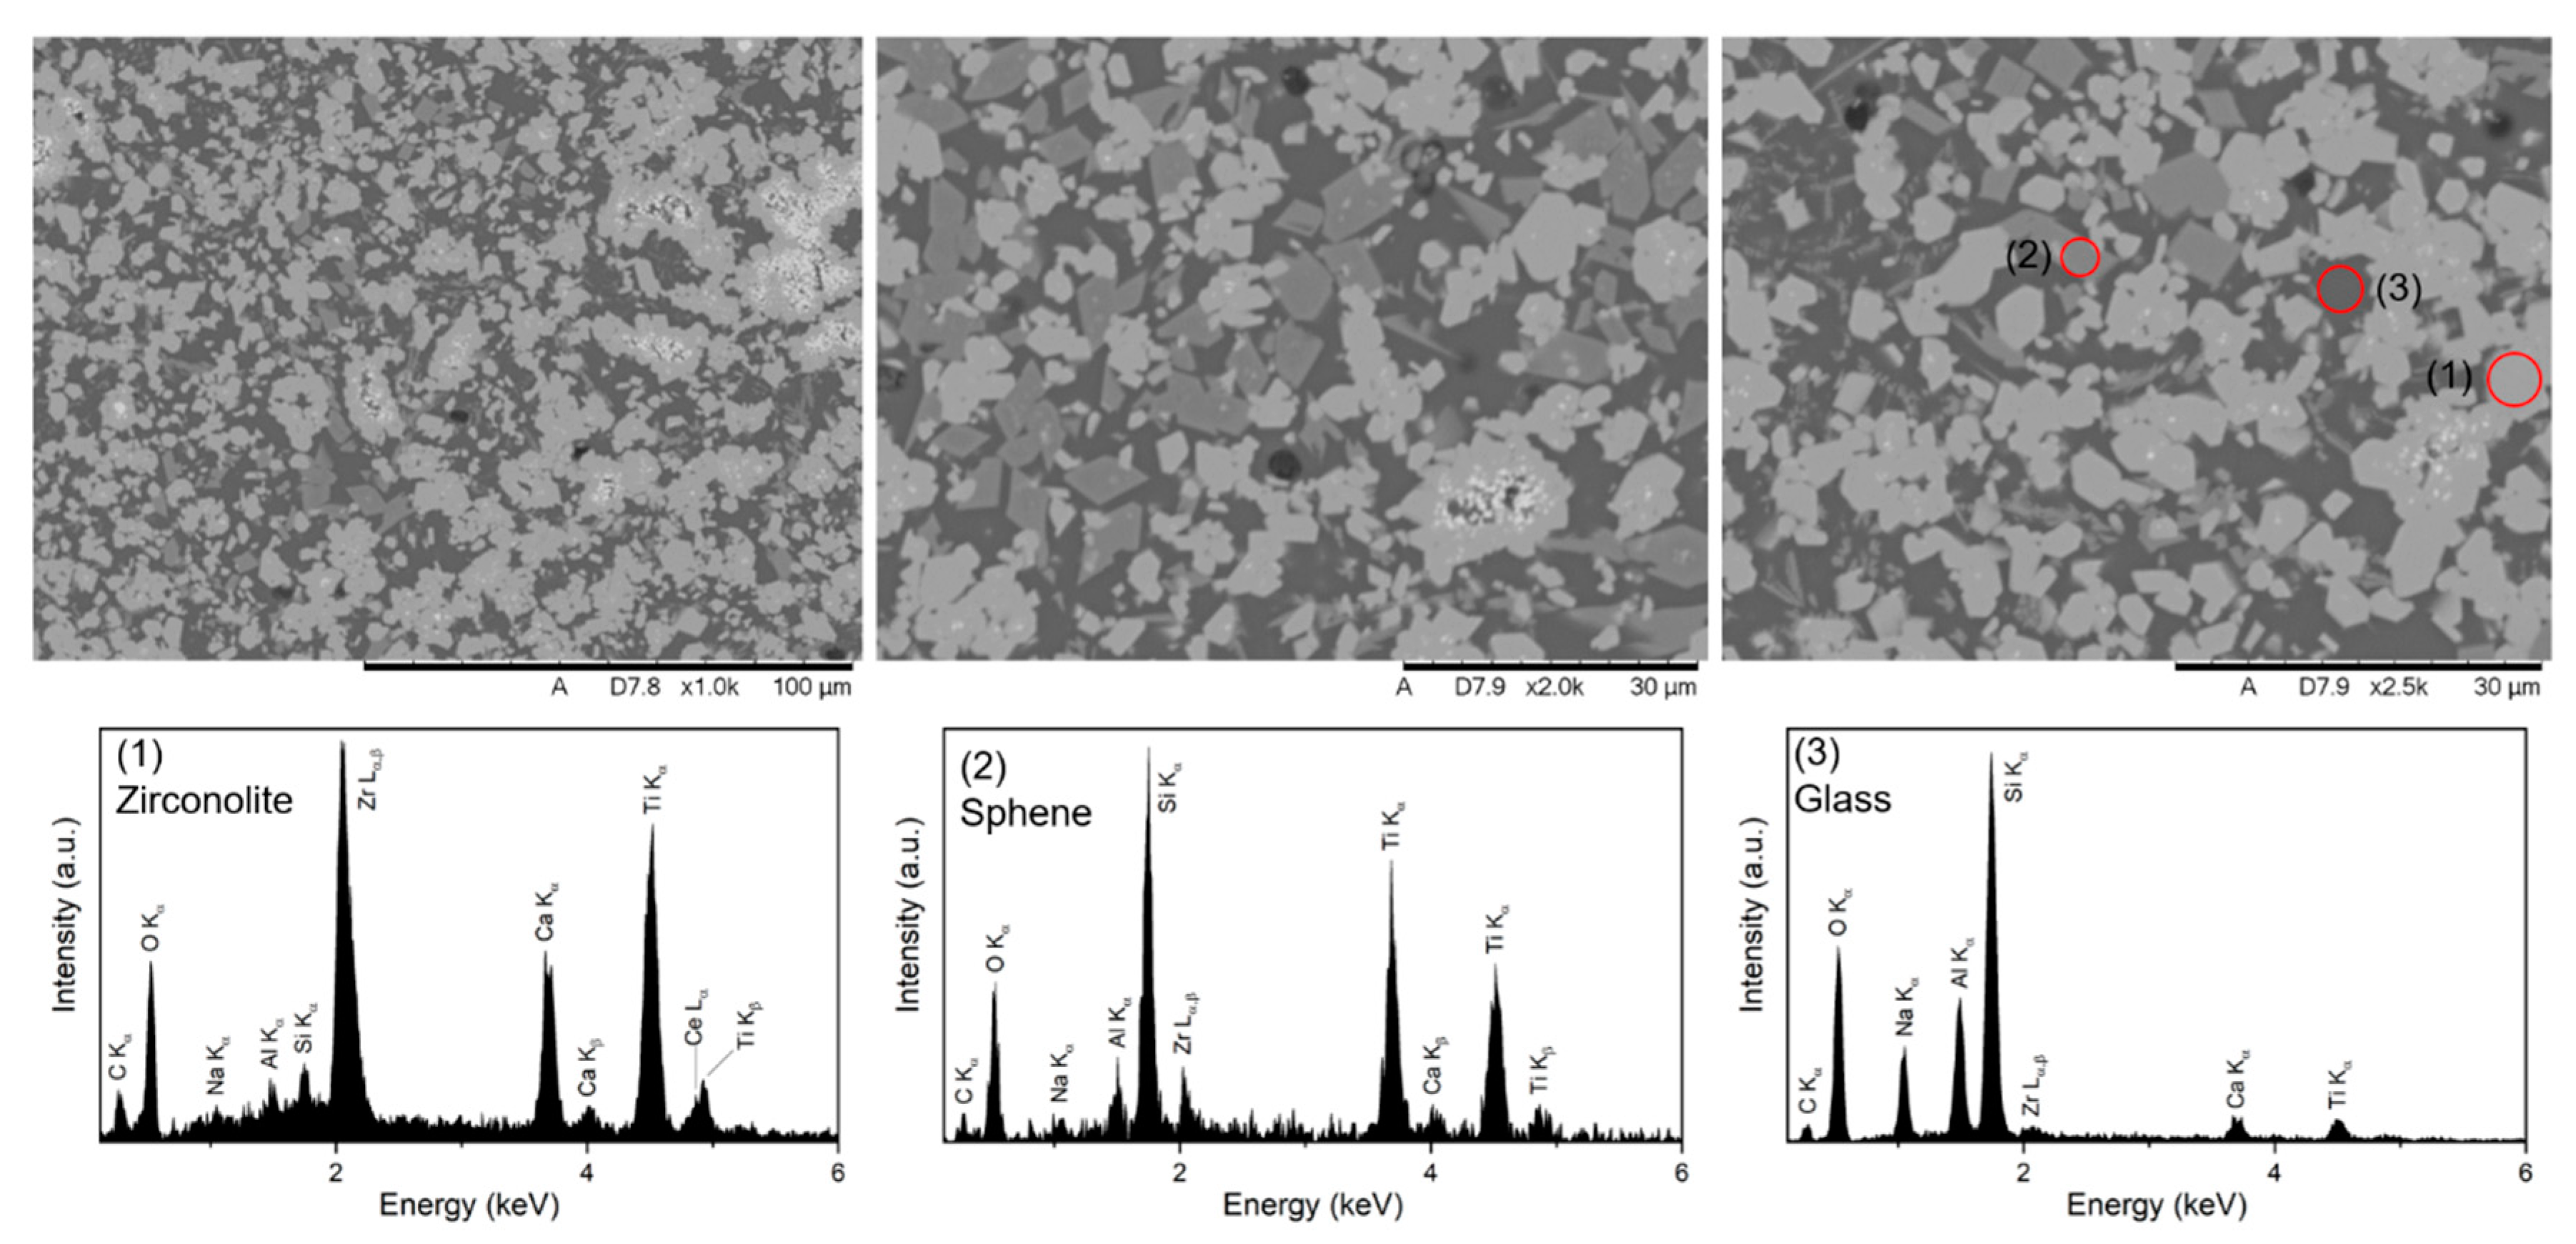
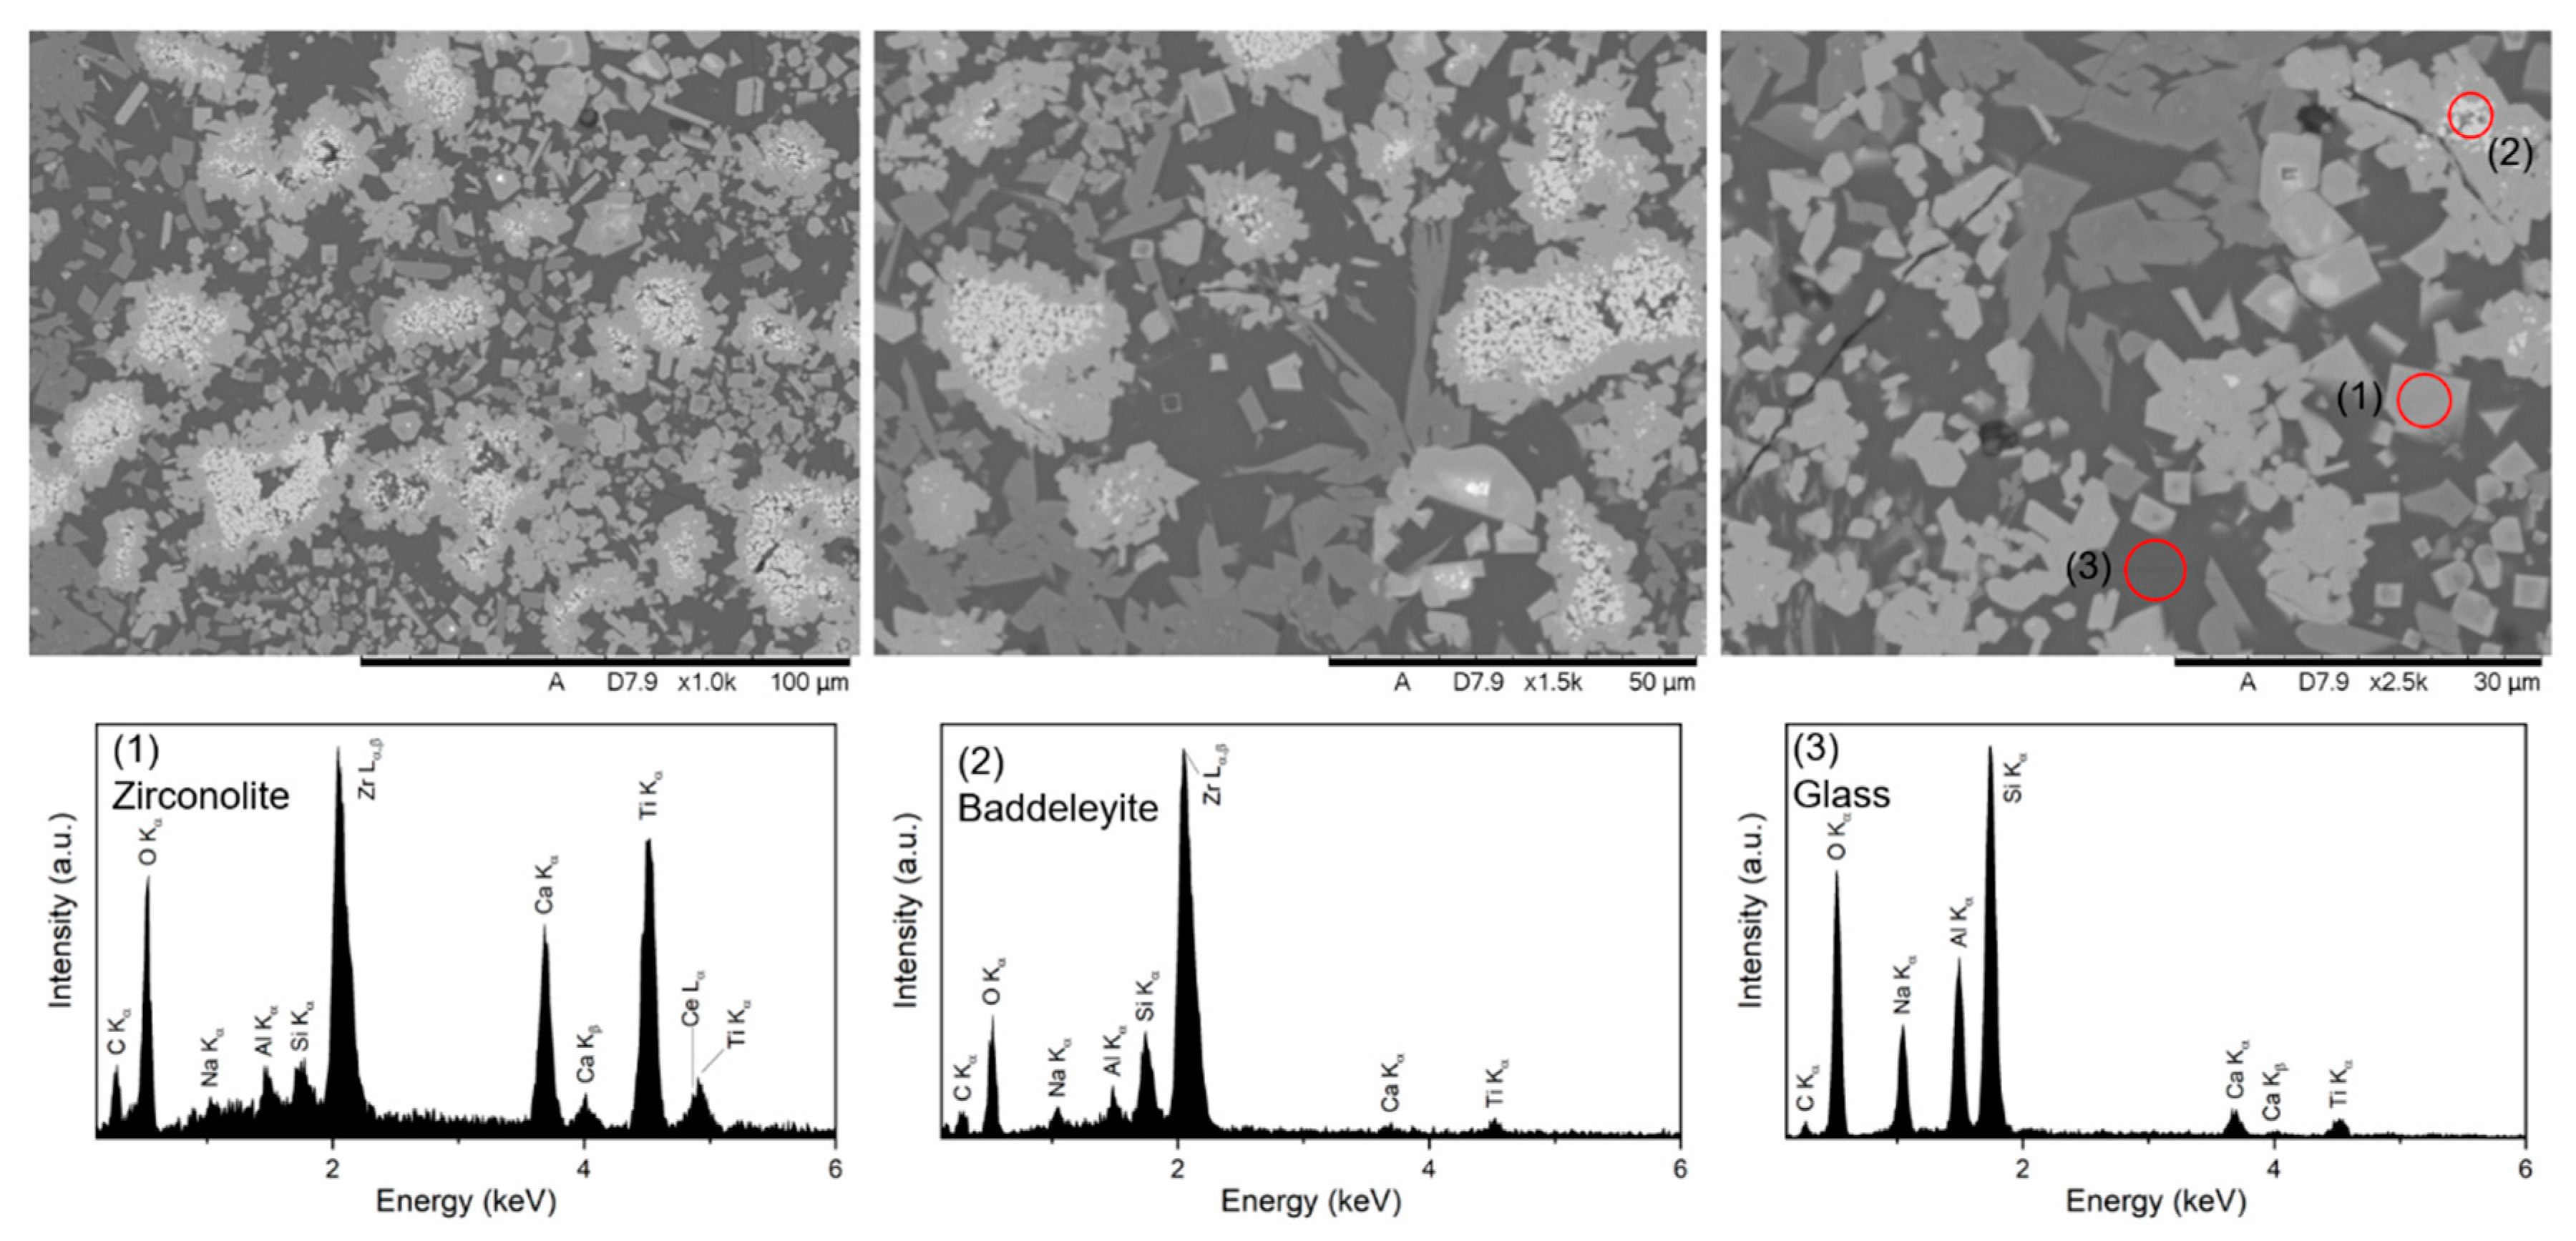
3.2.2. Scanning Electron Microscopy

Lower Bulk and Upper Bulk Regions

As observed by XRD, zirconolite-2M (light grey, approx. particle size 3–10 μm) was the most abundant phase in the lower bulk (B, see Figure 4) and was present as isolated particles and clusters of these particles held within the glass matrix (darkest region). Many regions of zirconolite-2M also contained small clusters of baddeleyite (m-ZrO2, brightest particles, approx. 0.5–2 μm) within their core. Grains of sphene (CaTiSiO5, dark grey, approx. 3–5 μm) and rutile (TiO2, thin dark grey crystals, approx. 3 × 0.5 μm) were also observed within the glass. A small number of isolated pores were also seen with approx. sizes of 3–7.5 μm.
In comparison, the upper bulk (C, see Figure 5) contained significantly higher fractions of the minority phases observed in the lower bulk (B). The large clusters of zirconolite-2M (light grey, individual particle size approx. 3–10 μm) surrounded significant regions of baddeleyite (brightest particles, approx. 0.5–4 μm). Particles of sphene (dark grey, 5–15 μm) were significantly more abundant and contained small regions of rutile (mid-grey, approx. 0.5–3 μm) in many cases. Individual particles of rutile were also observed within the glass matrix. Similar to the lower bulk, some isolated pores were seen with approx. sizes of 3–10 μm.

Lower and Upper Regions

The microstructure of the lower region (A, see Figure 6) was similar to that of the lower bulk (B), keeping with the similar phase assemblages observed by XRD. Zirconolite-2M (light grey, approx. 5–15 μm) was present as isolated particles and as larger clusters, with the clusters often containing small clusters of baddeleyite (brightest regions, approx. 0.5–2 μm). Isolated particles of sphene (dark grey, approx. 4–10 μm) and long thin laths of rutile (dark grey, approx. 0.5 × 6 μm) were also seen within the glass.
As observed for the bulk regions, the upper region (D, see Figure 7) contained significantly higher fractions of minority phases than the lower region (A). Particles of baddeleyite (brightest particles, approx. 0.5–3 μm) within large clusters of zirconolite-2M (light grey, approx. 3–10 μm) were observed. Isolated particles of sphene (mid-grey, approx. 5–10 μm) and rutile (dark grey, approx. 3–10 μm) were also observed within the glass matrix. Small regions of perovskite (dark grey) were observed within some of the smaller grains of zirconolite.

Lower Side and Upper Side Regions

The microstructure of the lower side region (F, Figure 8) was observed to be very similar to that of the lower (A) and lower bulk (B) regions but with higher fractions of sphene, which was in agreement with XRD analysis. Zirconolite-2M (light grey, approx. 3–12 μm) was the major phase and was present as particles and larger clusters within the glass matrix. As observed for the other regions of this HIP canister, groups of baddeleyite particles (brightest particles, approx. 0.5–2 μm) were seen within larger clusters of zirconolite. Sphene was present as mid-grey particles (approx. 5–10 μm) within the glass matrix, with thin laths of rutile also being observed (dark grey, approx. 0.5 × 3 μm).
As expected from their similar phase assemblages (see Figure 2), the upper side region (E, see Figure 9) comprised a very similar microstructure to that of the upper region (D). The major phases were particles and clusters of zirconolite (light grey, approx. 3–10 μm), glass (dark background) and sphene (CaTiSiO5, dark grey, approx. 5–15 μm). Many particles of sphene also contained regions of rutile (TiO2, mid-grey, approx. 0.5–2 μm) Larger clusters of zirconolite surrounded large clusters of baddeleyite (m-ZrO2, brightest region, individual particles approx. 0.5–2 μm). Perovskite was apparent as dark regions within some grains of zirconolite, though it was not observed in an abundance as high as expected from the refined phase assemblages.

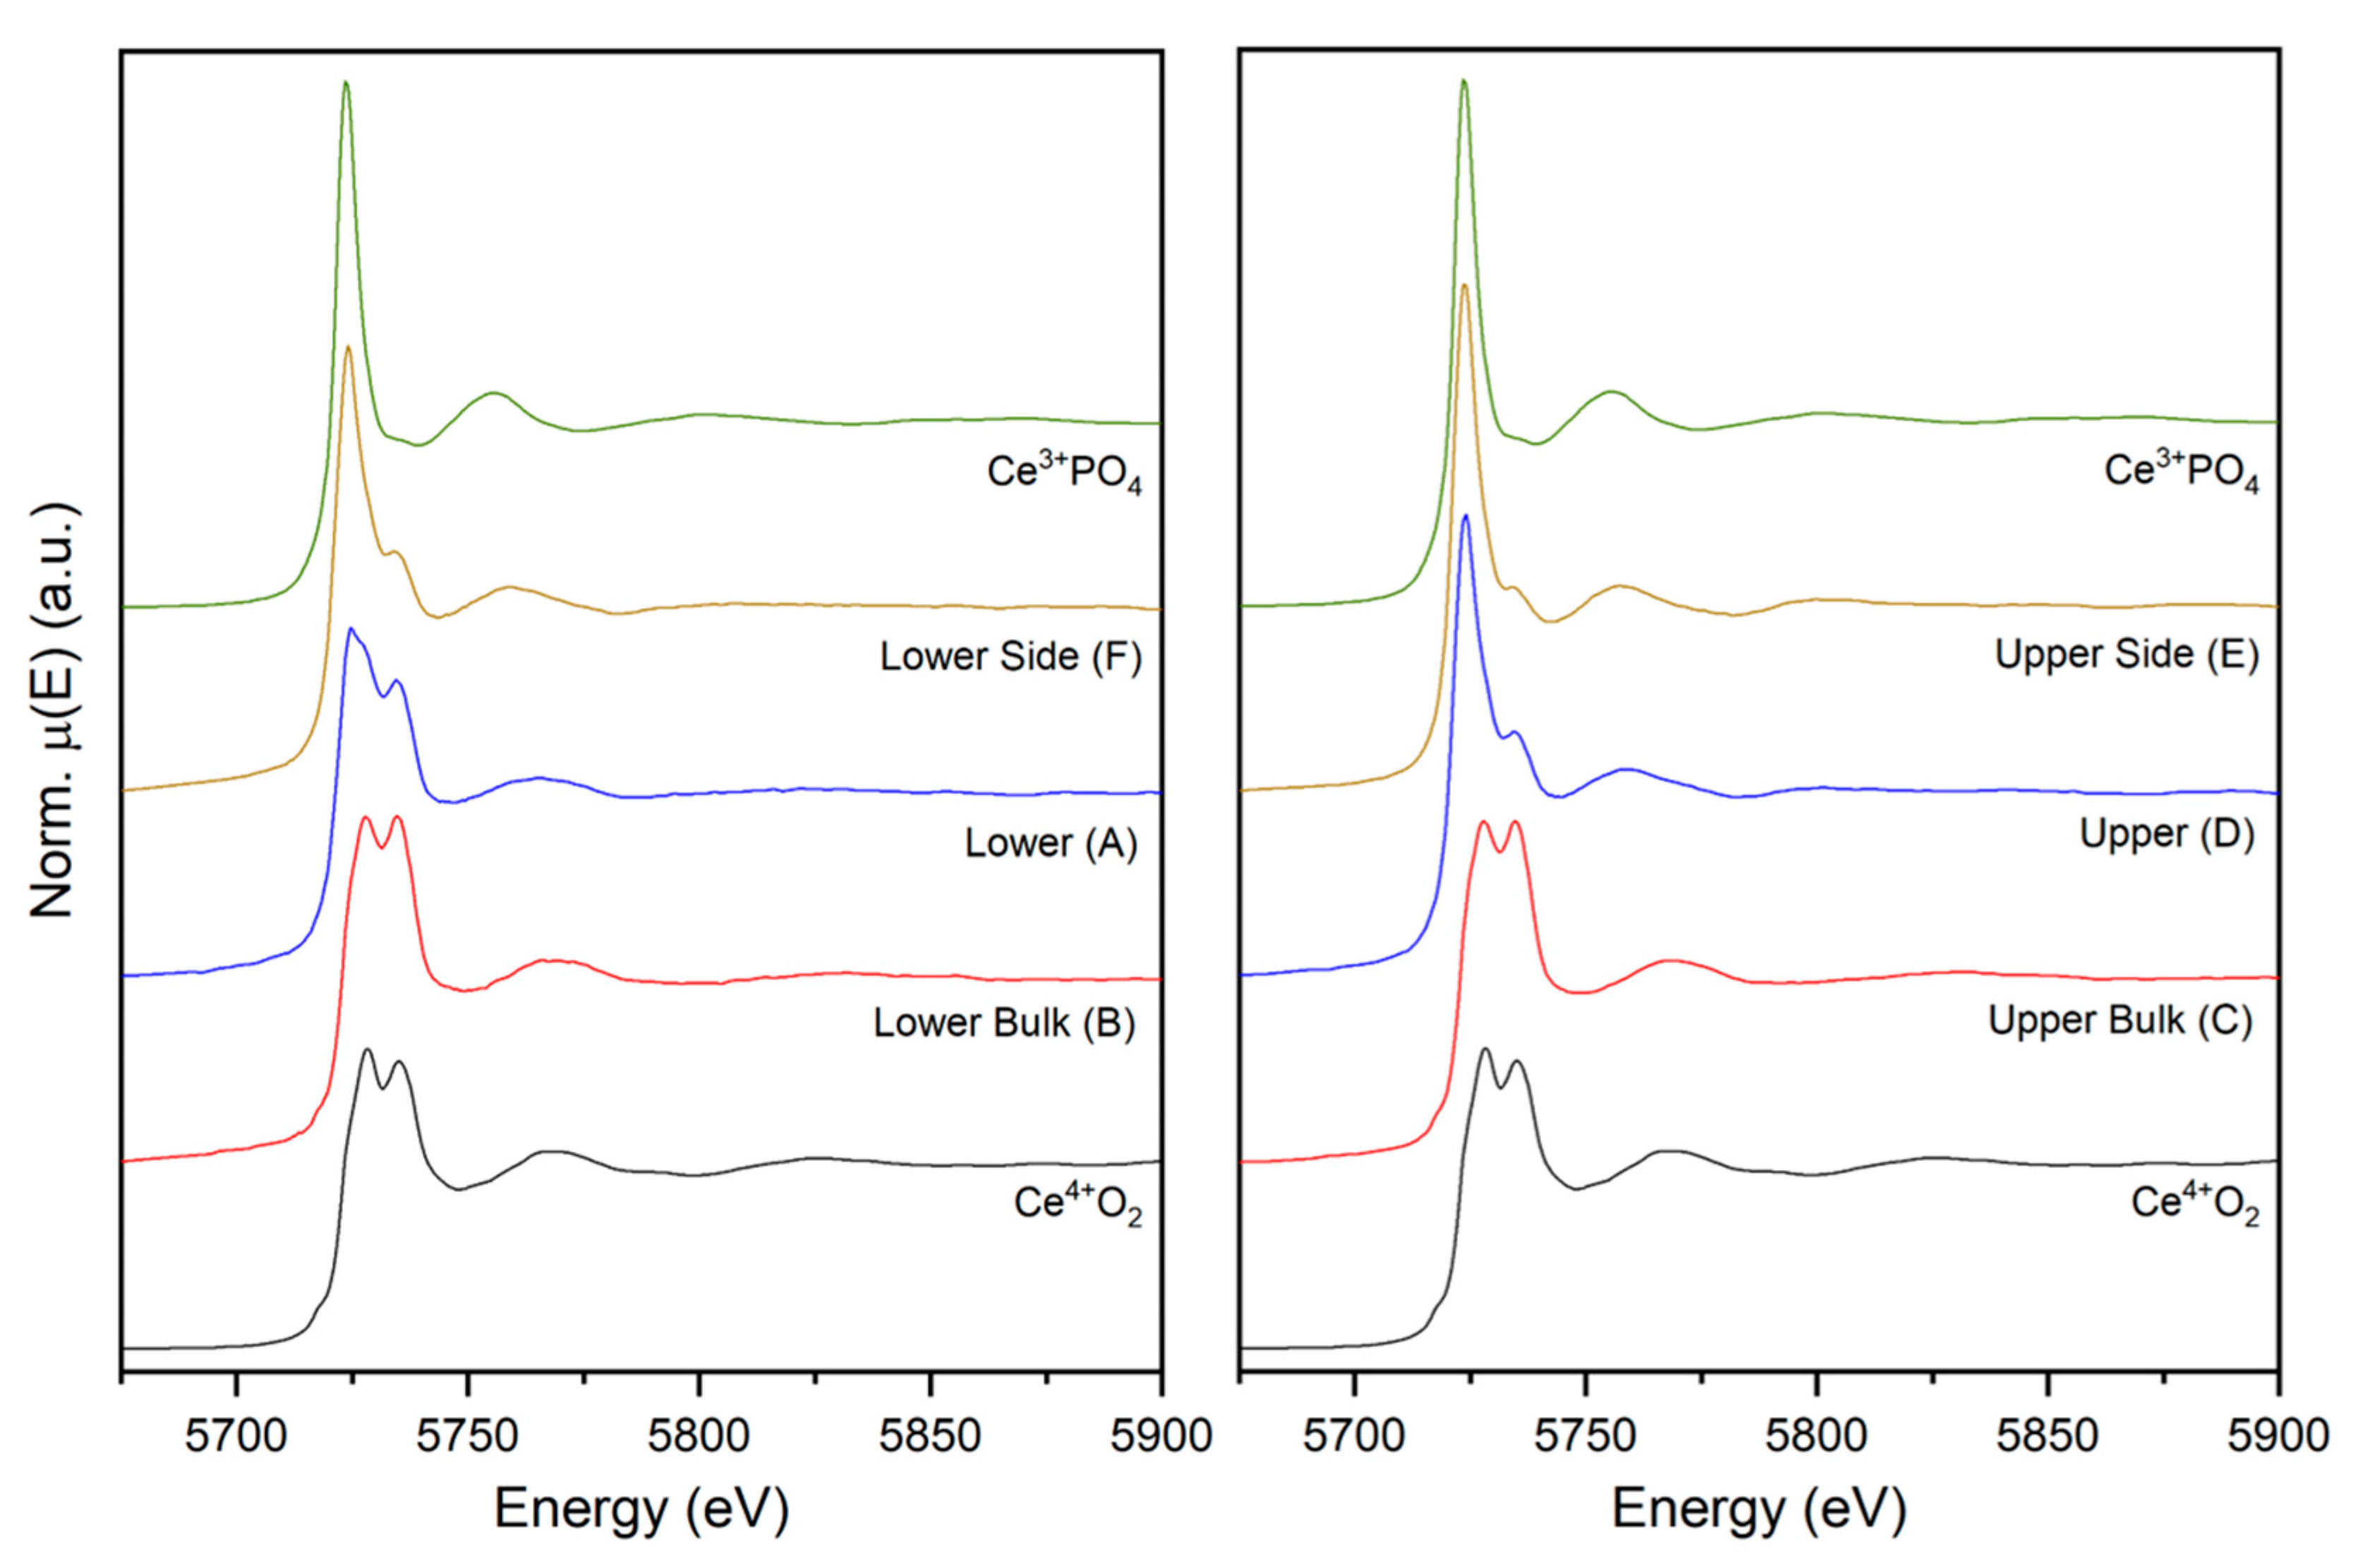
3.2.3. Ce L3-Edge XANES

The Ce oxidation state in each region was examined by Ce L3-edge XANES (see Figure 10). As expected from the different colours of the inner (cream) and outer regions (dark red to brown) [26,27], those regions closer to the ferrous HIP canister contained significant fractions of Ce3+, whereas Ce4+ predominated in the inner regions. Linear combination fitting (LCF) of each spectrum was used to examine the overall Ce oxidation state in each region, with CeO2 (Ce4+, 8 C.N.) and CePO4 (Ce3+, 9 C.N.) being utilised as standards. The linear combination fits are detailed in Table 2 and displayed in Figures S1–S6 in Supplementary Material.
As determined by LCF, the lower bulk (B) and upper bulk (C) regions contained Ce with overall oxidation state 4.0(1)+. This is in full agreement with the observations that these regions were both lightest in colour and furthest (in distance) from the reducing environment imposed by the HIP canister.
There were significant differences observed in the Ce oxidation states of the upper/upper side and lower/lower side regions. The upper (D) and upper side (E) regions contained a larger fraction of Ce3+: 3.3 (1)+ and 3.1 (1)+, respectively. In comparison, the lower (A) and lower side (F) regions were less reduced with average Ce oxidation states of 3.7 (1)+ and 3.4 (1)+, respectively.

4. Discussion

In comparison to the cold-pressed and sintered materials detailed above, similar phase assemblages were observed in regions closest to the canister, particularly the upper (D) and upper side (E). It is notable that though significant fractions of the same minority phases (i.e., perovskite, rutile, baddeleyite and sphene) were observed in both these regions and the cold-pressed and sintered materials, the relative amounts of each were different. For example, baddeleyite comprised 10.2 (2) wt.% and 13.0 (2) wt.% of the crystalline phases in the upper (D) and upper side regions, respectively, compared to 3.1 (2) wt.% and 3.2 (1) wt.% in the cold-pressed and sintered material heated in Ar and 5% H2/95% N2, respectively. Small fractions of zircon (approximately 2.5 wt.% of the crystalline phases) that were observed in both cold-pressed and sintered materials were not identified by XRD or SEM in any region of the HIPed material.
The most important observation made from this HIPed material was the appearance of a distinct interaction zone with the canister, with regions closer to the HIP canister containing significant fractions of Ce3+. This was unsurprising as the ferrous HIP canister imparts a mildly reducing environment, particularly at high temperature, and has been previously reported for a similar Ce–zirconolite glass–ceramic (targeting a CaZr0.8Ce0.2Ti2O7 ceramic phase) [16]. The observation that the bulk regions comprised only Ce4+ (as determined from the Ce L3-edge spectra) is notable as it showed that the canister–sample interaction did not affect the entire body of the HIPed glass–ceramic. The interaction zone was approx. 5 mm thick with a further transition zone of approx. 3 mm. This suggests that a comparable full-scale HIPed glass–ceramic would contain only Ce4+ in the bulk with a (relative to the size of the canister) thin interaction zone enriched in Ce3+. In agreement with observations made in the literature [25], perovskite was only stabilised in those regions with the lowest average Ce oxidation state, namely, the upper (D, Ce3.3(1)+) and upper side (E, Ce3.1(1)+) regions.
Each upper region (C, D and E) contained significantly higher fractions of minority phases than the equivalent lower region (A, B and C), with perovskite only observed in the upper (D) and upper side (E) regions, i.e., those that were most reduced. The upper/lower divide was also easily observed by eye (see Figure 2). The larger clusters of baddeleyite observed in the upper regions resulted in a significant fraction of unreacted Ca and Ti (whether dissolved in the glass or not), which then formed the highly abundant grains of sphene and rutile. Apart from the bulk regions, where the Ce content comprised only Ce4+, the upper regions were also more reduced than the lower regions; for example, the upper side (E) had an overall average Ce oxidation state of 3.1 (1)+ compared to 3.4 (1)+ in the lower side (F). Two possible explanations for these differences will be discussed here.
The powder was packed into the HIP canister in four additions, and as such, it is possible the lower powder was packed significantly more densely than the upper (as it would have been under uniaxial pressure for an overall longer time). However, it would be expected that flow of the glass at this temperature would be significant enough to allow for rapid equilibration of the packing density of the material in the canister. Accordingly, no significant difference in porosity was seen between equivalent upper and lower regions. It is also unclear how a lower packing density would lead to the formation of larger clusters of baddeleyite and the higher fractions of minority phases observed.
Another possible explanation is that the canister experienced a thermal gradient during HIP, with the upper regions being cooler than the lower regions. This effect has been previously shown to result in similarly differentiated phase assemblages in HIPed CaZrTi2O7 glass–ceramics (70 wt.% ceramic in 30 wt.% Na2Al2Si6O16 glass). Sphene, rutile and baddeleyite were all observed in higher abundances when HIPed at 1100 °C compared to material of the same composition HIPed at 1200 °C [28]. However, a thermal gradient across the canister during HIP is not expected; the hot zone of the HIP utilised for this sample was significantly taller (400 mm) than the sealed canister (60 mm), so it should have ensured uniform heating.
Neither of these possible phenomena sufficiently explain the variations observed, whether considered alone or together, and the reasons behind this complex multiphase product remain unclear without significant further experimentation.

5. Conclusions

A large (approx. 170 cm3 pre-HIP) glass–ceramic of target composition 70 wt.% CaZr0.9Ce0.1Ti2O7 in 30 wt.% Na2Al2Si6O16 glass was produced by HIP. Significant differences in crystalline phase assemblage were observed in the outer and inner regions of the HIP canister, with differences also seen between upper and lower regions. Compared to the inner regions, the outer regions contained significantly higher fractions of baddeleyite (m-ZrO2) with a corresponding increase in sphene (CaTiSiO5) and decrease in zirconolite-2M. The same trend was observed when comparing upper regions to lower regions, with the lower bulk (B) containing the highest fraction of zirconolite-2M.
The impact of the reducing environment imposed by the ferrous HIP canister at high temperature on the Ce oxidation state in different regions was examined by Ce L3-edge XANES. Outer regions (particularly the upper (D) and upper side (E) with Ce3.3(1)+ and Ce3.1(1)+, respectively) in closer proximity to the canister were significantly reduced compared to the lower bulk (B) and upper bulk (C) regions, which comprised only Ce4+. Perovskite (prototypically CaTiO3) was only observed in those regions that were most reduced, namely, the upper (D) and upper side (E). Compared to materials of the same composition produced by a cold-press and sinter process in Ar and 5% H2/95% N2 atmospheres, other than zircon, all crystalline phases were also observed in those regions that were most reduced but with significant differences in their relative abundances.
Though it is unclear what caused the variations between the upper and lower regions, it is apparent that some portion of the inner/outer variation was caused by the effect of the reducing environment exerted by the ferrous HIP canister. This work has shown that despite decreased barrier to diffusion in the glass phase, in an analogous production-scale HIPed glass–ceramic, the bulk of the material would not experience the reducing impact of a metallic HIP canister.

Supplementary Materials

The following supporting information can be downloaded at: https://www.mdpi.com/article/10.3390/ceramics5040074/s1, Figure S1: Linear combination fit of the Ce L3-edge XANES spectrum of the lower region of a HIPed glass-ceramic targeting 30 wt.% CaZr0.9Ce0.1Ti2O7 in 70 wt.% Na2Al2Si6O16 glass; Figure S2: Linear combination fit of the Ce L3-edge XANES spectrum of the lower bulk region of a HIPed glass-ceramic targeting 30 wt.% CaZr0.9Ce0.1Ti2O7 in 70 wt.% Na2Al2Si6O16 glass; Figure S3: Linear combination fit of the Ce L3-edge XANES spectrum of the upper bulk region of a HIPed glass-ceramic targeting 30 wt.% CaZr0.9Ce0.1Ti2O7 in 70 wt.% Na2Al2Si6O16 glass; Figure S4: Linear combination fit of the Ce L3-edge XANES spectrum of the upper region of a HIPed glass-ceramic targeting 30 wt.% CaZr0.9Ce0.1Ti2O7 in 70 wt.% Na2Al2Si6O16 glass; Figure S5: Linear combination fit of the Ce L3-edge XANES spectrum of the upper side region of a HIPed glass-ceramic targeting 30 wt.% CaZr0.9Ce0.1Ti2O7 in 70 wt.% Na2Al2Si6O16 glass; Figure S6: Linear combination fit of the Ce L3-edge XANES spectrum of the lower side region of a HIPed glass-ceramic targeting 30 wt.% CaZr0.9Ce0.1Ti2O7 in 70 wt.% Na2Al2Si6O16 glass.

Author Contributions

Conceptualisation, M.C.J.D.W. and C.L.C.; methodology, M.C.J.D.W., L.T.T., L.J.G. and C.G.; formal analysis, M.C.J.D.W.; investigation, M.C.J.D.W., L.T.T., L.J.G. and C.G.; resources, L.J.G. and C.L.C.; data curation, M.C.J.D.W.; writing—original draft preparation, M.C.J.D.W.; writing—review and editing, M.C.J.D.W. and C.L.C.; visualisation, M.C.J.D.W.; supervision, C.L.C.; project administration, C.L.C.; funding acquisition, C.L.C. All authors have read and agreed to the published version of the manuscript.

Funding

This work was undertaken in part under the EPSRC TRANSCEND project (EP/S01019X/1) sponsored by Nuclear Waste Services (NWS). C.C. acknowledges the U.K. EPSRC for funding through an Early Career Research Fellowship (EP/N017374/1). This research utilised the HADES/MIDAS facility at the University of Sheffield established with financial support from EPSRC and BEIS under grant EP/T011424/1 [29]. This research used beamline 6-BM of the National Synchrotron Light Source II, a U.S. Department of Energy (DOE) Office of Science User Facility operated for the DOE Office of Science by Brookhaven National Laboratory under Contract No. DE-SC0012704.

Institutional Review Board Statement

Not applicable.

Informed Consent Statement

Not applicable.

Data Availability Statement

Not applicable.

Conflicts of Interest

The authors declare no conflict of interest.

References

  1. 2020 Annual Figures for Holdings of Civil Unirradiated Plutonium. Available online: https://www.onr.org.uk/safeguards/civilplut20.htm (accessed on 27 July 2022).
  2. Hyatt, N.C. Safe management of the UK separated plutonium inventory: A challenge of materials degradation. NPJ Mater. Degrad. 2020, 4, 28. [Google Scholar] [CrossRef]
  3. Hyatt, N.C. Plutonium management policy in the United Kingdom: The need for a dual track strategy. Energy Policy 2017, 101, 303–309. [Google Scholar] [CrossRef] [Green Version]
  4. Blackburn, L.R.; Bailey, D.J.; Sun, S.-K.; Gardner, L.J.; Stennett, M.C.; Corkhill, C.L.; Hyatt, N.C. Review of zirconolite crystal chemistry and aqueous durability. Adv. Appl. Ceram. 2021, 120, 69–83. [Google Scholar] [CrossRef]
  5. McGlinn, P.J.; Hart, K.P.; Loi, E.H.; Vance, E.R. pH Dependence of the Aqueous Dissolution Rates of Perovskite and Zirconolite at 90 °C. MRS Proc. 1994, 353, 847. [Google Scholar] [CrossRef]
  6. Hart, K.P.; Vance, E.R.; Stewart, M.W.A.; Weir, J.; Carter, M.L.; Hambley, M.; Brownscombe, A.; Day, R.A.; Leung, S.; Ball, C.J.; et al. Leaching Behavior of Zirconolite-Rich Synroc Used to Immobilize High-Fired Plutonium Oxide. MRS Proc. 1997, 506, 161. [Google Scholar] [CrossRef]
  7. Strachan, D.; Scheele, R.; Buck, E.; Kozelisky, A.; Sell, R.; Elovich, R.; Buchmiller, W. Radiation damage effects in candidate titanates for Pu disposition: Zirconolite. J. Nucl. Mater. 2008, 372, 16–31. [Google Scholar] [CrossRef]
  8. Smith, K.L.; Zhang, Z.; McGlinn, P.; Attard, D.; Li, H.; Lumpkin, G.R.; Colella, M.; McLeod, T.; Aly, Z.; Loi, E.; et al. The Effect of Radiation Damage on Zirconolite Dissolution. MRS Proc. 2002, 757, II6.12. [Google Scholar] [CrossRef]
  9. Smith, K.L.; Zaluzec, N.J.; Lumpkin, G.R. In situ studies of ion irradiated zirconolite, pyrochlore and perovskite. J. Nucl. Mater. 1997, 250, 36–52. [Google Scholar] [CrossRef]
  10. Zhang, Y.; Kong, L.; Ionescu, M.; Gregg, D.J. Current advances on titanate glass-ceramic composite materials as waste forms for actinide immobilization: A technical review. J. Eur. Ceram. Soc. 2022, 42, 1852–1876. [Google Scholar] [CrossRef]
  11. Thornber, S.M.; Stennett, M.C.; Vance, E.R.; Chavara, D.T.; Watson, I.; Jovanovic, M.; Davis, J.; Gregg, D.; Hyatt, N.C. A preliminary validation study of PuO2 incorporation into zirconolite glass-ceramics. MRS Adv. 2018, 3, 1065–1071. [Google Scholar] [CrossRef]
  12. Stewart, M.W.A.; Moricca, S.A.; Eddowes, T.; Zhang, Y.; Vance, E.R.; Lumpkin, G.R.; Carter, M.L.; Dowson, M.; James, M. The Use of Hot-Isostatic Pressing to Process Nuclear Waste Forms. In Proceedings of the 12th International Conference on Environmental Remediation and Radioactive Waste Management, Liverpool, UK, 11–15 December 2009; pp. 611–616. [Google Scholar]
  13. Maddrell, E. Hot isostatically pressed wasteforms for future nuclear fuel cycles. Chem. Eng. Res. Des. 2013, 91, 735–741. [Google Scholar] [CrossRef]
  14. Bingham, P.; Hand, R.J.; Stennett, M.; Hyatt, N.; Harrison, M.T. The Use of Surrogates in Waste Immobilization Studies: A Case Study of Plutonium. MRS Proc. 2008, 1107, 421. [Google Scholar] [CrossRef]
  15. Kong, L.; Karatchevtseva, I.; Zhang, Y.; Wei, T. The incorporation of Nd or Ce in CaZrTi2O7 zirconolite: Ceramic versus glass-ceramic. J. Nucl. Mater. 2020, 543, 152583. [Google Scholar] [CrossRef]
  16. Thornber, S.M.; Stennett, M.C.; Hyatt, N.C. Investigation of Ce incorporation in zirconolite glass-ceramics for UK plutonium disposition. MRS Adv. 2017, 2, 699–704. [Google Scholar] [CrossRef]
  17. Blackburn, L.R.; Gardner, L.J.; Sun, S.K.; Maddrell, E.R.; Stennett, M.C.; Corkhill, C.L.; Hyatt, N.C. Hot Isostatically Pressed Zirconolite Wasteforms for Actinide Immobilisation. IOP Conf. Series Mater. Sci. Eng. 2020, 818, 012010. [Google Scholar] [CrossRef]
  18. Dayal, P.; Farzana, R.; Zhang, Y.; Lumpkin, G.R.; Holmes, R.; Triani, G.; Gregg, D.J. Profiling hot isostatically pressed canister–wasteform interaction for Pu-bearing zirconolite-rich wasteforms. J. Am. Ceram. Soc. 2022, 105, 5359–5372. [Google Scholar] [CrossRef]
  19. Zhang, Y.; Stewart, M.; Li, H.; Carter, M.; Vance, E.; Moricca, S. Zirconolite-rich titanate ceramics for immobilisation of actinides—Waste form/HIP can interactions and chemical durability. J. Nucl. Mater. 2009, 395, 69–74. [Google Scholar] [CrossRef]
  20. Li, H.; Zhang, Y.; McGlinn, P.; Moricca, S.; Begg, B.; Vance, E. Characterisation of stainless steel–synroc interactions under hot isostatic pressing (HIPing) conditions. J. Nucl. Mater. 2006, 355, 136–141. [Google Scholar] [CrossRef]
  21. Gates-Rector, S.; Blanton, T. The Powder Diffraction File: A quality materials characterization database. Powder Diffr. 2019, 34, 352–360. [Google Scholar] [CrossRef] [Green Version]
  22. Coelho, A.A. TOPAS and TOPAS-Academic: An optimization program integrating computer algebra and crystallographic objects written in C++. J. Appl. Crystallogr. 2018, 51, 210–218. [Google Scholar] [CrossRef]
  23. Evans, J.S. Advanced Input Files & Parametric Quantitative Analysis Using Topas. Mater. Sci. Forum 2010, 651, 1–9. [Google Scholar] [CrossRef]
  24. Ravel, B.; Newville, M. ATHENA, ARTEMIS, HEPHAESTUS: Data analysis for X-ray absorption spectroscopy using IFEFFIT. J. Synchrotron Radiat. 2005, 12, 537–541. [Google Scholar] [CrossRef] [Green Version]
  25. Blackburn, L.R.; Sun, S.; Gardner, L.J.; Maddrell, E.R.; Stennett, M.C.; Hyatt, N.C. A systematic investigation of the phase assemblage and microstructure of the zirconolite CaZr1-xCexTi2O7 system. J. Nucl. Mater. 2020, 535, 152137. [Google Scholar] [CrossRef]
  26. Huynh, L.T.; Eger, S.B.; Walker, J.D.; Hayes, J.R.; Gaultois, M.W.; Grosvenor, A.P. How temperature influences the stoichiometry of CeTi2O6. Solid State Sci. 2012, 14, 761–767. [Google Scholar] [CrossRef]
  27. Otsuka-Yao-Matsuo, S.; Omata, T.; Yoshimura, M. Photocatalytic behavior of cerium titanates, CeTiO4 and CeTi2O6 and their composite powders with SrTiO3. J. Alloys Compd. 2004, 376, 262–267. [Google Scholar] [CrossRef]
  28. Maddrell, E.R.; Paterson, H.C.; May, S.E.; Burns, K.M. Phase evolution in zirconolite glass-ceramic wasteforms. J. Nucl. Mater. 2017, 493, 380–387. [Google Scholar] [CrossRef]
  29. Hyatt, N.C.; Corkhill, C.L.; Stennett, M.C.; Hand, R.J.; Gardner, L.J.; Thorpe, C.L. The HADES Facility for High Activity Decommissioning Engineering & Science: Part of the UK National Nuclear User Facility. IOP Conf. Series Mater. Sci. Eng. 2020, 818, 012022. [Google Scholar] [CrossRef]
Figure 1. XRD patterns of CaZr0.9Ce0.1Ti2O7 (70 wt.%) in Na2Al2Si6O16 (30 wt.%) glass–ceramics, reacted at 1250 °C for 4 h in Ar (black) and 5% H2/95% N2 (red). Tick marks below show the reflection positions of zirconolite-2M (PDF card no. 04-002-4312). The diagnostic reflections of perovskite (CaTiO3) are marked with filled circles, sphene (CaTiSiO5) with empty circles, rutile (TiO2) with red squares and baddeleyite (m-ZrO2) with blue squares. Not all minority phases or reflections are marked.
Ceramics 05 00074 g001
Figure 2. Photograph (right) of a cross section of a piece of the HIPed glass–ceramic targeting 70 wt.% CaZr0.9Ce0.1Ti2O7 in 30 wt.% Na2Al2Si6O16 glass, showing six distinct regions termed lower (A), lower bulk (B), upper bulk (C), upper (D), upper side (E) and lower side (F). The as-refined crystalline phase abundances present in the different regions are shown on the left.
Ceramics 05 00074 g002
Figure 3. XRD patterns of the different regions (AF) of a HIPed CaZr0.9Ce0.1Ti2O7 (70 wt.%) in Na2Al2Si6O16 (30 wt.%) glass–ceramic HIPed at 1250 °C for 4 h under 103 MPa. Tick marks below show the reflection positions of zirconolite-2M (PDF card no. 04-002-4312). The diagnostic reflections of perovskite (CaTiO3) are marked with filled circles, sphene (CaTiSiO5) with empty circles, rutile (TiO2) with red squares and baddeleyite (m-ZrO2) with blue squares. Not all minority phases or reflections are marked.
Ceramics 05 00074 g003
Figure 4. Backscattered electron SEM micrographs and EDX spectra ((1) zirconolite grain; (2) baddeleyite, m-ZrO2; (3) glass) of the lower bulk (B) region. The major phases are zirconolite (light grey) and glass (dark background). Mid-grey particles are sphene (CaTiSiO5), thin mid-grey particles are rutile (TiO2) and the lightest grains/clusters within regions of zirconolite are baddeleyite (m-ZrO2). Some circular pores are seen (darkest regions). Note that the left-hand image is at a different magnification.
Ceramics 05 00074 g004
Figure 5. Backscattered electron SEM micrographs and EDX spectra ((1), zirconolite grain; (2), sphene, CaTiSiO5; (3), glass) of the upper bulk (C) region. The major phases are zirconolite (light grey), glass (dark background), baddeleyite (m-ZrO2) and sphene (CaTiSiO5, light grey). Some grains of sphene contain regions of rutile (TiO2). Some circular pores are seen (darkest regions). Note each image is at a different magnification.
Ceramics 05 00074 g005
Figure 6. Backscattered electron SEM micrographs and EDX spectra ((1) zirconolite grain; (2) baddeleyite, m-ZrO2; (3), glass) of the lower (A) region. The major phases are zirconolite (light grey) and glass (dark background). Mid-grey particles are sphene (CaTiSiO5), thin mid-grey particles are rutile (TiO2) and the lightest grains/clusters within regions of zirconolite are baddeleyite (m-ZrO2). Some circular pores are seen (darkest regions). Note that the left-hand image is at a different magnification.
Ceramics 05 00074 g006
Figure 7. Backscattered electron SEM micrographs and EDX spectra ((1), zirconolite grain; (2) perovskite, prototypically CaTiO3; (3) glass) of the upper region (D). The major phases are zirconolite (light grey), glass (dark background) and baddeleyite (lightest regions, m-ZrO2). Also observed are mid-grey grains of sphene (CaTiSiO5) and dark grey grains of rutile (TiO2). Some regions of perovskite (prototypically CaTiO3, dark grey) are seen within regions of zirconolite. Some circular pores are seen (darkest regions). Note that the left-hand image is at a different magnification.
Ceramics 05 00074 g007
Figure 8. Backscattered electron SEM micrographs and EDX spectra ((1) zirconolite grain; (2) sphene, CaTiSiO5; (3), glass) of the lower side region (F). The major phases are zirconolite (light grey) and glass (dark background). The lightest particles are baddeleyite (m-ZrO2), mid-grey particles are sphene (CaTiSiO5) and thin mid-grey particles are rutile (TiO2). Some circular pores are seen. Note each image is at a different magnification.
Ceramics 05 00074 g008
Figure 9. Backscattered electron SEM micrographs and EDX spectra ((1), zirconolite grain; (2), baddeleyite, m-ZrO2; (3) glass) of the upper side region (E). The major phases are zirconolite (light grey), glass (dark background). The lightest particles are baddeleyite (m-ZrO2), mid-grey particles are sphene (CaTiSiO5) and dark grey particles are rutile (TiO2). Some regions of perovskite (prototypically CaTiO3, dark grey) are seen within regions of zirconolite. Some circular pores are seen (darkest regions). Note each image is at a different magnification.
Ceramics 05 00074 g009
Figure 10. Ce L3-edge spectra of the different regions (AF) of the HIPed glass–ceramic. The spectra of CeO2 (Ce4+, 8 C.N.) and CePO4 (Ce3+, 9 C.N.) reference compounds are also displayed for comparison.
Ceramics 05 00074 g010
Table 1. As-refined relative crystalline phase abundances (wt.%) of glass–ceramics targeting 70 wt.% CaZr0.9Ce0.1Ti2O7 in 30 wt.% Na2Al2Si6O16 glass, including cold-pressed and sintered (CPS) materials heated under Ar and 5% H2/95% N2 atmospheres and the six regions of the HIPed material. Two goodness-of-fit metrics of the Rietveld refinements are also included.
MaterialZirconolite-2M (wt. %)Perovskite (wt. %)Rutile (wt. %)Baddeleyite (wt. %)Sphene (wt. %)Zircon (wt. %)RwpGOF
CPS Ar68.6(3)1.7(2)4.0(2)3.1(2)20.1(2)2.5(1)7.851.53
CPS 5% H2/95% N269.4 (3)0.9 (1)5.3 (2)3.2 (1)18.5 (2)2.7 (1)6.851.41
Lower (A)90.4 (4)-1.8 (2)3.8 (2)4.0 (3)-7.361.25
Lower bulk (B)90.3 (4)-2.9 (2)3.8 (2)3.0 (4)-7.161.24
Upper bulk (C)68.2 (4)-6.1 (2)9.1 (2)16.6 (4)-7.001.23
Upper (D)52.9 (3)7.1 (2)7.7 (2)13.0 (2)19.3 (4)-7.191.26
Upper side (E)55.5 (3)7.9 (2)6.7 (2)10.2 (2)19.7 (3)-7.361.28
Lower side (F)82.8 (5)-1.3 (2)3.7 (2)12.2 (4)-7.011.17
Table 2. Results of linear combination fits of the Ce L3-edge spectra of different regions of the HIPed glass–ceramic, highlighting the fraction (f) of each spectrum that could be fit by CeO2 (Ce4+) and CePO4 (Ce3+). The calculated average Ce oxidation state and R factors of the fits are also reported.
Materialf(CeO2)f(CePO4)SumCe ox. StateFit R Factor
Lower (A)0.808 (14)0.326 (12)1.1343.7 (1)+0.0187
Lower bulk (B)1.140 (14)0.025 (12)1.1654.0 (1)+0.0149
Upper bulk (C)1.121 (14)0.024 (13)1.1454.0 (1)+0.0154
Upper (D)0.385 (13)0.751 (11)1.1363.3 (1)+0.0127
Upper side (E)0.137 (13)0.937 (11)1.0743.1 (1)+0.0095
Lower side (F)0.401 (15)0.708 (13)1.1093.4 (1)+0.0182
Publisher’s Note: MDPI stays neutral with regard to jurisdictional claims in published maps and institutional affiliations.

