

Different Impacts of DNA-PK and mTOR Kinase Inhibitors in Combination with Ionizing Radiation on HNSCC and Normal Tissue Cells
 , and
, and 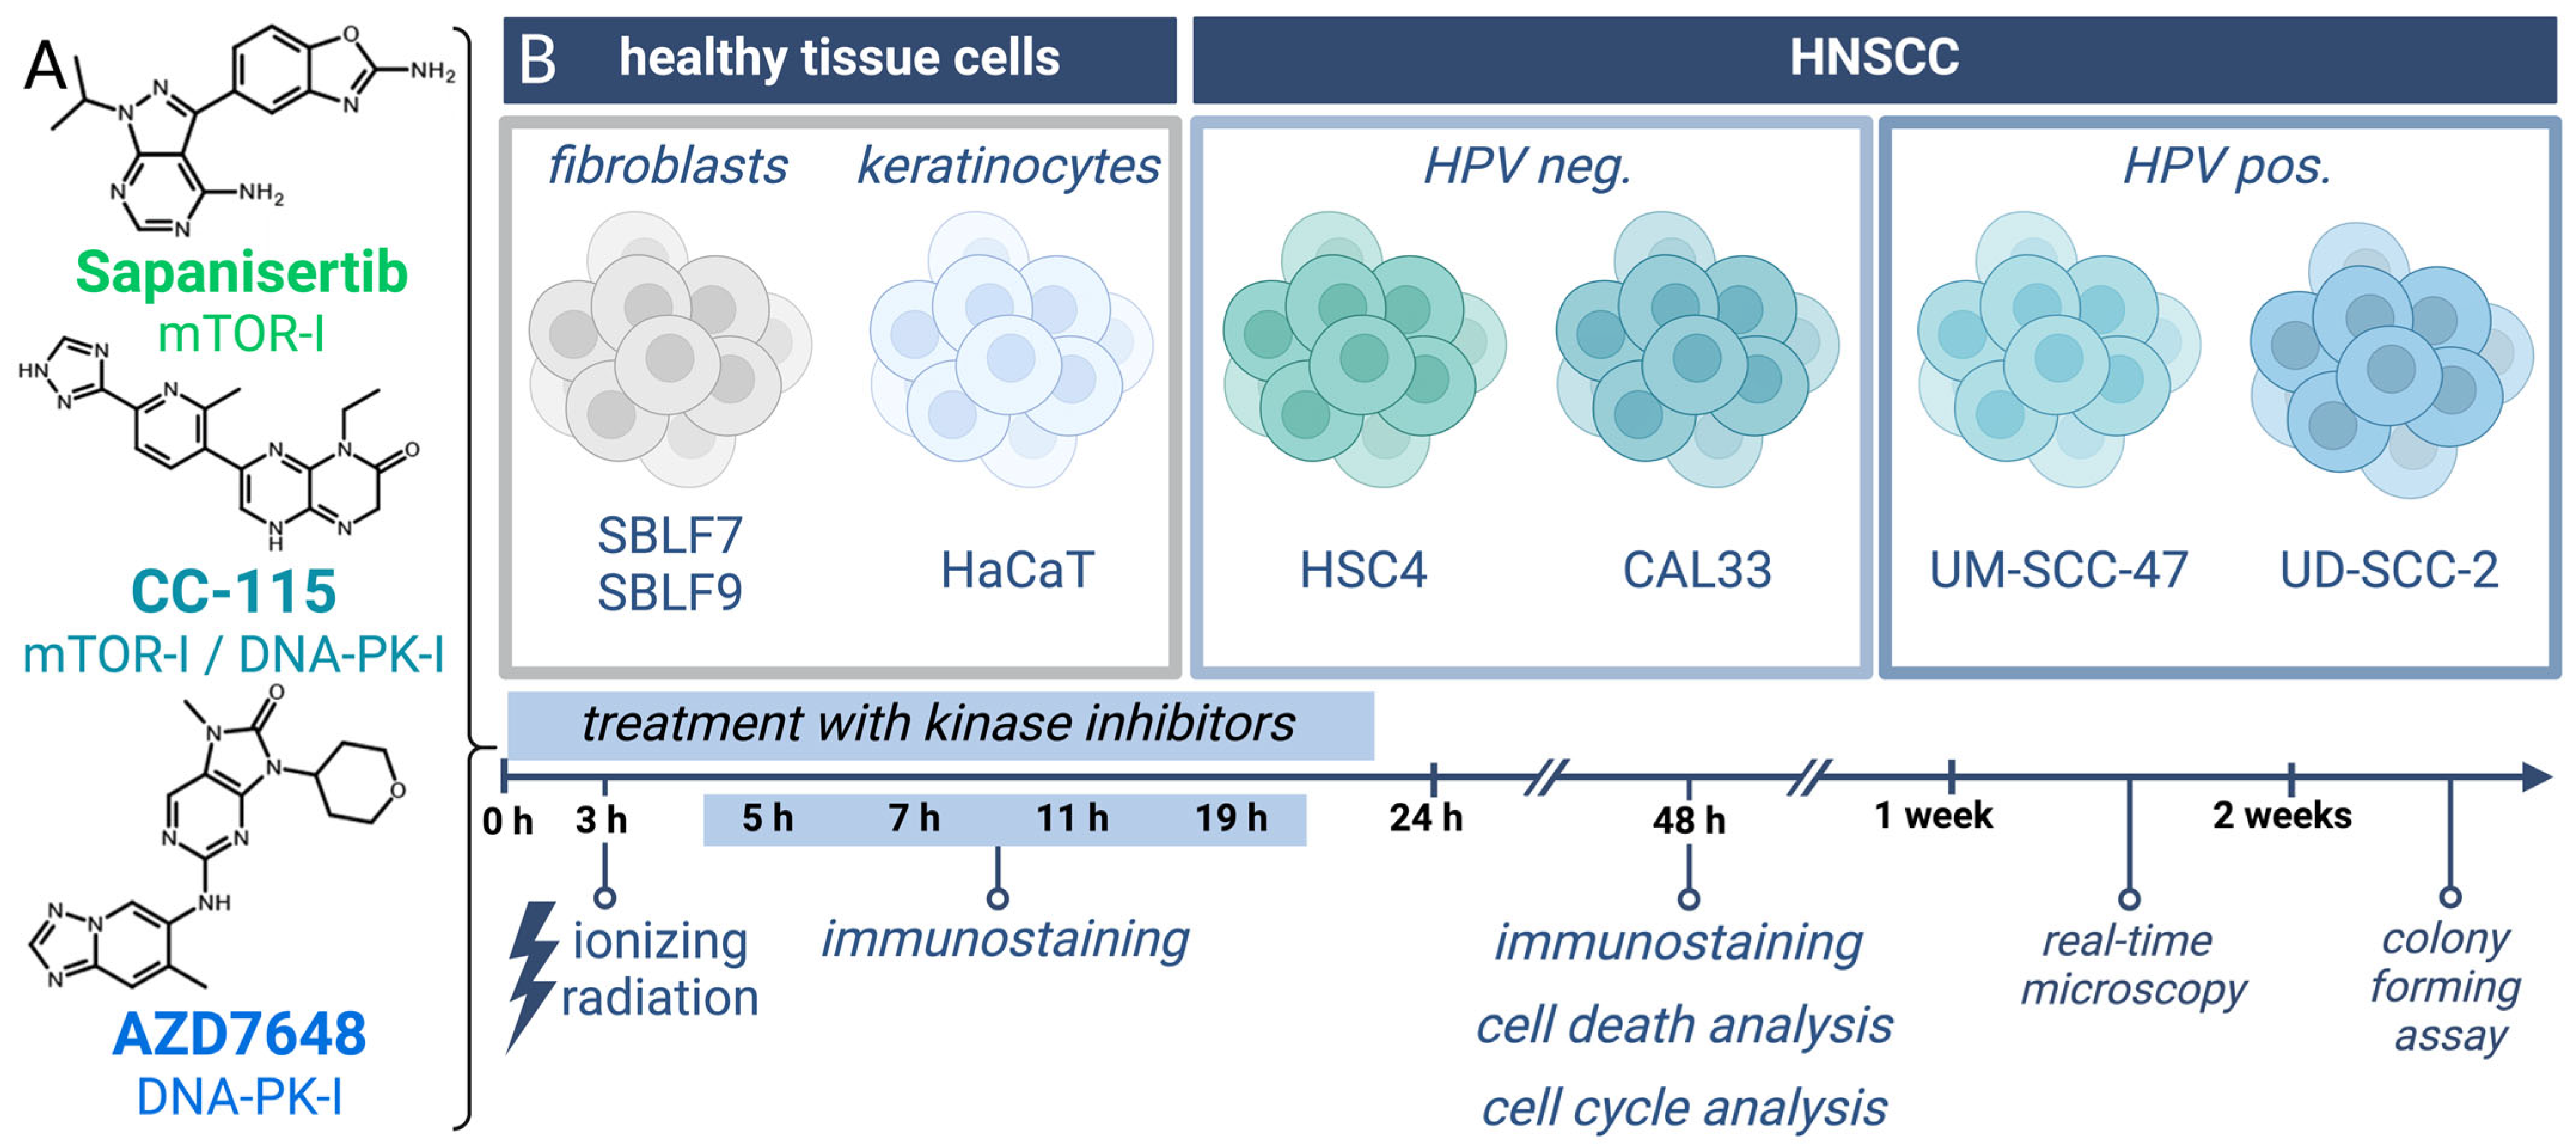
Abstract
:1. Introduction
2. Materials and Methods
2.1. Cell Cultures and Inhibitors
2.2. Determination of Dose
2.3. Colony-Forming Assay
2.4. Immunohistochemical Staining
2.5. Apoptosis and Necrosis Analysis by Flow Cytometry
2.6. Cell Cycle Analysis by Flow Cytometry
2.7. Live-Cell Microscope (Real-Time Microscope)
2.8. Statistical Analysis
3. Results
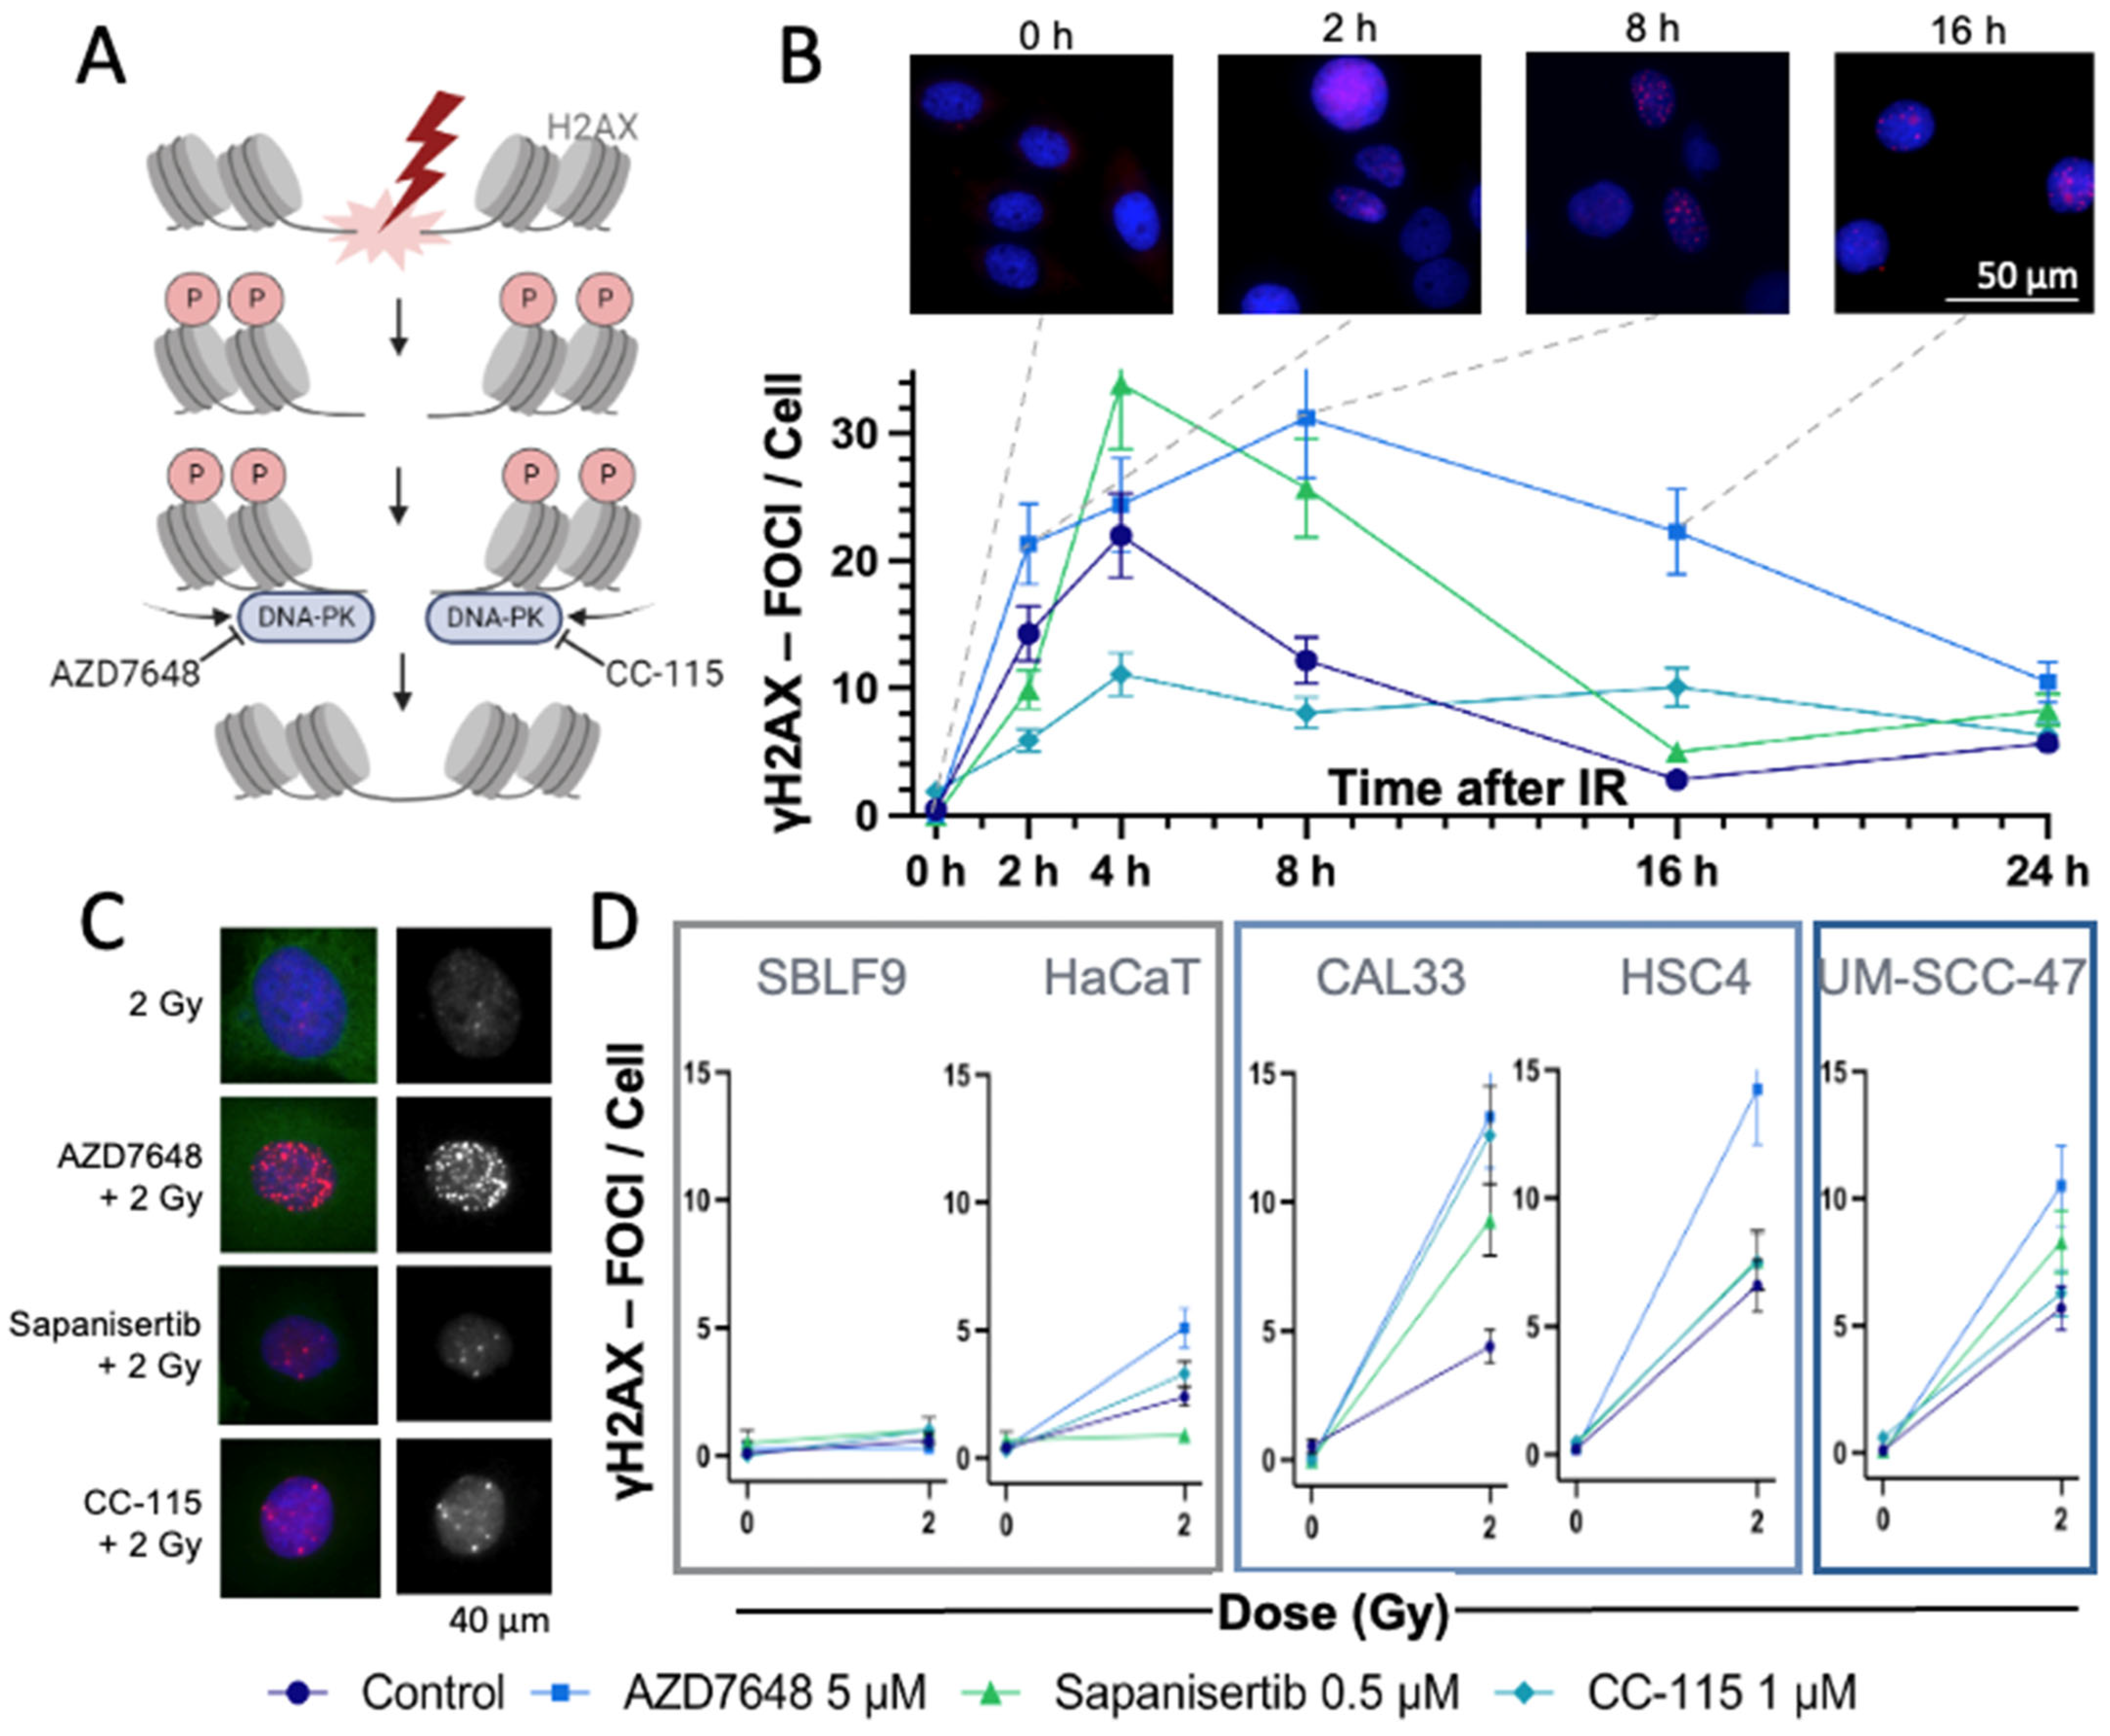
3.1. γH2AX Immmunostaining to Detect DSBs
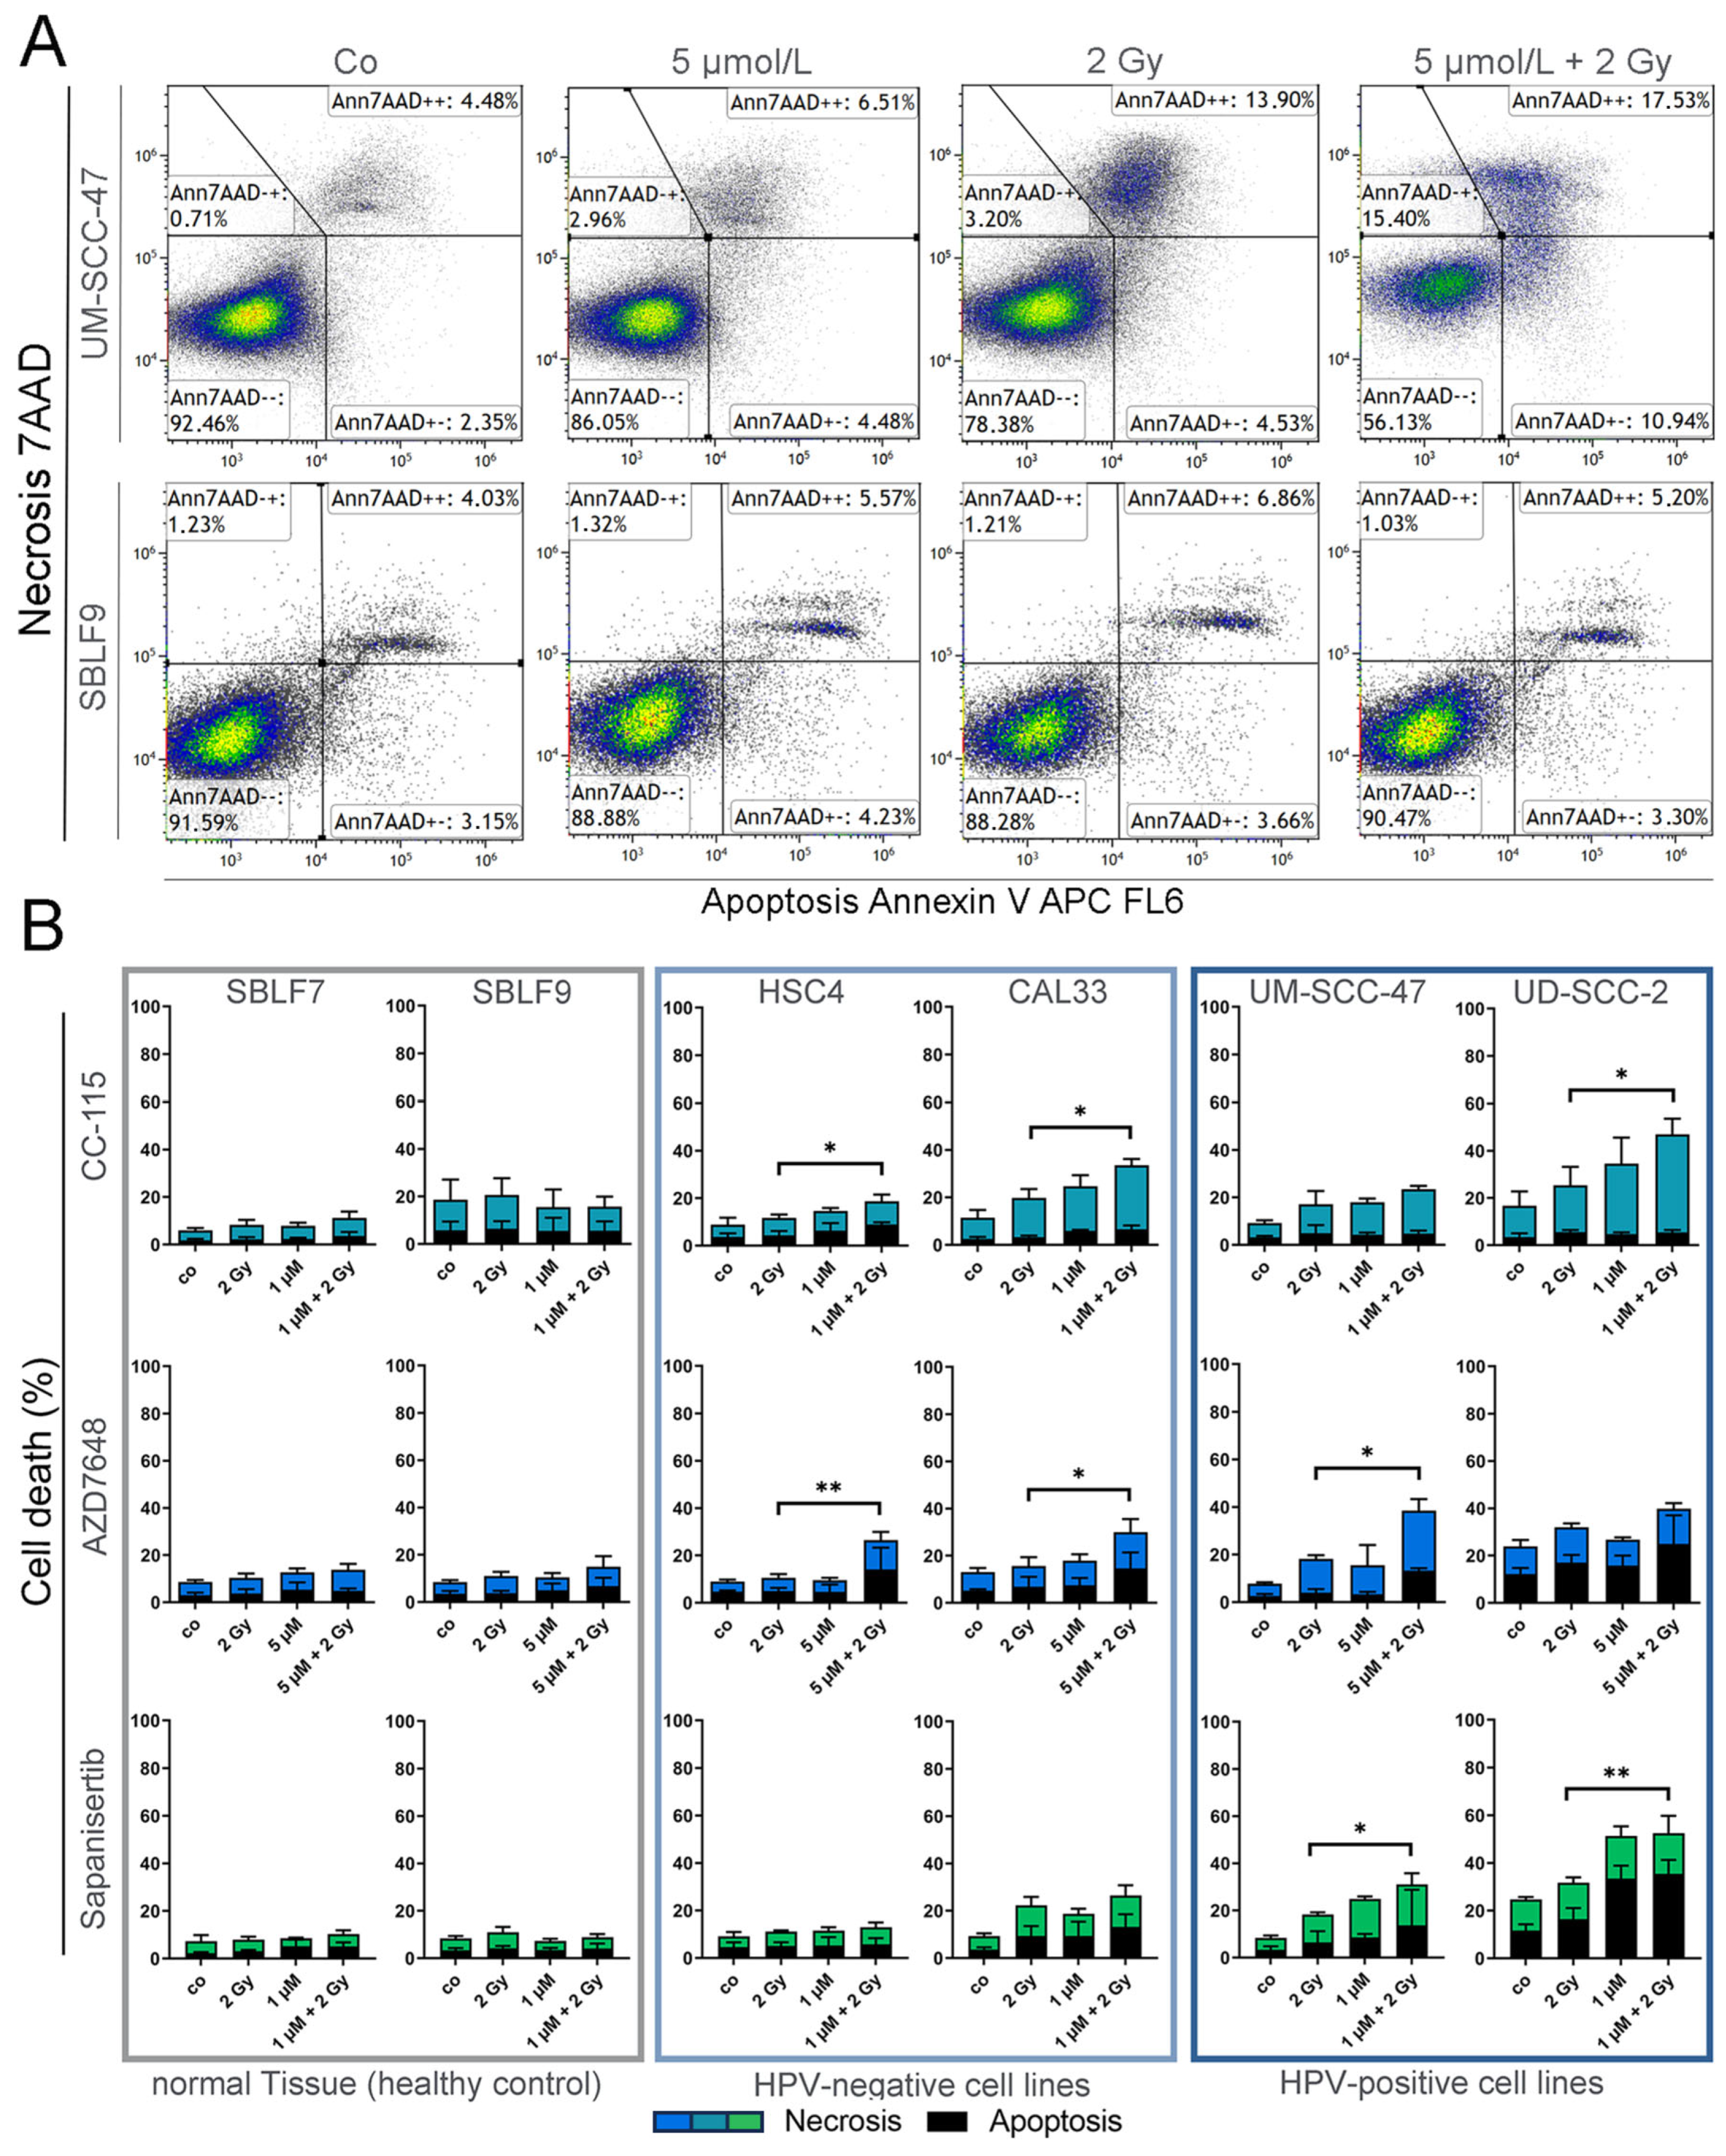
3.2. Assay for Apoptosis and Necrosis by Flow Cytometry
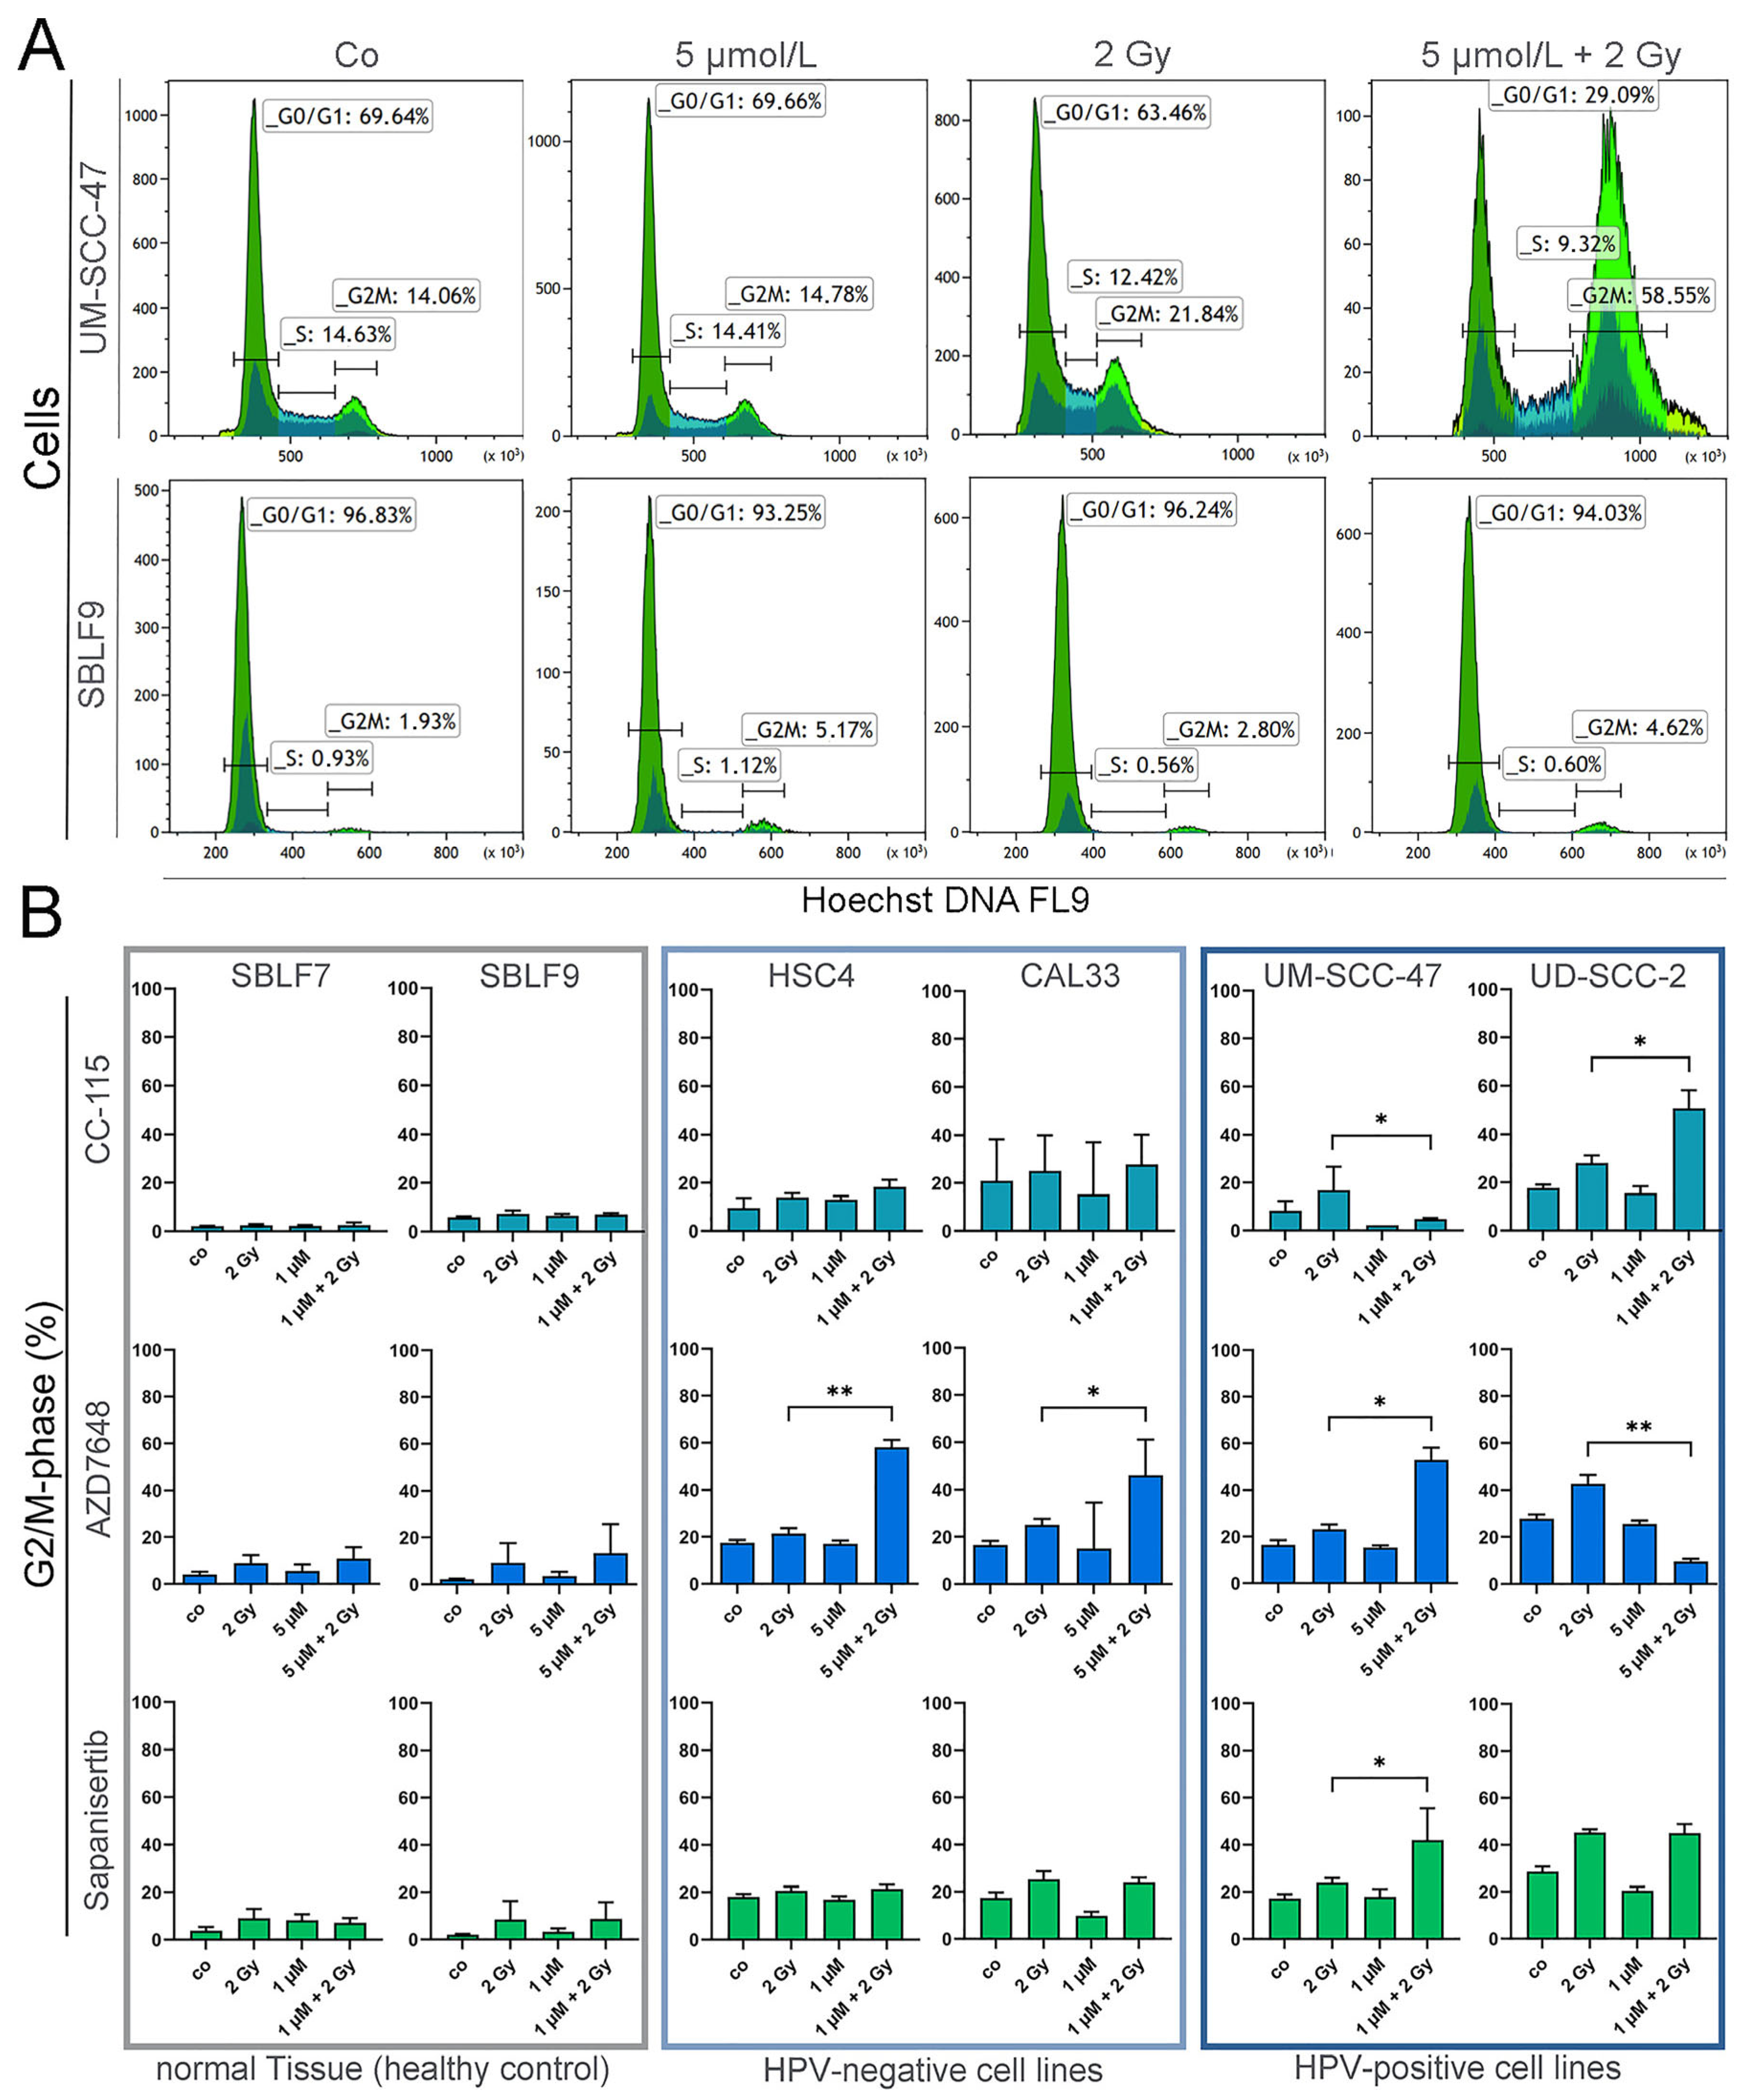
3.3. Cell Cycle Analysis by Flow Cytometry
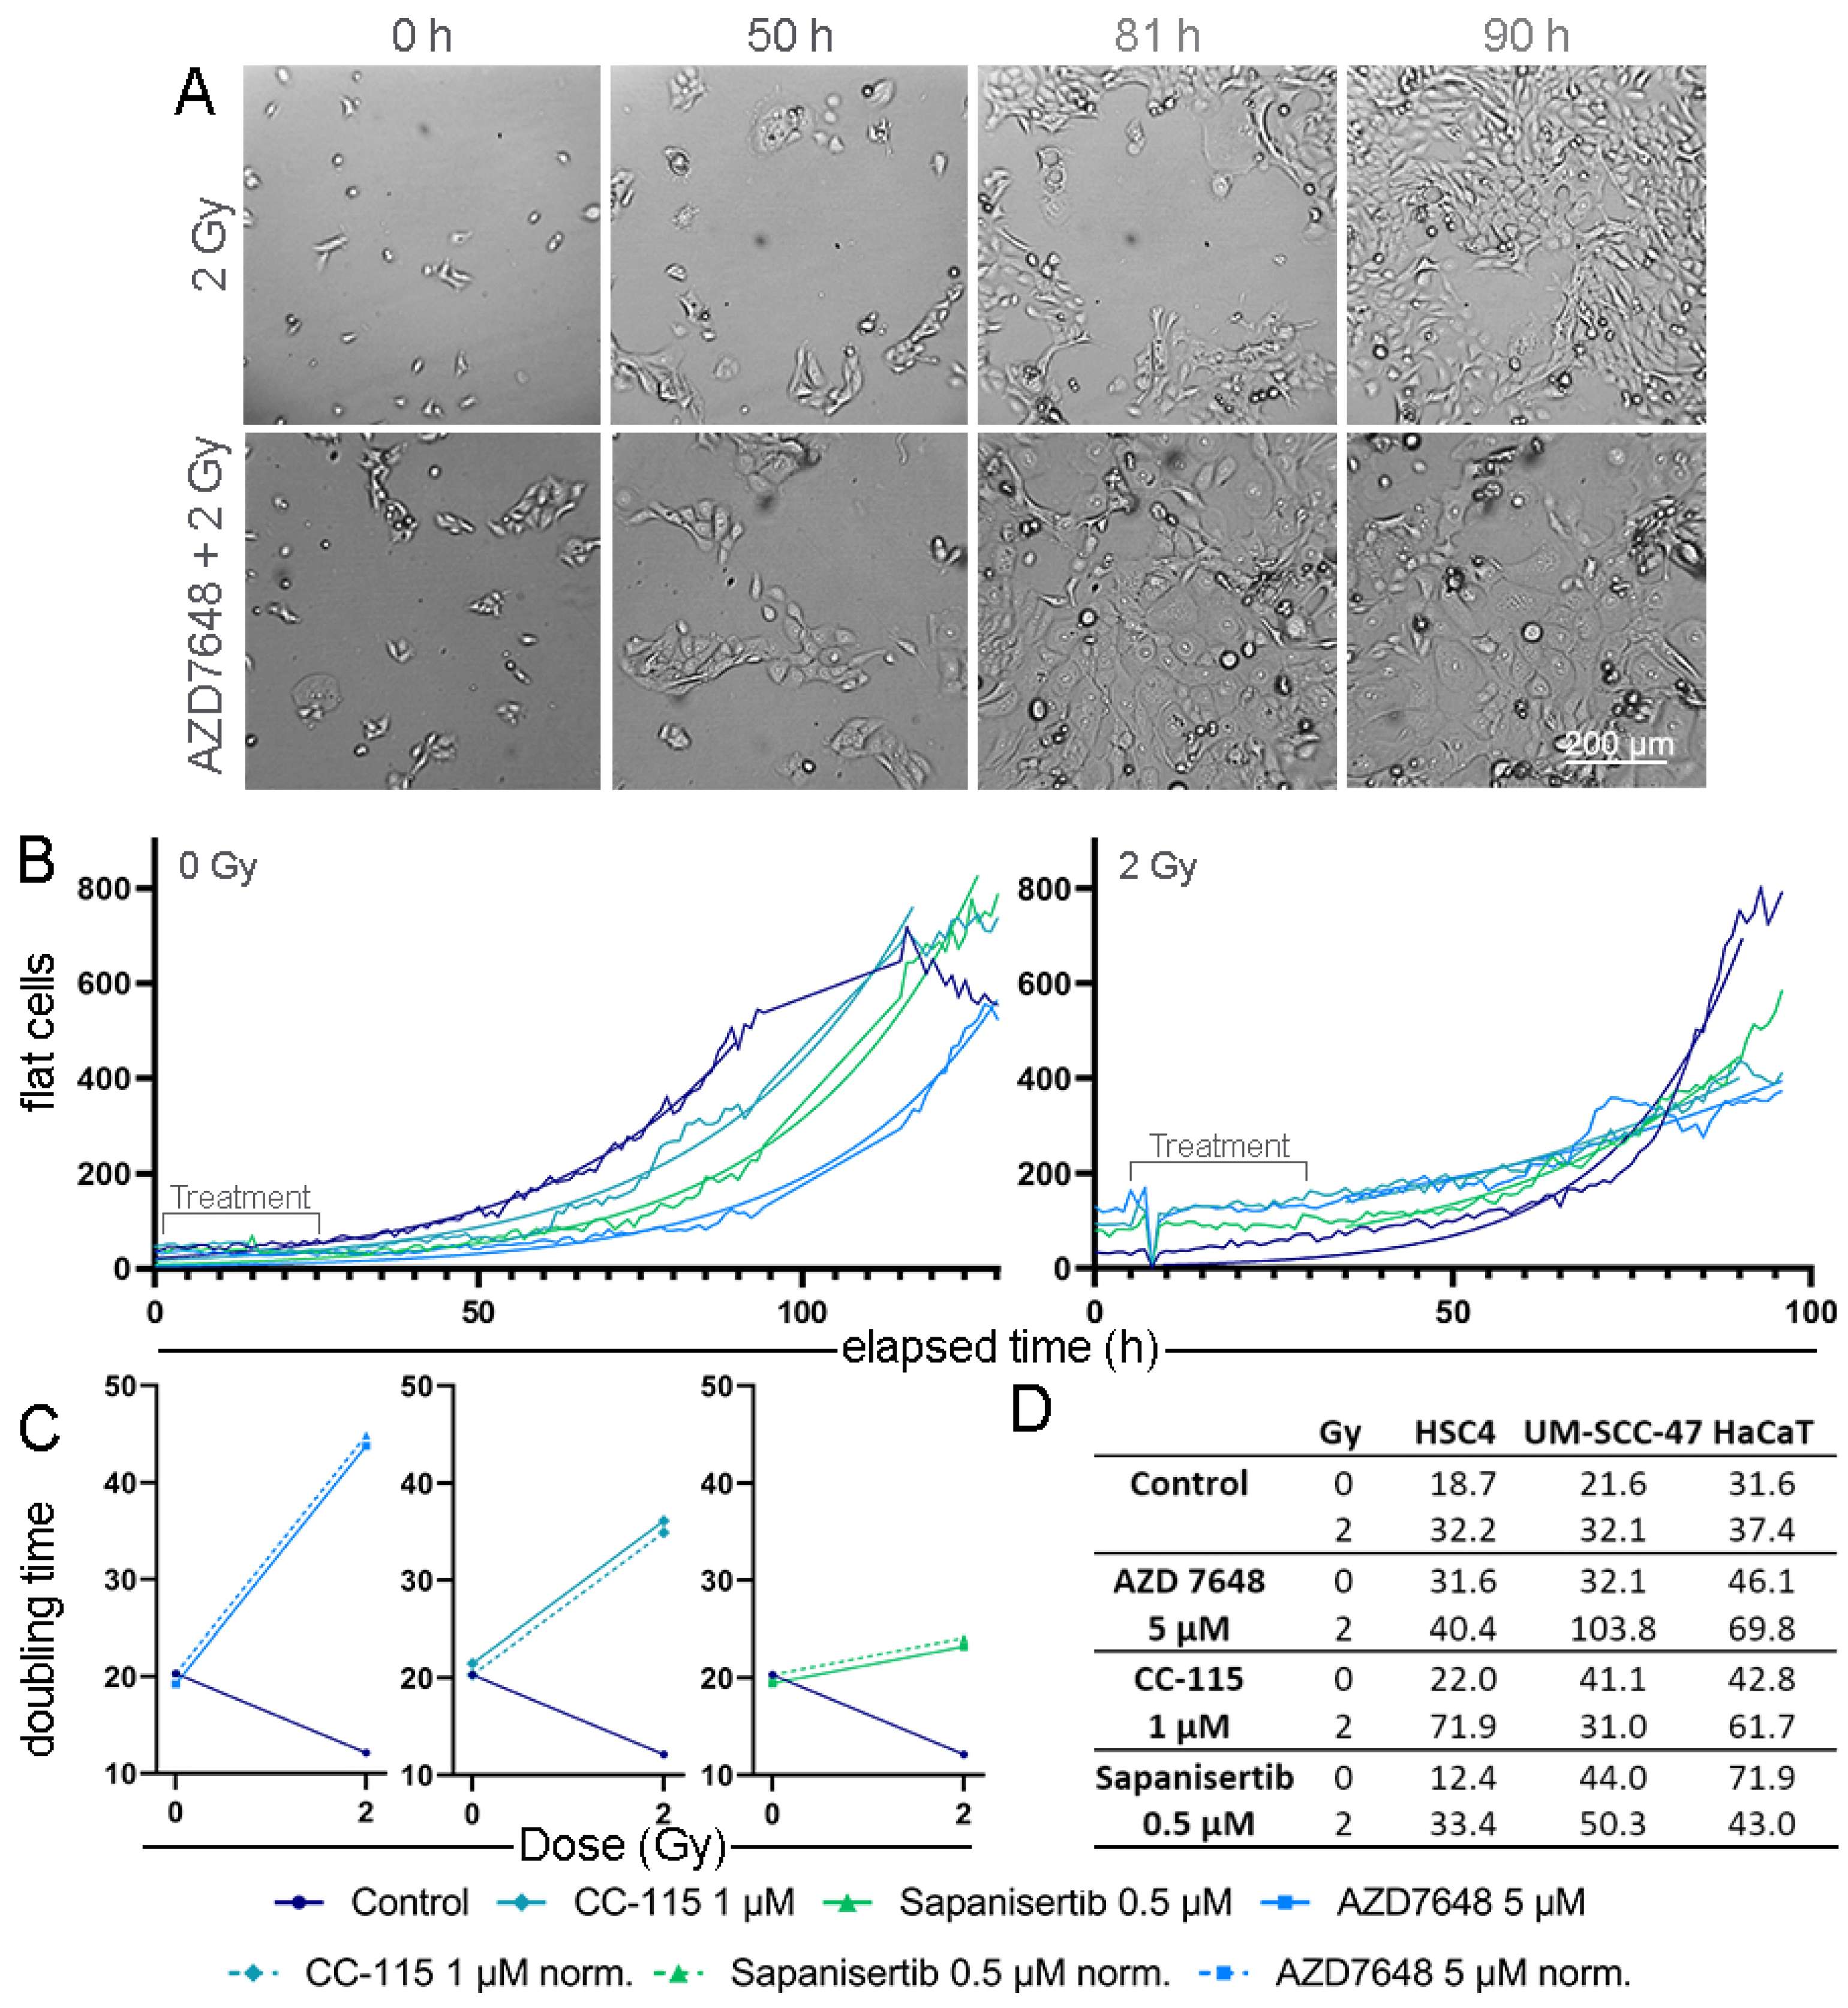
3.4. Real-Time Microscopy to Detect Time-Resolved Proliferation under Treatment
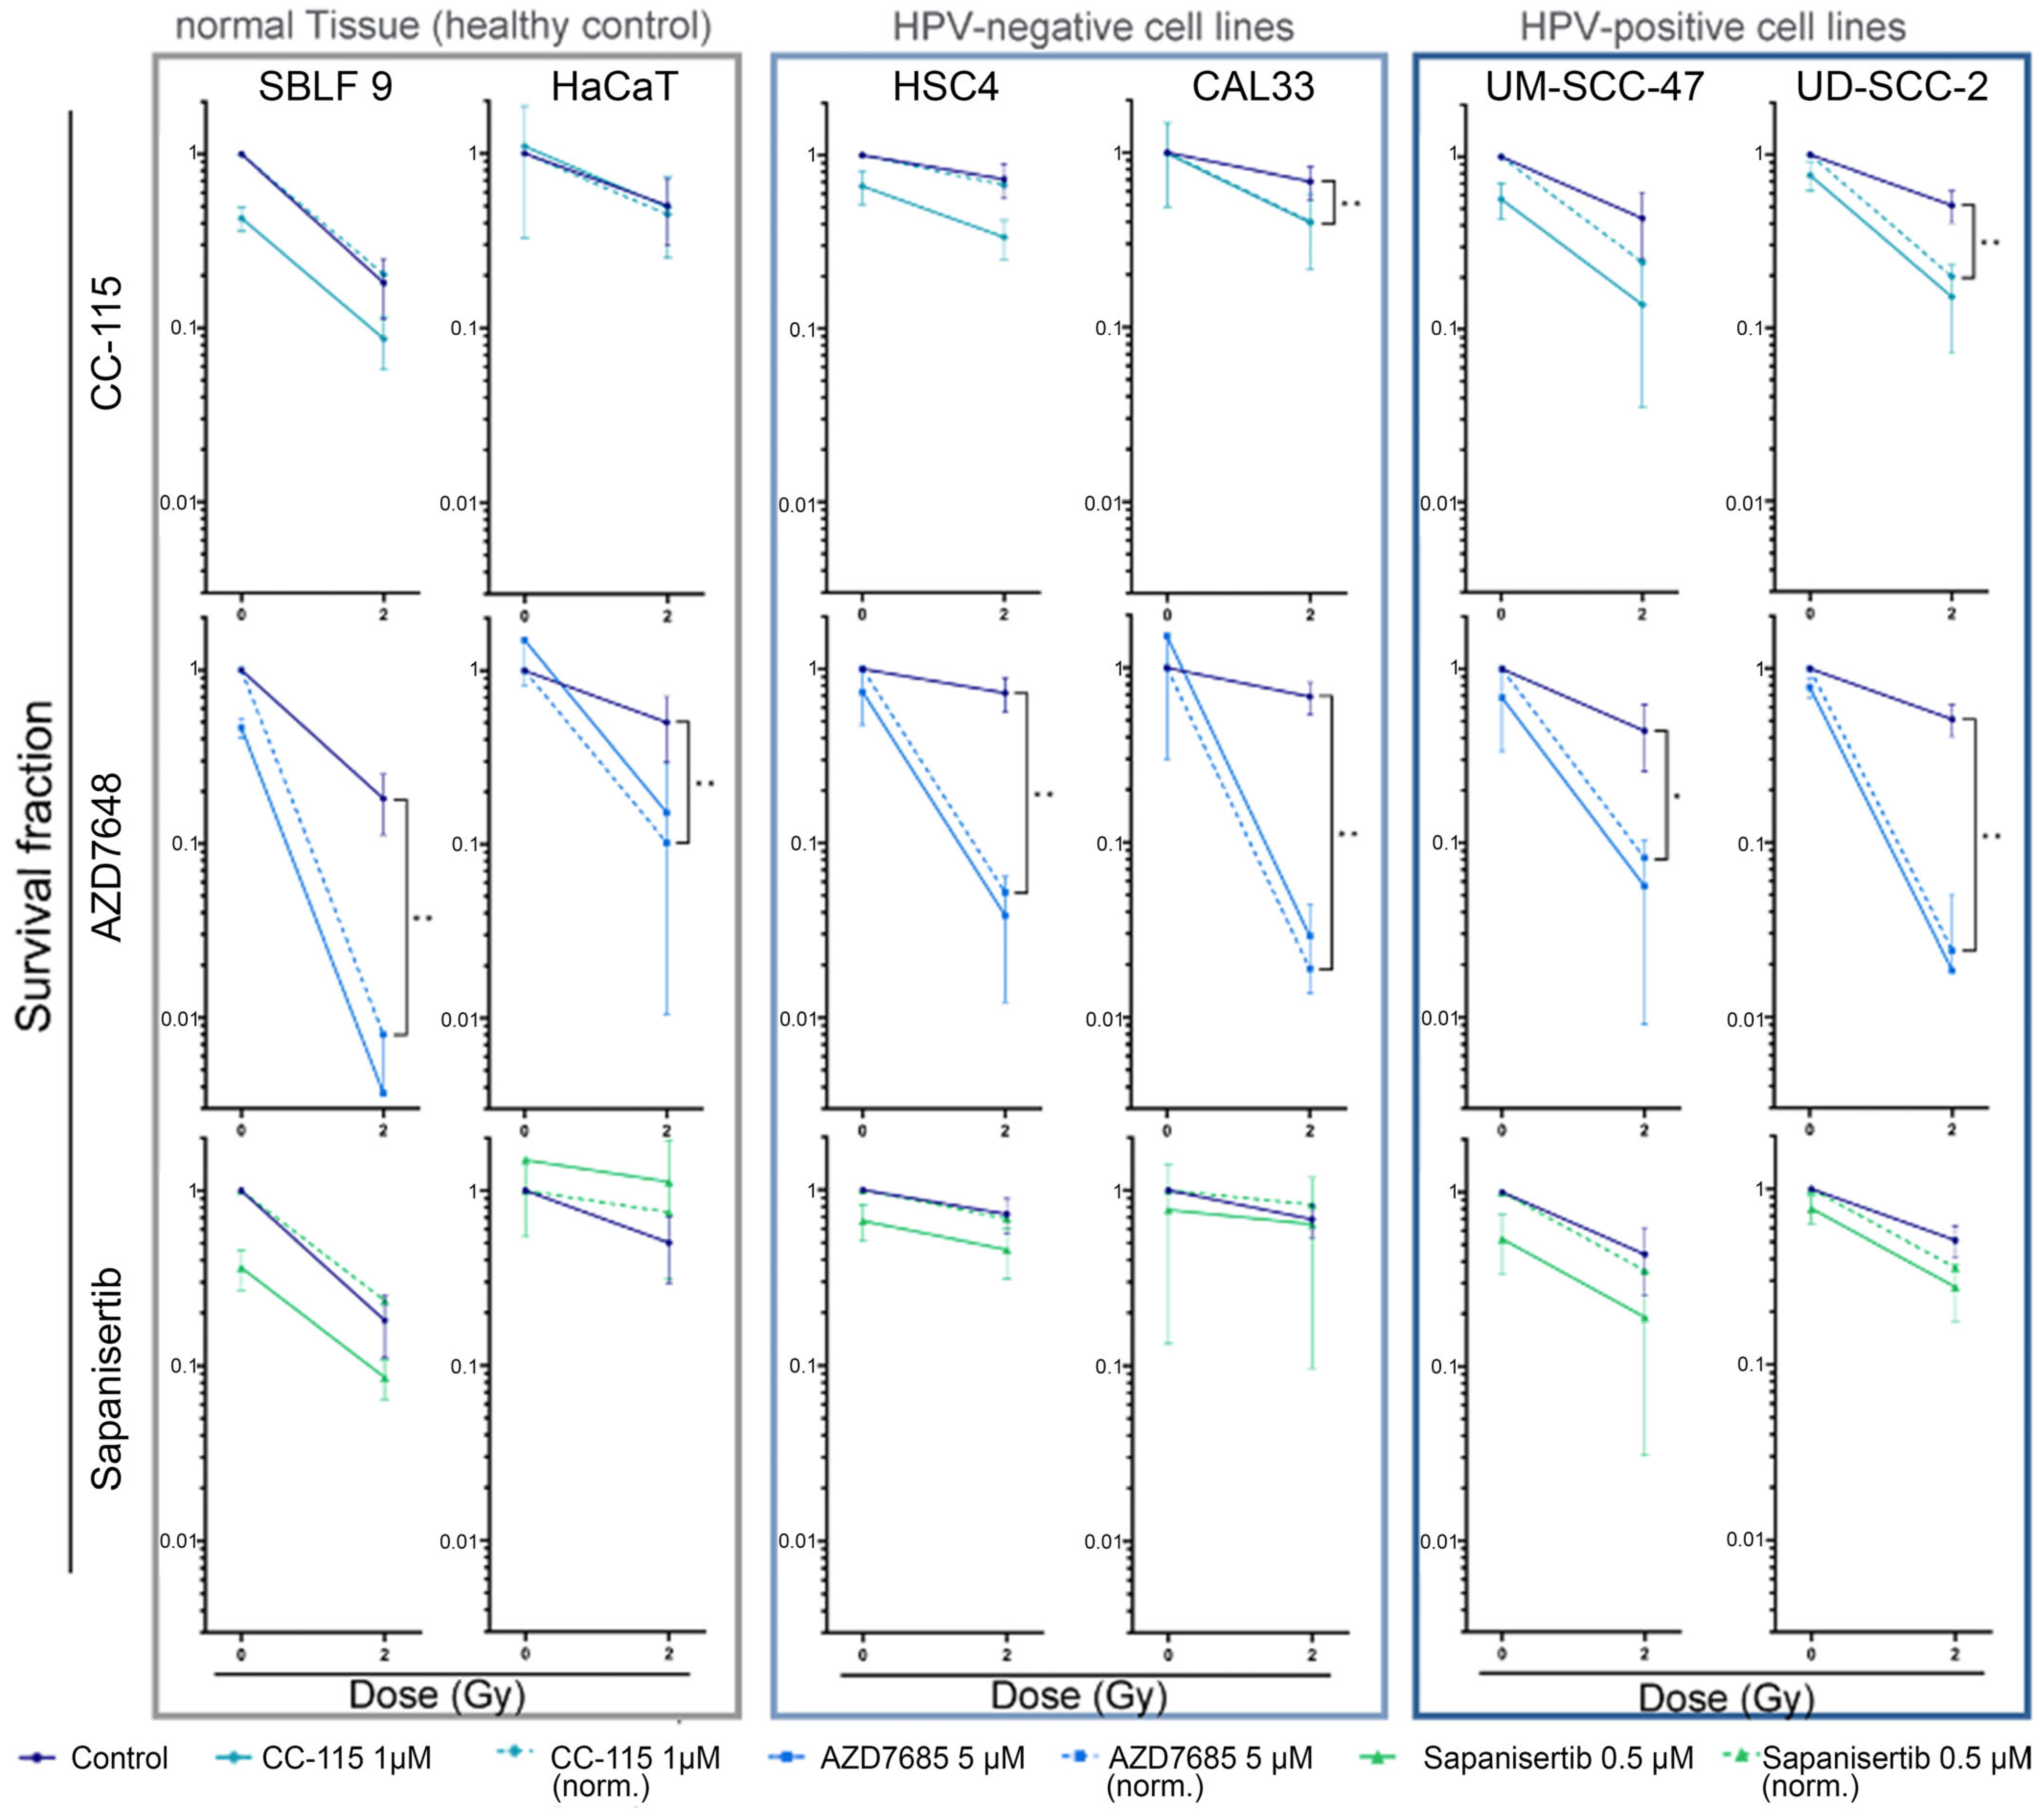
3.5. Colony-Forming Assay for Clonogenicity
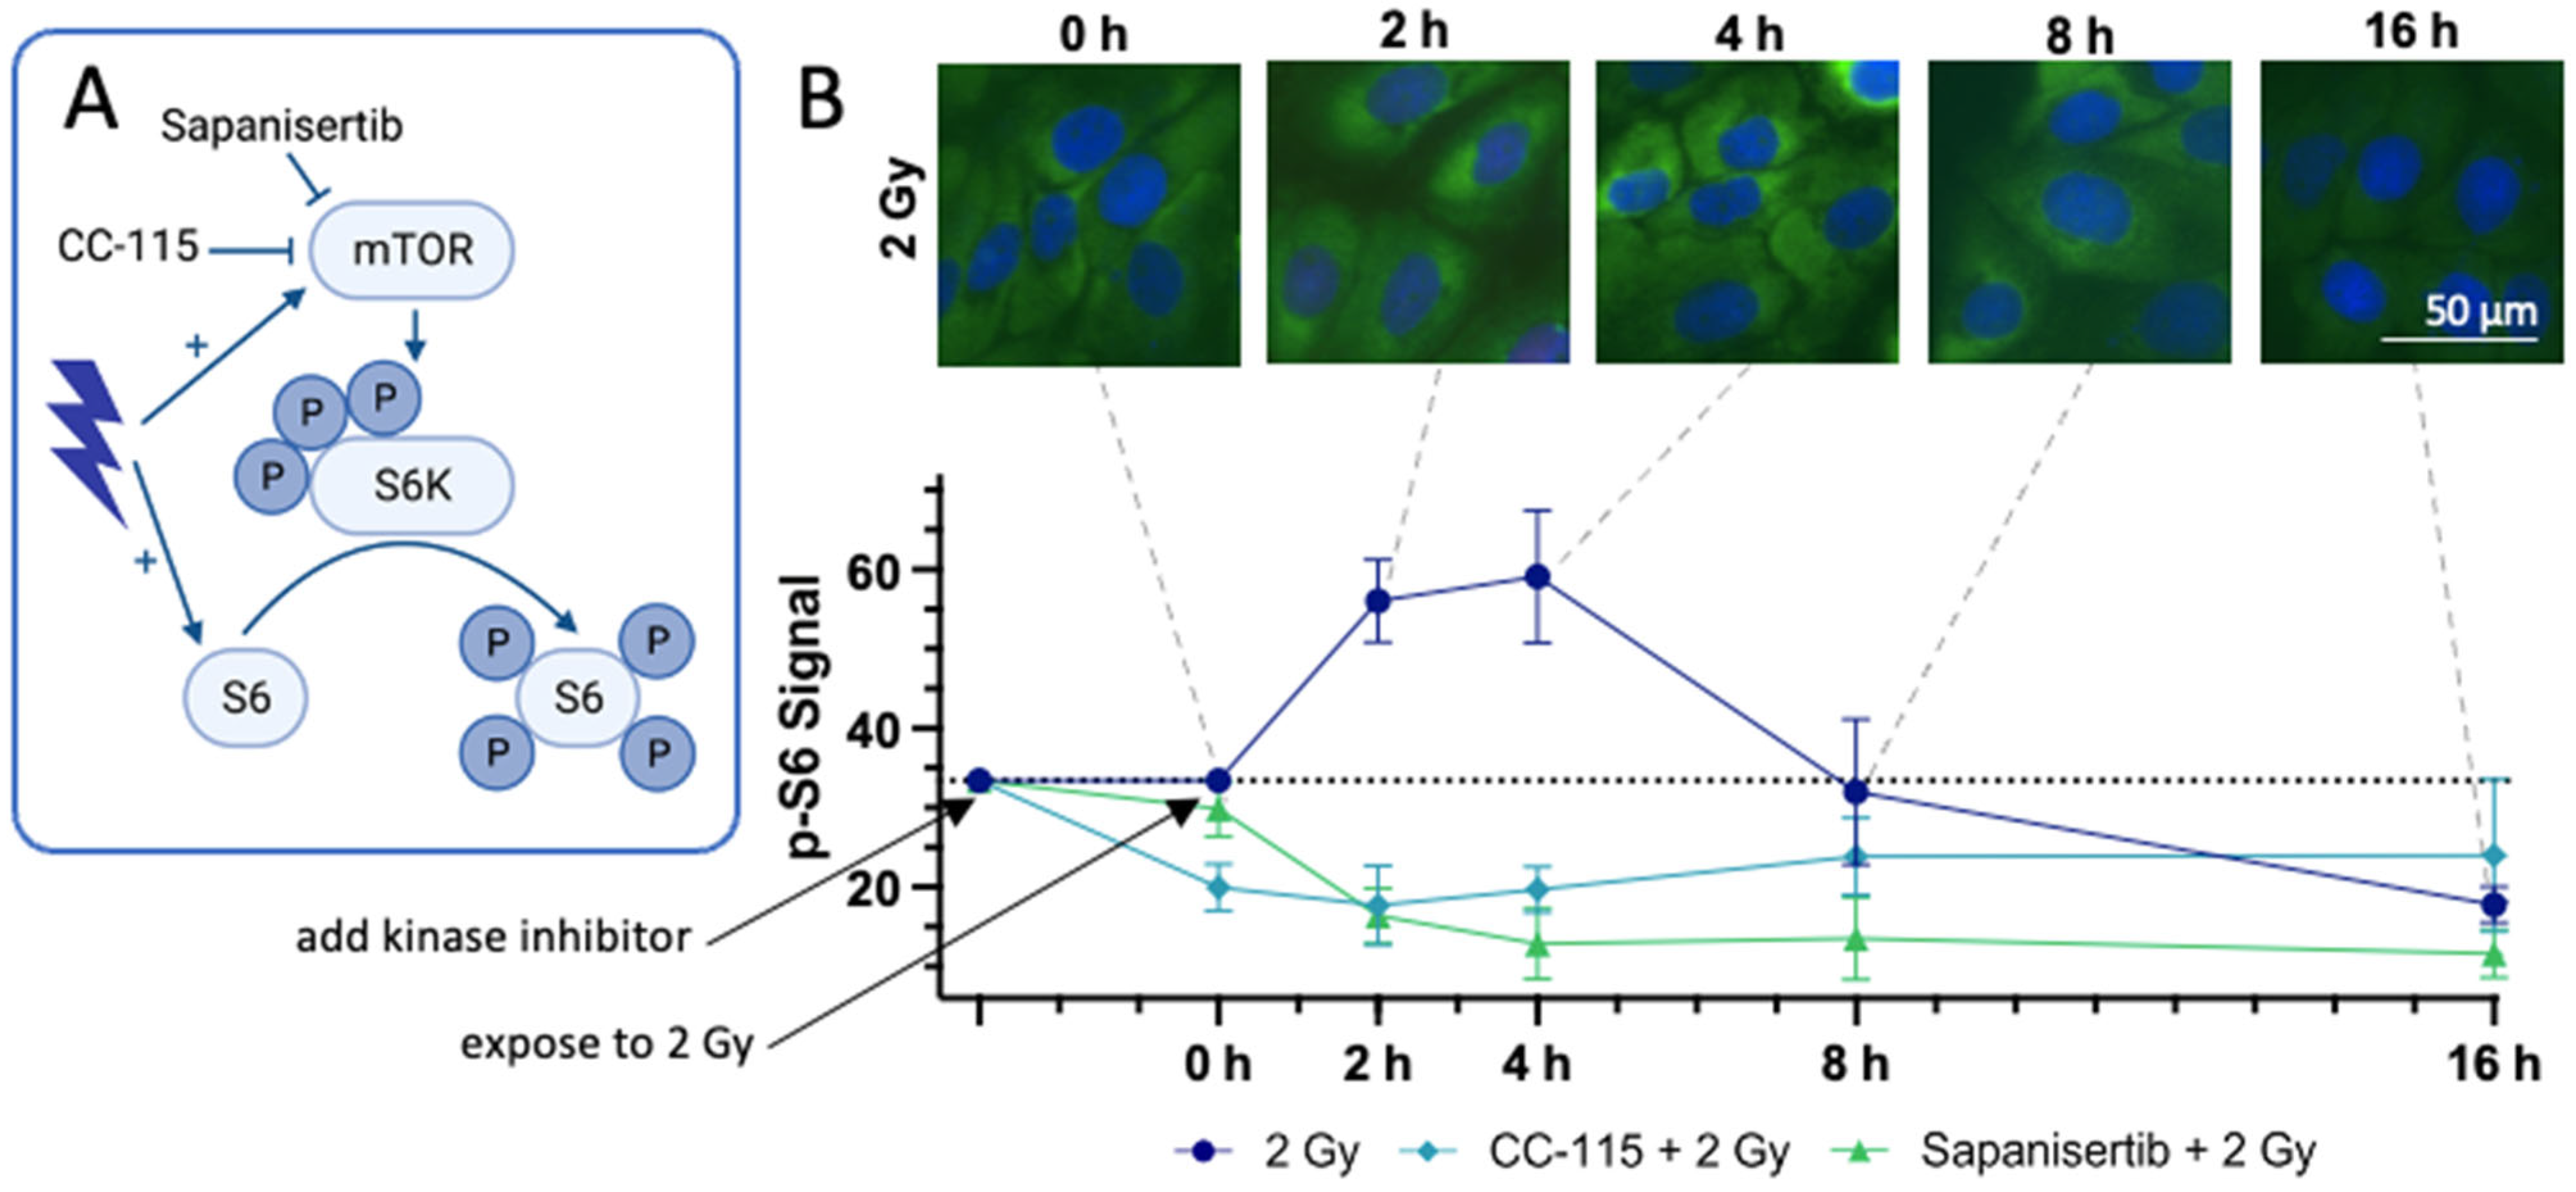
3.6. Immunohistochemical Staining of the Downstream Proteins of mTOR
4. Discussion
5. Conclusions
Author Contributions
Funding
Institutional Review Board Statement
Informed Consent Statement
Data Availability Statement
Acknowledgments
Conflicts of Interest
References
- Sung, H.; Ferlay, J.; Siegel, R.L.; Laversanne, M.; Soerjomataram, I.; Jemal, A.; Bray, F. Global Cancer Statistics 2020: GLOBOCAN Estimates of Incidence and Mortality Worldwide for 36 Cancers in 185 Countries. CA Cancer J. Clin. 2021, 71, 209–249. [Google Scholar] [CrossRef] [PubMed]
- Johnson, D.E.; Burtness, B.; Leemans, C.R.; Lui, V.W.Y.; Bauman, J.E.; Grandis, J.R. Head and neck squamous cell carcinoma. Nat. Rev. Dis. Prim. 2020, 6, 92. [Google Scholar] [CrossRef] [PubMed]
- Bray, F.; Ferlay, J.; Soerjomataram, I.; Siegel, R.L.; Torre, L.A.; Jemal, A. Global cancer statistics 2018: GLOBOCAN estimates of incidence and mortality worldwide for 36 cancers in 185 countries. CA Cancer J. Clin. 2018, 68, 394–424. [Google Scholar] [CrossRef] [PubMed]
- Ferlay, J. Global Cancer Observatory. Available online: https://gco.iarc.fr/today (accessed on 21 January 2023).
- Ferlay, J.; Colombet, M.; Soerjomataram, I.; Mathers, C.; Parkin, D.M.; Piñeros, M.; Znaor, A.; Bray, F. Estimating the global cancer incidence and mortality in 2018: GLOBOCAN sources and methods. Int. J. Cancer 2019, 144, 1941–1953. [Google Scholar] [CrossRef] [PubMed]
- Fabbrizi, M.R.; Parsons, J.L. Radiotherapy and the cellular DNA damage response: Current and future perspectives on head and neck cancer treatment. Cancer Drug Resist. 2020, 3, 775. [Google Scholar] [CrossRef] [PubMed]
- Economopoulou, P.; Perisanidis, C.; Giotakis, E.I.; Psyrri, A. The emerging role of immunotherapy in head and neck squamous cell carcinoma (HNSCC): Anti-tumor immunity and clinical applications. Ann. Transl. Med. 2016, 4, 173. [Google Scholar] [CrossRef] [PubMed]
- Ang, K.K.; Harris, J.; Wheeler, R.; Weber, R.; Rosenthal, D.I.; Nguyen-Tân, P.F.; Westra, W.H.; Chung, C.H.; Jordan, R.C.; Lu, C.; et al. Human Papillomavirus and Survival of Patients with Oropharyngeal Cancer. N. Engl. J. Med. 2010, 363, 24–35. [Google Scholar] [CrossRef] [PubMed]
- Burtness, B.; Harrington, K.J.; Greil, R.; Soulières, D.; Tahara, M.; de Castro, G., Jr.; Psyrri, A.; Basté, N.; Neupane, P.; Bratland, Å.; et al. Pembrolizumab alone or with chemotherapy versus cetuximab with chemotherapy for recurrent or metastatic squamous cell carcinoma of the head and neck (KEYNOTE-048): A randomised, open-label, phase 3 study. Lancet 2019, 394, 1915–1928. [Google Scholar] [CrossRef]
- Seiwert, T.Y.; Burtness, B.; Mehra, R.; Weiss, J.; Berger, R.; Eder, J.P.; Heath, K.; McClanahan, T.; Lunceford, J.; Gause, C.; et al. Safety and clinical activity of pembrolizumab for treatment of recurrent or metastatic squamous cell carcinoma of the head and neck (KEYNOTE-012): An open-label, multicentre, phase 1b trial. Lancet Oncol. 2016, 17, 956–965. [Google Scholar] [CrossRef]
- Ferris, R.L.; Blumenschein, G., Jr.; Fayette, J.; Guigay, J.; Colevas, A.D.; Licitra, L.; Harrington, K.; Kasper, S.; Vokes, E.E.; Even, C.; et al. Nivolumab for Recurrent Squamous-Cell Carcinoma of the Head and Neck. N. Engl. J. Med. 2016, 375, 1856–1867. [Google Scholar] [CrossRef]
- Kitamura, N.; Sento, S.; Yoshizawa, Y.; Sasabe, E.; Kudo, Y.; Yamamoto, T. Current Trends and Future Prospects of Molecular Targeted Therapy in Head and Neck Squamous Cell Carcinoma. Int. J. Mol. Sci. 2020, 22, 240. [Google Scholar] [CrossRef]
- Von der Grün, J.; Balermpas, P. Radiotherapie mit Cetuximab oder Cisplatin beim Plattenepithelkarzinom der Kopf-Hals-Region—Was ist zu bevorzugen? Strahlenther. Onkol. 2020, 196, 197–199. [Google Scholar] [CrossRef]
- Rühle, A.; Nicolay, N.H. Wöchentliche versus dreiwöchentliche Cisplatingabe bei der postoperativen Radiochemotherapie von lokal fortgeschrittenen Kopf-Hals-Plattenepithelkarzinomen—Ergebnisse der JCOG1008-Studie. Strahlenther. Onkol. 2022, 198, 966–969. [Google Scholar] [CrossRef]
- Dağdelen, M.; Şahin, M.; Çatal, T.K.; Yıldırım, H.C.; Karaçam, S.; Çepni, K.; Uzel, Ö.E. Selective local postoperative radiotherapy for T3-T4 N0 laryngeal cancer. Strahlenther. Onkol. 2022, 198, 1025–1031. [Google Scholar] [CrossRef]
- Kaidar-Person, O.; Gil, Z.; Billan, S. Precision medicine in head and neck cancer. Drug Resist. Updates 2018, 40, 13–16. [Google Scholar] [CrossRef] [PubMed]
- Griffin, S.; Walker, S.; Sculpher, M.; White, S.; Erhorn, S.; Brent, S.; Dyker, A.; Ferrie, L.; Gilfillan, C.; Horsley, W.; et al. Cetuximab plus radiotherapy for the treatment of locally advanced squamous cell carcinoma of the head and neck. Health Technol. Assess. 2009, 13 (Suppl. S1), 49–54. [Google Scholar] [CrossRef] [PubMed]
- Bonner, J.A.; Harari, P.M.; Giralt, J.; Azarnia, N.; Shin, D.M.; Cohen, R.B.; Jones, C.U.; Sur, R.; Raben, D.; Jassem, J.; et al. Radiotherapy plus cetuximab for squamous-cell carcinoma of the head and neck. N. Engl. J. Med. 2006, 354, 567–578. [Google Scholar] [CrossRef] [PubMed]
- Koyama, S.; Akbay, E.A.; Li, Y.Y.; Herter-Sprie, G.S.; Buczkowski, K.A.; Richards, W.G.; Gandhi, L.; Redig, A.J.; Rodig, S.J.; Asahina, H.; et al. Adaptive resistance to therapeutic PD-1 blockade is associated with upregulation of alternative immune checkpoints. Nat. Commun. 2016, 7, 10501. [Google Scholar] [CrossRef]
- Chow, L.Q.M.; Haddad, R.; Gupta, S.; Mahipal, A.; Mehra, R.; Tahara, M.; Berger, R.; Eder, J.P.; Burtness, B.; Lee, S.H.; et al. Antitumor Activity of Pembrolizumab in Biomarker-Unselected Patients with Recurrent and/or Metastatic Head and Neck Squamous Cell Carcinoma: Results from the Phase Ib KEYNOTE-012 Expansion Cohort. J. Clin. Oncol. 2016, 34, 3838–3845. [Google Scholar] [CrossRef] [PubMed]
- Saâda-Bouzid, E.; Defaucheux, C.; Karabajakian, A.; Coloma, V.P.; Servois, V.; Paoletti, X.; Even, C.; Fayette, J.; Guigay, J.; Loirat, D.; et al. Hyperprogression during anti-PD-1/PD-L1 therapy in patients with recurrent and/or metastatic head and neck squamous cell carcinoma. Ann. Oncol. 2017, 28, 1605–1611. [Google Scholar] [CrossRef] [PubMed]
- Champiat, S.; Ferrara, R.; Massard, C.; Besse, B.; Marabelle, A.; Soria, J.C.; Ferté, C. Hyperprogressive disease: Recognizing a novel pattern to improve patient management. Nat. Rev. Clin. Oncol. 2018, 15, 748–762. [Google Scholar] [CrossRef] [PubMed]
- Van den Bossche, V.; Zaryouh, H.; Vara-Messler, M.; Vignau, J.; Machiels, J.P.; Wouters, A.; Schmitz, S.; Corbet, C. Microenvironment-driven intratumoral heterogeneity in head and neck cancers: Clinical challenges and opportunities for precision medicine. Drug Resist. Updates 2022, 60, 100806. [Google Scholar] [CrossRef] [PubMed]
- Hecht, M.; Hahn, D.; Wolber, P.; Hautmann, M.G.; Reichert, D.; Weniger, S.; Belka, C.; Bergmann, T.; Göhler, T.; Welslau, M.; et al. A Prospective Real-World Multi-Center Study to Evaluate Progression-Free and Overall Survival of Radiotherapy with Cetuximab and Platinum-Based Chemotherapy with Cetuximab in Locally Recurrent Head and Neck Cancer. Cancers 2021, 13, 3413. [Google Scholar] [CrossRef] [PubMed]
- Kang, Y.; He, W.; Ren, C.; Qiao, J.; Guo, Q.; Hu, J.; Xu, H.; Jiang, X.; Wang, L. Advances in targeted therapy mainly based on signal pathways for nasopharyngeal carcinoma. Signal Transduct. Target. Ther. 2020, 5, 245. [Google Scholar] [CrossRef] [PubMed]
- Caetano, R.S.; Lima, F.F.; Gomes, E.P.; Volpato, L.E. Quality of Life of Patients After Treatment for Cancer in the Head and Neck Region: A Case-Control Study. Cureus 2022, 14, e25800. [Google Scholar] [CrossRef] [PubMed]
- Brook, I. Late side effects of radiation treatment for head and neck cancer. Radiat. Oncol. J. 2020, 38, 84–92. [Google Scholar] [CrossRef] [PubMed]
- Lazarus, C.L. Effects of chemoradiotherapy on voice and swallowing. Curr. Opin. Otolaryngol. Head Neck Surg. 2009, 17, 172–178. [Google Scholar] [CrossRef]
- Huang, R.-X.; Zhou, P.-K. DNA damage response signaling pathways and targets for radiotherapy sensitization in cancer. Signal Transduct. Target. Ther. 2020, 5, 60. [Google Scholar] [CrossRef]
- Lieber, M.R. The Mechanism of Human Nonhomologous DNA End Joining. J. Biol. Chem. 2008, 283, 1–5. [Google Scholar] [CrossRef]
- San Filippo, J.; Sung, P.; Klein, H. Mechanism of Eukaryotic Homologous Recombination. Annu. Rev. Biochem. 2008, 77, 229–257. [Google Scholar] [CrossRef]
- Lieber, M.R. The Mechanism of Double-Strand DNA Break Repair by the Nonhomologous DNA End-Joining Pathway. Annu. Rev. Biochem. 2010, 79, 181–211. [Google Scholar] [CrossRef] [PubMed]
- Srivastava, M.; Raghavan, S.C. DNA Double-Strand Break Repair Inhibitors as Cancer Therapeutics. Chem. Biol. 2015, 22, 17–29. [Google Scholar] [CrossRef] [PubMed]
- Glorieux, M.; Dok, R.; Nuyts, S. Novel DNA targeted therapies for head and neck cancers: Clinical potential and biomarkers. Oncotarget 2017, 8, 81662–81678. [Google Scholar] [CrossRef] [PubMed]
- Munster, P.; Mita, M.; Mahipal, A.; Nemunaitis, J.; Massard, C.; Mikkelsen, T.; Cruz, C.; Paz-Ares, L.; Hidalgo, M.; Rathkopf, D.; et al. First-In-Human Phase I Study of a Dual mTOR Kinase and DNA-PK Inhibitor (CC-115) in Advanced Malignancy. Cancer Manag. Res. 2019, 11, 10463–10476. [Google Scholar] [CrossRef] [PubMed]
- Basourakos, S.P.; Li, L.; Aparicio, A.M.; Corn, P.G.; Kim, J.; Thompson, T.C. Combination Platinum-based and DNA Damage Response-targeting Cancer Therapy: Evolution and Future Directions. Curr. Med. Chem. 2017, 24, 1586–1606. [Google Scholar] [CrossRef] [PubMed]
- Davis, A.J.; Chen, B.P.C.; Chen, D.J. DNA-PK: A dynamic enzyme in a versatile DSB repair pathway. DNA Repair 2014, 17, 21–29. [Google Scholar] [CrossRef] [PubMed]
- Yang, F.; Teves, S.S.; Kemp, C.J.; Henikoff, S. Doxorubicin, DNA torsion, and chromatin dynamics. Biochim. Biophys. Acta (BBA)-Rev. Cancer 2014, 1845, 84–89. [Google Scholar] [CrossRef]
- Chang, H.H.Y.; Pannunzio, N.R.; Adachi, N.; Lieber, M.R. Non-homologous DNA end joining and alternative pathways to double-strand break repair. Nat. Rev. Mol. Cell Biol. 2017, 18, 495–506. [Google Scholar] [CrossRef]
- Goodwin, J.F.; Knudsen, K.E. Beyond DNA Repair: DNA-PK Function in Cancer. Cancer Discov. 2014, 4, 1126–1139. [Google Scholar] [CrossRef]
- Smith, G.C.M.; Jackson, S.P. The DNA-dependent protein kinase. Genes Dev. 1999, 13, 916–934. [Google Scholar] [CrossRef]
- Kurimasa, A.; Kumano, S.; Boubnov, N.V.; Story, M.D.; Tung, C.-S.; Peterson, S.R.; Chen, D.J. Requirement for the Kinase Activity of Human DNA-Dependent Protein Kinase Catalytic Subunit in DNA Strand Break Rejoining. Mol. Cell. Biol. 1999, 19, 3877–3884. [Google Scholar] [CrossRef]
- Sinclair, W.K. Cyclic X-ray Responses in Mammalian Cells In Vitro. Radiat. Res. 1968, 33, 620–643. [Google Scholar] [CrossRef]
- Lui, V.W.Y.; Hedberg, M.L.; Li, H.; Vangara, B.S.; Pendleton, K.; Zeng, Y.; Lu, Y.; Zhang, Q.; Du, Y.; Gilbert, B.R.; et al. Frequent Mutation of the PI3K Pathway in Head and Neck Cancer Defines Predictive Biomarkers. Cancer Discov. 2013, 3, 761–769. [Google Scholar] [CrossRef] [PubMed]
- The Cancer Genome Atlas Network. Comprehensive genomic characterization of head and neck squamous cell carcinomas. Nature 2015, 517, 576–582. [Google Scholar] [CrossRef]
- Du, L.; Shen, J.; Weems, A.; Lu, S.-L. Role of Phosphatidylinositol-3-Kinase Pathway in Head and Neck Squamous Cell Carcinoma. J. Oncol. 2012, 2012, 450179. [Google Scholar] [CrossRef] [PubMed]
- Cai, Y.; Dodhia, S.; Su, G.H. Dysregulations in the PI3K pathway and targeted therapies for head and neck squamous cell carcinoma. Oncotarget 2017, 8, 22203–22217. [Google Scholar] [CrossRef] [PubMed]
- Lovejoy, C.A.; Cortez, D. Common mechanisms of PIKK regulation. DNA Repair 2009, 8, 1004–1008. [Google Scholar] [CrossRef] [PubMed]
- Laplante, M.; Sabatini, D.M. mTOR Signaling in Growth Control and Disease. Cell 2012, 149, 274–293. [Google Scholar] [CrossRef] [PubMed]
- Heikamp, E.B.; Patel, C.H.; Collins, S.; Waickman, A.; Oh, M.-H.; Sun, I.-H.; Illei, P.; Sharma, A.; Naray-Fejes-Toth, A.; Fejes-Toth, G.; et al. The AGC kinase SGK1 regulates TH1 and TH2 differentiation downstream of the mTORC2 complex. Nat. Immunol. 2014, 15, 457–464. [Google Scholar] [CrossRef] [PubMed]
- Rispal, D. Target of Rapamycin Complex 2 Regulates Actin Polarization and Endocytosis via Multiple Pathways. J. Biol. Chem. 2015, 290, 14963–14978. [Google Scholar] [CrossRef]
- Chen, H.; Ma, Z.; Vanderwaal, R.P.; Feng, Z.; Gonzalez-Suarez, I.; Wang, S.; Zhang, J.; Roti Roti, J.L.; Gonzalo, S.; Zhang, J. The mTOR inhibitor rapamycin suppresses DNA double-strand break repair. Radiat. Res. 2011, 175, 214–224. [Google Scholar] [CrossRef] [PubMed]
- Fok, J.H.L.; Ramos-Montoya, A.; Vazquez-Chantada, M.; Wijnhoven, P.W.G.; Follia, V.; James, N.; Farrington, P.M.; Karmokar, A.; Willis, S.E.; Cairns, J.; et al. AZD7648 is a potent and selective DNA-PK inhibitor that enhances radiation, chemotherapy and olaparib activity. Nat. Commun. 2019, 10, 5065. [Google Scholar] [CrossRef] [PubMed]
- Miyahara, H.; Yadavilli, S.; Natsumeda, M.; Rubens, J.A.; Rodgers, L.; Kambhampati, M.; Taylor, I.C.; Kaur, H.; Asnaghi, L.; Eberhart, C.G.; et al. The dual mTOR kinase inhibitor TAK228 inhibits tumorigenicity and enhances radiosensitization in diffuse intrinsic pontine glioma. Cancer Lett. 2017, 400, 110–116. [Google Scholar] [CrossRef] [PubMed]
- Zhang, J.; Jiang, Y.; Yu, Y.; Li, J. Preclinical evaluation of the dual mTORC1/2 inhibitor sapanisertib in combination with cisplatin in nasopharyngeal carcinoma. Eur. J. Pharmacol. 2021, 915, 174688. [Google Scholar] [CrossRef]
- McGregor, B.A.; Xie, W.; Adib, E.; Stadler, W.M.; Zakharia, Y.; Alva, A.; Michaelson, M.D.; Gupta, S.; Lam, E.T.; Farah, S.; et al. Biomarker-Based Phase II Study of Sapanisertib (TAK-228): An mTORC1/2 Inhibitor in Patients with Refractory Metastatic Renal Cell Carcinoma. JCO Precis. Oncol. 2022, 6, e2100448. [Google Scholar] [CrossRef] [PubMed]
- Tsuji, T.; Sapinoso, L.M.; Tran, T.; Gaffney, B.; Wong, L.; Sankar, S.; Raymon, H.K.; Mortensen, D.S.; Xu, S. CC-115, a dual inhibitor of mTOR kinase and DNA-PK, blocks DNA damage repair pathways and selectively inhibits ATM-deficient cell growth in vitro. Oncotarget 2017, 8, 74688–74702. [Google Scholar] [CrossRef] [PubMed]
- Merten, R.; Hecht, M.; Haderlein, M.; Distel, L.; Fietkau, R.; Heinzerling, L.; Semrau, S. Increased skin and mucosal toxicity in the combination of vemurafenib with radiation therapy. Strahlenther. Onkol. 2014, 190, 1169–1172. [Google Scholar] [CrossRef]
- Buch, K.; Peters, T.; Nawroth, T.; Sänger, M.; Schmidberger, H.; Langguth, P. Determination of cell survival after irradiation via clonogenic assay versus multiple MTT Assay—A comparative study. Radiat. Oncol. 2012, 7, 1. [Google Scholar] [CrossRef]
- Faulhaber, E.M.; Jost, T.; Symank, J.; Scheper, J.; Bürkel, F.; Fietkau, R.; Hecht, M.; Distel, L.V. Kinase Inhibitors of DNA-PK, ATM and ATR in Combination with Ionizing Radiation Can Increase Tumor Cell Death in HNSCC Cells While Sparing Normal Tissue Cells. Genes 2021, 12, 925. [Google Scholar] [CrossRef]
- Scheper, J.; Hildebrand, L.S.; Faulhaber, E.M.; Deloch, L.; Gaipl, U.S.; Symank, J.; Fietkau, R.; Distel, L.V.; Hecht, M.; Jost, T. Tumor-specific radiosensitizing effect of the ATM inhibitor AZD0156 in melanoma cells with low toxicity to healthy fibroblasts. Strahlenther. Onkol. 2023, 199, 1128–1139. [Google Scholar] [CrossRef]
- Jost, T.; Schultz, A.K.; Frey, B.; Vu, J.; Fietkau, R.; Distel, L.V.; Hecht, M. Influence of alectinib and crizotinib on ionizing radiation—In vitro analysis of ALK/ROS1-wildtype lung tissue cells. Neoplasia 2022, 27, 100780. [Google Scholar] [CrossRef] [PubMed]
- Phan, M.; Kim, C.; Mutsaers, A.; Poirier, V.; Coomber, B. Modulation of mTOR signaling by radiation an rapamycin treatment in canine mast cell cancer cells. Can. J. Veternary Res. 2022, 86, 3–12. [Google Scholar]
- Markova, B.; Albers, C.; Breitenbuecher, F.; Melo, J.V.; Brümmendorf, T.H.; Heidel, F.; Lipka, D.; Duyster, J.; Huber, C.; Fischer, T. Novel pathway in Bcr-Abl signal transduction involves Akt-independent, PLC-gamma1-driven activation of mTOR/p70S6-kinase pathway. Oncogene 2010, 29, 739–751. [Google Scholar] [CrossRef] [PubMed]
- Noubissi, F.K.; McBride, A.A.; Leppert, H.G.; Millet, L.J.; Wang, X.; Davern, S.M. Detection and quantification of γ-H2AX using a dissociation enhanced lanthanide fluorescence immunoassay. Sci. Rep. 2021, 11, 8945. [Google Scholar] [CrossRef] [PubMed]
- Mao, Z.; Hine, C.; Tian, X.; Van Meter, M.; Au, M.; Vaidya, A.; Seluanov, A.; Gorbunova, V. SIRT6 promotes DNA repair under stress by activating PARP1. Science 2011, 332, 1443–1446. [Google Scholar] [CrossRef] [PubMed]
- Vargas, J.; Feltes, B.C.; Poloni, J.d.F.; Lenz, G.; Bonatto, D. Senescence; an endogenous anticancer mechanism. Front. Biosci.-Landmark 2012, 17, 2616–2643. [Google Scholar] [CrossRef] [PubMed]
- Reits, E.; Hodge, J.; Herberts, C.; Groothuis, T.; Chakraborty, M.; Wansley, E.; Camphausen, K.; Luiten, R.; Ru, A.; Neijssen, J.; et al. Radiation modulates the peptide repertoire, enhances MHC class I expression, and induces successful antitumor immunotherapy. J. Exp. Med. 2006, 203, 1259–1271. [Google Scholar] [CrossRef]


Disclaimer/Publisher’s Note: The statements, opinions and data contained in all publications are solely those of the individual author(s) and contributor(s) and not of MDPI and/or the editor(s). MDPI and/or the editor(s) disclaim responsibility for any injury to people or property resulting from any ideas, methods, instructions or products referred to in the content. |
© 2024 by the authors. Licensee MDPI, Basel, Switzerland. This article is an open access article distributed under the terms and conditions of the Creative Commons Attribution (CC BY) license (https://creativecommons.org/licenses/by/4.0/).
Share and Cite
Klieber, N.; Hildebrand, L.S.; Faulhaber, E.; Symank, J.; Häck, N.; Härtl, A.; Fietkau, R.; Distel, L.V. Different Impacts of DNA-PK and mTOR Kinase Inhibitors in Combination with Ionizing Radiation on HNSCC and Normal Tissue Cells. Cells 2024, 13, 304. https://doi.org/10.3390/cells13040304
Klieber N, Hildebrand LS, Faulhaber E, Symank J, Häck N, Härtl A, Fietkau R, Distel LV. Different Impacts of DNA-PK and mTOR Kinase Inhibitors in Combination with Ionizing Radiation on HNSCC and Normal Tissue Cells. Cells. 2024; 13(4):304. https://doi.org/10.3390/cells13040304
Chicago/Turabian StyleKlieber, Nina, Laura S. Hildebrand, Eva Faulhaber, Julia Symank, Nicole Häck, Annamaria Härtl, Rainer Fietkau, and Luitpold V. Distel. 2024. "Different Impacts of DNA-PK and mTOR Kinase Inhibitors in Combination with Ionizing Radiation on HNSCC and Normal Tissue Cells" Cells 13, no. 4: 304. https://doi.org/10.3390/cells13040304