Article

Effect of HPSE and HPSE2 SNPs on the Risk of Developing Primary Paraskeletal Multiple Myeloma

1
Department of Hematology and Bone Marrow Transplantation, Chaim Sheba Medical Center, Tel-Hashomer 5266202, Israel
2
Department of Pathology, University of Alabama at Birmingham, Birmingham, AL 35294, USA
3
Technion Integrated Cancer Center (TICC), Rappaport Faculty of Medicine, Technion, Haifa 3525433, Israel
*
Author to whom correspondence should be addressed.
Current address: Division of Hematology, Assuta Ashdod University Hospital, Ashdod 7747629, Israel.
Current address: Faculty of Health Science, Ben-Gurion University of the Negev, Beersheba 8410501, Israel.
Cells 2023, 12(6), 913; https://doi.org/10.3390/cells12060913
Submission received: 18 January 2023 / Revised: 9 March 2023 / Accepted: 13 March 2023 / Published: 16 March 2023

Abstract

:
Multiple myeloma (MM) is a plasma cell malignancy that is accompanied by hypercalcemia, renal failure, anemia, and lytic bone lesions. Heparanase (HPSE) plays an important role in supporting and promoting myeloma progression, maintenance of plasma cell stemness, and resistance to therapy. Previous studies identified functional single nucleotide polymorphisms (SNPs) located in the HPSE gene. In the present study, 5 functional HPSE SNPs and 11 novel HPSE2 SNPs were examined. A very significant association between two enhancer (rs4693608 and rs4693084), and two insulator (rs4364254 and rs4426765) HPSE SNPs and primary paraskeletal disease (PS) was observed. SNP rs657442, located in intron 9 of the HPSE2 gene, revealed a significant protective association with primary paraskeletal disease and lytic bone lesions. The present study demonstrates a promoting (HPSE gene) and protective (HPSE2 gene) role of gene regulatory elements in the development of paraskeletal disease and bone morbidity. The effect of signal discrepancy between myeloma cells and normal cells of the tumor microenvironment is proposed as a mechanism for the involvement of heparanase in primary PS. We suggest that an increase in heparanase-2 expression can lead to effective suppression of heparanase activity in multiple myeloma accompanied by extramedullary and osteolytic bone disease.

1. Introduction

Multiple myeloma (MM) is a malignant neoplasm of plasma cells. The disease is defined by the presence of 10% or more clonal plasma cells in the bone marrow (BM), accompanied by one or more myeloma-defining events (MDE) consisting of the CRAB criteria (hypercalcemia, renal failure, anemia, and lytic bone lesions), and three specific biomarkers: clonal bone marrow plasma cells ≥ 60%, serum free light chain (FLC) ratio ≥ 100, and more than one focal lesion in MRI [1,2]. A subclone of plasma cells, capable of growing outside the BM, may lead to extramedullary multiple myeloma (EMD) [3]. Extramedullary myeloma, presented at initial diagnosis (primary EMD) or recurrence (secondary EMD), includes two categories: i. Extramedullary disease (EMD), an aggressive form of MM with soft-tissue plasmacytomas resulting from hematogenous spread; ii. Paraskeletal disease (PS) characterized by the presence of soft-tissue plasmacytomas arising from direct growth of skeletal tumors with distraction of the bone cortex. Solitary plasmacytoma (SP) and plasma cell leukemia (PCL) are typically excluded from the definition of EMD [3,4]. Despite the implementation of new therapeutic agents, MM is still an incurable disease due to recurrent relapses in most patients [5].
Heparanase, the sole heparan sulfate (HS) degrading endoglycosidase, plays an important role in supporting and promoting myeloma progression, maintenance of cancer cell stemness, and resistance to chemotherapy [6,7,8]. High heparanase expression enhances bone marrow angiogenesis, MM growth and osteolytic bone disease [9,10,11]. Heparanase leads to structural modifications of syndecan-1 resulting in syndecan-1 shedding from the myeloma cell surface [12,13,14]. High levels of shed syndecan-1 are correlated with poor prognosis and overall survival of MM patients [12,13,14]. Moreover, heparanase-dependent activation of the ERK and p38 signaling pathways is associated with myeloma progression [13,15]. In addition, heparanase is an important factor in the biogenesis and functioning of exosomes, which influence the control of cell behavior in the myeloma microenvironment and distal sites [16,17]. Nuclear heparanase enhances chromatin remodeling, stimulates gene transcription involved in MM progression, and blocks the tumor suppressor function of PTEN [18].
The HPSE2 gene encodes a close heparanase homolog, named heparanase-2 (Hpa2) [19]. Unlike the intense research effort devoted to exploring the significance of heparanase (Hpa1) in human diseases, very little attention was given to heparanase-2 (Hpa2). Hpa2 gained attention when it was reported that the HPSE2 gene is mutated in a human disease called urofacial syndrome (UFS) [20,21]. UFS is a rare autosomal recessive congenital disease, featuring a combination of urological defects and an inverted facial expression attributed to peripheral neuropathy [22]. Hpa2 lacks intrinsic heparan sulfate (HS)-degrading activity, binds heparin/HS with high affinity, and thereby competes for HS binding and inhibits heparanase enzymatic activity [23]. Co-immunoprecipitation revealed a physical association between the two proteins [23]. The role of Hpa2 in the development of cancer is not well understood. However, heparanase-2 inhibits heparanase enzymatic activity [23] and appears to function as a tumor suppressor [19,24,25,26,27,28,29]. The role of heparanase-2 in multiple myeloma has not been elucidated.
Previously, several functional single nucleotide polymorphisms (SNPs) located in the enhancer and insulator of the HPSE gene have been identified [30,31], the most prominent of which are rs4693608 (enhancer) and rs4364254 (insulator) SNPs [30,31]. Combinations of rs4693608 and rs4364254 SNPs are significantly associated with high (HR), intermediate (MR) and low (LR) HPSE gene levels in normal leukocytes and mononuclear cells (MNCs) in both peripheral and umbilical cord blood [32,33]. The HR group includes all individuals with the rs4693608 AA genotype. The MR group consists of carriers AG-TT and AG-TC genotypes, and the LR group includes the genotypes GG-TT, GG-TC, GG-CC, and AG-CC. Moreover, a highly significant association was found between rs4693608 and the risk of acute and extensive chronic graft versus host disease (GVHD) after allogeneic stem cell transplantation (HSCT). Importantly, the discrepancy between the recipient and donor in these SNPs significantly affects the risk of acute GVHD [33,34]. Notably, the enhancer rs4693084 SNP and insulator rs28649799 SNP were shown to be associated with the yield of G-CSF-mediated CD34+ cell mobilization in normal donors [31,35]. In addition, rs4426765 is associated with heparanase gene expression in activated MNCs, as well as CD3 cell number and lymphocyte count in response to G-CSF-induced cell mobilization [31].
In the present study, the functional SNPs of the HPSE and HPSE2 genes were analyzed. For the first time, 11 SNPs of HPSE2 were examined. Our results show a very significant association between two enhancer (rs4693608 and rs4693084), and two insulator (rs4364254 and rs4426765) HPSE SNPs and primary paraskeletal disease (PS). SNPs rs4693608 and rs4364254 exhibited the most significant results. The frequencies of the LR genotype, previously shown to be associated with a low level of HPSE expression and a low risk of developing acute GVHD [32,33,34], were significantly higher in the group with total and paraskeletal disease compared with control patients. Significant correlations were found with rs4693608, rs4693084, and rs4426765 SNPs and multiple myeloma stage at diagnosis. SNP rs657442, located in intron 9 of the HPSE2 gene, revealed a significant protective association with primary PS disease and lytic bone lesions. The impact of rs658225 and rs754585 HPSE2 gene SNPs was noted in secondary extramedullary disease.
The present study demonstrates the promoting (HPSE) and protective (HPSE2) role of regulatory gene elements in the development of paraskeletal disease and bone morbidity. We suggest that signal discrepancy between malignant myeloma cells and normal cells of the microenvironment provides a possible mechanism for the involvement of heparanase in primary EMD.

2. Materials and Methods

2.1. Study Population
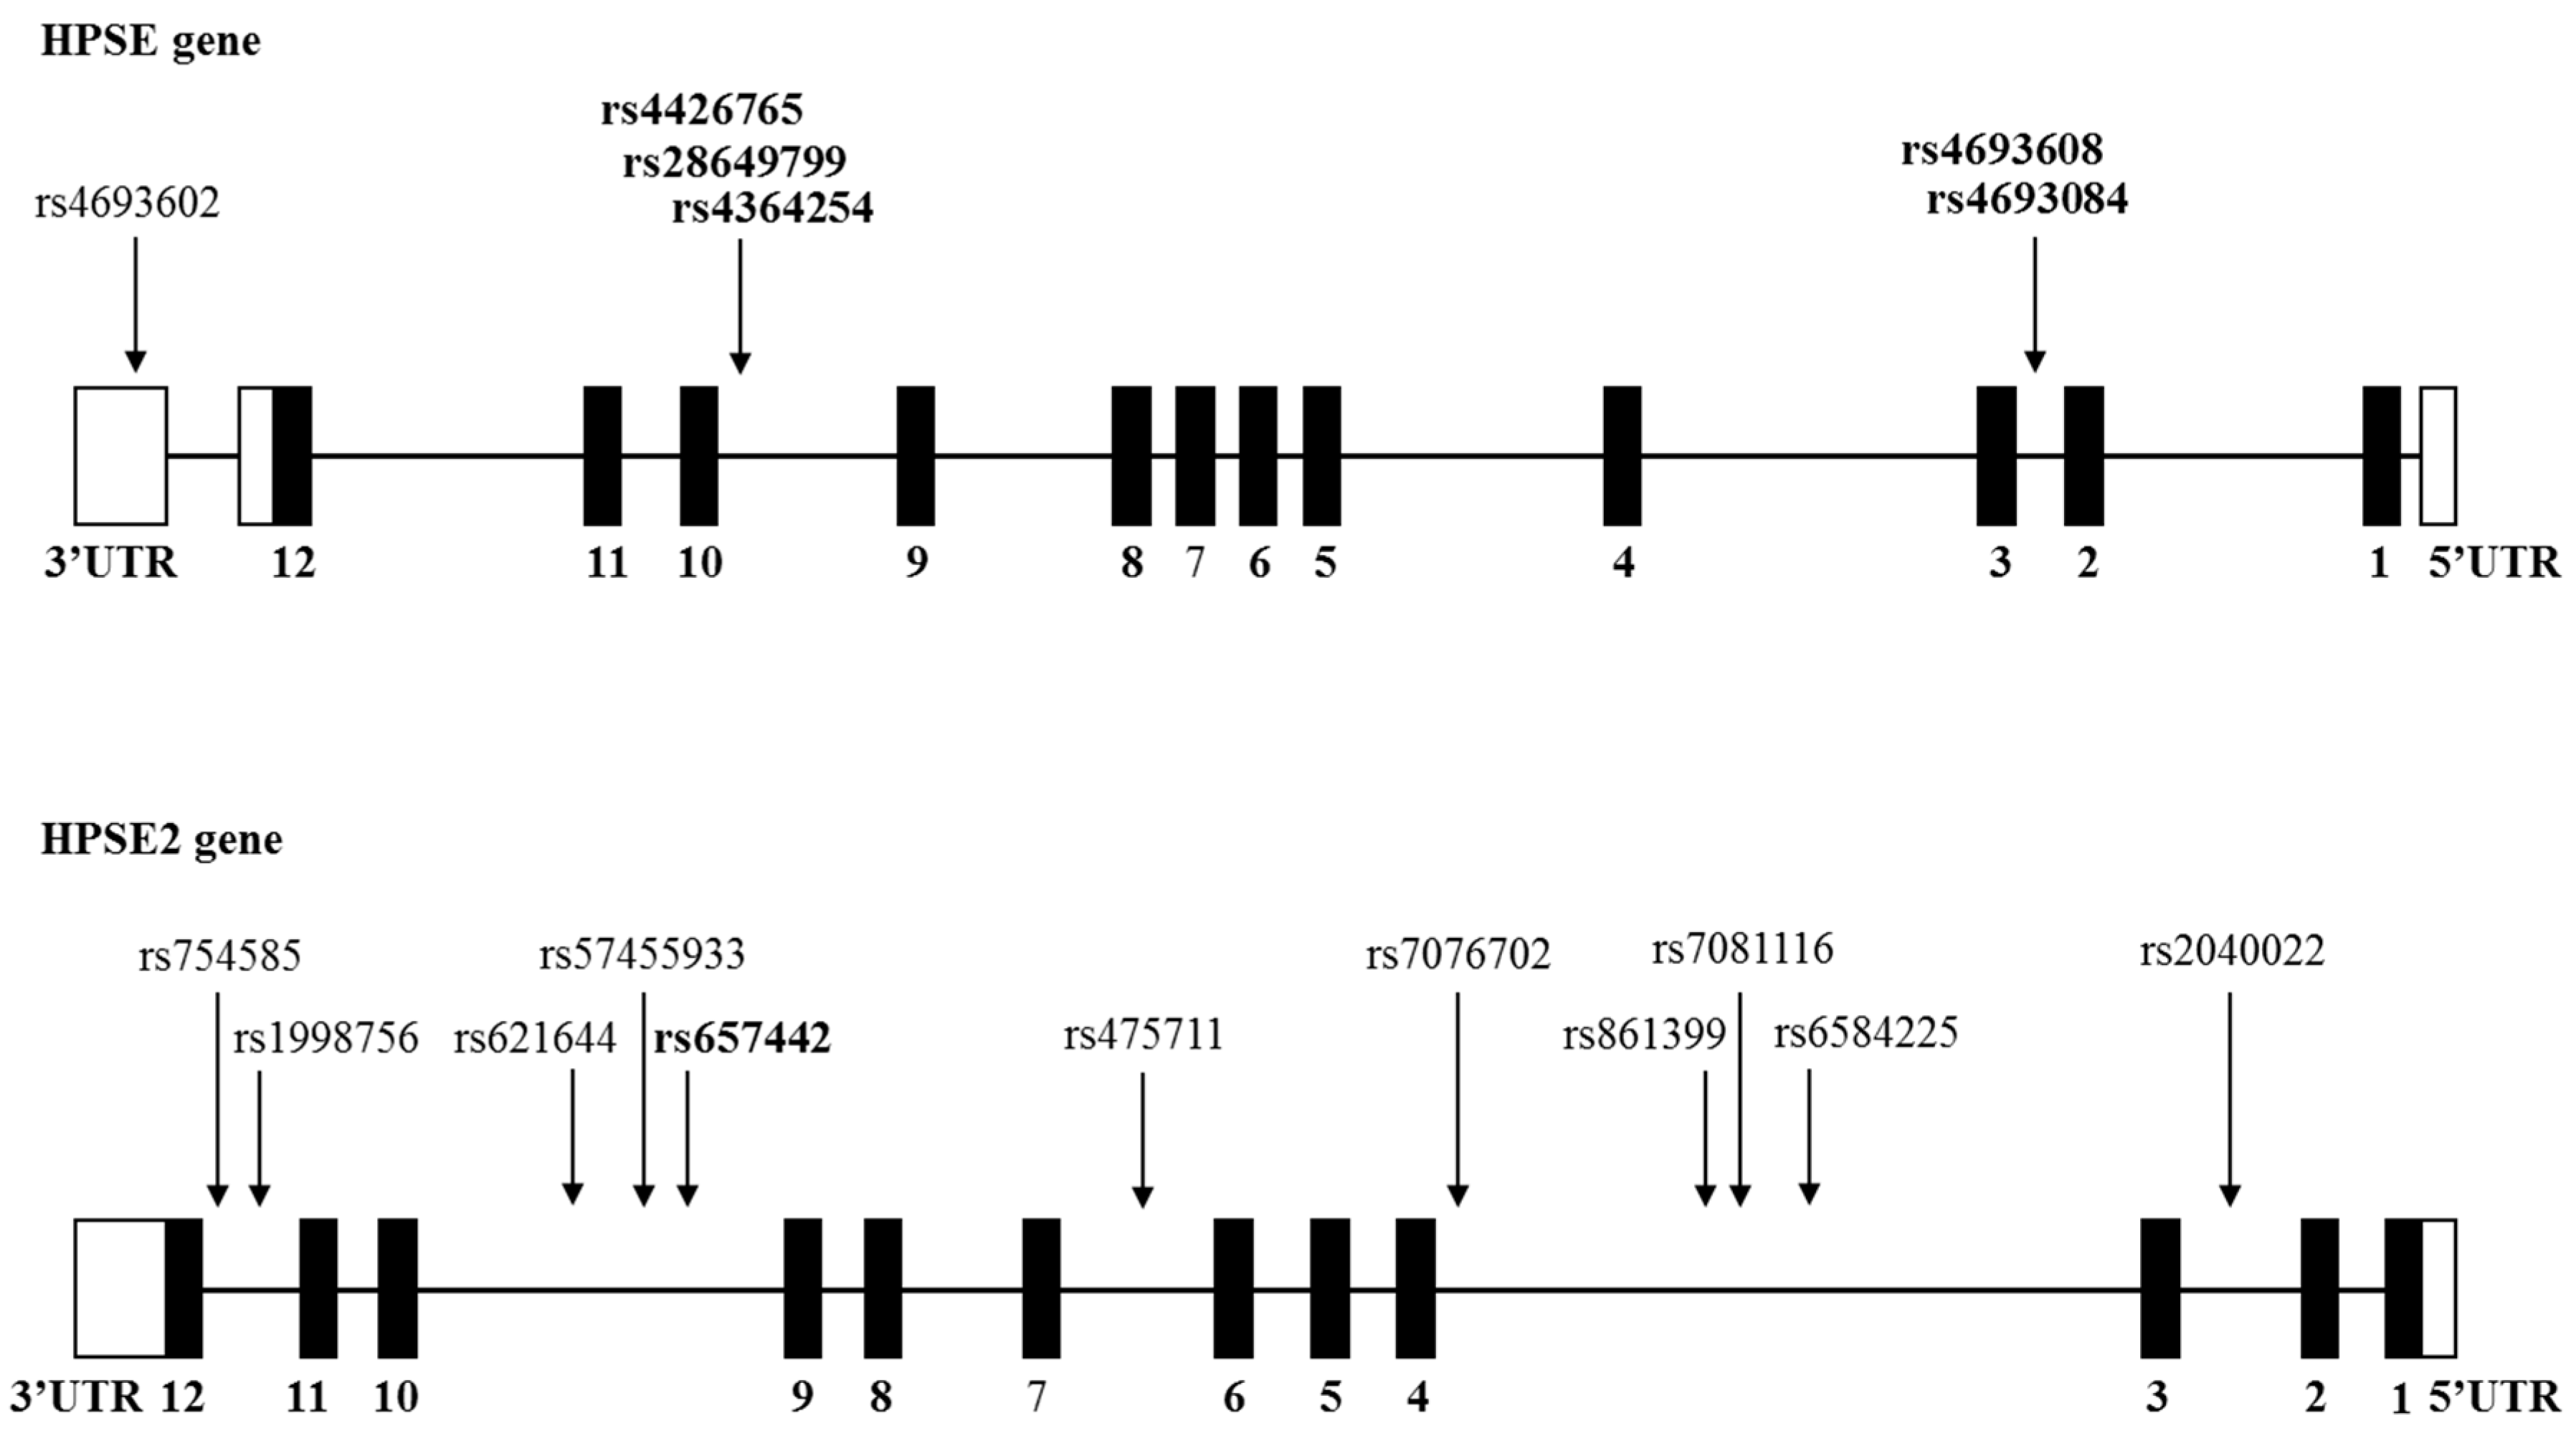
Two hundred and seventy eight patients were included in the study. Nineteen patients were diagnosed with monoclonal gammopathy (MGUS) and 28 with smoldering multiple myeloma (SMM). Six patients with MGUS and 4 with SMM progressed to active multiple myeloma (MM). Clinical and disease characteristics, including disease stage by the International Staging System (ISS), bone involvement, renal failure, extramedullary disease, beta-2-microglobulin, creatinine, albumin, calcium, and hemoglobin levels were collected from medical records. The definition of renal failure is based on an estimated glomerular filtration rate (eGFR) or creatinine clearance (CrCl) of 29–15 mL/min/1.73 m2. Patient characteristics are presented in Table 1. The study was approved by the Sheba Medical Center Ethics Committee and the Israeli Ministry of Health (#4247) and all subjects gave their written informed consent.

2.2. SNPs Analysis

Genomic DNA was extracted from peripheral blood applying the Wizard® Genomic DNA Purification kit (Promega, Madison, WI, USA). Functional SNPs of the HPSE and HPSE2 genes were genotyped using Real-Time SNP Assay (Bio Search Technologies, Novato, CA, USA) and TaqMan SNP Genotyping Assay (Thermo Fisher Scientific, Pleasanton, CA, USA). PCR reactions were performed using an ABI PRISM 7700 sequence detector (Applied Biosystems, Warrington, UK) according to the manufacturer’s instructions (Quanta, Gaithersburg, MD, USA).

2.3. DNA Constructs

A fragment of the HPSE gene enhancer (440 bp), located in intron 2 and including rs4693083, rs4693608, rs4693084 and rs4693609 SNPs, was cloned via PCR using PCR II-TOPO vector (Invitrogen by Life Technologies, Carlsbad, CA), as previously described in detail [30]. The multiple myeloma cell line RPMI-8226, isolated from a patient with plasmacytoma, was seeded into six-well culture dishes according to Lonza instructions (AMAXA biosystems, Lonza, Germany). Cells were transfected with 2 µg of each DNA construct using the Ingenio Electroporation Kit (Mirus Bio, Madison, WI, USA) and NucleofectorTM (AMAXA biosystems, Lonza, Germany). Twenty-four hours after electroporation, the cells proceeded to RNA analysis.

2.4. Purification of Total RNA, Generation of cDNA, and Real-Time Quantitative RT-PCR

Total RNA was obtained from RPMI-8226 cell line using the TRIzol reagent (Invitrogen, Carlsbad, CA, USA) according to the manufacturer’s instructions. Complementary DNA (cDNA) was synthesized using 1µg total RNA applying the qScript cDNA Synthesis kit (Quanta, Gaithersburg, MD, USA). PerfeCTa SYBR Green Fast Mix ROX (Quanta, Gaithersburg, MD, USA) Real-time PCR reactions to amplify the HPSE and HPSE2 genes and the RPL-19 housekeeping gene were performed using an ABI PRISM 7700 sequence detector (Applied Biosystems, Warrington, UK) in a total volume of 20 µL. The primer sequences for HPSE and RPL-19 genes were previously published [36]. HPSE2 expression was determined using primers 5’CAGGGCATTGATGTCGTGATAC3’ and 5’GCCAGTAGTCTGGTAATGGGTTA3’. The experiments were performed in triplicates and a standard curve was created. A dissociation curve was generated after each experiment to confirm that one product was amplified. Comparative CT method (∆∆CT) was used to quantify HPSE and HPSE2 gene expression, and relative quantification (RQ) was calculated as 2−∆∆CT.

2.5. Statistical Analysis

All calculations were performed using the NCSS software (NCSS, Kaysville, Utah, USA). A p-value ≤ 0.05 was considered statistically significant. Genotype and allele frequencies of the SNPs were calculated by direct counting. Possible differences between samples in the frequency of each SNP genotype or allele were assessed using the χ2 test. The Yates correction was used when analyzing the interaction of two or more SNPs. Due to the low frequency of allele A of SNP rs657422, association analysis was carried out using Fisher’s exact test.

3. Results

3.1. Analysis of HPSE and HPSE2 Gene SNPs among Multiple Myeloma Patients

The retrospective study included 278 multiple myeloma patients (174 males and 104 females) and 211 controls. Two hundred and thirty one patients were diagnosed with multiple myeloma, 28 with SMM and 19 with MGUS. The median age was 60 years (range 27–90). All statistical analyzes, except for association with the patient’s diagnosis (MM, SMM and MGUS), were performed in 259 patients who developed active MM. Patient characteristics are presented in Table 1. Six HPSE gene SNPs were used in the case vs control analyses. Two functional SNPs rs4693608 and rs4693084 are located in the HPSE gene enhancer, three functional SNPs (rs4426765, rs28649799 and rs4364254) are mapped in the HPSE gene insulator, and rs4693602 is situated in the 3’UTR (Figure 1). SNPs of the HPSE2 gene were analyzed for the first time. Eleven SNPs that could potentially be functional polymorphisms or be associated with functional SNPs were selected (Figure 1). A correlation analysis was performed between the HPSE and HPSE2 SNPs and the patient’s diagnosis (MM, SMM, and MGUS). The frequency of the TT genotype (rs4364254) was slightly higher in patients with MM compared to the control group of healthy individuals, but statistical analysis showed only a trend toward correlation (Supplementary Table S1). No associations were observed for rs4364254 allele frequencies (Supplementary Table S1). In addition, no correlations were found between the HPSE2 gene SNPs and the patient’s diagnosis.

3.2. Association between HPSE Gene SNPs and Stage of Multiple Myeloma Patients at Diagnosis

The influence of HPSE and HPSE2 SNPs on the stage of multiple myeloma at diagnosis was analyzed in 151 patients. The stage was determined according to the ISS [37]. Stage I was diagnosed in 25% of patients, stage II in 43.7%, and stage III in 30.5%. The association between HPSE gene SNPs and MM staging is shown in Table 2. Significant correlations were found with enhancer rs4693608 and rs4693084 SNPs and insulator rs4426765 SNP. The most significant results were obtained in comparing stage I and stage II/ III. The frequencies of the AA genotype were higher in patients diagnosed with stage II and III (15.4% in stage I vs. 40.9% and 32.6% in stages II and III, respectively). The frequencies of the GG genotype were higher in patients diagnosed with stage I vs II and III (25.6% at stage I vs. 12% and 15.2% at stages II and III, respectively). The p-value for genotype frequency was p = 0.022 and the p-value for allele frequency was p = 0.0082 (Table 2). No correlations with HPSE2 gene SNPs were found.

3.3. Association between HPSE Gene SNPs and Primary Bone-Related Disease in Multiple Myeloma

Fifty patients with primary extramedullary disease were identified. Forty-one of 50 were diagnosed with paraskeletal disease, one with EMD from hematogenous spread and two had both bone-depended and bone-independent EMD. One patient was diagnosed with solitary plasmacytoma, and five developed plasma cell leukemia.
Analysis of the correlation between functional SNPs of the HPSE gene is presented in Table 3. Calculations were performed for all individuals diagnosed with any type of EMD and separately for patients who developed paraskeletal disease. Four functional SNPs revealed highly significant associations (Table 3). The frequency of the GG genotype and the G allele of rs4693608 SNP was higher in patients with EMD compared to the control group (32% versus 13% for the GG genotype, 18% versus 36.4% for the AA genotype, p = 0.003, and 57% versus 38.3%, p = 0.001 for the G allele, respectively, Table 3). Similar results were obtained for paraskeletal disease (p = 0.018 for genotype comparison and p = 0.006 for allele comparison) (Table 3). All three insulator SNPs were associated with EMD, rs4364254 being the most prominent SNP (Table 3). The frequency of the CC genotype and the C allele of rs4364254 SNP was higher in patients with primary total EMD and patients with paraskeletal disease (20% versus 8.6%, p = 0.003 for the CC genotype; 43% versus 24.4%, p = 0.00032 for allele C in total EMD; 18.6% versus 8.6%, p = 0.019 for genotype CC; and 40.7% versus 24.4%, p = 0.003 for allele C in paraskeletal disease, respectively, Table 3).
In our previous studies, we investigated the interaction between enhancer and insulator HPSE gene SNPs [31,32,34]. We allocated all possible HPSE genotype combinations into three groups (HR, MR, and LR) correlating with high, intermediate and low heparanase mRNA expression levels and with high, intermediate and low risk of acute GVHD, respectively [31,32,34]. Given the results presented in Table 3, we can conclude that rs4693608 and rs4364254 exhibited the most significant association with EMD. Therefore, correlations were analyzed in HR (genotypes AA-TT and AA-TC), MR (genotypes AG-TT and AG-TC), and LR (genotypes GG-TT, GG-TC, GG-CC and AG-CC) groups. Frequency of the LR genotype was significantly higher in patients with total and paraskeletal disease compared with patients without EMD disease (44% for total EMD and 41.9% for paraskeletal disease versus 16.1% in the other patients, χ2 = 16.036, p = 0.00033 for total EMD and χ2 = 14.32, p = 0.002 for paraskeletal disease after Yates’ correction) (Table 3).

3.4. Association between HPSE2 Gene SNPs and Primary Extramedullary Disease (EMD) in Multiple Myeloma

Eleven HPSE2 SNPs were analyzed. Only one SNP, rs657442, located in intron 9, demonstrated a significant correlation with primary EMD (Table 4). Of note, all patients (100%) diagnosed with EMD were carriers of the CC genotype, while in the control group, only 86.4% were carriers of this genotype (p = 0.0065 for total EMD and p = 0.011 for paraskeletal disease). The A allele frequency was 7.1% in the control group and null in the EMD group (p = 0.038 for total EMD and p = 0.0066 for paraskeletal disease, Table 4).
The interactions between HPSE genotypes and the significant HPSE2 SNP rs657442 are presented in Table 5. A protective effect of the A allele was observed. Five patients with the LR genotype, identified in association with the risk of EMD, were carriers of the A allele for SNP rs657442 and had neither primary nor secondary EMD (Table 5). Primary EMD was not observed in 8 carriers of the A allele and MR genotype. Three of them developed secondary EMD, one with hematogenous spread and two with paraskeletal disease. The frequency of the A allele is low, and there are many variations with null frequencies (Table 5). Therefore, the impact of HPSE-HPSE2 gene interaction was assessed by allocation of all possible variants into three groups with high-, intermediate- and low-risk. In group A, we hypothesized that the protective effect of the A allele could downgrade the risk of developing EMD from high to intermediate, and from intermediate to low. Therefore, group A1 included the HR-CC, HR-CA, HR-AA, and MR-CA genotypes. The LR-CA variant was added to group A2. Since we could not assess the magnitude of the A allele-mediated protective effect against EMD in group B, we assumed that the protective effect was high in all subjects with the A allele. As a result, the LR-CA and MR-CA genotypes were included in group B1. Chi-square analysis was performed for both groups, and after Yates’ correction, the summarized effect was found to be highly significant compared to the p-values for each SNP alone (p = 0.000015 for group A and p = 0.0000098 for group B) (Table 5).

3.5. Association between HPSE2 Gene SNPs and Secondary Extramedullary Disease (EMD) in Multiple Myeloma

Thirty-eight patients developed secondary EMD. Seven of them had soft-tissue plasmacytomas with hematogenous spread, 27 had bone-related EMD, and 4 had both types of EMD. No correlation with HPSE gene SNPs was observed. Analysis of the association between HPSE2 gene SNPs and secondary EMD is shown in Table 6. Some associations were identified with rs658225 (intron 3), rs621644 (intron 9), and rs754585 (intron 11) (Figure 1 and Table 6). Notably, the G allele of rs658225 SNP exhibited a protective effect. The G allele frequency in the control group (18%) was higher compared to patients with secondary EMD (8.1%) (p = 0.03, Table 6). In addition, the TT genotype of rs754585 SNP disclosed a protective effect (33.3% in the control group vs. 13.5% in the secondary EMD group, p = 0.027). However, the frequency of the CC genotype was the same in both groups (Table 6). An opposite effect was observed in heterozygous individuals (64.9% in the secondary EMD group vs. 41.7% in the control group).
The interaction between these SNPs was assessed (Table 7). Since the number of patients with secondary EMD was relatively small, the analysis was carried out not only in the group of secondary EMD but also for all patients who revealed EMD. The same trend was observed both in total and secondary EMD compared with the control group. The protective effect of the G allele was manifested in the possessors of the AG genotype for rs658225 (Table 7).
The influence of SNP rs754585 was demonstrated in carriers of the AA genotype. The risk of secondary EMD in patients with the AA-TT genotype was low compared with the control group (10.5% vs. 22.5%), while in individuals with the AA-CT genotype the risk of secondary EMD was higher (52.6% in the secondary EMD group vs. 23.3% in the control group). No differences were found among AA-CC carriers. Due to the small number of individuals with the AG-TT genotype, it was impossible to confirm an addictive apologetic effect of rs658225 and rs754585 HPSE2 SNPs (Table 7). Additional studies are needed in a larger cohort of patients with EMD.

3.6. Association between HPSE2 Gene SNPs and Bone Morbidity in Multiple Myeloma Patients

One hundred and fifty-eight multiple myeloma patients (74.9%) exhibited one or more osteolytic bone lesions, while 53 patients (25.1%) had no lytic bone disease. Analysis of the functional HPSE gene SNPs did not reveal a correlation with bone involvement. Eleven SNPs of the HPSE2 gene were genotyped among patients with multiple myeloma. A highly significant correlation with bone morbidity was observed with rs657442 SNP (intron 9), a SNP with a relatively rare frequency of the A allele. Only one individual was genotyped as homozygous for the A allele. Therefore, the following comparison is related to the frequencies of the CA genotype and the A allele. Only 5.7% of patients with the CA genotype had bone involvement compared to 20.8% of patients who had no detectable bone disease (p = 0.001 for genotype frequency, and p = 0.00016 for allele frequency, Table 8). Collectively, HPSE2 gene SNP rs657442 revealed a protective effect.

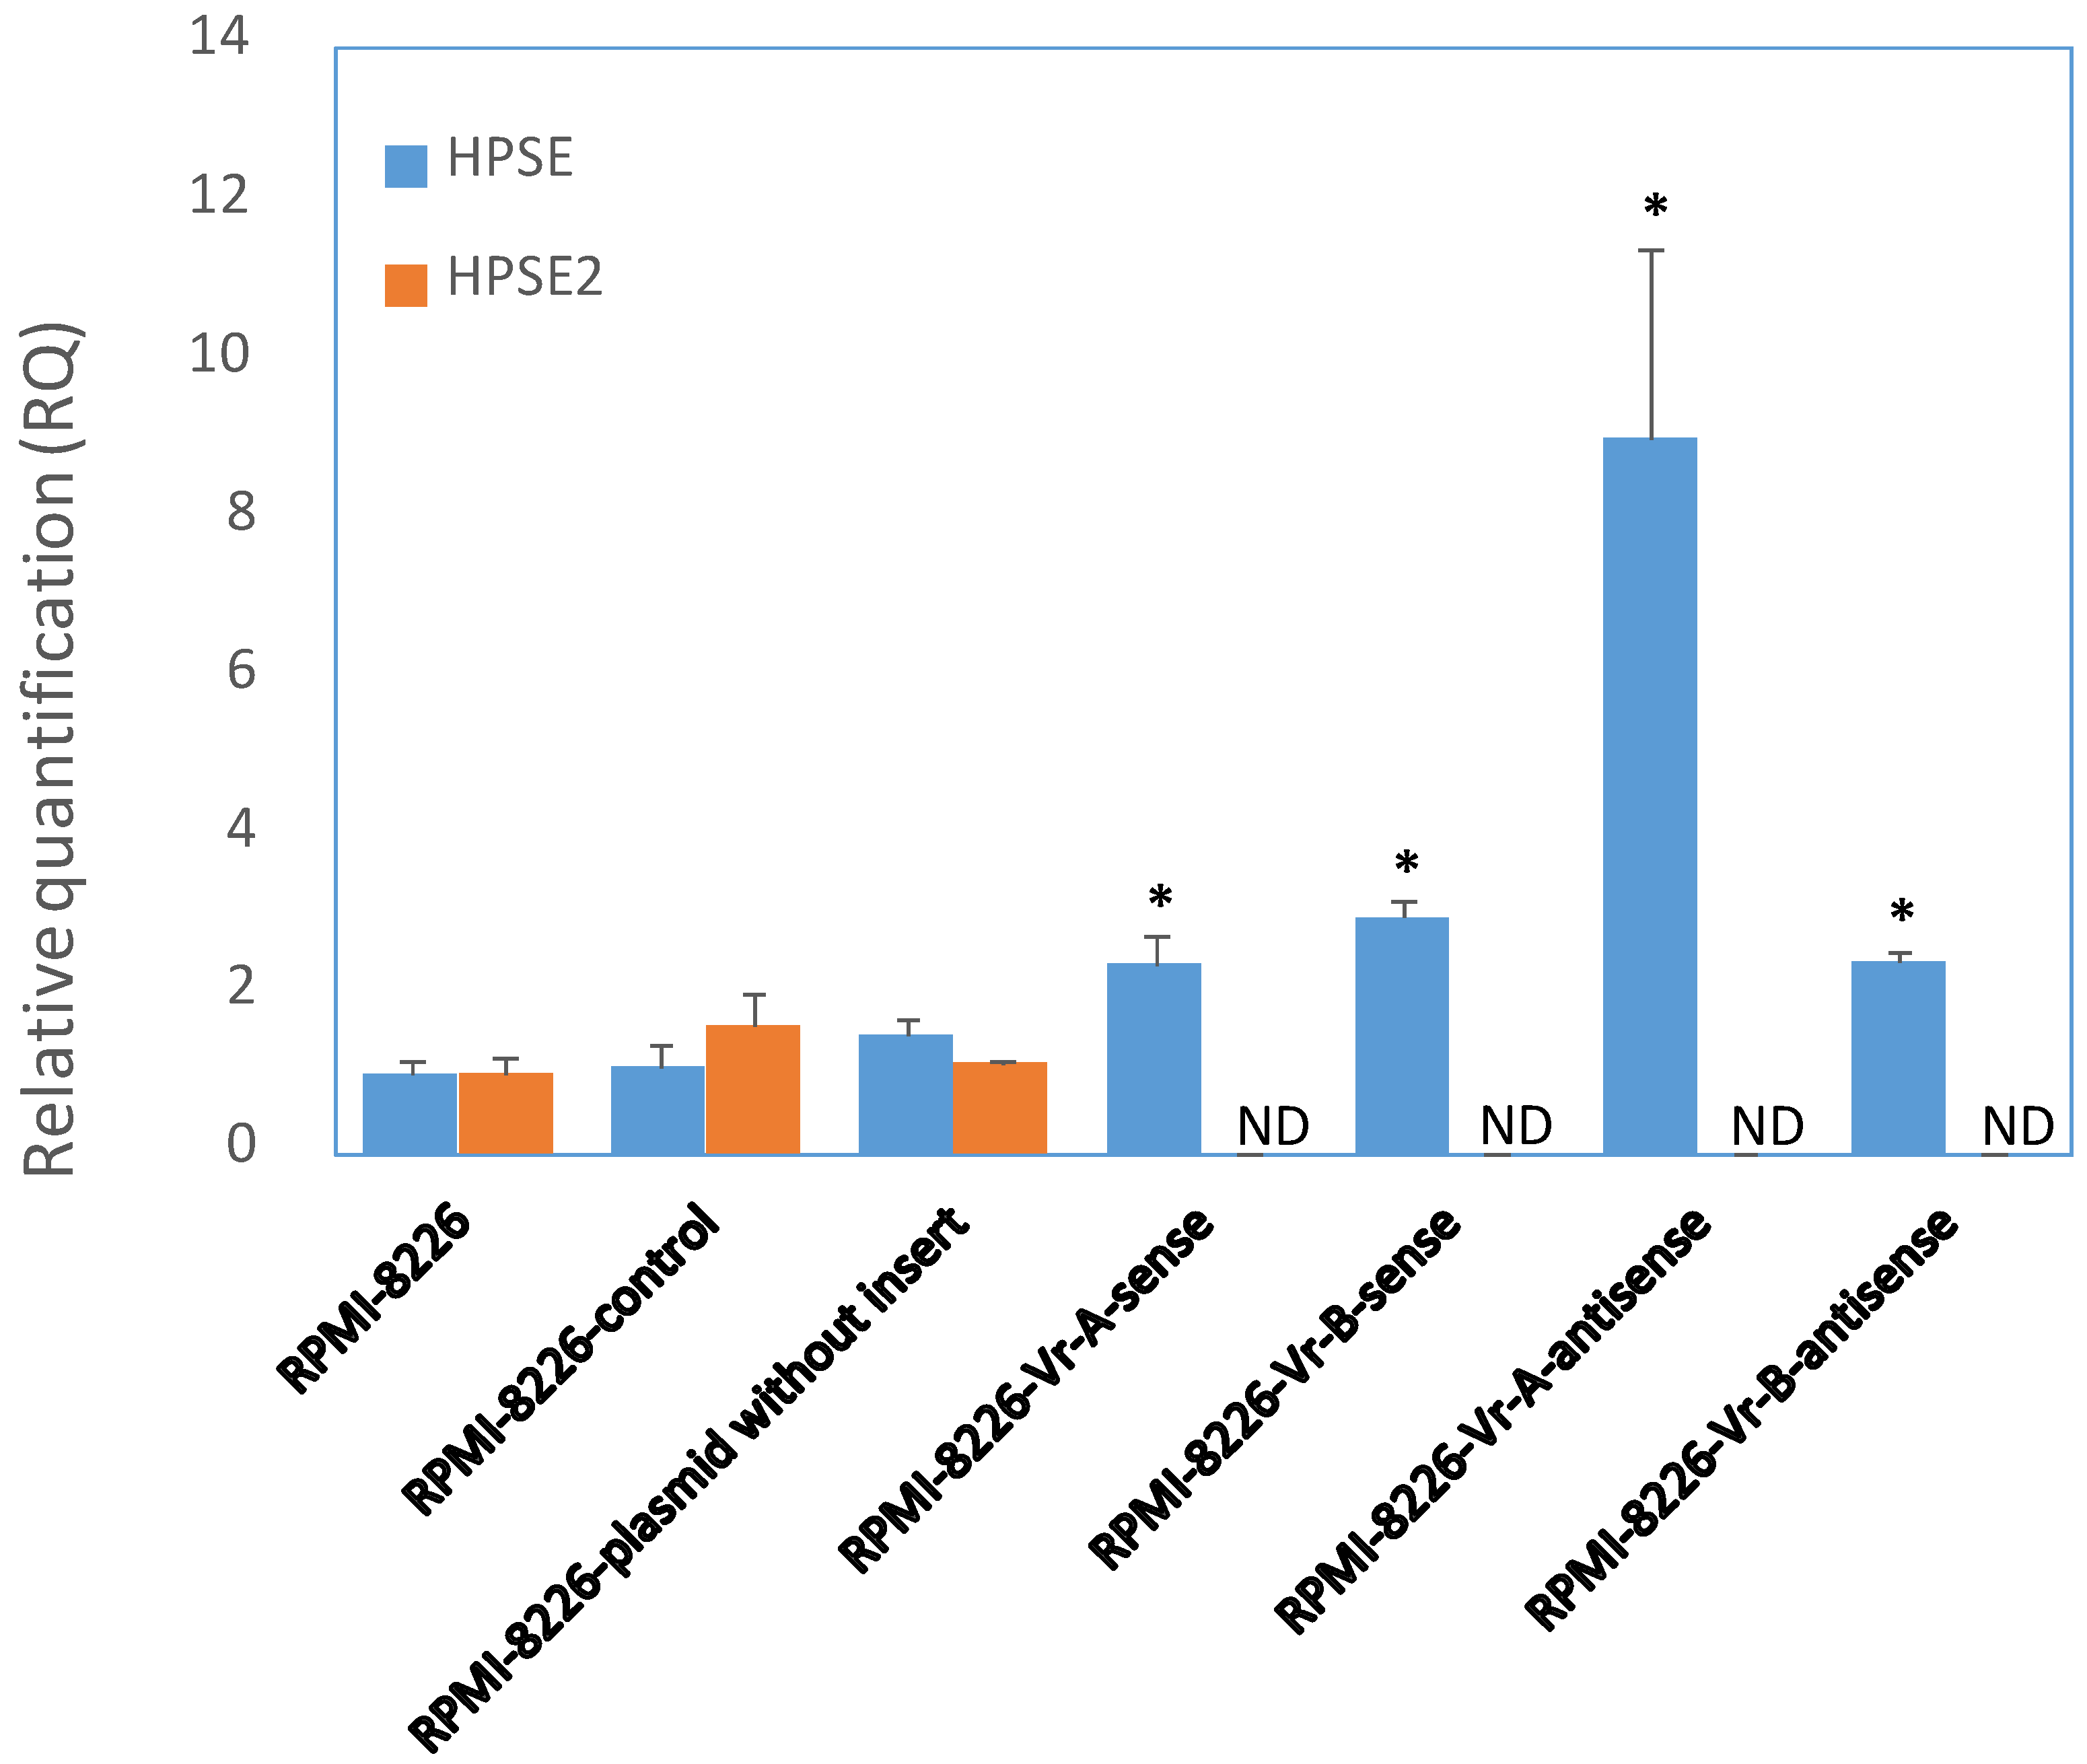
3.7. Modification of HPSE and HPSE2 Gene Expression after Transient Transfection of RPMI-8226 MM Cells with a Fragment of the Enhancer
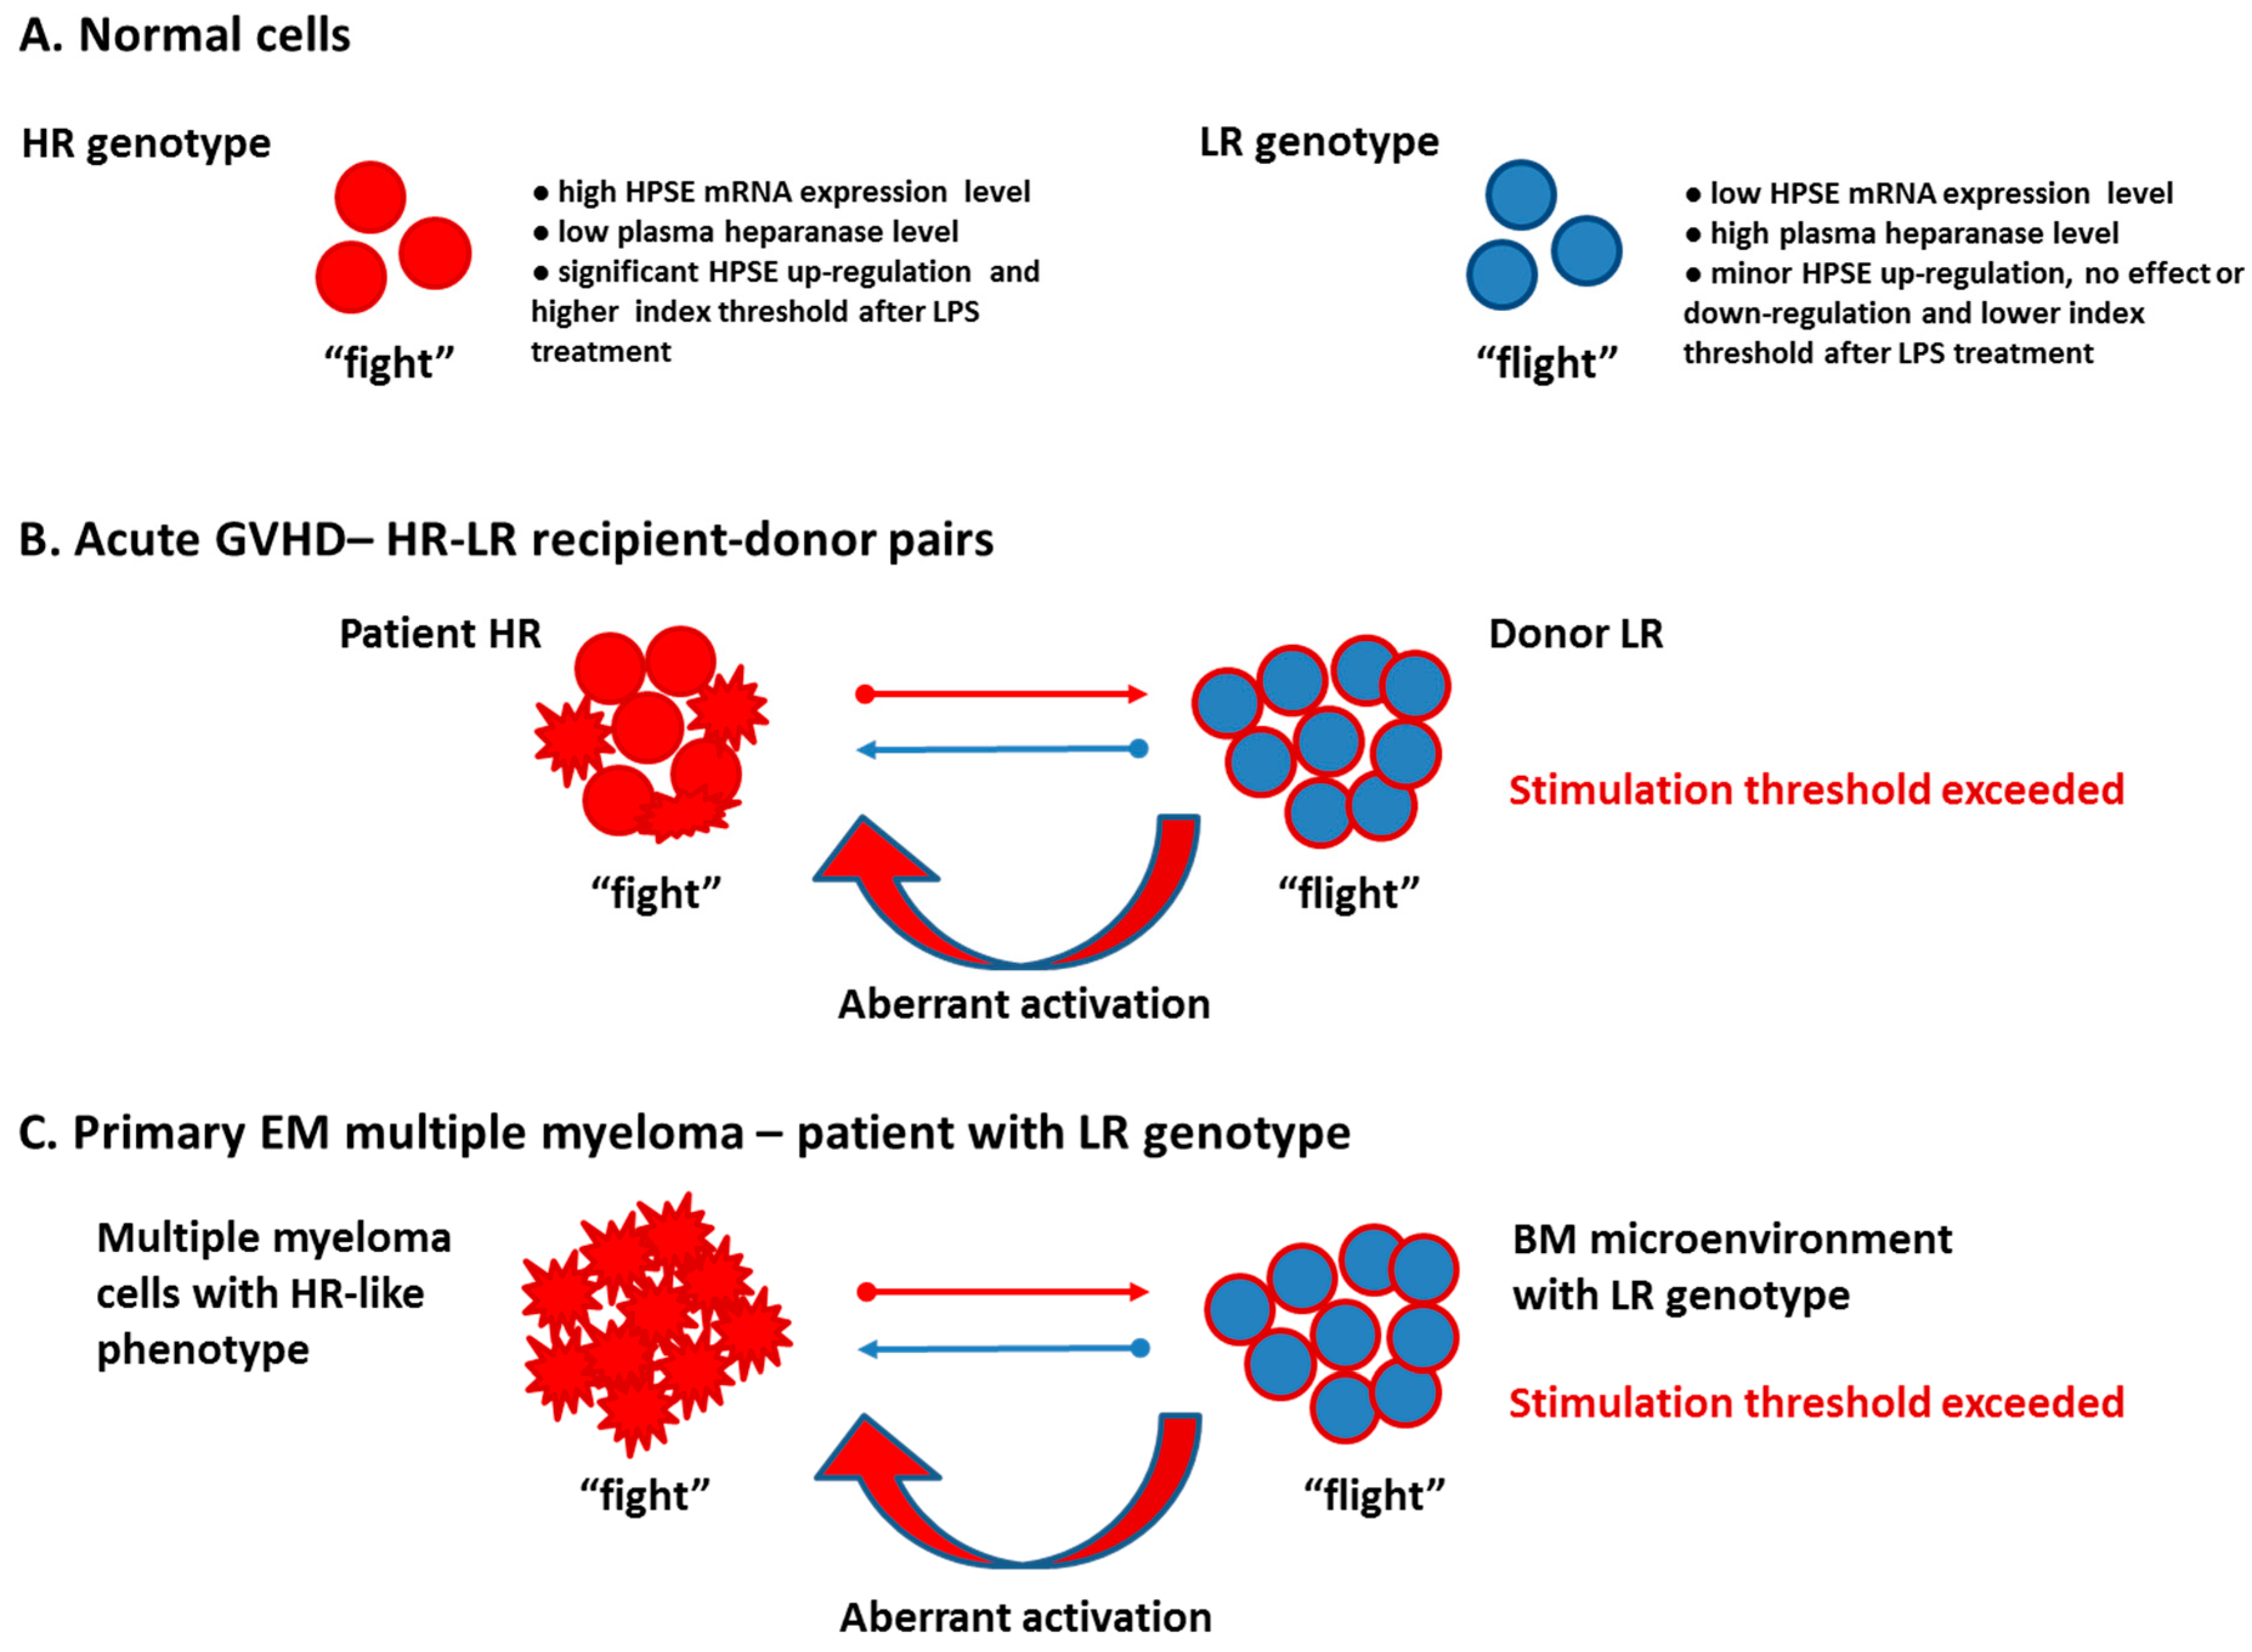
In a previously published study, we found an active HPSE enhancer in intron 2 of the HPSE gene [30]. To determine the functional effects of enhancer SNPs, we applied a luciferase reporter gene with a minimal promoter to measure enhancer activity. Briefly, RPMI-8226 cells were transiently transfected with DNA constructs in the sense and antisense directions or with an empty vector [30]. As an additional control, RPMI-8226 cells were subjected to an electric pulse. The HPSE gene enhancer fragment (440 bp) included rs4693083, rs4693608, rs4693084, and rs4693609 SNPs. We have previously reported [30] that the 440 bp fragment of the HPSE gene exhibits enhancer activity in both the sense and antisense directions. In the present study, we evaluated the effect of the enhancer fragment transfection on the expression of HPSE and HPSE2 and the results are presented in Figure 2. HPSE expression was increased in all the transfected samples, while the level of the HPSE gene remained unchanged in the control samples.
The expression level of the HPSE2 gene is low in most malignant cell lines [19,20,21,22,23,24,25,26,27,28,29]. Likewise, RMPI-8226 cells expressed a very low, but detectable level of HPSE2 and there was no effect to electrical pulse and transfection with an empty plasmid. Transfection of the HPSE enhancer fragment resulted in an undetectable level of HPSE2 expression (Figure 2), suggesting that the HPSE gene enhancer not only regulates HPSE gene expression but also has an opposite effect on the expression of the HPSE2 gene. The undetectable level of the HPSE2 gene makes it impossible to evaluate the role of specific HPSE enhancer functional SNPs in co-regulation of both genes.

4. Discussion

Association studies open up great prospects for elucidating the genetic basis of diseases. Moreover, functional SNP-based studies are effective because they focus on SNPs with the highest prior probability of being associated [38]. Functional SNPs located in regulatory elements, such as enhancers and insulators, help not only to indicate the involvement of a particular gene in the development of common diseases but also to explore the possible mechanisms of these enhancers or insulators in pathological processes [39,40]. Moreover, these regions can be used as targets for subsequent treatments [41].
In the present study, five previously identified and characterized functional HPSE gene SNPs were analyzed among patients with multiple myeloma. A highly significant association was found between the low-frequency alleles of rs4693608, rs4693084, rs4426765 and rs4364254 SNPs and an increased risk of primary paraskeletal disease. A previously published approach to studying the interaction between HPSE enhancer and insulator SNPs was applied [31,32,34]. The LR genotype, which correlates with low expression of the HPSE gene, was found to be associated with primary EMD.
Heparanase-2 appears to function as a natural inhibitor of the heparanase enzyme and a tumor suppressor [19,24,42]. While heparanase enhances the pathogenesis of cancer, heparanase-2 plays a protective role. It appears that the heparanase/Hpa2 ratio impacts tissue hemostasis [43,44] and the balance between cancer progression and suppression [19,24,42].
The present study aimed to identify and characterize possible functional SNPs located in the HPSE2 gene. Importantly, the rs657442 SNP, genotyped at intron 9, showed a protective effect on primary paraskeletal disease and bone-related morbidity. According to the ENCODE Registry of candidate cis-Regulatory Elements (cCREs), rs657442 SNP is located in a region with a distal enhancer-like signature (https://genome.ucsc.edu/cgi-bin/hgTracks?db=hg38&lastVirtModeType=default&lastVirtModeExtraState=&virtModeType=default&virtMode=0&nonVirtPosition=&position=chr10%3A98567418%2D98567918&hgsid=1502432943_OAIfBAS927s66nGeaamrwOHsFwZi, accessed on 20 May 2020). Additional three HPSE2 SNPs (rs658225, rs621644 and rs754585) revealed some correlation with secondary EMD. The rs658225 polymorphism was mapped to intron 3 and, according to the ENCODE Registry, is localized to the CTCF-related insulator (https://genome.ucsc.edu/cgi-bin/hgTracks?db=hg38&lastVirtModeType=default&lastVirtModeExtraState=&virtModeType=default&virtMode=0&nonVirtPosition=&position=chr18%3A43420931%2D43421131&hgsid=1502451125_iiE7HfeK7puYOrj2ozO3noTl2oPi, accessed on 20 May 2020). Intron 3 of the HPSE2 gene is a large intron that contains two pseudogenes and a gene encoding for MIR6507. It can be assumed that SNPs located in intron 3 may play an important role in the regulation of HPSE2 and other processes associated with MIR6507, and the RPL7P36 and ARL5AP2 pseudogenes. The rs624644 SNP has also been mapped to a region with a distal enhancer-like signature and could potentially be functional. SNP rs754585 was found to be in complete linkage disequilibrium with many polymorphic SNPs that are located in the 3’UTR region that can influence the expression and function of the HPSE2 gene.
Heparanase is one of the main regulators of aggressive tumor behavior [7]. It drives angiogenesis, tumor growth, and metastasis [9,10,14,45,46,47,48]. Soluble heparanase is detected in the bone marrow of patients with myeloma associated with a high microvessel density [9]. Our results indicate that patients with genotypes AA-AA and AG-AC (rs4693608-rs4426765) had an increased risk of being diagnosed with stage II and III of the disease. Our previous studies revealed that the A allele is associated with higher heparanase levels in healthy individuals [32,33] and a higher risk of developing GVHD [34]. Andersen et al. identified a significant correlation between the A allele of rs4693608 and the risk of vertebral fractures at diagnosis [49]. Taken together, it is conceivable that the HPSE gene enhancer plays an important role in progression of the disease before diagnosis, and that the risk of multiple myeloma being diagnosed at later stages of the disease is higher in individuals with the AA genotype.
The interaction between myeloma cells and the bone marrow microenvironment promotes signaling cascades and activates chemotaxis and adhesion of myeloma cells to the bone marrow [50]. MM progression and extramedullary dissemination require continuous MM cell egress and spread into new extramedullary sites, regulated by dynamic changes in the expression of chemokine receptors and adhesion molecules. Thus, increased CXCR4/CXCL12 chemokine signaling in MM cells promotes epithelial to mesenchymal transition (EMT)-like phenotype with enhanced invasive properties [50,51,52,53,54]. Consequently, the CXCR4-mediated EMT-like program involves E-cadherin downregulation, resulting in decreased adhesion and enhanced egression of MM cells [54]. Furthermore, down-regulation of adhesion molecules (VLA-4, p-selectin, CD56, CD44), and membrane-embedded tetraspanins as well as up-regulation of heparanase are part of the mechanism regulating extramedullary spread in MM [3,18,53].
Heparanase is a multitasking protein whose activation promotes, among other effects, the release of various cytokines, chemokines and growth factors in the tumor microenvironment [9,55,56]. Moreover, nuclear heparanase in activated human T-lymphocytes modifies the activity of inducible immune response genes by association with euchromatin and regulation of histone H3 methylation [57]. ChIP-on-chip data revealed that heparanase bound to regulatory regions of myeloma-related genes (i.e., CXCL12) [57], encodes for SDF-1, CXCR4, CXCL2, CXCR3, CCL27, CX3CL1, and LCN2 [58,59,60]. The HPSE2 gene is also on this list [57], indicating that the interaction between HPSE and HPSE2 may occur at both the gene and protein levels [23]. This was confirmed our results. Transfection of HPSE gene enhancer to myeloma cells resulted in increased expression of the HPSE gene and subsequent downregulation of the HPSE 2 gene.
Unexpectedly, the present results indicate that MM patients with the LR genotype disclosed an increased risk of developing primary paraskeletal disease. Studies performed over the past two decades have shown that heparanase plays a major role in modulating the bone marrow microenvironment to support the progression of multiple myeloma [6]. High heparanase activity in myeloma cells correlates with myeloma growth, bone marrow angiogenesis, and osteolytic bone disease [6,9,11,12]. Our previous results showed that transfection of the HPSE enhancer and insulator fragments into RPMI-8226 and CAG human myeloma cells led to the highest level of luciferase activity compared to other similarly transfected cell types [30,31]. Thus, one would expect that the risk of developing a more aggressive disease in patients with HR genotype would be higher in comparison to carriers of the LR genotype. Indeed, a significant correlation was found between the rs4693608 AA genotype, which constitutes the bulk of the HR genotype, and a more progressive disease (stages II and III) at the time of diagnosis.
To explain how the LR genotype increases the risk of paraskeletal disease, we propose the following mechanism, which is summarized in Figure 3. In our previous published studies [33,34], we found that the effect of a discrepancy between recipient and donor in HPSE gene SNPs leads to an increased risk of developing acute GVHD. The same effect was now observed in primary paraskeletal disease. To simplify, we adopt the concept of the “fight-or-flight” response to stress, first described by Walter Cannon [61]. Animals respond to stress with a set of predictable reactions known as “fight-or-flight” [62]. The function of the autonomic nervous system (ANS) in mediating the “fight-or-flight” response is well studied [63]. Briefly, the ANS is a major modulator of immune response and immune effector cells by activation of pro- and anti-inflammatory functions [64]. In the hematopoietic system, the ANS regulates stem cell niche homeostasis, and fine-tunes the inflammatory response [64]. Based on this approach, we named the HR genotype “fight” and the LR genotype “flight”. Our previous studies revealed that the HR genotype exhibited high HPSE mRNA expression, low plasma heparanase level, significant HPSE up-regulation, and most importantly, a higher index threshold after LPS treatment [32,33]. In contrast, the LR genotype disclosed low HPSE gene expression level, high plasma heparanase level, minor HPSE up-regulation, and no effect or downregulation of HPSE in response to LPS treatment [32,33]. A lower index threshold was observed (Figure 3A). Downstream heparanase signaling affects a variety of molecular mechanisms including transcription of immunologically related genes and miRNAs, and release of various cytokines, chemokines, and growth factors from the extracellular matrix [9,10,11,57]. Moreover, heparanase is an important modulator of exosome biogenesis via the syndecan-syntenin-ALIX pathway, affecting the level of exosomal cargo and the regulation of neurotransmission [65].
We suggest that the regulatory elements of the HPSE gene are involved in cell responsiveness to activating signals. After HSCT, engrafted donor cells (LR genotype), are exposed to the patient cells (HR genotype) and pro-inflammatory environment. When the stimulation threshold is exceeded, such donor cells with the LR “flight” genotype react with recipient cells harboring the HR “fight” genotype, resulting in aberrant activation and increased risk of developing acute GVHD increased (Figure 3B) [33,34].
We explain the identified risk of developing primary paraskeletal disease in patients with the LR genotype using a previously published discrepancy model [33,34]. Although aggressive myeloma cells exhibited the LR genotype, these cells have acquired a “fight” phenotype with high heparanase activity. In other words, while myeloma cells express HR-like phenotype, the normal microenvironment continues to express the LR genotype, leading to differences in signaling responses. When the signaling stimulation threshold is exceeded, aberrant activation of normal cells in the microenvironment results in bone cortex rupture and paraskeletal disease progression (Figure 3C). Previous studies have shown that heparanase expression by myeloma cells significantly increases local and systemic osteolysis [11]. In addition, heparanase can also alter the fate of osteoblast progenitor cells, directing cellular differentiation toward adipocytes rather than osteoblasts [66]. The effect of discrepancy in signaling between myeloma cells and the normal microenvironment, and the aberrant activity of cells in the bone marrow niche contribute to osteolysis, bone cortex distraction and various manifestation of bone-associated extramedullary disease.
The present study indicates the mutual role of HPSE and HPSE2 regulatory elements in the manifestation of multiple myeloma and proposes the use of heparanase 2-mimicking drugs for a most pronounced suppression of heparanase activity in multiple myeloma accompanied by EMD and osteolytic bone disease.

Supplementary Materials

The following supporting information can be downloaded at: https://www.mdpi.com/article/10.3390/cells12060913/s1, Table S1: Genotype and allele frequencies of the HPSE gene SNPs in multiple myeloma patients.

Author Contributions

Conceptualization, O.O.; Methodology, O.O.; Validation, O.O. and K.B.; Formal Analysis, O.O.; Investigation, O.O., Resources, H.M. and M.L.; Data Curation, O.O.; Writing—Original Draft Preparation, O.O.; Writing—Review & Editing, O.O., K.B., R.D.S., I.V. and A.N.; Supervision, I.V. and A.N.; Project Administration, O.O.; Funding Acquisition, A.N. and I.V. All authors have read and agreed to the published version of the manuscript.

Funding

We wish to thank the Naor family for a generous research grant memorizing their dear son-in-law, Mr. Guy Weinshtock, with “The Guy Weinshtock Multiple Myeloma Foundation”, in support of research in the field of MM at the Division of Hematology at the Chaim Sheba Medical Center, Tel Hashomer, Israel. We acknowledge the support of the US-Israel-Binational Science Foundation (BSF 2021059) awarded to Israel Vlodavsky (Technion) and Ralph D. Sanderson (UAB), and the DKFZ-MOST cooperation cancer research program.

Institutional Review Board Statement

The study was conducted according to the guidelines of Declaration of Helsinki, and approved by the Ethics Committee of the Sheba Medical Center and the Israeli Ministry of Health (#4247).

Informed Consent Statement

Informed consent was obtained from all subjects involved in the study.

Data Availability Statement

Not applicable.

Conflicts of Interest

The authors declare no conflict of interest.

References

  1. Cowan, A.J.; Green, D.J.; Kwok, M.; Lee, S.; Coffey, D.G.; Holmberg, L.A.; Tuazon, S.; Gopal, A.K.; Libby, E.N. Diagnosis and management of multiple myeloma: A review. JAMA 2022, 327, 464–477. [Google Scholar] [CrossRef]
  2. Rajkumar, S.V. Multiple myeloma: 2022 update on diagnosis, risk stratification, and management. AJH 2022, 97, 989–1107. [Google Scholar] [CrossRef]
  3. Blade, J.; Beksac, M.; Caers, J.; Jurczyszyn, A.; von Lilienfeld-Toal, M.; Moreau, P.; Rasche, L.; Rosinol, L.; Usmani, S.Z.; Zamagni, E.; et al. Extramedullary disease in multiple myeloma: A systematic literature review. Blood Cancer J. 2022, 12, 45. [Google Scholar] [CrossRef] [PubMed]
  4. Rosinol, L.; Beksac, M.; Zamagni, E.; Van de Donk, N.W.C.J.; Anderson, K.C.; Badros, A.; Caers, J.; Cavo, M.; Dimopoulos, M.-A.; Dispenzieri, A.; et al. Expert review on soft-tissue plasmacytomas in multiple myeloma: Definition, disease assessement and treatment considerations. Br. J. Haematol. 2021, 194, 496–507. [Google Scholar] [CrossRef]
  5. Rodriguez-Otero, P.; Paiva, B.; San-Miguel, J.F. Roadmap to cure multiple myeloma. Cancer Treat. Rev. 2021, 100, 102284. [Google Scholar] [CrossRef] [PubMed]
  6. Purushothaman, A.; Sanderson, R.D. Heparanase: A dynamic promoter of myeloma progression. Adv. Exp. Med. Biol. 2020, 1221, 331–349. [Google Scholar] [CrossRef] [PubMed]
  7. Ramani, V.C.; Vlodavsky, I.; Ng, M.; Zhang, Y.; Barbieri, P.; Noseda, A.; Sanderson, R.D. Chemotherapy induces expression and release of heparanase leading to changes associated with an aggressive tumor phenotype. Matrix Biol. 2016, 55, 22–34. [Google Scholar] [CrossRef]
  8. Ramani, V.C.; Zhan, F.; He, M.; Barbieri, P.; Noseda, A.; Tricot, G.; Sanderson, R.D. Targeting heparanase overcomes chemoresistance and diminishes relapse in myeloma. Oncotarget 2016, 7, 1598–1607. [Google Scholar] [CrossRef] [Green Version]
  9. Kelly, T.; Miao, H.Q.; Yang, Y.; Navarro, E.; Kussie, P.; Huang, Y.; MacLeod, V.; Casciano, J.; Joseph, L.; Zhan, F.; et al. High heparanase activity in multiple myeloma is associated with elevated microvessel density. Cancer Res. 2003, 63, 8749–8756. [Google Scholar]
  10. Barash, U.; Zohar, Y.; Wildbaum, G.; Beider, K.; Nagler, A.; Karin, N.; Ilan, N.; Vlodavsky, I. Heparanase enhancers myeloma progression via CXCL10 downregulation. Leukemia 2014, 28, 2178–2187. [Google Scholar] [CrossRef]
  11. Yang, Y.; Ren, Y.; Ramani, V.C.; Nan, L.; Suva, L.J.; Sanderson, R.D. Heparanase enhances local and systemic osteolysis in multiple myeloma by upregulating the expression and secretion of RANKL. Cancer Res. 2010, 70, 8329–8338. [Google Scholar] [CrossRef] [Green Version]
  12. Purushothaman, A.; Uyama, T.; Kobayashi, F.; Yamada, S.; Sugahara, K.; Rapraeger, A.C.; Sanderson, R.D. Heparanase-enhanced shedding of syndecan-1 by myeloma cells promotes endothelial invasion and angiogenesis. Blood 2010, 115, 2449–2457. [Google Scholar] [CrossRef] [Green Version]
  13. Ramani, V.C.; Purushothaman, A.; Stewart, M.D.; Thompson, C.A.; Vlodavsky, I.; Sanderson, R.D. The heparanase/syndecan-1 axis in cancer: Mechanisms and therapies. FEBS J. 2013, 280, 2294–2306. [Google Scholar] [CrossRef] [Green Version]
  14. Jung, O.; Trapp-Stamborski, V.; Purushothaman, A.; Jin, H.; Wang, H.; Sanderson, R.D.; Rapraeger, A.C. Heparanase-induced shedding of syndecan-1/CD138 in myeloma and endothelial cells activates VEGFR2 and an invasive phenotype: Prevention by novel synstatins. Oncogene 2016, 5, e202. [Google Scholar] [CrossRef] [Green Version]
  15. Vlodavsky, I.; Singh, P.; Boyango, I.; Gutter-Kapon, L.; Elkin, M.; Sanderson, R.D.; Ilan, N. Heparanase: From basic research to therapeutic applications in cancer and inflammation. Drug Resist. Updates 2016, 29, 54–75. [Google Scholar] [CrossRef] [PubMed] [Green Version]
  16. Thompson, C.A.; Purushothaman, A.; Ramani, V.C.; Vlodavsky, I.; Sanderson, R.D. Heparanase regulates secretion, composition, and function of tumor cell-derived exosomes. J. Biol. Chem. 2013, 288, 10093–10099. [Google Scholar] [CrossRef] [PubMed] [Green Version]
  17. Purushothaman, A.; Bandari, S.K.; Liu, J.; Mobley, J.A.; Brown, E.E.; Sanderson, R.D. Fibronectin on the surface of myeloma cell-derived exosomes mediates exosome-cell interactions. J. Biol. Chem. 2016, 291, 1652–1663. [Google Scholar] [CrossRef] [Green Version]
  18. Amin, R.; Tripathi, K.; Sanderson, R.D. Nuclear heparanase regulates chromatin remodeling, gene expression and PTEN tumor suppression function. Cells 2020, 9, 2038. [Google Scholar] [CrossRef] [PubMed]
  19. Vlodavsky, I.; Gross-Cohen, M.; Weissmann, M.; Ilan, N.; Sanderson, R.D. Opposing functions of heparanase-1 and heparanase-2 in cancer progression. Trends Biochem. Sci. 2018, 43, 18–31. [Google Scholar] [CrossRef]
  20. Daly, S.B.; Urquhart, J.E.; Hilton, E.; McKenzie, E.A.; Kammerer, R.A.; Lewis, M.; Kerr, B.; Stuart, H.; Donnai, D.; Long, D.A.; et al. Mutations in HPSE2 cause urofacial syndrome. Am. J. Hum. Genet. 2010, 86, 963–969. [Google Scholar] [CrossRef] [Green Version]
  21. Pang, J.; Zhang, S.; Yang, P.; Hawkins-Lee, B.; Zhong, J.; Zhang, Y.; Ochoa, B.; Agundez, J.A.G.; Voelckel, M.-A.; Fisher, R.B.; et al. Loss-of-function mutations in HPSE2 cause the autosomal recessive urofacial syndrome. Am. J. Hum. Genet. 2010, 86, 957–962. [Google Scholar] [CrossRef] [PubMed] [Green Version]
  22. Stuart, H.M.; Roberts, N.A.; Hilton, E.N.; McKenzie, E.A.; Daly, S.B.; Hadfield, K.D.; Rahal, J.S.; Gardiner, N.J.; Tanley, S.W.; Lewis, M.A.; et al. Urinary tract effects of HPSE2 mutations. J. Am. Soc. Nephrol. 2015, 26, 797–804. [Google Scholar] [CrossRef] [Green Version]
  23. Levy-Adam, F.; Cohen-Kaplan, V.; Shteingauz, A.; Gross, M.; Arvatz, G.; Naroditsky, I.; Ilan, N.; Doweck, I.; Vlodavsky, I. Heparanase-2 interacts with heparan sulfate with high affinity and inhibits heparanase activity. J. Biol. Chem. 2010, 285, 28010–28019. [Google Scholar] [CrossRef] [Green Version]
  24. Pinhal, M.A.S.; Melo, C.M.; Nader, H.B. The good and bad sides of heparanase-1 and heparanase-2. Adv. Exp. Med. Biol. 2020, 1221, 821–845. [Google Scholar] [CrossRef] [PubMed]
  25. Gross-Cohen, M.; Yanku, Y.; Kessler, O.; Barash, U.; Boyango, I.; Cid-Arregui, A.; Neufeld, G.; Ilan, N.; Vlodavsky, I. Heparanase 2 (Hpa2) attenuates tumor growth by inducing Sox2 expression. Matrix Biol. 2021, 99, 58–71. [Google Scholar] [CrossRef]
  26. Liu, J.; Knani, I.; Gross-Cohen, M.; Hu, J.; Wang, S.; Tang, L.; Ilan, N.; Yang, S.; Vlodavsky, I. Role of heparanase 2 (Hpa2) in gastric cancer. Neoplasia 2021, 23, 966–978. [Google Scholar] [CrossRef]
  27. Kayal, Y.; Singh, P.; Naroditsky, I.; Ilan, N.; Vlodavsky, I. Heparanase 2 (Hpa2) attenuates the growth of pancreatic carcinoma. Matrix Biol. 2021, 98, 21–31. [Google Scholar] [CrossRef]
  28. Knani, I.; Yanku, Y.; Gross-Cohen, M.; Ilan, N.; Vlodavsky, I. Heparanase 2 (Hpa2) attenuates the growth of human sarcoma. Matrix Biol. 2022, 113, 22–38. [Google Scholar] [CrossRef]
  29. Knani, I.; Singh, P.; Gross-Cohen, M.; Aviram, S.; Ilan, N.; Sanderson, R.D.; Aronheim, A.; Vlodavsky, I. Induction of heparanase 2 (Hpa2) expression by stress is mediated by ATF3. Matrix Biol. 2022, 105, 17–30. [Google Scholar] [CrossRef] [PubMed]
  30. Ostrovsky, O.; Grushchenko-Polaq, A.H.; Beider, K.; Mayorov, M.; Canaani, J.; Shimoni, A.; Vlodavsky, I.; Nagler, A. Identification of strong intron enhancer in the heparanase gene: Effect of functional rs4693608 variant on HPSE enhancer activity in hematological and solid malignancies. Oncogenesis 2018, 7, 51–65. [Google Scholar] [CrossRef] [Green Version]
  31. Ostrovsky, O.; Baryakh, P.; Morgulis, Y.; Mayorov, M.; Bloom, N.; Beider, K.; Shimoni, A.; Vlodavsky, I.; Nagler, A. The HPSE gene insulator—A novel regulatory element that affects heparanase expression, stem cell mobilization and the risk of acute graft versus host disease. Cells 2021, 10, 2523. [Google Scholar] [CrossRef]
  32. Ostrovsky, O.; Korostishevsky, M.; Shafat, I.; Mayorov, M.; Ilan, N.; Vlodavsky, I.; Nagler, A. Inverse correlation between HPSE gene single nucleotide polymorphisms (SNPs) and heparanase expression: Possibility of multiple levels of heparanase regulation. J. Leukoc. Biol. 2009, 86, 445–455. [Google Scholar] [CrossRef] [Green Version]
  33. Ostrovsky, O.; Shimoni, A.; Baryakh, P.; Morgulis, Y.; Mayorov, M.; Beider, K.; Shteingauz, A.; Ilan, N.; Vlodavsky, I.; Nagler, A. Modification of heparanase gene expression in response to conditioning and LPS treatment: Strong correlation to rs4693608 SNP. J. Leukoc. Biol. 2014, 95, 677–688. [Google Scholar] [CrossRef] [PubMed] [Green Version]
  34. Ostrovsky, O.; Shimoni, A.; Rand, A.; Vlodavsky, I.; Nagler, A. Genetic variations in the heparanase gene (HPSE) associate with increased risk of GVHD following allogeneic stem cell transplantation: Effect of discrepancy between recipients and donors. Blood 2010, 115, 2319–2328. [Google Scholar] [CrossRef] [Green Version]
  35. Ostrovsky, O.; Beider, K.; Morgulis, Y.; Bloom, N.; Cid-Arregui, A.; Shimoni, A.; Vlodavsky, I.; Nagler, A. CMV seropositivity status increases heparanase SNPs regulatory activity, risk of acute GVHD and yield of CD34+ cell mobilization. Cells 2021, 10, 3489. [Google Scholar] [CrossRef]
  36. Ostrovsky, O.; Korostishevsky, M.; Levite, I.; Leiba, M.; Galski, H.; Vlodavsky, I.; Nagler, A. Association of heparanase gene (HPSE) single nucleotide polymorphisms with hematological malignancies. Leukemia 2007, 21, 2296–2303. [Google Scholar] [CrossRef] [PubMed]
  37. D’Agostino, M.; Cairns, D.A.; Lahuerta, J.J.; Wester, R.; Bertsch, U.; Waage, A.; Zamagni, E.; Mateos, M.V.; Dall’Olio, D.; van de Donk, N.W.C.J.; et al. Second revision of the International Staging System (R2-ISS) for overall survival in multiple myeloma: A European Myeloma Network (EMN) report within the HARMONY Project. J. Clin. Oncol. 2022, 40, 3406–3418. [Google Scholar] [CrossRef] [PubMed]
  38. Carlton, V.E.H.; Ireland, J.S.; Useche, F.; Feham, M. Functional single nucleotide polymorphism-based associated studies. Human Genom. 2006, 2, 391–402. [Google Scholar] [CrossRef] [Green Version]
  39. Walavalkar, K.; Notani, D. Beyond the coding genome: Non-coding mutations and cancer. Front. Biosci. 2020, 25, 1828–1838. [Google Scholar] [CrossRef]
  40. Fullard, J.F.; Rahman, S.; Roussos, P. Genetic variation in long-range enhancers. Curr. Top. Behav. Neurosci. 2019, 42, 35–50. [Google Scholar] [CrossRef]
  41. Matharu, N.; Ahituv, N. Modulating gene regulation to treat genetic disorders. Nat. Rev. Drug Discov. 2020, 19, 757–775. [Google Scholar] [CrossRef]
  42. Karamanos, N.K.; Piperigkou, Z.; Passi, A.; Gotte, M.; Rousselle, P.; Vlodavsky, I. Extracellular matrix-based cancer targeting. Trends Mol. Med. 2021, 27, 1000–1013. [Google Scholar] [CrossRef] [PubMed]
  43. Kiyan, Y.; Tkachuk, S.; Kurselis, K.; Shushakova, N.; Stahl, K.; Dawodu, D.; Kiyan, R.; Chichkov, B.; Haller, H. Heparanase-2 protects from LPS-mediated endothelial injury by inhibiting TLR4 signaling. Sci. Rep. 2019, 9, 13591. [Google Scholar] [CrossRef] [Green Version]
  44. Pape, T.; Hunkemoller, A.M.; Kümpers, P.; Haller, H.; David, S.; Stahl, K. Targeting the “sweet spot” in septic shock—A perspective on the endothelial glycocalyx regulating proteins heparanase-1 and -2. Matrix Biol. Plus 2021, 12, 100095. [Google Scholar] [CrossRef] [PubMed]
  45. Jayatilleke, K.M.; Hulett, M.D. Heparanase and the hallmarks of cancer. J. Transl. Med. 2020, 18, 453. [Google Scholar] [CrossRef]
  46. Ilan, N.; Bhattacharya, U.; Barash, U.; Boyango, I.; Yanku, Y.; Gross-Cohen, M.; Vlodavsky, I. Heparanase—The massage comes in different flavors. Adv. Exp. Med. Biol. 2020, 1221, 253–283. [Google Scholar] [CrossRef] [PubMed]
  47. Yang, Y.; Macleod, V.; Bendre, M.; Huang, Y.; Theus, A.M.; Miao, H.Q.; Kussie, P.; Yaccoby, S.; Epstein, J.; Suva, L.J.; et al. Heparanase promotes the spontaneous metastasis of myeloma cells to bone. Blood 2005, 105, 1303–1309. [Google Scholar] [CrossRef]
  48. Purushothaman, A.; Chen, L.; Yang, Y.; Sanderson, R.D. Heparanase stimulation of protease expression implicates it as a master regulator of the aggressive tumor phenotype in myeloma. J. Biol. Chem. 2008, 283, 32628–32636. [Google Scholar] [CrossRef] [Green Version]
  49. Andersen, N.F.; Vogel, U.; Klausen, T.W.; Gimsing, P.; Gregersen, H.; Abildgaard, N.; Vangsted, A.J. Polymorphisms in the heparanase gene in multiple myeloma associated with bone morbidity and survival. Eur. J. Haematol. 2015, 94, 60–66. [Google Scholar] [CrossRef] [Green Version]
  50. Bansal, R.; Rakshit, S.; Kumar, S. Extramedullary disease in multiple myeloma. Blood Cancer J. 2021, 11, 161. [Google Scholar] [CrossRef]
  51. Alsayed, Y.; Ngo, H.; Runnels, J.; Leleu, X.; Singha, U.K.; Pitsillides, C.M.; Spencer, J.A.; Kimlinger, T.; Ghobrial, J.M.; Jia, X.; et al. Mechanisms of regulation of CXCR4/SDF-1 (CXCL12)-dependent migration and homing in multiple myeloma. Blood 2007, 109, 2708–2717. [Google Scholar] [CrossRef]
  52. Beider, K.; Rosenberg, E.; Bitner, H.; Shimoni, A.; Leiba, M.; Koren-Michowitz, M.; Ribakovsky, E.; Klein, S.; Olam, D.; Weiss, L.; et al. The sphingosine-1-phosphate modulator FTY720 targets multiple myeloma via the CXCR4/CXCL12 pathway. Clin. Cancer Res. 2017, 23, 1733–1747. [Google Scholar] [CrossRef] [PubMed] [Green Version]
  53. Blade, J.; Fernandez de Larrea, C.; Rosinol, L.; Cibeira, M.T.; Jimenez, R.; Powles, R. Soft-tissue plasmacytomas in multiple myeloma: Incidence, mechanisms of extramedullary spread, and treatment approach. J. Clin. Oncol. 2011, 29, 3805–3812. [Google Scholar] [CrossRef]
  54. Roccaro, A.M.; Mishima, Y.; Sacco, A.; Moschetta, M.; Tai, Y.-T.; Shi, J.; Zhang, Y.; Reagan, M.R.; Huynh, D.; Kawano, Y.; et al. CXCR4 regulates extra-medullary myeloma through epithelial-mesenchymal-transition-like transcriptional activation. Cell Rep. 2015, 12, 622–635. [Google Scholar] [CrossRef] [Green Version]
  55. Zhang, G.L.; Gutter-Kapon, L.; Ilan, N.; Batool, T.; Singh, K.; Digre, A.; Luo, Z.; Sandler, S.; Shaked, Y.; Sanderson, R.D.; et al. Significance of host heparanase in promoting tumor growth and metastasis. Matrix Biol. 2020, 93, 25–40. [Google Scholar] [CrossRef]
  56. Mayfosh, A.J.; Nguyen, T.K.; Hulett, M.D. The heparanase regulatory network in health and disease. Int. J. Mol. Sci. 2021, 22, 11096. [Google Scholar] [CrossRef] [PubMed]
  57. He, Y.Q.; Sutcliffe, E.L.; Bunting, K.L.; Li, J.; Goodall, K.J.; Poon, I.K.; Hulett, M.D.; Freeman, C.; McInnes, R.L.; Taya, T.; et al. The endoglycosidase heparanase enters the nucleus of T lymphocytes and modulates H3 methylation at actively transcribed genes via the interplay with key chromatin modifying enzymes. Transcription 2012, 3, 130–145. [Google Scholar] [CrossRef] [PubMed] [Green Version]
  58. Ullah, T.R. The role of CXCR4 in multiple myeloma: Cells’ journey from bone marrow to beyond. J. Bone Oncol. 2019, 17, 100253. [Google Scholar] [CrossRef] [PubMed]
  59. Huang, Y.; Huang, J.; Zhang, P.; Luo, J.; Cheng, P.; Miao, L.; Lai, Y. Integrated analysis of hub gene expression in multiple myeloma. J. BUON 2021, 26, 2040–2052. [Google Scholar]
  60. Giuliani, N.; Bonomini, S.; Romagnani, P.; Lazzaretti, M.; Morandi, F.; Colla, S.; Tagliaferri, S.; Lasagni, L.; Annunziato, F.; Crugnola, M.; et al. CXCR3 and its binding chemokines in myeloma cells: Expression of isoforms and potential relationships with myeloma cell proliferation and survival. Haematologica 2006, 91, 1489–1497. [Google Scholar]
  61. Cannon, W.B. Bodily Changes in Pain, Hunger, Fear and Rage; Appleton-Crofts: New York, NY, USA, 1929. [Google Scholar]
  62. Goligorsky, M.S. The concept of ce.ellular “fight-or-flight” reaction to stress. Am. J. Physiol. Renal. Physiol. 2001, 280, F551–F561. [Google Scholar] [CrossRef] [PubMed] [Green Version]
  63. Carpenter, M.B. The autonomic nervous system. In Human Neuroanatomy, 7th ed.; The William & Wilkins Co.: Baltimore, MD, USA, 1976; pp. 191–212. [Google Scholar]
  64. Hanoun, M.; Maryanovich, M.; Arnal-Estape, A.; Frenette, P.S. Neural regulation of hematopoiesis, inflammation and cancer. Neuron 2015, 86, 360–373. [Google Scholar] [CrossRef] [PubMed] [Green Version]
  65. Roucourt, B.; Meeussen, S.; Bao, J.; Zimmermann, P.; David, G. Heparanase activates the syndecan-syntenin-ALIX exosome pathway. Cell Res. 2015, 25, 412–428. [Google Scholar] [CrossRef] [Green Version]
  66. Ruan, J.; Trotter, T.N.; Nan, L.; Luo, R.; Javed, A.; Sanderson, R.D.; Suva, L.J.; Yang, Y. Heparanase inhibits osteoblastogenesis and shifts bone marrow progenitor cell fate in myeloma bone disease. Bone 2013, 57, 10–17. [Google Scholar] [CrossRef] [PubMed] [Green Version]
Figure 1. Map of the HPSE and HPSE2 genes. Numbered boxes indicate exons. Black boxes depict open reading frames, and white boxes represent the 5’- and 3’-untranslated regions. The most prominent SNPs are marked in bold in both genes. Arrows point to the location of SNPs.
Cells 12 00913 g001
Figure 2. Expression of the HPSE and HPSE2 genes in multiple myeloma RPMI-8226 cells transfected with the HPSE gene enhancer fragment. Four HPSE enhancer constructs were inserted upstream of the luciferase gene in pGL4.26 vector with minimal promoter and transfected into RPMI-8226 myeloma cells [30]. DNA constructs were prepared in sense and antisense direction. The HPSE gene enhancer fragment (440 bp) included rs4693083, rs4693608, rs4693084, and rs4693609 SNPs. Vr-A construct contains allele A of rs4693608 and allele G of rs4693084. Vr-B fragment includes allele G of rs4693608 and allele T of rs4693084. Samples of RPMI-8226 cells before and after transfection were analyzed by quantitative RT-PCR. RQ (relative quantification) values are shown on the y-axis. HPSE gene expression levels were elevated in enhancer fragment-transfected samples compared to controls, while HPSE2 gene expression was decreased to undetectable levels in the same samples. Samples treated with AMAXA electrical pulse alone or transfected with empty plasmid were used as controls. No differences were observed between untreated and treated samples. Data shown are of representative experiments performed in triplicates. Differences in RQ among various constructs were evaluated by t-test. p value of ≤0.05 was regarded as statistically significant. * p value of ≤0.05. ND—not detected.
Cells 12 00913 g002
Figure 3. Scheme describing the putative role of discrepancy in HPSE SNP profiles as possible mechanisms for the development of acute GVHD and primary paraskeletal disease in multiple myeloma. (A). Effect of enhancer (rs4693608) and insulator (rs4364254) HPSE gene SNP combinations on heparanase expression in normal cells. (B). Proposed influence of HPSE gene SNP discrepancy between patient and donor on the development of acute GVHD following HSCT. (C). Discrepancy between myeloma and microenvironment signaling dictates an increased risk of developing paraskeletal disease in patients with the HPSE LR genotype (rs4693608-rs4364254 SNP combination).
Cells 12 00913 g003
Table 1. Patient’s characteristics.
VariableCharacteristicNo. of Cases (%)
median—60
Age (years)range—27–90
<60128 (46.0)
≥60150 (54.0)
Gendermale174 (62.6)
female104 (37.4)
MMmultiple myeloma231(83.1)
SMMsmoldering multiple myeloma28 (10.1)
MGUSmonoclonal gammopathy19 (6.8)
ISS (international staging system)I39 (14.0)
II66 (23.7)
III46 (16.5)
NA127 (45.7)
Beta-2-microglobulin (µg/dL)median—4.1range—1.2–14.8
Creatinine (mg/dL)median—1.04range—0.5–20.0
Albumin (g/dL)median—3.9range—1.9–5.2
Calcium (mg/dL)median—9.4range—7.4–16.2
Hemoglobin (g/dL)median—11.4range—5.2–16.5
Bone morbidityprimary149 (69.0)
secondary13 (6.0)
without bone disease54 (25.0)
Extramedullary diseaseprimary50 (23.1)
secondary39 (18.1)
without EMD127 (58.8)
Renal failurewith renal failure57 (26.3)
without renal failure160 (73.7)
ISS—international staging system; NA—data not available.
Table 2. Genotype and allele frequencies of the HPSE gene SNPs according to the International Staging System (ISS) in multiple myeloma patients.
SNPs/
Genotypes
and Alleles
Stage IStage IIStage IIIχ2/
p-Value
Number/
Incidence
Number/
Incidence
Number/
Incidence
rs4693608
AA
AG
GG

A
G

6 (15.4%)
23 (59.0%)
10 (25.6%)

35 (44.9%)
43 (55.1%)

27 (40.9%)
31 (47.0%)
8 (12.0%)

85 (64.4%)
47 (35.6%)

15 (32.6%)
24 (52.2%)
7 (15.2%)

54 (58.7%)
38 (41.3%)


I − III: 3.86, 0.15
I − II + III: 7.62, 0.022
I + II − III: 0.089, 0.96

I − III: 3.23, 0.072
I − II + III: 6.99, 0.0082
I + II − III: 0.063, 0.8
rs4693084
GG
GT
TT

G
T

17 (43.6%)
18 (46.2%)
4 (10.3 %)

52 (66.7%)
26 (33.3%)

44 (66.7%)
19 (28.8%)
3 (4.5%)

107 (81.1%)
25 (18.9%)

30 (65.2%)
13 (28.3%)
3 (6.5%)

73 (79.3%)
19 (20.7%)


I − III: 4.0, 0.14
I − II + III: 6.175, 0.046
I + II − III: 0.74, 0.69

I − III: 3.49, 0.062
I − II + III: 6.09, 0.014
I + II − III: 0.47, 0.49
rs4426765
AA
AC
CC

A
C

25 (64.1%)
8 (20.5%)
6 (15.4%)

58 (74.4%)
20 (25.6%)

33 (50.0%)
29 (43.9%)
4 (6.1%)

95 (72.0%)
37 (28.0%)

29 (63.0%)
16 (34.8%)
1 (2.2%)

74 (80.4%)
18 (19.6%)


I − III: 6.0, 0.05
I − II + III: 8.31, 0.016
I + II − III: 2.71, 0.26

I − III: 0.9, 0.34
I − II + III: 0.037, 0.85
I + II − III: 1.97, 0.16
rs28649799
AA
AG
GG

A
G

30 (76.9%)
9 (23.1%)
0

69 (88.5%)
9 (11.5%)

58 (87.9%)
7 (10.6%)
1 (1.5%)

123 (93.2%)
9 (6.8%)

35 (76.1%)
9 (19.6%)
2 (4.3%)

79 (85.9%)
13 (14.1%)


I − III: 1.82, 0.4
I − II + III: 2.53, 0.28
I + II − III: 2.45, 0.29

I − III: 0.25, 0.62
I − II + III: 0.19, 0.67
I + II − III: 2.15, 0.14
rs4364254
TT
TC
CC

T
C

20 (51.3%)
15 (38.5%)
4 (10.3%)

55 (70.5%)
23 (29.5%)

33 (50.0%)
26 (37.9%)
8 (12.1%)

91 (68.9%)
41 (31.1%)

23 (50.0%)
18 (39.1%)
5 (10.9%)

64 (69.6%)
28 (30.4%)


I − III: 0.017, 0.99
I − II + III: 0.059, 0.97
I + II − III: 0.008, 0.99

I − III: 0.018, 0.89
I − II + III: 0.047, 0.83
I + II − III: 0, 1
Significant deviations (p < 0.05) are marked in bold.
Table 3. Genotype and allele frequencies of the HPSE gene SNPs in correlation with primary extramedullary disease (EMD) in multiple myeloma.
SNPs/
Genotypes
and Alleles
Total EMDParaskeletal Disease
Yes
Number/
Incidence
No
Number/
Incidence
χ2/
p-Value
Yes
Number/
Incidence
No
Number/
Incidence
χ2/
p-Value
rs4693608
AA9 (18.0%)59 (36.4%)11.98,8 (18.6%)59 (36.4%)8.07,
AG25 (50.0%)82 (50.6%)0.00323 (53.5%)82 (50.6%)0.018
GG16 (32.0%)21 (13%) 12 (27.9%)21 (13.0%)
A43 (43.0%)200 (61.7%)10.96,39 (45.3%)200 (61.7%)7.5,
G57 (57.0%)124 (38.3%)0.00147 (54.7%)124 (38.3%)0.006
rs4693084
GG25 (50.0%)107 (66.5%)8.65,22 (51.2%)107 (66.5%)5.76,
GT18 (36.0%)48 (29.8%)0.01316 (37.2%)48 (29.8%)0.056
TT7 (14.0%)6 (3.7%) 5 (11.6%)6 (3.7%)
G68 (68.0%)262 (81.1%)7.996,60 (69.8%)262 (81.1%)5.49,
T32 (32.0%)60 (18.6%)0.00526 (30.2%)60 (18.6%)0.019
rs4426765
AA23 (46.0%)103 (63.6%)4.94,18 (41.9%)103 (63.6%)6.77,
AC22 (44.0%)49 (30.2%)0.08520 (46.5%)49 (30.2%)0.034
CC5 (10.0%)10 (6.2%) 5 (11.6%)10 (6.2%)
A68 (68.0%)255 (78.7%)4.82,56 (65.1%)255 (78.7%)6.85,
C32 (32.0%)69 (21.3%)0.02830 (34.9%)69 (21.3%)0.009
rs28649799
AA35 (70.0%)135 (83.3%)4.33,32 (74.4%)135 (83.3%)3.44,
AG13 (26.0%)24 (14.8%)0.1211 (25.6%)24 (14.8%)0.18
GG2 (4.0%)3 (1.9%) 0 3 (1.9%)
A83 (83.0%)294 (90.7%)4.65,75 (87.2%)294 (90.7%)0.94,
G17 (17.0%)30 (9.3%)0.03111 (12.8%)30 (9.3%)0.33
rs4364254
TT17 (34.0%)97 (59.9%)11.42,16 (37.2%)97 (59.9%)7.92,
TC23 (46.0%)51 (31.5%)0.00319 (44.2%)51 (31.5%)0.019
CC10 (20.0%)14 (8.6%) 8 (18.6%)14 (8.6%)
T57 (57.0%)245 (75.6%)12.92,51 (59.3%)245 (75.6%)9.01,
C43 (43.0%)79 (24.4%)0.0003235 (40.7%)79 (24.4%)0.003
rs4693608
rs4364254
HR9 (18.0%)59 (36.4%)17.99,8 (18.6%)59 (36.4%)14.32,
MR19 (38.0%)77 (47.5%)0.0001217 (39.5%)77 (47.5%)0.00078
LR22 (44.0%)26 (16.1%)Yc: 16.036, 0.0003318 (41.9%)26 (16.1%)Yc: 12.472, 0.002
Significant deviations (p < 0.05) are marked in bold. Yc—Yates’ correction.
Table 4. Genotype and allele frequencies of the HPSE2 gene SNPs in correlation with primary extramedullary disease (EMD) in multiple myeloma.
SNPs/
Genotypes
and Alleles
Total EMDParaskeletal Disease
Yes
Number/
Incidence
No
Number/
Incidence
χ2/
p-Value
Yes
Number/
Incidence
No
Number/
Incidence
χ2/
p-Value
rs2040022
AA19 (38%)57 (35.2%)NS15 (34.9%)57 (35.2%)NS
AG21 (42%)81 (50.0%) 19 (44.2%)81 (50.0%)
GG10 (20%)24 (14.8%) 9 (20.9%)24 (14.8%)
A59 (59%)195 (60.2%)NS49 (57.0%)195 (60.2%)NS
G41 (41%)129 (39.8%) 37 (43.0%)129 (39.8%)
rs658225
AA32 (64%)110 (67.9%)NS26 (60.5%)110 (67.9%)NS
AG15 (30%)50 (30.9%) 15 (34.9%)50 (30.9%)
GG3 (6%)2 (1.2%) 2 (4.7%)2 (1.2%)
A79 (79%)270 (83.3%)NS67 (77.9%)270 (83.3%)NS
G21 (21%)54 (16.7%) 19 (22.1%)54 (6.7%)
rs7081116
AA30 (60%)99 (61.9%)NS25 (58.1%)99 (61.9%)NS
AG17 (34%)55 (34.4%) 15 (34.9%)55 (34.4%)
GG3 (6%)6 (3.8%) 3 (7.0%)6 (3.8%)
A77 (77%)253 (79.1%)NS65 (75.6%)253 (79.1%)NS
G23 (23%)67 (20.9%) 21 (24.4%)67 (20.9%)
rs861399
TT36 (72%)111 (68.5%)NS31 (72.1%)111 (68.5%)NS
TC13 (26%)49 (30.2%) 11 (25.6%)49 (30.2%)
CC2 (1%)2 (1.2%) 1 (2.3%)2 (1.2%)
T85 (85%)271 (83.6%)NS73 (84.9%)271 (83.6%)NS
C15 (15%)53 (16.4%) 13 (15.1%)53 (16.4%)
rs7076702
CC29 (58%)95 (58.6%)NS24 (55.8%)95 (58.6%)NS
CG18 (36%)59 (36.4%) 16 (37.2%)59 (36.4%)
GG3 (6%)8 (4.9%) 3 (7.0%)8 (4.9%)
C76 (76%)249 (76.9%)NS64 (74.4%)249 (76.9%)NS
G24 (24%)75 (23.1%) 22 (25.6%)75 (23.1%)
rs475711
CC28 (56%)101 (62.3%)NS23 (53.5%)101 (62.3%)NS
CT19 (38%)56 (34.6%) 17 (39.5%)56 (34.6%)
TT3 (6%)5 (3.1%) 3 (7.0%)5 (3.1%)
C75 (75%)258 (79.6%)NS63 (73.3%)258 (79.6%)NS
T25 (25%)66 (20.4%) 23 (26.7%)66 (20.4%)
rs657442
CC50 (100%)140 (86.4%)0.006543 (100%)140 (86.4%)0.011
CA021 (13.0%) 021 (13.0%)
AA01 (0.6%) 01 (0.6%)
C100 (100%)301 (92.9%)0.003886 (100%)301 (92.9%)0.0066
A023 (7.1%) 023 (7.1%)
rs57455933
AA26 (52%)75 (46.3%)NS23 (53.5%)75 (46.3%)NS
AT21 (42%)68 (42.0%) 18 (41.7%)68 (42.0%)
TT3 (6%)19 (11.7%) 2 (4.7%)19 (11.7%)
A73 (73%)218 (67.3%)NS64 (74.4%)218 (67.3%)NS
T27 (27%)106 (32.7%) 22 (25.6%)106 (32.7%)
rs621644
GG25 (50%)85 (52.8%)NS22 (51.2%)85 (52.8%)NS
GA22 (44%)65 (40.4%) 19 (44.2%)65 (40.4%)
AA3 (6%)11 (6.8%) 2 (4.7%)11 (6.8%)
G72 (72%)235 (73%)NS63 (73.3%)235 (73%)NS
A28 (28%)87 (27%) 23 (26.7%)87 (27%)
rs1998756
CC20 (40%)74 (45.7%)NS18 (41.9%)74 (45.7%)NS
CT24 (48%)71 (43.8%) 20 (46.5%)71 (43.8%)
TT6 (12%)17 (10.5%) 5 (11.6%)17 (10.5%)
C64 (64%)219 (67.6%)NS56 (65.1%)219 (67.6%)NS
T36 (36%)105 (32.4%) 30 (34.9%)105 (32.4%)
rs754585
CC10 (20%)39 (24.1%)NS8 (18.6%)39 (24.1%)NS
CT29 (58%)77 (47.5%) 27 (62.8%)77 (47.5%)
TT11 (22%)46 (28.4%) 8 (18.6%)46 (28.4%)
C49 (49%)155 (47.8%)NS43 (50.0%)155 (47.8%)NS
T51 (51%)169 (52.2%) 43 (50.0%)169 (52.2%)
Significant deviations (p < 0.05) are marked in bold.
Table 5. Examination of the interaction between HPSE rs4693608 and rs4364254 SNPs and HPSE2 rs657422 SNP in correlation with primary extramedullary disease (EMD) of multiple myeloma.
GenotypesYes
Number/Incidence
No
Number/Incidence
χ2/
p-Value
HR-CC9 (18.0%)50 (30.9%)
HR-CA08 (4.9%)
HR-AA01 (0.6%)
MR-CC19 (38.0%)69 (42.6%)
MR-CA08 (4.9%)
MR-AA00
LR-CC22 (44.0%)21 (13.0)
LR-CA05 (3.1%)
LR-AA00
Group A1
Group A2
Group A3

9 (18.0%)
19 (38.0%)
22 (44.0%)

67 (41.4%)
74 (45.7%)
21 (12.9%)

χ2df2 = 22.47,
p = 0.0000049
Yates’ χ2 = 22.18,
Yates’ p = 0.000015
Group B1
Group B2
Group B3

9 (18.0%)
19 (38.0%)
22 (44.0%)

72 (44.4%)
69 (42.6%)
21 (13.0%)

χ2df2 = 25.33,
p = 0.0000036
Yates’ χ2 = 23.065,
Yates’ p = 0.0000098
Significant deviations (p < 0.05) are marked in bold. Group A1: HR-CC, HR-CA, HR-AA, MR-CA; group A2: MR-CC, LR-CA; group A3: LR-CC. Group B1: HR-CC, HR-CA, HR-AA, MR-CA, LR-CA; group B2: MR-CC; group B3: LR-CC.
Table 6. Genotype and allele frequencies of the HPSE2 gene SNPs in correlation with secondary extramedullary disease (EMD) in multiple myeloma.
SNPs/
Genotypes
and Alleles
Total EMDParaskeletal Disease
Yes
Number/
Incidence
No
Number/
Incidence
χ2/
p-Value
Yes
Number/
Incidence
No
Number/
Incidence
χ2/
p-Value
rs2040022
AA15 (40.5%)41 (34.2%)NS9 (32.1%)41 (34.2%)NS
AG16 (43.2%)61 (50.8%) 14 (50.0%)61 (50.8%)
GG6 (16.2%)18 (15.0%) 5 (17.9%)18 (15.0%)
A46 (62.1%)143 (59.6%)NS32 (57.1%)143 (59.6%)NS
G28 (37.8%)97 (40.4%) 24 (42.9%)97 (40.4%)
rs658225
AA31 (83.8%)77 (64.2%)5.24,23 (82.1%)77 (64.2%)3.5,
AG6 (16.2%)41 (34.2%)0.0735 (17.9%)41 (34.2%)0.17
GG02 (1.7%) 02 (1.7%)
A68 (91.9%)195 (81.3%)4.71,51 (91.1%)195 (81.3%)3.12,
G6 (8.1%)45 (18.7%)0.035 (8.9%)45 (18.7%)0.077
rs7081116
AA24 (64.9%)72 (61.0%)NS16 (57.1%)72 (61.0%)NS
AG11 (29.7%)42 (35.6%) 11 (39.3%)42 (35.6%)
GG2 (5.4%)4 (3.4%) 1 (3.6%)4 (3.4%)
A59 (79.7%)186 (78.8%)NS43 (76.8%)186 (78.8%)NS
G15 (20.3%)50 (21.2%) 13 (23.2%)50 (21.2%)
rs861399
TT25 (67.6%)82 (68.3%)NS17 (60.7%)82 (68.3%)NS
TC11 (29.7%)37 (30.8%) 11 (39.3%)37 (30.8%)
CC1 (2.7%)1 (0.8%) 01 (0.8%)
T61 (82.4%)201 (83.7%)NS45 (80.4%)201 (83.7%)NS
C13 (17.6%)39 (16.3%) 11 (19.6%)39 (16.3%)
rs7076702
CC24 (64.9%)67 (55.8%)NS16 (57.1%)67 (55.8%)NS
CG11 (29.7%)47 (39.2%) 11 (39.3%)47 (39.2%)
GG2 (5.4%)6 (5.0%) 1 (3.6%)6 (5.0%)
C59 (79.7%)181 (75.4%)NS43 (76.8%)181 (75.4%)NS
G15 (20.3%)59 (24.6%) 13 (23.2%)59 (24.6%)
rs475711
CC23 (62.2%)75 (62.5%)NS16 (57.1%)75 (62.5%)NS
CT13 (35.1%)41 (34.2%) 12 (42.9%)41 (34.2%)
TT1 (2.7%)4 (3.3%) 04 (3.3%)
C59 (79.7%)191 (79.6%)NS44 (78.6%)191 (79.6%)NS
T15 (20.3%)49 (20.4%) 12 (21.4%)49 (20.4%)
rs657442
CC34 (91.9%)102 (85.0%)NS26 (92.9%)102 (85.0%)NS
CA3 (8.1%)17 (14.2%) 2 (7.1%)17 (14.2%)
AA01 (0.8%) 01 (0.8%)
C71 (95.9%)221 (92.1%)NS54 (96.4%)221 (92.1%)NS
A3 (4.1%)19 (7.9%) 2 (3.6%)19 (7.9%)
rs57455933
AA20 (54.1%)53 (44.2%)NS14 (50.0%)53 (44.2%)NS
AT11 (29.7%)54 (45.0%) 8 (28.6%)54 (45.0%)
TT6 (16.2%)13 (10.8%) 6 (21.4%)13 (10.8%)
A51 (68.9%)160 (66.7%)NS36 (64.3%)160 (66.7%)NS
T23 (31.1%)106 (33.3%) 20 (35.7%)106 (33.3%)
rs621644
GG20 (54.1%)62 (52.1%)7.16,13 (46.4%)62 (52.1%)9.9,
GA11 (29.7%)52 (43.7%)0.0289 (32.1%)52 (43.7%)0.007
AA6 (16.2%)5 (4.2%) 6 (21.4%)5 (4.2%)
G51 (68.9%)176 (73.9%)NS35 (62.5%)176 (73.9%)2.93,
A23 (31.1%)62 (26.1%) 21 (37.5%)62 (26.1%)0.087
rs1998756
CC18 (48.6%)54 (45.0%)NS14 (50.0%)54 (45.0%)NS
CT15 (40.5%)54 (45.0%) 11 (39.3%)54 (45.0%)
TT4 (10.8%)12 (10.0%) 3 (10.7%)12 (10.0%)
C51 (68.9%)162 (67.5%)NS39 (69.6%)162 (67.5%)NS
T23 (31.1%)78 (32.5%) 17 (30.4%)78 (32.5%)
rs754585
CC8 (21.6%)30 (25.0%)7.24,6 (21.4%)30 (25.0%)5.42,
CT24 (64.9%)50 (41.7%)0.02718 (64.3%)50 (41.7%)0.067
TT5 (13.5%)40 (33.3%) 4 (14.3%)40 (33.3%)
C40 (54.1%)155 (45.8%)NS30 (53.6%)155 (45.8%)NS
T34 (45.9%)169 (54.2%) 26 (46.4%)169 (54.2%)
Significant deviations (p < 0.05) are marked in bold.
Table 7. Examination of the interaction between HPSE2 gene SNPs rs658225 and rs754585 in correlation with secondary extramedullary disease (EMD) of multiple myeloma.
GenotypesSecondary EMD
Number/Incidence
Total EMD
Number/Incidence
No
Number/Incidence
AA-CC8 (21.1%)13 (14.9%)22 (18.3%)
AA-CT20 (52.6%)40 (46.0%)28 (23.3%)
AA-TT4 (10.5%)10 (11.5%)27 (22.5%)
AG-CC1 (2.6%)4 (4.6%)8 (6.7%)
AG-CT4 (10.5%)12 (13.8%)22 (18.3%)
AG-TT1 (2.6%)5 (5.8%)11 (9.2%)
GG-CC01 (1.1)0
GG-CT01 (1.1)0
GG-TT01 (1.1)2 (1.7%)
Significant deviations are marked in bold.
Table 8. Genotype and allele frequencies of the HPSE2 gene SNPs in correlation with bone morbidity in multiple myeloma patients.
SNPsGenotypes
and Alleles
Yes
Number/Incidence
No
Number/Incidence
χ2/
p-Value
rs2040022AA56 (35.4%)17 (32.1%)NS


NS
AG78 (49.4%)26 (49.0%)
GG24 (15.2%)10 (18.9%)
A190 (60.1%)60 (56.6%)
G126 (39.9%)46 (43.4%)
rs658225AA109 (69.0%)34 (64.2%)NS


NS
AG44 (27.8%)19 (35.8%)
GG5 (3.2%)0
A262 (82.9%)87 (82.1%)
G54 (17.1%)19 (17.9%)
rs7081116AA91 (58.3%)35 (66.0%)NS


NS
AG56 (35.9%)18 (34.0%)
GG9 (5.8%)0
A238 (76.3%)88 (83.0%)
G74 (23.7%)18 (17.0%)
rs861399TT104 (65.8%)40 (75.5%)NS


NS
TC51 (32.3%)13 (24.5%)
CC3 (1.9%)0
T259 (82.0%)93 (87.3%)
C57 (18.0%)13 (12.3%)
rs7076702CC87 (55.1%)34 (64.2%)NS


NS
CG61 (38.6%)18 (34.0%)
GG10 (6.3%)1 (1.9%)
C235 (74.4%)86 (81.1%)
G81 (25.6%)20 (18.9%)
rs475711CC90 (57.0%)36 (67.9%)NS


NS
CT60 (38.0%)17 (32.1%)
TT8 (5.0%)0
C240 (76.0%)89 (84.0%)
T76 (24.0%)17 (16.0%)
rs657442CC149 (94.3%)41 (77.4%)13.74,
CA9 (5.7%)11 (20.8%)0.001
AA01 (1.9%)
C307 (97.2%)93 (87.7%)14.24,
A9 (2.8%)13 (12.3%)0.00016
rs57455933AA77 (48.7%)24 (45.3%)
AT67 (42.4%)20 (37.7%)NS
TT14 (8.9%)9 (17.0%)
A221 (69.9%)68 (64.2%)
T95 (30.1%)38 (35.4%)NS
rs621644GG81 (51.7%)28 (52.8%)
GA64 (40.8%)22 (41.5%)NS
AA12 (7.6%)3 (5.7%)
G226 (72.0%)78 (73.6%)
A88 (28.0%)28 (26.4%)NS
rs1998756CC74 (46.8%)20 (37.7%)
CT66 (41.8%)27 (51.0%)NS
TT18 (11.4%)6 (11.3%)
C214 (67.7%)67 (63.2%)
T102 (32.3%)39 (36.8%)NS
rs754585CC37 (23.4%)13 (24.5%)
CT80 (50.6%)25 (47.2%)NS
TT41 (25.9%)15 (28.3%)
C154 (48.7%)51 (48.1%)
T162 (51.3%)55 (51.9%)NS
Significant deviations (p < 0.05) are marked in bold.
Disclaimer/Publisher’s Note: The statements, opinions and data contained in all publications are solely those of the individual author(s) and contributor(s) and not of MDPI and/or the editor(s). MDPI and/or the editor(s) disclaim responsibility for any injury to people or property resulting from any ideas, methods, instructions or products referred to in the content.

