
Expression and Kinetics of Endogenous Cannabinoids in the Brain and Spinal Cord of a Spare Nerve Injury (SNI) Model of Neuropathic Pain
 ,
,  , , and
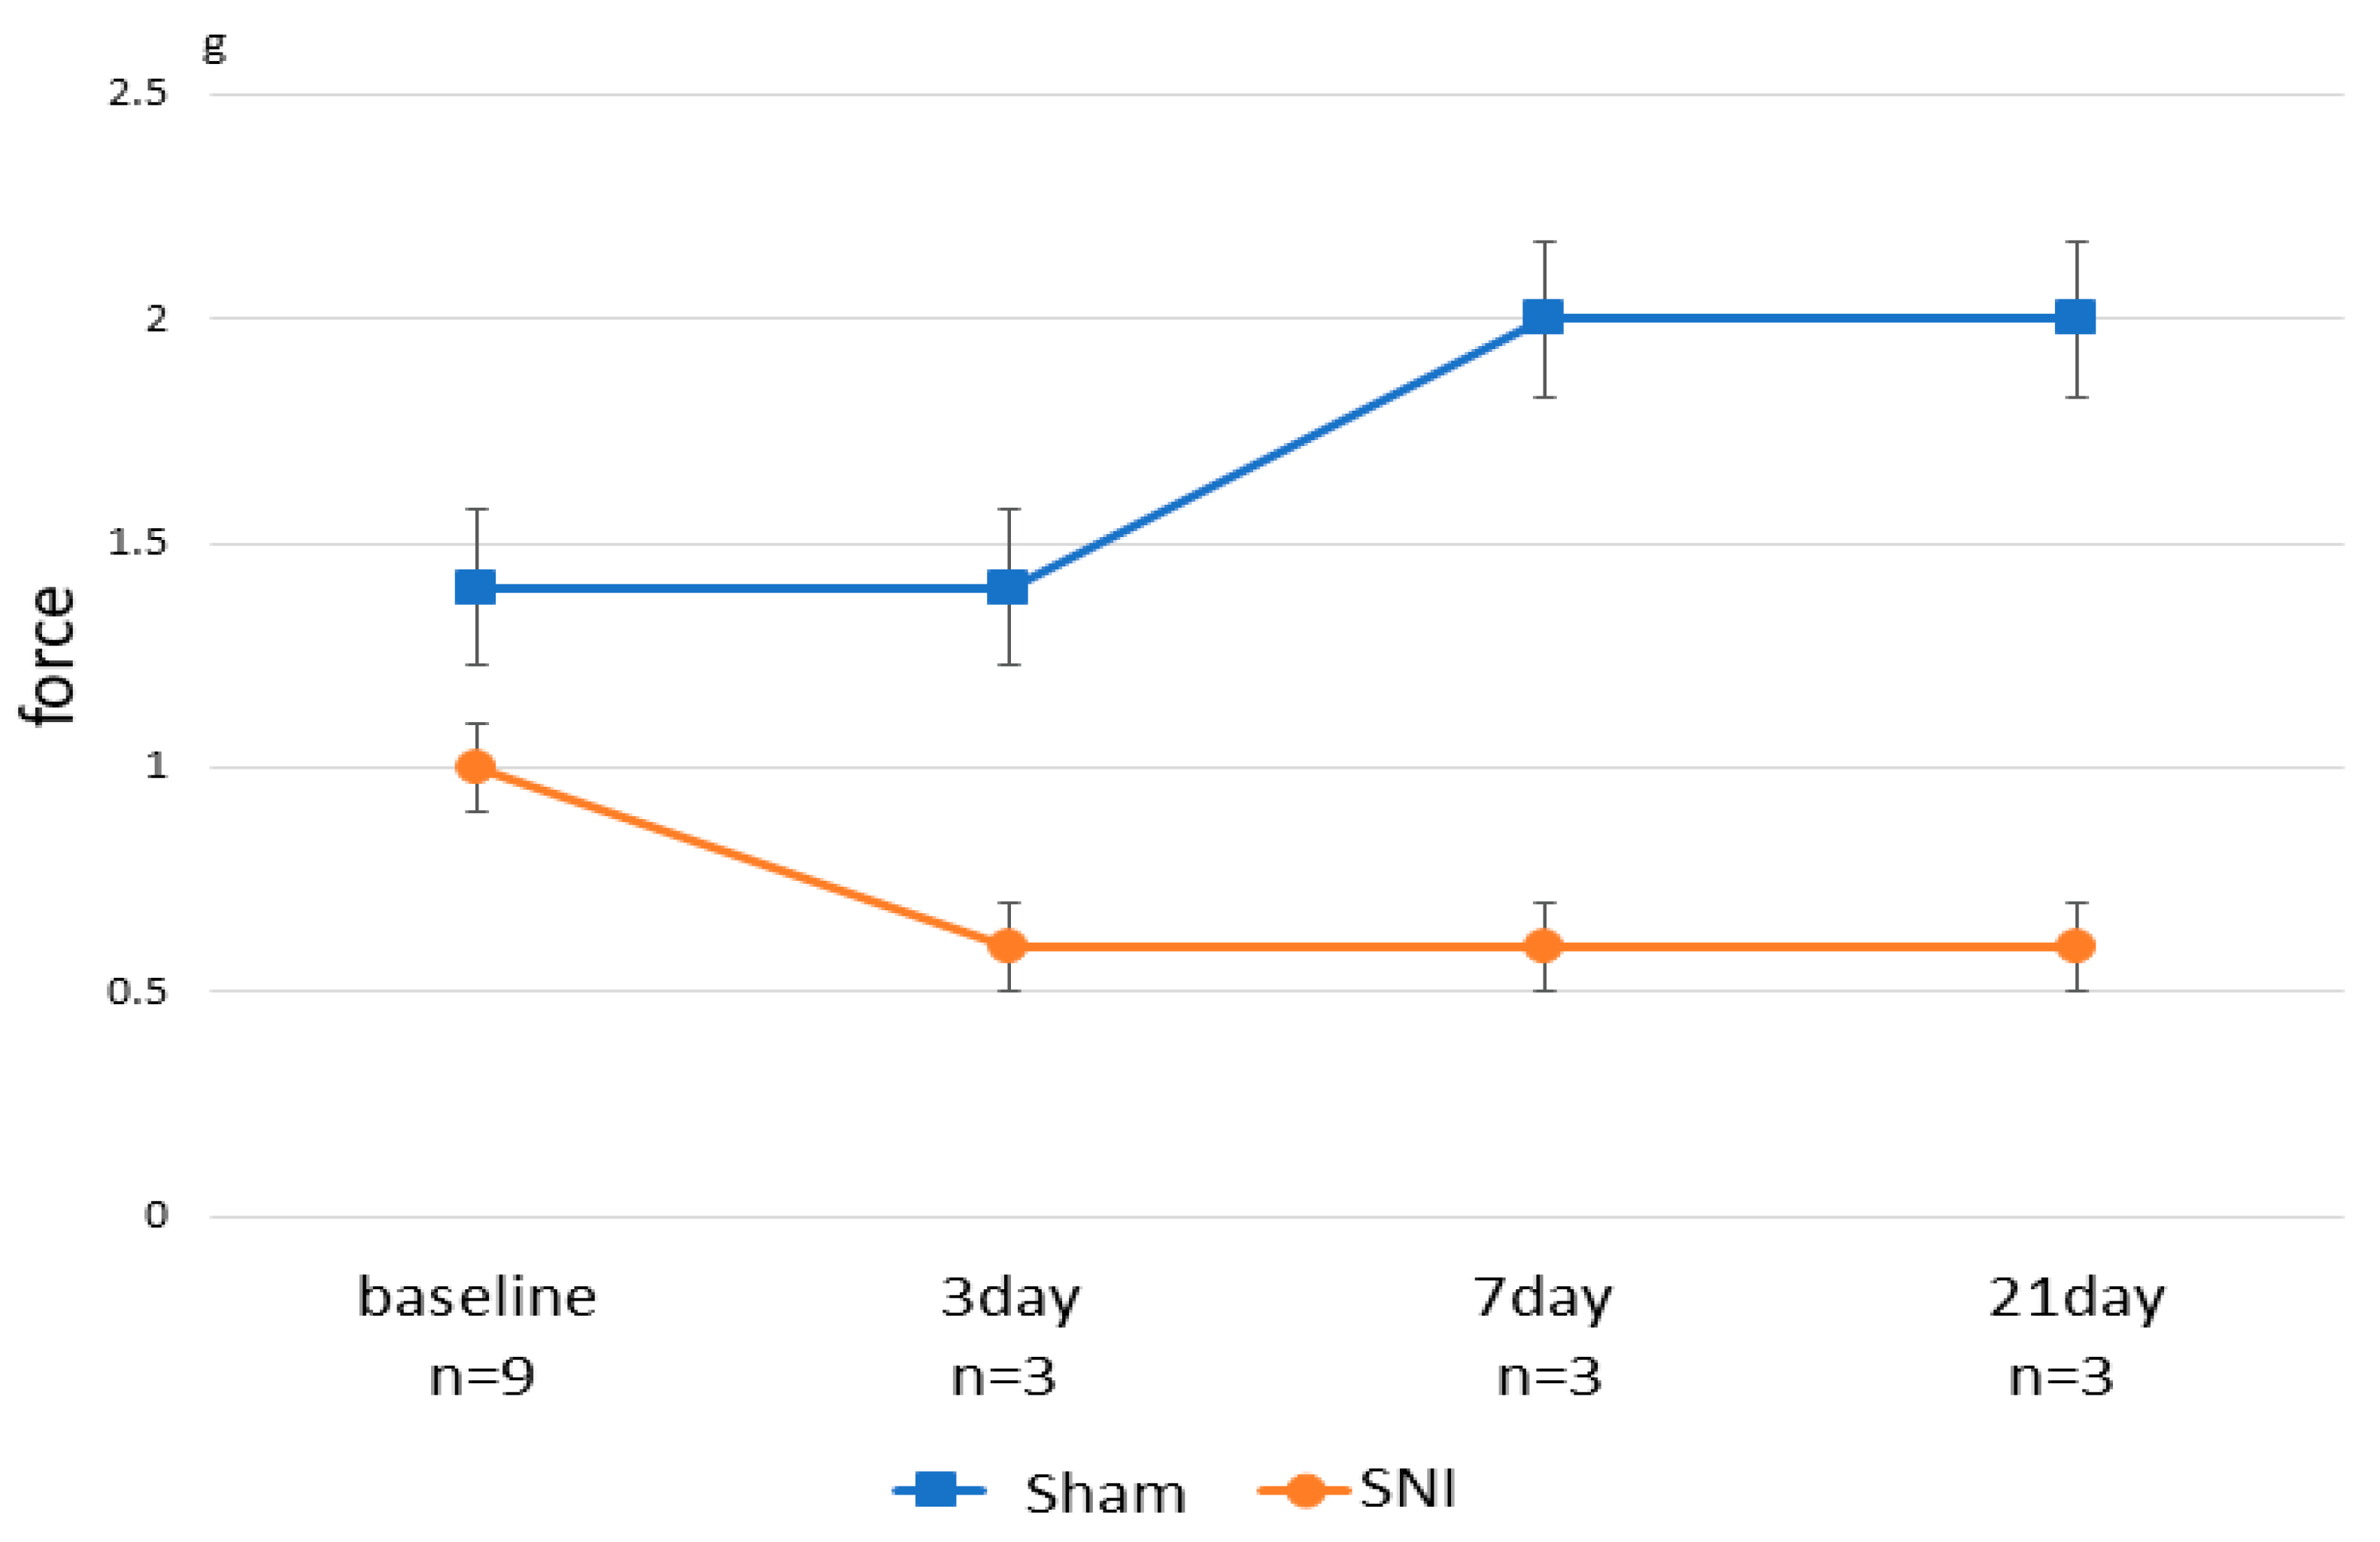
Abstract
:1. Introduction
2. Materials and Methods
2.1. Animals
2.2. Behavior Test
2.3. Tissue Preparation and DESI-MSI Data Acquisition
2.4. DESI-MSI Data Analysis
3. Results
3.1. Effects of SNI on Escape Behavior in Mice
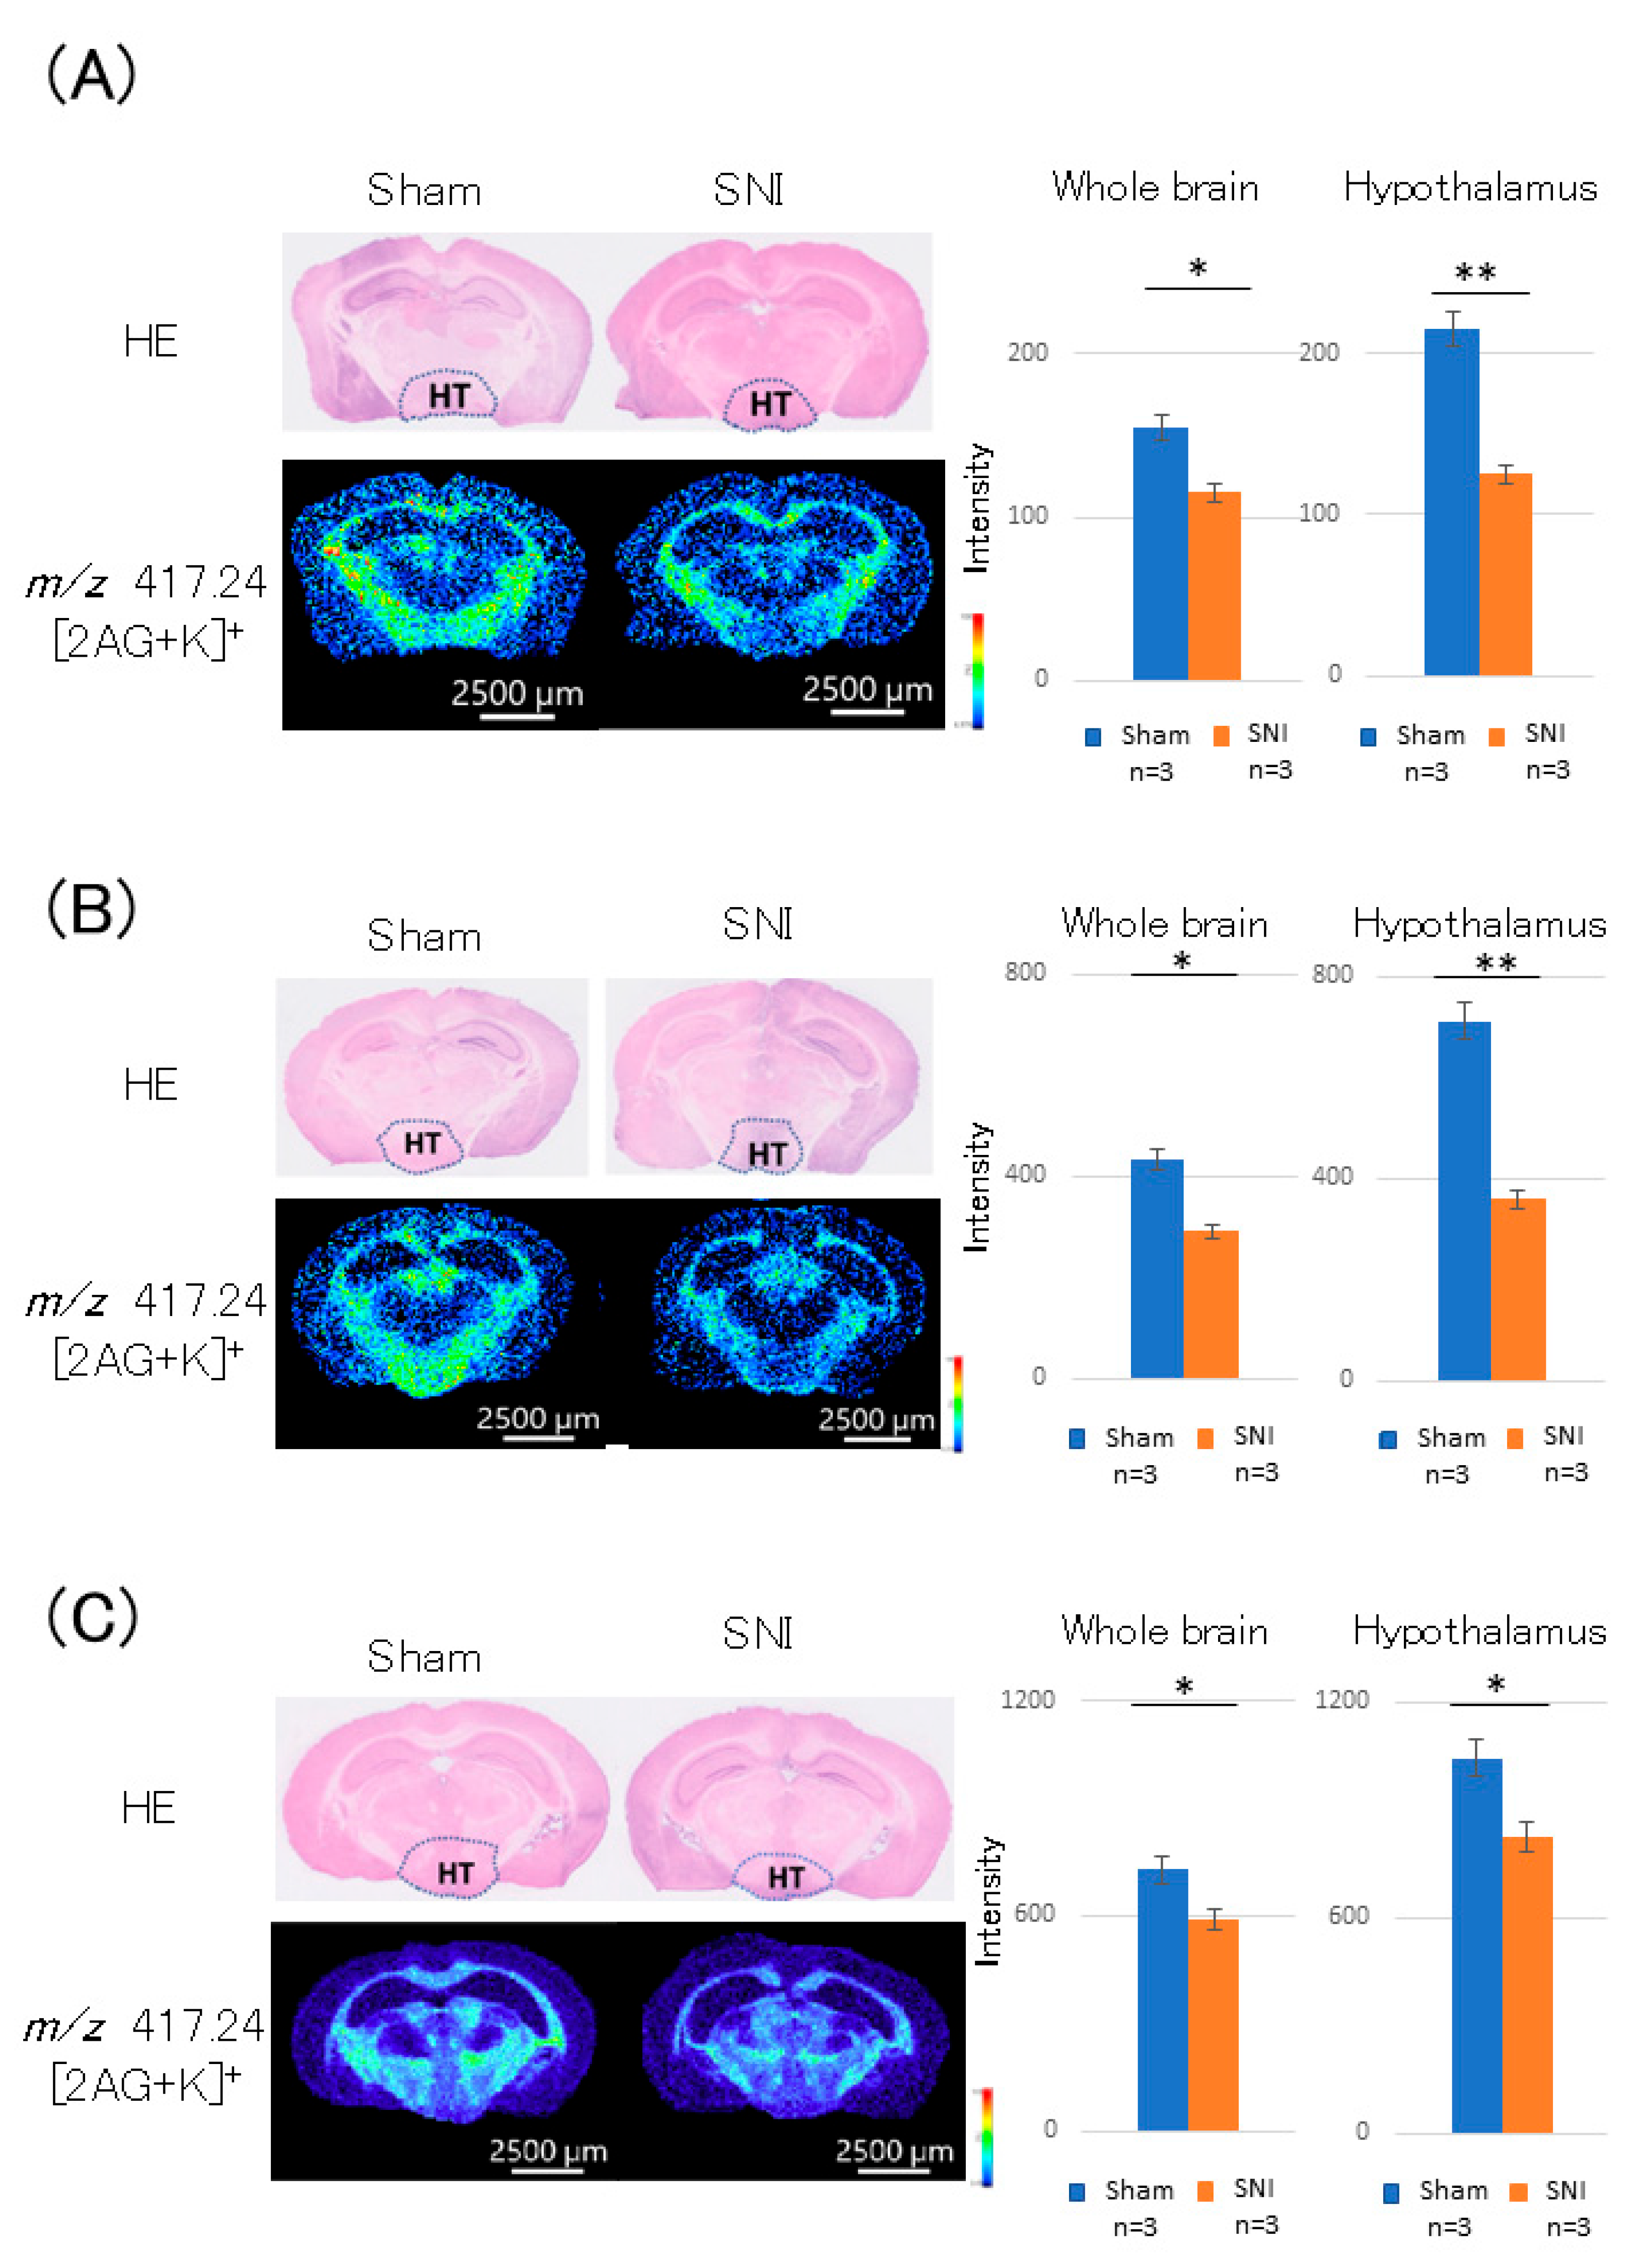
3.2. Distribution of 2-AG in the Hypothalamus of SNI Mice
3.3. Distribution of 2-AG in the Periaqueductal Gray (PAG) of SNI Mice
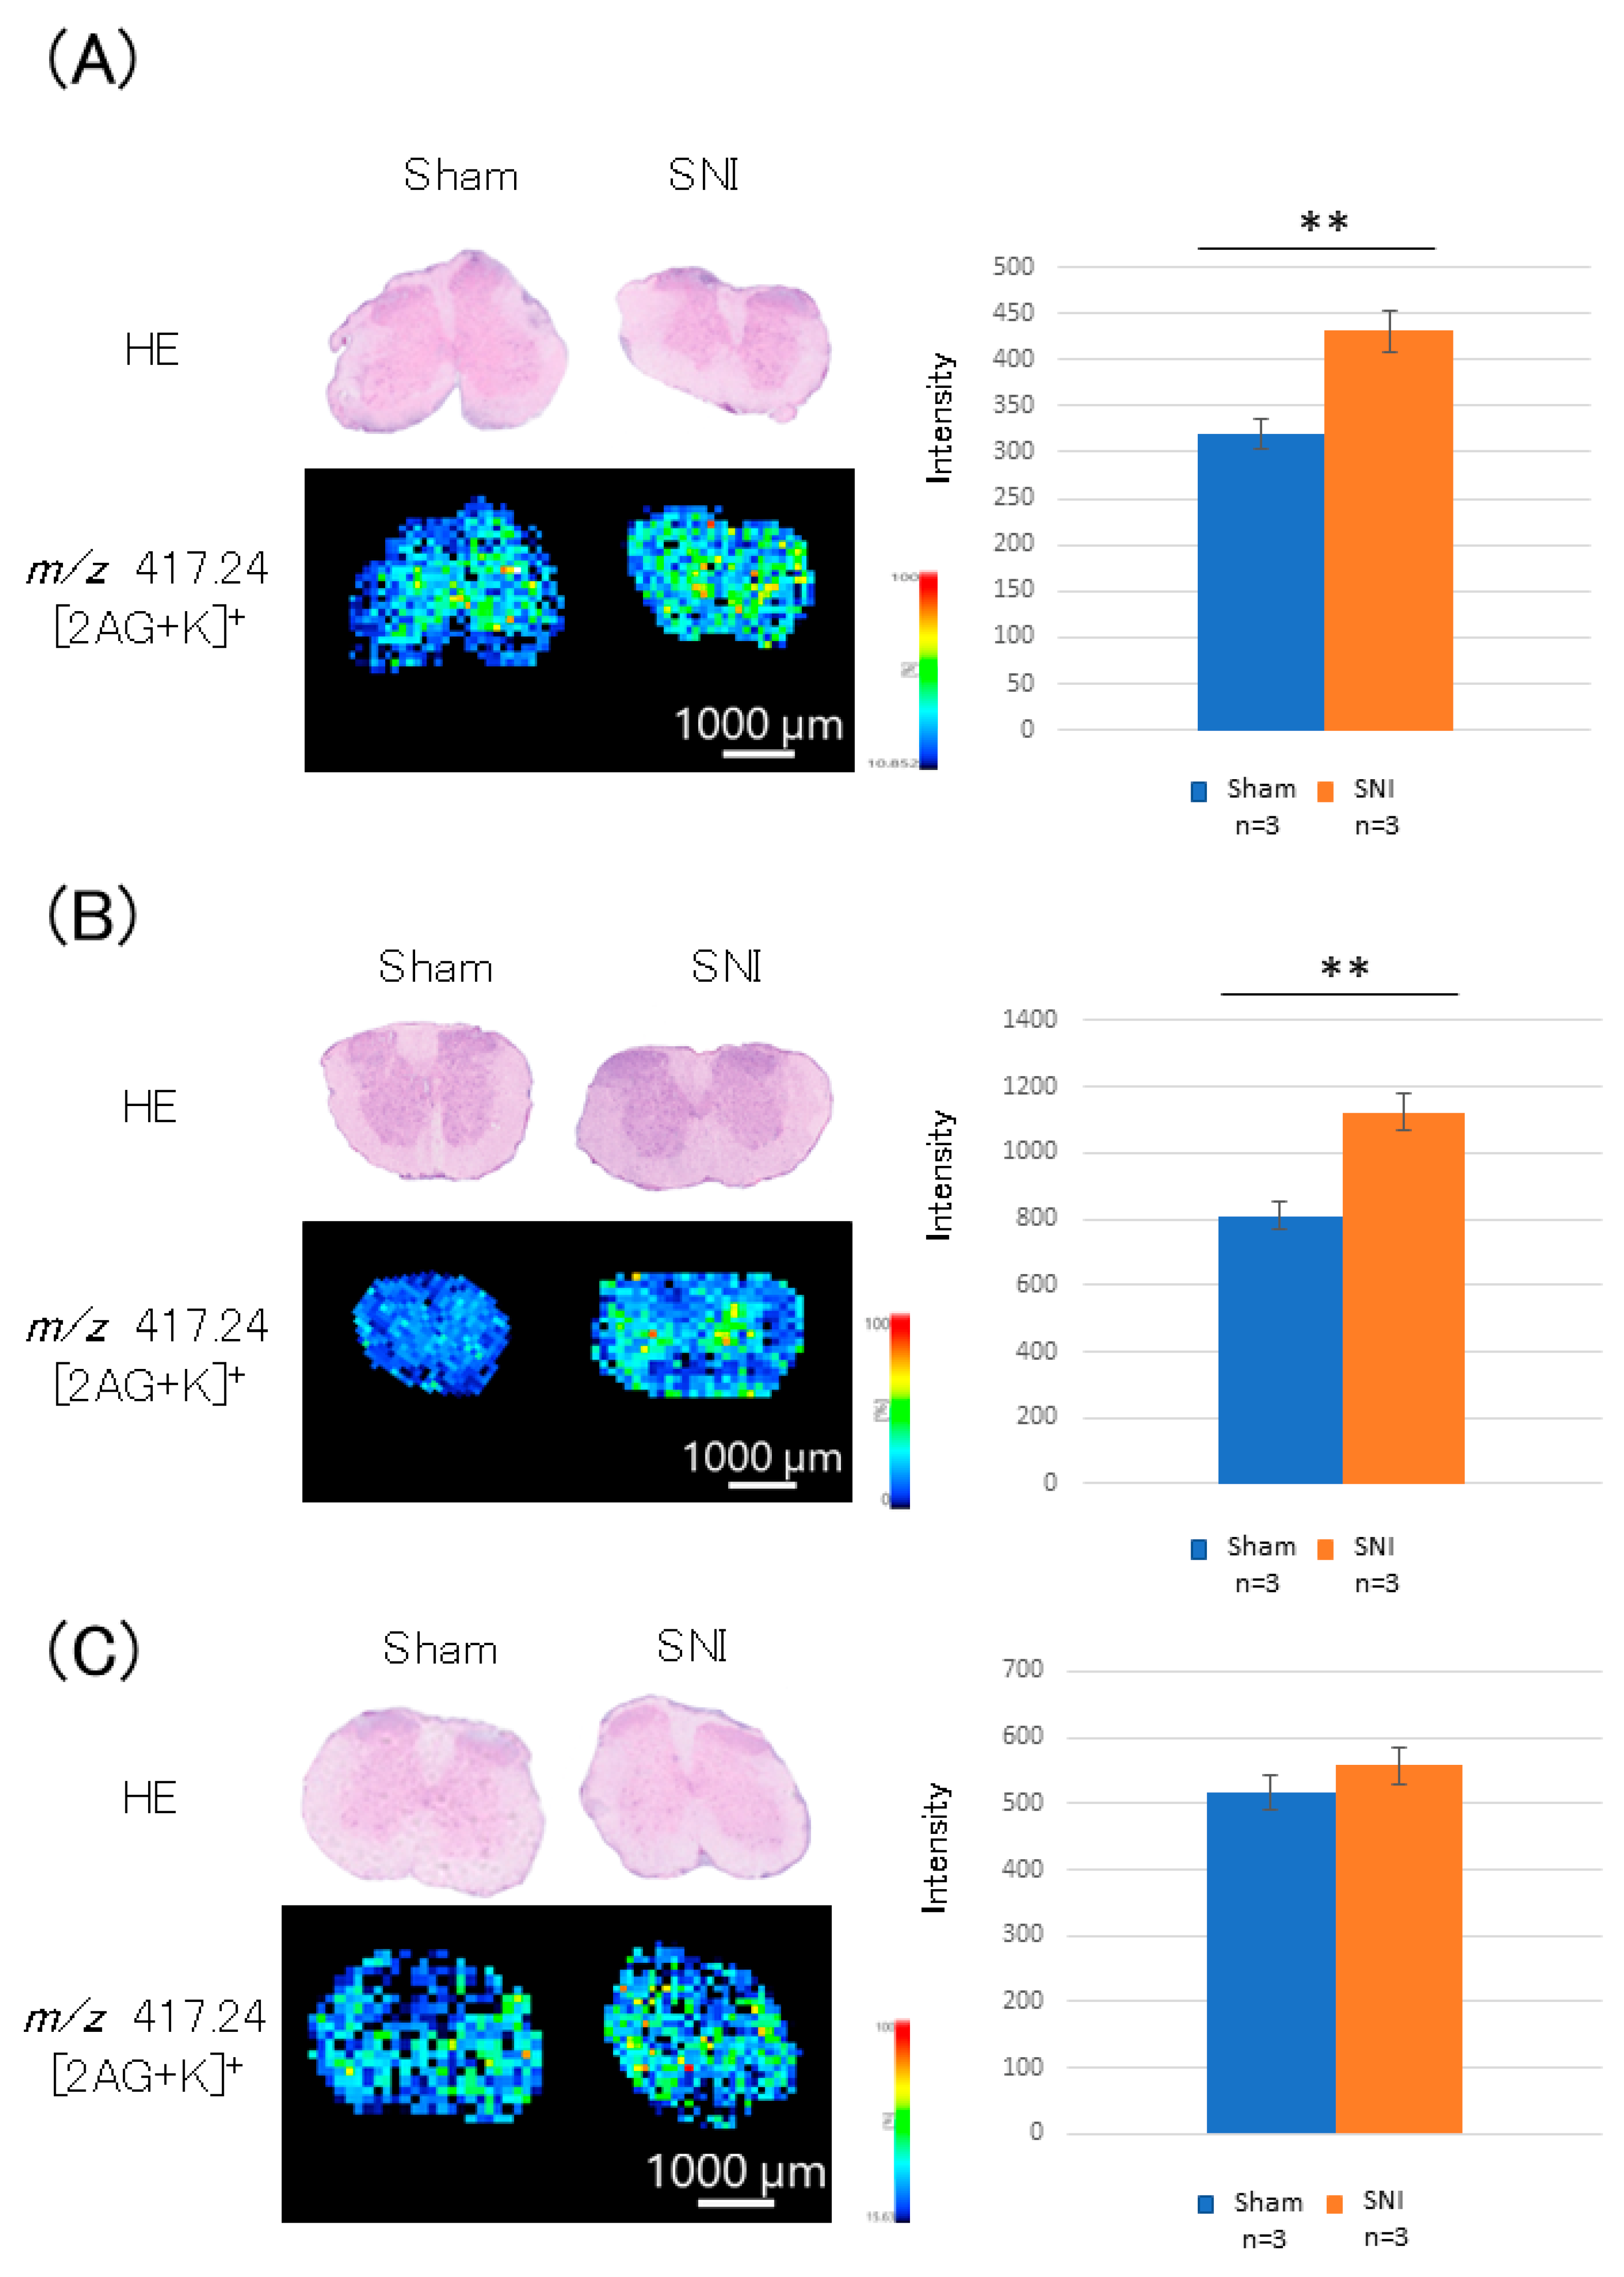
3.4. Distribution of 2-AG in the Lumbar Spinal Cord of SNI Mice
4. Discussion
5. Conclusions
Supplementary Materials
Author Contributions
Funding
Institutional Review Board Statement
Informed Consent Statement
Data Availability Statement
Acknowledgments
Conflicts of Interest
References
- Matsuda, L.A.; Lolait, S.J.; Brownstein, M.J.; Young, A.C.; Bonner, T.I. Structure of a cannabinoid receptor and functional expression of the cloned cDNA. Nature 1990, 346, 561–564. [Google Scholar] [CrossRef] [PubMed]
- Devane, W.A.; Hanus, L.; Breuer, A.; Pertwee, R.G.; Stevenson, L.A.; Griffin, G.; Gibson, D.; Mandelbaum, A.; Etinger, A.; Mechoulam, R. Isolation and structure of a brain constituent that binds to the cannabinoid receptor. Science 1992, 258, 1946–1949. [Google Scholar] [CrossRef] [PubMed]
- Sugiura, T.; Kondo, S.; Sukagawa, A.; Nakane, S.; Shinoda, A.; Itoh, K.; Yamashita, A.; Waku, K. 2-Arachidonoylglycerol: A possible endogenous cannabinoid receptor ligand in brain. Biochem. Biophys. Res. Commun. 1995, 215, 89–97. [Google Scholar] [CrossRef] [PubMed]
- Mechoulam, R.; Ben-Shabat, S.; Hanus, L.; Ligumsky, M.; Kaminski, N.E.; Schatz, A.R.; Gopher, A.; Almog, S.; Martin, B.R.; Compton, D.R. Identification of an endogenous 2-monoglyceride, present in canine gut, that binds to cannabinoid receptors. Biochem. Pharmacol. 1995, 50, 83–90. [Google Scholar] [CrossRef]
- Altamura, C.; Ventriglia, M.; Martini, M.G.; Montesano, D.; Errante, Y.; Piscitelli, F.; Scrascia, F.; Quattrocchi, C.; Palazzo, P.; Seccia, S.; et al. Elevation of Plasma 2-Arachidonoylglycerol Levels in Alzheimer’s Disease Patients as a Potential Protective Mechanism against Neurodegenerative Decline. J. Alzheimer’s Dis. 2015, 46, 497–506. [Google Scholar] [CrossRef]
- Nielsen, J.E.; Rolland, A.D.; Meyts, R.D.; Janfelt, C.; Jørgensen, A.; Winge, S.B.; Kristensen, D.M.; Juul, A.; Chalmel, F.; Jégou, B.; et al. Characterisation and localisation of the endocannabinoid system components in the adult human testis. Sci. Rep. 2019, 9, 12866. [Google Scholar] [CrossRef] [Green Version]
- Islam, A.; Takeyama, E.; Nabi, M.M.; Zhai, Q.; Fukushima, M.; Watanabe, N.; Al Mamun, M.M.; Kikushima, K.; Kahyo, T.; Setou, M. Stress upregulates 2-arachidonoylglycerol levels in the hypothalamus, midbrain, and hindbrain, and it is sustained by green nut oil supplementation in SAMP8 mice revealed by DESI-MSI. Biochem. Biophys. Res. Commun. 2022, 609, 9–14. [Google Scholar] [CrossRef]
- Sagar, D.R.; Staniaszek, L.E.; Okine, B.N.; Woodhams, S.; Norris, L.M.; Pearson, R.G.; Garle, M.J.; Alexander, S.P.; Bennett, A.J.; Barrett, D.A.; et al. Tonic modulation of spinal hyperexcitability by the endocannabinoid receptor system in a rat model of osteoarthritis pain. Arthritis Rheumatol. 2010, 62, 3666–3676. [Google Scholar] [CrossRef] [Green Version]
- Sagar, D.R.; Jhaveri, M.D.; Richardson, D.; Gray, R.A.; De Lago, E.; Fernández-Ruiz, J.; Barrett, D.A.; Kendall, D.A.; Chapman, V. Endocannabinoid regulation of spinal nociceptive processing in a model of neuropathic pain. Eur. J. Neurosci. 2010, 31, 1414–1422. [Google Scholar] [CrossRef]
- Okine, B.N.; Norris, L.M.; Woodhams, S.; Burston, J.; Patel, A.; Alexander, S.P.; Barrett, D.A.; Kendall, D.A.; Bennett, A.J.; Chapman, V. Lack of effect of chronic pre-treatment with the FAAH inhibitor URB597 on inflammatory pain behaviour: Evidence for plastic changes in the endocannabinoid system. Br. J. Pharmacol. 2012, 167, 627–640. [Google Scholar] [CrossRef]
- Wotherspoon, G.; Fox, A.; McIntyre, P.; Colley, S.; Bevan, S.; Winter, J. Peripheral nerve injury induces cannabinoid receptor 2 protein expression in rat sensory neurons. Neuroscience 2005, 135, 235–245. [Google Scholar] [CrossRef] [PubMed]
- Lim, G.; Sung, B.; Ji, R.R.; Mao, J. Upregulation of spinal cannabinoid-1-receptors following nerve injury enhances the effects of win 55,212–2 on neuropathic pain behaviors in rats. Pain 2003, 105, 275–283. [Google Scholar] [CrossRef] [PubMed]
- Zhang, J.; Hoffert, C.; Vu, H.K.; Groblewski, T.; Ahmad, S.; O’Donnell, D. Induction of CB2 receptor expression in the rat spinal cord of neuropathic but not inflammatory chronic pain models. Eur. J. Neurosci. 2003, 17, 2750–2754. [Google Scholar] [CrossRef] [PubMed]
- Decosterd, I.; Woolf, C.J. Spared nerve injury: An animal model of persistent peripheral neuropathic pain. Pain 2000, 87, 149–158. [Google Scholar] [CrossRef]
- Luongo, L.; Palazzo, E.; Tambaro, S.; Giordano, C.; Gatta, L.; Scafuro, M.A.; Rossi, F.S.; Lazzari, P.; Pani, L.; de Novellis, V.; et al. 1-(2′,4′-dichlorophenyl)-6-methyl-N-cyclohexylamine-1,4-dihydroindeno[1,2-c]pyrazole-3-carboxamide, a novel CB2 agonist, alleviates neuropathic pain through functional microglial changes in mice. Neurobiol. Dis. 2010, 37, 177–185. [Google Scholar] [CrossRef]
- Tal, M.; Bennett, G.J. Extra-territorial pain in rats with a peripheral mononeuropathy: Mechano-hyperalgesia and mechano-allodynia in the territory of an uninjured nerve. Pain 1994, 57, 375–382. [Google Scholar] [CrossRef]
- Herkenham, M.; Lynn, A.B.; Little, M.D.; Johnson, M.R.; Melvin, L.S.; de Costa, B.R.; Rice, K.C. Cannabinoid receptor localization in brain. Proc. Natl. Acad. Sci. USA 1990, 87, 1932–1936. [Google Scholar] [CrossRef] [Green Version]
- Hohmann, A.G.; Briley, E.M.; Herkenham, M. Pre- and postsynaptic distribution of cannabinoid and mu opioid receptors in rat spinal cord. Brain Res. 1999, 822, 17–25. [Google Scholar] [CrossRef]
- Sañudo-Peña, M.C.; Strangman, N.M.; Mackie, K.; Walker, J.M.; Tsou, K. CB1 receptor localization in rat spinal cord and roots, dorsal root ganglion, and peripheral nerve. Zhongguo Yao Li Xue Bao 1999, 20, 1115–1120. [Google Scholar]
- van der Stelt, M.; Trevisani, M.; Vellani, V.; De Petrocellis, L.; Schiano Moriello, A.; Campi, B.; McNaughton, P.; Geppetti, P.; Di Marzo, V. Anandamide acts as an intracellular messenger amplifying Ca2+ influx via TRPV1 channels. EMBO J. 2005, 24, 3026–3037. [Google Scholar] [CrossRef] [Green Version]
- Lichtman, A.H.; Leung, D.; Shelton, C.C.; Saghatelian, A.; Hardouin, C.; Boger, D.L.; Cravatt, B.F. Reversible inhibitors of fatty acid amide hydrolase that promote analgesia: Evidence for an unprecedented combination of potency and selectivity. J. Pharmacol. Exp. Ther. 2004, 311, 441–448. [Google Scholar] [CrossRef] [PubMed]
- Jayamanne, A.; Greenwood, R.; Mitchell, V.A.; Aslan, S.; Piomelli, D.; Vaughan, C.W. Actions of the FAAH inhibitor URB597 in neuropathic and inflammatory chronic pain models. Br. J. Pharmacol. 2006, 147, 281–288. [Google Scholar] [CrossRef] [PubMed] [Green Version]
- Huggins, J.P.; Smart, T.S.; Langman, S.; Taylor, L.; Young, T. An efficient randomised, placebo-controlled clinical trial with the irreversible fatty acid amide hydrolase-1 inhibitor PF-04457845, which modulates endocannabinoids but fails to induce effective analgesia in patients with pain due to osteoarthritis of the knee. Pain 2012, 153, 1837–1846. [Google Scholar] [CrossRef] [PubMed]
- Petrosino, S.; Palazzo, E.; de Novellis, V.; Bisogno, T.; Rossi, F.; Maione, S.; Di Marzo, V. Changes in spinal and supraspinal endocannabinoid levels in neuropathic rats. Neuropharmacology 2007, 52, 415–422. [Google Scholar] [CrossRef]
- Walker, J.M.; Hohmann, A.G.; Martin, W.J.; Strangman, N.M.; Huang, S.M.; Tsou, K. The neurobiology of cannabinoid analgesia. Life Sci. 1999, 65, 665–673. [Google Scholar] [CrossRef]
- Mitrirattanakul, S.; Ramakul, N.; Guerrero, A.V.; Matsuka, Y.; Ono, T.; Iwase, H.; Mackie, K.; Faull, K.F.; Spigelman, I. Site-specific increases in peripheral cannabinoid receptors and their endogenous ligands in a model of neuropathic pain. Pain 2006, 126, 102–114. [Google Scholar] [CrossRef] [Green Version]
- Xu, N.; Tang, X.H.; Pan, W.; Xie, Z.M.; Zhang, G.F.; Ji, M.H.; Yang, J.J.; Zhou, M.T.; Zhou, Z.Q. Spared nerve injury increases the expression of microglia M1 markers in the prefrontal cortex of rats and provokes depression-like behaviors. Front. Neurosci. 2017, 11, 209. [Google Scholar] [CrossRef] [Green Version]
- Ito, S. Biochemistry of pain, progress in these 20 years. Seikagaku J. Jpn. Biochem. Soc. 2017, 89, 841–855. [Google Scholar] [CrossRef]
- Boullon, L.; Finn, D.P.; Llorente-Berzal, Á. Sex differences in a rat model of peripheral neuropathic pain and associated levels of endogenous cannabinoid ligands. Front. Pain Res. 2021, 2, 673638. [Google Scholar] [CrossRef]


Publisher’s Note: MDPI stays neutral with regard to jurisdictional claims in published maps and institutional affiliations. |
© 2022 by the authors. Licensee MDPI, Basel, Switzerland. This article is an open access article distributed under the terms and conditions of the Creative Commons Attribution (CC BY) license (https://creativecommons.org/licenses/by/4.0/).
Share and Cite
Kurosu, K.; Islam, A.; Sato, T.; Kahyo, T.; Banno, T.; Sato, N.; Matsuyama, Y.; Setou, M. Expression and Kinetics of Endogenous Cannabinoids in the Brain and Spinal Cord of a Spare Nerve Injury (SNI) Model of Neuropathic Pain. Cells 2022, 11, 4130. https://doi.org/10.3390/cells11244130
Kurosu K, Islam A, Sato T, Kahyo T, Banno T, Sato N, Matsuyama Y, Setou M. Expression and Kinetics of Endogenous Cannabinoids in the Brain and Spinal Cord of a Spare Nerve Injury (SNI) Model of Neuropathic Pain. Cells. 2022; 11(24):4130. https://doi.org/10.3390/cells11244130
Chicago/Turabian StyleKurosu, Kenta, Ariful Islam, Tomohito Sato, Tomoaki Kahyo, Tomohiro Banno, Noriko Sato, Yukihiro Matsuyama, and Mitsutoshi Setou. 2022. "Expression and Kinetics of Endogenous Cannabinoids in the Brain and Spinal Cord of a Spare Nerve Injury (SNI) Model of Neuropathic Pain" Cells 11, no. 24: 4130. https://doi.org/10.3390/cells11244130