
Water Oxidation over Au-Pd/TiO2 as a Substitute for Iridium-Based Catalysts

1
Department of Chemical Engineering, University of Waterloo, Waterloo, ON N2L 3G1, Canada
2
Institute of Functional Interfaces, Karlsruhe Institute of Technology (KIT), 76344 Eggenstein-Leopoldshafen, Germany
*
Author to whom correspondence should be addressed.
Catalysts 2024, 14(1), 87; https://doi.org/10.3390/catal14010087
Submission received: 31 December 2023
/
Revised: 18 January 2024
/
Accepted: 19 January 2024
/
Published: 21 January 2024
(This article belongs to the Special Issue Feature Papers in Catalytic Materials)
Abstract
:Water oxidation is one of the most important reactions needed for a transition to a green economy. The reaction relies on extracting electrons from oxygen anions and is commonly studied using homogenous catalysts based on Ru or Ir metals. Because of Ir scarcity and its relative instability in acidic environments, metals to replace it are sought after. In this study, we have synthesized Au-Pd-based catalysts deposited on TiO2 with different ratios in order to mimic IrO2 valence orbitals (Ir5d) by the hybrid valence orbitals of Au5d and Pd4d and compared their heterogeneous catalytic activity for the evolution of O2 from water in the presence of cerium ammonium nitrate (CAN). Au-Pd-based catalysts were found to be active at a particular nominal atomic ratio. At an atomic ratio of 1 Au to 2 Pd and 1 Au to 3 Pd, the catalysts were active and stable for oxygen production from water. Long-term runs up to 20,000 min still showed the expected stoichiometry between O2 production and CAN consumption (1 to 4). However, catalysts with a reverse ratio were not active. Also, the monometallic catalysts were found to be not active for the reaction. We link the reason for the activity of Au-Pd with this specific ratio to the shape and energy position of their valence band that might be similar to those of IrO2 particles. While the turnover numbers of the Au-Pd-based catalysts were found to be lower than those of IrO2-based catalysts, on the same support in a heterogenous system, there is considerable potential upon further optimization for these two metals to replace IrO2 for a water oxidation reaction.
1. Introduction
Water splitting into H2 and O2 is a much-needed process for the transition to green technology. These processes, for H2 and O2 generation, can be divided into two main reactions. For the reduction of protons to H2 and the oxidation of oxygen anions to O2, the latter reaction is the most difficult because it involves the transfer of four electrons. There has been extensive research in this area and a large number of heterogeneous and homogeneous catalysts were found to be active for O2 production from water [1,2].
There are many comprehensive studies on the evolution of O2 over Ru-based complexes in the presence of Ce4+ as an electron acceptor in an acidic medium using cerium ammonium nitrate (CAN) [3,4,5]. Several reaction mechanisms have been proposed for the generation of O2. In an oxo–water acid base pathway, O-O bond formation takes place between an oxygen atom bound to a ruthenium center and an oxygen atom from adsorbed water [6,7]. The other path includes radical coupling of two Ruv = O species to form an O-O bond. It is also proposed that the oxygen evolution reaction in the presence of Ce4+ takes place by the coupling of an oxo hydrocerium (IV) radical with an Ruv = O species. Ce4+ plays an important role, not only as an oxidizing agent but also as a radical, by forming hydroxocerium (IV) radical, which takes part in radical–radical coupling with monoruthenium complex catalyst to form the O-O bond [6].
In a detailed study of iridium-based homogenous catalysts using CAN as an oxidizing agent, it was found that there is initially no O2 evolution with the addition of CAN, and when the concentration of CAN is increased gradually in the reaction mixture, O2 evolution takes place. The authors proposed that the catalyst first undergoes some transformation and new active sites, most probably IrOx-based, are evolved which catalyze the reaction. To further support the idea, an acidified IrOx-based catalyst was used in similar conditions and the O2 evolution reaction occurred without lag, indicating that IrOx-based active sites were catalyzing the reaction [8,9]. In another work, CAN consumption was found to be higher than needed for stoichiometric O2 evolution; higher equivalents of CAN are required to produce an instantaneous generation of O2. When the CAN/catalyst ratio is small, the O2 evolution takes place a few minutes after the consumption of CAN. These results suggest that there is an intermediate, which is formed during the reaction. It was proposed that water oxidation driven by CAN starts with the formation of the Ir catalyzed phase, which is further transformed to the O-O bond containing moiety, which, in turn, is further transferred to the Ce species that slowly evolves to O2 [10].
In one of our previous studies, we used Cp*Ir-based Klaüi compound immobilized over TiO2 with sacrificial electron donors NaIO4 and CAN for the oxygen evolution reaction. Catalyst leaching took place during the initial reaction and the spent catalyst was found to be relatively active for further water oxidation reactions. The increase in activity was explained in terms of the dispersion of Ir nanoparticles during the first run, and also due to the creation of active sites for O2 evolution [11]. It has been argued by a few researchers that water oxidation catalysts with Cp*Ir complexes transform into heterogeneous IrOx nanoparticles when CAN is used as an oxidizing agent [7]. Similar observations were reported on the Cp*Ir catalyst, namely, that when used with CAN, it transforms into a better water oxidation catalyst after a first run with higher TOFs. It was later concluded that iridium hydroxide nanoparticles were formed that increased the water oxidation rate [12].
Metal oxides with high valency show activity as water oxidation catalysts, and they include RuO2, IrO2, Co3O4, Rh2O3, and Mn2O3 under photoirradiation in the presence of an electron scavenger [13,14,15]. For example, it was shown that high valent states of citrate-stabilized IrO2 oxidize water photocatalytically in the presence of sodium persulphate as an electron scavenger. One of the reasons invoked for the activity of IrO2-based catalysts is the position of the valence band with respect to the redox potential of water [16,17,18,19]. IrO2 is a metallic oxide, and although its bonds have considerable covalent character, it is reasonable to consider the O atoms as O2− and the Ir atom as Ir4+. The valence band of IrO2 is largely composed of Ir5d and O2p orbitals crossing the Fermi level (Ef) up to −9 eV below it. The Ir5d are close to the Fermi level and have a narrow band [20] around 2–3 eV below Ef. In a previous work, we showed that IrO2 deposited on TiO2 is active for a water oxidation reaction [21] in the presence of CAN. IrO2 was found to form small clusters of less than 1 nm in size highly dispersed on the oxide support. Many other noble metals are known to have activity in both hydrogen ion reduction and oxygen anion oxidation [22], particularly, Au, Pd, and Pt. In this work, we focus on Au and Pd because their of their high miscibility. Au particles have their valence band Au5d extending from 2 to 8 eV below the Fermi level, with their energy position depending on their particle size [23,24]. The valence band of Pd particles is composed of Pd4d and is positioned [25] about 2–4 eV below Ef, which also depends on the particle size. Au and Pd form an alloy that has been studied in detail by numerous authors [26,27,28,29]. The position of the valence band of the Au-Pd alloy changes depending on the metal compositions, with some overlapping with that of IrO2. In addition, Au-Pd-based catalysts have shown high activity for oxidation reactions in general [30,31,32,33,34].
Focusing on water splitting to H2 and O2, IrO2 has been shown to be the most active metal in an acidic environment. The rates of water electrolysis are better in acidic and alkaline environments compared to neutral pH (because of ions transport). At present, there is no proven technology for membranes working in alkaline environments (although considerable progress has been made in the last decade [35,36]). Stable membranes in acidic environments are available, yet, except for IrO2, no other metals, so far, have been found to combine high activity and relative stability. Because the world production of Ir is very small (the annual production is about 7 tons, while that of Au is about 3000 tons), a global-scale technology based on IrO2 is not possible. Therefore, replacing it with other metals that may have similar activity is needed.
In this study, we focus on the O2 evolution reactions performed over Au-Pd/TiO2 to compare it with those of IrO2/TiO2 and IrO2/CeO2 heterogeneous catalysts using cerium ammonium nitrate (CAN) as a sacrificial electron acceptor without photo irradiation. The reactions were performed by changing the concentrations of CAN and the metal composition in an effort to find, albeit preliminarily, an optimal range of the ratio of Au to Pd that performs similarly to IrO2-based catalysts.
2. Results
2.1. Catalysts Composition
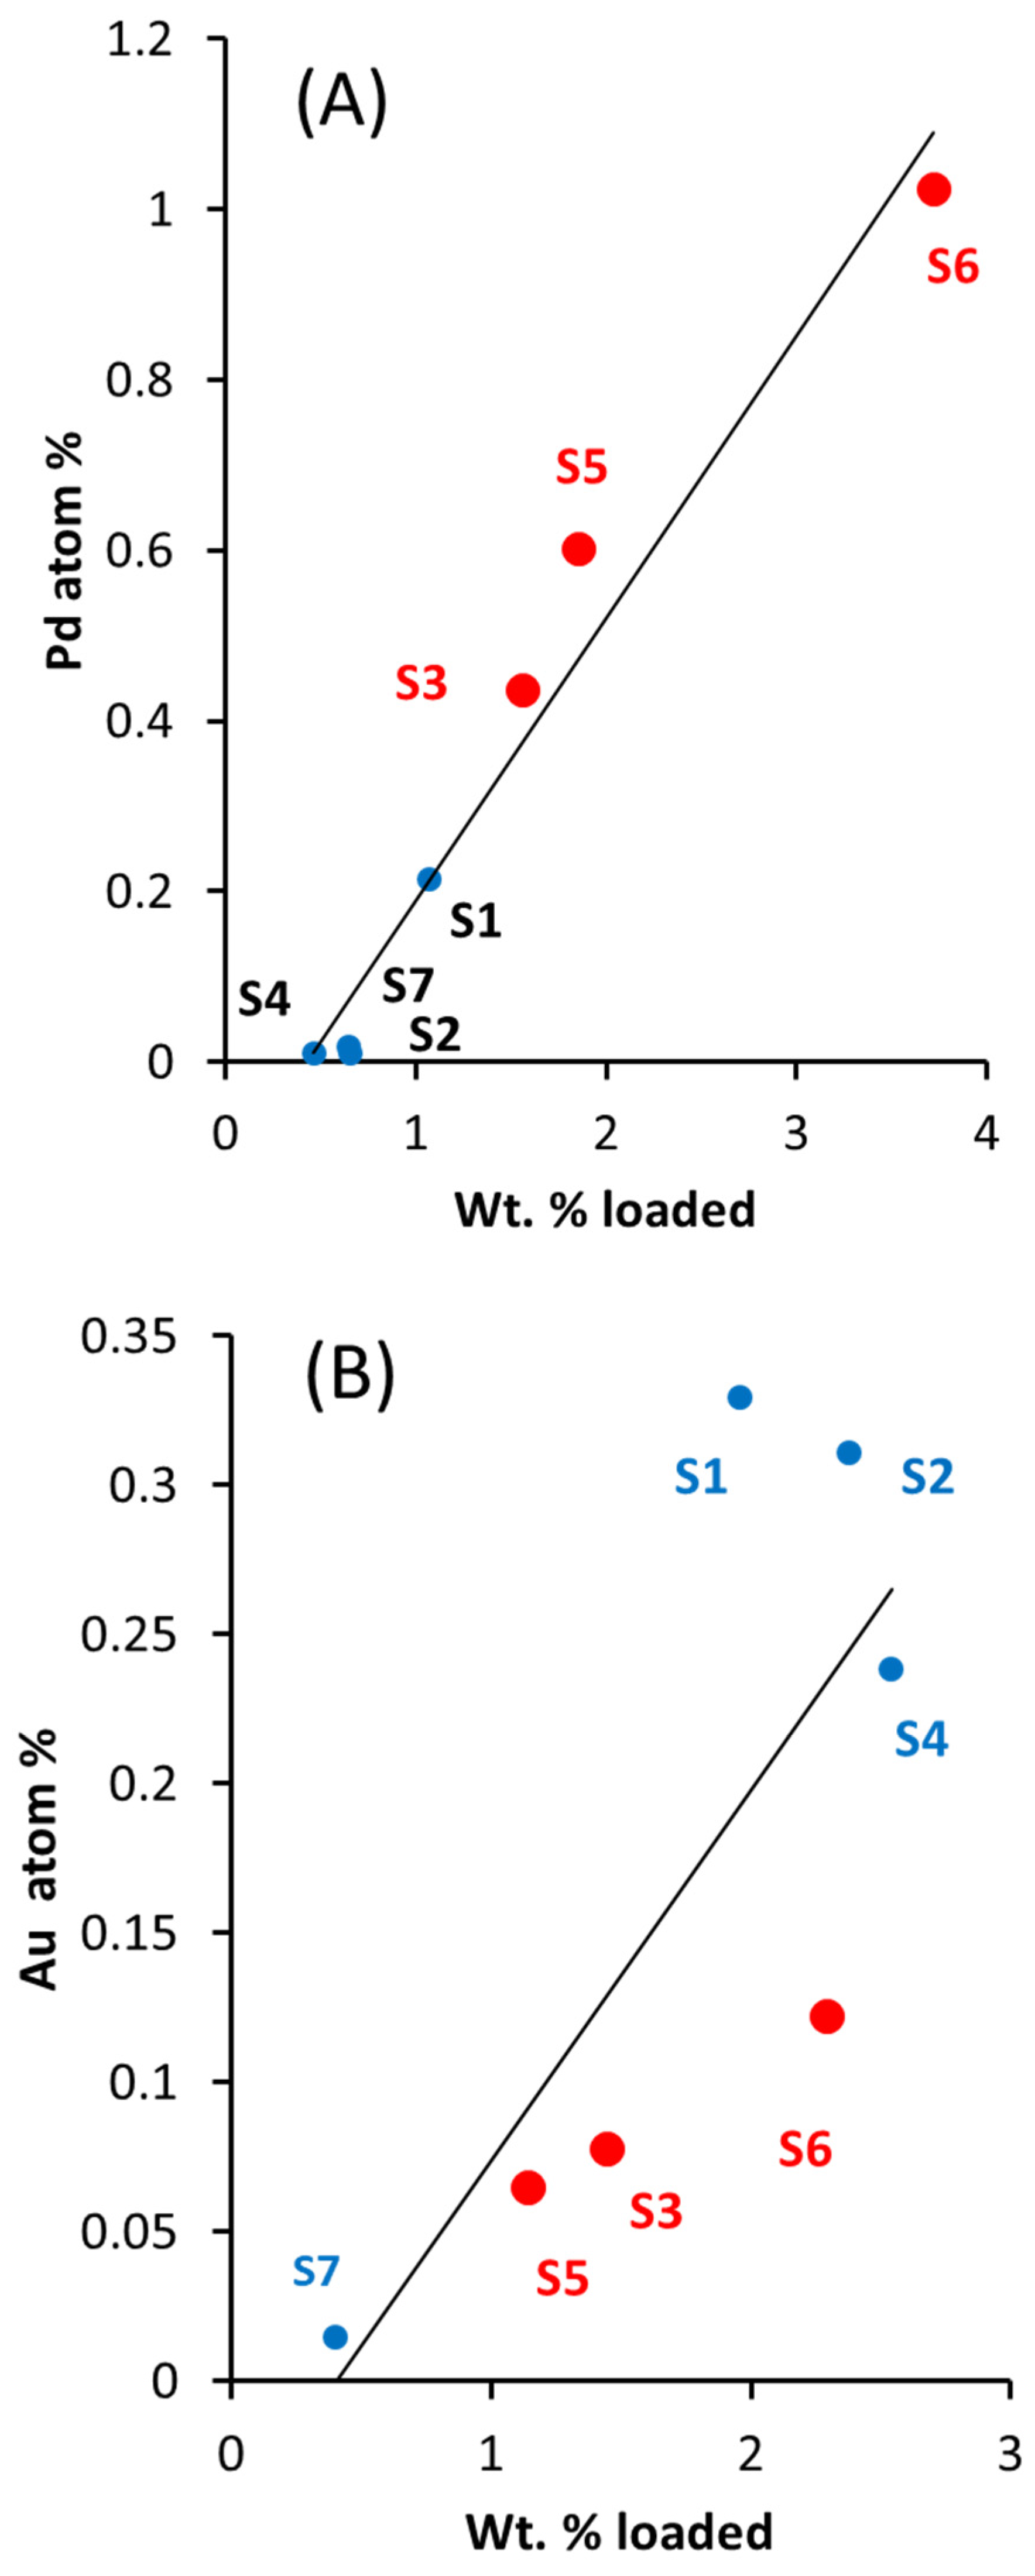
The core and valence photoelectron binding energy levels of the series of catalysts were monitored by XPS. Quantitative data are presented in Table 1. Nine catalysts were analyzed: two for the monometals Au and Pd and seven for the bi-metals. Figure 1A–C present the trend in atomic% versus weight% and the relation between the quantified atomic% of Au and Pd on top of TiO2. It is important to mention that Au and Pd are miscible and easily alloyed [23,25,28]. This has been seen numerous times for catalysts when both metals are deposited on top of a support by transmission electron microscopy, for example [37,38]. Also, the presence of alloy results in the damping of the plasmon resonance peak of Au particles [39,40] (typically, about 3–5 nm) at 500–600 nm. A similar result is presented here (Figure S2). UV-Vis spectra of TiO2 (anatase + rutile), Au/TiO2, and Pd/TiO2 are also included as a reference. TiO2 has a wide band gap energy and shows absorbance mainly in the UV. Due to the presence of rutile (15 wt. %), the absorption edge extends to 410 nm. The Au-TiO2 catalyst shows the expected localized surface plasmonic resonance (LSPR) response in the visible region (centered at around 550 nm), with a wavelength depending upon its particle size, morphology, and dielectric constant of the medium. The absorbance spectrum of Pd/TiO2 was slightly shifted to 420 nm, which may be due to the presence of Pd/PdO [41]. In the Au-Pd/TiO2 samples, the Au plasmon peak was considerably reduced, and also the PdO absorption edge was not visible. This was noticed in particular for the catalyst containing 2.29 wt. % of Au and where the plasmon is largely absent. These absorption changes have been explained as being due to a charge transfer from Au to Pd [42]. We have not conducted a detailed study of the Au-Pd/TiO2 by TEM. However, a few catalysts of a similar series were imaged in the past [43]. There are two types of particles. Small ones seem to be exclusively composed of Pd atoms (of about 1.5 nm in mean size) and large ones contain Au (of about 3 nm in mean size). It is not possible to identify these large particles as exclusively composed of an Au-Pd alloy, although, as shown by the UV-Vis spectra, the considerable quenching of the Au plasmon indicates the likely presence of an alloy.
In this work, there is a good linear relationship between the increase in loading (wt. %) and the surface and near surface signal from Pd3d (XPS), indicating a good dispersion of Pd of the Pd-Au/TiO2 series (Figure 1A). While there is, in general, an increase of the Au signal (XPS Au4f) with increasing Au loading, the relationship is less linear (Figure 1B). Figure 1C shows the relationship between Au and Pd from their Au4f and Pd3d XPS peaks. There are two regions, one with a high ratio of Au/Pd (catalysts labeled S1, S2, and S4) and one with a low ratio of Au/Pd (catalysts labeled S3, S5, and S6). As will be shown later, these catalysts were found to be active for water oxidation.
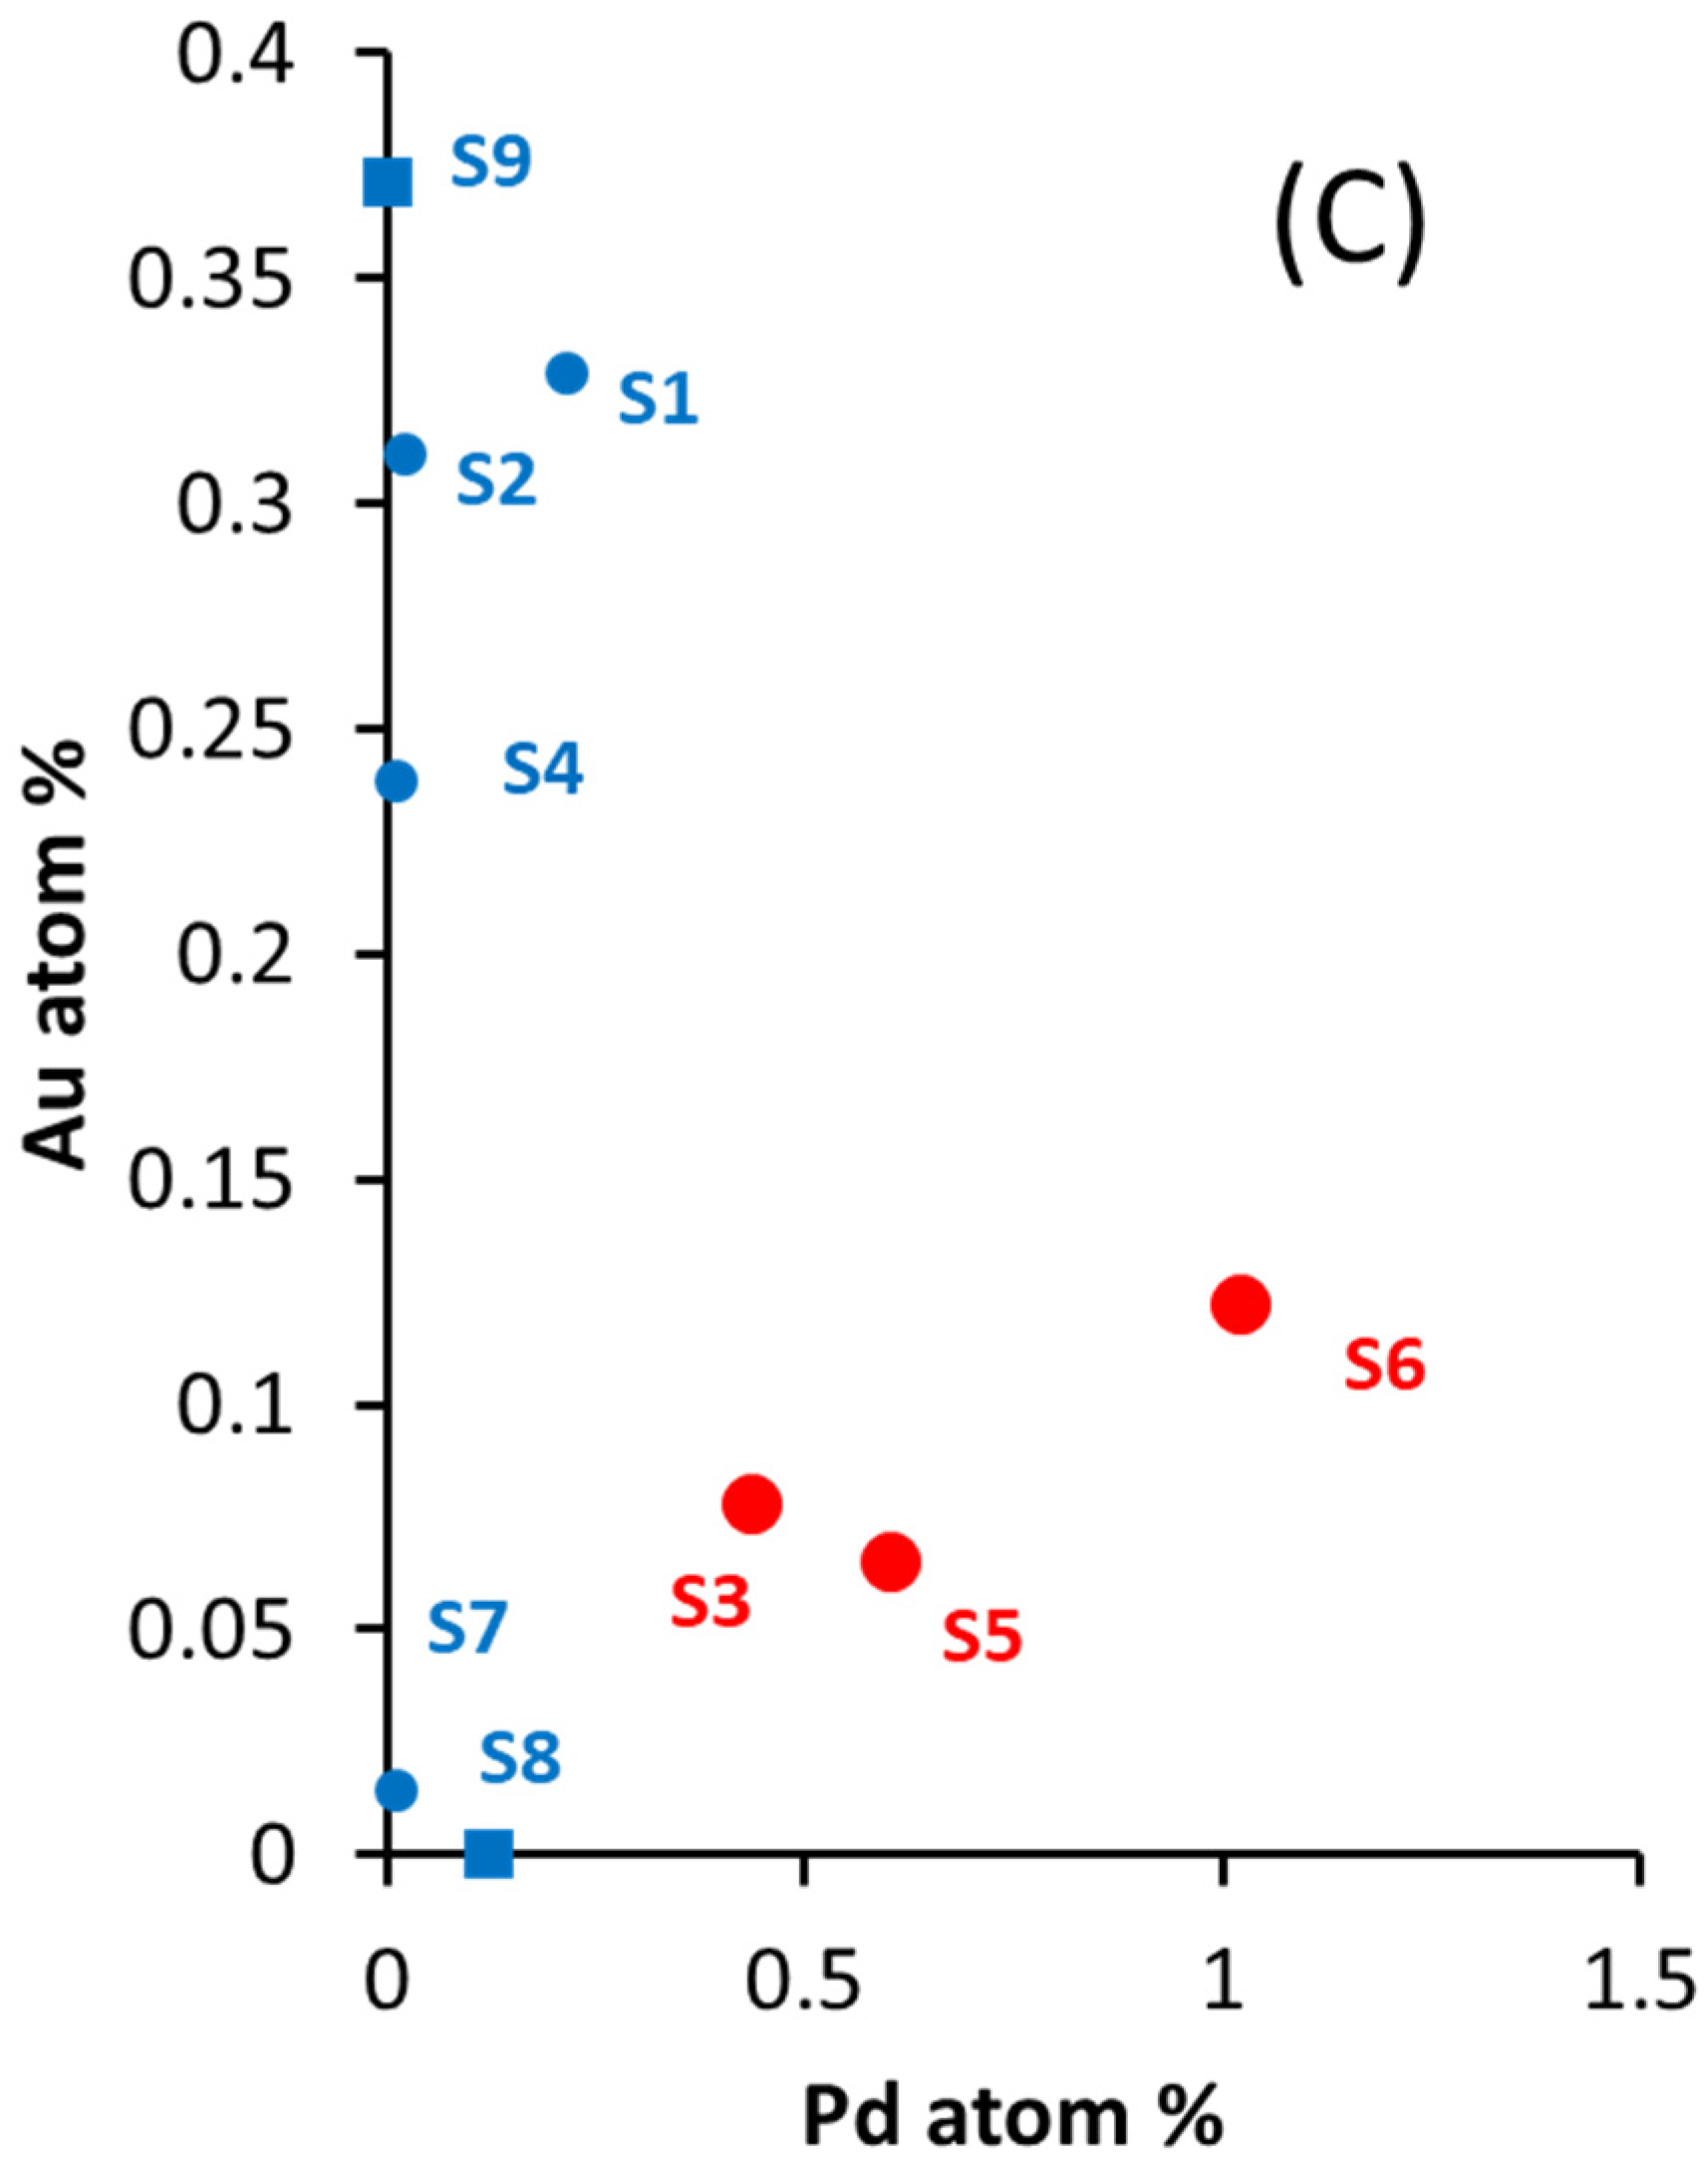
Figure 2 presents the valance band of the same series of catalysts. In Figure S3, spectra of pure Au, Pd, and Au-Pd alloy valence bands are taken from others’ work [24]. Au 5d bands change with Au particle size and composition, as do the Pd4d bands. The Pd4d bands extend from 1 to 8 eV in binding energy and the Au 5d bands from 1 to 10 eV below the Fermi level. When the ratio Au/Pd is 3 to 1 up to 1.5 to 1, the band is closer to that of Pd, and when the Au ratio increases, the spectra resemble more those of Au. Figure S3B shows the valence band of the monometallic catalysts of this work. The figure is dominated by the O2p bands (the two bands centered at 5 and 8 eV binding energy) of TiO2, with the shape of these two bands depending on the phase composition (anatase and rutile) [44] and stoichiometry of TiO2. The contribution of Au 5d in the spectrum of Au/TiO2 is seen. The positions and shape of the valence band of Au depend on its particle size, morphology, and crystallographic direction [45]. The 6s is at the Fermi level, while the 5d5/2 is located about 3–4 eV below. The separation ∆E (between the Au 5d5/2 and Au5d3/2) is also a function of the particle size and increases with increasing size due to the d–d interaction [46]. The 5d structure and position also change with the oxidation state of Au [47]. In this work, we only consider a qualitative analysis. The high Au/Pd catalyst series in this work are shown in Figure 2A, while Figure 2B shows the low Au/Pd series. As seen in Figure 2A, there are additional structures to the O2p (of TiO2) when Au loading increases in the 4–8 eV region. This is clear for the S4 catalyst because it has the highest % of Au in the series investigated (2.54 wt. %). For the series with a high ratio of Pd with respect to Au, there is a pronounced signal before the onset of the O2p band at about 2–3 eV, and this is due to Pd4d lines. The most important point is that the shape of the bands for the high Pd-to-Au ratio resembles those of IrO2 [15,19]. As can be seen below, these catalysts are found to be active for water oxidation, while those having a high Au-to-Pd ratio (in Figure 2A) were not active.
Quantitative analyses are based on XPS Au4f and XPS Pd3d, as presented in Table 1. Qualitatively, it is difficult to obtain information from the binding energy peak position, full-width half maximum (FWHM), and spin-orbit splitting of Au because of the initial and final size effects that change with the particle size and the degree of interaction with the support, in addition to the oxidation state. Figure S4 presents an example of a Au-Pd/TiO2 catalyst. We do not attempt to correlate the activity of the Au-Pd series to their initial peak shape or position because of these complexities and because the metal particles’ chemical state would change during the reaction; therefore, limited information that would be relevant to understanding the electron transfer process may be extracted.
2.2. Catalytic Activity of Au-Pd Catalysts
2.2.1. Oxygen Production over Au-Pd/TiO2
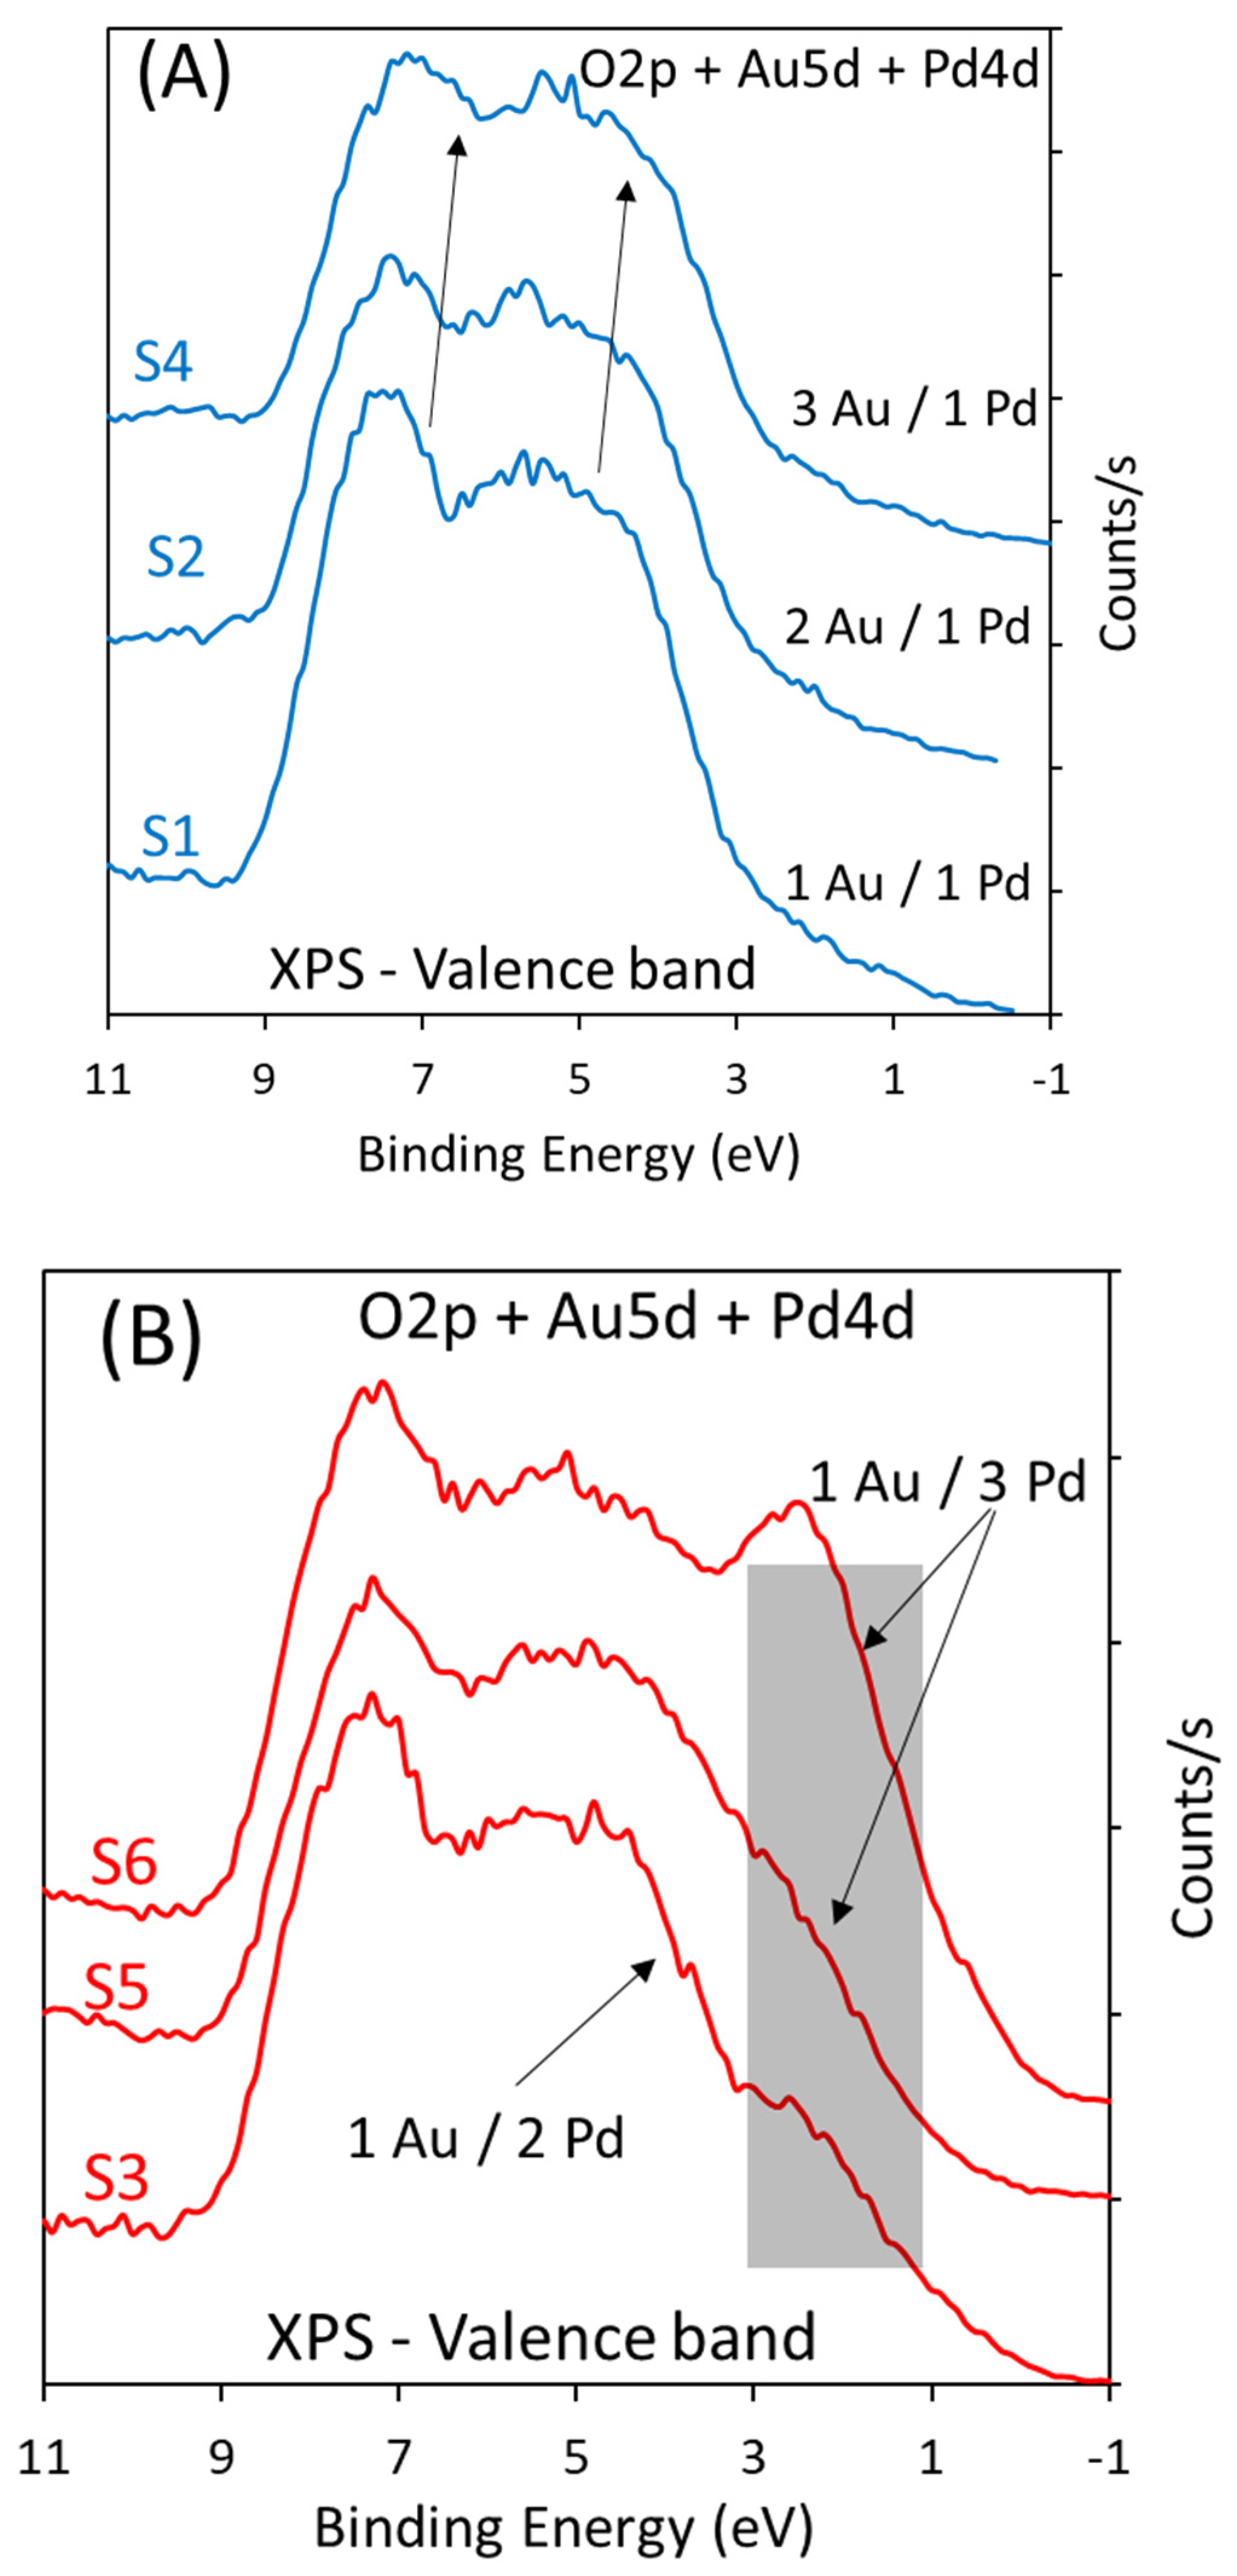
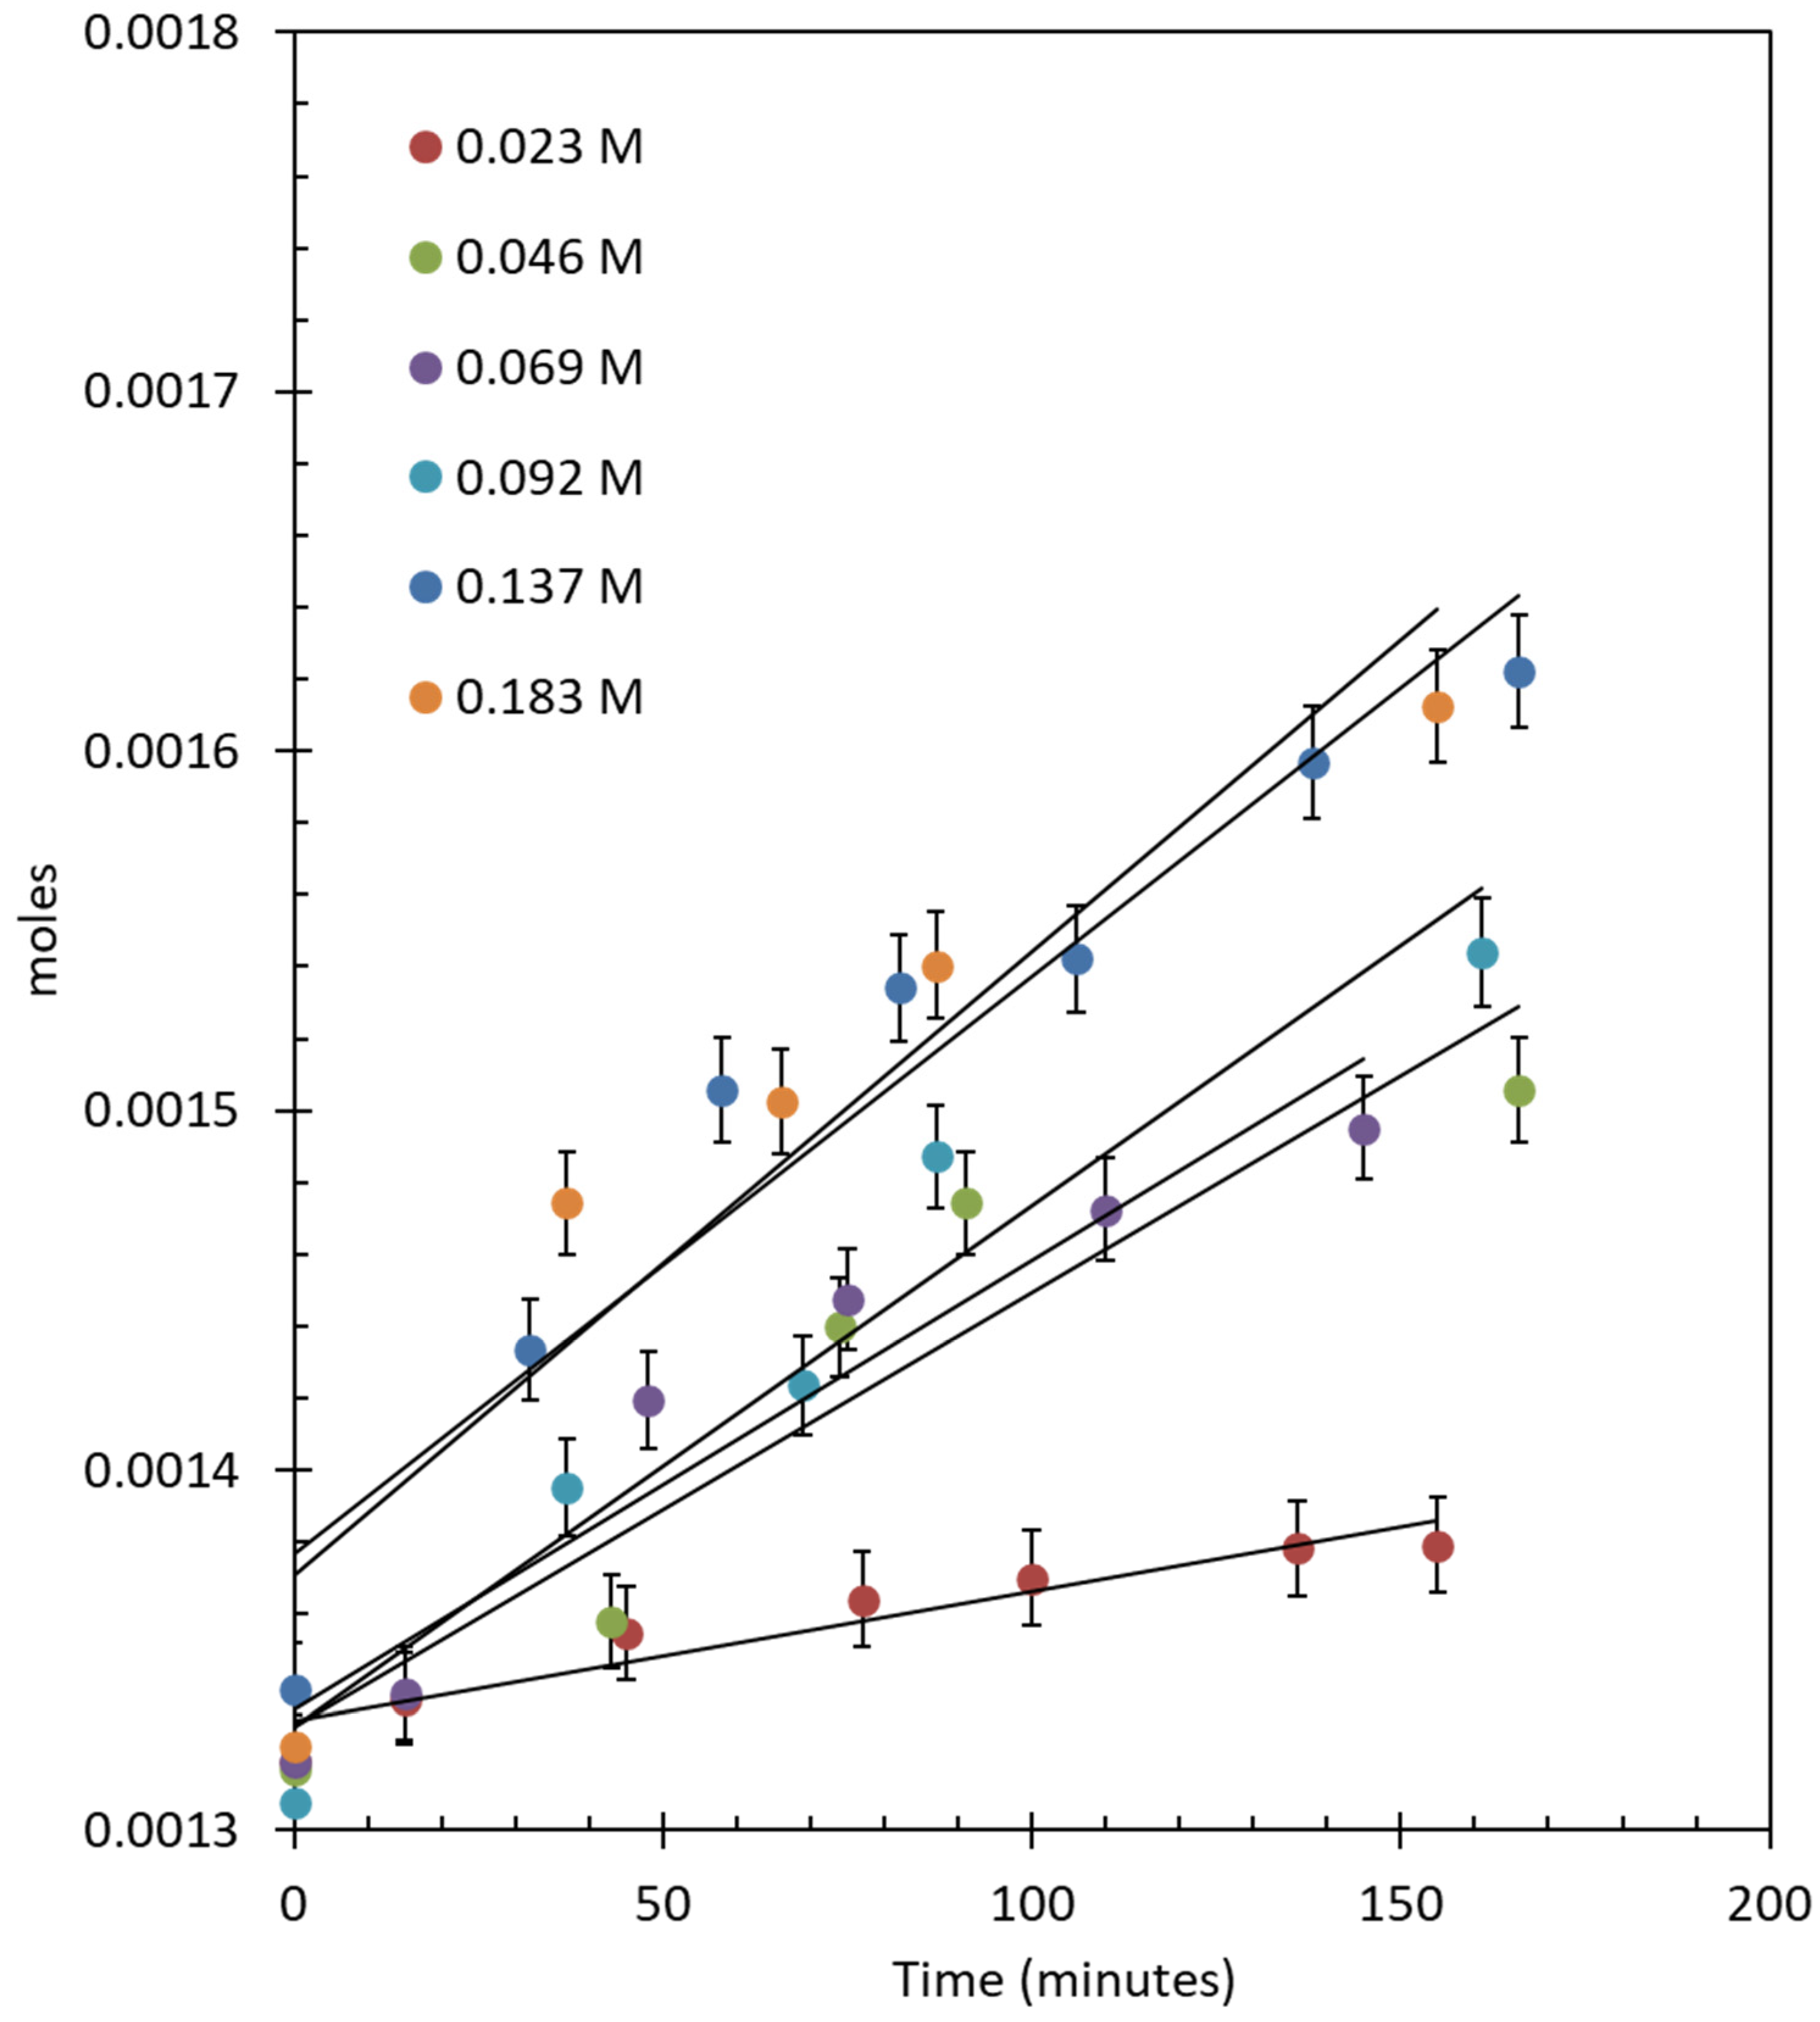
The 1.45 wt. % Au–1.57 wt. % Pd-TiO2 catalyst was used for an O2 evolution reaction employing CAN as an electron scavenger. Figure 3 shows the O2 evolution reactions at different concentrations of CAN using 20 mg of catalyst; the reactions were carried out in air without light irradiation or heating. Air was preferred, in certain runs, so that the background signal of O2 (due to air) is constant. The rate of reaction increased by increasing the concentration of CAN from 0.023 to 0.18 M. The initial O2 evolution rate increased from 3.61 × 10⁻⁷ moles/min to 1.96 × 10⁻⁶ moles/min.
The reactions were continued for a longer time to observe the stability of the catalyst and to quantify the consumption of CAN. During the reaction, the intense orange color of CAN changed to light yellow and, finally, the solution became transparent because Ce(III) is colorless [48]. The number of moles of O2 evolved was very close to ¼ of the concentration of the CAN at the end of the experiment, which shows that four electrons were accepted by four Ce4+ species to form one molecule of O2. The turnover number (TON) and turnover frequency (TOF) of the reactions were also calculated assuming that both Au and Pd are the active sites for the reaction. Table 2 shows the TONs and TOFs of the reactions: the TONs were 13.02, 21.20, 37.75, 71.77, 107.81, and 121.33 after 450 min of reactions and the TOFs were 0.07, 0.14, 0.16, 0.17, 0.34, and 0.35 min−1 after 150 min for reactions performed with increasing CAN concentrations. It also shows the initial Ce4+-to (Au + Pd)-atomic ratio (Table S1 contains an example of the calculations). A similar reaction was performed using cerium nitrate hexahydrate as the Ce3+ source and did not yield any O2.
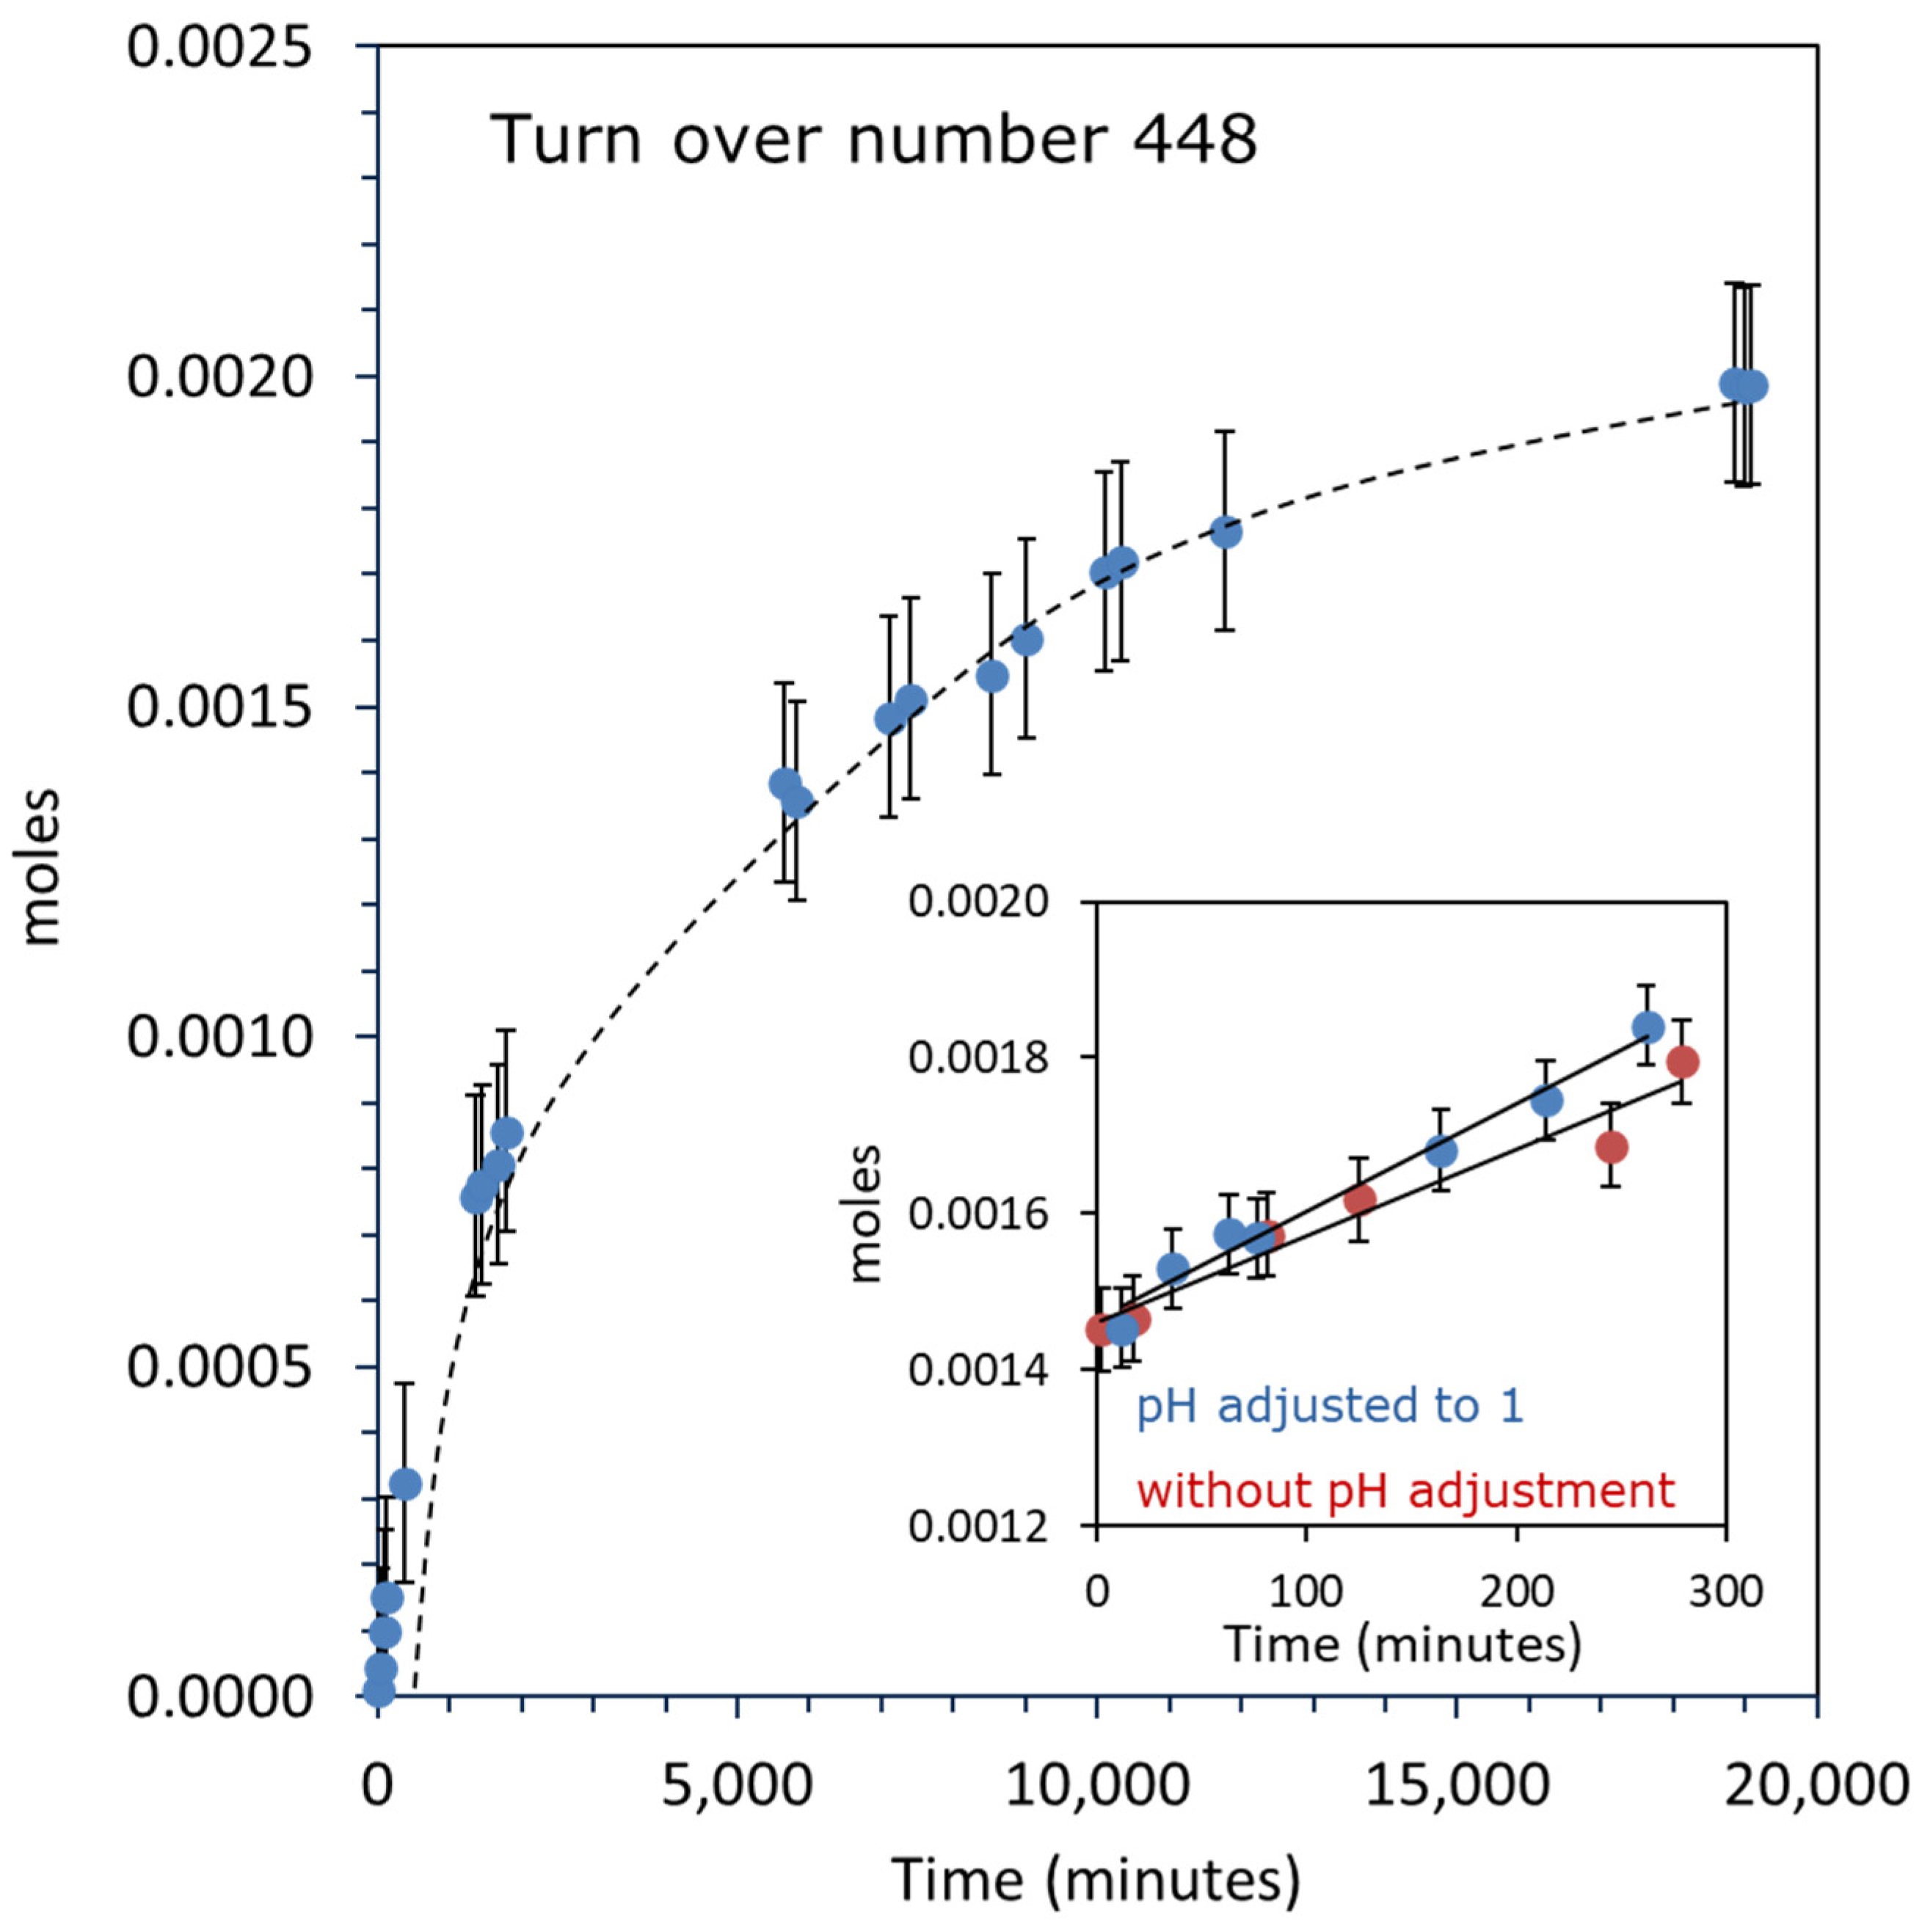
Figure 4 shows the O2 evolution reaction over 1.45 wt. % Au–1.57 wt. % Pd/TiO2 catalyst; the concentration of CAN was 0.456 M (5000 mg of CAN in 20 mL of water), the reaction was started after purging the reactor with N2, the reaction was continued for 19,000 min, and a continuous O2 evolution was seen. The theoretical volume of O2 that can be formed using CAN by assuming Ce4+ as an electron acceptor to produce O2 is 51 mL (2.28 × 10⁻³ moles) and the total volume of O2 formed after 19,000 min of the reaction was 44.57 mL (1.99 × 10⁻³ moles). This shows that the reaction is catalytic and the evolution of O2 matches the total amount of CAN used in the reaction. The TON for this reaction was 448 after the completion of the reaction. The reaction is proposed to take place via Equation (1), in which Ce4+ acts as an electron acceptor and is reduced to Ce3+. The potential of Ce4+ to Ce3+ is lower than the redox potential of H2O/OH, H2O/H2O2, and H2O/O2 [49].
2 H2O + 4 Ce4+ → 4 Ce3+ + 4 H+ + O2
The inset in the figure shows the O2 evolution reactions catalyzed by 1.45 wt. %Au–1.57 wt. % Pd/TiO2 with 0.456 M CAN using 40 mg of catalyst. In one case, CAN was directly added to water, which is at pH 7, and in another case, the pH was adjusted to 1 by adding a few drops of HNO3 prior to adding CAN.
The rate of reaction was 1.37 × 10⁻⁶ moles/min and 1.11 × 10⁻⁶ moles/min, respectively. Wasylenko et al. conducted the O2 evolution reaction based on a ruthenium complex by using different acidic media with CAN. They reported that the evolution rate of O2 gradually increases in H2SO4, CF3SO3H, HClO4, and HNO3, respectively. The high reactivity in HNO3 was explained due to the NO3− ions, which enable fast electron transfer steps [50]. The rate constant for O-O bond formation was found to be two times faster in HNO3 at pH 1 compared to other acids. It was proposed that the reaction took place by assisted atom–proton transfer (APT), in which NO3 acts as a base and accepts protons from H2O, which results in avoiding the formation of higher energy intermediates [40,51] [RuIIIOOH2]3+. Also, CAN is usually used in an acidic medium, with pH as low as 1 to avoid the hydrolysis of Ce4+ species. It was also proposed that some of the hydrolyzed species such as [Ce(NO3)5OH]2− also take part in O-O bond formation by interacting with Ruv = O species of the catalyst. In the present study, we did not observe a considerable difference due to the initial acidification of the medium and this may indicate that in a heterogeneous system (or at least in the case of Au-Pd on top of TiO2), the metal particles do not undergo considerable changes at the beginning of the reaction.
2.2.2. Effect of Catalyst Concentration
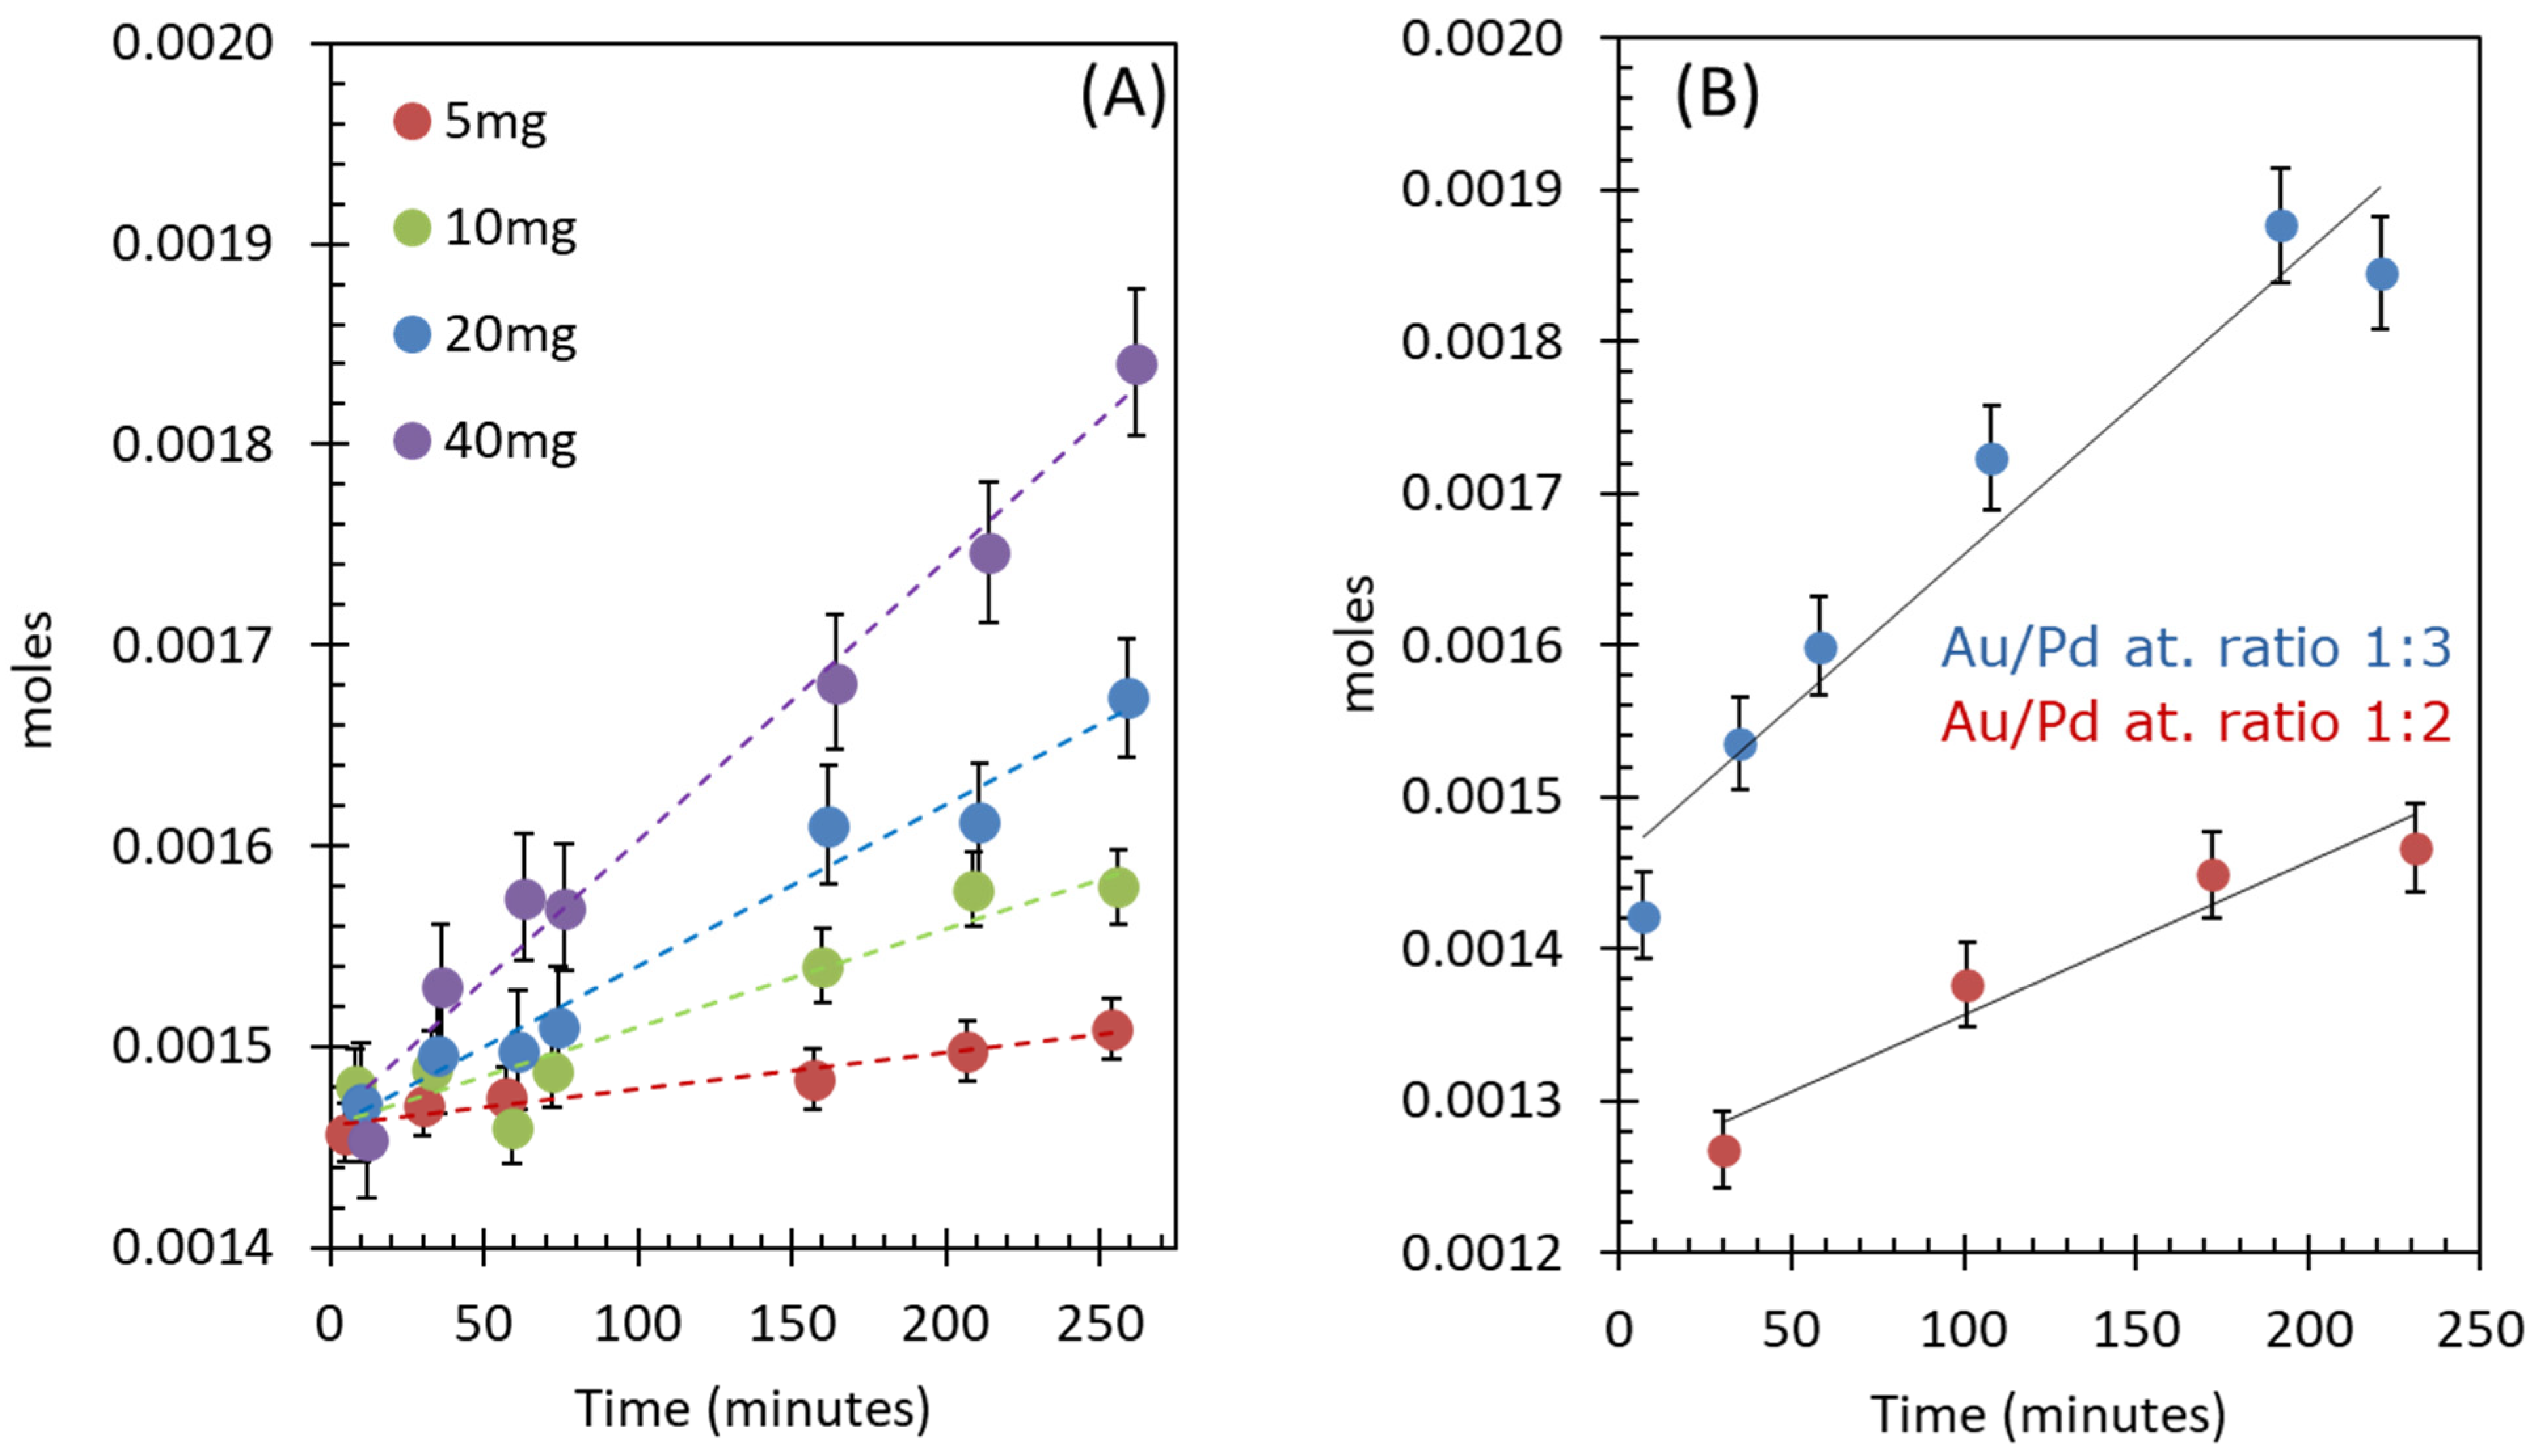
Figure 5A presents the O2 evolution reactions as a function of catalysts concentration by keeping the CAN concentration constant at 0.091 M. The total O2 production rate increased linearly with the increase in catalysts amount. The rates of reactions per catalyst weight were in the same range. The highest rate was observed when the catalyst amount was 10 mg, which might be due to an optimal [CAN]-to-[catalyst] ratio (Table 3). The TONs and TOFs were also found to be in the same range and in all reactions, around 41–42 catalytic cycles were completed.
2.2.3. Effect of Catalyst Composition (Au-to-Pd Ratios)
The composition of Au-Pd/TiO2 catalyst was also varied by changing the atomic ratios of Au to Pd. Figure 5B shows O2 evolution reactions over two active catalysts which have Au/Pd atomic ratios of 1:2 and 1:3. The rates and composition of the catalysts are listed in Table 4. The highest rate was observed for 2.29 wt. % Au–3.72 wt. % Pd/TiO2 catalyst with Au/Pd ratio of 1:3. The catalysts with Au/Pd ratios of 1/1, 2/1, and 3/1 were found to be not active for the reaction. An O2 evolution reaction was also performed using Ce(IV)(SO4)2·4H2O (Ce4+ as an electron acceptor) over 1.45 wt. % Au–1.57 wt. % Pd/TiO2 as a catalyst (Figure S5). The initial rate of reaction (1.67 × 10⁻⁷ moles/min) was 3.6 times slower under similar reaction conditions when CAN was used. Similar trends were observed in homogeneous catalysis when Ce(NH4)4(SO4)2·4H2O was used instead of CAN in the presence of a catalyst [6,40]. The sulfate anions form a more stable complex with Ce4+ compared to nitrate anion in CAN, which causes the decrease in oxidation potential [52] of Ce4+ to Ce3+.
2.3. UV-Vis Absorbance Spectroscopy of the Liquid Phase
To observe the transformation of Ce4+ into Ce3+, liquid samples of the reaction mixture were analyzed at different intervals of time by UV-Vis for the reaction over IrO2/TiO2 (anatase) catalysts (Figure S6). The peak at 300 nm is assigned to Ce4+ and NO3−. The UV spectra of Ce4+ and NO3− overlap. This was confirmed by taking the absorption spectra of Ce(IV) sulfate and HNO3 as Ce4+ and NO3− sources, respectively. The spectra at 0 min show only one peak at 300 nm assigned to Ce4+ and NO3−; as the reaction progresses, a new peak at 250 nm emerges, which is assigned to Ce3+. The peak position of Ce3+ was also confirmed by taking the absorption spectra of Ce3+ nitrate hexahydrate as the Ce3+ source. As the reaction time increased, the Ce3+ peak became more distinct, and at the end of the reaction there were two main peaks, one for Ce3+ and one at 300 nm, which becomes flatter due to the transformation of Ce4+ to Ce3+, but it did not completely disappear because of the presence of NO3−. There was no peak at 350 nm, which is assigned to NO2−. The peak assignment for NO2− was confirmed by taking the absorbance spectra of NaNO2.
2.4. Oxygen Production over IrO2 Catalysts
2.4.1. Oxygen Production over IrO2/TiO2 (Anatase)
IrO2- and IrOx-based catalysts are known as water oxidation catalysts [53,54,55,56]. It was reported that the mechanistic difference between IrOx and relatively less effective 3d metals such as Fe2O3 and Mn2O3 OER catalysts was due to the charge accumulation process, which occurs through valence state changes of the metal center, and was found to proceed efficiently [57] on IrOx. In this study, IrO2 was deposited on three different supports: TiO2 (anatase), TiO2 (anatase + rutile), and CeO2.
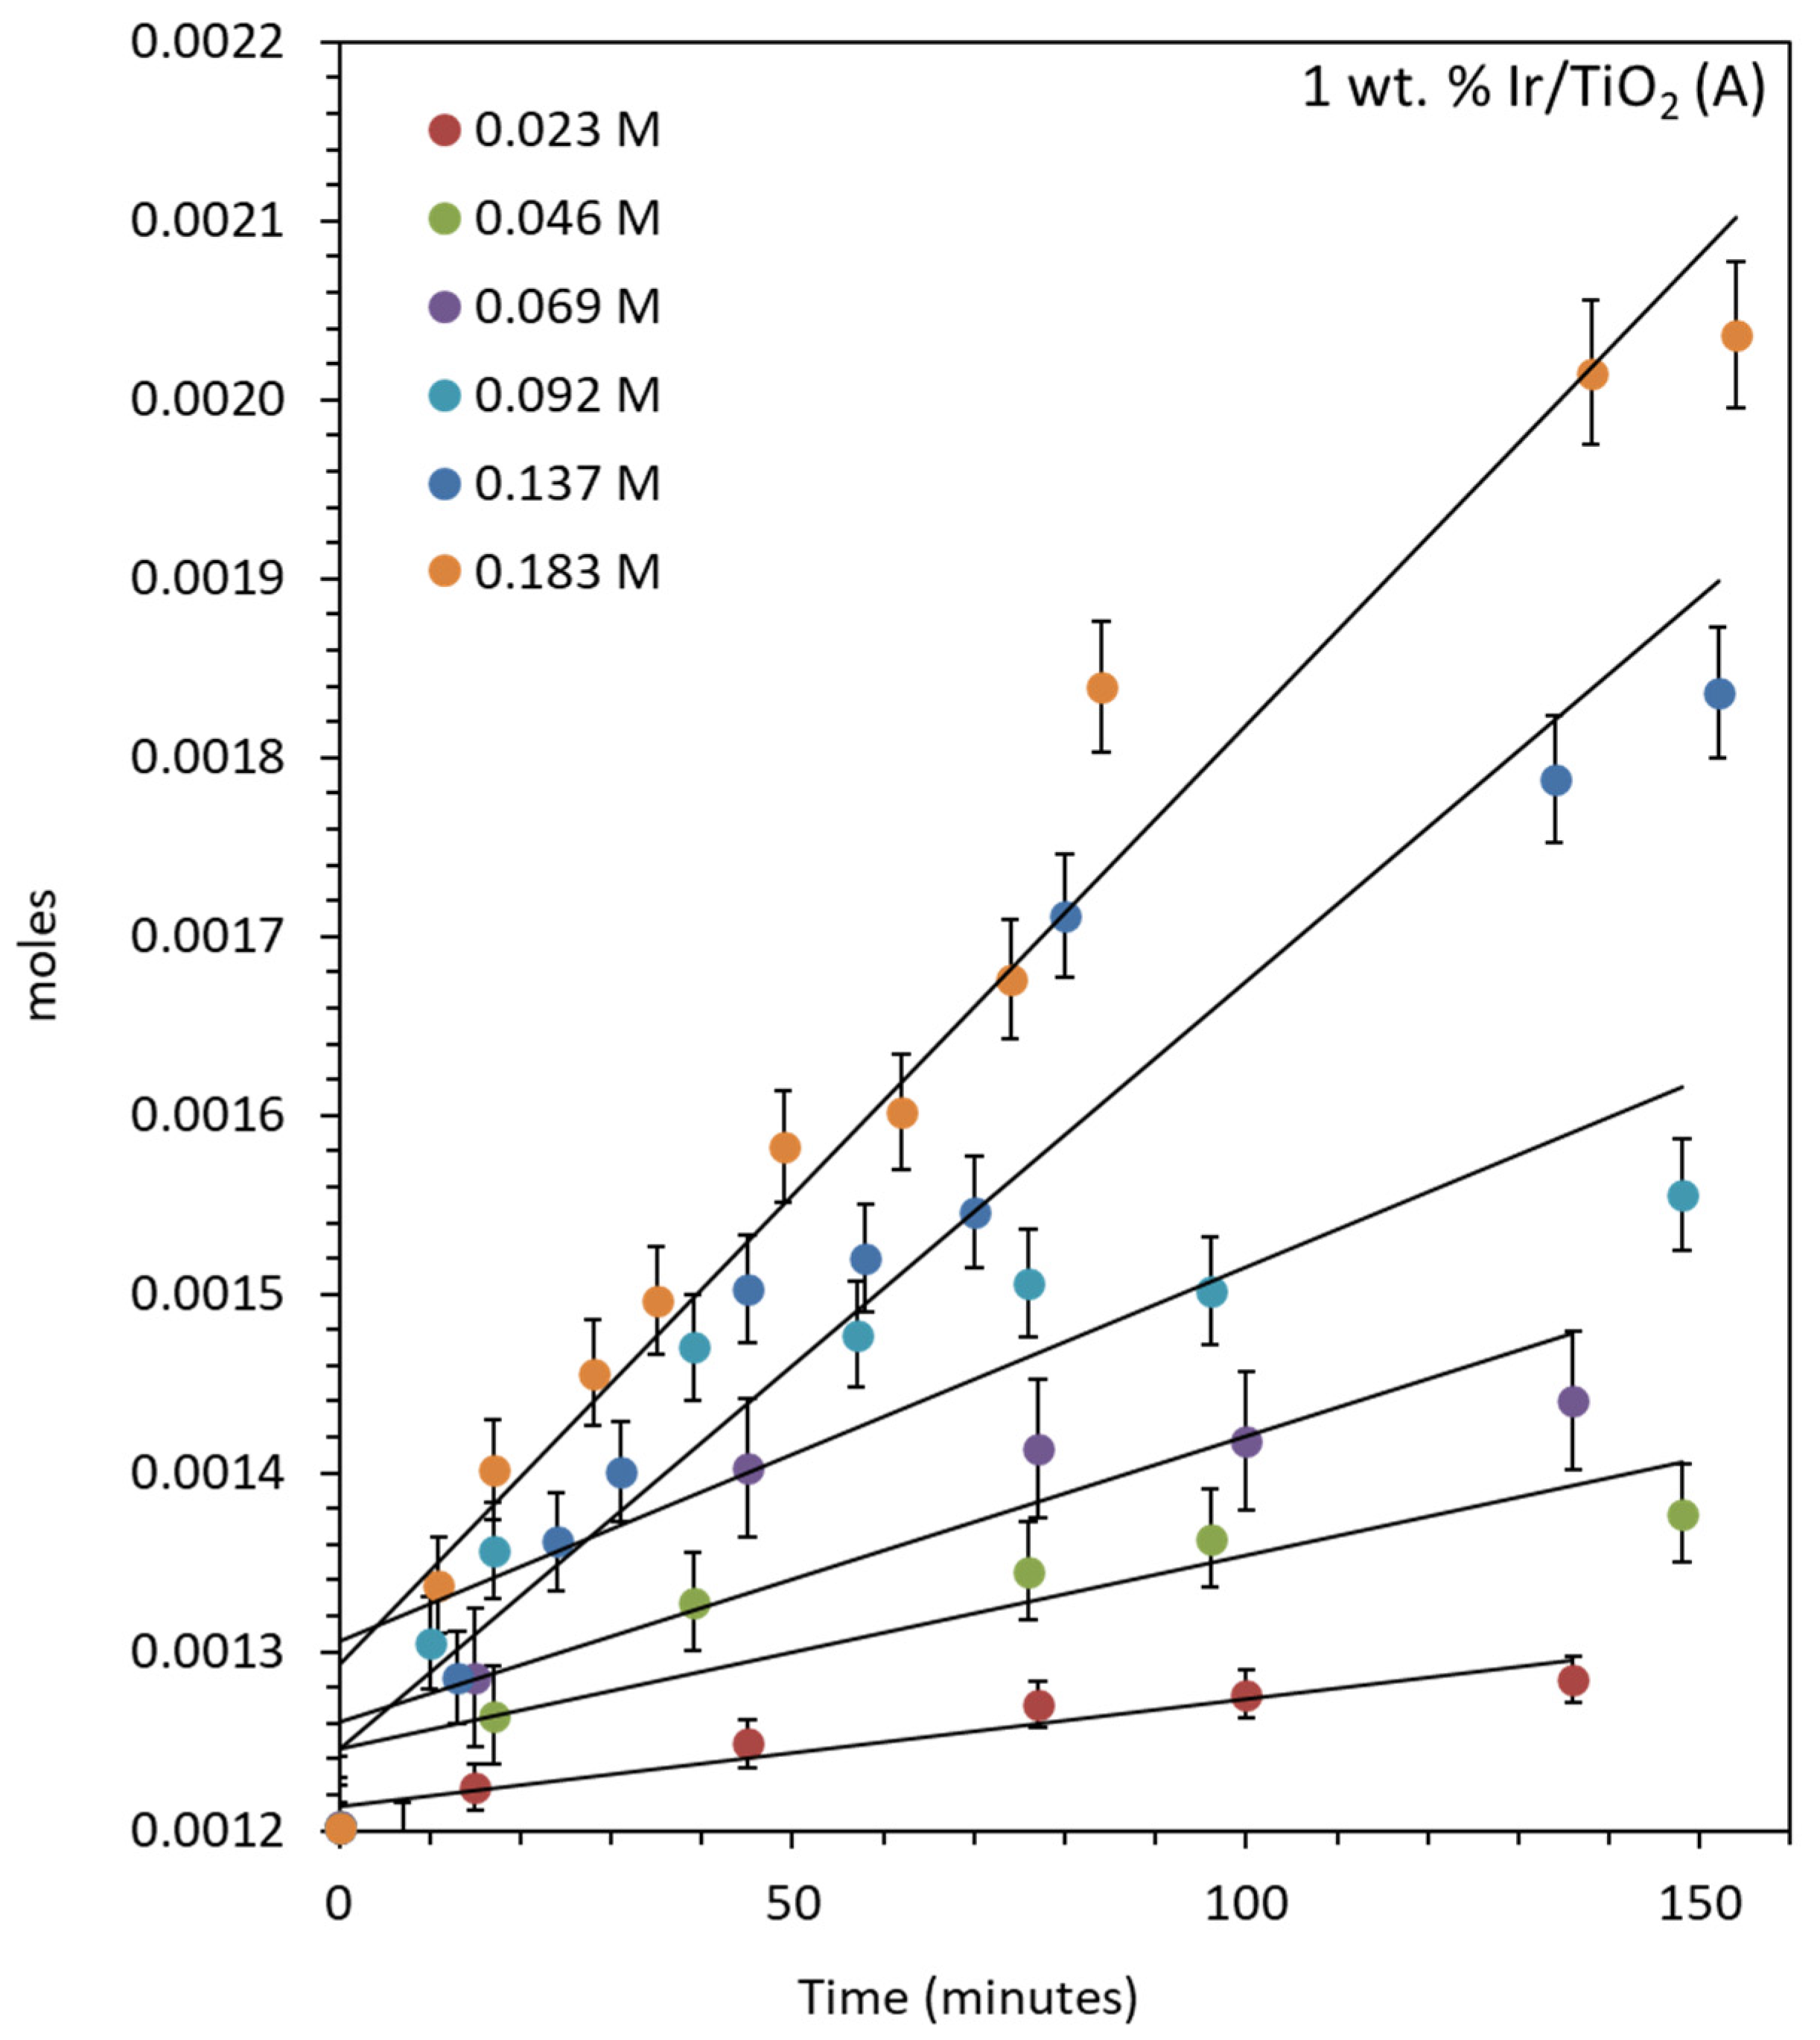
For the oxygen evolution over IrO2/TiO2 (anatase), the reactions were conducted in air and 20 mg of catalyst was used each time, with the concentrations of CAN kept similar to the previous studies mentioned above (Figure 6). The rate of reaction increased by increasing the concentration of CAN from 0.023 to 0.182 M. O2 evolution rates increased from 5.98 × 10⁻⁷ moles/min to 5.52 × 10⁻⁶ moles/min. Figure S7 shows the same reactions that were continued for longer periods. The turnover number (TON) and turnover frequency (TOF) of the catalyst were also calculated considering Ir as the active center for the reaction. The TONs were 81, 170.75, 243.25, 411, 629.8, and 847.7 after 450 min of reactions and the TOFs were 0.57, 1.05, 1.54, 2.11, 4.12, and 5.30 min−1 after 150 min for reactions performed with increasing CAN concentration. The initial Ce4+-to-Ir atomic ratios are also included (Table 5).
2.4.2. Oxygen Production over IrO2/TiO2 (Anatase + Rutile)
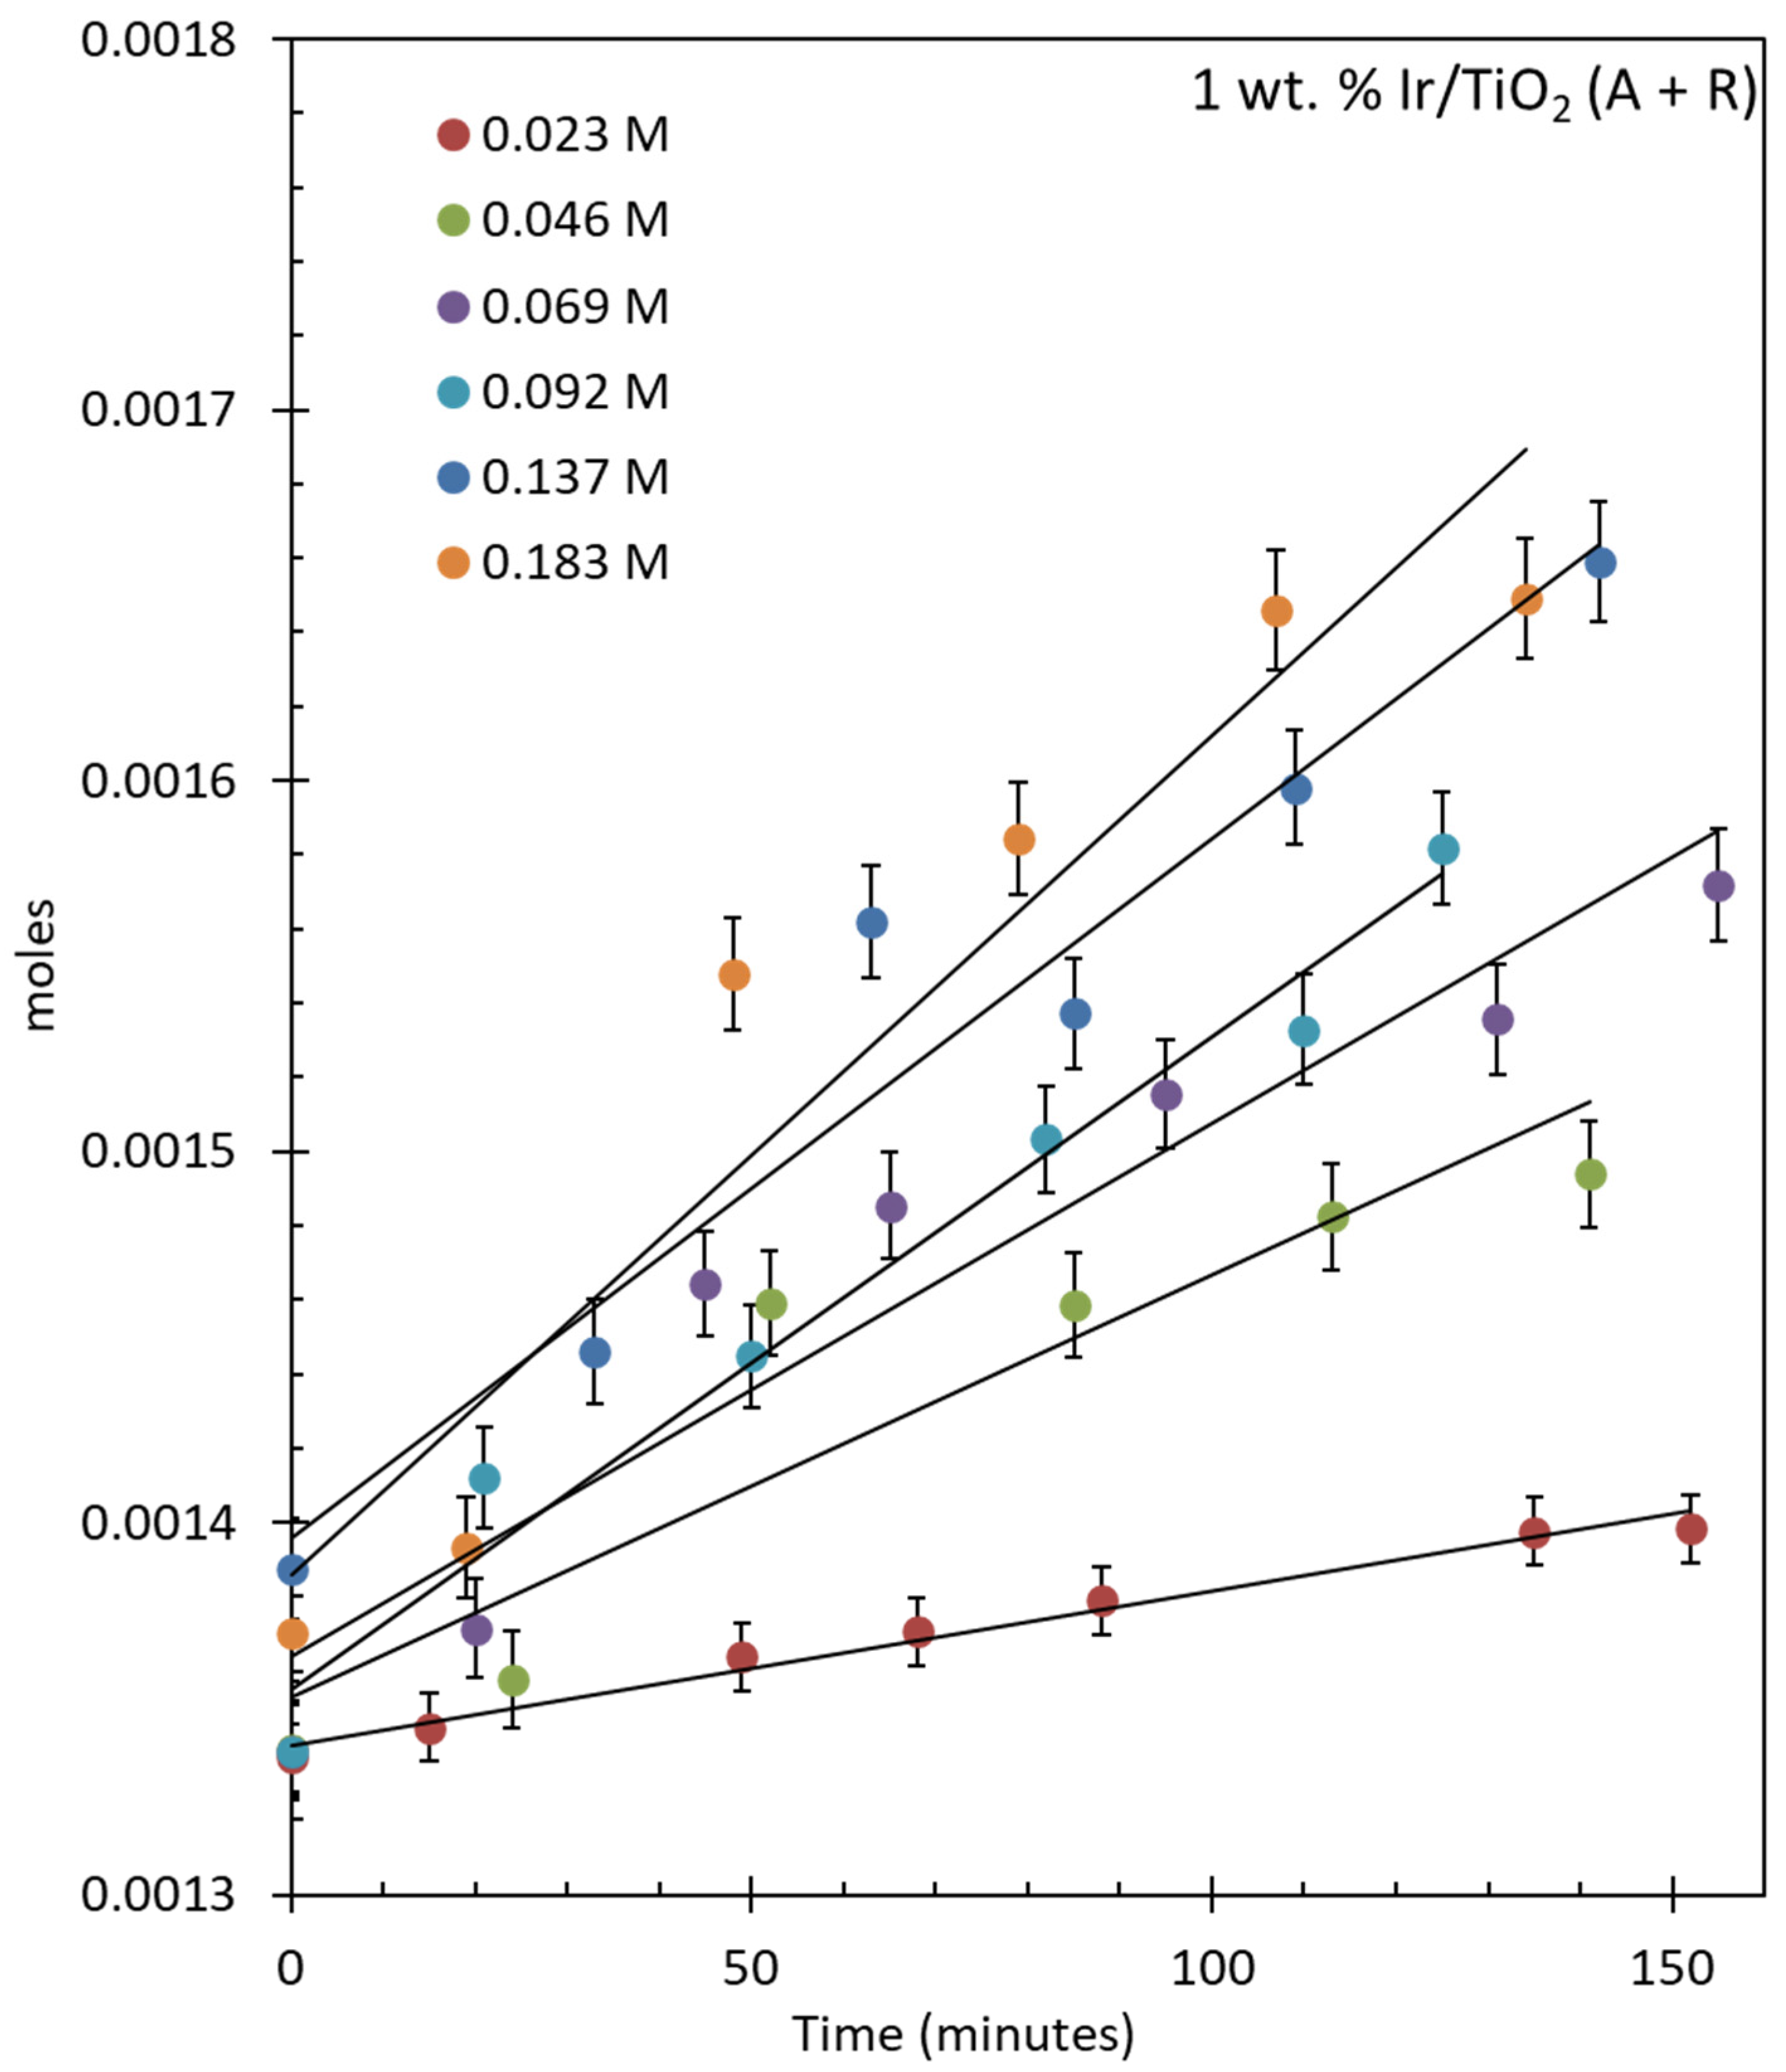
Oxygen evolution reactions were also performed over IrO2-TiO2 (anatase + rutile) using similar reaction conditions (Figure 7). The rate of reaction increased with the concentration of CAN from 0.023 to 0.182 M. The O2 evolution rate increased from 4.14 × 10⁻⁷ moles/min to 2.26 × 10⁻⁶ moles/min. The rates of O2 evolution were half compared to IrO2/TiO2 (anatase), although the BET surface areas were approximately the same for IrO2-TiO2 anatase and IrO2-TiO2 (anatase + rutile). The reactions were continued for longer periods, as shown in Figure S8. The TONs and TOFs of the reactions were calculated considering Ir as the active site for the reaction (Table 6). The TONs were 94, 170.75, 254, 343, 450, and 565 after 450 min of reactions and the TOFs were 0.40, 1.08, 1.37, 1.68, 1.81, and 2.17 min−1 after 150 min for reactions performed with increasing CAN concentration.
2.4.3. Oxygen Production over IrO2/CeO2
Reactions over IrO2/CeO2 under similar conditions were performed (Figure 8). The O2 evolution rate increased from 3.61 × 10⁻⁷ moles/min to 1.67 × 10⁻⁶ moles/min at the lowest and highest concentrations of CAN, respectively. Figure S9 shows the same reactions that were continued for longer periods to observe the stability of the catalyst and to quantify the consumption of CAN. The TONs and TOFs are shown in Table 7. The TONs were 74.65, 196.49, 226.52, 506.67, and 619 after 450 min of reactions and the TOFs were 0.35, 1.11, 1.19, 1.39, 1.49, and 1.60 min−1 after 150 min for reactions performed with increasing CAN concentration. CeO2 was considered as an alternative support here since, as mentioned in previous work, there is a CeO2 deposition during the reaction with CAN over the catalyst. However, we have shown previously that these did not affect the reaction rates (at least for the five cycles investigated).
Several other catalysts were also tested in similar reaction conditions but did not yield any O2. Those catalysts include 3 wt. % Au/TiO2, 3 wt. % Pd/TiO2, 1 wt. %Pt/TiO2, Fe2O3, 1 wt. % Ru/SrTiO3, 1 wt. % Rh–1 wt. % Ru/SrTiO3, and 0.1 wt. % Ag–0.3 wt. % Pd /TiO2 (Table 8).
Below, we compare the activity of the Ir-based catalysts and the Au-Pd-based catalysts.
2.5. Reaction Kinetics
For a homogenous catalytic reaction, the reaction with CAN is typically first-order with respect to a catalyst and oxidants [58,59] such as CAN and NaIO4.
The rate of evolution of oxygen is given as:
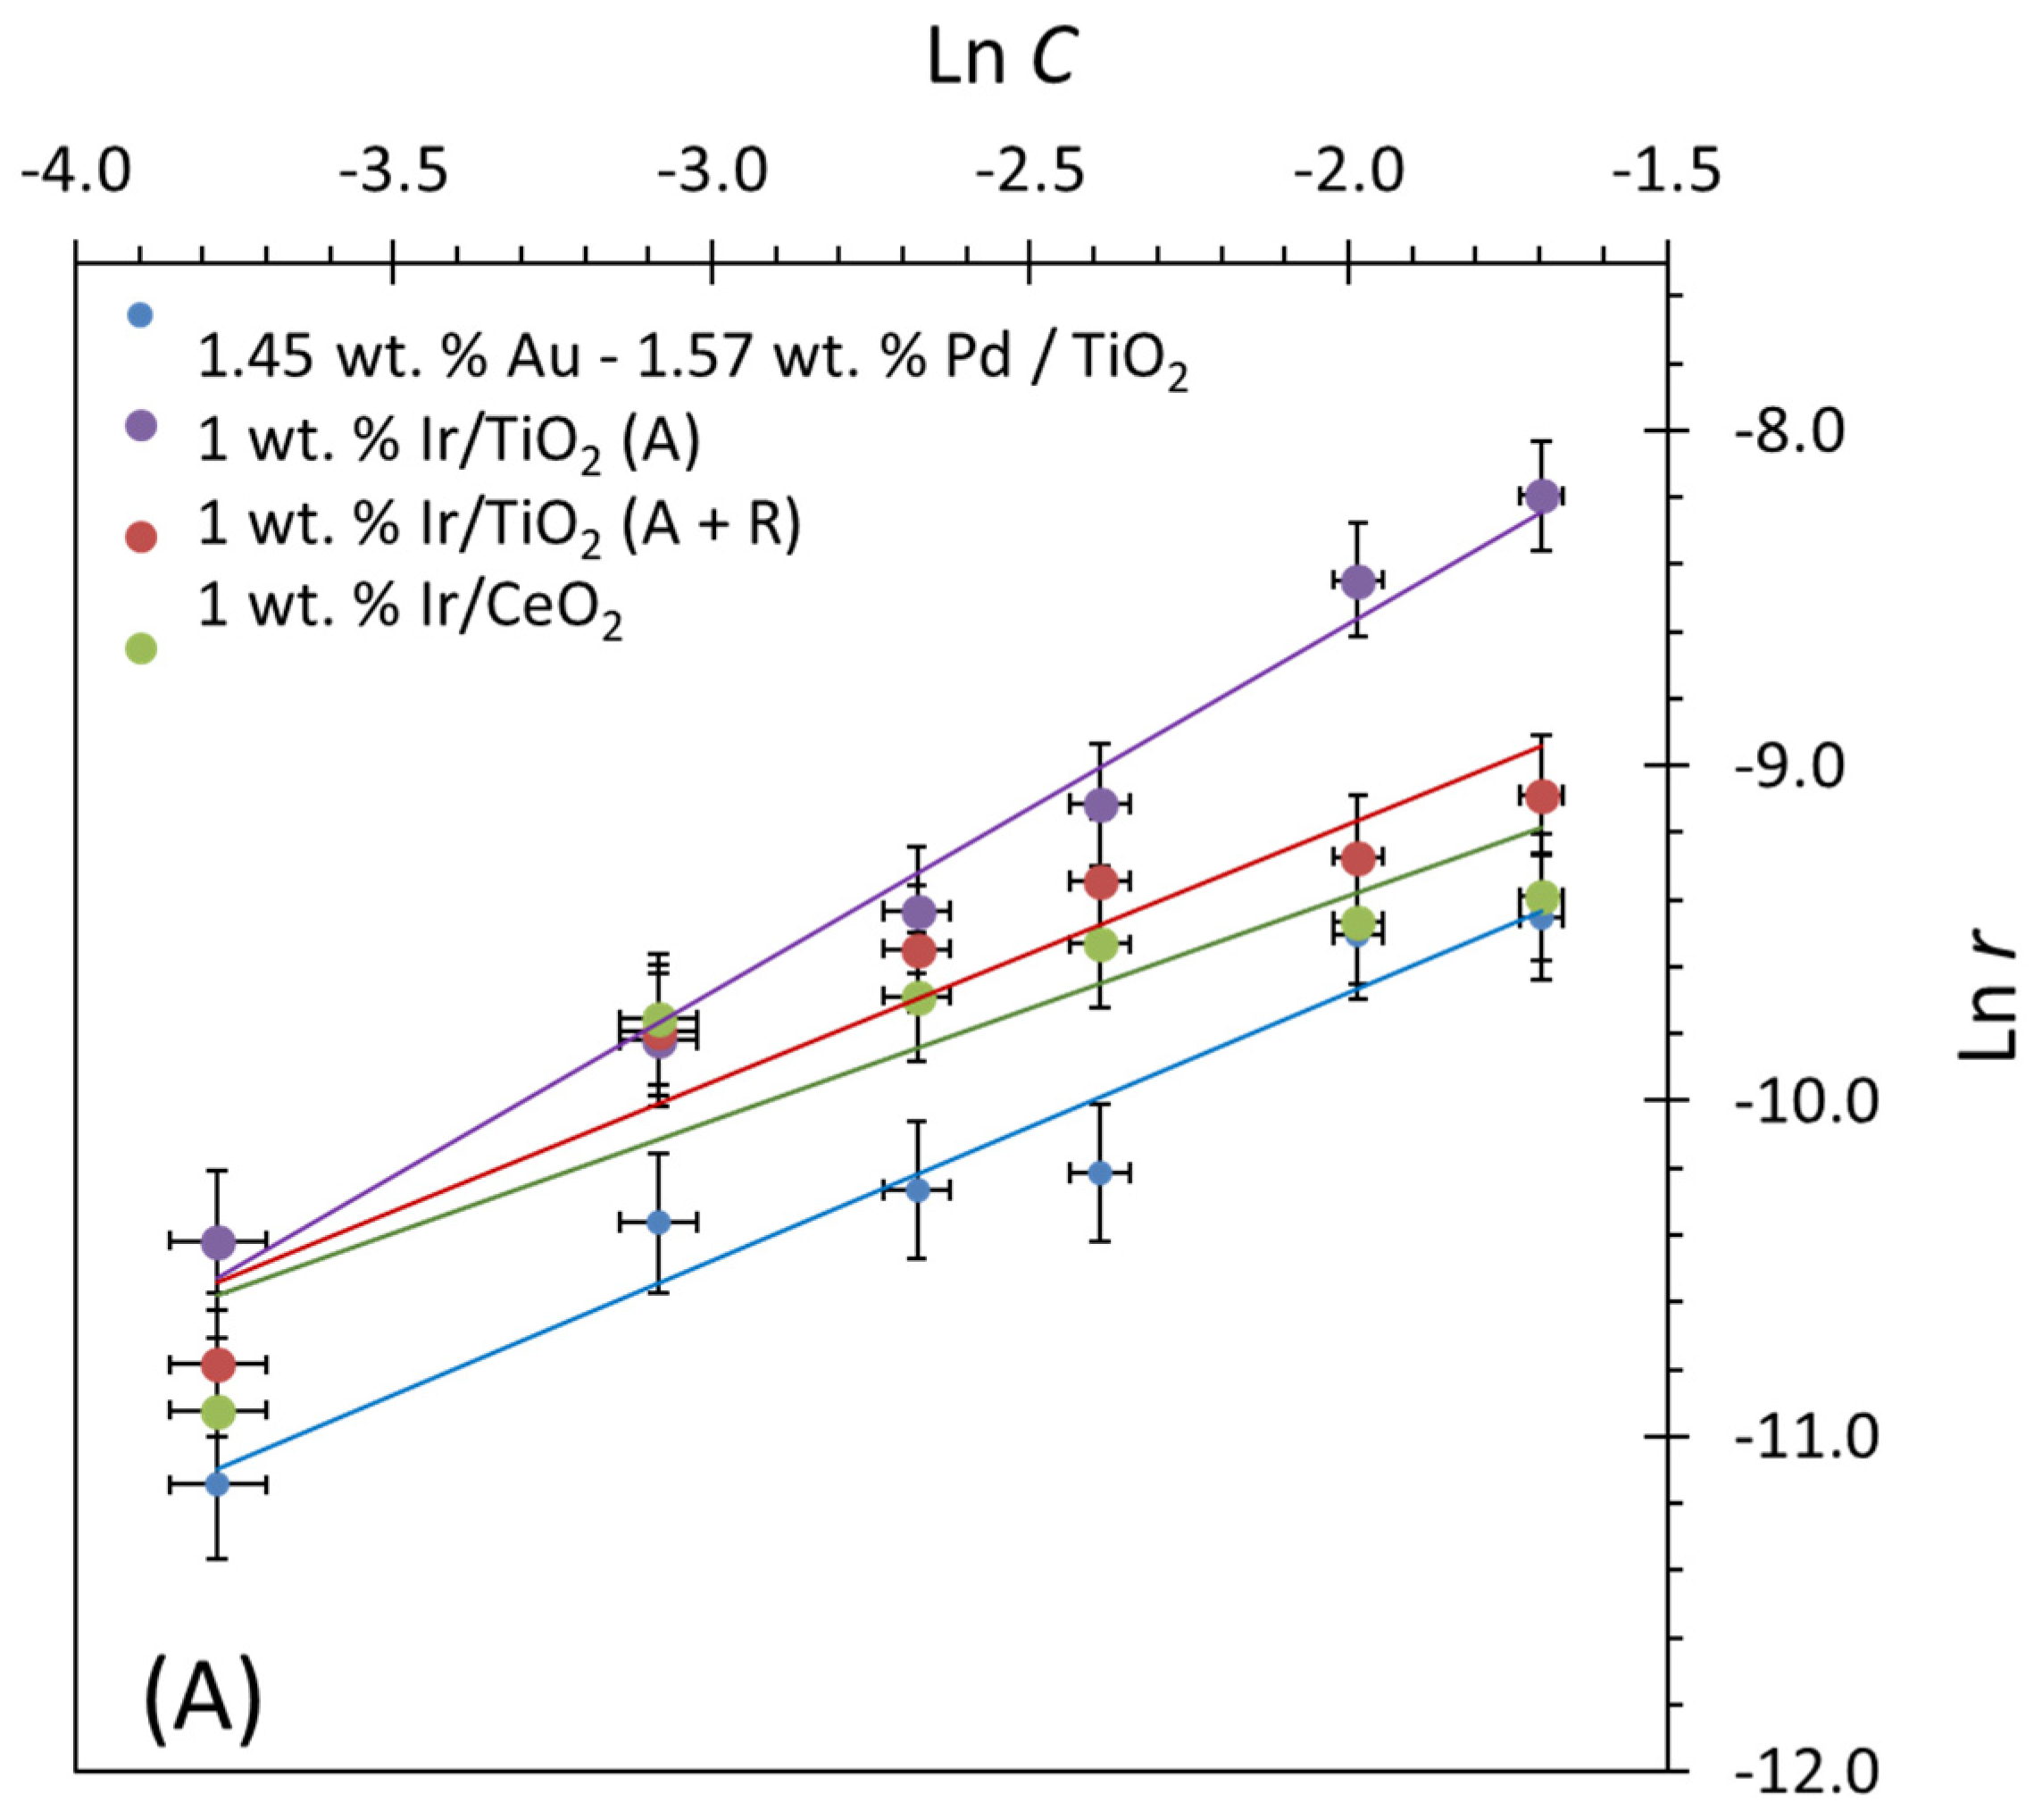
In Equation (2), r is the rate of evolution of oxygen, k is the rate constant, and n is the order of reaction with respect to cerium ammonium nitrate concentration. The rate is zero-order with respect to water because it is in excess. The rate equation can be given by Equation (3). By plotting Equation (4), the Ln r (rate of evolution of O2) as a function of Ln [CAN] (cerium ammonium nitrate concentration in moles/gcatal.) is found to be approximately (within experimental errors, R2 values are given in the figure caption) a straight line (Figure 9A). The extracted orders of reaction with respect to cerium ammonium nitrate concentrations over different catalysts are listed in Table 9.
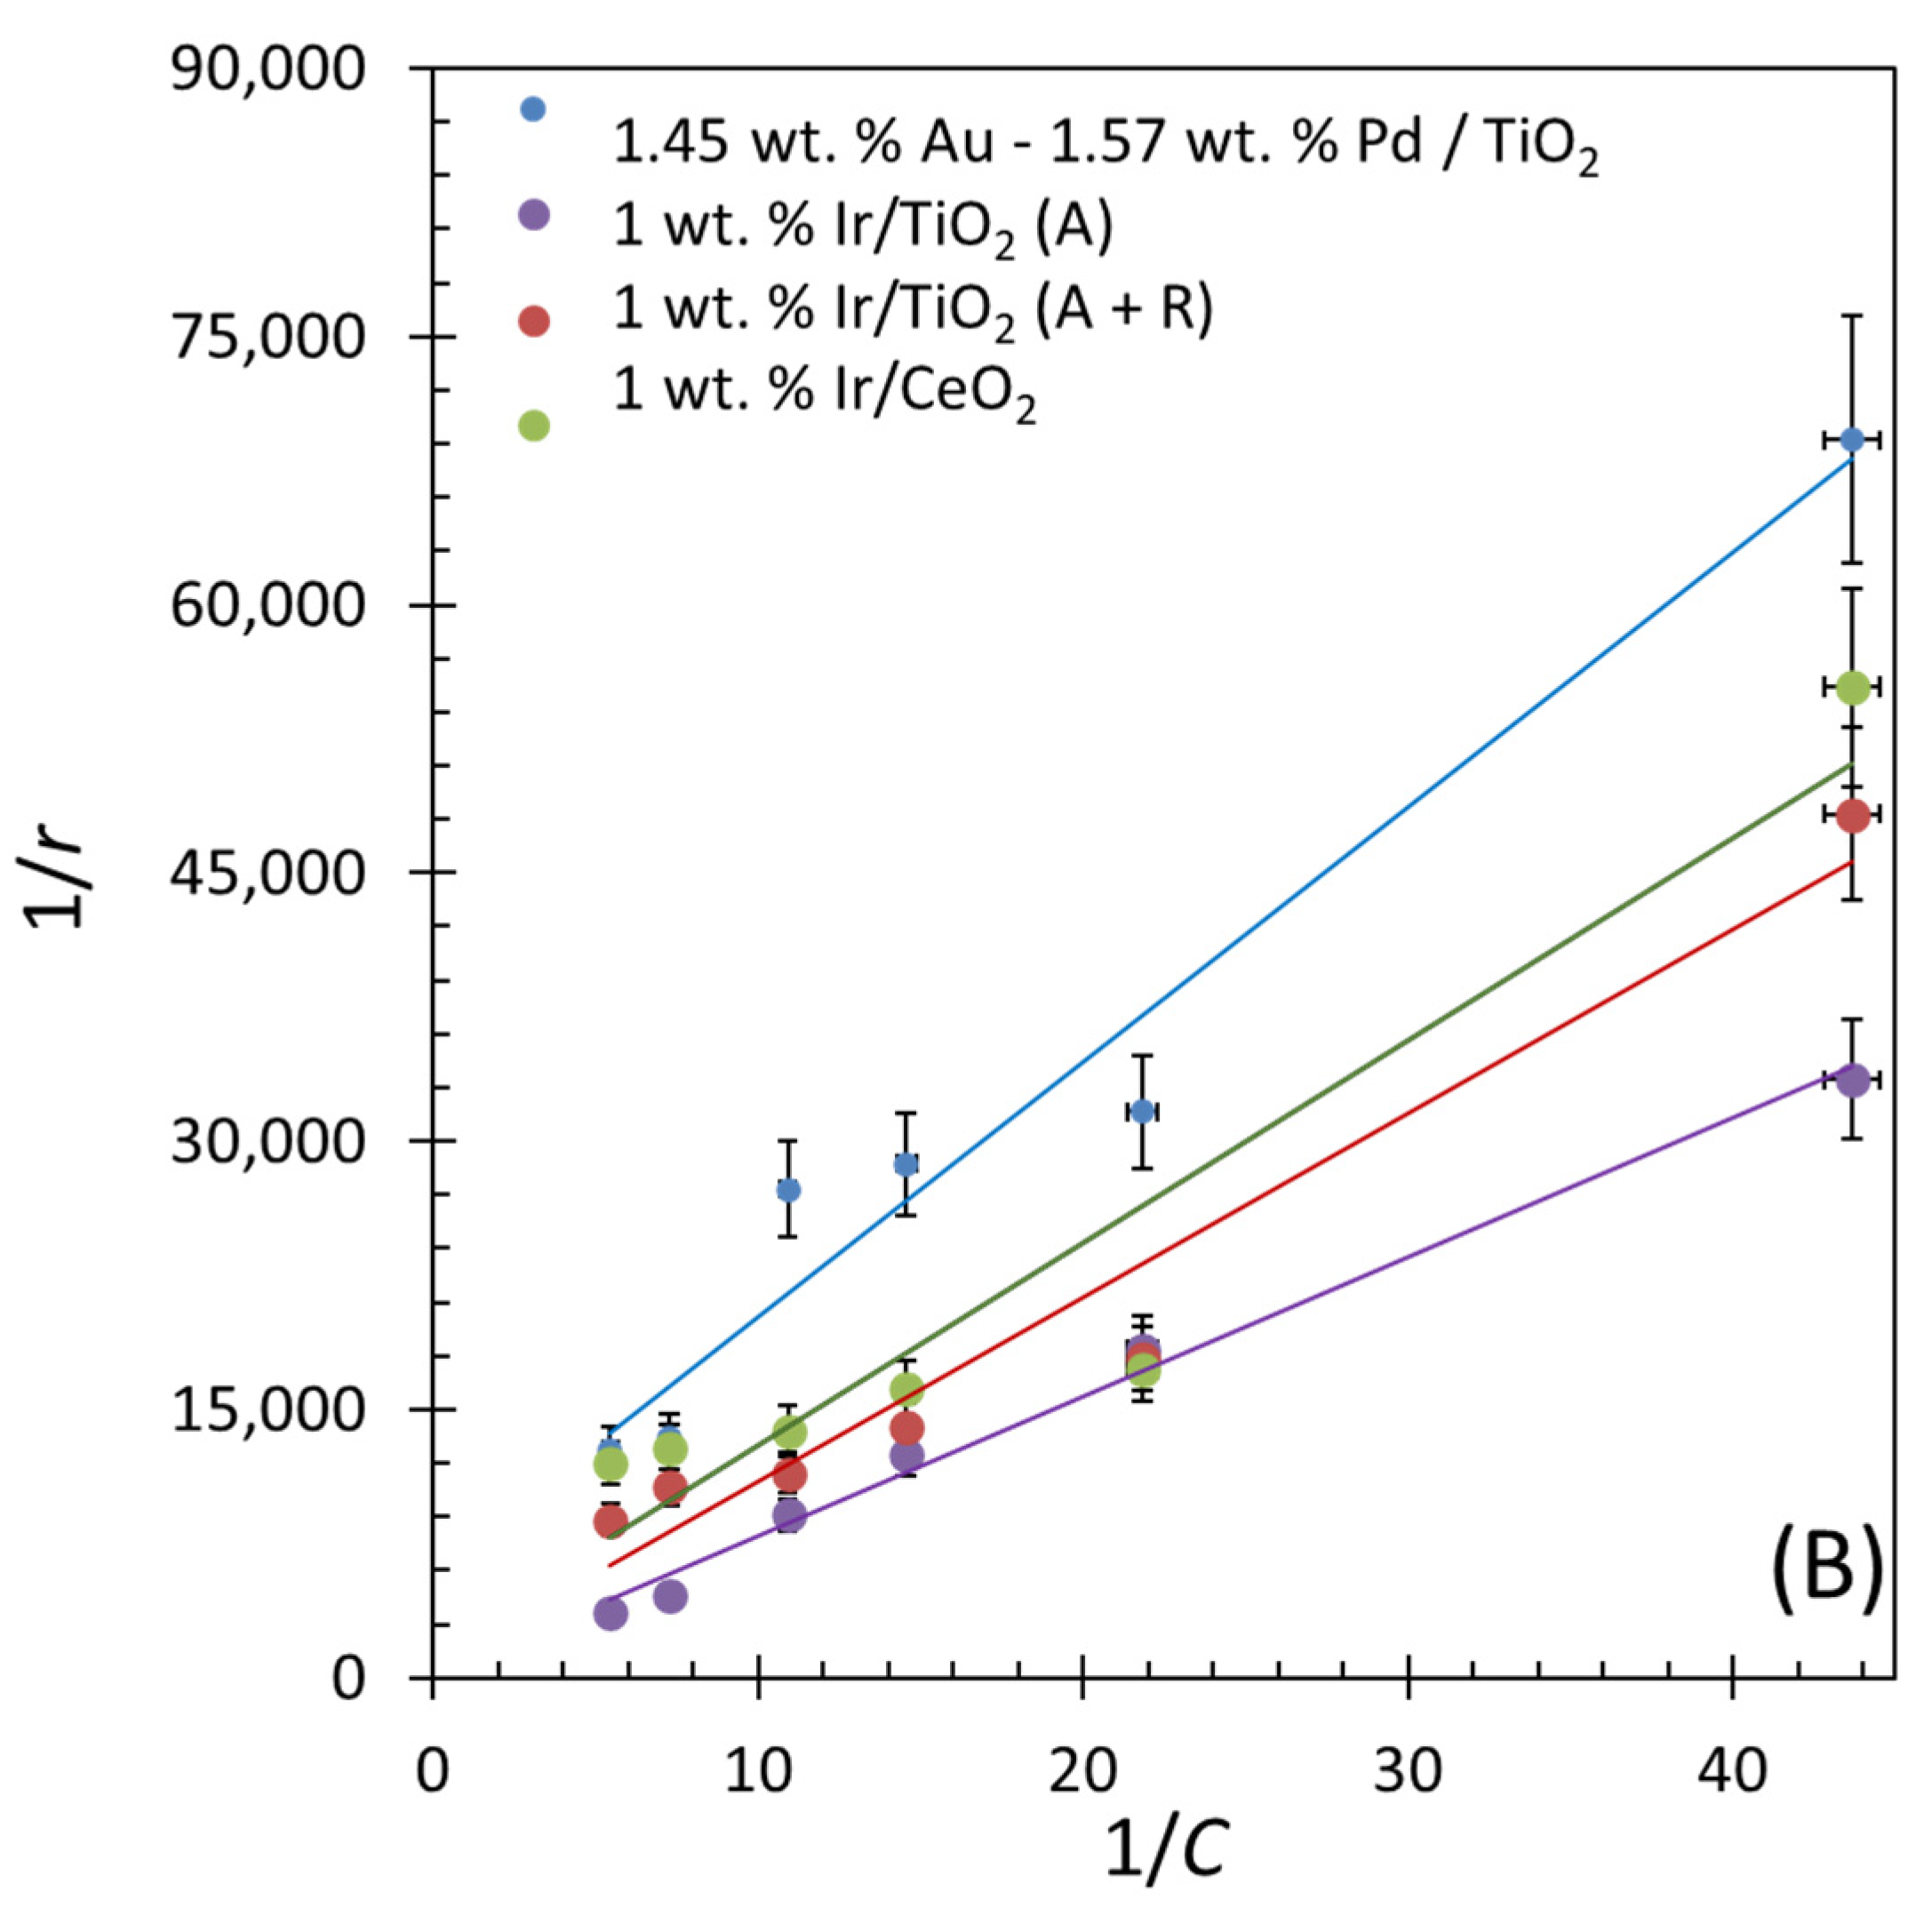
The Langmuir–Hinshelwood (L–H) kinetic model was used to observe the relation between the rate of oxygen evolution and the binding constant of adsorbed cerium ammonium nitrate.
where r is the rate of evolution of oxygen, C is the concentration of cerium ammonium nitrate, k is the rate constant of the reaction, and K is the adsorption constant or binding constant. Plotting 1/r vs. 1/C (equation 5) shows a linear trend, within experimental errors. The rate constants and binding constants are listed in Table 9. The highest rates of O2 were achieved on IrO2/TiO2 (anatase), which is 2.11 × 10⁻⁴ mol/(m2 min), and the lowest rate was on IrO2/CeO2, which is 3.27 × 10⁻⁶ mol/(m2 min). The O2 evolution rates over Au-Pd/TiO2 (anatase + rutile) and IrO2/TiO2 (anatase + rutile) were in the same range, 4.25 × 10⁻⁶ and 4.02 × 10⁻⁶ mol/(m2 min), respectively. These results may indicate that, at least in the case of Ir-based catalysts, the lower the binding constant between CAN and the support, the faster the reaction rate for water oxidation.
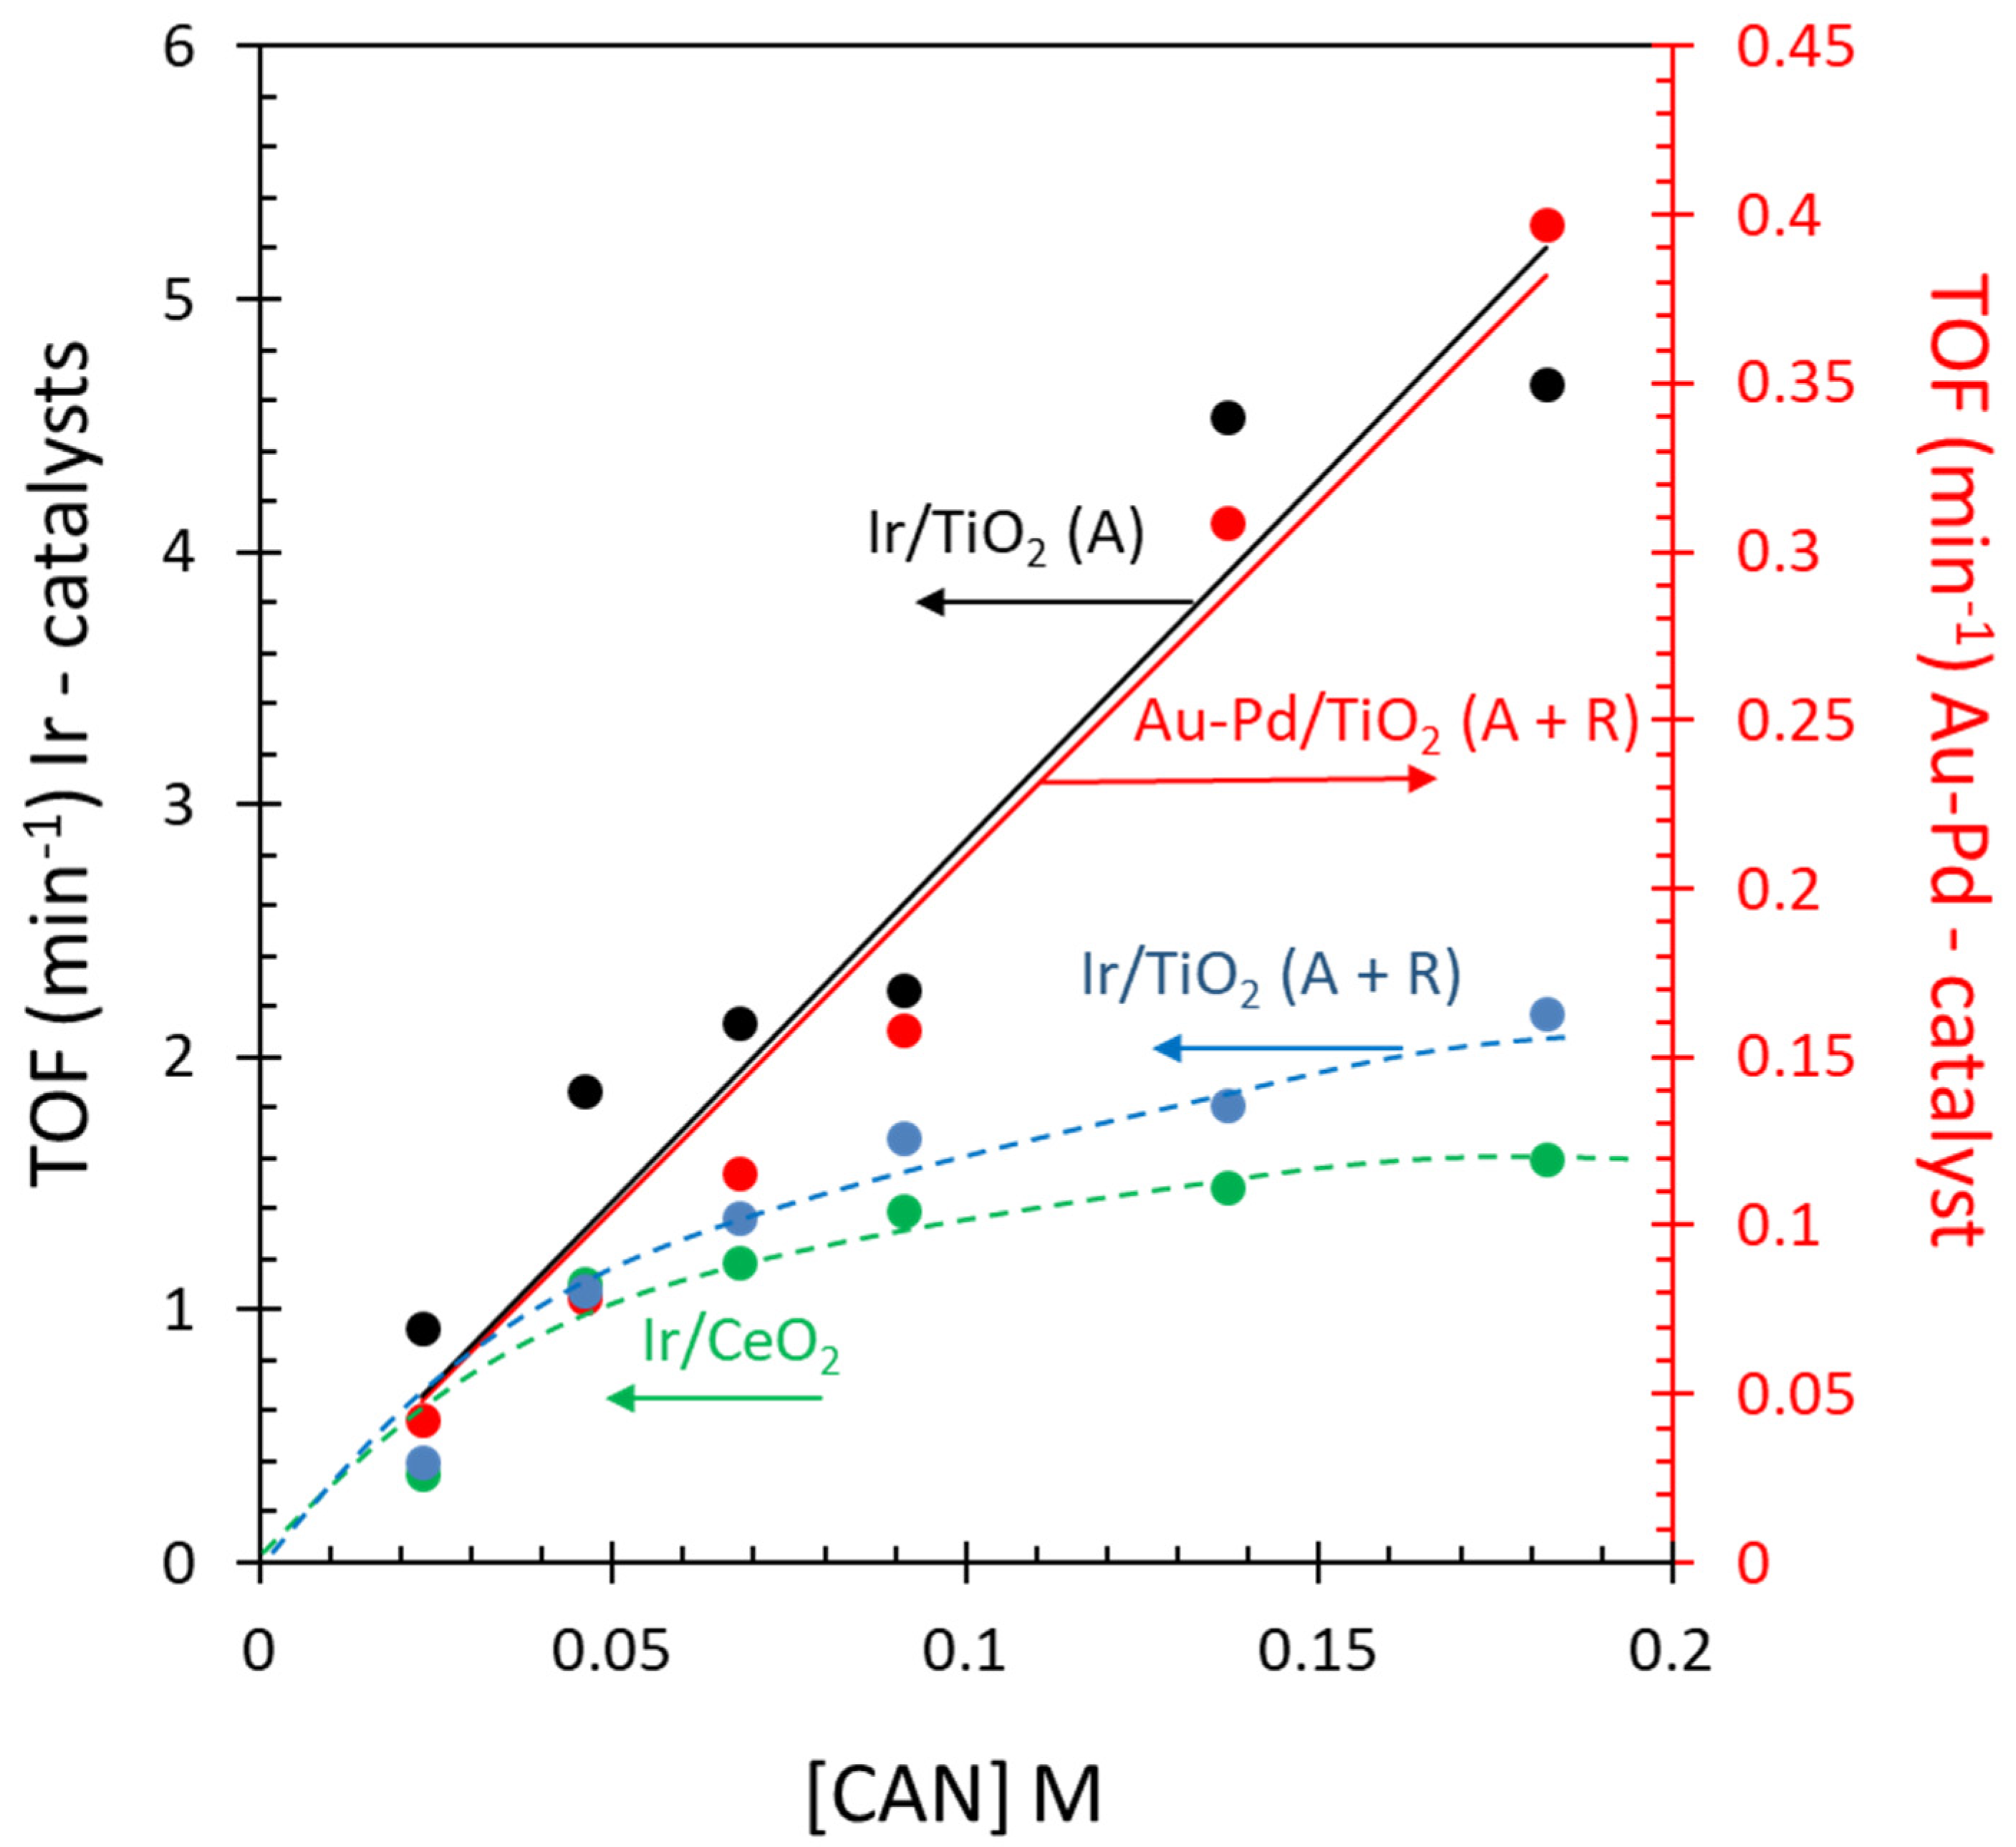
While Au-Pd-based catalysts were found to be less active than Ir-based catalysts, these were not optimized in terms of particle size, dispersion, ratio, or the nature of the support. For example, as seen in Figure 10, TOF numbers still increase with increasing Ce4+ concentration. A simple qualitative description would be that the orbitals of the adsorbates and catalysts are aligned energetically. In other words, the O2p of a surface hydroxyl on the support(s) at the interface with an Au-Pd nanoparticle (at a ratio between 1 to 2 and 1 to 3) is energetically aligned with the Pd4d/Au5d bands of these nanoparticles, which are in turn aligned with the Ce4f/Ce4d orbital energy of the Ce4+ cations. This would allow electrons to flow from the surface hydroxyl to the Ce4+ cations, ultimately leading to Ce3+ and O2 molecules.
(O2p) of OH(s) → [4d(Pd)/5d(Au)]0, −1 → [4f(Ce)/4d(Ce)]+4, +3
reactant catalyst reactant/product
reactant catalyst reactant/product
Equation (6) is a descriptive mechanism of the direction of electron transfer from a surface hydroxyl leading to Ce3+ cations and an O2 molecule. The superscripts on the [Pd/Au] indicate the change in electronic state during the catalytic cycle, while the superscripts on the Ce cations indicate the initial (reactant) and final (product) states.
3. Experimental
3.1. Catalyst Preparation
TiO2 (anatase + rutile) Sigma Aldrich, HAuCl4·3H2O, and PdCl2 were used as Au and Pd precursors, respectively. Metals were loaded over TiO2 by the deposition precipitation method [60]. HAuCl4·3H2O was dissolved in water while PdCl2 was dissolved in 1N HCl and deposited over TiO2 to obtain different atomic percentages of Au and Pd. Then, 0.4 M of a urea solution was added to precipitate gold by raising the pH to 10–12. The suspension was placed into a glass vessel and maintained at 80 °C for 24 h to reduce Au3+ to Au0. After this treatment, the suspension was washed with distilled water, dried, and calcined at 350 °C for 5 h. Then, 1 wt. % IrO2/TiO2 (anatase), 1 wt. % IrO2/TiO2 (anatase + rutile), and 1 wt. % IrO2/CeO2 catalysts were synthesized, using iridium chloride as a precursor, by the wet impregnation method. The required amount of solution was impregnated onto the support and stirred on a heating plate at 80 °C until the whole solution evaporated. The final dried material was calcined at 400 °C for 5 h. CeO2 was synthesized using the precipitation method. In brief, cerium (III) nitrate hexahydrate (Sigma Aldrich, St. Louis, MO, USA) was dissolved in deionized water. Then ammonium hydroxide, used as a precipitating agent (70%), was added to the solution while stirring vigorously until it reached a pH of 9–10. After filtration of the precipitate, it was washed using deionized water until a neutral pH was obtained. After drying the hydroxide/oxide in an oven at 100 °C, it was crushed, loaded into a crucible, and calcined in air at 500 °C for 12 h with a temperature ramp of 15 °C min−1.
3.2. Reaction Setup
Experimental work was conducted at SABIC Research Center at KAUST. Reactions were performed in a 140 mL flat-bottom glass reactor. Catalysts were dispersed in 20 mL of water and bubbled with N2 to remove dissolved and gas-phase O2. Some reactions were also performed in air without purging with N2. The final mixture was subjected to constant stirring during the reaction for better dispersion of the catalyst and CAN in the water. A gas chromatograph (GC) equipped with a thermal conductivity detector (TCD) was used for O2 quantification using a molecular sieve 5A column at 80 °C, and He was used as a carrier gas.
UV-Vis absorbance spectra were collected over the wavelength range of 250–900 nm on a Thermo Fisher Scientific EvolutionTM 300 UV-Vis spectrophotometer. The absorbance spectra were collected using a quartz cuvette. Solid catalysts were collected over the wavelength range of 250–800 nm on the same equipment using a Praying Mantis TM diffuse reflection accessory obtained from Harrick Scientific.
The powder XRD patterns of the samples were recorded on a Philips X’pert-MPD X-ray powder diffractometer. A 2θ interval between 10 and 90° was used with a step size of 0.010° and a step time of 0.5 s. The X-ray, a Ni-filtered Cu Kα radiation source (Kα = 1.5418 Å), was operated at 45 mA and 40 kV. The XRD of the mixed-phase TiO2 used as a catalyst support is shown in Figure S1. The peaks at 2θ 25.35 and 27.5 represent the diffraction peaks of (101) and (110) planes of anatase and rutile TiO2, respectively. The percentage of rutile in the mixed phase of TiO2 was calculated using the formula given in Equation (7) and was found [61] to be about 15 wt. %.
X-ray photoelectron spectroscopy (XPS) was conducted using a Thermo scientific ESCALAB 250 Xi. Spectra were calibrated with respect to C1s at 284.7 eV. The Au4f, Pd3d, O1s, Ti2p, and valence band (O2p, Au5d/Au6s, and Pd4d) binding energy regions were scanned. Typical acquisition conditions were pass energy (PE) = 20 eV, with a scan rate = 0.1 eV per 200 ms. Self-supported oxide disks of approximately 0.5 cm diameter were loaded into the UHV chamber (typically in the low 10−10 torr range). The analyzed area was set to 600 × 600 μm2. Data acquisition was achieved using Avantage software, version 24.
Table S1 shows the method used to calculate the turnover numbers, TON (number of moles of O2 produced after time t, divided by the number of moles of the metals (Au, Pd, Au-Pd, or Ir) of the catalyst used) and turnover frequencies, TOF (volumetric molar rate of O2 production divided by the number of moles of the metals of the catalyst used).
4. Conclusions
In this study, the spontaneous evolution of O2 from water over heterogeneous catalysts based on IrO2 and Au-Pd was reported. The evolution of O2 was found to be sensitive to the Au-to-Pd ratios. At a nominal atomic ratio of 1 Au to 2 Pd or to 3 Pd, the Au-Pd-based catalysts were found to be active and stable for the reaction. At a higher Au-to-Pd ratio, no activity was seen. The monometallic catalysts were not active for the reaction either. Other catalysts were also tested and found to be not active, including those based on Pt and Rh. The reason for the activity of the Au-Pd at a particular ratio is linked to the valence orbitals of the specific particles that may have the same valence orbital band energy and shape as those of Ir-based catalysts. The comparison with IrO2 was supported on TiO2 and CeO2, with both showing good activity and stability for the reaction, indicating that there is a potential for further development of Au-Pd-based catalysts to replace Ir-based catalysts for a water oxidation reaction.
Supplementary Materials
The following supporting information can be downloaded at: https://www.mdpi.com/article/10.3390/catal14010087/s1, Figure S1. XRD of TiO2. Figure S2. UV-Vis spectra. Figure S3. Valence band XPS of Pd, Au, and Pd-Au alloy series. Figure S4. XPS Au 4f and XPS Pd 3d. Figure S5. O2 evolution reaction over an Au-Pd catalyst using Ce(SO4)2. Figure S6. UV-Vis absorption spectra were obtained at different intervals of time after the addition of IrO2 catalyst. Figures S7–S9. O2 evolution reaction over 1 wt. % IrO2 deposited in different supports. Table S1. Example for the calculation of TONs and TOFs for a Au-Pd catalyst with different CAN concentrations.
Author Contributions
Conceptualization, H.I.; methodology, H.I. and K.W.; formal analysis, H.I. and K.W.; investigation, K.W.; writing—original draft preparation, K.W.; writing—review and editing, H.I. and K.W.; supervision, H.I. All authors have read and agreed to the published version of the manuscript.
Funding
This research received no external funding.
Data Availability Statement
Data are available from H.I. and K.W. and can be provided upon direct request.
Acknowledgments
The authors thank Toseef Ahmed (Sabic STC-Riyadh) for conducting the XPS measurements.
Conflicts of Interest
The authors declare no conflicts of interest.
References
- Fukuzumi, S.; Hong, D. Homogeneous versus Heterogeneous Catalysts in Water Oxidation. Eur. J. Inorg. Chem. 2014, 2014, 645–659. [Google Scholar] [CrossRef]
- Huang, Y.; Li, M.; Yang, W.; Yu, Y.; Hao, S. Ce-Doped Ordered Mesoporous Cobalt Ferrite Phosphides as Robust Catalysts for Water Oxidation. Chem. Eur. J. 2020, 26, 13305–13310. [Google Scholar] [CrossRef] [PubMed]
- Concepcion, J.J.; Jurss, J.W.; Templeton, J.L.; Meyer, T.J. One Site is Enough. Catalytic Water Oxidation by [Ru(tpy)(bpm)(OH2)]2+ and [Ru(tpy)(bpz)(OH2)]2+. J. Am. Chem. Soc. 2008, 130, 16462–16463. [Google Scholar] [CrossRef] [PubMed]
- Kiyota, J.; Yokoyama, J.; Yoshida, M.; Masaoka, S.; Sakai, K. Electrocatalytic O2 Evolution from Water at an ITO Electrode Modified with [Ru(terpy){4,4′-(CH2PO3H2)2-2,2′-bpy}(OH2)]2+: Evidence for a Unimolecular Pathway. Chem. Lett. 2010, 39, 1146–1148. [Google Scholar] [CrossRef]
- Wasylenko, D.J.; Ganesamoorthy, C.; Henderson, M.A.; Koivisto, B.D.; Osthoff, H.D.; Berlinguette, C.P. Electronic Modification of the [RuII(tpy)(bpy)(OH2)]2+ Scaffold: Effects on Catalytic Water Oxidation. J. Am. Chem. Soc. 2010, 132, 16094–16106. [Google Scholar] [CrossRef] [PubMed]
- Yang, X.; Baik, M.-H. cis,cis-[(bpy)2RuVO]2O4+ Catalyzes Water Oxidation Formally via in Situ Generation of Radicaloid RuIV−O•. J. Am. Chem. Soc. 2006, 128, 7476–7485. [Google Scholar] [CrossRef] [PubMed]
- Yoshida, M.; Masaoka, S.; Abe, J.; Sakai, K. Catalysis of mononuclear aquaruthenium complexes in oxygen evolution from water: A new radical coupling path using hydroxocerium (IV) species. Chem. Asian J. 2010, 5, 2369–2378. [Google Scholar] [CrossRef]
- Grotjahn, D.B.; Brown, D.B.; Martin, J.K.; Marelius, D.C.; Abadjian, M.-C.; Tran, H.; Kalyuzhny, G.; Vecchio, K.S.; Specht, Z.G.; Cortes-Llamas, S.A. Evolution of iridium-based molecular catalysts during water oxidation with ceric ammonium nitrate. J. Am. Chem. Soc. 2011, 133, 19024–19027. [Google Scholar] [CrossRef]
- Zhao, Y.; Hernandez-Pagan, E.A.; Vargas-Barbosa, N.M.; Dysart, J.L.; Mallouk, T.E. A high yield synthesis of ligand-free iridium oxide nanoparticles with high electrocatalytic activity. J. Phys. Chem. Lett. 2011, 2, 402–406. [Google Scholar] [CrossRef]
- Bucci, A.; Menendez Rodriguez, G.; Bellachioma, G.; Zuccaccia, C.; Poater, A.; Cavallo, L.; Macchioni, A. An alternative reaction pathway for iridium-catalyzed water oxidation driven by cerium ammonium nitrate (CAN). ACS Catal. 2016, 6, 4559–4563. [Google Scholar] [CrossRef]
- Pastori, G.; Wahab, K.; Bucci, A.; Bellachioma, G.; Zuccaccia, C.; Llorca, J.; Idriss, H.; Macchioni, A. Heterogenized water oxidation catalysts prepared by immobilizing Kläui-type organometallic precursors. Chem. A Eur. J. 2016, 22, 13459–13463. [Google Scholar] [CrossRef] [PubMed]
- Hong, D.; Murakami, M.; Yamada, Y.; Fukuzumi, S. Efficient water oxidation by cerium ammonium nitrate with [IrIII(Cp*)(4, 4′-bishydroxy-2, 2′-bipyridine)(H2O)]2+ as a precatalyst. Energy Environ. Sci. 2012, 5, 5708–5716. [Google Scholar] [CrossRef]
- Harriman, A.; Richoux, M.-C.; Christensen, P.A.; Mosseri, S.; Neta, P. Redox reactions with colloidal metal oxides. Comparison of radiation-generated and chemically generated RuO2 2H2O. J. Chem. Soc. Faraday Trans. 1 Phys. Chem. Condens. Phases 1987, 83, 3001–3014. [Google Scholar] [CrossRef]
- Harriman, A.; Pickering, I.J.; Thomas, J.M.; Christensen, P.A. Metal oxides as heterogeneous catalysts for oxygen evolution under photochemical conditions. J. Chem. Soc. Faraday Trans. 1 Phys. Chem. Condens. Phases 1988, 84, 2795–2806. [Google Scholar] [CrossRef]
- Morris, N.D.; Suzuki, M.; Mallouk, T.E. Kinetics of Electron Transfer and Oxygen Evolution in the Reaction of [Ru(bpy)3]3+ with Colloidal Iridium Oxide. J. Phys. Chem. A 2004, 108, 9115–9119. [Google Scholar] [CrossRef]
- Ping, Y.; Galli, G.; Goddard, W.A., III. Electronic Structure of IrO2: The Role of the Metal d Orbitals. J. Phys. Chem. C 2015, 119, 11570–11577. [Google Scholar] [CrossRef]
- He, J.; Zhou, X.; Xu, P.; Sun, J. Regulating Electron Redistribution of Intermetallic Iridium Oxide by Incorporating Ru for Efficient Acidic Water Oxidation. Adv. Energy Mater. 2021, 11, 2102883. [Google Scholar] [CrossRef]
- Kawasaki, S.; Takahashi, R.; Akagi, K.; Yoshinobu, J.; Komori, F.; Horiba, K.; Kumigashira, H.; Iwashina, K.; Kudo, A.; Lippmaa, M. Electronic Structure and Photoelectrochemical Properties of an Ir-Doped SrTiO3 Photocatalyst. J. Phys. Chem. C 2014, 118, 20222–20228. [Google Scholar] [CrossRef]
- Sun, W.; Liu, J.-Y.; Gong, X.-Q.; Zaman, W.Q.; Cao, L.-M.; Yang, J. OER activity manipulated by IrO6 coordination geometry: An insight from pyrochlore iridates. Sci. Rep. 2016, 6, 38429. [Google Scholar] [CrossRef]
- Kahk, J.M.; Poll, C.G.; Oropeza, F.E.; Ablett, J.M.; Céolin, D.; Rueff, J.-P.; Agrestini, S.; Utsumi, Y.; Tsuei, K.D.; Liao, Y.F.; et al. Understanding the Electronic Structure of IrO2 Using Hard-X-ray Photoelectron Spectroscopy and Density-Functional Theory. Phys. Rev. Lett. 2014, 112, 117601. [Google Scholar] [CrossRef]
- Alrushaid, M.; Nadeem, M.A.; Wahab, K.A.; Idriss, H. Extracting Turnover Frequencies of Electron Transfer in Heterogeneous Catalysis: A Study of IrO2-TiO2 Anatase for Water Oxidation Using Ce4+ Cations. Catalysts 2021, 11, 1030. [Google Scholar] [CrossRef]
- Liu, B.; Yang, H.; Hu, P.; Wang, G.-S.; Guo, Y.; Zhao, H. Dimension Engineering in Noble-Metal-Based Nanocatalysts. Catalysts 2024, 14, 9. [Google Scholar] [CrossRef]
- Reinecke, B.N.; Kuhl, K.P.; Ogasawara, H.; Li, L.; Voss, J.; Abild-Pedersen, F.; Nilsson, A.; Jaramillo, T.F. Elucidating the electronic structure of supported gold nanoparticles and its relevance to catalysis by means of hard X-ray photoelectron spectroscopy. Surf. Sci. 2016, 650, 24–33. [Google Scholar] [CrossRef]
- Boyen, H.-G.; Kästle, G.; Weigl, F.; Koslowski, B.; Dietrich, C.; Ziemann, P.; Spatz, J.P.; Riethmüller, S.; Hartmann, C.; Möller, M.; et al. Oxidation-Resistant Gold-55 Clusters. Science 2002, 297, 1533. [Google Scholar] [CrossRef] [PubMed]
- McGuirk, G.M.; Ledieu, J.; Gaudry, É.; de Weerd, M.-C.; Fournée, V. Surface structures of In-Pd intermetallic compounds. I. Experimental study of In thin films on Pd(111) and alloy formation. J. Chem. Phys. 2014, 141, 084702. [Google Scholar] [CrossRef] [PubMed]
- McClure, J.P.; Boltersdorf, J.; Baker, D.R.; Farinha, T.G.; Dzuricky, N.; Villegas, C.E.P.; Rocha, A.R.; Leite, M.S. Structure–Property-Performance Relationship of Ultrathin Pd–Au Alloy Catalyst Layers for Low-Temperature Ethanol Oxidation in Alkaline Media. ACS Appl. Mater. Interfaces 2019, 11, 24919–24932. [Google Scholar] [CrossRef]
- Dash, P.; Bond, T.; Fowler, C.; Hou, W.; Coombs, N.; Scott, R.W.J. Rational Design of Supported PdAu Nanoparticle Catalysts from Structured Nanoparticle Precursors. J. Phys. Chem. C 2009, 113, 12719–12730. [Google Scholar] [CrossRef]
- Sellidj, A.; Koel, B.E. Electronic and CO chemisorption properties of ultrathin Pd films vapor deposited on Au(111). Phys. Rev. B 1994, 49, 8367–8376. [Google Scholar] [CrossRef]
- Nahm, T.U.; Jung, R.; Kim, J.-Y.; Park, W.-G.; Oh, S.-J.; Park, J.-H.; Allen, J.W.; Chung, S.-M.; Lee, Y.S.; Whang, C.N. Electronic structure of disordered Au-Pd alloys studied by electron spectroscopies. Phys. Rev. B 1998, 58, 9817–9825. [Google Scholar] [CrossRef]
- Hutchings, G.J. Nanocrystalline gold and gold–palladium alloy oxidation catalysts: A personal reflection on the nature of the active sites. Dalton Trans. 2008, 5523–5553. [Google Scholar] [CrossRef]
- Marx, S.; Baiker, A. Beneficial Interaction of Gold and Palladium in Bimetallic Catalysts for the Selective Oxidation of Benzyl Alcohol. J. Phys. Chem. C 2009, 113, 6191–6201. [Google Scholar] [CrossRef]
- Boltersdorf, J.; Leff, A.C.; Forcherio, G.T.; Baker, D.R. Plasmonic Au–Pd Bimetallic Nanocatalysts for Hot-Carrier-Enhanced Photocatalytic and Electrochemical Ethanol Oxidation. Crystals 2021, 11, 226. [Google Scholar]
- Idriss, H.; Khaja, A.W. Photocatalyst Comprising Gold-Palladium Alloy, Method for Preparation, Photolysis System. PCT Patents WO2014033645A1, 6 March 2014. [Google Scholar]
- Waterhouse, G.I.N.; Wahab, A.K.; Al-Oufi, M.; Jovic, V.; Sun-Waterhouse, D.; Anjum, D.; Llorca, J.; Idriss, H. Photonic Band Gap Au/TiO2 materials as highly active and stable Photocatalysts for Hydrogen production from water. Sci. Rep. 2013, 3, 2849. [Google Scholar] [CrossRef]
- Kaczur, J.J.; Yang, H.; Liu, Z.; Sajjad, S.D.; Masel, R.I. Carbon Dioxide and Water Electrolysis Using New Alkaline Stable Anion Membranes. Front. Chem. 2018, 6, 263. [Google Scholar] [CrossRef] [PubMed]
- Idriss, H. Towards large scale hydrogen production from water, what have we learned and what are the main hurdles to cross for commercialization. Energy Technol. 2021, 9, 2000843. [Google Scholar] [CrossRef]
- Yang, M.; Wang, Z.; Wang, W.; Liu, C.-J. Synthesis of AuPd alloyed nanoparticles via room-temperature electron reduction with argon glow discharge as electron source. Nanoscale Res. Lett. 2014, 9, 405. [Google Scholar]
- Xiao, Q.; Jaatinen, S.E.; Jia, J.; Arnold, D.P.; Liu, H.; Zhu, H. Efficient photocatalytic Suzuki cross-coupling reactions on Au–Pd alloy nanoparticles under visible light irradiation. Green Chem. 2014, 16, 4272–4285. [Google Scholar] [CrossRef]
- Tsuji, M.; Uto, K.; Hayashi, J.-I.; Yoshiwara, A. Synthesis of Flower-Like AuPd@SiO2 Nanoparticles with a Broad Light Extinction for Application to Efficient Dye-Sensitized Solar Cells. Part. Part. Syst. Charact. 2018, 35, 1700396. [Google Scholar] [CrossRef]
- Damasceno, J.P.V.; Maroneze, C.M.; Mathias Strauss, M.; Sigolia, F.A.; Mazali, I.O. Preparation of supported AuPd nanoalloys mediated by ionic liquid-like functionalized SBA-15: Structural correlations concerning its catalytic activity. New J. Chem. 2016, 40, 6636–6642. [Google Scholar] [CrossRef]
- Zhong, J.B.; Lu, Y.; Jiang, W.D.; Meng, Q.M.; He, X.Y.; Li, J.Z.; Chen, Y.Q. Characterization and photocatalytic property of Pd/TiO2 with the oxidation of gaseous benzene. J. Hazard. Mater. 2009, 168, 1632–1635. [Google Scholar] [CrossRef]
- Duan, K.; Liu, Z.; Li, J.; Yuan, L.; Hu, H.; Woo, S.I. Novel Pd–Au/TiO2 catalyst for the selective catalytic reduction of NOx by H2. Catal. Commun. 2014, 57, 19–22. [Google Scholar] [CrossRef]
- Bashir, S.; Wahab, A.K.; Anjum, D.; Al-Salik, Y.; Idriss, H. Ethanol photoreactions over Au-Pd/TiO2. Appl. Petrochem. Res. 2014, 4, 55–62. [Google Scholar]
- Bashir, S.; Wahab, A.K.; Idriss, H. Synergism and photocatalytic water splitting to hydrogen over Pt/TiO2 catalysts: Effect particle size. Catal. Today 2015, 240, 242–247. [Google Scholar] [CrossRef]
- Fadley, C.S. X-ray photoelectron spectroscopy: Progress and perspectives. J. Electron Spectrosc. Relat. Phenom. 2010, 178–179, 2–32. [Google Scholar] [CrossRef]
- Wang, D.; Cui, X.; Xiao, Q.; Hu, Y.; Wang, Z.; Yiu, Y.M.; Sham, T.K. Electronic behaviour of Au-Pt alloys and the 4f binding energy shift anomaly in Au bimetallics-X-ray spectroscopy studies. AIP Adv. 2018, 8, 065210. [Google Scholar] [CrossRef]
- Caux, M.; Menard, H.; Alsalik, Y.; Irvine, J.T.S.; Idriss, H. g-C3N4 influence on gold nanoparticles composition and morphology for visible light-driven hydrogen formation. Phys. Chem. Chem. Phys. 2019, 21, 15974–15987. [Google Scholar] [CrossRef]
- Heidt, L.J.; Berestecki, J. Optical Studies of Cerous Solutions. J. Am. Chem. Soc. 1955, 77, 2049–2054. [Google Scholar] [CrossRef]
- Najafpour, M.M.; Kompany-Zareh, M.; Zahraei, A.; Sedigh, D.J.; Jaccard, H.; Khoshkam, M.; Britt, R.D.; Casey, W.H. Mechanism, decomposition pathway and new evidence for self-healing of manganese oxides as efficient water oxidizing catalysts: New insights. Dalton Trans. 2013, 42, 14603–14611. [Google Scholar] [CrossRef]
- Wasylenko, D.J.; Ganesamoorthy, C.; Henderson, M.A.; Berlinguette, C.P. Unraveling the Roles of the Acid Medium, Experimental Probes, and Terminal Oxidant, (NH4)2[Ce(NO3)6], in the Study of a Homogeneous Water Oxidation Catalyst. Inorg. Chem. 2011, 50, 3662–3672. [Google Scholar] [CrossRef]
- Chen, Z.; Concepcion, J.J.; Hu, X.; Yang, W.; Hoertz, P.G.; Meyer, T.J. Concerted O atom–proton transfer in the O–O bond forming step in water oxidation. Proc. Natl. Acad. Sci. USA 2010, 107, 7225–7229. [Google Scholar] [CrossRef]
- Wadsworth, E.; Duke, F.R.; Goetz, C. Present status of cerium (IV)-cerium (III) potentials. Anal. Chem. 1957, 29, 1824–1825. [Google Scholar] [CrossRef]
- Yagi, M.; Tomita, E.; Sakita, S.; Kuwabara, T.; Nagai, K. Self-Assembly of Active IrO2 Colloid Catalyst on an ITO Electrode for Efficient Electrochemical Water Oxidation. J. Phys. Chem. B 2005, 109, 21489–21491. [Google Scholar] [CrossRef]
- Nakagawa, T.; Bjorge, N.S.; Murray, R.W. Electrogenerated IrOx Nanoparticles as Dissolved Redox Catalysts for Water Oxidation. J. Am. Chem. Soc. 2009, 131, 15578–15579. [Google Scholar] [CrossRef] [PubMed]
- Wang, C.; Schechter, A.; Feng, L. Iridium-based catalysts for oxygen evolution reaction in acidic media: Mechanism, catalytic promotion effects and recent progress. Nano Res. Energy 2023, 2, e9120056. [Google Scholar] [CrossRef]
- Eid, K.; Soliman, K.A.; Abdulmalik, D.; Mitoraj, D.; Sleim, M.H.; Liedke, M.O.; El-Sayed, H.A.; AlJaber, A.S.; Al-Qaradawi, I.Y.; Oliver Mendoza Reyes, O.M.; et al. Tailored fabrication of iridium nanoparticle sensitized titanium oxynitride nanotubes for solar driven water splitting: Experimental insights on the photocatalytic–activity–defects relationship. Catal. Sci. Technol. 2020, 10, 801–809. [Google Scholar] [CrossRef]
- Ooka, H.; Yamaguchi, A.; Takashima, T.; Hashimoto, K.; Nakamura, R. Efficiency of oxygen evolution on iridium oxide determined from the pH dependence of charge accumulation. J. Phys. Chem. C 2017, 121, 17873–17881. [Google Scholar] [CrossRef]
- Thomsen, J.M.; Huang, D.L.; Crabtree, R.H.; Brudvig, G.W. Iridium-based complexes for water oxidation. Dalton Trans. 2015, 44, 12452–12472. [Google Scholar] [CrossRef]
- Hintermair, U.; Hashmi, S.M.; Elimelech, M.; Crabtree, R.H. Particle formation during oxidation catalysis with Cp* iridium complexes. J. Am. Chem. Soc. 2012, 134, 9785–9795. [Google Scholar] [CrossRef]
- Jovic, V.; Chen, W.-T.; Blackford, M.G.; Idriss, H.; Waterhouse, G.I.N. Effect of Gold Loading and TiO2 Support Composition on the Activity of Au/TiO2 Photocatalysts for H2 Production from Ethanol-Water Mixtures. J. Catalysis 2013, 305, 307–317. [Google Scholar] [CrossRef]
- Fu, X.; Clark, L.A.; Yang, Q.; Anderson, M.A. Enhanced Photocatalytic Performance of Titania-Based Binary Metal Oxides: TiO2/SiO2 and TiO2/ZrO2. Environ. Sci. Technol. 1996, 30, 647–653. [Google Scholar] [CrossRef]
Figure 1.
(A) Plot of Pd at. % as a function of wt. % of the series Au-Pd/TiO2 (anatase + rutile) prepared for water oxidation. (B) Plot of Au at. % as a function of wt. % of the same series in (A). (C) plot of Au at. % as a function of Pd at. % of the same series in (A). The composition of the catalysts S1 to S9 is given in Table 1. Catalysts S3, S5, and S6 (red) are those found to be active for oxygen production.


Figure 2.
(A) Valence band XPS of a series of Au-Pd/TiO2 with 1 to 3 and 1 to 2 Au/Pd nominal atomic ratios. (B) Valence band XPS of a series of Au-Pd/TiO2 with 3 to 1, 2 to 1, and 1 to 1 Au/Pd nominal atomic ratios. The composition of catalysts is given in Table 1. The position of the Pd4d lines is in the shaded area in grey.

Figure 3.
O2 evolution reaction over 1.45 wt. % Au-1.57 wt. % Pd/TiO2 (anatase + rutile) using 20 mg of catalyst. The concentration of CAN ranges from 0.023 to 0.183 M (250–2000 mg) in 20 mL of water.
Figure 3.
O2 evolution reaction over 1.45 wt. % Au-1.57 wt. % Pd/TiO2 (anatase + rutile) using 20 mg of catalyst. The concentration of CAN ranges from 0.023 to 0.183 M (250–2000 mg) in 20 mL of water.

Figure 4.
O2 evolution reaction over 1.45 wt. % Au-1.57 wt. % Pd/TiO2 (anatase + rutile) with 5000 mg (0.456 M) of CAN using 20 mg of catalyst. Inset: O2 evolution reaction over the same catalyst and the same CAN concentration using 40 mg of catalyst at different pH. CAN was directly added to the water and in the second reaction, pH was pre-adjusted to 1 before adding the CAN.

Figure 5.
(A) Effect of catalyst concentration on O2 evolution reaction with 1.15 wt. % Au-1.87 wt. % Pd /TiO2 (anatase + rutile) with 0.091 M of CAN using 5–40 mg of catalyst. (B) Effect of Au/Pd ratio on O2 evolution reaction with 0.091 M of CAN using 40 mg of catalyst.
Figure 5.
(A) Effect of catalyst concentration on O2 evolution reaction with 1.15 wt. % Au-1.87 wt. % Pd /TiO2 (anatase + rutile) with 0.091 M of CAN using 5–40 mg of catalyst. (B) Effect of Au/Pd ratio on O2 evolution reaction with 0.091 M of CAN using 40 mg of catalyst.

Figure 6.
O2 evolution reaction over 1 wt. % IrO2/TiO2 (anatase) using 20 mg of catalyst. The concentration of CAN ranges from 0.0456 to 0.184 M (500–2000 mg) in 20 mL of water.
Figure 6.
O2 evolution reaction over 1 wt. % IrO2/TiO2 (anatase) using 20 mg of catalyst. The concentration of CAN ranges from 0.0456 to 0.184 M (500–2000 mg) in 20 mL of water.

Figure 7.
O2 evolution reaction over 1 wt. % IrO2/TiO2 (anatase + rutile) using 20 mg of catalyst. The concentration of CAN ranges from 0.023 to 0.184 M (250–2000 mg) in 20 mL of water.
Figure 7.
O2 evolution reaction over 1 wt. % IrO2/TiO2 (anatase + rutile) using 20 mg of catalyst. The concentration of CAN ranges from 0.023 to 0.184 M (250–2000 mg) in 20 mL of water.

Figure 8.
O2 evolution reaction over 1 wt. % IrO2/CeO2 using 20 mg of catalyst. The concentration of CAN ranges from 0.023 to 0.184 M (250–2000 mg) in 20 mL of water.
Figure 8.
O2 evolution reaction over 1 wt. % IrO2/CeO2 using 20 mg of catalyst. The concentration of CAN ranges from 0.023 to 0.184 M (250–2000 mg) in 20 mL of water.

Figure 9.
(A) Ln r as a function of Ln C, where C is the concentration of cerium ammonium nitrate and r is the rate of evolution of O2; R2 values from top-to-bottom lines are 0.9844, 0.9037, 0.7942, and 0.9415. (B) 1/r (gcatal. min/mol) vs. 1/C (gcatal./mol); R2 values from top-to-bottom lines are 0.9633, 0.9633, 0.9543, and 0.9069.


Figure 10.
Comparison of the TOFs of Au-Pd/TiO2 (anatase + rutile) and Ir-based catalysts for the oxygen evolution reaction as a function of [CAN].
Figure 10.
Comparison of the TOFs of Au-Pd/TiO2 (anatase + rutile) and Ir-based catalysts for the oxygen evolution reaction as a function of [CAN].


Table 1.
Weight and atom% of Au and Pd of the Au-Pd/TiO2 catalysts series, extracted from XPS Au4f and Pd3d lines.
Table 1.
Weight and atom% of Au and Pd of the Au-Pd/TiO2 catalysts series, extracted from XPS Au4f and Pd3d lines.
| Catalyst | Area CPS. eV | Sensitivity Factor | Corrected Area | Atomic% | Mol. Wt. | Mol. Wt. × at.% | wt. % | |
|---|---|---|---|---|---|---|---|---|
| 1.96 wt. % Au–1.06 wt. % Pd | Au 4f | 63.80 | 5.24 | 12.18 | 0.33 | 107.86 | 35.53 | 1.64 |
| Pd 3d | 36.60 | 4.60 | 7.96 | 0.22 | 106.42 | 22.91 | 1.06 | |
| Ti 2p | 1318.90 | 1.80 | 733.54 | 19.85 | 47.87 | 950.02 | 43.94 | |
| O 1s | 1304.10 | 0.71 | 1834.18 | 49.63 | 16.00 | 794.03 | 36.72 | |
| C 1s | 328.00 | 0.30 | 1108.11 | 29.98 | 12.00 | 359.78 | 16.64 | |
| S1 | Total | 3695.95 | 100.00 | 2162.27 | 100.00 | |||
| 2.38 wt. % Au–0.65 wt. % Pd | Au 4f | 57.80 | 5.24 | 11.03 | 0.31 | 107.86 | 33.57 | 1.66 |
| Pd 3d | 2.96 | 4.60 | 0.64 | 0.02 | 106.42 | 1.93 | 0.10 | |
| Ti 2p | 1083.30 | 1.80 | 602.50 | 17.00 | 47.87 | 813.70 | 40.16 | |
| O 1s | 1164.80 | 0.71 | 1638.26 | 46.22 | 16.00 | 739.55 | 36.50 | |
| C 1s | 382.40 | 0.30 | 1291.89 | 36.45 | 12.00 | 437.40 | 21.59 | |
| S2 | Total | 3544.32 | 100.00 | 2026.14 | 100.00 | |||
| 1.45 wt. % Au–1.575 wt. % Pd | Au 4f | 13.70 | 5.24 | 2.61 | 0.08 | 196.97 | 15.33 | 0.68 |
| Pd 3d | 67.50 | 4.60 | 14.67 | 0.44 | 106.42 | 46.49 | 2.07 | |
| Ti 2p | 1292.70 | 1.80 | 718.97 | 21.41 | 47.87 | 1024.61 | 45.65 | |
| O 1s | 1318.90 | 0.71 | 1854.99 | 55.23 | 16.00 | 883.64 | 39.37 | |
| C 1s | 227.20 | 0.30 | 767.57 | 22.85 | 12.00 | 274.23 | 12.22 | |
| S3 | Total | 3358.81 | 100.00 | 2244.30 | 100.00 | |||
| 2.54 wt. % Au–0.46 wt. % Pd | Au 4f | 44.60 | 5.24 | 8.51 | 0.24 | 107.86 | 25.74 | 1.27 |
| Pd 3d | 1.80 | 4.60 | 0.39 | 0.01 | 106.42 | 1.17 | 0.06 | |
| Ti 2p | 1102.00 | 1.80 | 612.90 | 17.18 | 47.87 | 822.41 | 40.55 | |
| O 1s | 1193.00 | 0.71 | 1677.92 | 47.04 | 16.00 | 752.58 | 37.10 | |
| C 1s | 375.20 | 0.30 | 1267.57 | 35.53 | 12.00 | 426.40 | 21.02 | |
| S4 | Total | 3567.29 | 100.00 | 2028.29 | 100.00 | |||
| 1.15 wt. % Au–1.86 wt. % Pd | Au 4f | 11.70 | 5.24 | 2.23 | 0.06 | 107.86 | 7.01 | 0.34 |
| Pd 3d | 95.00 | 4.60 | 20.65 | 0.60 | 106.42 | 63.97 | 3.09 | |
| Ti 2p | 1049.20 | 1.80 | 583.54 | 16.99 | 47.87 | 813.03 | 39.33 | |
| O 1s | 1190.50 | 0.71 | 1674.40 | 48.74 | 16.00 | 779.80 | 37.72 | |
| C 1s | 341.80 | 0.30 | 1154.73 | 33.61 | 12.00 | 403.33 | 19.51 | |
| S5 | Total | 3435.55 | 100.00 | 2067.15 | 100.00 | |||
| 2.29 wt. % Au–3.72 wt. % Pd | Au 4f | 21.10 | 5.24 | 4.03 | 0.12 | 107.86 | 13.18 | 0.58 |
| Pd 3d | 155.00 | 4.60 | 33.70 | 1.02 | 106.42 | 108.85 | 4.81 | |
| Ti 2p | 1210.20 | 1.80 | 673.08 | 20.43 | 47.87 | 978.03 | 43.24 | |
| O 1s | 1293.70 | 0.71 | 1819.55 | 55.23 | 16.00 | 883.76 | 39.07 | |
| C 1s | 226.10 | 0.30 | 763.85 | 23.19 | 12.00 | 278.25 | 12.30 | |
| S6 | Total | 3294.20 | 100.00 | 2262.08 | 100.00 | |||
| 0.40 wt. % Au–0.65 wt. % Pd | Au 4f | 2.74 | 5.24 | 0.52 | 0.01 | 107.86 | 1.59 | 0.08 |
| Pd 3d | 1.68 | 4.60 | 0.36 | 0.01 | 106.42 | 1.09 | 0.06 | |
| Ti 2p | 1005.70 | 1.80 | 559.34 | 15.79 | 47.87 | 755.67 | 38.80 | |
| O 1s | 1128.30 | 0.71 | 1586.92 | 44.79 | 16.00 | 716.63 | 36.79 | |
| C 1s | 413.20 | 0.30 | 1395.95 | 39.40 | 12.00 | 472.79 | 24.27 | |
| S7 | Total | 3543.10 | 100.00 | 1947.77 | 100.00 | |||
| 3 wt. % Pd | Au 4f | 5.24 | 0.00 | 0.00 | 107.86 | 0.00 | 0.00 | |
| Pd 3d | 20.40 | 4.60 | 4.43 | 0.12 | 106.42 | 13.13 | 0.59 | |
| Ti 2p | 1453.30 | 1.80 | 808.29 | 22.49 | 47.87 | 1076.44 | 48.03 | |
| O 1s | 1424.50 | 0.71 | 2003.52 | 55.74 | 16.00 | 891.87 | 39.79 | |
| C 1s | 230.30 | 0.30 | 778.04 | 21.65 | 12.00 | 259.76 | 11.59 | |
| S8 | Total | 3594.28 | 100.00 | 2241.20 | 100.00 | |||
| 3 wt. % Au | Au 4f | 64.80 | 5.24 | 12.37 | 0.37 | 107.86 | 40.04 | 1.71 |
| Pd 3d | 4.60 | 0.00 | 0.00 | 106.42 | 0.00 | 0.00 | ||
| Ti 2p | 1459.20 | 1.80 | 811.57 | 24.36 | 47.87 | 1166.01 | 49.83 | |
| O 1s | 1366.00 | 0.71 | 1921.24 | 57.67 | 16.00 | 922.66 | 39.43 | |
| C 1s | 173.60 | 0.30 | 586.49 | 17.60 | 12.00 | 211.24 | 9.03 | |
| S9 | Total | 3331.66 | 100.00 | 2339.94 | 100.00 |
Table 2.
O2 evolution reactions over 1.45 wt. % Au–1.57 wt. % Pd/TiO2 (anatase + rutile) with increasing CAN concentrations. The reactions were performed using 20 mg of catalyst in 20 mL of water.
Table 2.
O2 evolution reactions over 1.45 wt. % Au–1.57 wt. % Pd/TiO2 (anatase + rutile) with increasing CAN concentrations. The reactions were performed using 20 mg of catalyst in 20 mL of water.
| Concentration of CAN (M) | [Ce4+]/[Au + Pd] | TON | TOF (min−1) | Moles/min |
|---|---|---|---|---|
| 0.023 | 105.31 | 13.02 | 0.07 | 2.89 × 10⁻⁷ |
| 0.046 | 210.63 | 21.20 | 0.14 | 6.32 × 10⁻⁷ |
| 0.068 | 315.94 | 37.75 | 0.16 | 6.96 × 10⁻⁷ |
| 0.091 | 421.26 | 71.77 | 0.17 | 7.32 × 10⁻⁷ |
| 0.137 | 631.89 | 107.81 | 0.34 | 1.49 × 10⁻⁶ |
| 0.182 | 842.52 | 121.33 | 0.35 | 1.57 × 10⁻⁶ |
Table 3.
Effect of catalyst concentration, 1.15 wt. % Au-1.87 wt. % Pd/TiO2 (anatase + rutile), on O2 production. Reaction time of 250 min. The reactions were performed using 20 mL of water with 0.091 M CAN.
Table 3.
Effect of catalyst concentration, 1.15 wt. % Au-1.87 wt. % Pd/TiO2 (anatase + rutile), on O2 production. Reaction time of 250 min. The reactions were performed using 20 mL of water with 0.091 M CAN.
| Catalyst Weight (g) | TON ([O2]/[Au + Pd]) | TOF (min−1) | Moles/min | Moles/(min/gcatal.) |
|---|---|---|---|---|
| 0.005 | 43.70 | 0.15 | 1.80 × 10⁻⁷ | 3.60 × 10⁻⁵ |
| 0.01 | 42.15 | 0.21 | 4.87 × 10⁻⁷ | 4.87 × 10⁻⁵ |
| 0.02 | 42.87 | 0.17 | 8.04 × 10⁻⁷ | 4.02 × 10⁻⁵ |
| 0.04 | 41.19 | 0.15 | 1.39 × 10⁻⁶ | 3.48 × 10⁻⁵ |
Table 4.
Effect of composition of Au-Pd/TiO2 (anatase + rutile) catalysts on O2 evolution reactions. The reactions were performed using 40 mg of catalyst in 20 mL of water with 0.091 M CAN.
Table 4.
Effect of composition of Au-Pd/TiO2 (anatase + rutile) catalysts on O2 evolution reactions. The reactions were performed using 40 mg of catalyst in 20 mL of water with 0.091 M CAN.
| Au wt. % | Pd wt. % | Nominal Atomic Ratio of Au/Pd | Moles/min |
|---|---|---|---|
| 1.45 | 1.57 | 1:2 | 1.00 × 10⁻⁶ |
| 1.15 | 1.86 | 1:3 | 1.39 × 10⁻⁶ |
| 2.29 | 3.72 | 1:3 | 2.30 × 10⁻⁶ |
| 1.96 | 1.06 | 1:1 | No reaction |
| 2.38 | 0.65 | 2:1 | No reaction |
| 2.54 | 0.46 | 3:1 | No reaction |
Table 5.
O2 evolution reaction over 1 wt. % IrO2/TiO2 (anatase) with increasing CAN concentration. The reactions were performed using 20 mg of catalyst in 20 mL of water.
Table 5.
O2 evolution reaction over 1 wt. % IrO2/TiO2 (anatase) with increasing CAN concentration. The reactions were performed using 20 mg of catalyst in 20 mL of water.
| Concentration of CAN (M) | Ce4+/Ir (Atomic Ratio) | TON | TOF (min−1) | Moles/min |
|---|---|---|---|---|
| 0.023 | 437.7 | 81.08 | 0.57 | 5.98 × 10⁻⁷ |
| 0.046 | 875.5 | 170.75 | 1.05 | 1.09 × 10⁻⁶ |
| 0.068 | 1313.2 | 243.25 | 1.54 | 1.60 × 10⁻⁶ |
| 0.091 | 1750.9 | 411.00 | 2.11 | 2.20 × 10⁻⁶ |
| 0.137 | 2626.4 | 629.80 | 4.12 | 4.29 × 10⁻⁶ |
| 0.182 | 3501.9 | 847.74 | 5.30 | 5.52 × 10⁻⁶ |
Table 6.
O2 evolution reaction over 1 wt. % IrO2/TiO2 (anatase + rutile) with increasing CAN concentration. The reactions were performed using 20 mg of catalyst in 20 mL of water.
Table 6.
O2 evolution reaction over 1 wt. % IrO2/TiO2 (anatase + rutile) with increasing CAN concentration. The reactions were performed using 20 mg of catalyst in 20 mL of water.
| Concentration of CAN (M) | Ce4+/Ir (Atomic Ratio) | TON | TOF (min−1) | Moles/min |
|---|---|---|---|---|
| 0.023 | 437.7 | 93.95 | 0.40 | 4.14 × 10⁻⁷ |
| 0.046 | 875.5 | 170.75 | 1.08 | 1.12 × 10⁻⁶ |
| 0.068 | 1313.2 | 253.98 | 1.37 | 1.43 × 10⁻⁶ |
| 0.091 | 1750.9 | 343.64 | 1.68 | 1.75 × 10⁻⁶ |
| 0.137 | 2626.4 | 450.04 | 1.81 | 1.88 × 10⁻⁶ |
| 0.182 | 3501.9 | 565.02 | 2.17 | 2.26 × 10⁻⁶ |
Table 7.
O2 evolution reaction over 1 wt. % IrO2/CeO2 with increasing CAN concentration. The reactions were performed using 20 mg of catalyst in 20 mL of water.
Table 7.
O2 evolution reaction over 1 wt. % IrO2/CeO2 with increasing CAN concentration. The reactions were performed using 20 mg of catalyst in 20 mL of water.
| Concentration of CAN (M) | Ce4+/Ir (Atomic Ratio) | TON | TOF (min−1) | Moles/min |
|---|---|---|---|---|
| 0.023 | 437.7 | 74.65 | 0.35 | 3.61 × 10⁻⁷ |
| 0.046 | 875.5 | 196.49 | 1.11 | 1.16 × 10⁻⁶ |
| 0.068 | 1313.2 | 226.52 | 1.19 | 1.24 × 10⁻⁶ |
| 0.091 | 1750.9 | 498.52 | 1.39 | 1.45 × 10⁻⁶ |
| 0.137 | 2626.4 | 506.67 | 1.49 | 1.55 × 10⁻⁶ |
| 0.182 | 3501.9 | 619.50 | 1.60 | 1.67 × 10⁻⁶ |
Table 8.
List of catalysts found to be inactive for the O2 evolution reaction using 40 mg of each in 20 mL of water in the presence of 0.091 M of CAN.
Table 8.
List of catalysts found to be inactive for the O2 evolution reaction using 40 mg of each in 20 mL of water in the presence of 0.091 M of CAN.
| Catalyst | Remarks |
|---|---|
| 1 wt. % Pt/TiO2 | No activity |
| 3 wt. % Au/TiO2 | No activity |
| 3 wt. % Pd/TiO2 | No activity |
| 1 wt. % Ru/SrTiO3 | No activity |
| 1 wt. % Rh–1 wt. % Ru/SrTiO3 | No activity |
| Fe2O3 | No activity |
| 0.1 wt. % Ag–0.3 wt. % Pd/TiO2 | No activity |
Table 9.
Reaction rates, rates constants (k), and binding constants (K) using the rate law and Langmuir–Hinshelwood (L–H) equations over Au-Pd- and IrO2-based catalysts.
Table 9.
Reaction rates, rates constants (k), and binding constants (K) using the rate law and Langmuir–Hinshelwood (L–H) equations over Au-Pd- and IrO2-based catalysts.
| Catalyst | Reaction Order | BET Surface Area m2/gcatal. | k (Rate Low) L/(min. gcatal.) | k (Rate Law) L/(min. m2) | k (L–H) mol/(min. gcatal.). | k (L–H) mol/(min. m2) | K (g/mol) |
|---|---|---|---|---|---|---|---|
| Au-Pd/TiO2 (A/R) | 0.8 | 40 | 3.07 × 10⁻⁴ | 7.68 × 10⁻⁶ | 1.7 × 10⁻⁴ | 4.25 × 10⁻⁶ | 4.12 |
| IrO2/TiO2 Anatase | 1.14 | 40 | 1.69 × 10⁻³ | 4.23 × 10⁻⁵ | 8.4 × 10⁻³ | 2.11 × 10⁻⁴ | 0.15 |
| IrO2/TiO2 (A/R) | 0.77 | 40.5 | 4.81 × 10⁻⁴ | 1.19 × 10⁻⁵ | 1.4 × 10⁻³ | 4.02 × 10⁻⁶ | 0.71 |
| IrO2/CeO2 | 0.67 | 30.6 | 1.34 × 10⁻⁴ | 4.36 × 10⁻⁶ | 6.0 × 10⁻⁴ | 3.27 × 10⁻⁶ | 1.48 |
Disclaimer/Publisher’s Note: The statements, opinions and data contained in all publications are solely those of the individual author(s) and contributor(s) and not of MDPI and/or the editor(s). MDPI and/or the editor(s) disclaim responsibility for any injury to people or property resulting from any ideas, methods, instructions or products referred to in the content. |
© 2024 by the authors. Licensee MDPI, Basel, Switzerland. This article is an open access article distributed under the terms and conditions of the Creative Commons Attribution (CC BY) license (https://creativecommons.org/licenses/by/4.0/).
Share and Cite
MDPI and ACS Style
Wahab, K.; Idriss, H. Water Oxidation over Au-Pd/TiO2 as a Substitute for Iridium-Based Catalysts. Catalysts 2024, 14, 87. https://doi.org/10.3390/catal14010087
AMA Style
Wahab K, Idriss H. Water Oxidation over Au-Pd/TiO2 as a Substitute for Iridium-Based Catalysts. Catalysts. 2024; 14(1):87. https://doi.org/10.3390/catal14010087
Chicago/Turabian StyleWahab, Khaja, and Hicham Idriss. 2024. "Water Oxidation over Au-Pd/TiO2 as a Substitute for Iridium-Based Catalysts" Catalysts 14, no. 1: 87. https://doi.org/10.3390/catal14010087
Note that from the first issue of 2016, this journal uses article numbers instead of page numbers. See further details here.