Article

Pd-Bi-Based Catalysts for Selective Oxidation of Glucose into Gluconic Acid: The Role of Local Environment of Nanoparticles in Dependence of Their Composition

by
Mariya P. Shcherbakova-Sandu
1,*,
Andrey A. Saraev
2,
Alexey S. Knyazev
3 and
Irina A. Kurzina
1
1
Department of Natural Compounds, Pharmaceutical and Medicinal Chemistry, National Research Tomsk State University, 36 Lenin Ave., 634050 Tomsk, Russia
2
Synchrotron Radiation Facility SKIF, Boreskov Institute of Catalysis, Nikol’skiy Ave., 1, 630559 Kol’tsovo, Russia
3
LLC “Engineering Chemical Technological Center”, 7 Alekseya Belenca str., 634050 Tomsk, Russia
*
Author to whom correspondence should be addressed.
Catalysts 2024, 14(1), 66; https://doi.org/10.3390/catal14010066
Submission received: 8 December 2023 / Revised: 8 January 2024 / Accepted: 11 January 2024 / Published: 15 January 2024
(This article belongs to the Section Nanostructured Catalysts)

Abstract

:
Palladium–bismuth nanomaterials are used in various chemical applications such detectors, electrodes, and catalysts. Pd-Bi catalysts are attracting widespread interest because these catalysts enable the production of valuable products quickly and efficiently, and are environmentally friendly. However, the composition of the catalyst can have a significant impact on its catalytic performance. In this work, we identified a correlation between the composition of the catalyst and its efficiency in converting glucose into sodium gluconate. It was found that the conversion decreases with increasing bismuth content. The most active catalyst was the 0.35Bi:Pd sample with a lower bismuth content (glucose conversion of 57%). TEM, SEM, EXAFS, and XANES methods were used to describe, in detail, the surface properties of the xBi:Pd/Al2O3 catalyst samples. The increase in particle size with increasing bismuth content, observed in the TEM micrographs, was associated with the low melting point of bismuth (271 °C). The SEM method showed that palladium and bismuth particles were uniformly distributed over the surface of the support in close proximity to each other, which allowed us to conclude that an alloy of non-stoichiometric composition was formed. The EXAFS and XANES methods established that bismuth was located on the surface of the nanoparticle predominantly in an oxidized state.

Graphical Abstract

1. Introduction

Palladium–bismuth materials have found diverse applications across multiple fields. Nanowires based on Pd and Pd-Bi are commonly used as hydrogen detectors [1,2]. Meanwhile, Pd-Bi nanosheets have been utilized as electrode coatings in numerous electrooxidation reactions [3,4]. Additionally, supported Pd-Bi catalysts have demonstrated catalytic activity in reactions, attributed to palladium’s capacity to accumulate hydrogen [5]. The processes involved comprise the oxidation of formic acid, leading to the formation of carbon dioxide, hydrogen, and the hazardous 2,4-dichlorophenol, and the oxidation of carbohydrates, which results in the formation of aldonic acids and, in particular, industrially significant gluconic acid, etc. [6,7,8,9,10,11,12,13].
The effectiveness of systems using nanomaterials heavily relies on the size, composition, shape, and local environment of the nanoparticles involved [14,15,16,17,18,19,20,21]. From a mechanistic standpoint, the interaction of the substrate and the subsequent formation of intermediate compounds result in a structure that is complicated and indistinct. Various chemical environments differentiate the constituent atoms, which, in turn, affect the activation, deactivation, or presence of catalytic sites [22,23]. For instance, in hydrogen sensors based on Pd-Bi nanowires with a rough surface, bismuth is primarily in the oxidized state (~54%), whilst the majority of the palladium is in the metallic state Pd(0) (~67%) [1]. This occurrence is a result of electron transfer from bismuth to palladium. The considerable quantity of metallic-state palladium with excess electron density produces a superior hydrogen response in palladium–bismuth sensors at low temperatures. The use of Bi(OH)3 for the electrocatalytic oxidation of ethanol on palladium nanosheets enables the creation of an electron-rich state near Pd sites [3]. This excess of electrons facilitates the effective separation of the Pd ensemble, leading to the prevention of adsorption of the poisonous CO intermediate. Moreover, certain patterns have been identified in supported Pd@Bi/C catalysts that allow for the efficient production of hydrogen by means of the dehydrogenation of formic acid, and certain regularities have also been found [6]. In a well-composed catalyst, there is a partial transfer of electron density from Bi to Pd based on their electronegativity order on the Pauling scale and the depletion of the electronic state of the d-band near the Fermi level. This electronic effect decreases the binding of hydrogen or CO to the Pd’s active sites, whereas bismuth with a partially positive charge adsorbs formate ions with one active site of HCOOM∗. Witonska observed that the presence of the BiPd intermetallic compound in 5%Pd-3%Bi/Al2O3 catalysts with low bismuth content results in the enhanced dispersion of bimetallic particles and potentially increased efficacy during the hydrodechlorination reaction of 2,4-dichlorophenol to form phenol [8]. The increase in bismuth content in the 5%Pd-8%Bi/Al2O3 catalyst is linked to the formation of the Bi2Pd intermetallic compound, which leads to a decline in catalytic activity during the reaction being studied. When glucose is catalytically oxidized, bismuth—which has a greater affinity for oxygen—safeguards the active centers of palladium particles from oxidation. This is because PdO is inactive in this particular reaction [24,25]. Over the past decades, the XANES and EXAFS methods have become indispensable in the field of studying the surface properties of catalysts used in heterogeneous catalysis processes, revealing the nature of the active centers and the relationship between the local electronic structure and catalytic properties [26,27]. The EXAFS and XANES methods have demonstrated effectiveness for studying the surface and structural characteristics of palladium nanoparticles [28].
Thus, studying the local environment of promising palladium–bismuth catalysts is a strategic task for the design of effective catalysts not only based on bismuth-promoted palladium, but also for catalytic systems of other compositions. The goal of our work was to study the local environment of palladium–bismuth nanoparticles in samples of supported catalysts of various compositions, as well as to identify the relationship between the composition of the catalyst and its activity in the oxidation of glucose to produce valuable gluconic acid in the form of sodium gluconate. To study the surface characteristics of the catalysts, modern physicochemical methods of analysis (TEM, SEM, EXAFS, XANES) were used.

2. Results and Discussion

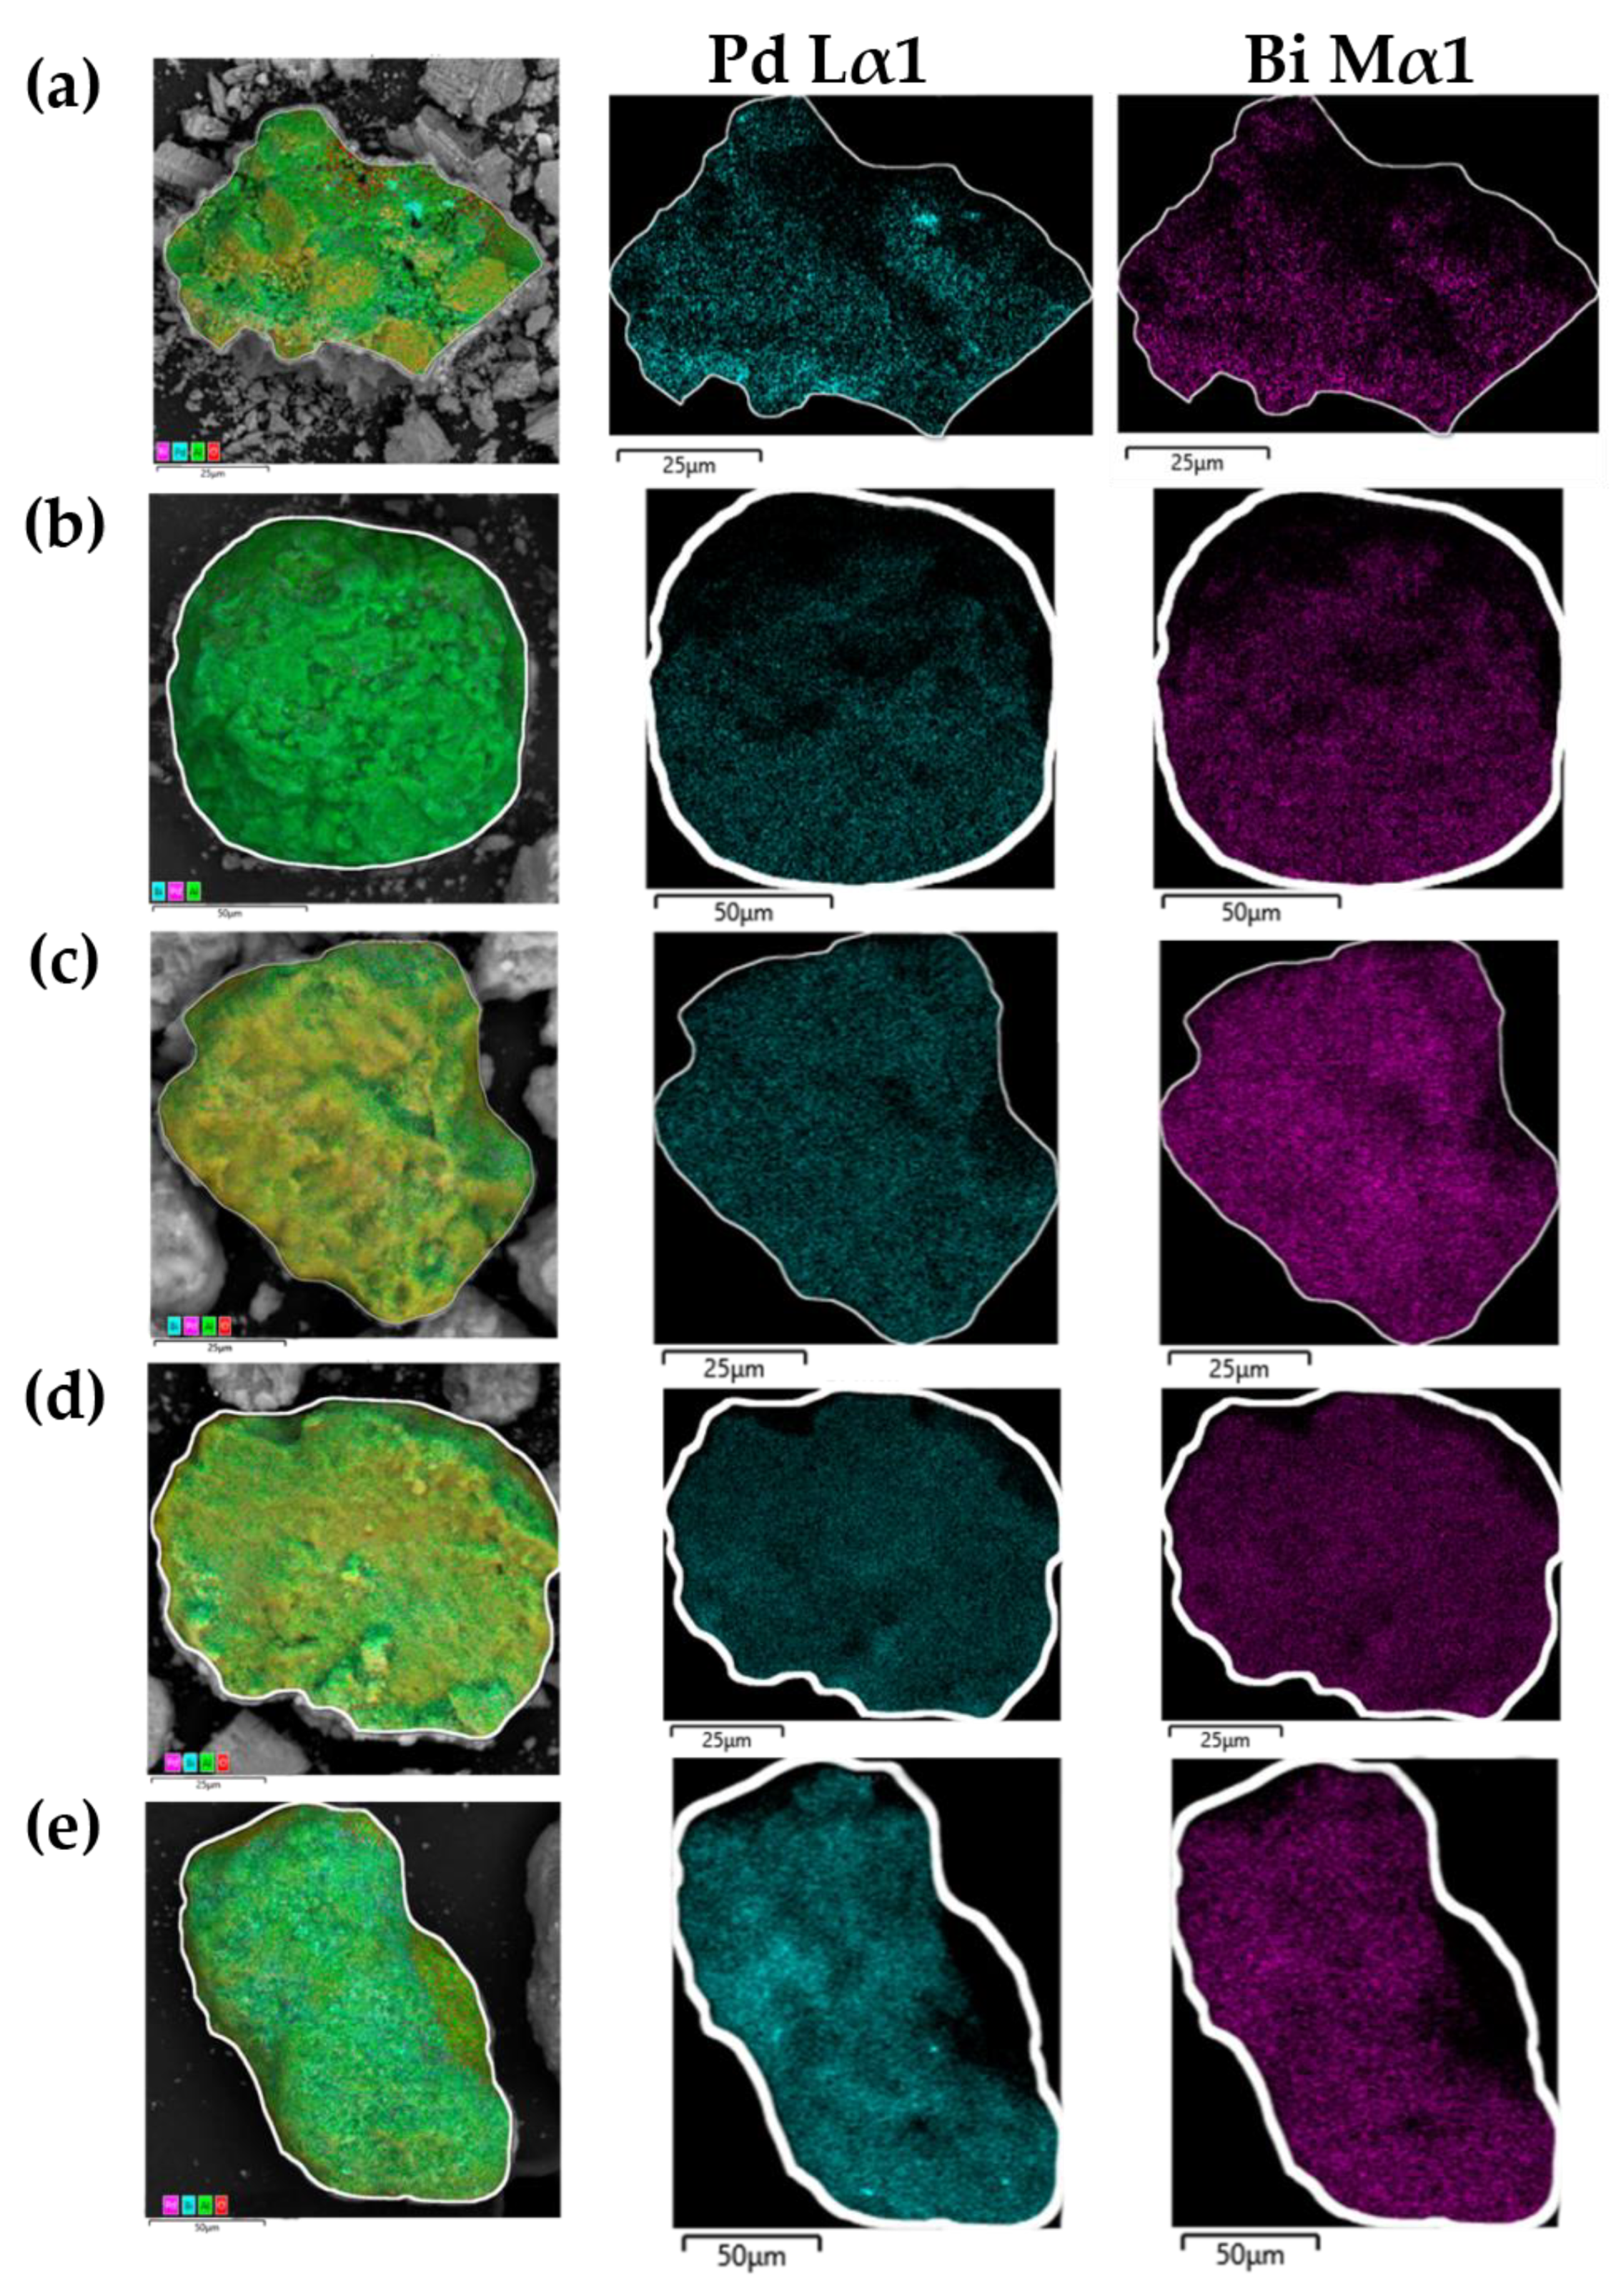
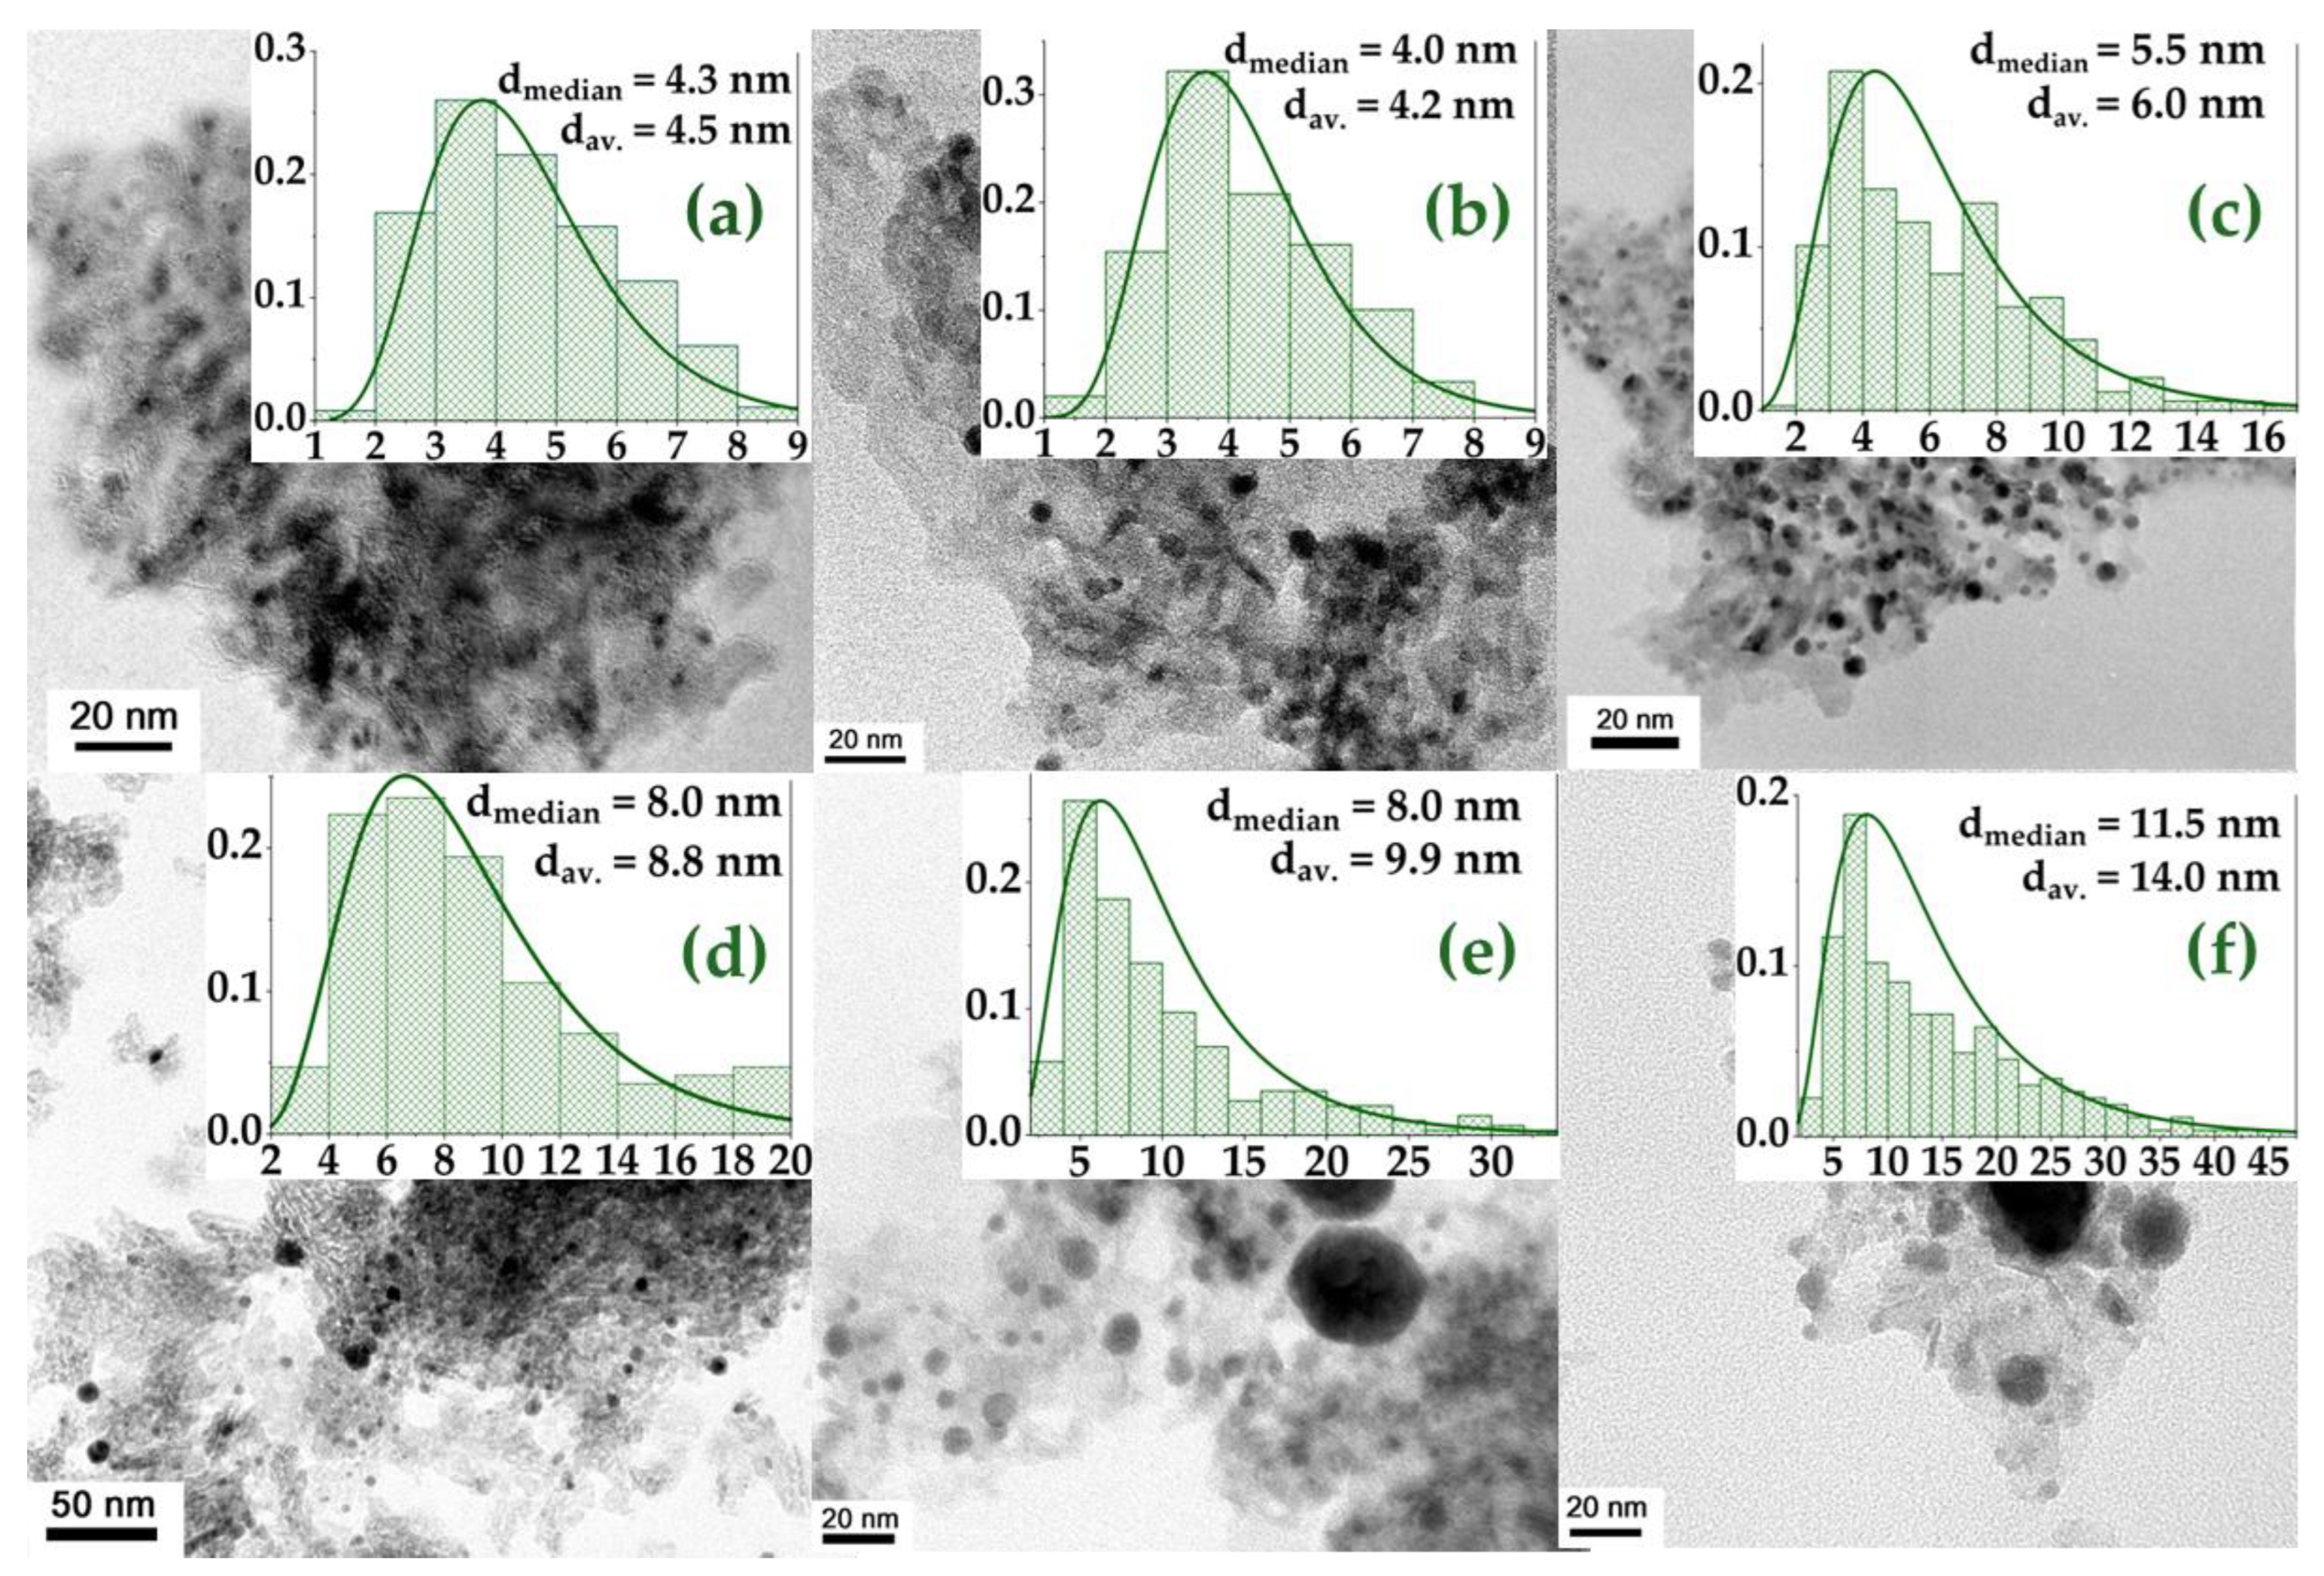
2.1. Metal Content and Surface Characterization Using Electron Microscopy

The results of the X-ray fluorescence analysis (XRF) are presented in Table 1. Palladium was chosen as the active component in the glucose oxidation reaction, and bismuth was the promoting metal. The atomic ratio between Bi/Pd in the synthesized catalysts was 0.35, 0.4, 0.5, 1.0, and 2.0. The total content of Pd and Bi on the support surface was approximately 5–6 wt. %.
The SEM-EDS micrographs (Figure 1) allow us to conclude that the palladium and bismuth atoms are evenly distributed over the surface of the catalyst grains and are likely to interact with each other. The Bi/Pd ratio in the volume of the samples, according to the elemental mapping data, is close to the theoretically calculated ratio as determined by the XRF method (Table 2).
Transmission electron microscopy (TEM) was used to study the morphology and particle size distribution of the catalysts. The TEM micrographs and histograms of the particle size distribution are shown in Figure 2. The particle size distribution follows a lognormal type of distribution; therefore, in addition to the average particle sizes, it is necessary to take into account the median diameters. The Pd/Al2O3 sample shows a relatively uniform distribution of metal particles. The shape of the particles is close to spherical, and their median diameter is ~4 nm (Figure 2a).
A similar particle size is characteristic of the sample with the lowest bismuth content, 0.35Bi:Pd/Al2O3 (Figure 2b). A further increase in the Bi content in bimetallic catalysts leads to an increase in the median diameter to 11.5 nm in the case of the sample with the highest bismuth content 2Bi:Pd/Al2O3, as well as an uneven distribution of particles over the surface of the support and coarsening of particles, reaching 45 nm in the case of 1Bi:Pd and 2Bi:Pd (Figure 2e,f). This pattern is due to the fact that the melting point of bismuth is 271 °C. An increase in the amount of bismuth leads to the sintering of particles at high temperatures (350–500 °C) during the temperature annealing of the sample in various gas atmospheres.

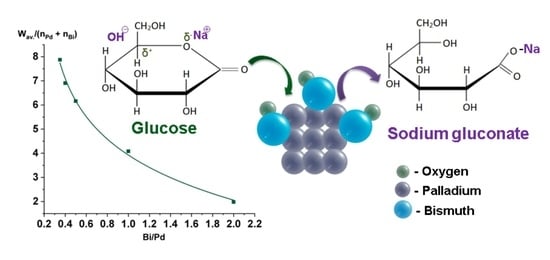
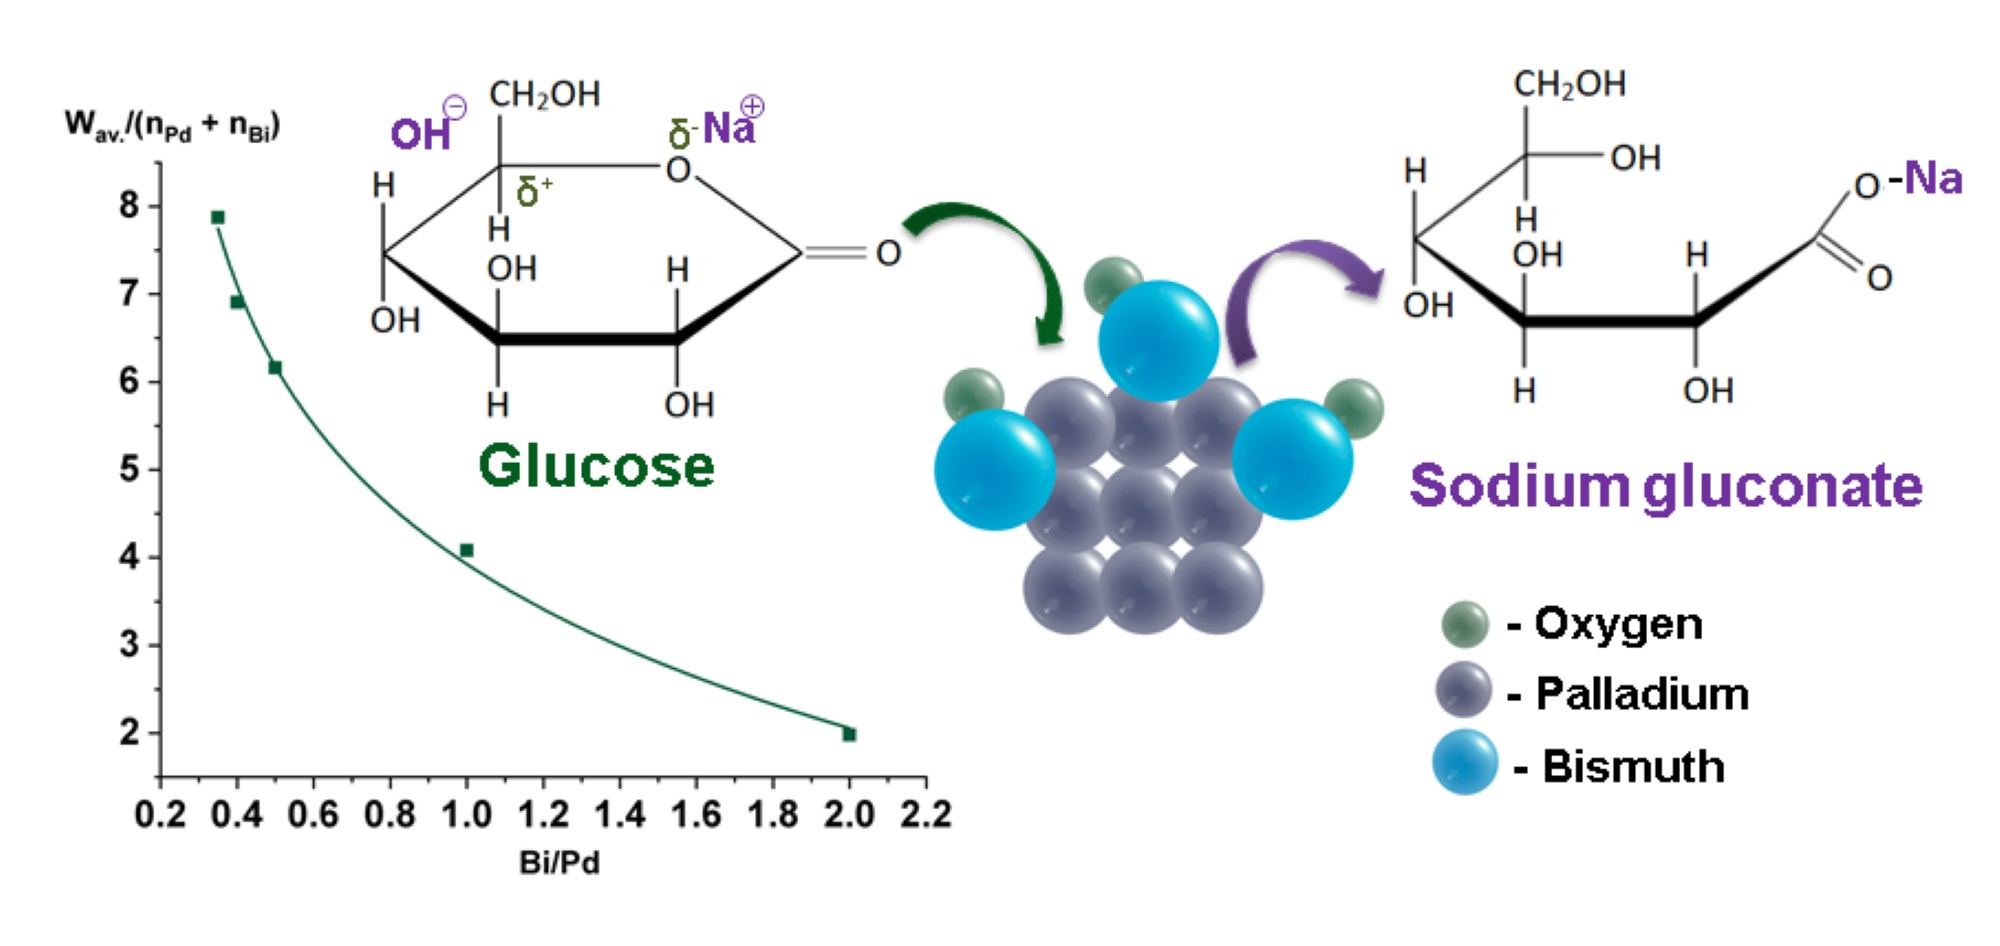
2.2. Catalytic Experiments

The obtained catalyst samples were tested in the reaction of glucose oxidation into sodium gluconate. A sample of glucose (3.1 g or 0.0172 mol) was pre-dissolved in 25 mL of distilled water. The initial glucose concentration was approximately 0.6 mol/L. Then, a portion of the catalyst was added from the ratio [Glu]:[Pd] = 5000. The pH of the medium was maintained by supplying 3 M NaOH with a peristaltic pump. Oxygen was supplied to the suspension at a flow rate of 10 mL/min. The reaction was carried out for 150 min with continuous stirring (1000 rpm). Samples for analysis were periodically taken from the reaction mixture. The results are presented in Table 3. The reference sample Pd/Al2O3 demonstrated a glucose conversion of 29% with selectivity for sodium gluconate of 93%. When bismuth was introduced to a ratio of 0.35Bi:Pd, the highest substrate conversion values were achieved (57%).
An increase in the stoichiometric Bi:Pd ratio led to a decrease in glucose. The glucose conversion (X = 28%) was close to the conversion value for monometallic Pd/Al2O3 in the presence of the catalyst with the highest bismuth content (2Bi:Pd/Al2O3). The structural isomer of glucose, fructose, was detected as the only byproduct in catalytic tests of xBi:Pd/Al2O3 samples. However, according to research by Wenkin et al. [29], the highest yield of sodium gluconate was achieved in the presence of a catalyst with the composition Bi1:Pd1 (38%). When studying a sample of the composition 0.33Bi:Pd, only a 10% yield of the desired product was achieved. Thus, the sample composition 0.35Bi:Pd exceeded the yields of sodium gluconate found in previous studies.
A correlation was found between the average reaction rate, related to the Pd and Bi amount of substances (nPd + nBi), and the Bi/Pd ratio in the catalyst samples, expressed by the logarithmic dependence presented in Figure 3. The revealed pattern makes it possible to predict the average reaction rates for catalyst samples of various compositions.

2.3. EXAFS and XANES Methods of Sample Characterization

To study the reason for the different catalytic properties of the samples, the xBi:Pd/Al2O3 catalysts were characterized using the EXAFS and XANES methods. The XAS spectra of the studied samples were approximated by a linear superposition (combination) of the XAS spectra of reference Bi samples, allowing us to estimate the chemical composition of the samples under study using XANES. Seven samples were studied: a series of PdBi catalysts and two bismuth reference compounds: metallic Bi and Bi2O3.
The XANES spectra of the Bi L3-edge of the studied catalysts and references—metallic bismuth and Bi2O3—are presented in Figure 4. One can see that the XANES spectra of the Bi L3-edges of the catalyst samples have a similar shape and are similar to the XANES spectrum of bismuth oxide Bi2O3. Indeed, there are peaks in the region of 13,440 and 13,495 eV in the XANES spectra of the studied catalysts, which are characteristic of bismuth oxide Bi2O3 (peaks A and C). However, there are some differences from the XANES spectrum of the Bi L3-edge of bismuth oxide Bi2O3. First, the energy of the edges for the catalysts is about 13,422 eV, while for bismuth oxide Bi2O3, the energy of the edge is 13,423.8 eV. Second, the intensity of the white line (peak A) for the catalyst samples is lower than for the one observed for bismuth oxide Bi2O3. Third, an additional low-intensity (peak B) is observed in the region of 13,457 eV, which is not characteristic of the XANES spectrum of the L3-edge of Bi of bismuth oxide Bi2O3. At the same time, the energy of the L3-edge of Bi for metallic bismuth is 13,419 eV. Moreover, the XANES spectrum of the Bi L3-edge of metallic bismuth has a peak at 13,458 eV (peak B).
A similar peak was observed previously, for example, after the reduction of bismuth-silicate glasses [30]. This fact allowed us to posit that the local environment of bismuth contains both oxygen atoms and bismuth and/or palladium atoms.
To estimate the chemical state of bismuth and the chemical composition of Bi-containing phases, the XANES spectra of the catalysts were approximated using a linear combination of the spectra of reference compounds using the DEMETER software package. This method is called “linear combination fitting—LCF” and is used to analyze XANES spectra [31]. The weighting coefficients in the linear combination of the reference compounds’ spectra are selected using the least squares method. As an example, Figure 5 shows the result of fitting the XANES spectrum of the 0.35Bi:Pd catalyst through a linear combination of the XANES spectra of metallic bismuth (30 at. %) and Bi2O3 (70 at. %) (Table 4). It should be noted that the absorption edge is approximated quite well; however, in the post-edge region (13,440–13,490 eV), significant differences are observed between the measured spectrum and the fitting model. The probable reason for the observed differences is the presence of a significant number of palladium atoms in the local environment of bismuth atoms.
EXAFS analysis allows one to obtain more detailed information about the local atomic structure of bismuth atoms, including the interatomic distances and coordination numbers of each coordination sphere. The EXAFS Fourier transforms for the Bi L3-edges of the catalysts are presented in Figure 5. The EXAFS L3-edge spectra of the catalysts have peaks at 1.6 and 2.6 Å in the R-δ scale, as well as low-intensity peaks in the range of 3.0–4.5 Å in the R-δ scale.
The peak at 1.6 Å corresponds to the first coordination sphere and Bi-O scattering path that is confirmed by comparison with the EXAFS L3-edge spectrum of bismuth oxide Bi2O3. The second peak at 2.6 Å, corresponding to the second coordination sphere, cannot be attributed to the Bi-Bi scattering path in bismuth oxide or to the Bi-Bi scattering path in metallic bismuth, since the characteristic distances for these scattering paths are 3.4 and 3.0 Å, respectively. Thus, it can be assumed that the peak at 2.6 Å corresponds to the scattering path of Bi-Pd.
To refine the structural parameters and coordination numbers, EXAFS Fourier transforms for the Bi L3-edges of the catalysts were fitted. We used the structural parameters of monoclinic bismuth oxide and BiPd alloy, taken from the Crystallography Open Database, to construct the fitting model [32,33]. There are several different Bi-O distances in the structure of monoclinic Bi2O3. However, introducing these distances into the structural model as independent parameters leads to a significant complication of the model and the impossibility of approximating the experimental curve (Figure 5). Therefore, to describe the oxygen environment (the first coordination sphere), a simplified one-sphere model was used, which allowed us to estimate the average Bi-O distance and the average coordination number for the first coordination sphere. Bi-Pd scattering path modeling was used to estimate the average Bi-Pd distance and average coordination number for the second coordination sphere in order to characterize the second peak (second coordination sphere). The results of the refined parameters are presented in Table 5.
The modeling of scattering on the first sphere of the oxygen environment indicates that for all catalysts, the Bi-O distance varies from 2.13 to 2.15 Å, while for Bi2O3 oxide, the radius of the Bi-O coordination sphere is 2.16 Å. Simulations of scattering on the second sphere indicate that for all catalysts, the Bi-Pd distance varies from 2.76 to 2.79 Å, while for the PdBi alloy, the radius of the Bi-Pd coordination sphere is 2.83 Å.
Thus, it can be assumed that bismuth is included in the structure of the PdBi alloy particle. The presence of an oxygen environment indicates the oxidation of bismuth centers. A change in the bismuth–palladium ratio leads to a change in the bimetallic particle structure. The highest coordination number (CN) of the second coordination sphere is observed for the 0.35Bi:Pd catalyst, while a further increase in the proportion of bismuth leads to a decrease in the CN of the second coordination sphere with a simultaneous increase in the CN of the oxygen environment. It is likely that an increase in the proportion of bismuth leads to the enrichment of the surface of bimetallic particles with bismuth, which is in an oxidized state. This configuration of the active component (bimetallic particles) is ineffective from the point of view of the catalytic reaction, since the most active palladium centers are inaccessible for the adsorption of reagents. Consequently, an increase in the proportion of bismuth leads to a decrease in the catalytic activity of the synthesized catalysts. According to the revealed pattern, a decrease in the amount of introduced bismuth should contribute to a significant improvement in catalytic characteristics. Therefore, our further research will be aimed at synthesizing and studying samples with lower bismuth content to confirm this hypothesis.

3. Materials and Methods

3.1. Catalyst Preparation

The shredded granules of the support γ-Al2O3 (SKTB Katalizator, Novosibirsk, Russia) underwent vacuum oven drying at 120 °C for 24 h and subsequent sifting, with the 125–250 µm fraction selected for the catalyst synthesis process. The synthesis of PdBi catalysts with various compositions was achieved through co-impregnation of the support. To synthetize xBi:Pd/Al2O3 catalysts with the given Bi/Pd ratio, Pd(C5H7O2)2 (Sigma-Aldrich, Louis, MO, USA, 99%) and Bi(CH3COO)3 (Sigma-Aldrich, Louis, MO, USA, 99.99%) were dissolved in an excess amount of glacial acetic acid (Ecos-1, Staraya Kupavna, Russia, 99.5%). To impregnate the support, the support was added to the solution and left to stir using a magnetic stirrer 1500S (ULAB, Nanjing, China) for 18 h (250 rpm). Using a Hei-VAP Expert (Heidolph, Kelheim, Germany) rotary evaporator in a water bath (55 °C, 60–80 rpm), acetic acid was distilled to dryness. The catalyst preparation scheme is shown in Figure 6.
The advantage of using organometallic complexes as precursors, such as acetates and acetylacetonates, is the production of more dispersed nanoparticles compared to inorganic salts [34,35]. The main advantage of organometallic salts over chloride-containing precursors is the absence of the poisoning effect of chloride ions that block the active centers of palladium [36].
The resulting powder was vacuum-oven-dried at a temperature of 80 °C for 24 h and then loaded into a quartz membrane reactor (Boreskov Institute of Catalysis, Novosibirsk, Russia). The reactor with the powder was placed in a tubular temperature-programmed furnace and a sequential three-stage process was carried out according to the procedure in atmospheres of argon (500 °C), oxygen (350 °C), and hydrogen (500 °C). The sample in the reactor underwent a pretreatment process in gaseous media, where it was heated at a rate of 1 °C per minute until the desired temperature was reached. The gas flow rate was set at 60 mL per minute and the sample was held for two hours. The synthesis process is described in more detail elsewhere [13].

3.2. X-ray Fluorescence Analysis (XRF)

The study of the elemental composition of the catalytic samples Pd/Al2O3, Bi/Al2O3, and xBi:Pd/Al2O3 was carried out on a Lab Center XRF-1800 X-ray fluorescence spectrometer (Shimadzu, Kyoto, Japan). The X-ray source was equipped with a Rh anode, and an acceleration voltage of 40 kV and an aperture of 3 mm were used. The measurement was carried out at a scanning rate of 8 deg/min. The device error was 10%.

3.3. Scanning Electron Microscopy and Energy-Dispersive Spectroscopy (SEM-EDS)

SEM images were made using a MIRA 3 (Tescan, Brno, Czech Republic) equipped with an energy-dispersive spectrometer Oxford Instruments Ultim Max 40 (Oxford Instruments NanoAnalysis, Wiesbaden, Germany) at an accelerating voltage of 20 kV. The equipment was provided by the Analytical Center of Natural Systems’ Geochemistry, TSU.

3.4. Transmission Electron Microscopy and Energy-Dispersive Spectrometry

TEM images of the particles were taken using a JEOL JEM-2100F transmission electron microscope (JEOL Ltd., Akishima, Tokyo, Japan). The microscope was equipped with a cathode field emission electron gun, a high-resolution pole tip (0.19 nm spot resolution), and a JEOL JED-2300 Analysis Station spectrometer (JEOL Ltd., Akishima, Tokyo, Japan). Scanning to obtain high-resolution images was performed at an accelerating voltage of 20 kV. The samples were first suspended in ethanol using an ultrasonic bath and then applied to hollow carbon-coated copper grids (diameter 3.05 mm, size 300 mesh). The particle size was estimated on the assumption that they were spherical. The average particle diameter (dav) was determined using the secant method from a sample of 200–500 grains using the formula dav = Σdi/N, where di is the diameter of each individual particle and N is the total number of particles.

3.5. Research of Catalytic Properties

The liquid-phase oxidation of glucose was carried out at 60 °C, atmospheric pressure, and pH 8.8–9.2 in a three-neck glass reactor (Boreskov Institute of Catalysis, Novosibirsk, Russia) with an external jacket designed for thermostating. pH-stating was carried out with a peristaltic pump by supplying alkali (3M NaOH). pH control was carried out using a glass combined electrode ESK-10601/7 (Izmeritel’naya tekhnika, Moscow, Russia) with ionomer “Anion-4111” (Infraspak-Analit, Novosibirsk, Russia) throughout the entire catalytic process. The temperature was maintained using a BT10-1 circulation thermostat (Termex, Tomsk, Russia). Product analysis was carried out using an Agilent 1200 high-performance liquid chromatograph (Agilent Technologies, Santa Clara, CA, USA). A Rezex ROA-Organic Acid H+ column was chosen to detect reaction products (300 × 7.8 mm).

3.6. EXAFS and XANES Methods of Sample Characterization

The chemical composition and structure of the PdBi catalysts were studied using X-ray absorption spectroscopy at the “Structural Materials Science Station” of Kurchatov Synchrotron Radiation Source (National Research Centre Kurchatov Institute, Moscow, Russia) [37]. X-ray absorption spectra of the Bi L3-edge were recorded in transmission geometry. Energy calibration was performed using the first inflection point in the Bi L3-edge spectrum of Bi foil at 13,419 eV. The X-ray beam intensities before and after passing through the sample and reference Bi foil were measured using three ionization chambers, and Keithley 6487 digital picoammeters (Keithley Instruments LLC, Cleveland, OH, USA) were used to measure the ionization current. The experimental spectra were processed using standard procedures for subtracting the background, normalizing to the value of the L3-edge jump, and extracting atomic absorption, followed by the Fourier transform of the EXAFS spectra χ(k) in the wavenumber range of 2.0–12.0 Å−1 with the weight function k2 using the DEMETER software package (version 0.9.26) [38]. Spectra modeling was performed for the correct interpretation of the EXAFS data [32,33]. For this, a preliminary model was constructed based on crystallographic data. Then, the theoretical EXAFS oscillation curve was calculated, which is the sum of single and multiple scattering paths, considering several coordination spheres. The minimization of the residual functional of the theoretical and experimental spectra using the FEFF program (version 6) made it possible to refine the parameters of the model used and determine the coordination numbers, the radii of the coordination spheres, and the Debye–Waller factors [39]. The EXAFS k2-weighted Fourier transforms of the Bi L3-edge of the catalyst were fitted in k-space. Fitted EXAFS k2-weighted Fourier transforms of the Bi L3-edge of catalyst in k-space are presented on the Figure S1 (S1).

4. Conclusions

The obtained samples of xBi:Pd/Al2O3 catalysts had different surface characteristics and catalytic properties depending on the composition of the sample. Particles of palladium and bismuth were evenly distributed over the support surface and were in close proximity to each other, which allowed us to draw a conclusion about the formation of the alloy. According to the quantitative analysis data (XRF, SEM-EDS), the atomic ratio between Bi and Pd coincided with the calculated one. An interesting feature was the enlargement of particles with an increasing amount of bismuth in the samples. The catalytic tests of the samples in the glucose oxidation reaction showed that the most effective catalyst was the sample with a lower bismuth content, 0.35Bi:Pd/Al2O3. A correlation dependence of the average reaction rate (Wav.), related to the amounts of palladium and bismuth substances (nPd + nBi), on the atomic ratio Bi/Pd was revealed. EXAFS and XANES methods made it possible to determine the cause of the deterioration in the catalytic performance of the samples with high bismuth content. An increase in the proportion of Bi led to its enrichment on the surface of the palladium centers. In this case, the formation of Bi-Pd alloy particles was assumed, in which part of bismuth atoms formed the Bi-O bond (partially oxidized). This form of Bi-O is not only inactive, but also leads to the blocking of the active sites of Pd involved in the conversion of glucose into sodium gluconate.

Supplementary Materials

The following supporting information can be downloaded at https://www.mdpi.com/article/10.3390/catal14010066/s1, Figure S1: Fitted EXAFS k2-weighted Fourier transforms of the Bi L3-edge of catalyst in k-space.

Author Contributions

M.P.S.-S.: investigation, methodology, visualization, writing—original draft; A.A.S.: investigation, methodology, visualization, writing—original draft; A.S.K.: conceptualization, funding acquisition, writing—review and editing; I.A.K.: supervision, conceptualization, funding acquisition, writing—review and editing. All authors have read and agreed to the published version of the manuscript.

Funding

The ‘Catalyst preparation’ and ‘Catalytic experiments’ were funded by financial support of the Ministry of Science and Higher Education of the Russian Federation (Agreement No. 075-15-2023-468). The transmission electron microscopy (TEM), scanning electron microscopy (SEM), and X-ray fluorescence analysis (XRF) studies of the catalysts’ surface characteristics were carried out with the support of the Ministry of Sciences and Higher Education of the Russian Federation (grant number FSWM-2020-0037). The extended X-ray absorption fine structure (EXAFS) and X-ray absorption near-edge structure (XANES) studies were financially supported by the Ministry of Science and Higher Education of the Russian Federation within the governmental order for SKIF of Boreskov Institute of Catalysis (grant number FWUR-2024-0042).

Data Availability Statement

Data are contained within the article.

Conflicts of Interest

Author Alexey S. Knyazev was employed by the company LLC “Engineering Chemical Technological Center”, 7 Alekseya Belenca str., 634050 Tomsk, Russia. The remaining authors declare that the research was conducted in the absence of any commercial or financial relationships that could be construed as a potential conflict of interest.

References

  1. Du, L.; Zheng, L.; Wei, H.; Zheng, S.; Zhu, Z.; Chen, J.; Yang, D. Palladium/bismuth nanowires with rough surface for stable hydrogen sensing at low temperatures. Appl. Nano Mater. 2019, 2, 1178–1184. [Google Scholar] [CrossRef]
  2. Kansara, S.; Gupta, S.K.; Sonvane, Y.; Gajjar, P.N. Ultrathin Pd and Pt nanowires for potential applications as hydrogen economy. Mater. Today Commun. 2021, 26, 101761. [Google Scholar] [CrossRef]
  3. Chu, M.; Huang, J.; Gong, J.; Qu, Y.; Chen, G.; Yang, H.; Wang, X.; Zhong, Q.; Deng, C.; Cao, M.; et al. Synergistic combination of Pd nanosheets and porous Bi(OH)3 boosts activity and durability for ethanol oxidation reaction. Nano Res. 2022, 15, 3920–3926. [Google Scholar] [CrossRef]
  4. Casella, I.G.; Contursi, M. Characterization of bismuth adatom-modified palladium electrodes: The electrocatalytic oxidation of aliphatic aldehydes in alkaline solutions. Electrochim. Acta 2006, 52, 649–657. [Google Scholar] [CrossRef]
  5. Witońska, I.A.; Walock, M.J.; Dziugan, P.; Karski, S.; Stanishevsky, A.V. The structure of Pd–M supported catalysts used in the hydrogen transfer reactions (M = In, Bi and Te). Appl. Surf. Sci. 2013, 273, 330–342. [Google Scholar] [CrossRef]
  6. Qin, X.; Li, H.; Xie, S.; Li, K.; Jiang, T.; Ma, X.Y.; Jiang, K.; Zhang, Q.; Terasaki, O.; Wu, Z. Mechanistic analysis-guided Pd-based catalysts for efficient hydrogen production from formic acid dehydrogenation. ACS Catal. 2020, 10, 3921–3932. [Google Scholar] [CrossRef]
  7. Shen, T.; Chen, S.; Zeng, R.; Gong, M.; Zhao, T.; Lu, Y.; Liu, X.; Xiao, D.; Yang, Y.; Hu, J.; et al. Tailoring the antipoisoning performance of Pd for formic acid electrooxidation via an ordered PdBi intermetallic. ACS Catal. 2020, 10, 9977–9985. [Google Scholar] [CrossRef]
  8. Witońska, I.; Królak, A.; Karski, S. Bi modified Pd/support (SiO2, Al2O3) catalysts for hydrodechlorination of 2, 4-dichlorophenol. J. Mol. Catal. A Chem. 2010, 331, 21–28. [Google Scholar] [CrossRef]
  9. Belkacemi, K.; Hamoudi, S. Chemocatalytic oxidation of lactose to lactobionic acid over Pd-Bi/SBA-15: Reaction kinetics and modeling. Ind. Eng. Chem. Res. 2010, 49, 6878–6889. [Google Scholar] [CrossRef]
  10. Karski, S. Catalytic oxidation of lactose over Pd-Bi/SiO2 systems. Przem. Chem. 2006, 85, 201–204. [Google Scholar]
  11. Wenkin, M.; Ruiz, P.; Delmon, B.; Devillers, M. The role of bismuth as promoter in Pd–Bi catalysts for the selective oxidation of glucose to gluconate. J. Mol. Catal. A Chem. 2002, 180, 141–159. [Google Scholar] [CrossRef]
  12. Karski, S.; Paryjczak, T.; Witonñska, I. Selective oxidation of glucose to gluconic acid over bimetallic Pd–Me catalysts (Me = Bi, Tl, Sn, Co). Kinet. Catal. 2003, 44, 618–622. [Google Scholar] [CrossRef]
  13. Sandu, M.P.; Sidelnikov, V.S.; Geraskin, A.A.; Chernyavskii, A.V.; Kurzina, I.A. Influence of the method of preparation of the Pd-Bi/Al2O3 catalyst on catalytic properties in the reaction of liquid-phase oxidation of glucose into gluconic acid. Catalysts 2020, 10, 271. [Google Scholar] [CrossRef]
  14. Singh, S.B.; Tandon, P.K. Catalysis: A brief review on nano-catalyst. J. Energy Chem. Eng. 2014, 2, 106–115. [Google Scholar]
  15. Liu, P.; Qin, R.; Fu, G.; Zheng, N. Surface coordination chemistry of metal nanomaterials. J. Am. Chem. Soc. 2017, 139, 2122–2131. [Google Scholar] [CrossRef]
  16. Mitchell, S.; Qin, R.; Zheng, N.; Pérez-Ramírez, J. Nanoscale engineering of catalytic materials for sustainable technologies. Nat. Nanotechnol. 2021, 16, 129–139. [Google Scholar] [CrossRef]
  17. Wang, D.; Li, Y. Bimetallic nanocrystals: Liquid-phase synthesis and catalytic applications. Adv. Mater. 2011, 23, 1044–1060. [Google Scholar] [CrossRef]
  18. van Deelen, T.W.; Hernández Mejía, C.; de Jong, K.P. Control of metal-support interactions in heterogeneous catalysts to enhance activity and selectivity. Nat. Catal. 2019, 2, 955–970. [Google Scholar] [CrossRef]
  19. Cuenya, B.R. Synthesis and catalytic properties of metal nanoparticles: Size, shape, support, composition, and oxidation state effects. Thin Solid Film. 2010, 518, 3127–3150. [Google Scholar] [CrossRef]
  20. Pérez-Lorenzo, M. Palladium nanoparticles as efficient catalysts for Suzuki cross-coupling reactions. J. Phys. Chem. Lett. 2012, 3, 167–174. [Google Scholar] [CrossRef]
  21. Ndolomingo, M.J.; Bingwa, N.; Meijboom, R. Review of supported metal nanoparticles: Synthesis methodologies, advantages and application as catalysts. J. Mater. Sci. 2020, 55, 6195–6241. [Google Scholar] [CrossRef]
  22. Liu, D.; He, Q.; Ding, S.; Song, L. Structural regulation and support coupling effect of single-atom catalysts for heterogeneous catalysis. Adv. Energy Mater. 2020, 10, 2001482. [Google Scholar] [CrossRef]
  23. Liu, J. Advanced electron microscopy of metal–support interactions in supported metal catalysts. ChemCatChem 2011, 3, 934–948. [Google Scholar] [CrossRef]
  24. Gallezot, P. Catalytic routes from renewables to fine chemicals. Catal. Today 2007, 121, 76–91. [Google Scholar] [CrossRef]
  25. Sarkar, S.; Ramarao, S.D.; Das, T.; Das, R.; Vinod, C.P.; Chakraborty, S.; Peter, S.C. Unveiling the roles of lattice strain and descriptor species on Pt-like oxygen reduction activity in Pd–Bi catalysts. ACS Catal. 2021, 11, 800–808. [Google Scholar] [CrossRef]
  26. Timoshenko, J.; Roldan Cuenya, B. In Situ/operando electrocatalyst characterization by X-ray absorption spectroscopy. Chem. Rev. 2020, 121, 882–961. [Google Scholar] [CrossRef]
  27. Finzel, J.; Gutierrezet, K.M.S.; Hoffman, A.S.; Resasco, J.; Christopher, P.; Bare, S.R. Limits of Detection for EXAFS Characterization of Heterogeneous Single-Atom Catalysts. ACS Catal. 2023, 13, 6462–6473. [Google Scholar] [CrossRef]
  28. Mondal, S.; Ballav, T.; Biswas, K.; Ghosh, S.; Ganesh, V. Exploiting the versatility of palladium catalysis: A modern toolbox for cascade reactions. Eur. J. Org. Chem. 2021, 2021, 4566–4602. [Google Scholar] [CrossRef]
  29. Wenkin, M.; Renard, C.; Ruiz, P.; Delmon, B.; Devillers, M. On the role of bismuth-based alloys in carbon-supported bimetallic Bi-Pd catalysts for the selective oxidation of gluconic acid. Stud. Surf. Sci. Catal. 1997, 108, 391–398. [Google Scholar] [CrossRef]
  30. Witkowska, A.; Rybicki, J.; Di Cicco, A. Structure of partially reduced bismuth–silicate glasses: EXAFS and MD study. J. Alloys Compd. 2005, 401, 135–144. [Google Scholar] [CrossRef]
  31. Kremneva, A.M.; Fedorov, A.V.; Bulavchenko, O.A.; Knyazev, Y.V.; Saraev, A.A.; Yakovlev, V.A.; Kaichev, V.V. Effect of Calcination Temperature on Activity of Fe2O3–Al2O3 Nanocomposite Catalysts in CO Oxidation. Catal. Lett. 2020, 150, 3377–3385. [Google Scholar] [CrossRef]
  32. Ivanov, S.A.; Tellgren, R.; Rundlo, H.; Orlov, V.G. Structural studies of α-Bi2O3 by neutron powder diffraction. Powder Diffr. 2001, 16, 227–230. [Google Scholar] [CrossRef]
  33. Bayliss, P. Revised unit-cell dimensions, space group, and chemical formula of some metallic minerals. Can. Mineral. 1990, 28, 751–755. [Google Scholar]
  34. Escola, J.M.; Serrano, D.P.; Aguado, J.; Briones, L. Hydroreforming of the LDPE thermal cracking oil over hierarchical Ni/beta catalysts with different Ni particle size distributions. Ind. Eng. Chem. Res. 2015, 54, 6660–6668. [Google Scholar] [CrossRef]
  35. Romero, M.D.; Calles, J.A.; Rodríguez, A. Influence of the Preparation Method and Metal Precursor Compound on the Bifunctional Ni/HZSM5 Catalysts. Ind. Eng. Chem. Res. 1997, 36, 3533. [Google Scholar] [CrossRef]
  36. Karski, S. Activity and selectivity of Pd–Bi/SiO2 catalysts in the light of mutual interaction between Pd and B. J. Mol. Catal. A Chem. 2006, 253, 147–154. [Google Scholar] [CrossRef]
  37. Chernyshov, A.A.; Veligzhanin, A.A.; Zubavichus, Y.V. Structural Materials Science end-station at the Kurchatov Synchrotron Radiation Source: Recent instrumentation upgrades and experimental results. Nucl. Instrum. Methods Phys. Res. Sect. A Accel. Spectrometers Detect. Assoc. Equip. 2009, 603, 95–98. [Google Scholar] [CrossRef]
  38. Ravel, B.; Newville, M. ATHENA, ARTEMIS, HEPHAESTUS: Data analysis for X-ray absorption spectroscopy using IFEFFIT. J. Synchrotron Radiat. 2005, 12, 537–541. [Google Scholar] [CrossRef]
  39. Rehr, J.J.; Mustre de Leon, J.; Zabinsky, S.I.; Albers, R.C. Theoretical X-ray absorption fine structure standards. J. Am. Chem. Soc. 1991, 113, 5135–5140. [Google Scholar] [CrossRef]
Figure 1. SEM-EDS images of xBi:Pd/Al2O3 samples: 0.35Bi:Pd (a), 0.4Bi:Pd (b), 0.5Bi:Pd (c), 1Bi:Pd (d), 2Bi:Pd (e). Pink—Bi, Blue—Pd, Green—Al, Red—O. Scale bar: (a,c,d) 25 μm, (b,e) 50 μm.
Catalysts 14 00066 g001
Figure 2. TEM micrographs of samples Pd/Al2O3 (a) and xBi:Pd/Al2O3: 0.35Bi:Pd (b), 0.4Bi:Pd (c), 0.5Bi:Pd (d), 1Bi:Pd (e), 2Bi:Pd (f).
Catalysts 14 00066 g002
Figure 3. Dependence of the average reaction rate on the stoichiometric ratio of Bi/Pd in samples of xBi:Pd/Al2O3 catalysts.
Catalysts 14 00066 g003
Figure 4. XANES Bi L3-edge spectra of the studied catalysts, as well as the spectra of metallic Bi and Bi2O3.
Catalysts 14 00066 g004
Figure 5. EXAFS k2-weighted Fourier transforms of the Bi L3-edge of catalyst and references (a). Fitted EXAFS k2-weighted Fourier transforms of the Bi L3-edge of catalyst (b).
Catalysts 14 00066 g005
Figure 6. Stages of xBi:Pd/Al2O3 catalyst preparation.
Catalysts 14 00066 g006
Table 1. Elemental composition of xBi:Pd/Al2O3 catalysts (XRF).
Sample/Al2O3Pd Content, wt. %Bi Content, wt. %
0.35Bi:Pd3.5 ± 0.32.4 ± 0.2
0.4Bi:Pd2.8 ± 0.32.3 ± 0.2
0.5Bi:Pd2.5 ± 0.22.3 ± 0.2
1Bi:Pd2.3 ± 0.22.4 ± 0.2
2Bi:Pd1.1 ± 0.13.9 ± 0.3
Table 2. Elemental mapping data for xBi:Pd/Al2O3 samples (from SEM-EDS).
SamplePd Content,
at. %
Bi Content,
at. %
Al Content,
at. %
O Content,
at. %
Ratio
Bi/Pd
0.35Bi:Pd1.35 ± 0.130.44 ± 0.0446.33 ± 4.6351.88 ± 5.190.33
0.4Bi:Pd0.36 ± 0.040.14 ± 0.0137.98 ± 3.8061.51 ± 6.150.39
0.5Bi:Pd1.37 ± 0.140.70 ± 0.0741.73 ± 4.1756.20 ± 5.620.51
1Bi:Pd0.56 ± 0.050.56 ± 0.0637.66 ± 3.7761.21 ± 6.121.00
2Bi:Pd0.47 ± 0.050.93 ± 0.0942.34 ± 4.2356.26 ± 5.631.97
Table 3. Parameters of the glucose oxidation reaction in the presence of xBi:Pd/Al2O3 samples.
Sample/Al2O3Conversion XGlu, %Yield
YGluNa,%
Selectivity
SGluNa, %
W0·105, mol/(l·s)Wav·105, mol/(l·s)
Pd29.1 ± 1.127.1 ± 1.0935.0 ± 0.21.9 ± 0.1
0.35Bi:Pd56.6 ± 1.256.6 ± 1.2998.6 ± 0.43.8 ± 0.2
0.4Bi:Pd52.5 ± 2.151.8 ± 2.0997.8 ± 0.43.5 ± 0.2
0.5Bi:Pd47.5 ± 1.447.4 ± 1.4998.0 ± 0.43.2 ± 0.2
1Bi:Pd42.1 ± 1.342.1 ± 1.3>995.2 ± 0.22.8 ± 0.2
2Bi:Pd27.8 ± 0.927.8 ± 0.9>994.9 ± 0.21.8 ± 0.1
Table 4. Phase composition of the catalysts estimated using LCF of XANES Bi L3-edge spectra.
NoSample/Al2O3Bi, at. %Bi2O3, at. %
10.35Bi:Pd30.0 ± 1.570.0 ± 3.5
20.4Bi:Pd30.0 ± 1.570.0 ± 3.5
30.5Bi:Pd30.0 ± 1.570.0 ± 3.5
41Bi:Pd30.0 ± 1.570.0 ± 3.5
52Bi:Pd30.0 ± 1.570.0 ± 3.5
Table 5. Refined structural parameters of the Bi local environment revealed from modeling EXAFS spectra. Here, N is the coordination number, R is the interatomic distance, σ2 is the Debye parameter, and Rf is the R-factor.
Sample/Al2O3NBi-ORBi-O, Åσ2, Å2NBi-PdRBi-Pd, Åσ2, Å2Rf, %
0.35Bi:Pd2.82.140.0083.72.790.0110.8
0.4Bi:Pd3.72.150.0082.42.780.0110.8
0.5Bi:Pd3.62.140.0082.52.770.0111.3
1Bi:Pd3.72.130.0081.72.760.0110.8
2Bi:Pd3.72.140.0081.22.770.0110.8
Bi2O34.02.16
PdBi62.83
Disclaimer/Publisher’s Note: The statements, opinions and data contained in all publications are solely those of the individual author(s) and contributor(s) and not of MDPI and/or the editor(s). MDPI and/or the editor(s) disclaim responsibility for any injury to people or property resulting from any ideas, methods, instructions or products referred to in the content.

