Article

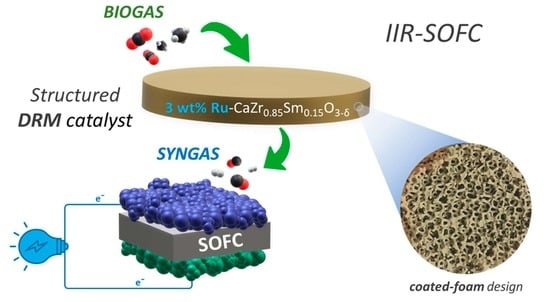
Structured Catalyst for Indirect Internal Reforming (IIR) of Biogas in Solid Oxide Fuel Cell (SOFC)

1
Department of Chemical Science and Technology, University of Rome Tor Vergata, Via della Ricerca Scientifica 1, 00133 Rome, Italy
2
Department of Energy Technologies, Italian National Agency for New Technologies, Energy and Sustainable Economic Development (ENEA) Casaccia Research Centre, Via Anguillarese 301, 00123 Rome, Italy
*
Authors to whom correspondence should be addressed.
Catalysts 2023, 13(7), 1129; https://doi.org/10.3390/catal13071129
Submission received: 22 June 2023 / Revised: 17 July 2023 / Accepted: 19 July 2023 / Published: 20 July 2023
(This article belongs to the Special Issue New Trends in Electrocatalysis for CO2 Conversion)

Abstract

:
The aim of this work is the development of a structured catalyst for the dry reforming of biogas to be used as a pre–reformer in the indirect internal reforming configuration (IIR) of solid oxide fuel cells (SOFCs). The structured catalyst is based on NiCrAl foams coated with ruthenium (nominal loading 3.0 wt%) supported on a CaZr0.85Sm0.15O3−δ (CZS) perovskite oxide. The powder is produced by solution combustion synthesis and deposited on metallic foams by the wash–coating method. Catalytic tests for the dry reforming of methane (DRM) reaction are carried out at 850 °C, 700 °C and 550 °C for an overall 50 h with CH4/CO2 = 1 and p = 1.3 bar at different gas hourly space velocities (GHSVs). The final goal is a proof–of–concept: a laboratory validation of an IIR–SOFC fed by biogas. The carbon amount on spent structured catalysts is evaluated by thermogravimetric analysis and microstructural/compositional investigation.

Graphical Abstract

1. Introduction

The production of biogas from the anaerobic digestion of different biomass sources (e.g., waste from the agro–food industry, sewage sludge, or landfills) is among the EU–promoted environmental policies for counteracting the increasing global warming [1,2]. Biogas is composed of two major greenhouse gases: methane (50–65%) and carbon dioxide (35–50%) and their relative amount depends on the source of organic material. The dry reforming of methane (DRM) (Equation (1)) is an efficient way to convert methane and carbon dioxide into valuable chemical products. It is a strongly endothermic reaction favored at high temperatures (≥800 °C) and produces a mixture of H2 and CO (syngas) with a molar ratio close to unity. Thus, the DRM reaction represents the ideal route for producing renewable hydrogen from biogas [3,4].
C H 4 + C O 2 2 H 2 + 2 C O Δ H 0 = 247   k J   m o l 1
Other reactions can simultaneously occur, such as: reverse water gas shift (RWGS) (Equation (2)), Boudouard reaction (Equation (3)), and methane dehydrogenation (Equation (4)), as reported in the following:
C O 2 + H 2 H 2 O + C O Δ H 0 = 41   k J   m o l 1
2 C O C + C O 2 Δ H 0 = 172   k J   m o l 1
C H 4 C + 2 H 2 Δ H 0 = 75   k J   m o l 1
The occurrence of side reactions leads to the decrease in H2/CO ratio and to the catalyst deactivation due to carbon formation that seriously limits the DRM development to a large extent. At present, Ni is the most used catalyst for DRM due to its high activity and low cost. However, it suffers from carbon deposition because of the methane–cracking reaction (4). To improve the long–term stability and the carbon resistance, bimetallic alloys such as Ni–Fe, Ni–Cu and Ni–Co were investigated [5,6,7,8,9]. More recently, supported Ni catalysts with core–shell structures have been proposed showing a strong chemical and physical interaction with the support matrix and high resistance to sintering and carbon deposition [10]. In addition, platinum group metals (PGMs) (Ru, Rh, Ir, Pd, Pt and Os) are known to show superior catalytic activity and durability compared to Ni, but their use on a large scale is limited due to their high cost [11,12]. Among PGMs, Ru and Rh seem to be the most resistant toward catalyst deactivation by carbon deposition [13].
Heterogeneous catalysts for DRM are composed not only of the active metal species but also by the support. It has been proven that oxide–based supports, on which metals are dispersed, can mitigate the problems of carbon deposition, supplying the metal catalytic sites of oxide ions to favor the combustion of carbonaceous residues and also by slowing down the coarsening of the catalytically active metallic particles [14,15,16]. Binary oxides such as Al2O3, ZrO2, or CeO2 are generally used. Recently, perovskite oxides (ABO3) have witnessed rapid development because of their unique properties, such as relatively high surface area, thermal stability, and redox activity [17,18,19]. The system made up of catalytically active metal on a perovskite oxide support can be deposited onto structured substrates (foams, honeycombs, and monoliths) that show several advantages compared to conventional packed bed reactors such as: high geometric surface area and low–pressure drop [20]. Specifically, metallic foams are recommended for their open–cell structure, high thermal conductivity (fundamental for endothermic reactions), high–temperature stability, and mechanical strength [21,22]. The high porous texture allows better mass and heat exchange and promotes high contact efficiency between catalyst particles and gases.
In this work, an efficient structured catalyst for DRM based on Ru–CaZr0.85Sm0.15O3 deposited on metal alloy foam is designed, fabricated, and tested. Ruthenium was chosen as a metallic active phase because it is an established catalyst for DRM [23], whereas Sm–doped CaZrO3 perovskite oxide was chosen as a support. Samarium doping at the B site of CaZrO3 of the perovskite structure introduces oxygen vacancies into the lattice and favors the mobility of adsorbed oxygen species, thus promoting anti–coking properties [24]. The powder contains only 3 wt% of Ru (Ru3CZS), and it is deposited on a commercial NiCrAl metallic foam by the wash–coating method. The structured catalyst fabrication and the catalytic activity toward DRM reaction at different temperatures in the range 550–850 °C are detailed.
The structured catalysts are integrated in indirect internal reforming mode (IIR) with an SOFC. This configuration allows a close heat transfer between the pre–reformer and the electrochemical cell [25,26,27,28,29]. IIR–SOFC is exposed to a biogas mixture at 850 °C, syngas is produced into the pre–reformer and the electrochemical reactions (Equations (5) and (6)) occur at the cell electrodes.
H 2 + O 2 H 2 O + 2 e
C O + O 2 C O 2 + 2 e
The aim of the work is a proof–of–concept: a structured catalyst based on NiCrAl foam coated with a Ru3CZS system: 3.0 wt% ruthenium supported on a CaZr0.85Sm0.15O3−δ (CZS) perovskite oxide. This system can act as a robust and efficient pre–reformer of biogas coupled with an SOFC in the indirect internal reforming (IIR) mode. Cell tests in biogas mixture are presented and discussed. Promising results in terms of maximum power density in presence of in CH4:CO2 mixture are obtained.

2. Results and Discussion

2.1. Ru3CZS Powder

The solution combustion synthesis is schematically reported in Figure 1. The procedure is divided into the three steps: gel formation (i), dry gel combustion at 300 °C to obtain precursors (ii) and calcination at 850 °C for the final Ru3CZS crystalline sample (iii). In Figure 2a, the XRD pattern of the Ru3CZS precursor shows three broad peaks overlapped to an amorphous background. Although the sample has a low degree of crystallinity, the CaZrO3 (JCPDS card 76–2401) main peaks can be clearly identified. Figure 2b displays the thermogravimetric profile of the Ru3CZS precursor. At low temperature (T < 150 °C), a weight loss associated with the removal of adsorbed water is observed; then, from the DTG curve (red line), at least three major features are revealed: at 417 °C, 568 °C and 728 °C, which are likely due to hydroxides, nitrates and carbonates decompositions, respectively [30]. Since at T > 800 °C, Ru3CZS does not show any further weight loss, T = 850 °C was chosen as the calcination temperature for a stable crystalline structure. Figure 2c,d show the XRD diffractograms of Ru3CZS powder calcined at 850 C° for 5 h. A Ru–free CZS pattern is present for comparison, along with the CaZrO3 (JCPDS 76–2401) and RuO2 (JCPDS 40–1290) reference patterns. Both CZS and Ru3CZS show a crystalline phase with sharp peaks matching the CaZrO3 perovskite structure with orthorhombic symmetry. CZS peaks are shifted toward 2θ lower values as compared to the CaZrO3 reference pattern. The radius of the six–fold coordinated Sm3+ (0.958 Å) is larger than that of Zr4+ (0.72 Å), and thus, Sm doping increases the unit cell volume shifting the pattern toward lower values [31,32]. R3CZS peaks are slightly further left–shifted, as a minor part of 3 wt% Ru might have been included in the perovskite lattice. Peaks belonging to the RuO2 phase were not clearly observed, which was likely because the 3 wt% Ru doping is close to the XRD detection limit.
CZS samples with and without 3 wt% Ru were treated in a 5% H2/Ar gas mixture at 850 °C. The morphology and elemental composition of the reduced powders were analyzed through FE–SEM and EDX spectroscopy, respectively, and the results are reported in Figure 2e,f and Table 1.
In reduced Ru3CZS, uniformly dispersed nanoparticles (average diameter d = 4.6 ± 1.0 nm) on the oxide surface can be observed. These can be clearly attributed to the presence of ruthenium, as no surface segregation phenomena are known to occur when Ca, Sm or Zr oxides are exposed to such a reduction treatment. Several spot EDX analyses were performed on the reduced Ru3CZS sample, and the results are reported in Table 1, showing that the Ru amount is in close agreement with the nominal 3 wt% value (a representative EDX spectrum is reported in Figure S1 of the Supplementary Materials).

2.2. Structured Catalysts

The microstructure of bare and coated NiCrAl foams was investigated by FE–SEM. Figure 3a shows the micrograph of the NiCrAl microstructure with interconnected porosity and open pores of around 500 µm. The inset in the lower–right part of the panel highlights the detail of a rough surface morphology due to the passivation treatment. In fact, the commercial foam was pre–oxidized at high temperature to prevent further internal oxidations [33]. The roughness of the oxidized surface layer increases the specific surface area, promoting the adhesion with an oxide–based coating. Figure 3b shows the morphology of 25 wt% Ru3CZS coated on the NiCrAl foam–structured catalyst. The deposited layer appears continuous and uniform on the foam structure without evidence of microcracks or detachments. The inset of Figure 3b highlights the good adhesion of the coating layer onto the passivated surface of the substrate. Thus, the wash coating with proper drying and calcination steps seems to be a proper deposition method for structured catalysts based on metallic substrates.

2.3. Temperature–Programmed Reduction (TPR)

The temperature–programmed reduction (H2–TPR) measurements from room temperature to 850 °C were performed to determine the redox properties of NiCrAl foam (profile a), Ru–free CZS powder (profile b) and Ru3CZS powder (profile c). In Figure 4, the H2–TPR profile of NiCrAl foam (profile a) is shown. The observed hydrogen consumption peaks are associated with the reduction of the different oxides in the passivated surface layer, such as α–Al2O3, Cr2O3, NiCr2O4 spinel, and traces of NiO. The profile shows two peaks at 348 °C and 514 °C and two overlapping high–temperature peaks at 664 °C and 729 °C. As reported in our previous work [22], the first two peaks are likely associated to chromium oxides reduction, while the last two are attributed to the Ni oxides reduction.
The trend of the TCD signal as a function of operating temperature for the CZS sample is shown in profile b of Figure 4. A single feature is distinguishable around 640 °C: this H2 consumption contribution might arise from the decomposition of CaCO3 carbonate impurities [34]. The same peak is observed on the Ru3CZS profile too, with a maximum at 637 °C, but the presence of Ru resulted in more intense features at lower temperatures. Three overlapping peaks at 180 °C, 241 °C and 420 °C were observed, which can be attributed to the reduction of RuO2–based and Ru4+–based species in partial solid solution with the perovskite. The peak at 180 °C, which is particularly narrow and intense, was attributed to the initial formation of Ru0 aggregates that promoted the rapid reduction of RuO2 species at the surface by the release of atomic hydrogen (spillover effect), as also reported by Madhavaram et al. [35]. This interpretation is also supported by the thermodynamic analysis of the reduction reaction of Ru oxide (Equation (7)), which is already strongly exothermic at the standard conditions of 273.15 K and 1 bar.
RuO2 + 2H2 → Ru + 2H2O
The further broadened peaks with maxima at 241 °C and 420 °C were assigned to the reduction of Ru4+ species strongly interacting with the CZS perovskite lattice, likely in partial solid solution. The hydrogen consumption for the reduction process was calculated by integrating the peaks and was equal to 0.71 mmol H2/g, which is close to the theoretical value of 0.59 mmol H2/g expected for the reduction of the amount of Ru4+ in the sample.

2.4. Catalytic Activity in Biogas

The thermodynamic study of the DRM was performed using the HSC chemistry program [36]. The H2/CO conversions and ratios were calculated assuming two different scenarios: in case of carbon formation and in the absence of carbon formation, and the results are shown in Figure S2a,b of the Supplementary Materials. Assuming that carbon is one of the products (and thus, Equations (2)–(4) are considered parallel reactions), the conversions in the model are extremely high already at 200 °C with values close to 67%. As the temperature increases, the conversions significantly decrease, especially for CO2. Then, they increase again, reaching values close to 100% at 850 °C, but the turnover values for CO2 are always far below those expected for CH4. If we exclude the formation of carbon between the products (i.e., assume that only RWGS Equation (2) occurs as the only secondary reaction), a completely different trend is observed. The conversion values start to become significant at temperatures above 400 °C and are always higher for CO2. With increasing temperature, the conversions tend to settle with a sigmoidal trend at values close to 100%.
The catalytic test of DRM was carried out in a fixed–bed quartz reactor using a catalytic bed with 11 foams, as schematically reported in Figure 5. The foams are named A1–A11, going from the inlet to the outlet of the reactor. A preliminary investigation (not reported) showed that the uncoated foams were not catalytically active under the same experimental conditions.
The reaction conditions of dry reforming of methane are: CH4/CO2 = 1, chemical composition of CH4:CO2:N2 = 1:1:3 vol%, p = 1.3 bar, a temperature range from 300 to 850 °C and the following Gas Hourly Space Velocities (GHSVs) of 6860 h−1, 3430 h−1 and 1710 h−1.
Figure 6a shows the CH4 and CO2 conversions and Figure 6b shows the H2/CO molar ratio as a function of temperatures at different GHSVs. At all investigated temperatures, the conversion of CO2 was favored over that of CH4 but the difference between CO2 and CH4 became smaller with increasing temperature. The CH4 conversion increased with increasing temperature, reaching a maximum of 98% at 850 °C for all GSHVs, which corresponds to the thermodynamic value. Both CO2 and CH4 conversion decrease with increasing GHSV. As already reported in the literature [37,38,39], DRM is better promoted at low GHSV when the effect of mass transfer limitation is negligible.
The always greater CO2 conversion, compared to CH4, was due to the concomitant occurrence of the RWGS reaction shown in Equation (2). Thus, the not–reformed CO2 was hydrogenated by the produced H2, forming CO and H2O and causing a H2/CO molar ratio less than unity at different GHSV values and operating temperatures. At 850 °C, the H2/CO molar ratio at different GHSVs was very close to unity. Thus, at 850 °C, the dry reforming of methane (DRM) conversion is almost complete.
CH4 and CO2 conversion (%) vs. time of stream at different GHSVs are shown in Figure 7a,b, while Figure 7c displays the H2/CO molar ratio.
At 850 °C, CH4 and CO2 conversions around 100% were observed for all the tested GHSVs. When the temperature was decreased stepwise to 700 °C, only the lowest GHSV (1710 h−1) allowed for high conversion, and it was higher for CO2 (85%) than for CH4 (80%) in accordance with the trends observed in Figure 6. Conversions values dramatically decreased by increasing the GHSV, reaching 50% for CO2 and 40% for CH4 at 6860 h−1. Higher conversion values at lower GHSVs were recently observed in similar systems [40] and attributed to the larger contact time between reactants and catalyst. The H2/CO decreased as well with GHSV, and this is likely due to the presence of a higher amount of unconverted CO2, which consumes H2 through the RWGS reaction, resulting in a higher CO presence. The temperature was further lowered to 550 °C and again, the lowest GHSV kept the highest CO2 and CH4 conversions as well as the H2/CO ratio. The observed discontinuous trend in CO2 conversion at 550 °C and GHSV 1710 h−1 may result from the concurrent CO2 methanation reaction, which is favored up to 600 °C on Ru–supported oxide catalysts [41,42]. The temperature was raised again to 700 °C and then to 850 °C: no catalyst deactivation was observed. A full recovery of conversion values was observed for GHSV = 1710 h−1, while a slow conversion decay over time was observed for higher GHSVs.

2.5. Spent Catalysts

The main reason for catalyst deactivation during DRM reaction is the loss of catalyst active sites due to carbon deposition [43]. Despite the activity trends observed in Figure 6 follow the modeled no–coking scenario (Figure S2a,b), morphologic and thermogravimetric analyses of selected spent catalysts were performed to detect any traces of coking. Figure 8a schematically displays the packed reactor with SEM micrographs of A1, A3, A6, A9 and A11 spent foams. From the inlet to the outlet, the foams progressively display a degraded microstructure. In the foams closer to the outlet (A9 and A11), cracks and delamination of the Ru3CSZ coating is clearly revealed. While for the foams close to the inlet, the coating seems uniform, homogeneous, and free of cracks. Figure 8b shows the TG measurements of fresh (not tested) and the selected spent foams. The A1 and A3 foams, which were located close to the gas inlet, do not present any weight loss (%), showing the same profile as that of the fresh foam, meaning that no carbon was deposited during the catalytic tests (40 h of operation). For these samples, the weight (%) slightly increases at T > 500 °C, accounting for a partial re–oxidation of the surface passivated layer of the metallic foams (Cr2O3 and NiO) reduced under the exposure to biogas mixture during the catalytic test [44]. Otherwise, A6, A9 and A11 foams reveal a weight loss in the 600–750 °C temperature range due to the combustion of deposited carbon. The data reported in Figure 8 clearly show that weight loss (%) depends on the foam position within the reactor: A11 which is the closest to the outlet shows the highest weight loss of 3.88%, and A9 owns a slightly lower weight loss of 3.36%, while A6, which is in the middle of the reactor, shows a weight loss of only 0.54%. In proximity of the outlet of the reactor, DRM products such as CO can be highly concentrated and cause carbon formation according to the reaction (8)
C O + H 2 C + H 2 O Δ H 0 = 131   k J   m o l 1
An energy–dispersive X-ray spectroscopy mapping analysis was performed on the A11 sample (Figure 9), investigating the elemental composition around a fracture in the Ru3CZS coating layer. The signal arising from carbon matches the Ni, Cr and Al signals, indicating that carbon formation does not occur on the catalyst layer. The limited amount of carbon can be thus ascribed to the presence of cracks in the passivation layer of the NiCrAl foam, which exposed metallic Ni to catalyze the cracking of methane.

2.6. Cell Test in IIR–Mode

The structured catalysts were finally tested as indirect internal reformers for solid–oxide fuel cells. For this purpose, a lanthanum–strontium perovskite–based SOFC was selected, LSFNi/LSGM/LSFCo + GDC, which recently proved to be a remarkably active and stable cell architecture for operation in carbon–containing species, also for CO2 electro–reduction [45]. The cell–testing system was optimized to accommodate four structured catalysts between the gas inlet and the SOFC anode. The whole system was pre–reduced for 2 h in H2 flux at 850 °C. A preliminary cell test was run with and without the structured catalysts, using identical conditions: 850 °C, pure hydrogen flux at the anode and static air at the cathode. I–V characterization and electrochemical impedance spectroscopy results are shown in Figure 10a,b, respectively. Cell performances were negligibly affected by the presence of the foams, as the maximum power density (MPD) values obtained were 364 mW/cm2 and 368 mW/cm2 with and without the structured catalysts, respectively. The presence of the foams resulted in a slightly higher activation and diffusion polarizations. The EIS analysis of Figure 10b shows that the cell ohmic resistance Rohm was 520 mΩ∙cm2 for the cell without a reforming system, and a minor increase was registered when the same measurement was repeated on the complete IIR–SOFC system. The total cell polarization resistance Rpol without the internal reforming section was 454 mΩ∙cm2 and increased by 11% with the structured catalysts. Spectra in the Nyquist plot of Figure 10b display two main arcs; thus, data were fitted with an LRohm(QHFRHF)(QLFRLF) equivalent circuit, where L is the inductance, Q is the constant phase element, related to the capacitive impedance of the process, and RHF and RLF represent the higher and lower frequency contributions to Rpol, respectively. The former is related to fast processes occurring in the bulk of the cell, such as O2− ions transfer at the electrolyte/electrode interface or within the electrode structure. The latter takes into account the slow, mass–controlled mechanisms: gas conversion (oxygen reduction/fuel oxidation) and diffusion to the electrode active sites [46,47,48]. As expected, the presence of the structured catalysts is mainly visible on the lower frequency arc, affecting mainly gas diffusion and increasing the polarization resistance by 24%, while the higher frequency contribution was slightly affected (+5%).
After the reduction in pure hydrogen, argon was used as a buffer before switching to the methane and carbon dioxide mixture. To better investigate the role of the Ru3CZS catalyst in the DRM reaction, the complete system (Ru3CZS–coated foams + SOFC) was tested and compared to the catalyst–free system (uncoated–foams + SOFC) and to the SOFC alone. The open circuit voltage (OCV) variation upon gas switch was monitored vs. time, and the results are shown in Figure 11a. In the starting 90% Ar + 10% H2 initial mixture, the OCV was around 1.06 V for the three samples. Upon gas switch, a severe lowering down to 0.72 V and 0.76 V was observed for the system without foams and with uncoated foams, respectively. This low OCV value may result from methane cracking occurring at the anode surface [49,50]: the slightly higher value observed for the system containing the uncoated foams may result from Ni in the NiCrAl alloy contributing to methane activation. Otherwise, an OCV of 1.01 V was observed with the Ru3CZS–coated foams, which, according to the Nernst equation, is the voltage expected for SOFC operation in a H2:CO mixture at 850 °C. Figure 11b shows the I–V and power density curves for the three different systems working in the DRM mixture. Although the recorded power density range in CH4:CO2 was significantly lower as compared to operation in 100% H2, the presence of the structured catalysts allowed for a 68% increase in MPD, obtaining 137 mW/cm2. Interestingly, the power density values observed for the SOFC alone and the system including the uncoated foams were similar to each other. Figure 11c shows the comparison of EIS spectra obtained with the complete IIR–SOFC system (Ru3CZS–coated foams + cell) in 100% H2 and in 50% CH4 / 50% CO2. Rohm was set to 0 to ease the comparison between polarization resistances. The Rpol increase upon gas switch was mainly attributed to the higher frequency arc, which was 36% larger in the DRM mixture than in pure hydrogen, while the lower frequency one was negligibly affected. This latter aspect can be attributed to a slower electrode polarization, as CO is also present in the reformed mixture that reaches the anode.

3. Materials and Methods

3.1. Catalyst Synthesis

CaZr0.85Sm0.15O3−δ (CSZ) containing 3 wt% nominal loading of Ru was prepared by the solution combustion method (SCS) by using glycine as fuel. Stoichiometric amounts of nitrate salts ZrO(NO3)2∙6H2O; Ca(NO3)3∙4H2O; Sm(NO3)3∙6H2O; Ru(NO)(NO3)3 and glycine were dissolved in distilled water following the increasing order of solubility. The solution was slowly dehydrated at 70 °C to obtain a dry gel; then, the temperature was increased up to 300 °C to ignite the combustion. A dark gray powder was obtained and calcined at 850 °C for 5 h with a heating rate of 2 °C/min. The final powder (Ru3CZS) was milled using a planetary ball mill (Fritsch, Mono Mill Pulverisette 6, Idar-Oberstein, Germany.) at 450 rpm for 3 h.

3.2. Structured Catalyst Fabrication

Commercial NiCrAl alloy foam (purchased from Alantum, München, Germany) with a pore size of 800 µm, porosity 90%, geometric surface area 6000 m2·m−3 and density 1250 g·m−3 was chosen as substrate for the catalyst deposition. The foam is provided with a ~0.33 µm thick passivated dense oxide layer to prevent internal oxidation [22,51]. For the structured catalyst fabrication, Ru3CZS was deposited on the commercial NiCrAl foams by the wash–coating method: metallic foams (disks of a diameter of 0.9 mm and thickness of 2.5 mm) were dipped into a stable slurry [22]. For the slurry preparation, triethanolamine (dispersant) and polyvinyl butyral resin (organic binder) were dissolved in 2–propanol (solvent) and homogenized using an ultrasound bath for 30 min at room temperature. To achieve the final slurry, Ru3CZS powder was added to the solution, and an ultrasonic processor sonication (Sonics Vibra Cell VCX–600, Newtown, CT, USA) was used for 5 min. The deposition process was carried out by consecutively dipping the foams into the slurry, blowing out the excess with compressed air and putting the coated samples in an oven at 105 °C for solvent evaporation. The process was repeated until the amount of deposited powder reached the 25 wt% of the uncoated foam. The coated foams were calcined at 750 °C for 5 h with a heating ramp of 5 °C/min. The coating adhesion strength was assessed by evaluating the weight loss after sonication: the samples were immersed in 2–propanol, sonicated for 20 min, and then dried at 120 °C for 2 h. For all measured samples, the weight loss was lower than 0.4 wt%.

3.3. Structured Catalyst Characterization

X-ray diffraction (XRD) analyses were performed using a Philips X–Pert Pro 500 diffractometer (Bridge Tronic Global, Fountain Valley, CA, USA) with Cu Kα radiation (λ = 1.54056 Å) in the range 2θ = 20°–90°, 0.05° step size and 3 s time per step.
A Mettler Toledo TG–DSC 1, STAR System was used for the thermogravimetric analyses. First, 50 mg of each sample was loaded into platinum crucibles, and the mass change was monitored on a heating ramp up to 1050 °C with a rate of 10 °C/min in flowing air.
Temperature–programmed reduction (H2–TPR) experiments were performed using a flow–through automatic instrument (AutoChem 2950 HP Micromeritics). The calcined sample was placed in a quartz reactor and pre–treated with 30 cm3 min−1 of a 5% O2/He gas mixture up to 500 °C (10 °C min−1), kept at 500 °C for one hour to ensure a well–defined oxidation state (reference state), and cooled to 50 °C. Then, 30 cm3 min−1 of a 5% H2/Ar gas mixture was introduced into the reactor, and the temperature was raised to 850 °C at a heating rate of 10 °C min−1. H2 consumption was measured using a TCD detector calibrated by reducing a known amount of CuO (99.99% purity from Sigma Aldrich).
The morphology of powders and foams was investigated by a field–emission scanning electron microscope (SUPRATM 35 (FE–SEM) Carl Zeiss STM, Oberkochem, Germany) and the chemical composition was determined by energy–dispersive X-ray spectroscopy (EDX INCAx–sight, Model: 7426, Oxford Instruments).

3.4. Catalytic Tests Apparatus

The activity of the catalyst–coated foams was studied by placing them in the center of a reactor consisting of an NHI®–1100 D.E. quartz tube (dimensions: diameter 13.00 ± 0.20 mm × thickness 1.50 ± 0.10 mm × length 500.00 ± 1.00 mm, manufactured by Helios Ital–quartz, equipped with a type N thermocouple inserted near the catalyst bed volume). The reagent gases were introduced through four Bronckhorst mass flow controllers. Any water generated by reactions such as RWGS was removed with a suitable cooling trap before entering the analysis system. The analyzer was an Agilent Technologies Micro GC 990, a gas chromatograph equipped with a micromechanical thermal conductivity detector (μTCD), that allows chemical analysis of gases in a very short time. The instrument was equipped with two capillary columns for the permanent gases using Ar as carrier gas (MS5A) and a PoraPLOT U with He as the carrier gas, which can be used for the analysis of gases generated during the operation of the reactor. The catalysts were subjected to a reduction treatment before testing. Samples were reduced in situ at 850 °C for 4 h with a heating ramp of 4 °C/min. After catalyst reduction, the reactant mixture (CH4, CO2, N2) (vol%) was fed in the reactor. CH4 and CO2 percent conversions (Xi %) were calculated according to Equation (9), in which C i 0 and C i are the inlet and outlet concentrations (%), respectively. ε is the expansion factor calculated by Equation (10), in which V 0 and V represent the gas volume at zero conversion and full conversion, respectively. Thermodynamic equilibrium conversions and H2/CO molar ratio for DRM were calculated using GASEQ software ver. 0.7.0.9, including all the possible main side reactions.
X i % = C i 0 C i C i 0 + ε C i
ε = V V 0 V 0
CH4 and CO2 percent conversions (Xi %) and the H2/CO molar ratio were recorded at different gas hourly space velocities, both vs. temperature and vs. time to evaluate the system response and stability.
A morphological analysis of spent structured catalysts after DRM reaction was carried out using FE–SEM. To evaluate the amount of deposited carbon, a thermogravimetric analysis of structured catalysts by using TG–DSC 1 (Mettler Toledo, STAR System) was carried out.

3.5. IIR–SOFC Tests

Button cells (area = 0.95 cm2) for IIR–SOFC tests were fabricated with an electrolyte–supported configuration. La0.8Sr0.2Ga0.8Mg0.2O3−δ commercial powder, purchased by Praxair, was shaped as 300 µm–thick disks and sintered at 1500 °C for 10 h. Perovskite–based electrodes were chosen as electrodes: La0.6Sr0.4Fe0.8Ni0.2O3−δ as the anode and a La0.6Sr0.4Fe0.8Co0.2O3−δ + Gd0.1Ce0.9O2 70:30 wt% mixture as the cathode. Perovskite–based inks were prepared using a serigraphic oil and applied on both sides of the electrolyte specifically, the anode was deposited by the spin–coating technique, and the cathode was brush–painted. Electrodes were fired at 950 °C for 2 h. IIR–SOFC tests were run at 850 °C. Four structured catalysts (Ru3CSZ–coated foams) were inserted into an alumina tube close to the gas inlet. The SOFC was then mounted on the top of the tube by using a ceramic sealant (Aremco Ceramabond 552) with the anode facing the foams. The cathode was exposed to static air. Au paste and wires were applied on the electrodes as current collectors. The alumina tube was inserted into a tubular furnace, and the operating temperature was reached with a heating ramp of 5°C/min. SOFCs were tested in a 50:50 = CH4:CO2 mixture. As reference, fuel cell tests were also carried out without foams. Electrochemical characterization (I–V and electrochemical impedance spectroscopy (EIS) measurements) was carried out using a PARSTAT 2273 potentiostat/galvanostat.

4. Conclusions

In this paper, 3 wt% Ru–CaZr0.85Sm0.15O3 (Ru3CZS) supported on NiCrAl foams were prepared and tested as supported catalysts for the dry reforming of methane. The active catalyst made up of a pure CaZr0.85Sm0.15O3 (CZS) phase along with ruthenium oxide was obtained by solution combustion synthesis. An even and well–adhered active catalyst layer was successfully deposited on the metal foam (25 wt%) through the wash–coating technique. The Ru3CZS–coated foams were subjected to a reduction treatment prior to the evaluation as DRM catalysts. After reduction, a uniform dispersion of Ru nanoparticles was observed on the surface of the CZS perovskite. The supported catalysts were tested for DRM in a fixed–bed quartz reactor at different temperatures and GHSV, revealing 98% conversion and a 0.93 H2/CO ratio at 850 °C. In general, the activity for DRM of the structured catalysts was stable, directly scaling with temperature and inversely proportional to the gas hourly space velocity, selecting an optimal GHSV of 1710 h−1. A minor coking formation was revealed after 40 h on 2 of the 11 structured catalysts used for DRM tests, and EDX analysis showed how it is entirely attributed to the presence of Ni in the commercial foams. Finally, the structured catalysts were tested for indirect internal reforming in an SOFC apparatus. To assess Ru3CZS activity, the SOFC was also tested alone and with uncoated foams. Comparable performance was obtained testing the system with and without structured catalysts in dry H2 at 850 °C. Conversely, when the fuel was switched to a 1:1 CH4:CO2, only the system with Ru3CZS–coated foams mounted upstream of the SOFC anode showed an OCV higher than 1 V, together with a 68% increase in the maximum power density. Ru3CZS–coated NiCrAl foams proved to be robust and efficient structured catalysts for DRM, allowing SOFC to work on biogas–simulating CH4:CO2 mixtures in the IIR–SOFC apparatus.

Supplementary Materials

The following supporting information can be downloaded at: https://www.mdpi.com/article/10.3390/catal13071129/s1, Figure S1: Representative EDX spectrum obtained on the reduced Ru3CZS sample. Elemental compositions (wt %) are reported in Table 1; Figure S2: Curves of thermodynamic conversion of reactants (a) and H2/ CO ratio (b) obtained by HSC chemistry with or without formation of C among the products.

Author Contributions

Conceptualization, I.L. and E.D.B.; methodology, L.D.; software, I.L.; validation, M.L.G., I.L. and E.D.B.; formal analysis, A.P., C.L. and F.S.; investigation, A.P.; resources, M.L.G.; data curation, A.P. and F.S.; writing—original draft preparation, L.D.; writing—review and editing, L.D. and E.D.B.; visualization, F.S.; supervision, M.L.G. and I.L.; project administration, E.D.B.; funding acquisition, E.D.B. All authors have read and agreed to the published version of the manuscript.

Funding

This work was funded by POR FESR LAZIO 2014–2020 MARVELOUS (A0375–2020–36494) project, the FSE–REACT EU Programma Operativo Nazionale Ricerca e Innovazione 2014–2020 (MUR) with the research contract “Towards the energy transition: multifunctional materials for solid oxide reversible cells” CUP E81B21004910005 and PRIN–2017–Prot.2017FCFYHK_004 project of the Italian Ministry for University and Research (MUR).

Data Availability Statement

The data presented in this study are available on request.

Acknowledgments

The authors gratefully acknowledge Cadia D’Ottavi for the technical support.

Conflicts of Interest

The authors declare no conflict of interest.

References

  1. Duerr, M.; Gair, S.; Cruden, A.; McDonald, J. Hydrogen and electrical energy from organic waste treatment. Int. J. Hydrogen Energy 2007, 32, 705–709. [Google Scholar] [CrossRef]
  2. Scarlat, N.; Dallemand, J.-F.; Fahl, F. Biogas: Developments and perspectives in Europe. Renew. Energy 2018, 129, 457–472. [Google Scholar] [CrossRef]
  3. Minh, D.P.; Siang, T.J.; Vo, D.-V.N.; Phan, T.S.; Ridart, C.; Nzihou, A.; Grouset, D. Hydrogen Production from Biogas Reforming: An Overview of Steam Reforming, Dry Reforming, Dual Reforming, and Tri–Reforming of Methane. In Hydrogen Supply Chain: Design, Deployment and Operation; Azzaro-Pantel, C., Ed.; Academic Press: Cambridge, MA, USA, 2018; pp. 111–166. [Google Scholar] [CrossRef] [Green Version]
  4. Mizera, A.; Błaszczak, P.; Bochentyn, B.; Lach, R.; Drożdż, E. Cu supported on various oxides as a candidate catalyst for dry methane reforming in DIR–SOFCs systems. Int. J. Hydrogen Energy 2022, 47, 25647–25661. [Google Scholar] [CrossRef]
  5. Zhang, J.; Wang, H.; Dalai, A.K. Development of stable bimetallic catalysts for carbon dioxide reforming of methane. J. Catal. 2007, 249, 300–310. [Google Scholar] [CrossRef]
  6. Tsoukalou, A.; Imtiaz, Q.; Kim, S.M.; Abdala, P.M.; Yoon, S.; Müller, C.R. Dry–reforming of methane over bimetallic Ni–M/La2O3 (M=Co, Fe): The effect of the rate of La2O2CO3 formation and phase stability on the catalytic activity and stability. J. Catal. 2016, 343, 208–214. [Google Scholar] [CrossRef]
  7. Gao, X.; Tan, Z.; Hidajat, K.; Kawi, S. Highly reactive Ni–Co/SiO2 bimetallic catalyst via complexation with oleylamine/oleic acid organic pair for dry reforming of methane. Catal. Today 2016, 281, 250–258. [Google Scholar] [CrossRef]
  8. Turap, Y.; Wang, I.; Fu, T.; Wu, Y.; Wang, Y. Co–Ni alloy supported on CeO2 as a bimetallic catalyst for dry reforming of methane. Int. J. Hydrogen Energy 2020, 45, 6538–6548. [Google Scholar] [CrossRef]
  9. Djinović, P.; Črnivec, I.G.O.; Pintar, A. Biogas to syngas conversion without carbonaceous deposits via the dry reforming reaction using transition metal catalysts. Catal. Today 2015, 253, 155–162. [Google Scholar] [CrossRef]
  10. Majewski, A.J.; Wood, J.; Bujalski, W. Nickel–silica core@shell catalyst for methane reforming. Int. J. Hydrogen Energy 2013, 38, 14531–14541. [Google Scholar] [CrossRef] [Green Version]
  11. Yoshida, K.; Begum, N.; Ito, S.-I.; Tomishige, K. Oxidative steam reforming of methane over Ni/α–Al2O3 modified with trace noble metals. Appl. Catal. A Gen. 2009, 358, 186–192. [Google Scholar] [CrossRef]
  12. Grilli, M.L.; Slobozeanu, A.E.; Larosa, C.; Paneva, D.; Yakoumis, I.; Cherkezova-Zheleva, Z. Platinum Group Metals: Green Recovery from Spent Auto–Catalysts and Reuse in New Catalysts—A Review. Crystals 2023, 13, 550. [Google Scholar] [CrossRef]
  13. Erdohelyi, A.; Cserenyi, J.; Solymosi, F. Activation of CH4 and Its Reaction with CO2 over Supported Rh Catalysts. J. Catal. 1993, 141, 287–299. [Google Scholar] [CrossRef] [Green Version]
  14. Gurav, H.R.; Dama, S.; Samuel, V.; Chilukuri, S. Influence of preparation method on activity and stability of Ni catalysts supported on Gd doped ceria in dry reforming of methane. J. CO2 Util. 2017, 20, 357–367. [Google Scholar] [CrossRef]
  15. Liu, W.; Li, L.; Lin, S.; Luo, Y.; Bao, Z.; Mao, Y.; Li, K.; Wu, D.; Peng, H. Confined Ni–In intermetallic alloy nanocatalyst with excellent coking resistance for methane dry reforming. J. Energy Chem. 2021, 65, 34–47. [Google Scholar] [CrossRef]
  16. Ahn, S.; Littlewood, P.; Liu, Y.; Marks, T.J.; Stair, P.C. Stabilizing Supported Ni Catalysts for Dry Reforming of Methane by Combined La Doping and Al Overcoating Using Atomic Layer Deposition. ACS Catal. 2022, 12, 10522–10530. [Google Scholar] [CrossRef]
  17. Mortazavi-Manesh, A.; Safari, N.; Bahadoran, F.; Khani, Y. Synthesis, characterization, and methanol steam reforming performance of Cu/perovskite–structured catalysts. Heliyon 2023, 9, e13742. [Google Scholar] [CrossRef] [PubMed]
  18. Zhu, J.; Li, H.; Zhong, L.; Xiao, P.; Xu, X.; Yang, X.; Zhao, Z.; Li, J. Perovskite Oxides: Preparation, Characterizations, and Applications in Heterogeneous Catalysis. ACS Catal. 2014, 4, 2917–2940. [Google Scholar] [CrossRef]
  19. Duranti, L.; Sora, I.N.; Zurlo, F.; Luisetto, I.; Licoccia, S.; Di Bartolomeo, E. The role of manganese substitution on the redox behavior of La0.6Sr0.4Fe0.8Mn0.2O3−δ. J. Eur. Ceram. Soc. 2020, 40, 4076–4083. [Google Scholar] [CrossRef]
  20. Singh, R.; Dhir, A.; Mohapatra, S.K.; Mahla, S.K. Dry reforming of methane using various catalysts in the process. Biomass Convers. Biorefin. 2020, 10, 567–587. [Google Scholar] [CrossRef]
  21. Twigg, M.V.; Richardson, J.T. Fundamentals and Applications of Structured Ceramic Foam Catalysts. Ind. Eng. Chem. Res. 2007, 46, 4166–4177. [Google Scholar] [CrossRef]
  22. Santoro, M.; Luisetto, I.; Tuti, S.; Licoccia, S.; Romano, C.; Notargiacomo, A.; Di Bartolomeo, E. Nickel–Based Structured Catalysts for Indirect Internal Reforming of Methane. Appl. Sci. 2020, 10, 3083. [Google Scholar] [CrossRef]
  23. Zhang, J.-C.; Ge, B.-H.; Liu, T.-F.; Yang, Y.-Z.; Li, B.; Li, W.-Z. Robust Ruthenium–Saving Catalyst for High–Temperature Carbon Dioxide Reforming of Methane. ACS Catal. 2019, 10, 783–791. [Google Scholar] [CrossRef]
  24. Gao, X.; Wang, Z.; Ashok, J.; Kawi, S. A comprehensive review of anti–coking, anti–poisoning and anti–sintering catalysts for biomass tar reforming reaction. Chem. Eng. Sci. X 2020, 7, 100065. [Google Scholar] [CrossRef]
  25. Shiratori, Y.; Ijichi, T.; Oshima, T.; Sasaki, K. Internal reforming SOFC running on biogas. Int. J. Hydrogen Energy 2010, 35, 7905–7912. [Google Scholar] [CrossRef]
  26. Chiodo, V.; Galvagno, A.; Lanzini, A.; Papurello, D.; Urbani, F.; Santarelli, M.; Freni, S. Biogas reforming process investigation for SOFC application. Energy Convers. Manag. 2015, 98, 252–258. [Google Scholar] [CrossRef]
  27. Faro, M.L.; Antonucci, V.; Antonucci, P.; Aricò, A. Fuel flexibility: A key challenge for SOFC technology. Fuel 2012, 102, 554–559. [Google Scholar] [CrossRef]
  28. Sarno, C.; Luisetto, I.; Zurlo, F.; Licoccia, S.; Di Bartolomeo, E. Lanthanum chromite based composite anodes for dry reforming of methane. Int. J. Hydrogen Energy 2018, 43, 14742–14750. [Google Scholar] [CrossRef]
  29. Santoro, M.; Di Bartolomeo, E.; Luisetto, I.; Aricò, A.; Squadrito, G.; Zignani, S.; Faro, M.L. Insights on the electrochemical performance of indirect internal reforming of biogas into a solid oxide fuel cell. Electrochim. Acta 2022, 409, 139940. [Google Scholar] [CrossRef]
  30. Luisetto, I.; Mancini, M.R.; Della Seta, L.; Chierchia, R.; Vanga, G.; Grilli, M.L.; Stendardo, S. CaO–CaZrO3 Mixed Oxides Prepared by Auto–Combustion for High Temperature CO2 Capture: The Effect of CaO Content on Cycle Stability. Metals 2020, 10, 750. [Google Scholar] [CrossRef]
  31. Shannon, R.D. Revised effective ionic radii and systematic studies of interatomic distances in halides and chalcogenides. Acta Crystallogr. Sect. A Cryst. Phys. Diffr. Theor. Gen. Crystallogr. 1976, A32, 751–766. [Google Scholar] [CrossRef]
  32. Lawson, S.M.; Greaves, G.; Blackburn, L.R.; Chapman, R.; Hyatt, N.C.; Corkhill, C.L. Synthesis and in situ ion irradiation of A–site deficient zirconate perovskite ceramics. J. Mater. Chem. A 2020, 8, 19454–19466. [Google Scholar] [CrossRef]
  33. Kim, D.H.; Yu, B.Y.; Cha, P.R.; Yoon, W.Y.; Byun, J.Y.; Kim, S.H. A study on FeCrAl foam as effective catalyst support under thermal and mechanical stresses. Surf. Coat. Technol. 2012, 209, 169–176. [Google Scholar] [CrossRef]
  34. Tsiotsias, A.I.; Charisiou, N.D.; AlKhoori, A.; Gaber, S.; Sebastian, V.; Hinder, S.J.; Baker, M.A.; Polychronopoulou, K.; Goula, M.A. Towards maximizing conversion of ethane and carbon dioxide into synthesis gas using highly stable Ni–perovskite catalysts. J. CO2 Util. 2022, 61, 102046. [Google Scholar] [CrossRef]
  35. Madhavaram, H.; Idriss, H.; Wendt, S.; Kim, Y.; Knapp, M.; Over, H.; Aßmann, J.; Löffler, E.; Muhler, M. Oxidation Reactions over RuO2: A Comparative Study of the Reactivity of the (110) Single Crystal and Polycrystalline Surfaces. J. Catal. 2001, 202, 296–307. [Google Scholar] [CrossRef] [Green Version]
  36. Roine, A. HSC–software Ver. 3.0 for thermodynamic calculations. In Proceedings of the International Symposium on Computer Software in Chemical and Extractive Metallurgy; Elsevier: Amsterdam, The Netherlands, 1989; pp. 15–29. [Google Scholar]
  37. Luisetto, I.; Tuti, S.; Romano, C.; Boaro, M.; Di Bartolomeo, E.; Kesavan, J.K.; Kumar, S.S.; Selvakumar, K. Dry reforming of methane over Ni supported on doped CeO2: New insight on the role of dopants for CO2 activation. J. CO2 Util. 2019, 30, 63–78. [Google Scholar] [CrossRef]
  38. Seo, M.; Kim, S.Y.; Kim, Y.D.; Park, E.D.; Uhm, S. Highly stable barium zirconate supported nickel oxide catalyst for dry reforming of methane: From powders toward shaped catalysts. Int. J. Hydrogen Energy 2018, 43, 11355–11362. [Google Scholar] [CrossRef]
  39. Wei, J.; Iglesia, E. Isotopic and kinetic assessment of the mechanism of reactions of CH4 with CO2 or H2O to form synthesis gas and carbon on nickel catalysts. J. Catal. 2004, 224, 370–383. [Google Scholar] [CrossRef]
  40. Khairudin, N.F.; Mohammadi, M.; Mohamed, A.R. An investigation on the relationship between physicochemical characteristics of alumina–supported cobalt catalyst and its performance in dry reforming of methane. Environ. Sci. Pollut. Res. 2021, 28, 29157–29176. [Google Scholar] [CrossRef]
  41. Dreyer, J.A.; Li, P.; Zhang, L.; Beh, G.K.; Zhang, R.; Sit, P.H.-L.; Teoh, W.Y. Influence of the oxide support reducibility on the CO2 methanation over Ru–based catalysts. Appl. Catal. B Environ. 2017, 219, 715–726. [Google Scholar] [CrossRef]
  42. Quindimil, A.; De-La-Torre, U.; Pereda-Ayo, B.; Davó-Quiñonero, A.; Bailón-García, E.; Lozano-Castelló, D.; González-Marcos, J.A.; Bueno-López, A.; González-Velasco, J.R. Effect of metal loading on the CO2 methanation: A comparison between alumina supported Ni and Ru catalysts. Catal. Today 2019, 356, 419–432. [Google Scholar] [CrossRef]
  43. Arora, S.; Prasad, R. An overview on dry reforming of methane: Strategies to reduce carbonaceous deactivation of catalysts. RSC Adv. 2016, 6, 108668–108688. [Google Scholar] [CrossRef]
  44. Nijdam, T.; Jeurgens, L.; Sloof, W. Promoting exclusive α–Al2O3 growth upon high–temperature oxidation of NiCrAl alloys: Experiment versus model predictions. Acta Mater. 2005, 53, 1643–1653. [Google Scholar] [CrossRef]
  45. Liu, S.; Liu, Q.; Luo, J.-L. Highly Stable and Efficient Catalyst with In Situ Exsolved Fe–Ni Alloy Nanospheres Socketed on an Oxygen Deficient Perovskite for Direct CO2 Electrolysis. ACS Catal. 2016, 6, 6219–6228. [Google Scholar] [CrossRef]
  46. Marasi, M.; Panunzi, A.P.; Duranti, L.; Lisi, N.; Di Bartolomeo, E. Enhancing Oxygen Reduction Activity and Structural Stability of La0.6Sr0.4FeO3−δ by 1 mol % Pt and Ru B–Site Doping for Application in All–Perovskite IT–SOFCs. ACS Appl. Energy Mater. 2022, 5, 2918–2928. [Google Scholar] [CrossRef]
  47. Marasi, M.; Duranti, L.; Luisetto, I.; Fabbri, E.; Licoccia, S.; Di Bartolomeo, E. Ru–doped lanthanum ferrite as a stable and versatile electrode for reversible symmetric solid oxide cells (r–SSOCs). J. Power Sources 2023, 555, 232399. [Google Scholar] [CrossRef]
  48. Duranti, L.; Luisetto, I.; Licoccia, S.; D’Ottavi, C.; di Bartolomeo, E. Novel Composite Fuel Electrode for CO2/CO–RSOCs. J. Electrochem. Soc. 2021, 168, 104507. [Google Scholar] [CrossRef]
  49. Duranti, L.; Luisetto, I.; Licoccia, S.; Del Gaudio, C.; Di Bartolomeo, E. Electrochemical performance and stability of LSFMn+NiSDC anode in dry methane. Electrochimica Acta 2020, 362, 137116. [Google Scholar] [CrossRef]
  50. Duranti, L.; Luisetto, I.; Casciardi, S.; Del Gaudio, C.; Di Bartolomeo, E. Multi–functional, high–performing fuel electrode for dry methane oxidation and CO2 electrolysis in reversible solid oxide cells. Electrochim. Acta 2021, 394, 139163. [Google Scholar] [CrossRef]
  51. Liu, X.; Wu, J. Coupling interface constructions of NiO–Cr2O3 heterostructures for efficient electrocatalytic oxygen evolution. Electrochim. Acta 2019, 320, 134577. [Google Scholar] [CrossRef]
Figure 1. Schematic solution combustion synthesis procedure. (i) glycine is added to the solution of metal cations; then, water is evaporated overnight at 70 °C to form a gel; (ii) temperature is risen to 300 °C to ignite the combustion of the gel and form precursors ashes in the form of a black powder; (iii) the obtained brown oxide powder indicates the final perovskite formation, which is obtained after calcination at 850 °C for 5 h.
Catalysts 13 01129 g001
Figure 2. (a) XRD plot of Ru3CZS precursor ashes obtained after combustion, the CaZrO3 reference JCPDS card is added for comparison; (b) Thermogravimetric analysis profile and DTG curve resulting from Ru3CZS precursors, studied from RT to 1000 °C in flowing air; (c) XRD plot of CZS and Ru3CZS after the 5 h calcination step at 850 °C, CaZrO3 and RuO2 reference JCPDS cards are added for comparison; (d) 20° < 2θ < 40° enlargement of (c); (e) FE–SEM micrograph of CZS sample after reduction in 5% H2/Ar at 850 °C; (f) FE–SEM micrograph of Ru3CZS sample after reduction in 5% H2/Ar at 850 °C.
Catalysts 13 01129 g002
Figure 3. FE–SEM micrographs of: (a) NiCrAl foam (larger magnification in the inset) and (b) NiCrAl foam coated with Ru3CSZ catalyst layer (larger magnification in the inset).
Catalysts 13 01129 g003
Figure 4. H2–TPR profile of the magnified (5×) bare NiCrAl foam (a); CZS perovskite oxide (b); and Ru3CZS (c).
Catalysts 13 01129 g004
Figure 5. Schematization of the fixed–bed quartz reactor used for the structured catalysts activity assessment.
Catalysts 13 01129 g005
Figure 6. Reaction condition as a function of temperature at different total flows (50, 100 and 200 cm3·min−1) with CH4/CO2 = 1 composition: (a) CH4 (closed symbols) and CO2 (open symbols) conversion (%); (b) H2/CO molar ratio.
Catalysts 13 01129 g006
Figure 7. (a) CH4 and (b) CO2 conversion (%) vs. time of stream temperature at different total flows (50, 100 and 200 cm3·min−1) and CH4/CO2 = 1; the temperature profile (purple line) is reported; (c) H2/CO molar ratio vs. time of stream at different total flows (50, 100 and 200 cm3·min−1) and CH4/CO2 = 1; the temperature profile (purple line) is reported.
Catalysts 13 01129 g007
Figure 8. (a) Scheme of packed reactor with labels, positions of the foams and micrographs of A1, A3, A6, A9, and A11 foams; (b) mass loss (%) of A1, A3, A6, A9, A11 between 25 and 1000 °C.
Catalysts 13 01129 g008aCatalysts 13 01129 g008b
Figure 9. SEM micrograph and EDX mapping results of a localized fractured coating in an A11 spent sample.
Catalysts 13 01129 g009
Figure 10. (a) I–V and power density curves of the SOFC apparatus tested at 850 °C in dry hydrogen, with (red) and without (black) the structured catalysts; (b) Nyquist plot with EIS data recorded at open circuit for the cells tested in (a). Data were fitted with an equivalent LR(QR)(QR) circuit, which is depicted in the upper part of the panel.
Catalysts 13 01129 g010
Figure 11. (a) Open circuit voltage vs. time trends upon switching the gas feed from hydrogen to DRM mixture (50% CH4 + 50% CO2) for: the SOFC alone (black), the uncoated foams + SOFC (green), the Ru3CZS–coated foams + SOFC (red); (b) I–V and power density curves of the three systems described in (a) tested at 850 °C in DRM mixture; (c) EIS spectra comparison for the complete IIR–SOFC system tested at open circuit in 100% H2 (blue) and DRM mixture (red). Data were fitted with an equivalent LR(QR)(QR) circuit, ohmic resistance was set to 0 to ease Rpol comparison.
Catalysts 13 01129 g011aCatalysts 13 01129 g011b
Table 1. Elemental amounts (wt%) obtained by EDX analyses on reduced Ru3CZS sample.
ElementNominal wt%Measured wt%
O25.225.8 ± 2.4
Ca20.420.2 ± 3.8
Zr39.838. 4 ± 1.5
Sm11.611.2 ± 0.9
Ru33.1 ± 0.3
Disclaimer/Publisher’s Note: The statements, opinions and data contained in all publications are solely those of the individual author(s) and contributor(s) and not of MDPI and/or the editor(s). MDPI and/or the editor(s) disclaim responsibility for any injury to people or property resulting from any ideas, methods, instructions or products referred to in the content.

