
CO2 to Value-Added Chemicals: Synthesis and Performance of Mono- and Bimetallic Nickel–Cobalt Nanofiber Catalysts
 , , and
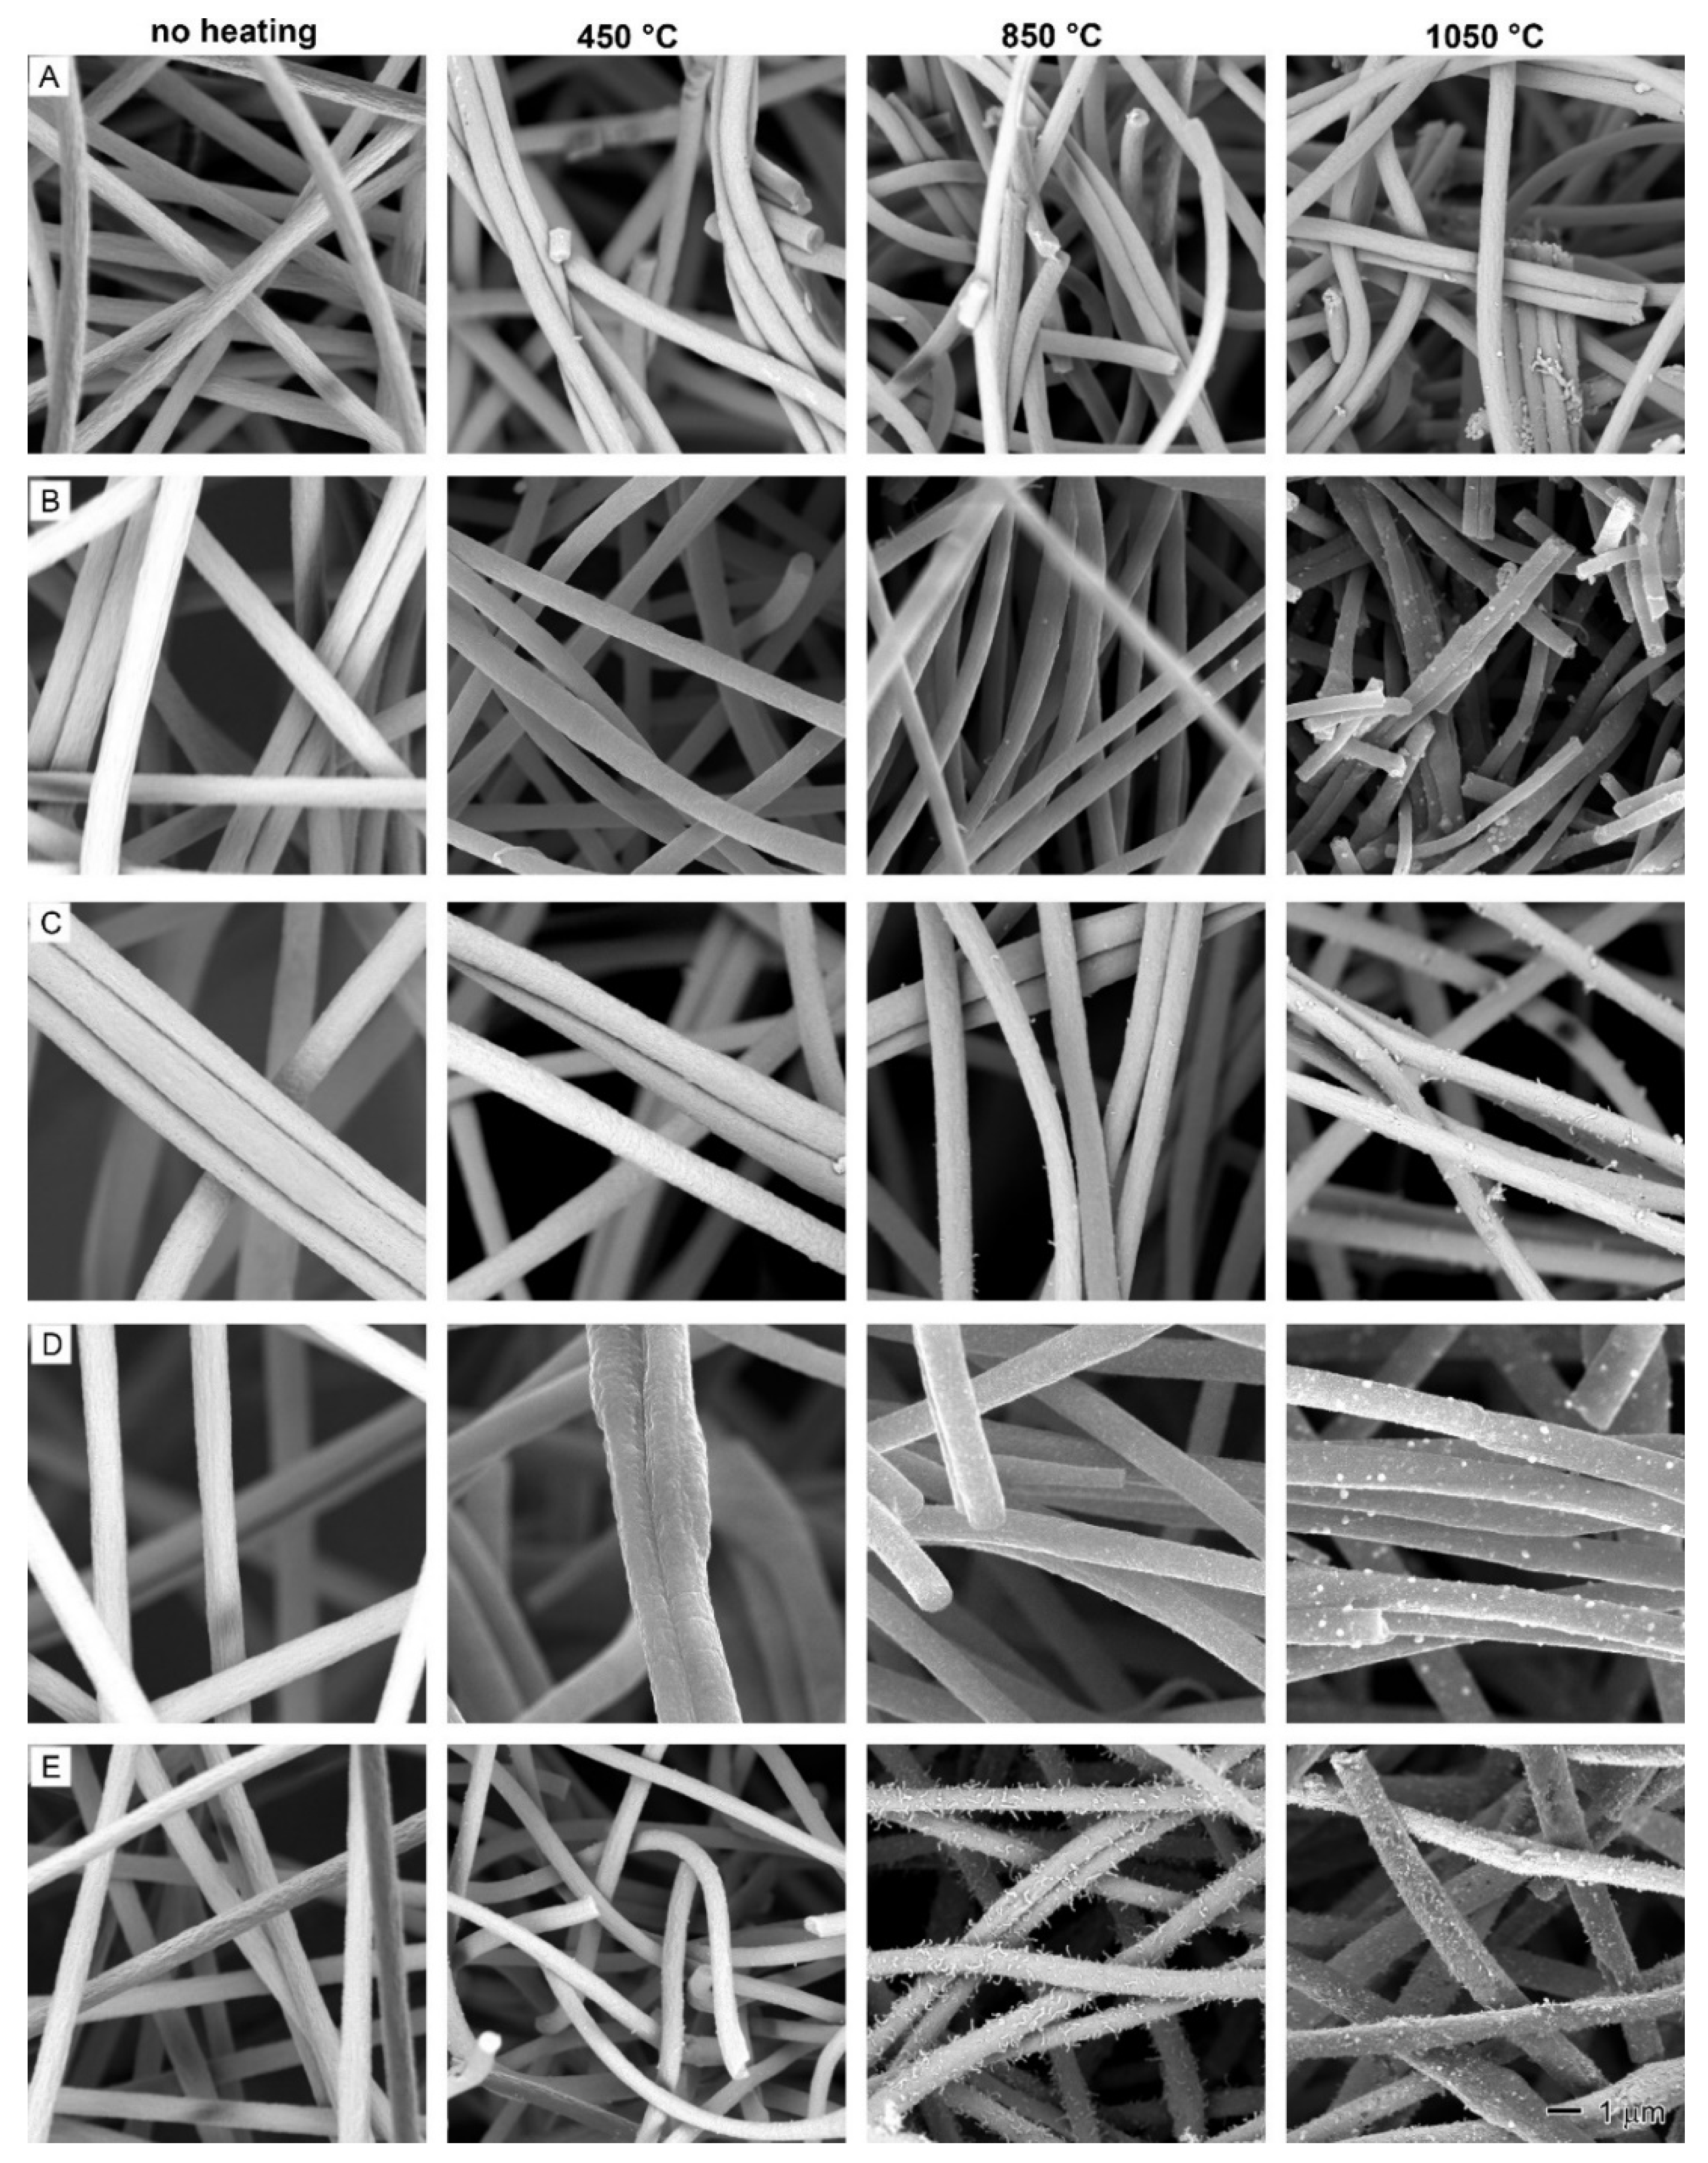
Abstract
:1. Introduction
2. Results and Discussion
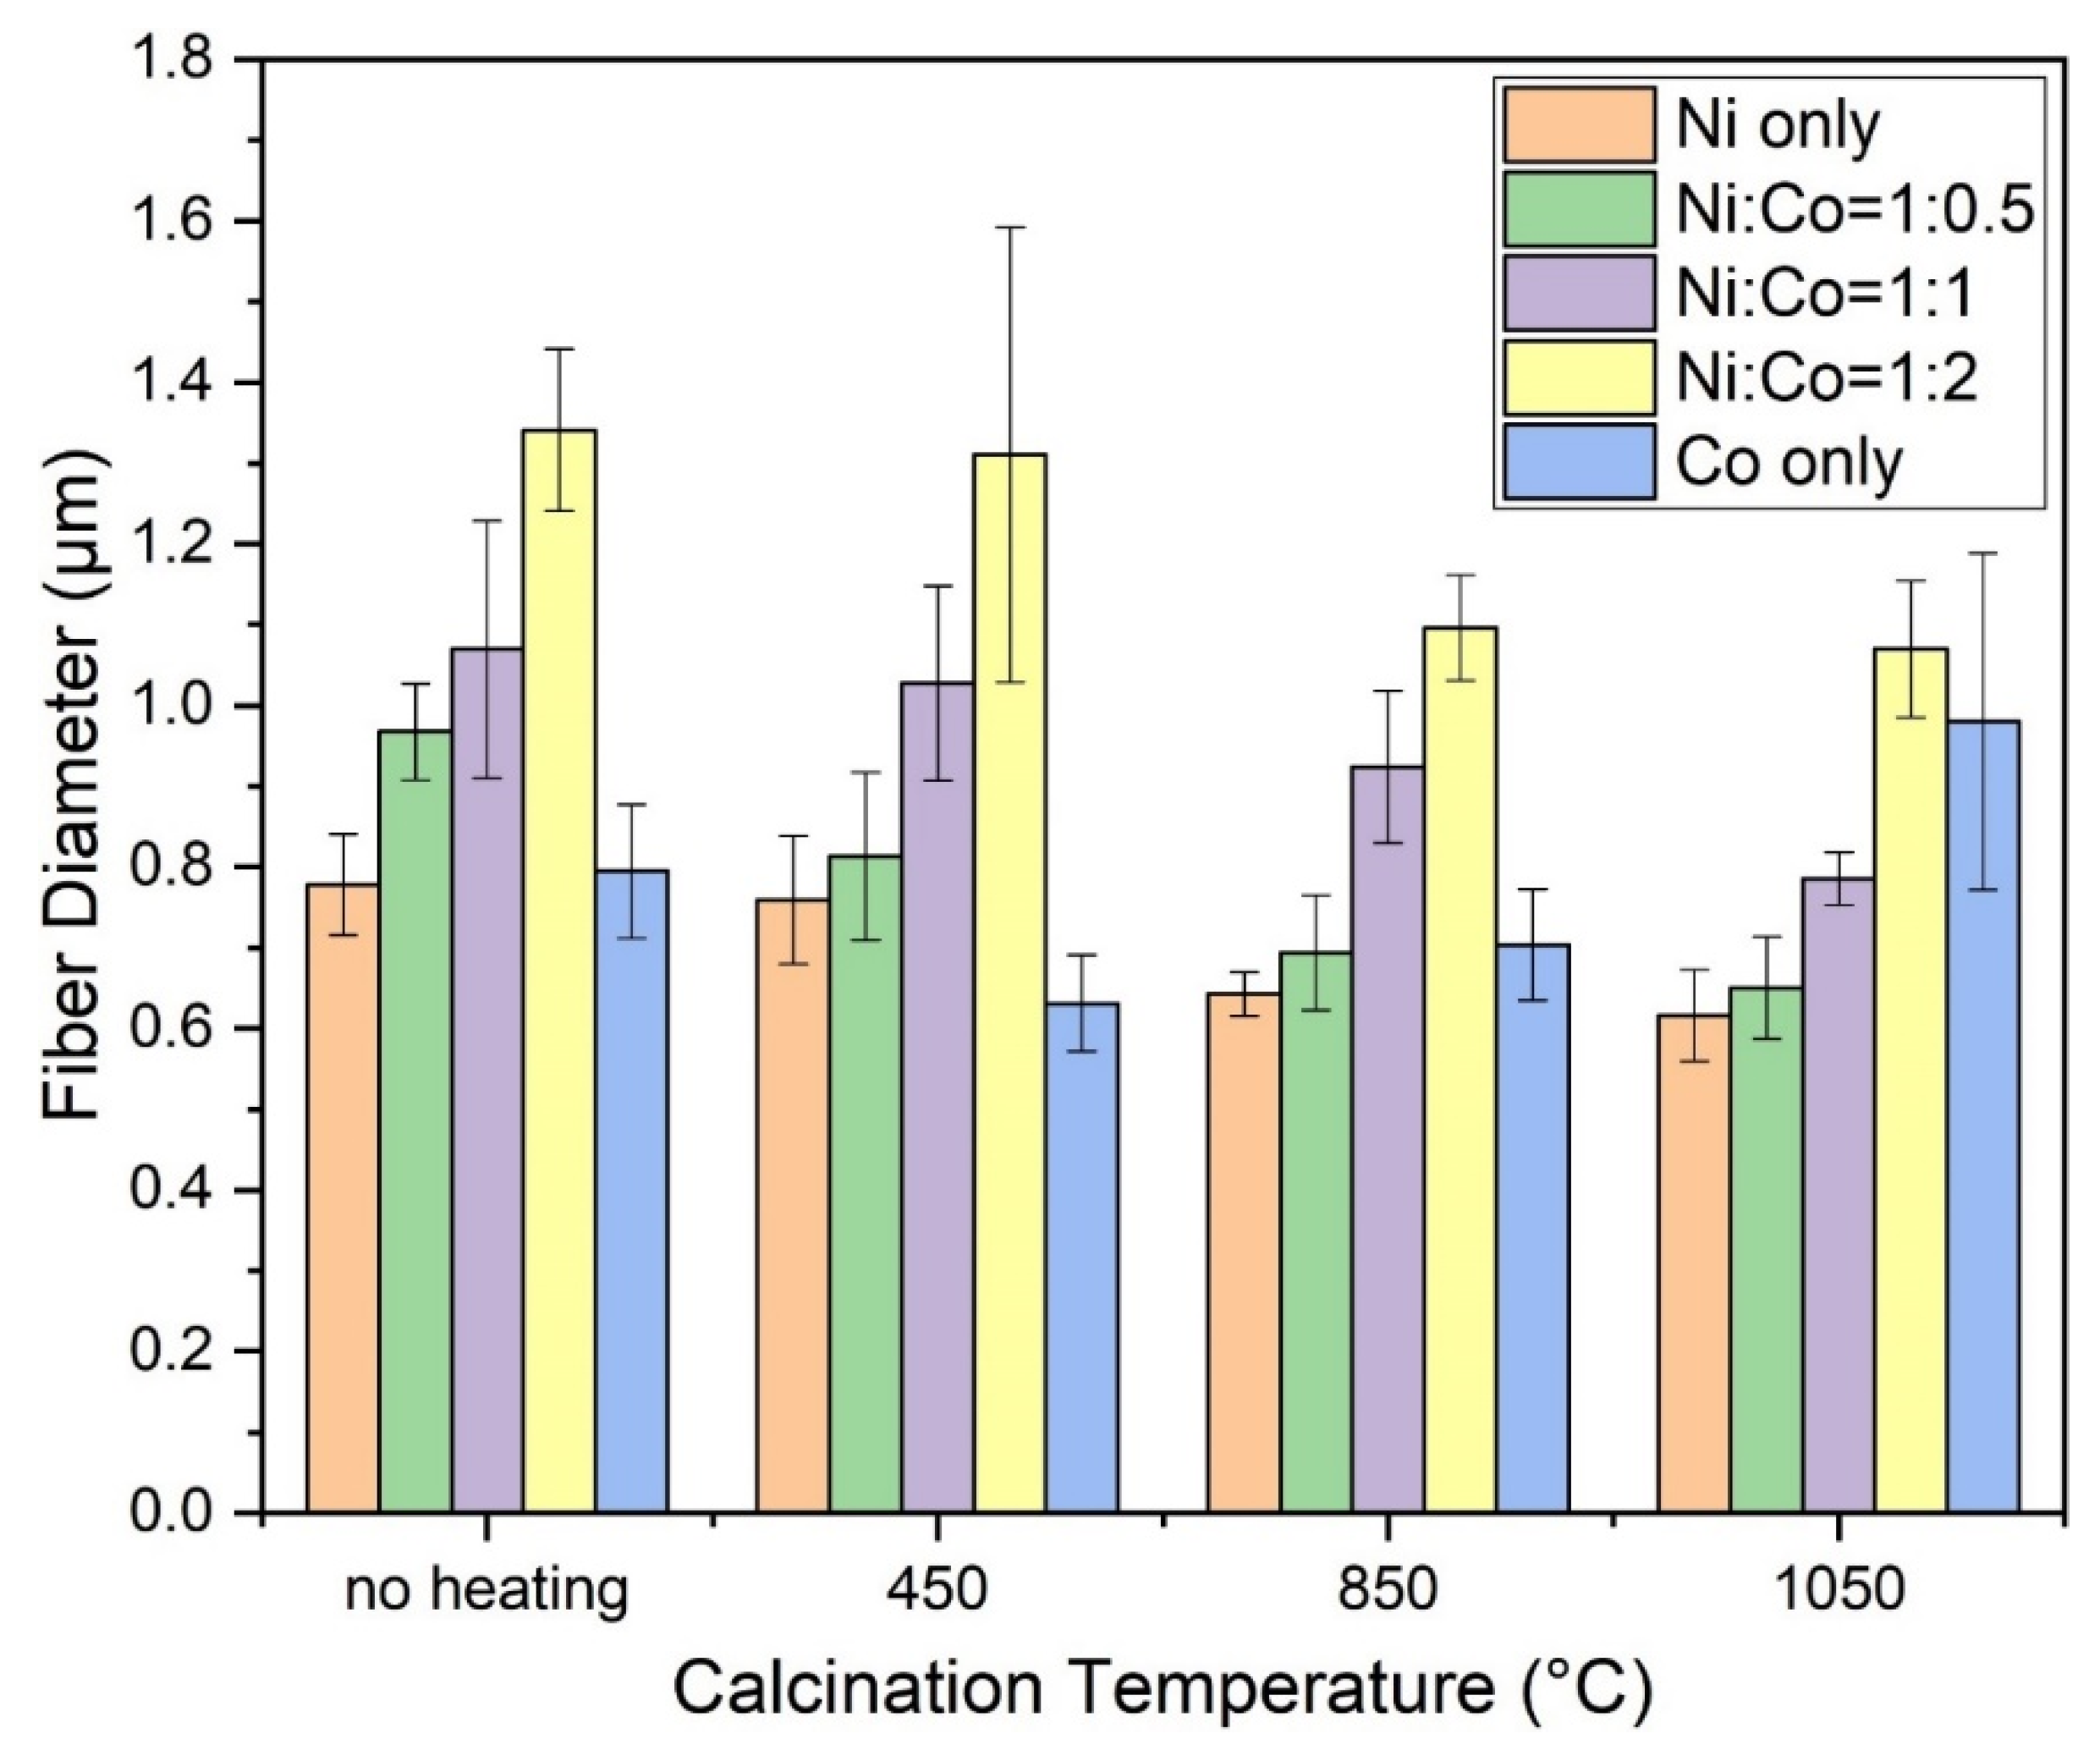
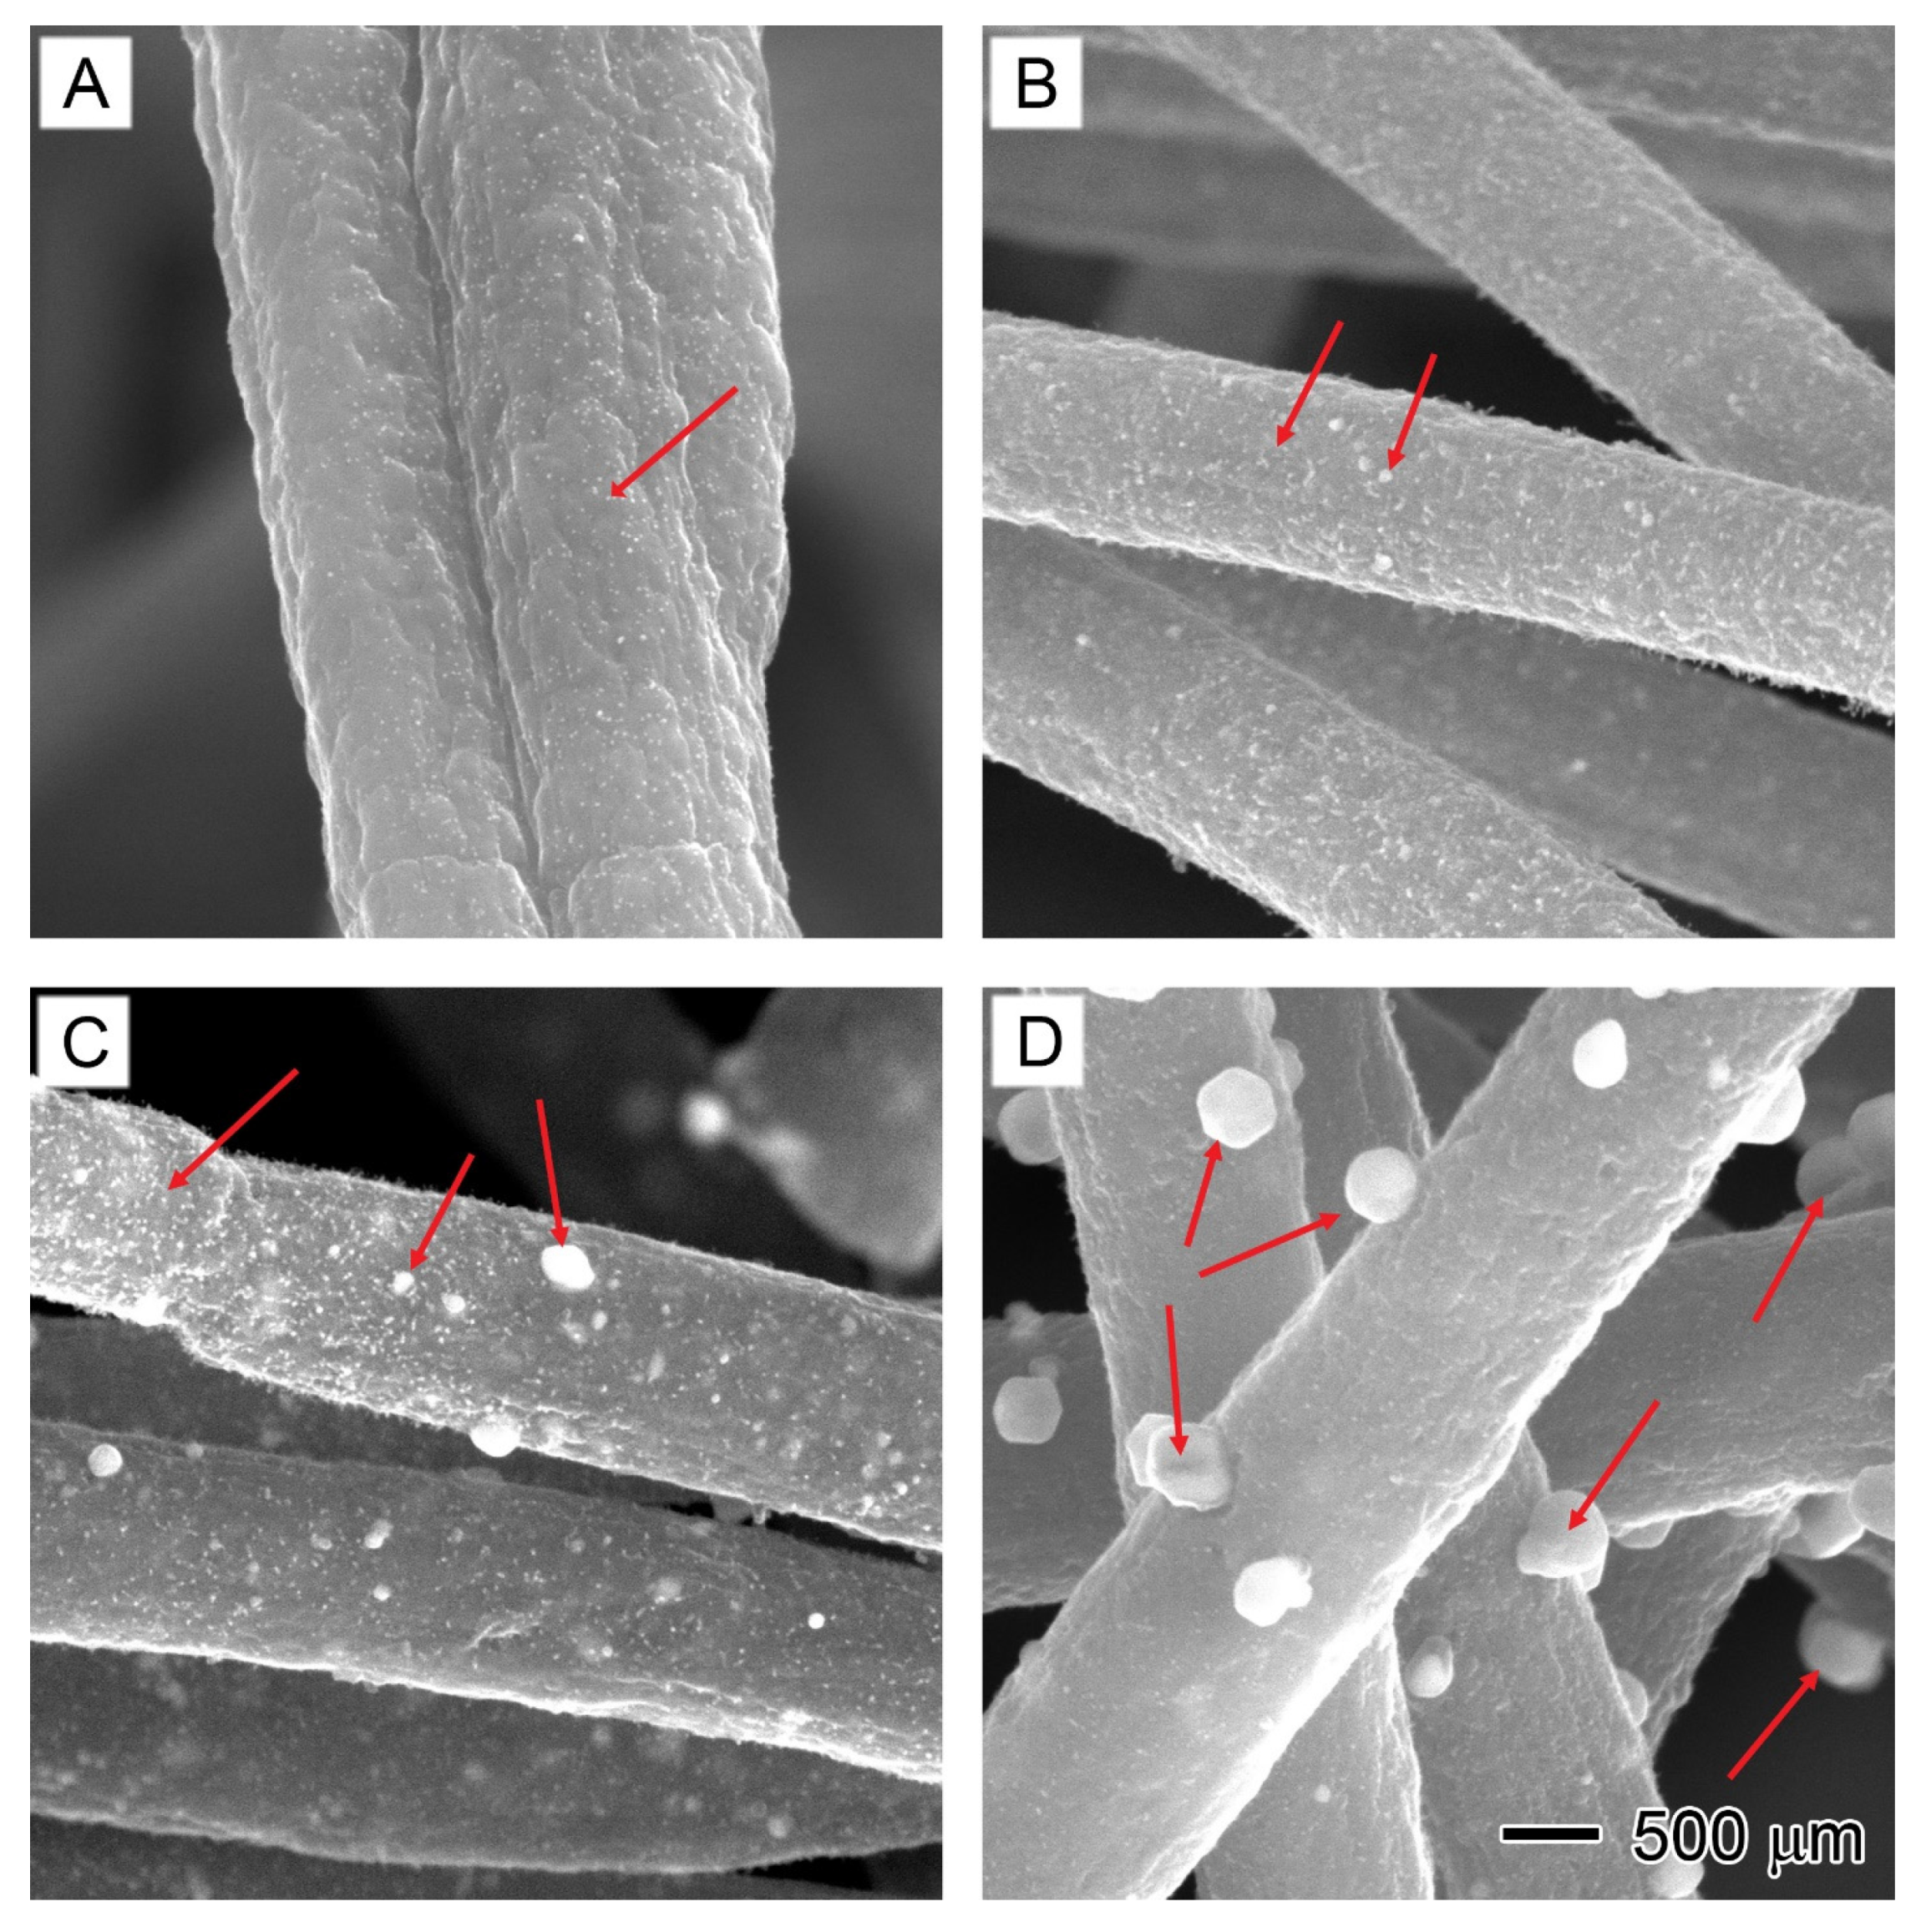
2.1. Physical Structure of Mono- and Bimetallic Ni–Co Nanofibers
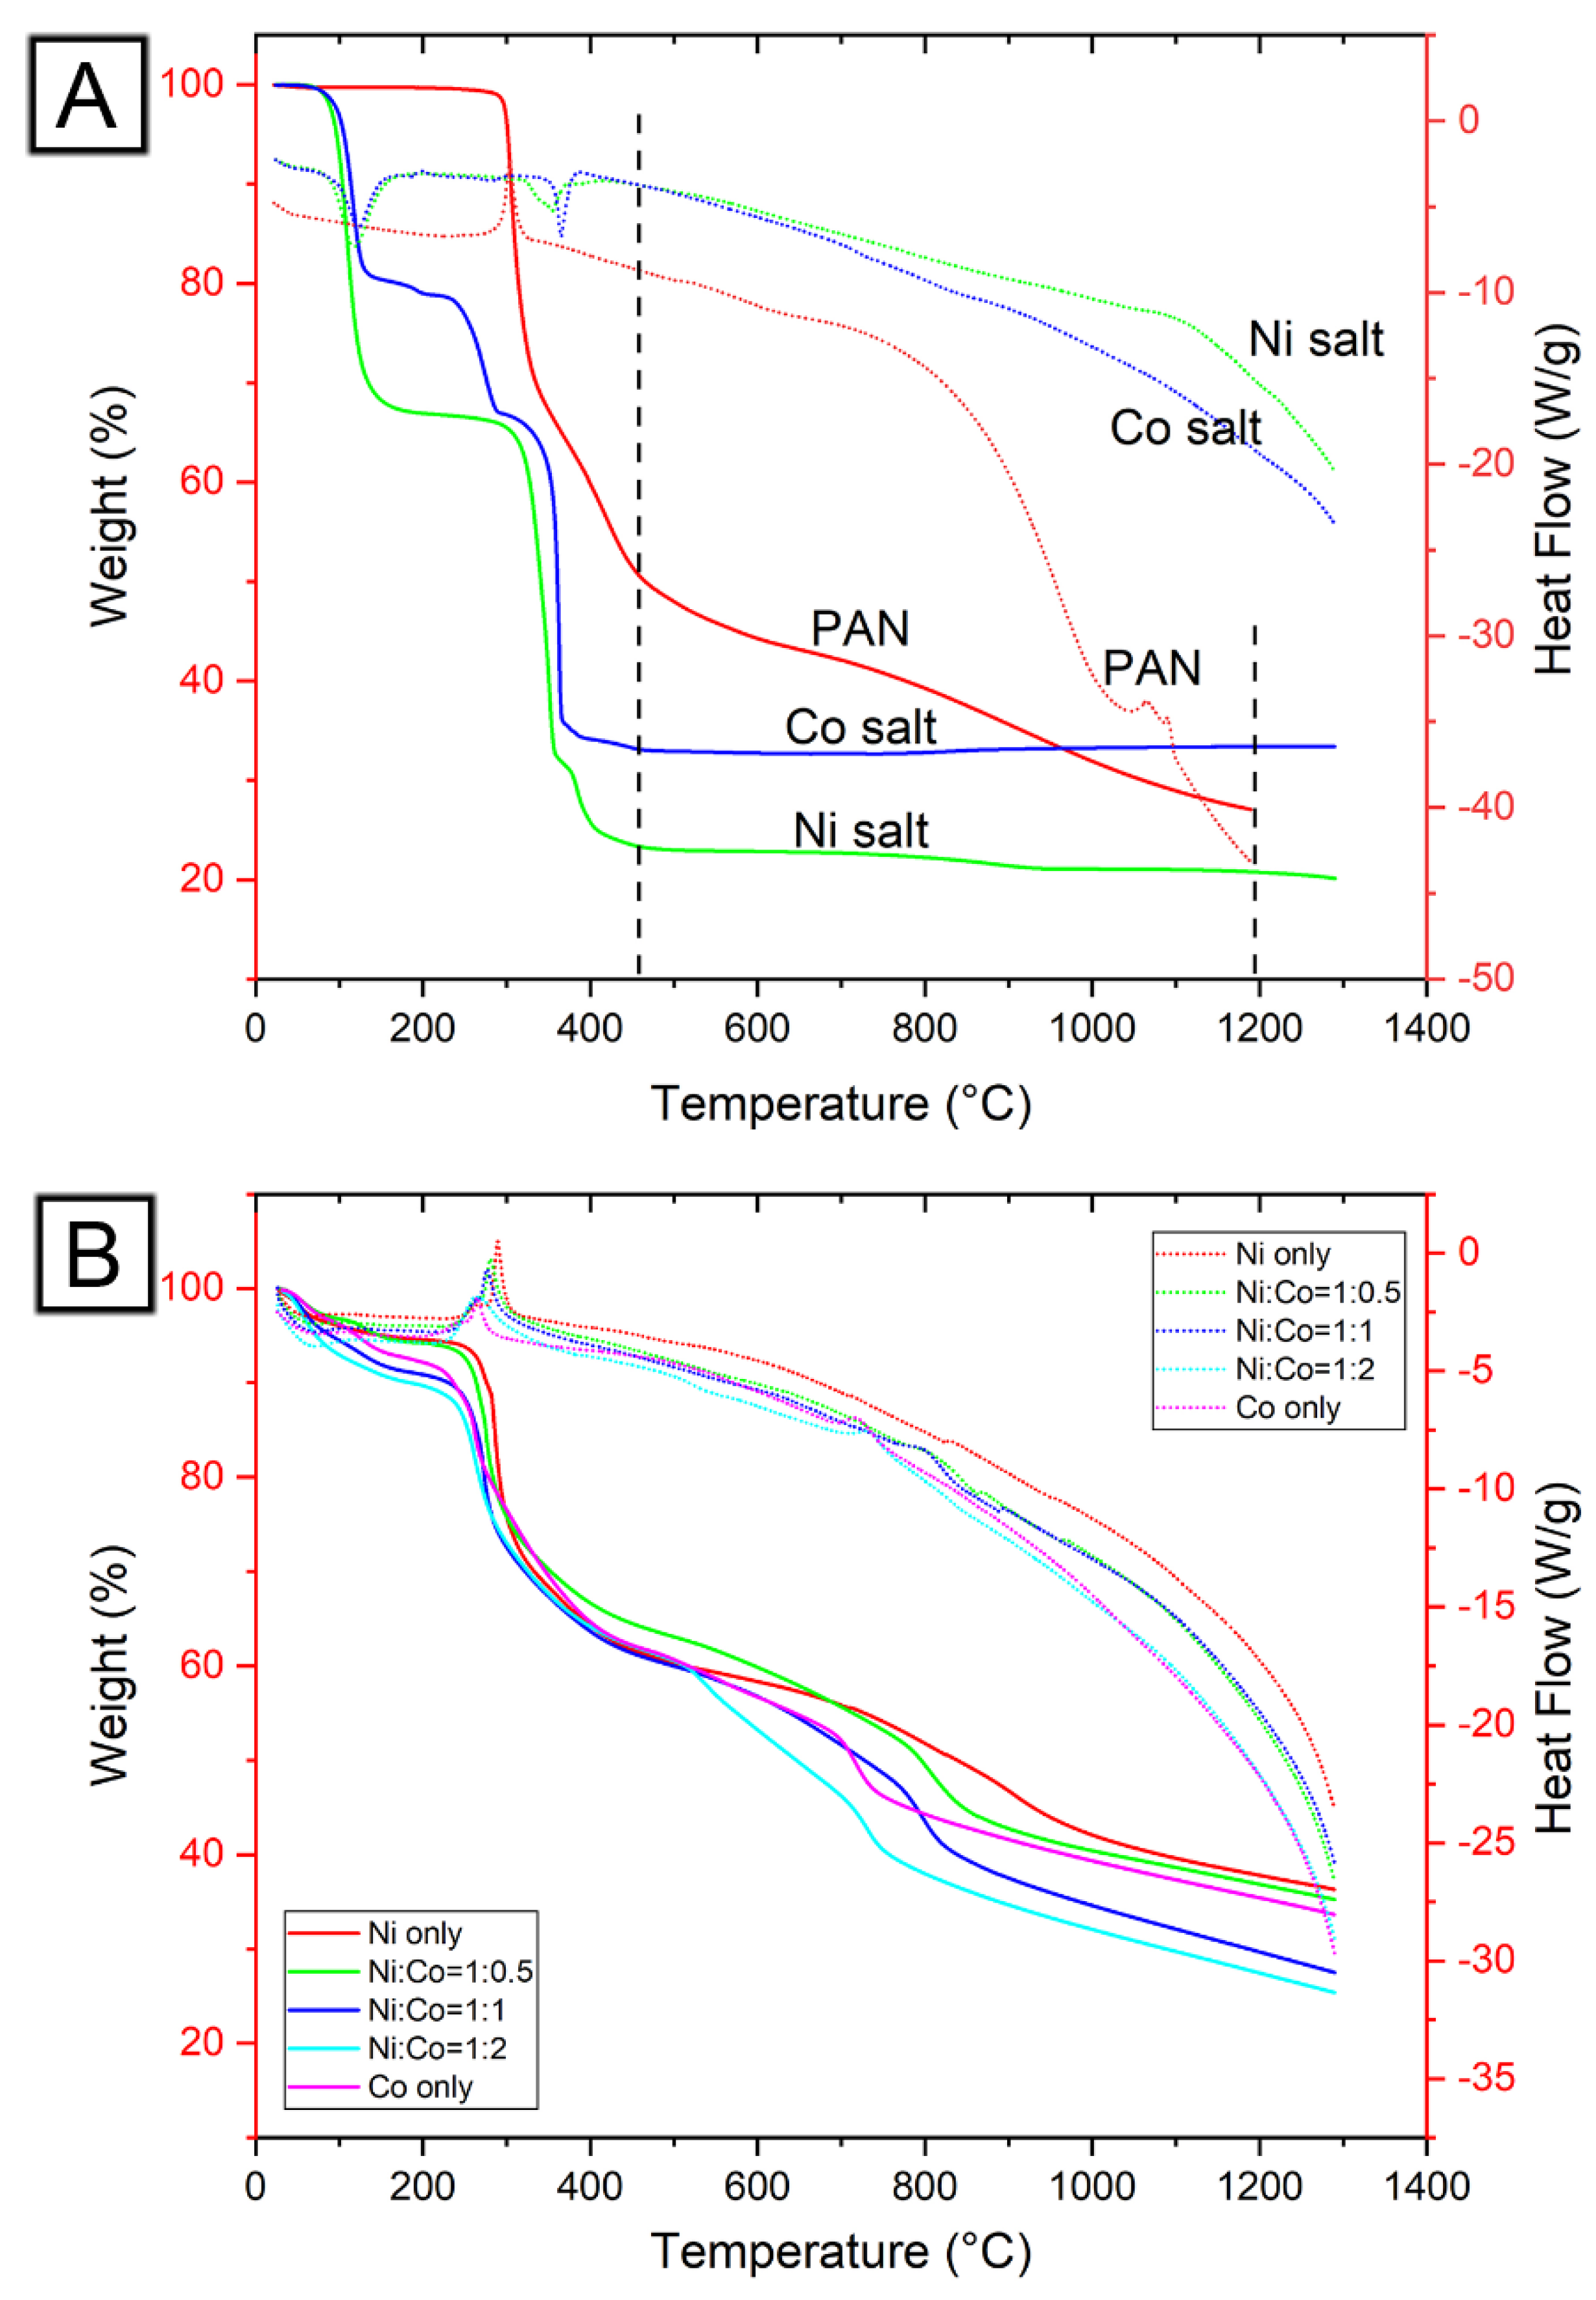
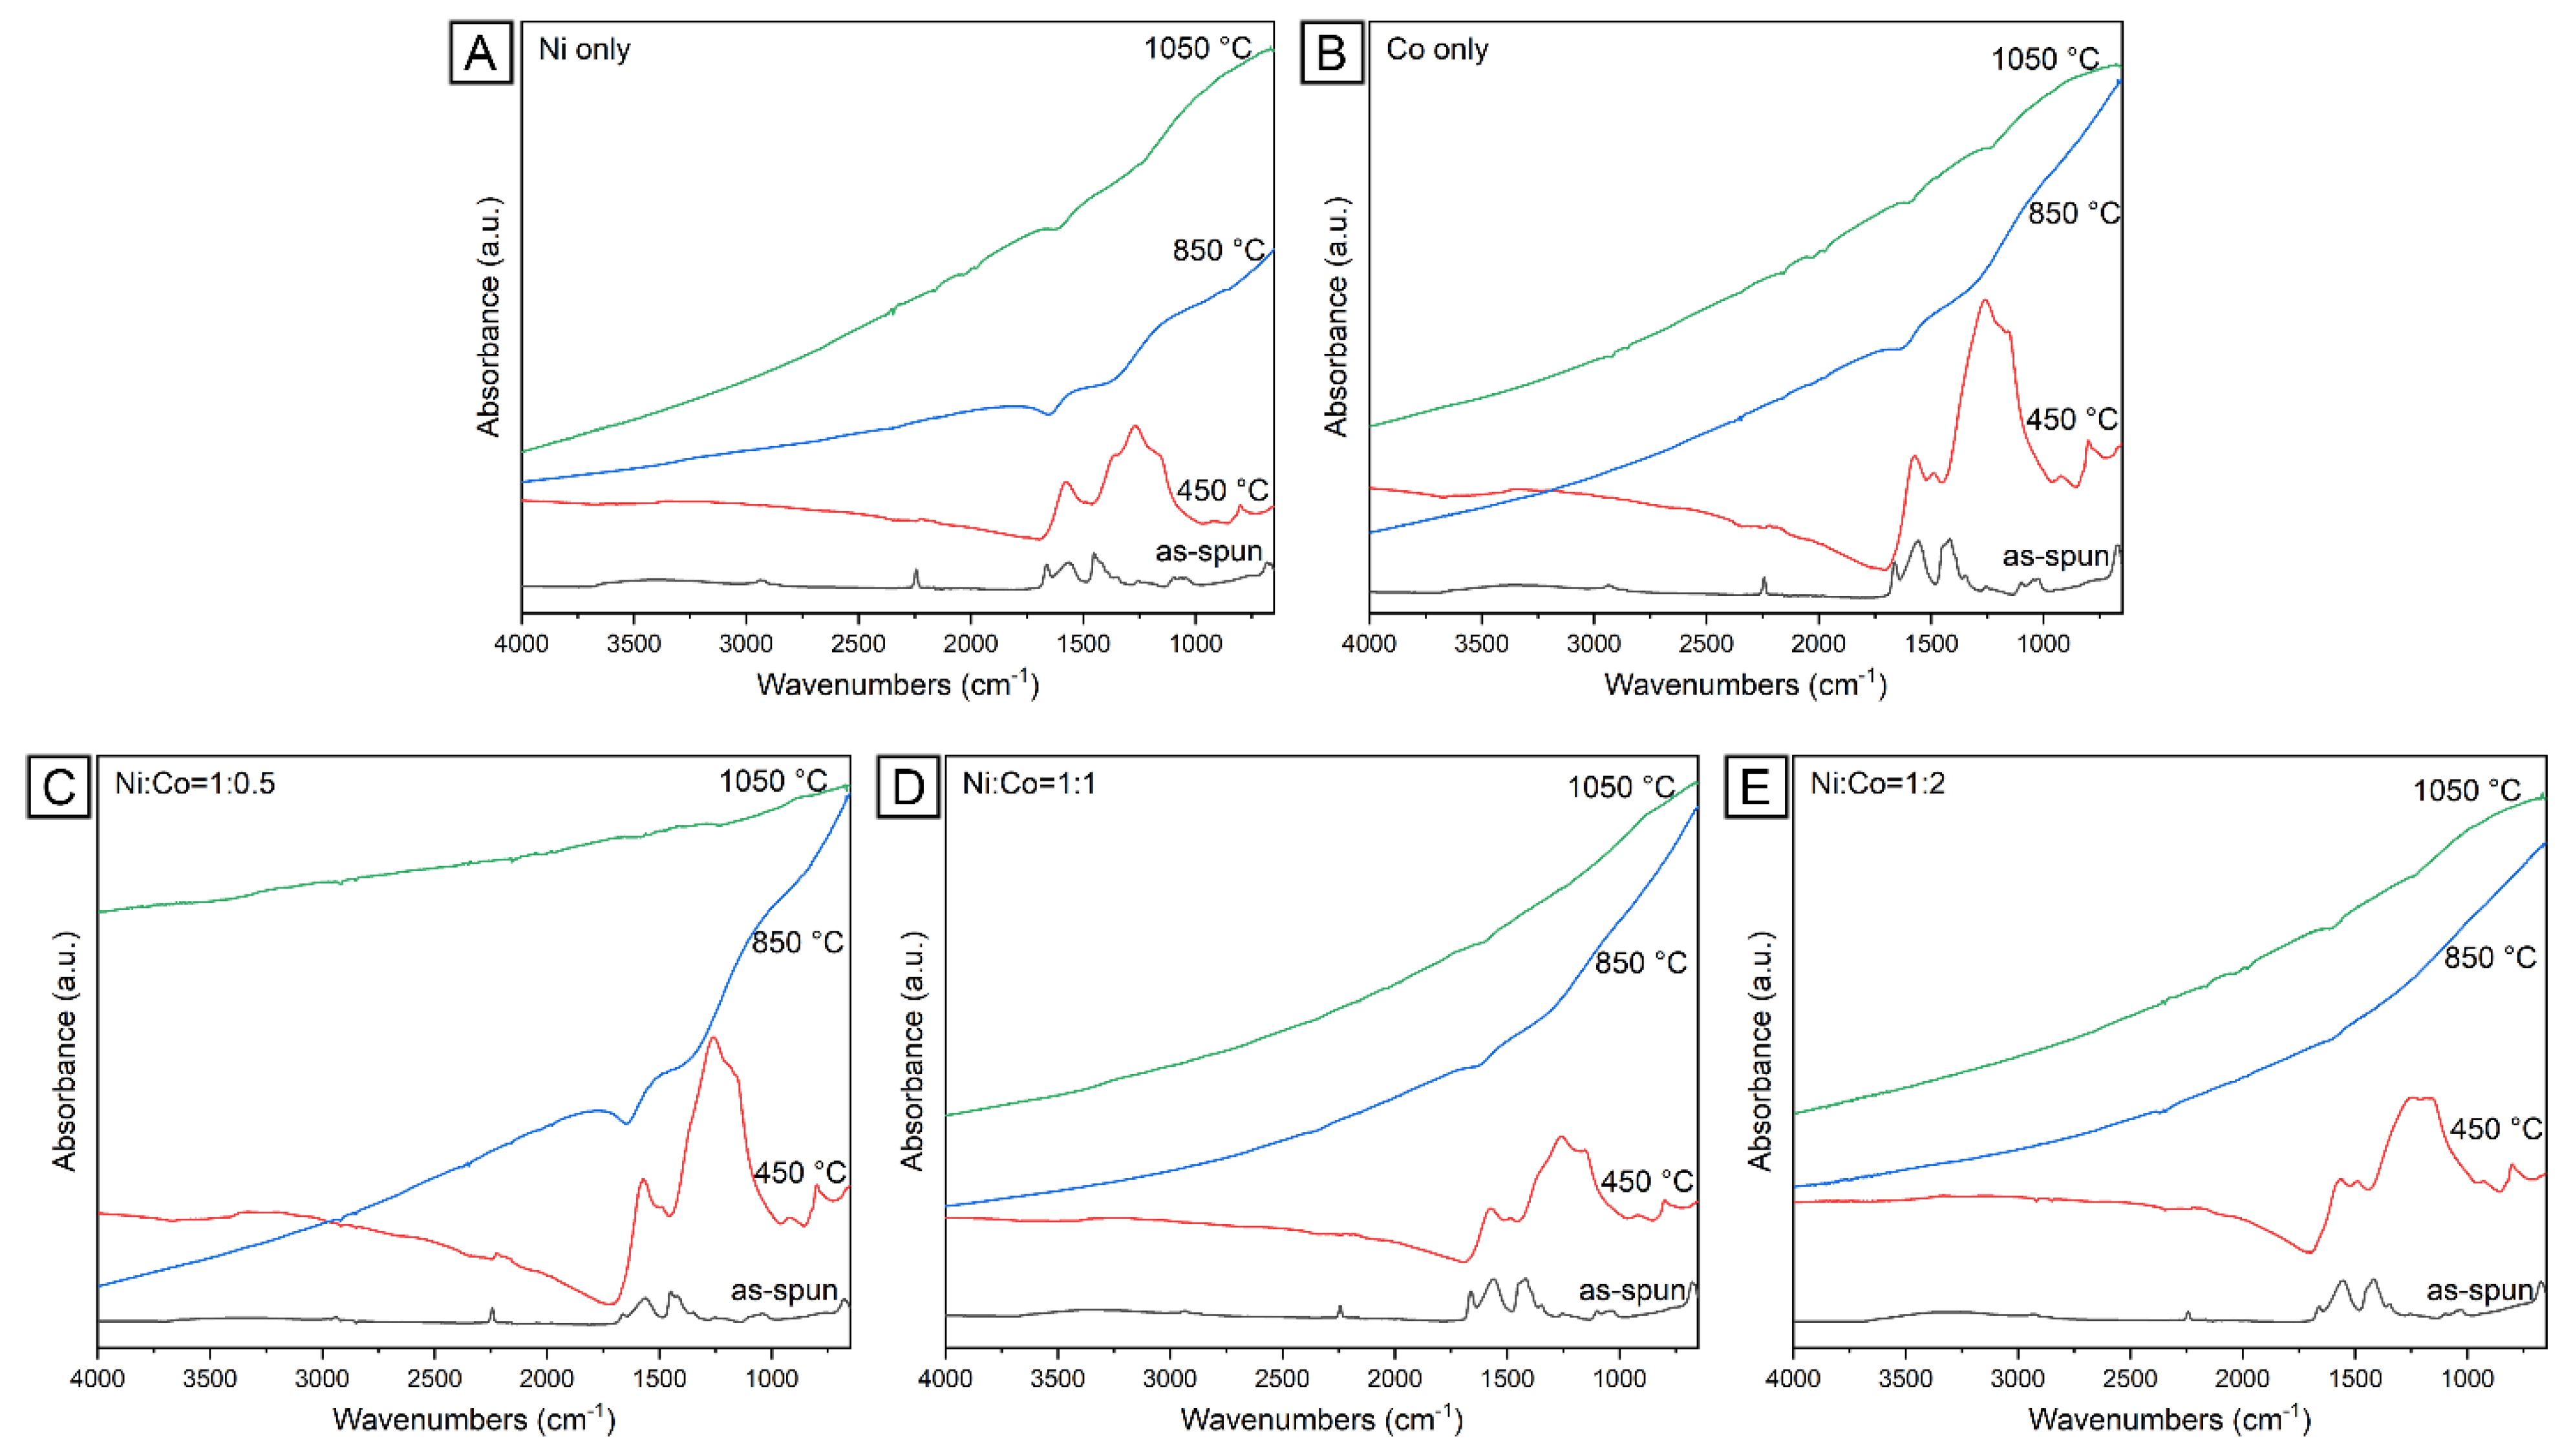
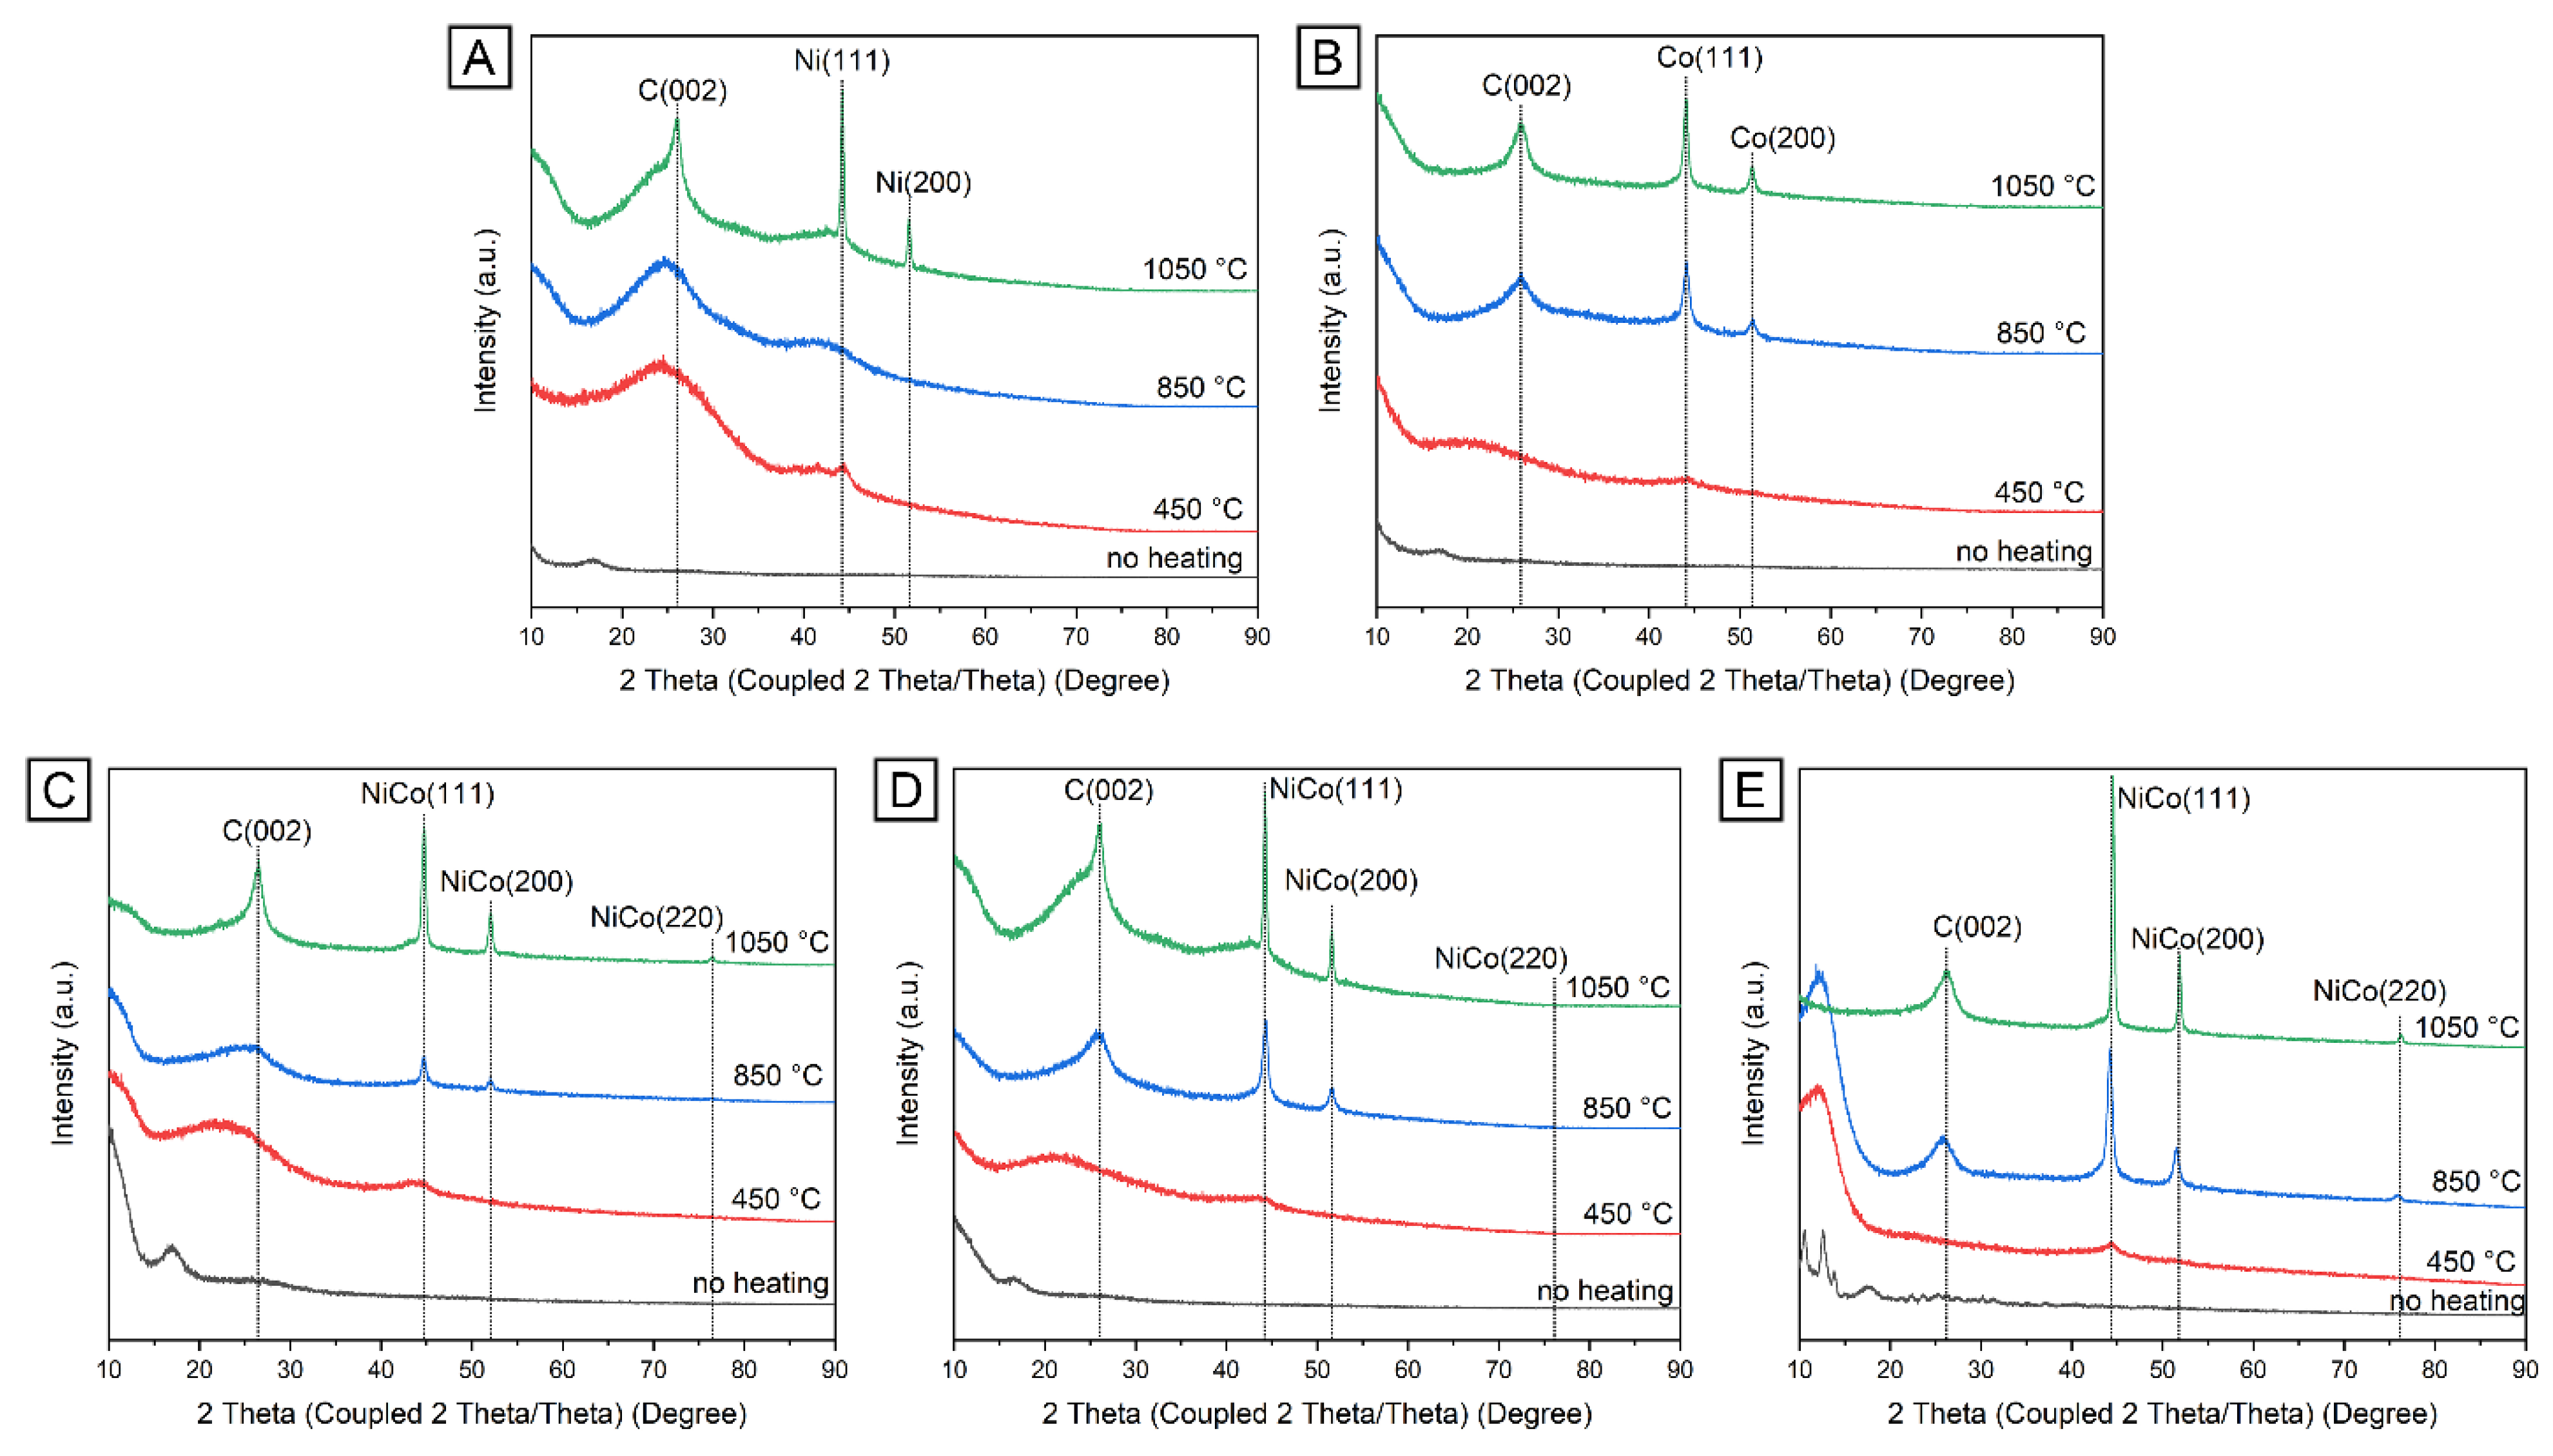
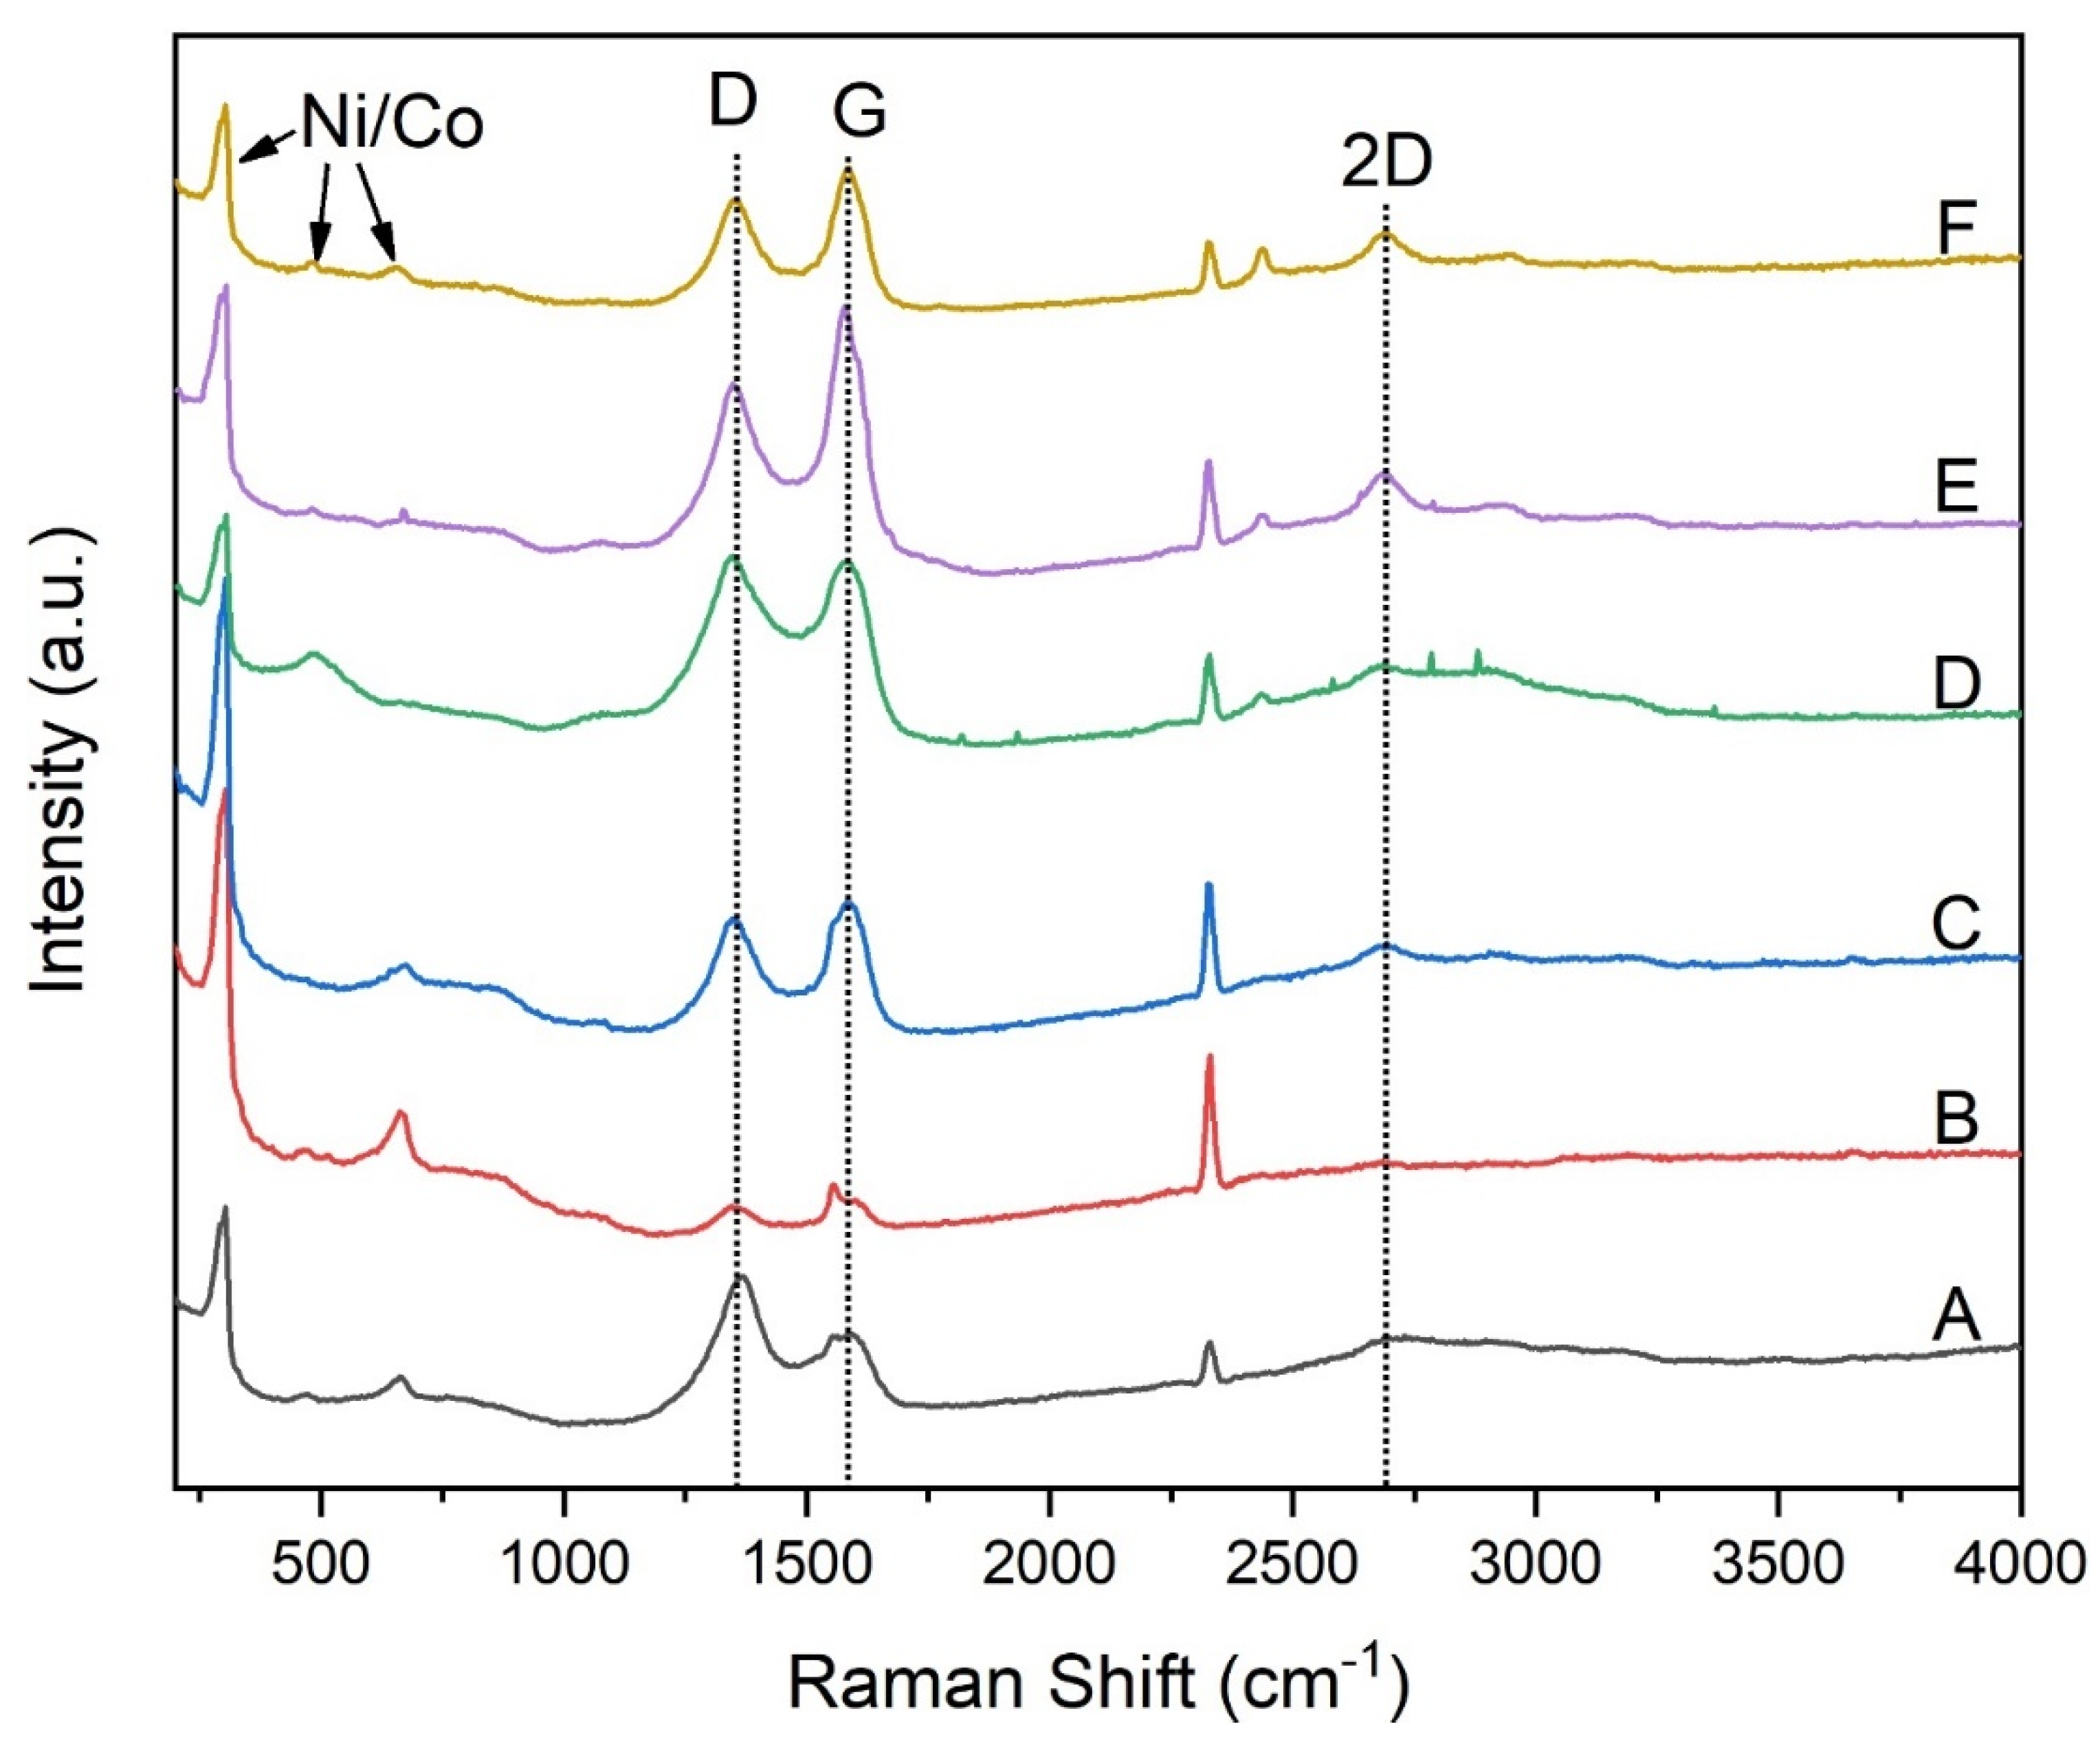
2.2. Chemical Composition and Crystalline Structure of Nanofiber Catalysts
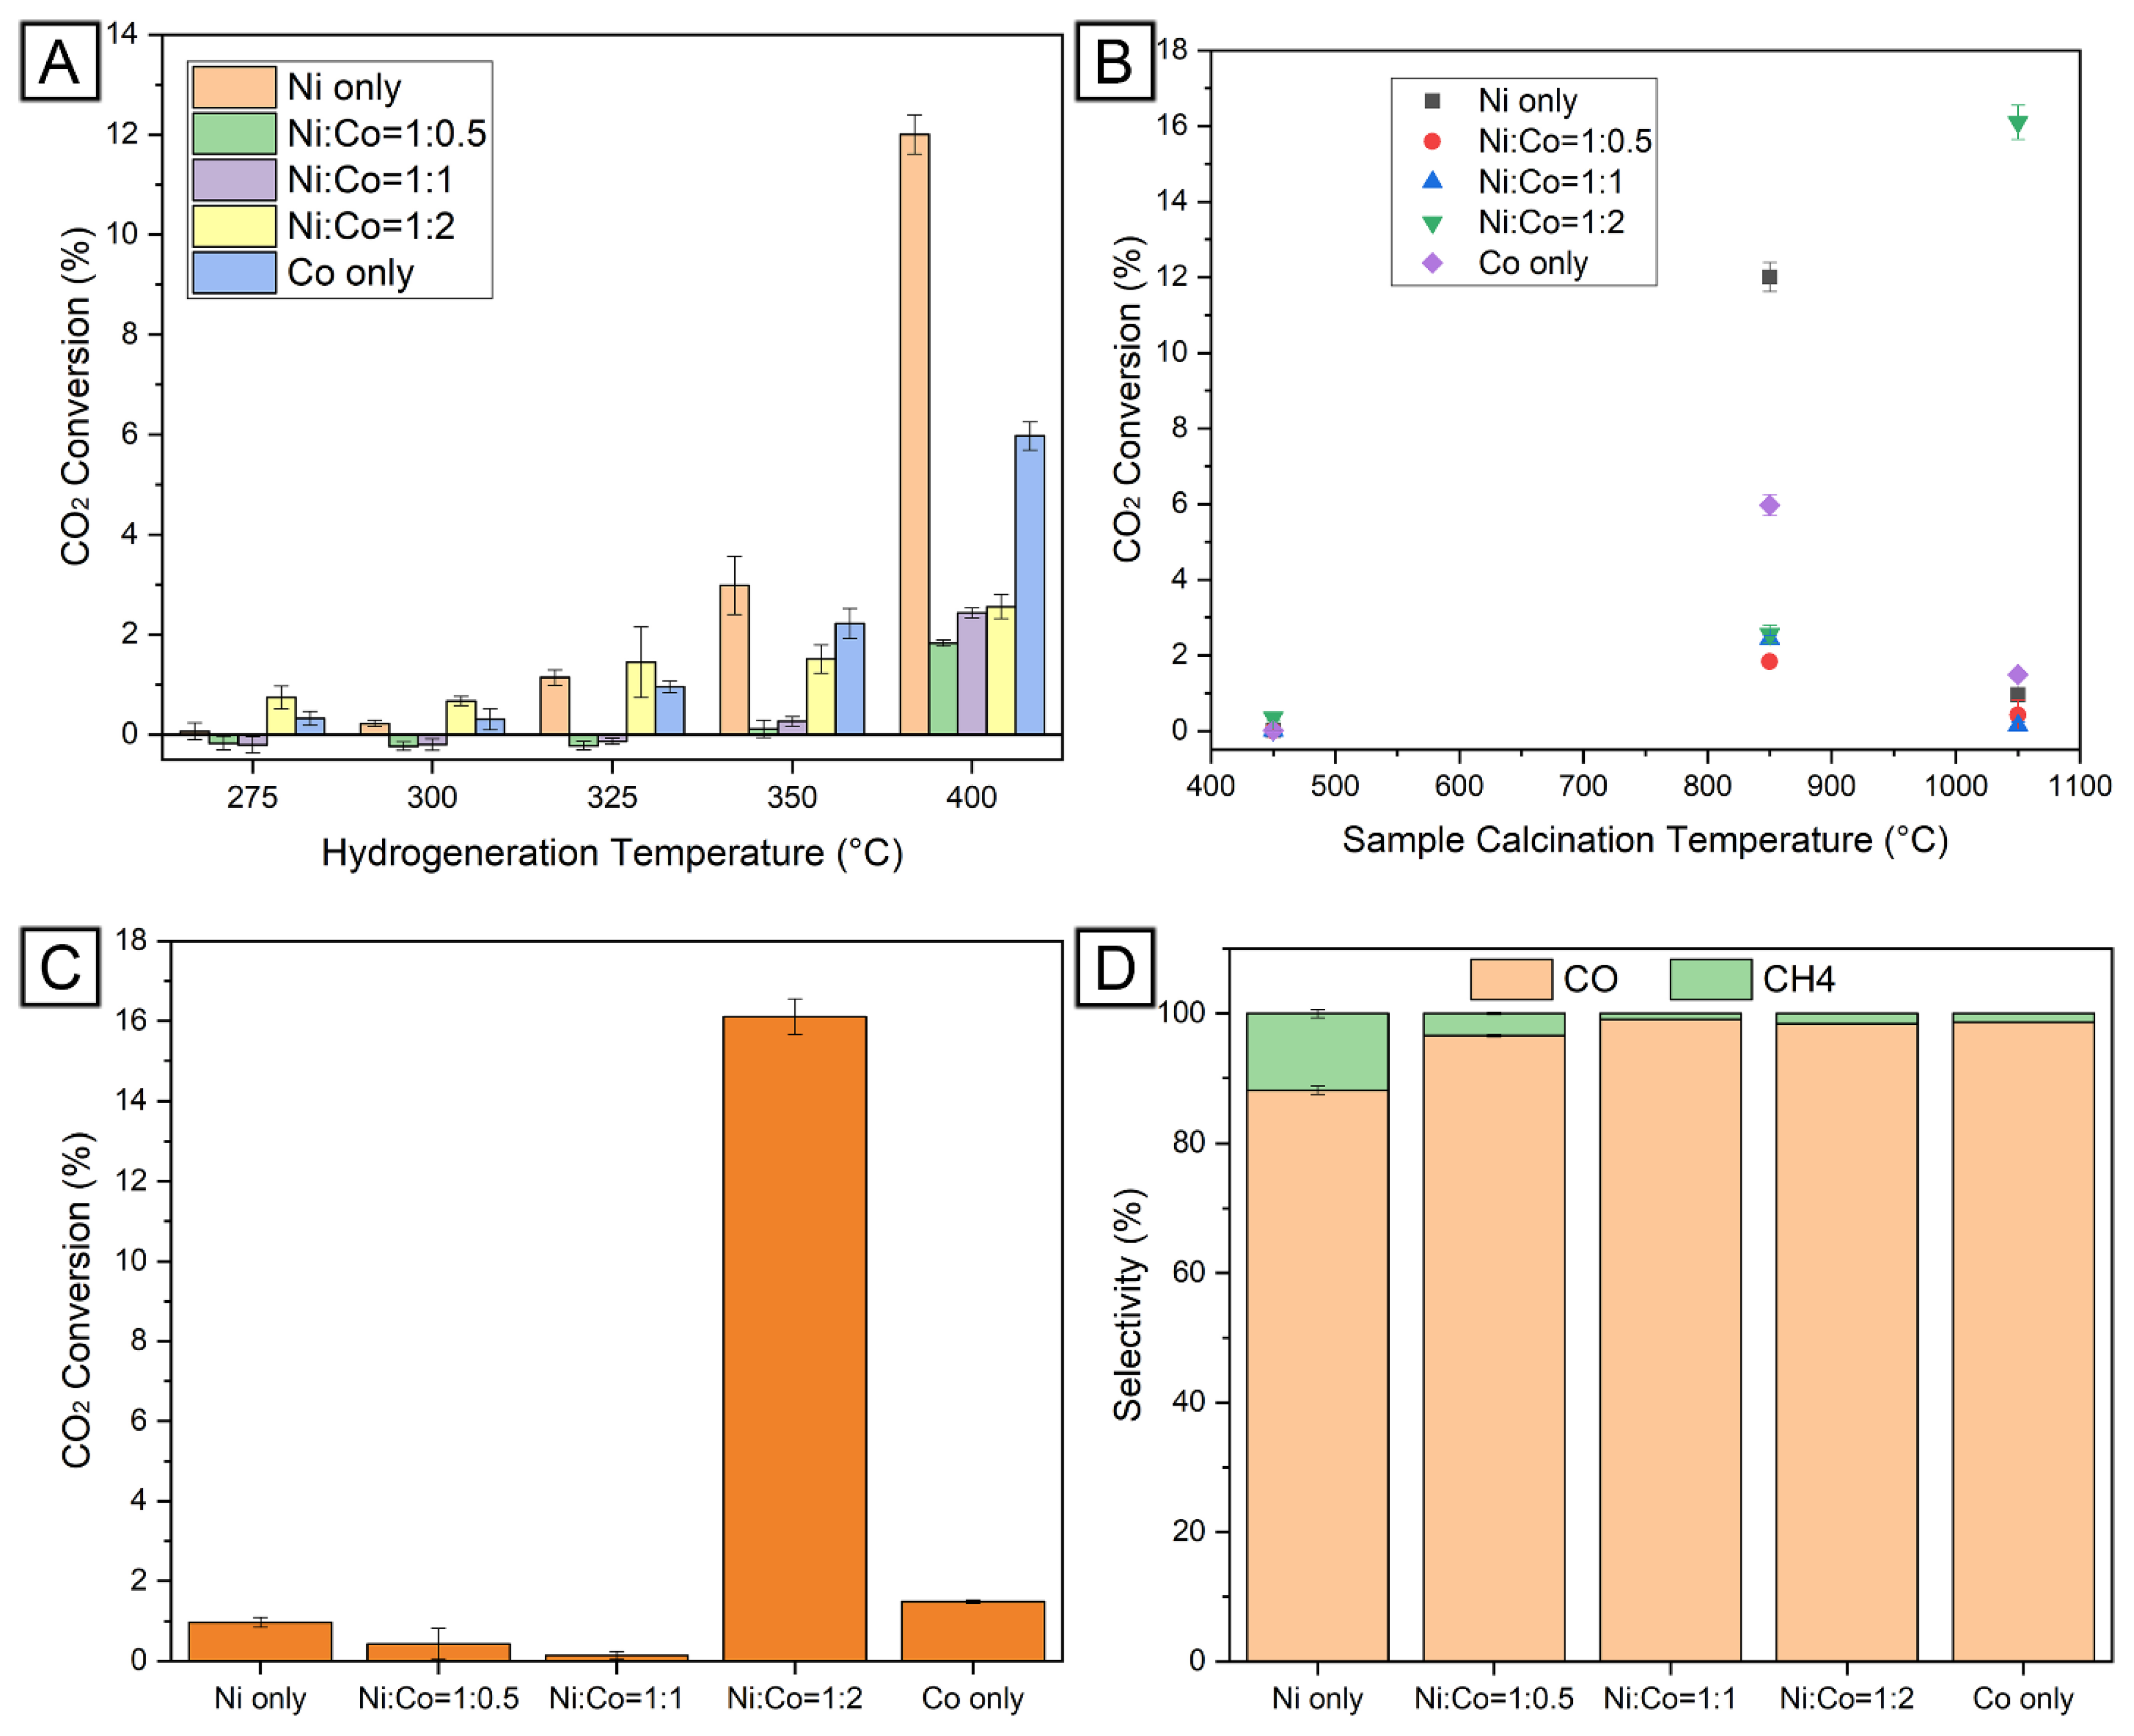
2.3. Catalytic Performance of Mono- and Bimetallic Nanofiber Catalysts for CO2 Hydrogenation
3. Materials and Methods
3.1. Synthesis of Mono- and Bimetallic Ni–Co Nanofiber Catalysts
3.2. Characterization
3.3. Catalyst Evaluation
4. Conclusions
Author Contributions
Funding
Data Availability Statement
Conflicts of Interest
References
- Wang, Y.; Tian, Y.; Pan, S.-Y.; Snyder, S.W. Catalytic Processes to Accelerate Decarbonization in a Net-Zero Carbon World. ChemSusChem 2022, 15, e202201290. [Google Scholar] [CrossRef] [PubMed]
- Vogt, C.; Weckhuysen, B.M. The concept of active site in heterogeneous catalysis. Nat. Rev. Chem. 2022, 6, 89–111. [Google Scholar] [CrossRef] [PubMed]
- Friend, C.M.; Xu, B. Heterogeneous Catalysis: A Central Science for a Sustainable Future. Acc. Chem. Res. 2017, 50, 517–521. [Google Scholar] [CrossRef] [PubMed]
- Ra, E.C.; Kim, K.Y.; Kim, E.H.; Lee, H.; An, K.; Lee, J.S. Recycling Carbon Dioxide through Catalytic Hydrogenation: Recent Key Developments and Perspectives. ACS Catal. 2020, 10, 11318–11345. [Google Scholar] [CrossRef]
- Tawalbeh, M.; Javed, R.M.N.; Al-Othman, A.; Almomani, F. The novel contribution of non-noble metal catalysts for intensified carbon dioxide hydrogenation: Recent challenges and opportunities. Energy Convers. Manag. 2023, 279, 116755. [Google Scholar] [CrossRef]
- Yusuf, N.; Almomani, F.; Qiblawey, H. Catalytic CO2 conversion to C1 value-added products: Review on latest catalytic and process developments. Fuel 2023, 345, 128178. [Google Scholar] [CrossRef]
- Lv, C.; Bai, X.; Ning, S.; Song, C.; Guan, Q.; Liu, B.; Li, Y.; Ye, J. Nanostructured Materials for Photothermal Carbon Dioxide Hydrogenation: Regulating Solar Utilization and Catalytic Performance. ACS Nano 2023, 17, 1725–1738. [Google Scholar] [CrossRef]
- Qu, R.; Junge, K.; Beller, M. Hydrogenation of Carboxylic Acids, Esters, and Related Compounds over Heterogeneous Catalysts: A Step toward Sustainable and Carbon-Neutral Processes. Chem. Rev. 2023, 123, 1103–1165. [Google Scholar] [CrossRef]
- Siegel, R.E.; Pattanayak, S.; Berben, L.A. Reactive Capture of CO2: Opportunities and Challenges. ACS Catal. 2023, 13, 766–784. [Google Scholar] [CrossRef]
- Zhao, H.; Yu, R.; Ma, S.; Xu, K.; Chen, Y.; Jiang, K.; Fang, Y.; Zhu, C.; Liu, X.; Tang, Y.; et al. The role of Cu1–O3 species in single-atom Cu/ZrO2 catalyst for CO2 hydrogenation. Nat. Catal. 2022, 5, 818–831. [Google Scholar] [CrossRef]
- Mao, D.; Zhang, J.; Zhang, H.; Wu, D. A highly efficient Cu-ZnO/SBA-15 catalyst for CO2 hydrogenation to CO under atmospheric pressure. Catal. Today 2022, 402, 60–66. [Google Scholar] [CrossRef]
- Li, C.-F.; Guo, R.-T.; Zhang, Z.-R.; Wu, T.; Pan, W.-G. Converting CO2 into Value-Added Products by Cu2O-Based Catalysts: From Photocatalysis, Electrocatalysis to Photoelectrocatalysis. Small 2023, 19, 2207875. [Google Scholar] [CrossRef] [PubMed]
- Syal, B.; Kumar, P.; Gupta, P. Recent Advancements in the Preparation and Application of Copper Single-Atom Catalysts. ACS Appl. Nano Mater. 2023, 6, 4987–5041. [Google Scholar] [CrossRef]
- Spennati, E.; Riani, P.; Garbarino, G. A perspective of lanthanide promoted Ni-catalysts for CO2 hydrogenation to methane: Catalytic activity and open challenges. Catal. Today 2023, 418, 114131. [Google Scholar] [CrossRef]
- Chen, M.; Li, B.; Wang, F.; Fang, J.; Li, K.; Zhang, C. Enhanced CH4 Selectivity in CO2 Hydrogenation on Bimetallic Pt–Ni Catalysts with Pt Nanoparticles Modified by Isolated Ni Atoms. ACS Appl. Nano Mater. 2023, 6, 5826–5834. [Google Scholar] [CrossRef]
- Rommens, K.T.; Saeys, M. Molecular Views on Fischer–Tropsch Synthesis. Chem. Rev. 2023, 123, 5798–5858. [Google Scholar] [CrossRef]
- Lozano-Reis, P.; Prats, H.; Gamallo, P.; Illas, F.; Sayós, R. Multiscale Study of the Mechanism of Catalytic CO2 Hydrogenation: Role of the Ni(111) Facets. ACS Catal. 2020, 10, 8077–8089. [Google Scholar] [CrossRef]
- Szamosvölgyi, Á.; Rajkumar, T.; Sápi, A.; Szenti, I.; Ábel, M.; Gómez-Pérez, J.F.; Baán, K.; Fogarassy, Z.; Dodony, E.; Pécz, B.; et al. Interfacial Ni active sites strike solid solutional counterpart in CO2 hydrogenation. Environ. Technol. Innov. 2022, 27, 102747. [Google Scholar] [CrossRef]
- Galhardo, T.S.; Braga, A.H.; Arpini, B.H.; Szanyi, J.; Gonçalves, R.V.; Zornio, B.F.; Miranda, C.R.; Rossi, L.M. Optimizing Active Sites for High CO Selectivity during CO2 Hydrogenation over Supported Nickel Catalysts. J. Am. Chem. Soc. 2021, 143, 4268–4280. [Google Scholar] [CrossRef]
- Gandara-Loe, J.; Portillo, E.; Odriozola, J.A.; Reina, T.R.; Pastor-Pérez, L. K-Promoted Ni-Based Catalysts for Gas-Phase CO2 Conversion: Catalysts Design and Process Modelling Validation. Front. Chem. 2021, 9, 785571. [Google Scholar] [CrossRef]
- Li, Z.; He, D.; Yan, X.; Dai, S.; Younan, S.; Ke, Z.; Pan, X.; Xiao, X.; Wu, H.; Gu, J. Size-Dependent Nickel-Based Electrocatalysts for Selective CO2 Reduction. Angew. Chem. Int. Ed. 2020, 59, 18572–18577. [Google Scholar] [CrossRef] [PubMed]
- Liu, L.; Corma, A. Bimetallic Sites for Catalysis: From Binuclear Metal Sites to Bimetallic Nanoclusters and Nanoparticles. Chem. Rev. 2023, 123, 4855–4933. [Google Scholar] [CrossRef] [PubMed]
- Hong, X.; Zhu, H.; Du, D.; Zhang, Q.; Li, Y. Research Progress of Copper-Based Bimetallic Electrocatalytic Reduction of CO2. Catalysts 2023, 13, 376. [Google Scholar] [CrossRef]
- Vysakh, A.B.; Lazar, A.; Yadukiran, V.; Singh, A.P.; Vinod, C.P. Phenylacetylene hydrogenation on Au@Ni bimetallic core–shell nanoparticles synthesized under mild conditions. Catal. Sci. Technol. 2016, 6, 708–712. [Google Scholar] [CrossRef]
- Yao, F.; Liu, S.; Cui, H.; Lv, Y.; Zhang, Y.; Liu, P.; Hao, F.; Xiong, W.; Luo, H.A. Activated Carbon Supported Non-noble Bimetallic Ni-Based Catalysts for Nitrocyclohexane Hydrogenation to Cyclohexanone Oxime under Mild Conditions. ACS Sustain. Chem. Eng. 2021, 9, 3300–3315. [Google Scholar] [CrossRef]
- De, S.; Zhang, J.; Luque, R.; Yan, N. Ni-based bimetallic heterogeneous catalysts for energy and environmental applications. Energ. Environ. Sci. 2016, 9, 3314–3347. [Google Scholar] [CrossRef] [Green Version]
- Posada-Pérez, S.; Solà, M.; Poater, A. Carbon Dioxide Conversion on Supported Metal Nanoparticles: A Brief Review. Catalysts 2023, 13, 305. [Google Scholar] [CrossRef]
- Yamanaka, N.; Shimazu, S. Selective Hydrogenation Properties of Ni-Based Bimetallic Catalysts. Eng 2022, 3, 60–77. [Google Scholar] [CrossRef]
- Reddy, K.P.; Kim, D.; Hong, S.; Kim, K.-J.; Ryoo, R.; Park, J.Y. Tuning CO2 Hydrogenation Selectivity through Reaction-Driven Restructuring on Cu–Ni Bimetal Catalysts. Acs Appl. Mater. Inter. 2023, 15, 9373–9381. [Google Scholar] [CrossRef]
- Lu, P.; Ding, B. Applications of electrospun fibers. Recent Pat. Nanotechnol. 2008, 2, 169–182. [Google Scholar] [CrossRef] [PubMed]
- Lu, P.; Qiao, B.; Lu, N.; Hyun, D.C.; Wang, J.; Kim, M.J.; Liu, J.; Xia, Y. Photochemical Deposition of Highly Dispersed Pt Nanoparticles on Porous CeO2 Nanofibers for the Water-Gas Shift Reaction. Adv. Funct. Mater. 2015, 25, 4153–4162. [Google Scholar] [CrossRef]
- Lu, P.; Campbell, C.T.; Xia, Y. A sinter-resistant catalytic system fabricated by maneuvering the selectivity of SiO2 deposition onto the TiO2 surface versus the Pt nanoparticle surface. Nano Lett. 2013, 13, 4957–4962. [Google Scholar] [CrossRef] [PubMed]
- Yoon, K.; Yang, Y.; Lu, P.; Wan, D.; Peng, H.-C.; Stamm Masias, K.; Fanson, P.T.; Campbell, C.T.; Xia, Y. A Highly Reactive and Sinter-Resistant Catalytic System Based on Platinum Nanoparticles Embedded in the Inner Surfaces of CeO2 Hollow Fibers. Angew. Chem. Int. Ed. 2012, 51, 9543–9546. [Google Scholar] [CrossRef] [PubMed]
- Dai, Y.; Lu, P.; Cao, Z.; Campbell, C.T.; Xia, Y. The physical chemistry and materials science behind sinter-resistant catalysts. Chem. Soc. Rev. 2018, 47, 4314–4331. [Google Scholar] [CrossRef] [PubMed]
- Murray, S.; Wei, W.; Hart, R.; Fan, J.; Chen, W.; Lu, P. Solar Degradation of Toxic Colorants in Polluted Water by Thermally Tuned Ceria Nanocrystal-Based Nanofibers. ACS Appl. Nano Mater. 2020, 3, 11194–11202. [Google Scholar] [CrossRef]
- Lu, P.; Xia, Y. Novel nanostructures of rutile fabricated by templating against yarns of polystyrene nanofibrils and their catalytic applications. Acs Appl. Mater. Inter. 2013, 5, 6391–6399. [Google Scholar] [CrossRef] [Green Version]
- Bethune, D.S.; Kiang, C.H.; de Vries, M.S.; Gorman, G.; Savoy, R.; Vazquez, J.; Beyers, R. Cobalt-catalysed growth of carbon nanotubes with single-atomic-layer walls. Nature 1993, 363, 605–607. [Google Scholar] [CrossRef]
- Xue, T.J.; McKinney, M.A.; Wilkie, C.A. The thermal degradation of polyacrylonitrile. Polym. Degrad. Stab. 1997, 58, 193–202. [Google Scholar] [CrossRef]
- Jadhav, S.A.; Dhavale, S.B.; Patil, A.H.; Patil, P.S. Brief overview of electrospun polyacrylonitrile carbon nanofibers: Preparation process with applications and recent trends. Mater. Des. Process. Commun. 2019, 1, e83. [Google Scholar] [CrossRef] [Green Version]
- De Jesus, J.C.; González, I.; Quevedo, A.; Puerta, T. Thermal decomposition of nickel acetate tetrahydrate: An integrated study by TGA, QMS and XPS techniques. J. Mol. Catal. A Chem. 2005, 228, 283–291. [Google Scholar] [CrossRef]
- Grimes, R.W.; Fitch, A.N. Thermal decomposition of cobalt(II) acetate tetrahydrate studied with time-resolved neutron diffraction and thermogravimetric analysis. J. Mater. Chem. 1991, 1, 461. [Google Scholar] [CrossRef]
- Gutiérrez-Martín, D.; Varela, A.; González-Calbet, J.M.; Matesanz, E.; Parras, M. Revisiting the Decomposition Process of Tetrahydrate Co(II) Acetate: A Sample’s Journey through Temperature. Appl. Sci. 2022, 12, 6786. [Google Scholar] [CrossRef]
- Ruhland, K.; Frenzel, R.; Horny, R.; Nizamutdinova, A.; van Wüllen, L.; Moosburger-Will, J.; Horn, S. Investigation of the chemical changes during thermal treatment of polyacrylonitrile and 15N-labelled polyacrylonitrile by means of in-situ FTIR and 15N NMR spectroscopy. Polym. Degrad. Stab. 2017, 146, 298–316. [Google Scholar] [CrossRef]
- Andrade-Sanchez, M.E.; Hernandez-Perez, M.A.; García-Pacheco, G.; Ortega-Avilés, M. Temperature and pH effect on reaction mechanism and particle size of nanostructured Co3O4 thin films obtained by sol-gel/dip-coating. Mater. Res. Express 2021, 8, 025015. [Google Scholar] [CrossRef]
- Setnescu, R.; Jipa, S.; Setnescu, T.; Kappel, W.; Kobayashi, S.; Osawa, Z. IR and X-ray characterization of the ferromagnetic phase of pyrolysed polyacrylonitrile. Carbon 1999, 37, 1–6. [Google Scholar] [CrossRef]
- Sellitti, C.; Koenig, J.L.; Ishida, H. Surface characterization of graphitized carbon fibers by attenuated total reflection fourier transform infrared spectroscopy. Carbon 1990, 28, 221–228. [Google Scholar] [CrossRef]
- Lu, P.; Huang, Q.; Mukherjee, A.; Hsieh, Y.-L. SiCO-doped Carbon Fibers with Unique Dual Superhydrophilicity/Superoleophilicity and Ductile and Capacitance Properties. Acs Appl. Mater. Inter. 2010, 2, 3738–3744. [Google Scholar] [CrossRef]
- Weber, D.; Rui, N.; Zhang, F.; Zhang, H.; Vovchok, D.; Wildy, M.; Arizapana, K.; Saporita, A.; Zhang, J.Z.; Senanayake, S.D.; et al. Carbon Nanosphere-Encapsulated Fe Core–Shell Structures for Catalytic CO2 Hydrogenation. ACS Appl. Nano Mater. 2022, 5, 11605–11616. [Google Scholar] [CrossRef]
- Li, J.; Li, P.; Li, J.; Tian, Z.; Yu, F. Highly-Dispersed Ni-NiO Nanoparticles Anchored on an SiO2 Support for an Enhanced CO Methanation Performance. Catalysts 2019, 9, 506. [Google Scholar] [CrossRef] [Green Version]
- Garces, L.J.; Hincapie, B.; Zerger, R.; Suib, S.L. The Effect of Temperature and Support on the Reduction of Cobalt Oxide: An in Situ X-ray Diffraction Study. J. Phys. Chem. C 2015, 119, 5484–5490. [Google Scholar] [CrossRef]
- Saha, B.; Schatz, G.C. Carbonization in Polyacrylonitrile (PAN) Based Carbon Fibers Studied by ReaxFF Molecular Dynamics Simulations. J. Phys. Chem. B 2012, 116, 4684–4692. [Google Scholar] [CrossRef]
- Brubaker, Z.E.; Miskowiec, A.; Niedziela, J.L. Raman spectroscopy of thermally perturbed carbon fibers: Discriminating spectral responses of modulus classes and defect types. Phys. Rev. Mater. 2022, 6, 073603. [Google Scholar] [CrossRef]
- Li, Z.; Deng, L.; Kinloch, I.A.; Young, R.J. Raman spectroscopy of carbon materials and their composites: Graphene, nanotubes and fibres. Prog. Mater. Sci. 2023, 135, 101089. [Google Scholar] [CrossRef]
- Bokobza, L.; Bruneel, J.-L.; Couzi, M. Raman Spectra of Carbon-Based Materials (from Graphite to Carbon Black) and of Some Silicone Composites. C 2015, 1, 77–94. [Google Scholar] [CrossRef] [Green Version]
- Papas, B.N.; Schaefer, H.F., III. Homonuclear transition-metal trimers. J. Chem. Phys. 2005, 123, 074321. [Google Scholar] [CrossRef] [PubMed]
- Clérac, R.; Cotton, F.A.; Dunbar, K.R.; Lu, T.; Murillo, C.A.; Wang, X. New Linear Tricobalt Complex of Di(2-pyridyl)amide (dpa), [Co3(dpa)4(CH3CN)2][PF6]2. Inorg. Chem. 2000, 39, 3065–3070. [Google Scholar] [CrossRef]
- Yoon, H.; Xu, A.; Sterbinsky, G.E.; Arena, D.A.; Wang, Z.; Stephens, P.W.; Meng, Y.S.; Carroll, K.J. In situ non-aqueous nucleation and growth of next generation rare-earth-free permanent magnets. Phys. Chem. Chem. Phys. 2015, 17, 1070–1076. [Google Scholar] [CrossRef]
- Lei, T.; Mao, J.; Liu, X.; Pathak, A.D.; Shetty, S.; van Bavel, A.P.; Xie, L.; Gao, R.; Ren, P.; Luo, D.; et al. Carbon Deposition and Permeation on Nickel Surfaces in Operando Conditions: A Theoretical Study. J. Phys. Chem. C 2021, 125, 7166–7177. [Google Scholar] [CrossRef]


Disclaimer/Publisher’s Note: The statements, opinions and data contained in all publications are solely those of the individual author(s) and contributor(s) and not of MDPI and/or the editor(s). MDPI and/or the editor(s) disclaim responsibility for any injury to people or property resulting from any ideas, methods, instructions or products referred to in the content. |
© 2023 by the authors. Licensee MDPI, Basel, Switzerland. This article is an open access article distributed under the terms and conditions of the Creative Commons Attribution (CC BY) license (https://creativecommons.org/licenses/by/4.0/).
Share and Cite
Schossig, J.; Gandotra, A.; Arizapana, K.; Weber, D.; Wildy, M.; Wei, W.; Xu, K.; Yu, L.; Chimenti, R.; Mantawy, I.; et al. CO2 to Value-Added Chemicals: Synthesis and Performance of Mono- and Bimetallic Nickel–Cobalt Nanofiber Catalysts. Catalysts 2023, 13, 1017. https://doi.org/10.3390/catal13061017
Schossig J, Gandotra A, Arizapana K, Weber D, Wildy M, Wei W, Xu K, Yu L, Chimenti R, Mantawy I, et al. CO2 to Value-Added Chemicals: Synthesis and Performance of Mono- and Bimetallic Nickel–Cobalt Nanofiber Catalysts. Catalysts. 2023; 13(6):1017. https://doi.org/10.3390/catal13061017
Chicago/Turabian StyleSchossig, John, Akash Gandotra, Kevin Arizapana, Daniel Weber, Michael Wildy, Wanying Wei, Kai Xu, Lei Yu, Robert Chimenti, Islam Mantawy, and et al. 2023. "CO2 to Value-Added Chemicals: Synthesis and Performance of Mono- and Bimetallic Nickel–Cobalt Nanofiber Catalysts" Catalysts 13, no. 6: 1017. https://doi.org/10.3390/catal13061017