
Durability of Commercial Catalysts within Relevant Stress Testing Protocols
by
 , , and
Elizaveta Moguchikh
1,
Kirill Paperzh
1,
Ilya Pankov
2,
Sergey Belenov
1,* and
Anastasia Alekseenko
1 1
Faculty of Chemistry, Southern Federal University, 7 Zorge St., 344090 Rostov-on-Don, Russia
2
Research Institute of Physical Organic Chemistry, Southern Federal University, 194/2 Stachki St., 344090 Rostov-on-Don, Russia
*
Author to whom correspondence should be addressed.
Catalysts 2023, 13(6), 923; https://doi.org/10.3390/catal13060923
Submission received: 1 May 2023
/
Revised: 20 May 2023
/
Accepted: 21 May 2023
/
Published: 23 May 2023
(This article belongs to the Special Issue Research Advances in Electrocatalysts for Fuel Cells)
Abstract
:In this study, we analyzed the durability of the commercial Pt/C catalysts with platinum loading of 20% and 40% using two different accelerated durability tests, i.e., using Ar or O2 when bubbling the electrolyte during testing. The structural analysis of the changes in the morphology of the catalysts was performed by XRD and TEM as well as the assessment of the degradation degree of the catalysts using the values of the specific surface area and ORR activity, both, before and after the stress testing. Regardless of the stress testing conditions, the JM20 material was established to degrade ESA and the catalytic activity to a greater extent than JM40, which may be due to the structural and morphological features of the catalysts and their evolution during the stress testing under various conditions. The JM20 material has been reported to exhibit a greater degree of degradation when bubbling the electrolyte with oxygen during the stress testing compared to argon, which may be explained by a different mechanism of degradation for the catalyst with the predominant oxidation of the carbon support, leading to a different nature of the distribution of the platinum nanoparticles over the surface of the carbon support, according to results that have estimated the number of nanoparticle intersections.
1. Introduction
Proton-exchange membrane fuel cells (PEMFCs) are promising renewable energy sources that reduce the carbon footprint, thereby allowing the transition to zero-emission energy sources [1]. The key component of PEMFCs is the membrane-electrode assembly (MEA), which consists of a proton-exchange polymer membrane and porous electrode layers and is where the cell reactions proceed, i.e., the oxidation of fuel (hydrogen, methanol, etc.) at the anode followed by the transfer of electrons along the external circuit and protons through the membrane to the cathode, with oxygen being reduced at the latter [2]. Due to the low rates of fuel oxidation and reduction reactions, platinum-based electrocatalysts are used to accelerate the rate of the electrode reactions. These catalysts are nanoparticles (NPs) of platinum or its alloys with a series of d metals distributed over the surface of the carbon-supporting microparticles [3,4,5].
During the MEA operation, the electrocatalysts are subject to changes in their structural and morphological characteristics, which in turn results in a decrease in their functional parameters, including the electrochemically active surface area (ESA) and the activity in the oxygen electroreduction reaction (ORR) [6].
The degradation of the catalyst is known to be associated with various processes, including Ostwald ripening of NPs [7,8], the dissolution of platinum [9], the agglomeration of NPs [8,10], changes in the NPs’ shape [11], and the oxidation of the carbon support, which cause the detachment of the platinum NPs and the loss of their contact with the support [8]. The durability of the catalysts is determined by the change in the ESA and ORR activity values before and after the stress testing [12]. The material is considered more stable since less of its electrochemical characteristics decrease after the stress testing.
Accelerated durability testing (ADT) is used to better understand the processes of the catalysts’ degradation under laboratory conditions. Recent scientific publications have presented a large number of various protocols that differ in the range of potentials [13,14], the number of cycles [12,13,14,15,16], the application of the start/stop mode [15,17], and the use of multiple potential sweeps. It is also noteworthy that researchers have proposed novel ADT protocols, which may be characterized by higher reproducibility of results, shorter periods of testing times, and similar testing conditions compared to the durability testing in the MEA, etc.
The ADT protocol proposed by Nagai et al. in [18], which corresponds to the start/stop mode of the PEMFC’s operation is thought to be of great interest in terms of its prospects. This ADT protocol is based on the overlap of multiple pulses in the potential window of 0.4–1.0 V in an oxygen-saturated electrolyte, while most other ADTs suggest using an argon-saturated one [17,19,20,21].
Therefore, a systematic study concerned with the testing of different ADT techniques under various conditions is deemed necessary; hence, the comparison of the efficacies of these techniques is required for further recommendations on the directed selection of a method to assess the durability of the catalyst. It is evident that the methodological work on the comparison of various ADT techniques is advantageously carried out using widespread commercial materials.
In terms of the MEAs’ production, there are electrocatalysts from various companies on the world market, including, inter alia, Johnson Matthey (Teesdale, UK) [22], TANAKA (Tokyo, Japan) [23], Umicor (Brussels, Belgium) [24], Pajarito Powder (Albuquerque, NM, USA) [25], BASF (Hannover, Germany) [26], Heraeus (Hanau, Germany) [27], Premetek (Cherry Hill, NJ, USA) [28], and Prometey (Rostov-on-Don, Russia) [29].
A series of scientific publications also mention the following commercial catalysts as reference samples: Johnson Matthey (Teesdale, UK) [22], TANAKA (Tokyo, Japan) [23], Umicor (Brussels, Belgium) [24], Pajarito Powder (Albuquerque, NM, USA) [25], Premetek (Cherry Hill, NJ, USA) [28], and Prometey (Rostov-on-Don, Russia) [29]. It should be noted that researchers mostly study the HiSPEC3000 and Hispec4000 samples produced by Johnson Matthey (Teesdale, UK) with platinum loading of 20% and 40%, respectively. Studying the influence of the conditions of a new stress testing protocol on the degradation of the electrocatalysts, the HiSPEC3000 and HiSPEC4000 samples are seen as the most interesting. The data obtained are thought to allow researchers to compare the available behavioral results of these catalysts within various stress testing protocols. Studying the effect of the platinum loading on the durability of the catalysts within a new stress testing protocol is also an urgent task.
2. Results
2.1. Activity and Durability of Commercial Pt/C Materials in Various ADT Modes
For a systematic study of the mechanisms of the catalysts’ degradation during the ADT, commonly used commercial materials JM20 and JM40 with the mass fraction of platinum of 20% and 40%, respectively, have been selected.
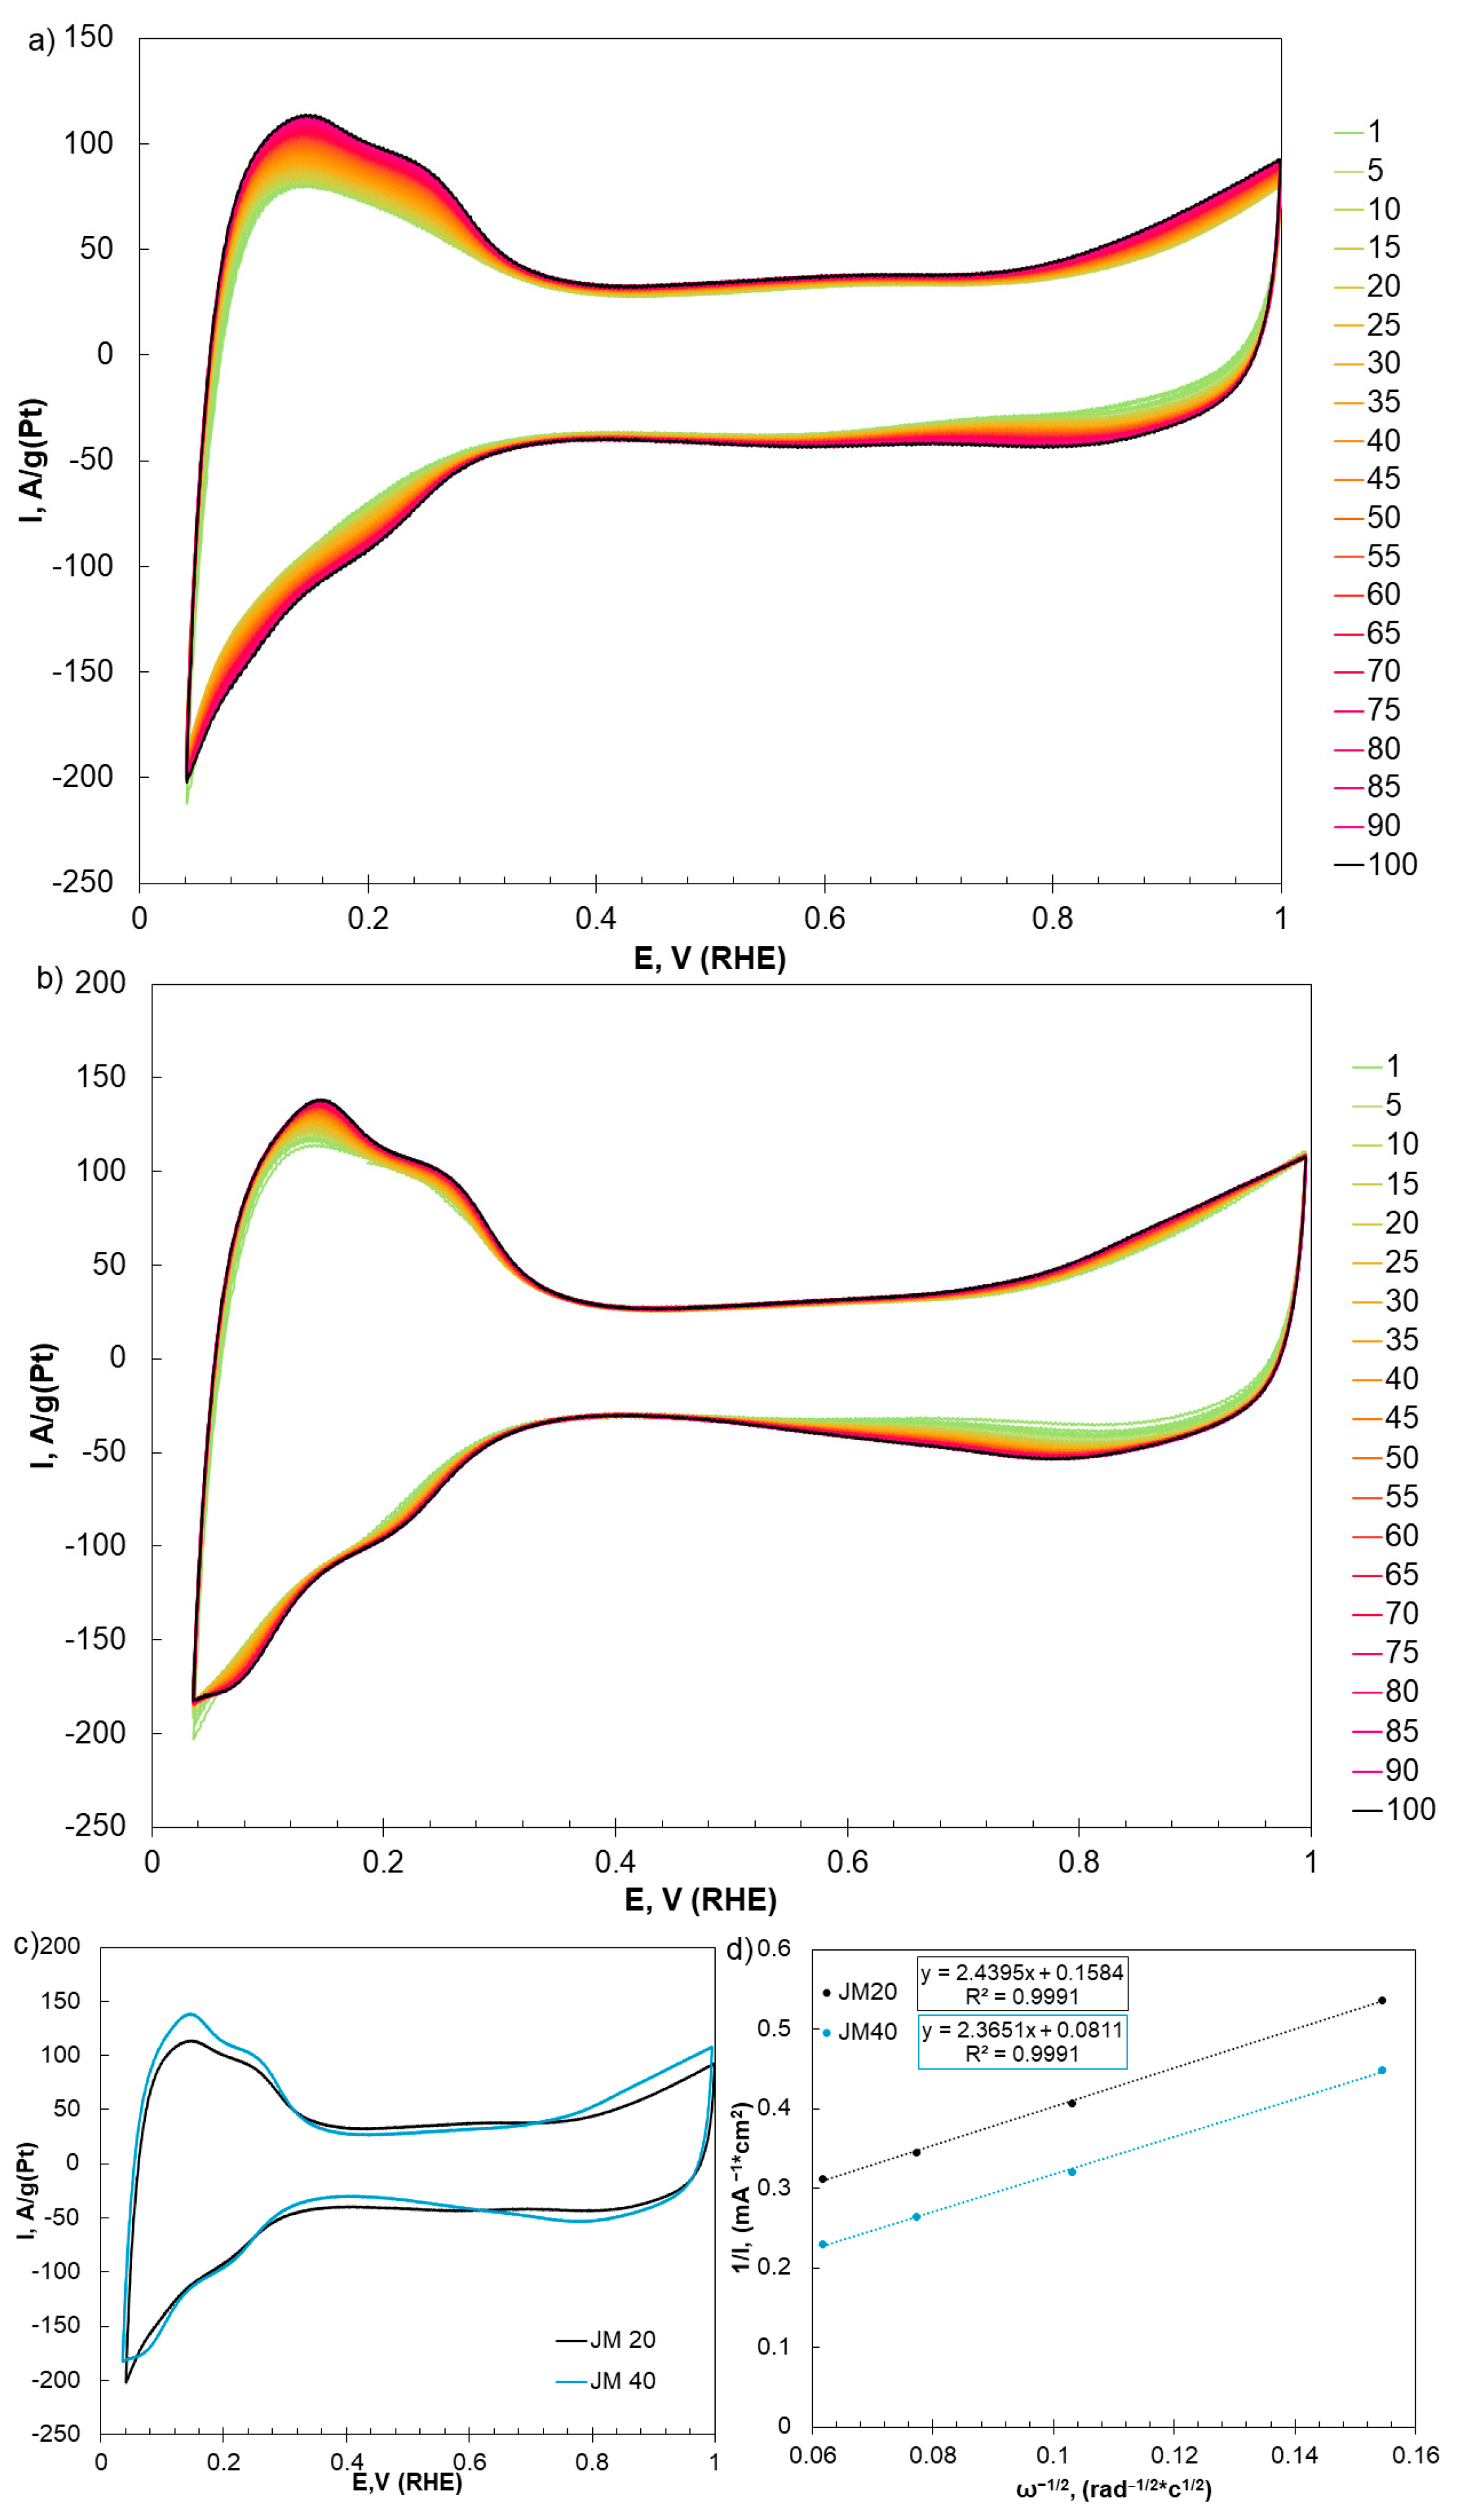
Before measuring the electrochemical characteristics, a pre-stage of the standardization/activation of the electrode surface was carried out. This stage consists of multiple cycles (100 cycles), which lead to the oxidation of various surface impurities that may be present in the electrocatalyst after the synthesis, which in turn results in the purification of the surface. Cyclic voltammograms (CVs) recorded during the electrochemical activation of the surface of the platinum catalysts JM20 and JM40 are shown in Figure 1a and b, respectively. CVs of the samples after the activation have the typical appearance of Pt/C catalysts (Figure 1c). Three characteristic regions can be distinguished in these CVs, i.e., the hydrogen region with the adsorption/desorption of hydrogen atoms (from 0.02 to 0.3 V), the double-layer region with the charge/discharge of an electric double layer (from 0.3 to 0.65 V), and the oxygen region with the platinum oxidation/oxygen reduction on the platinum surface (more than 0.65 V). It is worth noting that the currents in the double-layer region of the studied JM20 and JM40 materials coincide, which appears to indicate the use of carbon supports with similar surface areas for these materials (probably, of the same support) (Figure 1c). The ESA of the materials has been calculated using the charge amount consumed for the hydrogen desorption Q′ and adsorption Q″ (see the Section 3 ), according to the CV in Figure 1c. The calculation results are presented in Table 1. The JM40 material exhibits a lower ESA value, which is also highlighted by numerous publications (see Table S1 in the Supplementary Materials (SM)).
The study of the kinetics of the oxygen electroreduction in various catalysts (Figure 1d was carried out using the rotating disk electrode (RDE) technique (see the Section 3) and confirmed the 4-electron reaction mechanism, which is typical for the Pt/C materials. The ORR activity of the catalysts was estimated by values of the kinetic currents calculated by the Koutetsky–Levich equation and by values of the half-wave potentials (E1/2) in linear sweep voltammograms (LSVs) (Table 1 and Figure 1d). It is noteworthy that the JM20 catalyst exhibits the highest specific currents per the mass of platinum and a greater E1/2 value compared to the JM40 material, which appears to be due to a higher ESA value for the JM20 material.
To conduct the stress testing, the protocol proposed and described in detail by Nagai et al. has been used [18]. Studying the effect of a gas nature when bubbling the electrolyte during the durability testing of the materials has been of particular interest. Therefore, the stress testing was carried out in the electrolyte saturated with oxygen at atmospheric pressure, which better corresponds to the operation of the catalyst under real operating conditions of PEMFCs, as well as in the electrolyte saturated with argon, which is compliant with most stress testing protocols. The degradation of the catalysts was assessed by using the change in the ESA and ORR activity values before and after the ADT (see the Section 3). In this case, the charge amount transmitted through the electrode–electrolyte interface was recorded for all the materials under different stress testing conditions, as described in [30].
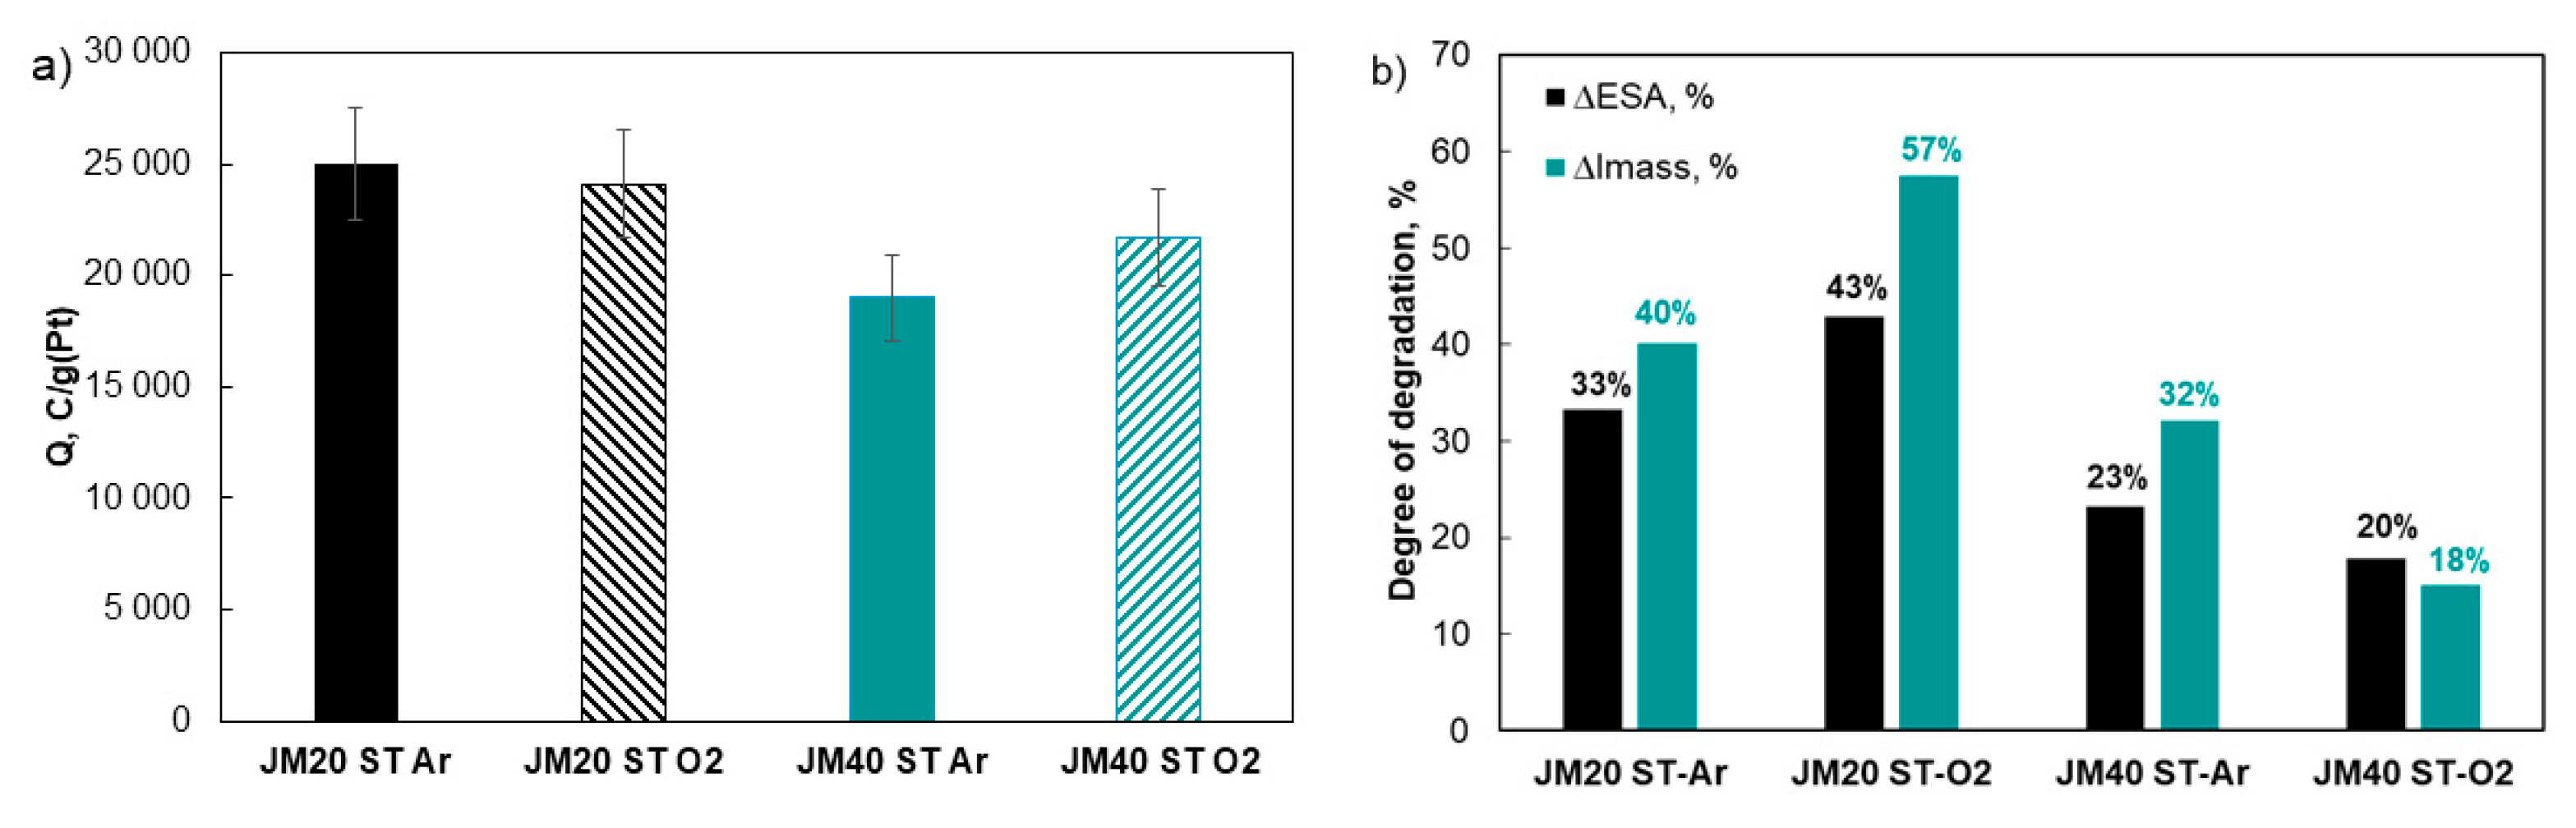
After 10,000 stress testing cycles, the ESA values had decreased for all the materials (Figure S1 and Table 1). The greatest area degradation for the JM20 electrocatalyst was observed during the stress testing in an oxygen-saturated electrolyte and was 43% of the initial ESA value (Figure 2b), whereas this amounts to 33% in an argon-saturated electrolyte. At the same time, the change in the atmosphere during the ADT slightly affected the change in the ESA for the JM40 catalyst. The degradation of the JM40 sample equates to 23% and 20% in the Ar and O2 atmospheres, respectively, which was significantly lower compared to JM20. It is also worth noting that regardless of the testing conditions, for the JM20 material, a greater charge amount per mass of platinum was transmitted during the stress testing compared to the JM40 catalyst (Figure 2a), which appears to be due to a higher ESA value in the JM20 material.
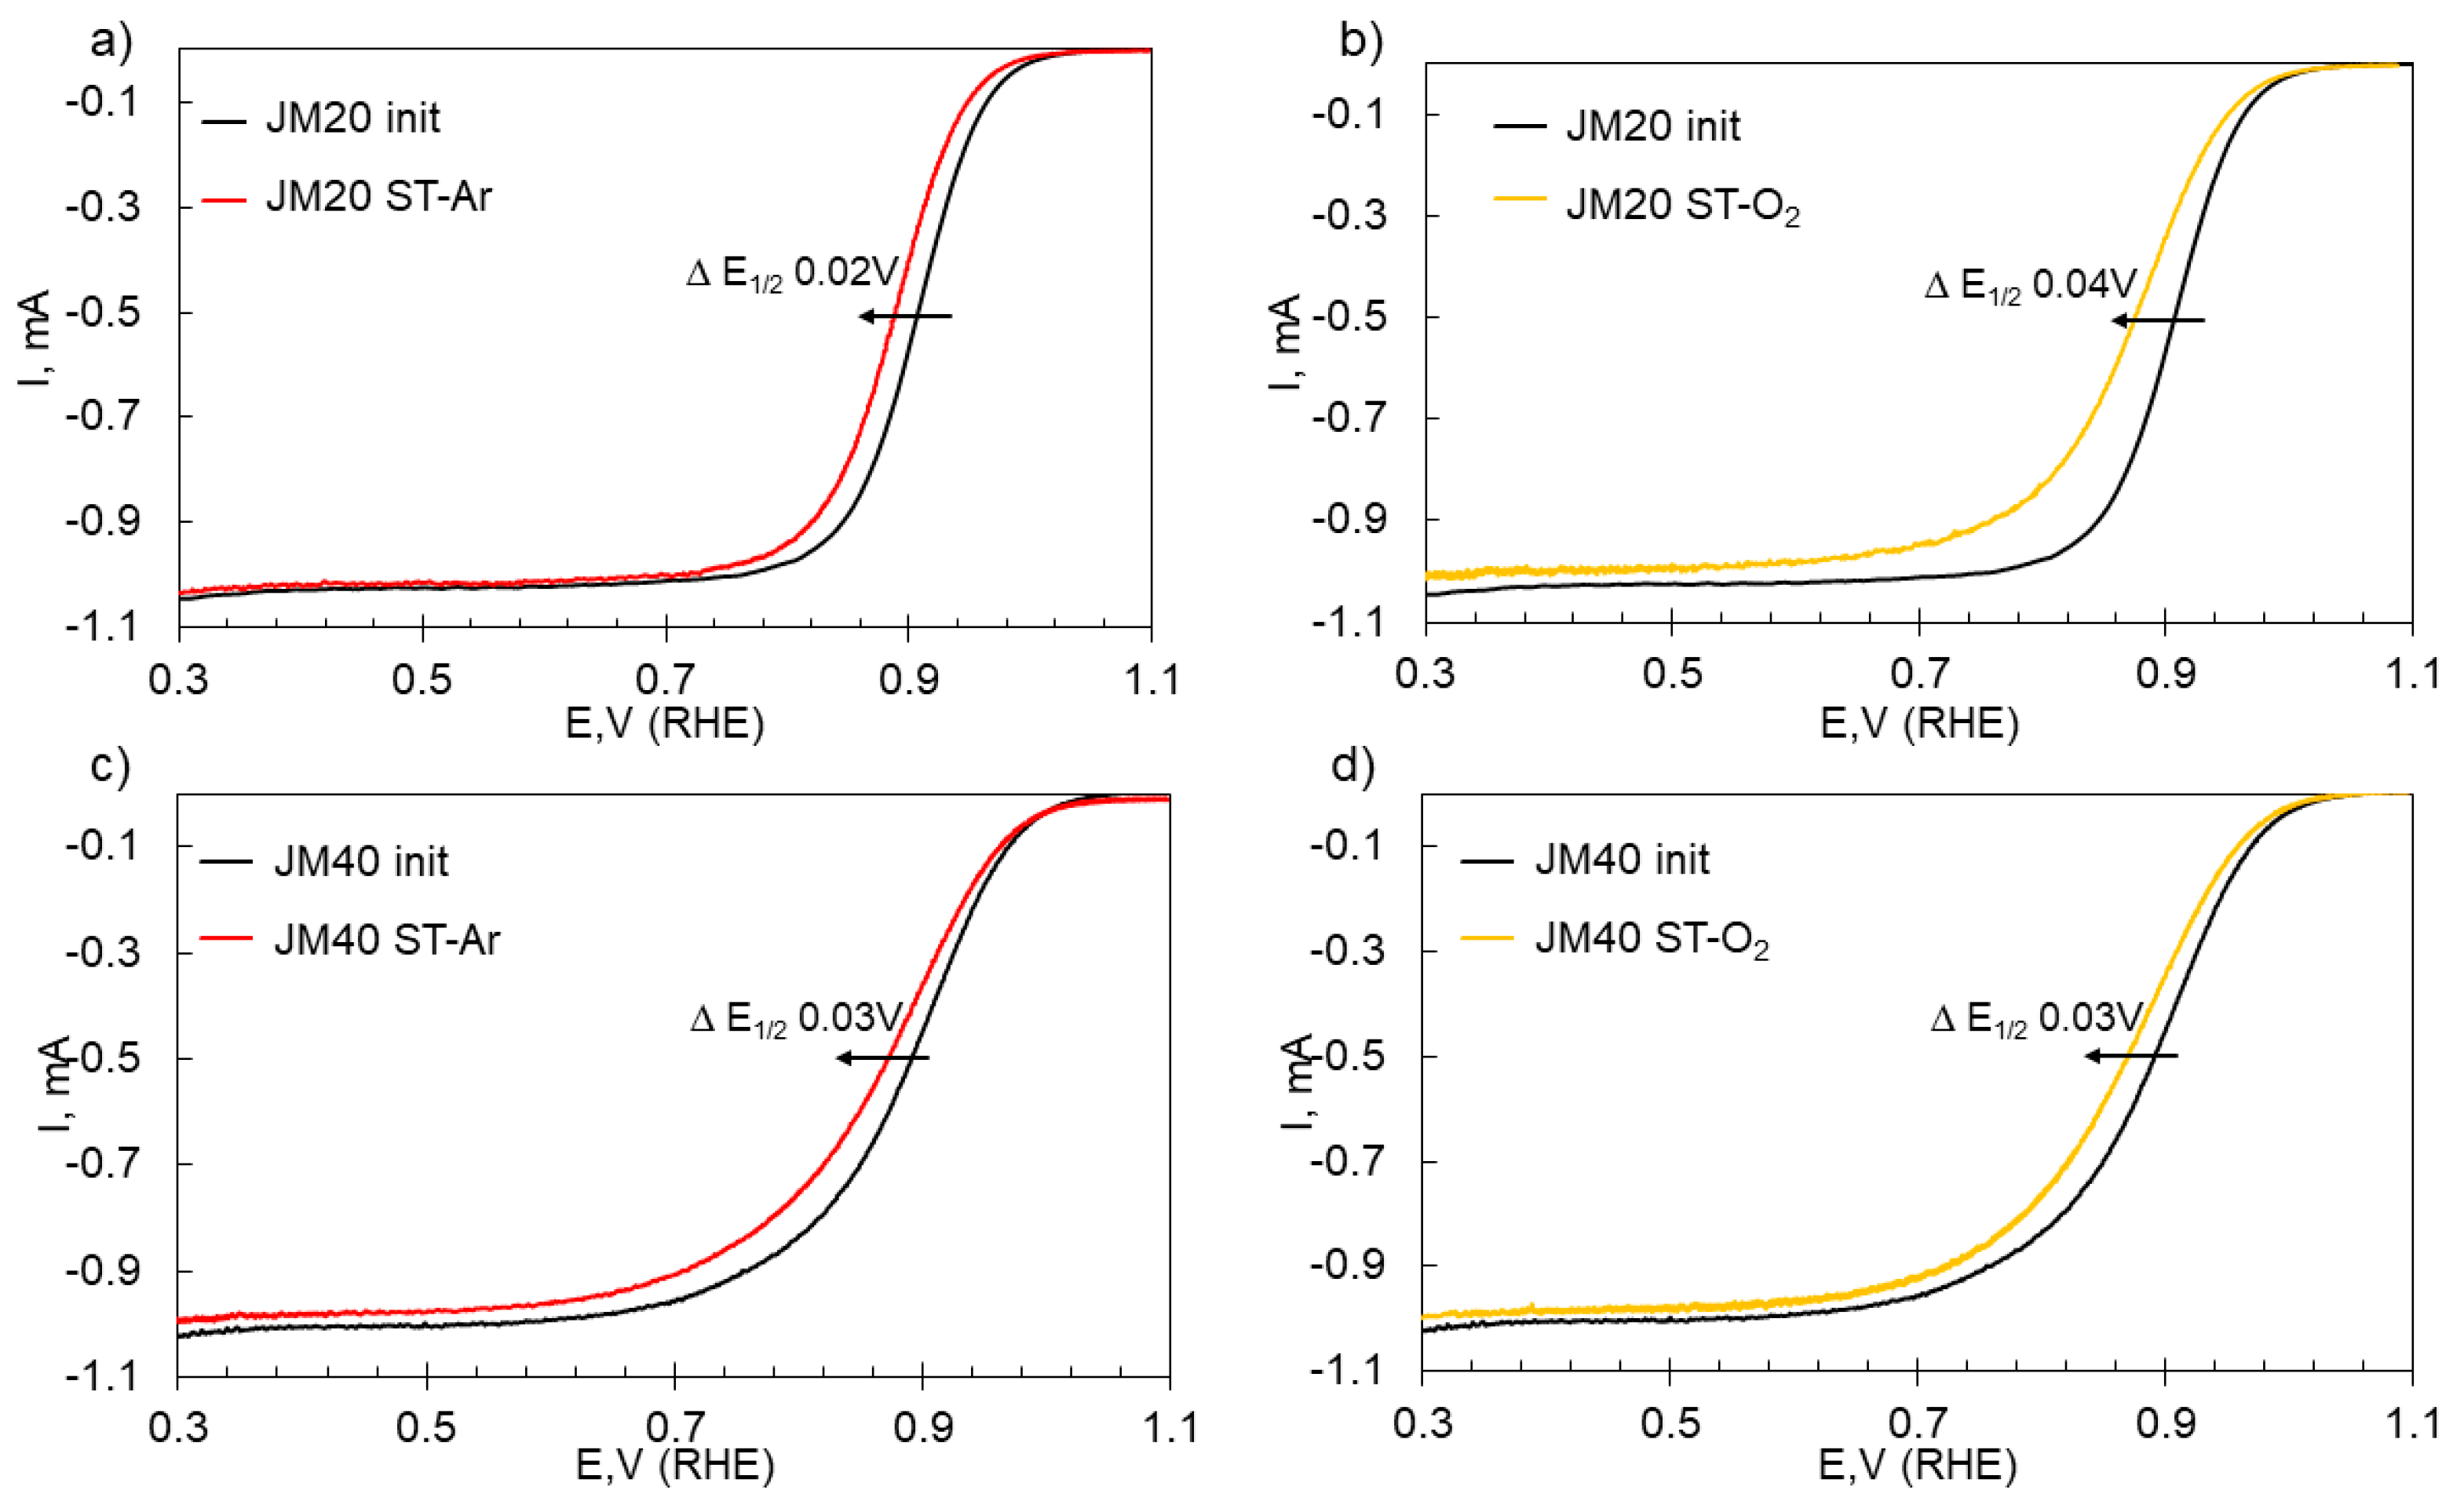
LSVs for the studied samples measured after the stress testing demonstrate a shift in the E1/2 value to the low-potential region compared to the pre-ADT sample. Notably, for the JM20 material, the shift value depended on the gas used when bubbling the electrolyte: for argon, the shift was 20 mV, while it was 40 mV for oxygen (Figure 3a,b). For the JM40 material, the half-wave potential shift was independent of the nature of the gas being used, which amounted to 30 mV (Figure 3c,d).
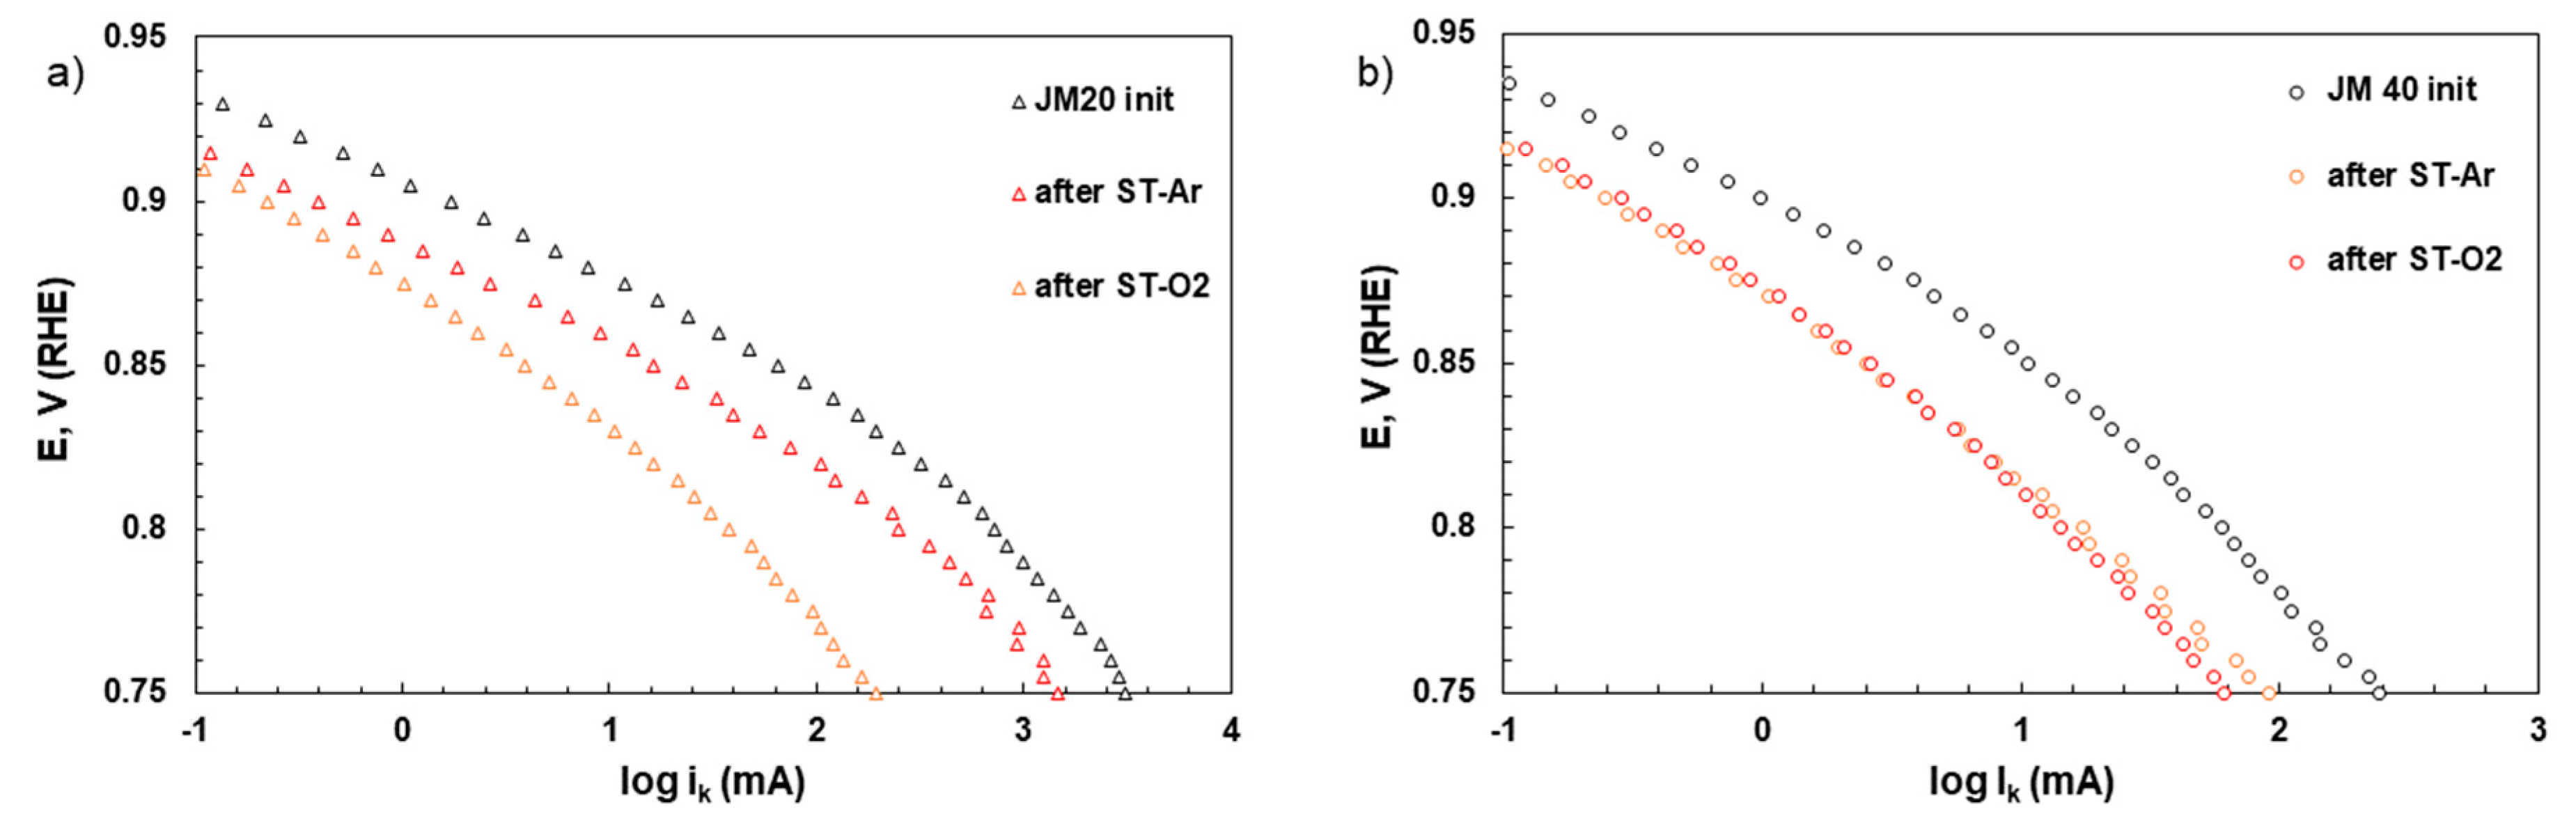
The calculated values of the specific and mass activities in the ORR for the catalysts after the stress testing decreased (Figure 4 and Table 1), which was associated with the ongoing degradation of the catalysts. The greatest degradation of the mass activity, as with the ESA value, is typical for a more active material with a lower platinum loading (JM20) (Figure 2b), which was 40% and 57% in Ar and O2 atmospheres, respectively, in contrast to the JM40 material, for which the mass activity degradation amounted to 15–32%. Studying the slope of the Tafel curves shows that the materials (Figure 4) before the ADT are characterized by a slope of about 60 mV in the potential range of more than 0.85 V, which is typical for Pt-based catalysts [31,32,33]. Tafel dependencies clearly show that the JM20 material degrades to a greater extent after the stress testing, with the activity after the ADT in argon being higher than after the testing in oxygen (Figure 4a). On the other hand, the JM40 material degraded approximately the same regardless of the stress testing conditions and exhibited similar activity values after the ADT under various conditions (Figure 4b). The lower durability of the JM20 material is in good agreement with the data in the literature (Table S1) since small-sized platinum NPs are characterized by a substantial decrease in the specific activity during the stress testing. At the same time, larger particles are thermodynamically more stable and not prone to aggregation. Therefore, the specific activity decreases to a much lesser extent. Notably, it is often the case that more active Pt/C catalysts degrade faster [34]. Therefore, it is necessary to select an optimal combination of the activity–durability interconnection depending on the requirements of a specific device. On the other hand, it should be noted that despite the lower durability, the activity of the JM20 material after the stress testing in an Ar atmosphere was still higher than for the JM40 catalyst after the stress testing.
Therefore, regardless of the stress testing conditions, the JM20 material has been established to degrade to a greater extent for the ESA and the catalytic activity than JM40, which may be due to the structural and morphological features of the catalysts and their evolution during the stress testing under various conditions due to different degradation mechanisms of the catalyst.
2.2. Morphology Evolution of Commercial Pt/C Materials before and after ADT in Various Modes
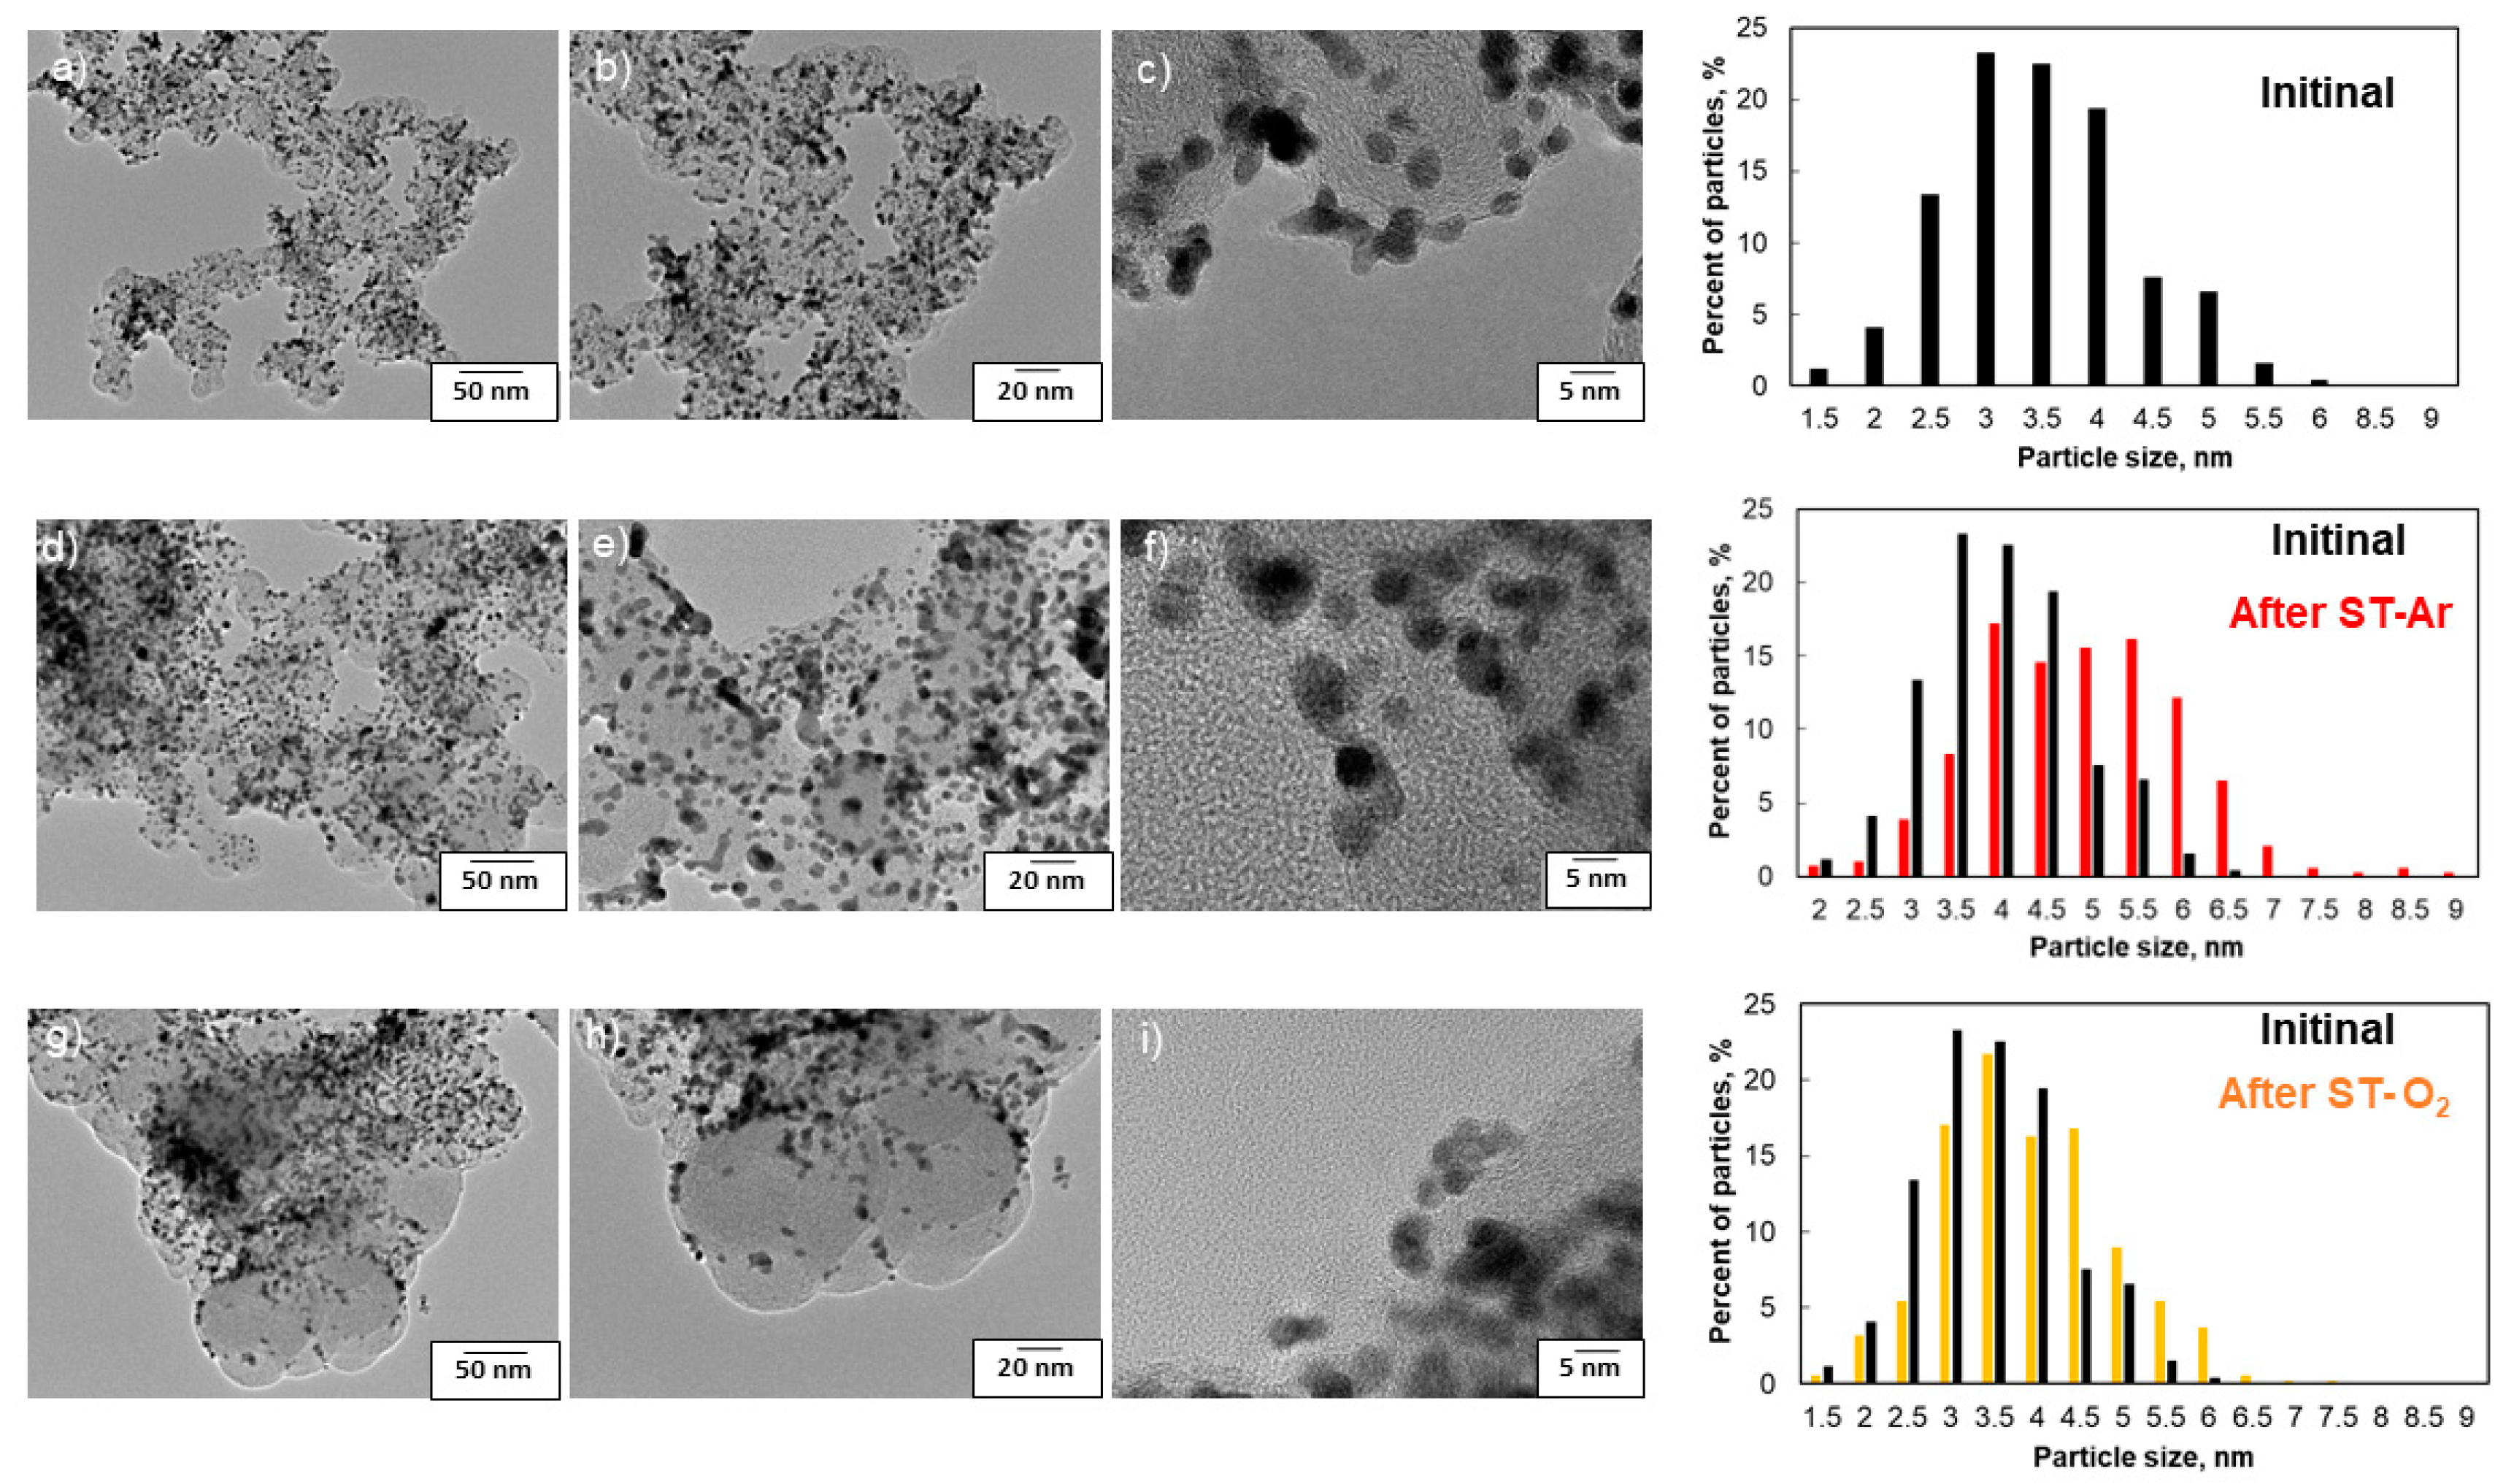
Structural and morphological characteristics of the initial Pt/C catalysts have preliminarily been studied using the X-ray powder diffraction (XRD) (Figure S2) and transmission electron microscopy (TEM) methods (Figure 5 and Figure 6). The average crystallite size for platinum (2.5 nm), according to the XRD data, and the average size of the NPs (3.0 nm), according to the TEM data for the JM20 catalyst, was 0.8 nm and 0.5 nm smaller, respectively, than in the JM40 sample. The JM40 material is characterized by a greater number of larger agglomerates, a wider size distribution of NPs, and a less uniform distribution of NPs over the surface of the carbon support (Figure 6) than the JM20 material, which is associated with a higher mass fraction of the precious metal. The structural and morphological characteristics of the JM20 and JM40 materials correlate well with the results presented in the literature (Table S1). It is noteworthy that the results of determining the ESA value for JM20 (84 m2/g(Pt)) and JM40 (56 m2/g(Pt)) are compliant with the XRD and TEM data for these materials. A larger size and a wider size distribution of Pt particles, as well as a greater number of agglomerates for the material with a higher mass fraction of platinum, are conducive to a decrease in the ESA value.
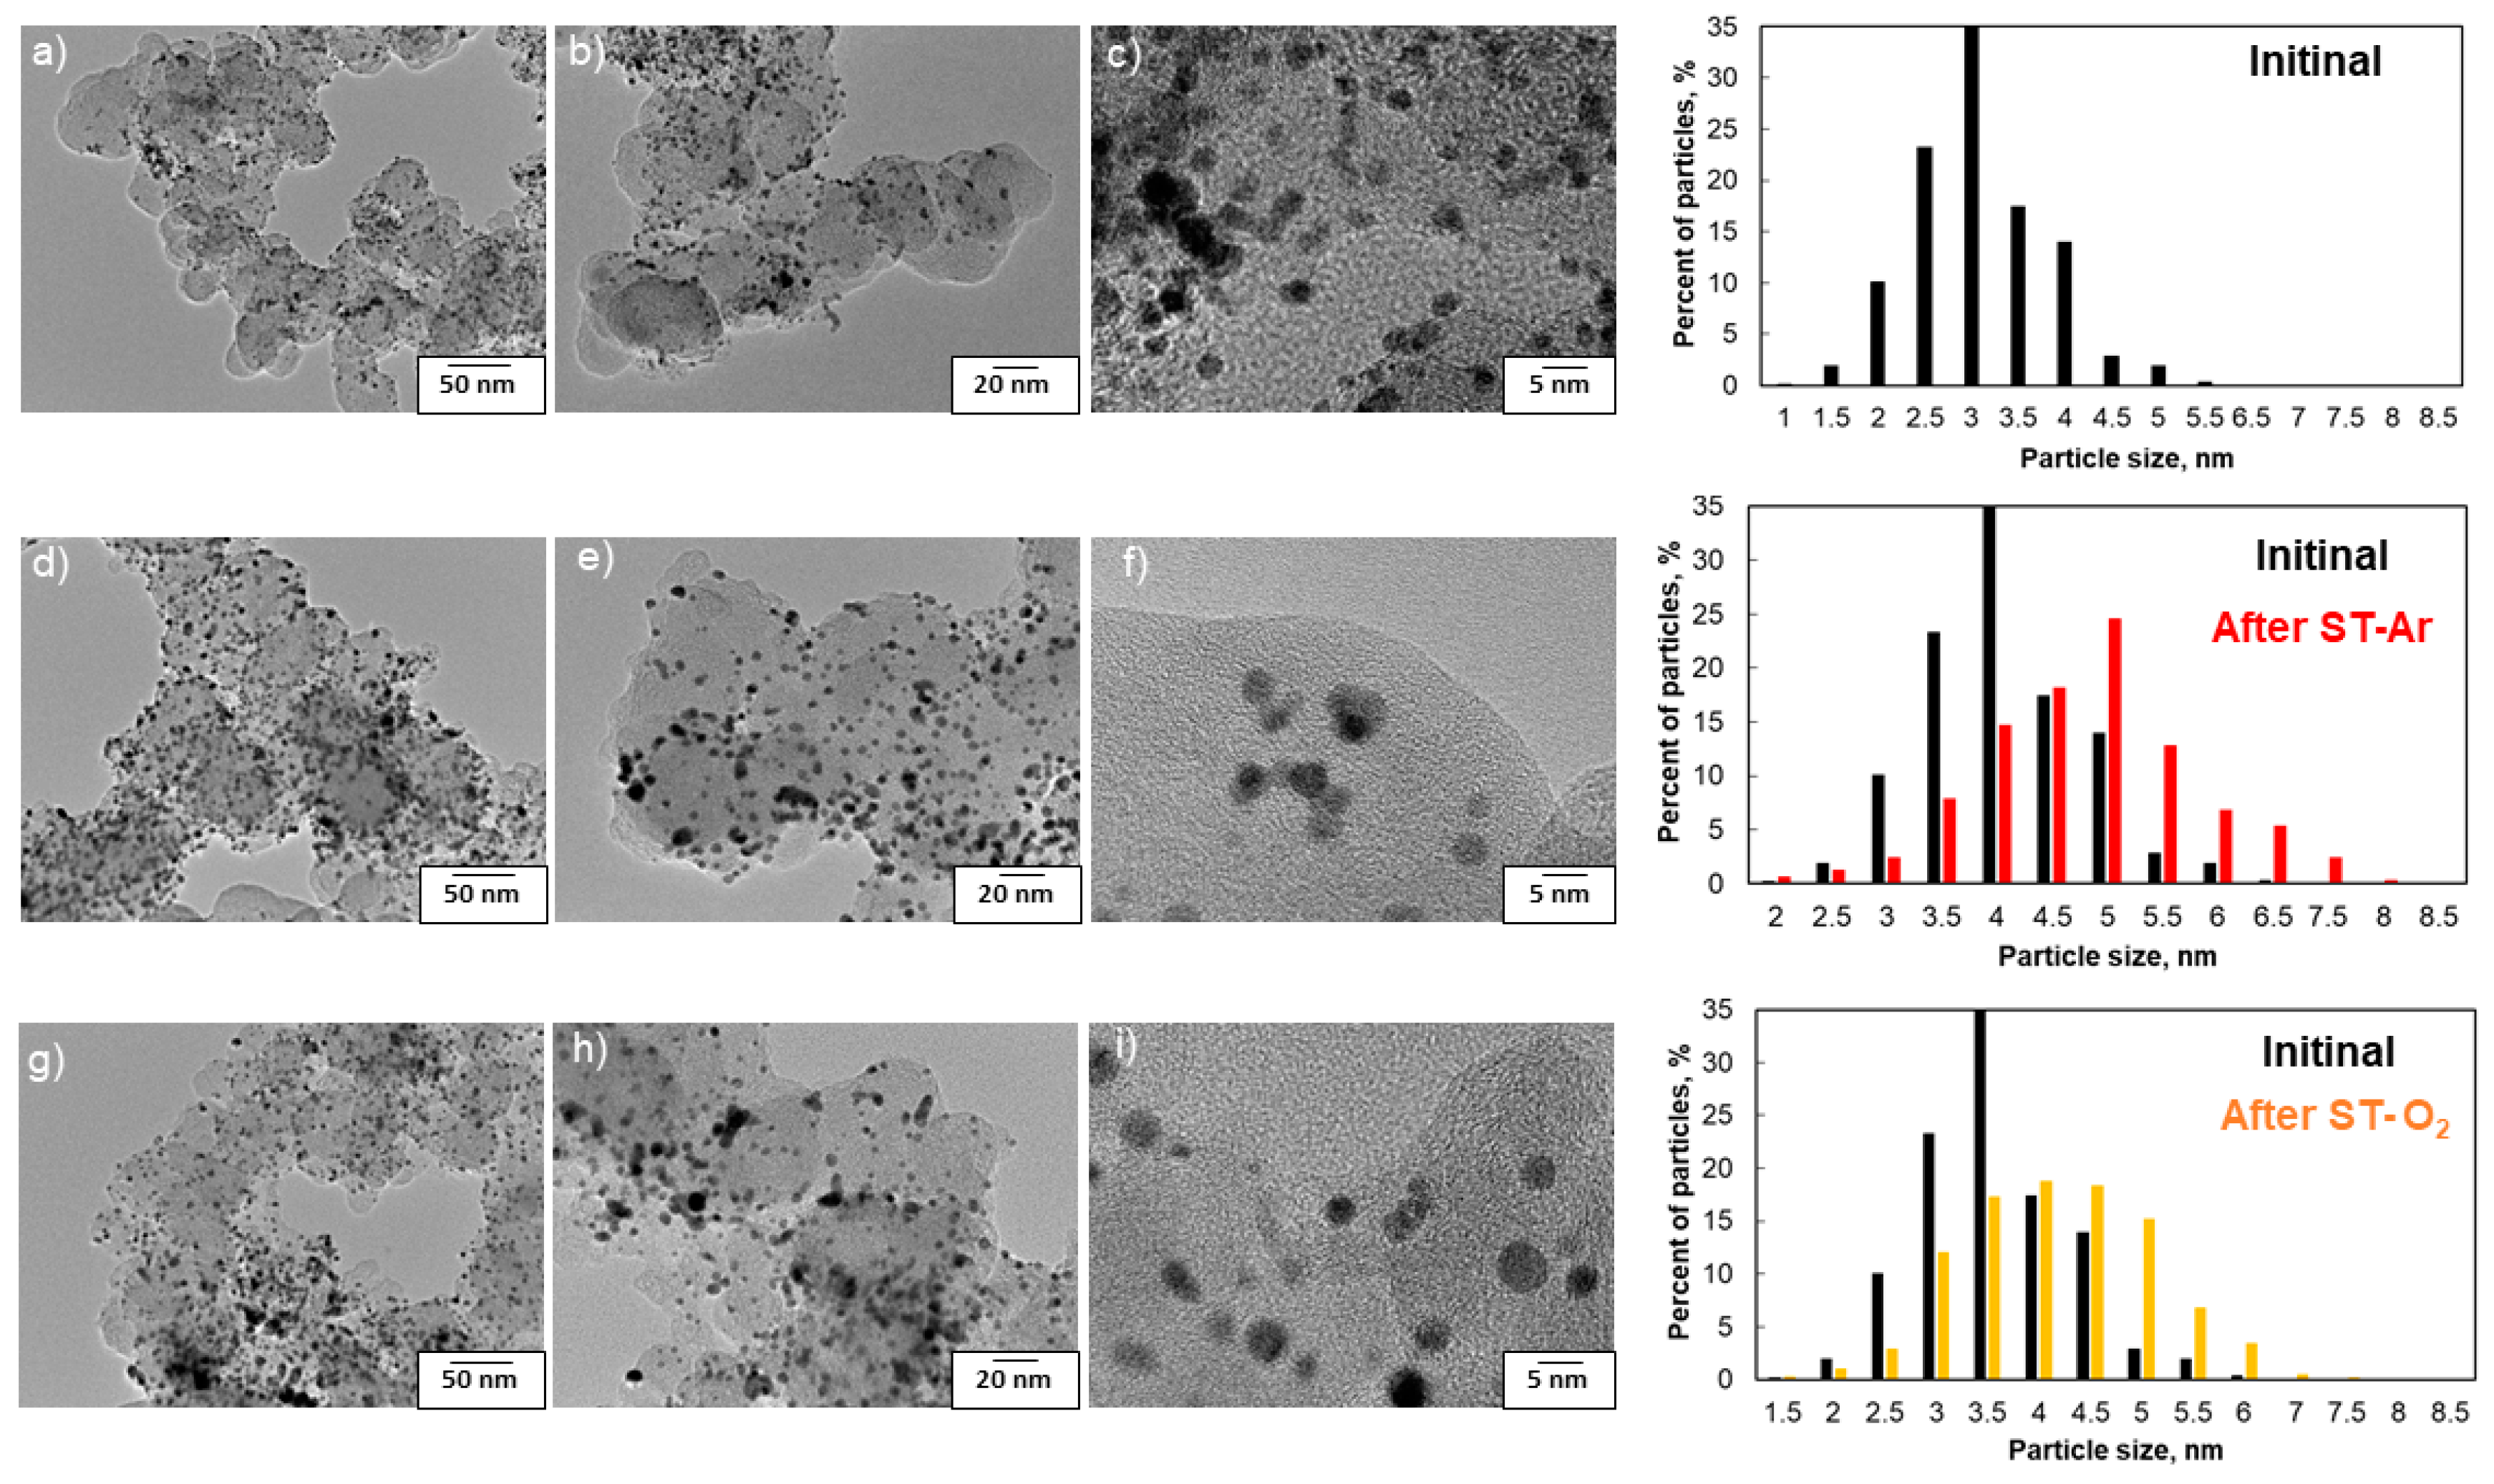
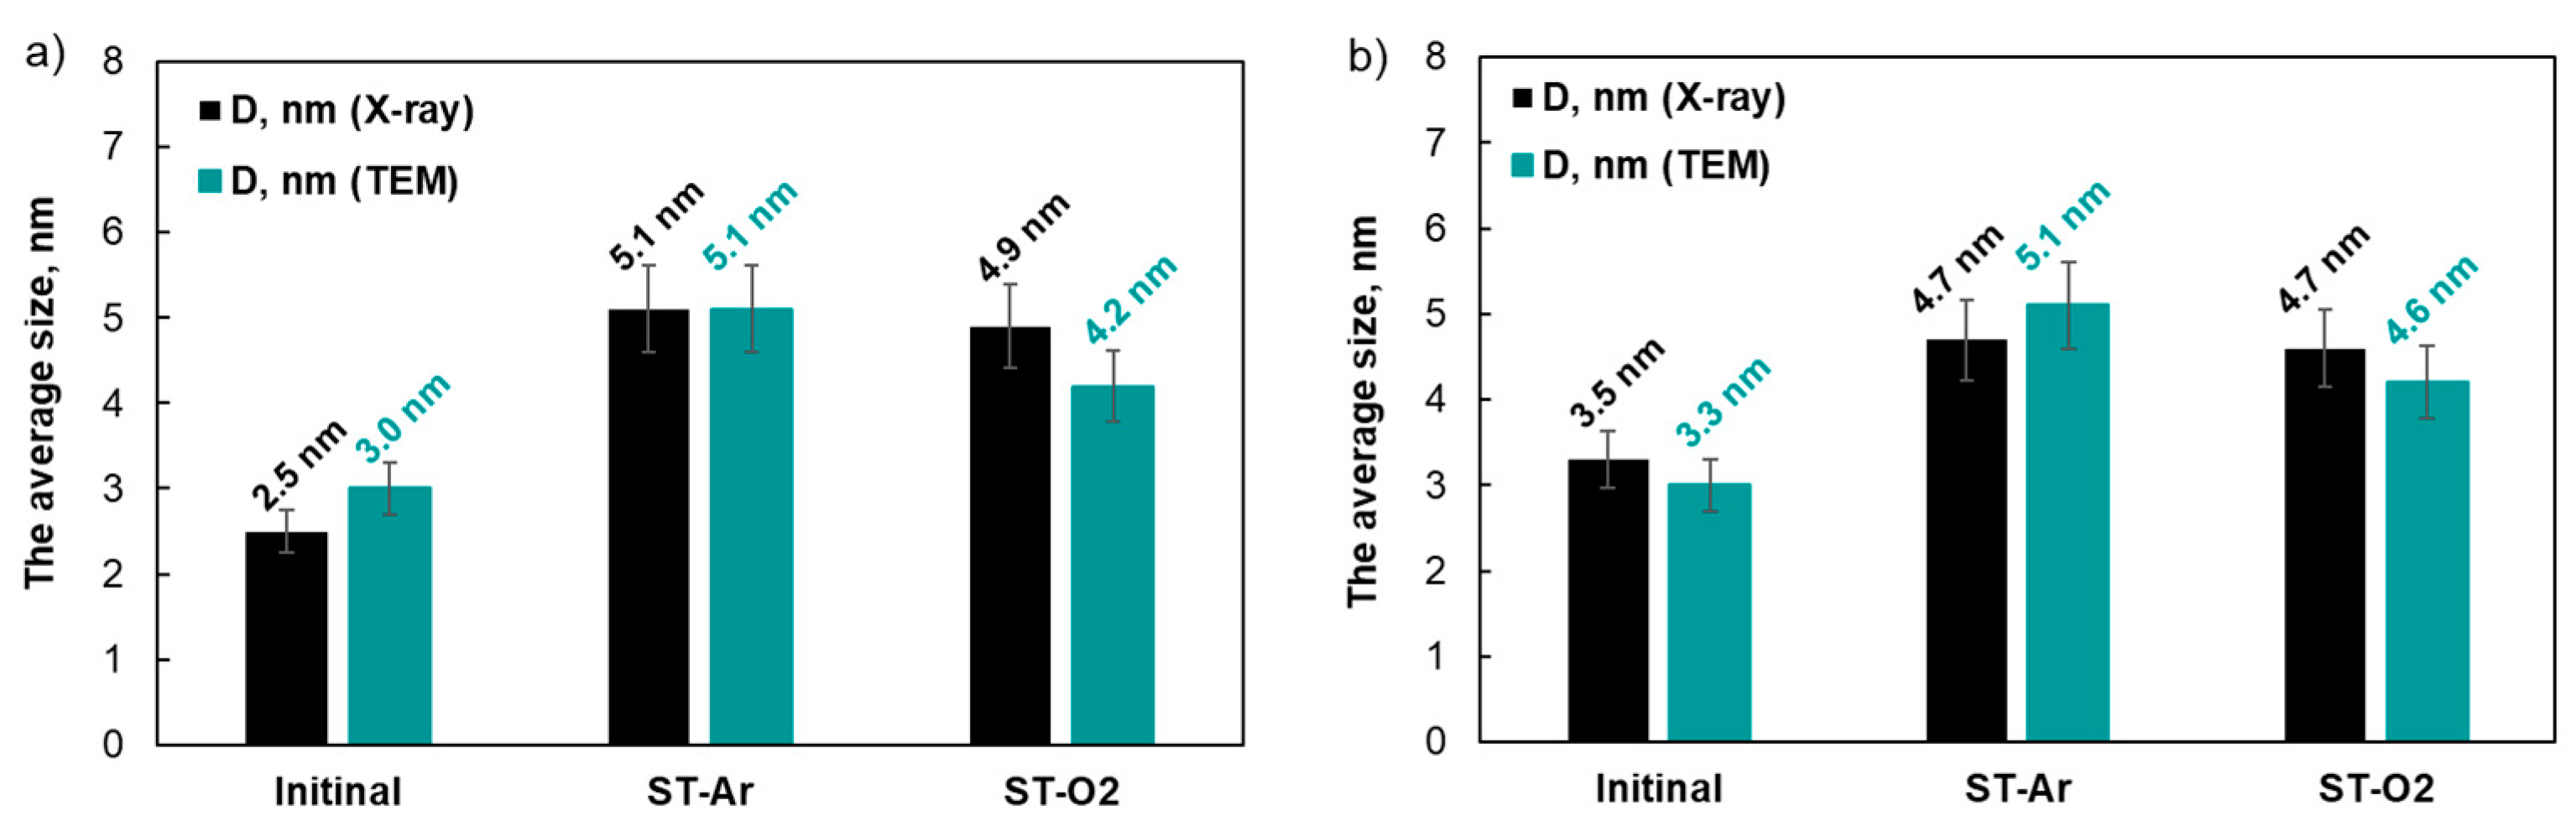
In this research, the degradation of the samples has additionally been studied by the changes in the structural and morphological characteristics of the materials after the stress testing. For the Pt/C materials after the ADT, the catalytic layer was cleared and studied using the XRD method. X-ray diffraction patterns for the JM20 and JM40 materials after the ADT (Figure S1) demonstrate a noticeable increase in the full width at half maximum (FWHM) for the platinum reflections, which indicates an increase in the average crystallite size (Figure 7). When comparing the TEM micrographs for the JM20 catalyst before and after the stress testing, it was seen that after the ADT, the proportion of the 4.5–5 nm sized agglomerates in the material had increased (Figure 5). This appears to be due to the coalescence of the aggregated (closely spaced) Pt crystallites, which are a result of the stress testing. This material is also characterized by a substantial change in the nature of the histogram of the NPs’ size distribution after the stress testing, which is associated with a decrease in the proportion of the 3–3.5 nm-sized NPs. According to the results of the analysis of the change in the average crystallite size based on the XRD data and the average size of NPs based on the TEM data before and after various types of stress testing for the JM20 material (Figure 6a), it can be demonstrated that the crystallite size increases from 2.5 to 5 nm, while the NPs grew from 3 to 4–5 nm (Figure 6). At the same time, according to the TEM data, the average size of the NPs after ST-O2 was slightly smaller than after ST-Ar. It should be noted that the nature of the NPs’ distribution over the surface of the carbon support as well as the proportion of the agglomerates for the JM20 material after ST-Ar and ST-O2 are markedly different, which is described hereinafter.
A similar comparison of the TEM micrographs was carried out for the JM40 catalyst, before and after the stress testing. This material also exhibited an increase in the average NP size as well as the presence of larger agglomerates (Figure 6). Nevertheless, the proportion of NPs of 3–4 nm in size prevailed in both the initial state and after the stress testing. At the same time, the nature of the size distribution after the ADT slightly changed, especially for the material after ST-O2. Notably, the JM40 material (Figure 6b) after the ADT exhibited an enlargement in both the crystallites and the NPs from about 3.5 to 4.5–5 nm, which was less than for the JM20 material. The greater durability of the JM40 material is certain to be due to the larger average size of the NPs and the higher thermodynamic robustness compared to the JM20 sample. It should be noted that no significant differences in the size of NPs were observed for the JM40 material after various types of stress testing, which correlates well with the close catalytic activity of the materials.
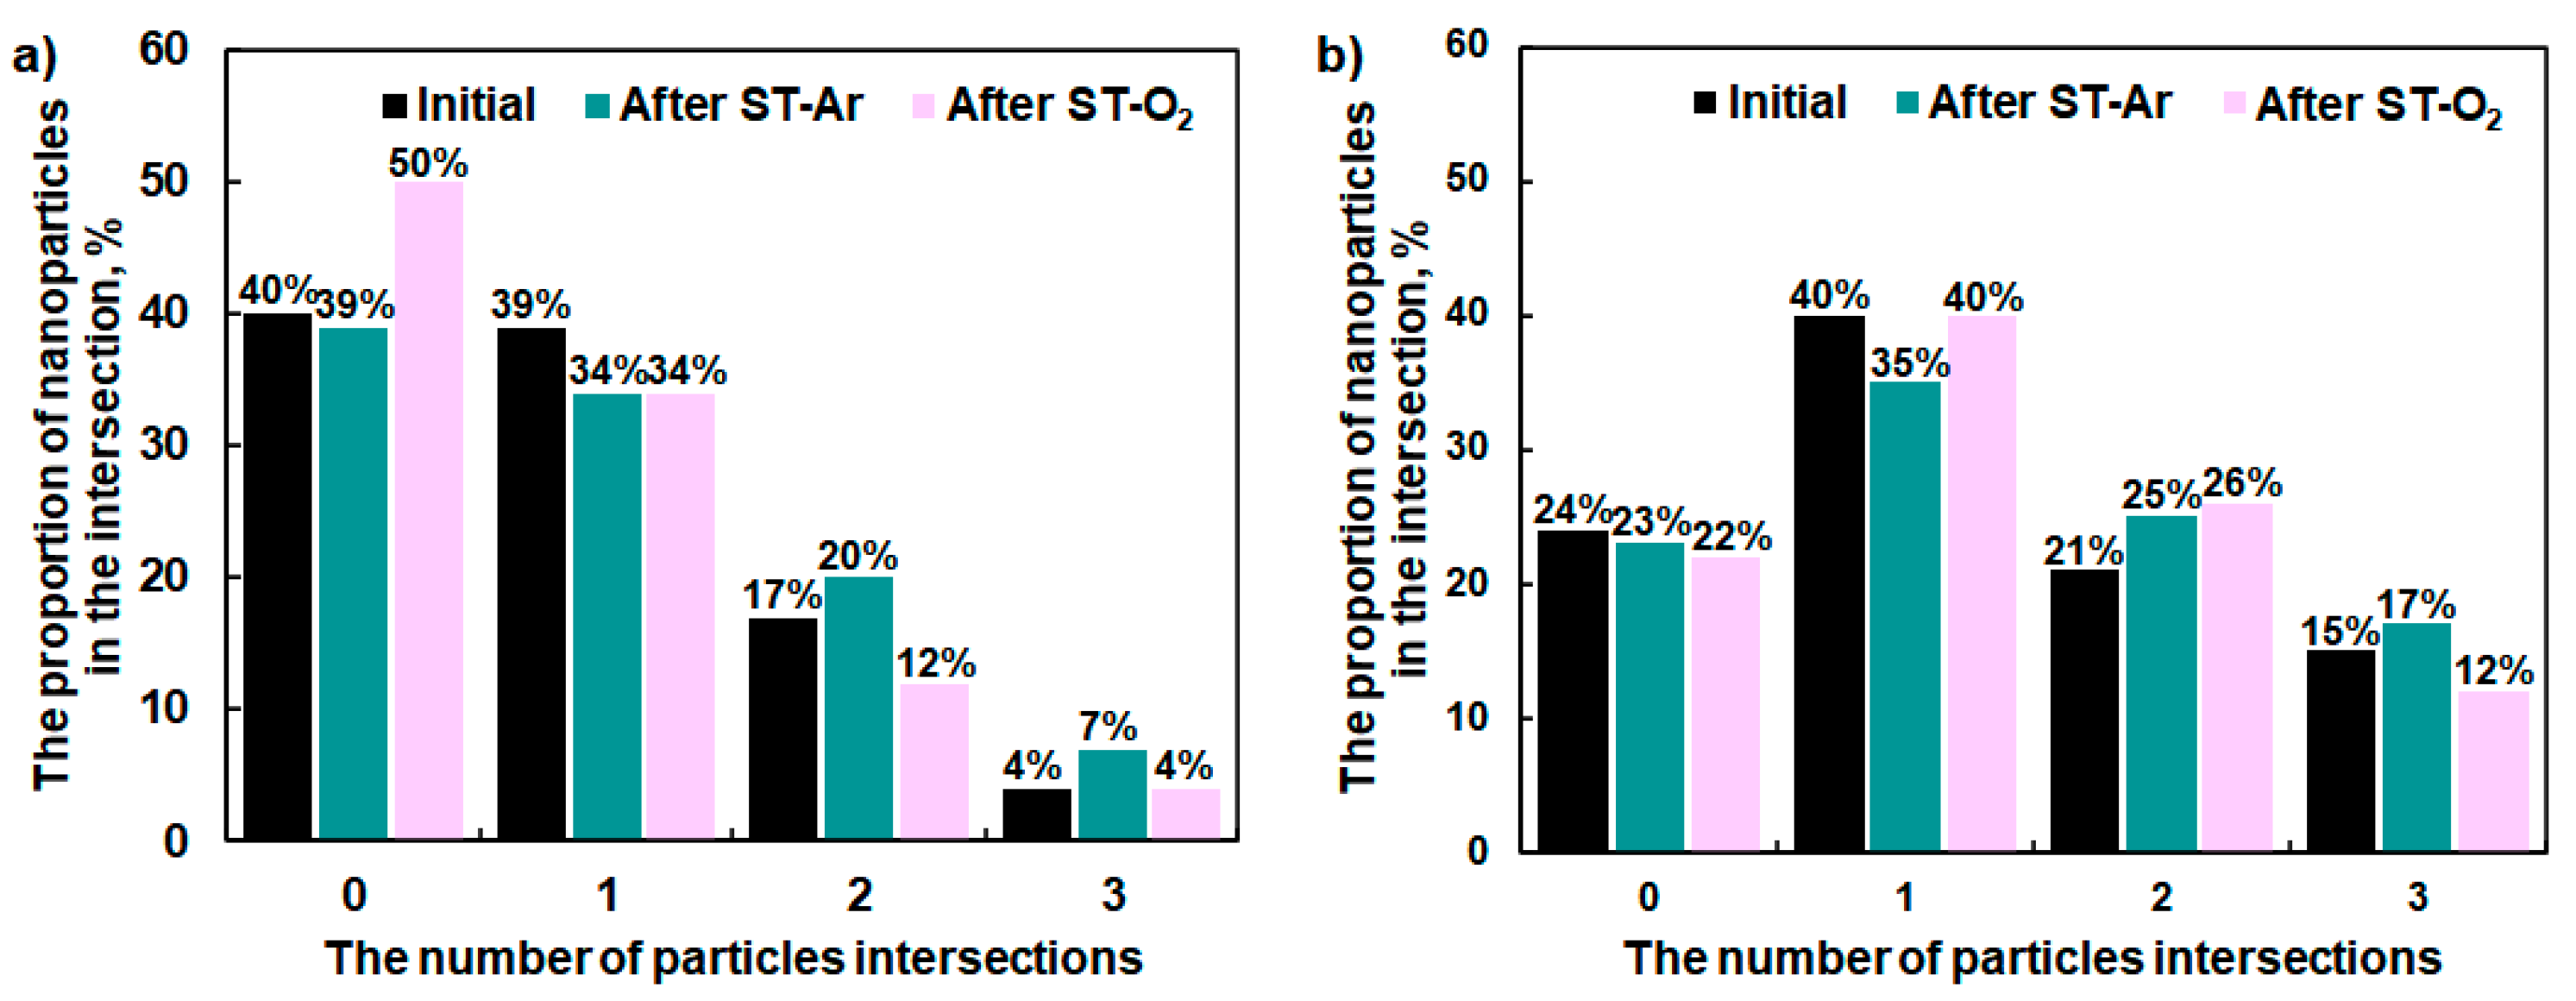
For quantification of the nature of the NPs’ distribution over the surface of the carbon support, according to the TEM results, the approach based on determining the proportion of the NPs that have a different number of intersections with the others can be used. This approach is described in detail and justified in [35]. Analysis of the number of NP intersections in the JM20 and JM40 materials (Figure 8) quite logically demonstrated that JM20 had a greater number of individual NPs and a greater number of particles with two or more intersections than JM40, which correlates because JM40 is associated with a higher mass fraction of platinum. The comparison of the number of intersections before and after the various types of stress testing is of particular interest. For example, for the JM20 material after ST-Ar, the proportion of individual particles practically did not change, whereas the proportion of particles with two or more intersections significantly increased, which indicates the agglomeration of the NPs during the stress testing (Figure 8a). The JM40 material behaved similarly after ST-Ar. The proportion of the particles with two or more intersections grew, while the proportion of individual particles remained virtually unchanged (Figure 8b). At the same time, for both the JM20 and JM40 materials, the proportion of the NPs with a single intersection significantly decreased, which may indicate the predominant agglomeration of the NPs, in terms of two closely spaced particles during this stress testing. A more complex dependence was observed after ST-O2. For example, the JM20 material exhibited a significant increase in the proportion of individual particles and a decrease in the proportion of particles with one or two intersections (Figure 8a), which cannot be explained by the agglomeration of NPs. According to the data in the literature [18], this stress testing mode is known to be characterized by agglomeration and other possible processes, including Ostwald ripening [2,36] and the corrosion of the carbon support [37], which may result in both the adhesion of NPs and their complete detachment from the surface of the carbon support. These are processes of the corrosion of the carbon support and the detachment of particles that mostly proceed at the location of the greater number of platinum NPs (agglomerates) intersections, which may lead to an increase in the proportion of individual particles for the JM20 material after ST-O2. This also appears to be related to a slightly smaller average size for the NPs of the JM20 material after ST-O2 compared to JM20 after ST-Ar. It is not excluded that a similar degradation mechanism occurs for the JM40 sample after ST-O2, although it is less pronounced and the change in the nature of the NPs’ distribution over the surface of the carbon support in this case is well explained by the agglomeration of the NPs.
According to the conducted BET study, the commercial JM20 and JM40 materials have been established to exhibit areas of 185 and 146 m2/g, respectively (Figure S3), and pore volumes of 0.278 and 0.210 cm³/g, respectively. These data testify in favor of the fact that platinum nanoparticles close the pores of the carbon support and reduce its area (the area of the Vulcan XC-27 support, according to the measurements performed, is 270 m2/g). Notably, with an increase in the platinum loading from 20 to 40, the area decreased by 39 m2/g. It is also noteworthy that the JM20 and JM40 materials exhibited no differences in the nature of the pore size distribution (Figure S4), i.e., with an increase in the platinum loading, all pores, except for the largest ones of more than 6 nm in size, were uniformly closed.
Therefore, the different activity of the JM20 catalyst after ST-O2 and ST-Ar was difficult to associate with various average sizes of NPs, according to TEM or XRD. This phenomenon may be explained by the different nature of the platinum NPs’ distribution over the surface of the carbon support, which has been quantitatively analyzed by determining the number of NP intersections. A different distribution of platinum NPs over the surface after various types of stress testing for the JM20 material may in turn be associated with the predominant course of the degradation process in an oxidative medium when using ST-O2 through a mechanism of oxidization of the carbon support and the subsequent detachment of NPs, in contrast to the agglomeration and Ostwald ripening, which do not result in the loss of platinum in the ST-Ar mode. The difference in degradation mechanisms for the JM20 material may also explain the lower catalytic activity of JM20 after ST-O2 compared to the sample after ST-Ar. This assumption undoubtedly needs verifying in further research, e.g., using the marked TEM grids.
3. Materials and Methods
3.1. Chemicals and Materials
Argon (Ar, 99.9%, Globus), isopropanol (99.8%, Ekos-1), and perchloric acid were used in the experimental work. The commercial Pt/C catalyst JM20 (HiSPEC3000, 20 wt.% Pt, Johnson Matthey) was used as the sample under study.
3.2. X-ray Examination
The XRD method was used to study the structural characteristics of the obtained Pt/C material. The ARL X’TRA powder diffractometer with the Bragg–Brentano geometry (θ-θ) and the CuKα radiation (λ = 0.154056 nm) was applied at room temperature to record X-ray diffraction patterns. A detailed description of the methods used is presented in the SM.
3.3. Transmission Electron Microscopy
The size of Pt NPs, as well as features of their size and spatial distributions, were studied by high-resolution transmission electron microscopy (HRTEM). TEM micrographs were obtained using the JEOL JEM F200 microscope (voltage 200 kV, current 12–15 μA, CFEG). A detailed description of the preparation procedure of the sample for TEM measurements is presented in the SM. Histograms of the platinum NPs’ size distribution in the catalysts were plotted based on the results of the size determination for at least 300 particles randomly selected in TEM micrographs at different sections of the sample. The error margin was ±0.2 nm.
3.4. Electrochemical Methods
The preparation of catalytic inks for electrochemical measurements is described in detail in the SM. The studied electrode was a uniform porous catalytic layer fixed at the end face of the RDE.
The electrochemical performance of the catalysts in a standard three-electrode cell was studied by cyclic voltammetry (CV) at 23 °C using the VersaSTAT 3 potentiostat. A silver-chloride electrode was used as the reference electrode, and a platinum wire was used as the auxiliary one. All potentials were considered in this study with regard to the reversible hydrogen electrode (RHE). Before electrochemical calculations, the electrode was electrochemically activated by setting 100 current–voltage cycles in the potential range from 0.04 to 1.2 V, at a scanning rate of 200 mV/s, in a solution of 0.1 M HClO4, and in an argon atmosphere.
Then, two CVs were recorded in the same potential range at a potential sweep rate of 20 mV/s. The ESA of the catalysts was estimated according to the standard adsorption/desorption of hydrogen technique, described in [35]. The equation for this calculation is presented in the SM.
To determine the ORR activity of the catalysts, a series of LSVs were measured in the potential range from 0.02 to 1.1 V and at a potential sweep rate of 20 mV/s. The electrolyte was preoxygenated for 60 min at a RDE rotation speed of 700 rpm. A detailed description of the ORR measurement is presented in the SM.
The durability of the catalysts was evaluated using the stress testing method based on the multiple overlaps of the rectangular pulses with potentials of 0.4 and 1.0 V, and the setting time equal to 3 s at the end potentials, during 10,000 cycles. The measurements were carried out using the 0.1 M HClO4 solution saturated with argon and oxygen at 25 °C. To assess the durability, two CVs were recorded before and after the stress testing using the potential sweep rate of 50 mV/s, a potential range of 0.05–1.05 V, and a RDE rotation speed of 50 rpm. The ESA calculation for the second CV was performed as described earlier. The durability was assessed by absolute and relative changes in the platinum ESA during and after the stress testing (ESA10000 and ESA10000/ESA0). The stress testing time in the argon atmosphere was 21 h, while it was 19 h in oxygen.
4. Conclusions
According to the results of the stress testing for the commercial catalysts JM20 and JM40, under various testing conditions, we can conclude that the catalyst with a lower mass fraction of platinum exhibits the highest ESA and catalytic activity values and, at the same time, the lower durability, which was dependent upon the nature of the gas being used to saturate the electrolyte during the stress testing. On the contrary, the JM40 catalyst is characterized by a larger size of NPs, lower ESA, and catalytic activity values, and higher durability, which were practically independent of the nature of the gas being used. This phenomenon can be explained by features in the morphology of the materials before and after the ADT as well as the influence of the gas being purged on the predominant corrosion mechanism for the studied catalysts. By analyzing the morphology of the catalysts’ surface based on the TEM data, before and after the stress testing, and by calculating the number of intersections in the NPs, it was possible to demonstrate an increase in the proportion of individual particles after stress testing in an oxidative atmosphere, which can be explained through a significant contribution by the oxidation process of the carbon support and the subsequent detachment of the NPs, which led to a substantial decrease in the activity of these materials. Understanding the features of the different stress testing modes and degradation processes occurring under various operating conditions would allow for the direct selection of the necessary testing modes to analyze the durability of catalysts and reliably and rapidly assess promising PEMFC catalysts to be distinguished.
Supplementary Materials
The following supporting information can be downloaded at: https://www.mdpi.com/article/10.3390/catal13060923/s1, Figure S1: The cyclic voltammograms for the electrocatalyst before and after the stress testing; Figure S2: The X-ray diffraction patterns for JM20 and JM40 before and after the ADT; Figure S3: Nitrogen adsorption/desorption curves for the commercial Pt/C materials JM20 and JM40; Figure S4: The pore size distribution for the commercial Pt/C materials JM20 and JM40; Table S1: Publication data on activity and stability of commercial Pt/C electrocatalyst.
Author Contributions
Conceptualization, A.A. and S.B.; methodology, E.M. and A.A.; validation, K.P., S.B. and A.A.; formal analysis, E.M., I.P. and K.P.; investigation, K.P. and E.M.; data curation, I.P., E.M., A.A. and S.B.; writing—original draft preparation, A.A. and E.M.; writing—review and editing, A.A. and S.B.; visualization, E.M.; supervision, A.A.; project administration, S.B. All authors have read and agreed to the published version of the manuscript.
Funding
This research was financially supported by the Russian Science Foundation, grant No. 20-79-10211.
Data Availability Statement
The data presented in this study are available on request from the corresponding author.
Acknowledgments
The authors are grateful to Maltsev, A.V. for supporting the translation and editing processes and the assistance in communicating with the editorial board. The authors are also grateful to Nikulin, A.Yu. for the assistance in the XRD pattern registration as well as to the Shared Use Center “High-Resolution Transmission Electron Microscopy” (SFedU) for conducting the TEM studies.
Conflicts of Interest
The authors declare no conflict of interest.
Abbreviations
| NPs | Nanoparticles |
| MEA | Membrane-electrode assembly |
| XRD | X-ray diffraction |
| TEM | Transmission electron microscopy |
| ESA | Electrochemically active surface area |
| CV | Cyclic voltammetry |
| RDE | Rotating disk electrode |
| RHE | Reversible hydrogen electrode |
| LSV | Linear sweep voltammetry |
References
- Jiao, K.; Xuan, J.; Du, Q.; Bao, Z.; Xie, B.; Wang, B.; Zhao, Y.; Fan, L.; Wang, H.; Hou, Z.; et al. Designing the next Generation of Proton-Exchange Membrane Fuel Cells. Nature 2021, 595, 361–369. [Google Scholar] [CrossRef] [PubMed]
- Katsounaros, I.; Cherevko, S.; Zeradjanin, A.R.; Mayrhofer, K.J.J. Oxygen Electrochemistry as a Cornerstone for Sustainable Energy Conversion. Angew. Chem. Int. Ed. Engl. 2014, 53, 102–121. [Google Scholar] [CrossRef]
- Litster, S.; McLean, G. PEM Fuel Cell Electrodes. J. Power Sources 2004, 130, 61–76. [Google Scholar] [CrossRef]
- Kodama, K.; Nagai, T.; Kuwaki, A.; Jinnouchi, R.; Morimoto, Y. Challenges in Applying Highly Active Pt-Based Nanostructured Catalysts for Oxygen Reduction Reactions to Fuel Cell Vehicles. Nat. Nanotechnol. 2021, 16, 140–147. [Google Scholar] [CrossRef] [PubMed]
- Jung, N.; Chung, D.Y.; Ryu, J.; Yoo, S.J.; Sung, Y.E. Pt-Based Nanoarchitecture and Catalyst Design for Fuel Cell Applications. Nano Today 2014, 9, 433–456. [Google Scholar] [CrossRef]
- Shao, Y.; Yin, G.; Gao, Y. Understanding and Approaches for the Durability Issues of Pt-Based Catalysts for PEM Fuel Cell. J. Power Sources 2007, 171, 558–566. [Google Scholar] [CrossRef]
- Xu, S.; Kim, Y.; Park, J.; Higgins, D.; Shen, S.J.; Schindler, P.; Thian, D.; Provine, J.; Torgersen, J.; Graf, T.; et al. Extending the Limits of Pt/C Catalysts with Passivation-Gas-Incorporated Atomic Layer Deposition. Nat. Catal. 2018, 1, 624–630. [Google Scholar] [CrossRef]
- Meier, J.C.; Galeano, C.; Katsounaros, I.; Witte, J.; Bongard, H.J.; Topalov, A.A.; Baldizzone, C.; Mezzavilla, S.; Schüth, F.; Mayrhofer, K.J.J. Design Criteria for Stable Pt/C Fuel Cell Catalysts. Beilstein J. Nanotechnol. 2014, 5, 44–67. [Google Scholar] [CrossRef]
- Sandbeck, D.J.S.; Secher, N.M.; Inaba, M.; Quinson, J.; Sørensen, J.E.; Kibsgaard, J.; Zana, A.; Bizzotto, F.; Speck, F.D.; Paul, M.T.Y.; et al. The Dissolution Dilemma for Low Pt Loading Polymer Electrolyte Membrane Fuel Cell Catalysts. J. Electrochem. Soc. 2020, 167, 164501. [Google Scholar] [CrossRef]
- Sharma, R.; Gyergyek, S.; Chamier, J.; Morgen, P.; Andersen, S.M. Pt/C Electrocatalyst Durability Enhancement by Inhibition of Pt Nanoparticle Growth Through Microwave Pretreatment of Carbon Support. ChemElectroChem 2021, 8, 1183–1195. [Google Scholar] [CrossRef]
- Lu, Y.; Du, S.; Steinberger-Wilckens, R. One-Dimensional Nanostructured Electrocatalysts for Polymer Electrolyte Membrane Fuel Cells—A Review. Appl. Catal. B. 2016, 199, 292–314. [Google Scholar] [CrossRef]
- Zhang, Y.; Chen, S.; Wang, Y.; Ding, W.; Wu, R.; Li, L.; Qi, X.; Wei, Z. Study of the Degradation Mechanisms of Carbon-Supported Platinum Fuel Cells Catalyst via Different Accelerated Stress Test. J. Power Sources 2015, 273, 62–69. [Google Scholar] [CrossRef]
- Bertin, E.; Münzer, A.; Reichenberger, S.; Streubel, R.; Vinnay, T.; Wiggers, H.; Schulz, C.; Barcikowski, S.; Marzun, G. Durability Study of Platinum Nanoparticles Supported on Gas-Phase Synthesized Graphene in Oxygen Reduction Reaction Conditions. Appl. Surf. Sci. 2019, 467–468, 1181–1186. [Google Scholar] [CrossRef]
- Ohma, A.; Shinohara, K.; Iiyama, A.; Yoshida, T.; Daimaru, A. Membrane and Catalyst Performance Targets for Automotive Fuel Cells by FCCJ Membrane, Catalyst, MEA WG. ECS Trans. 2011, 41, 775–784. [Google Scholar] [CrossRef]
- Meier, J.C.; Galeano, C.; Katsounaros, I.; Topalov, A.A.; Kostka, A.; Schüth, F.; Mayrhofer, K.J.J. Degradation Mechanisms of Pt/C Fuel Cell Catalysts under Simulated Start-Stop Conditions. ACS Catal. 2012, 2, 832–843. [Google Scholar] [CrossRef]
- Đukić, T.; Pavko, L.; Jovanovič, P.; Maselj, N.; Gatalo, M.; Hodnik, N. Stability Challenges of Carbon-Supported Pt-Nanoalloys as Fuel Cell Oxygen Reduction Reaction Electrocatalysts. Chem. Commun. 2022, 58, 13832–13854. [Google Scholar] [CrossRef]
- Watanabe, M.; Yano, H.; Uchida, H.; Tryk, D.A. Achievement of Distinctively High Durability at Nanosized Pt Catalysts Supported on Carbon Black for Fuel Cell Cathodes. J. Electroanal. Chem. 2018, 819, 359–364. [Google Scholar] [CrossRef]
- Nagai, T.; Jahn, C.; Jia, H. Improved Accelerated Stress Tests for ORR Catalysts Using a Rotating Disk Electrode. J. Electrochem. Soc. 2019, 166, F3111–F3115. [Google Scholar] [CrossRef]
- Borup, R.L.; Kusoglu, A.; Neyerlin, K.C.; Mukundan, R.; Ahluwalia, R.K.; Cullen, D.A.; More, K.L.; Weber, A.Z.; Myers, D.J. Recent Developments in Catalyst-Related PEM Fuel Cell Durability. Curr. Opin. Electrochem. 2020, 21, 192–200. [Google Scholar] [CrossRef]
- Alekseenko, A.A.; Moguchikh, E.A.; Safronenko, O.I.; Guterman, V.E. Durability of De-Alloyed PtCu/C Electrocatalysts. Int. J. Hydrogen Energy 2018, 43, 22885–22895. [Google Scholar] [CrossRef]
- Kodama, K.; Jinnouchi, R.; Takahashi, N.; Murata, H.; Morimoto, Y. Activities and Stabilities of Au-Modified Stepped-Pt Single-Crystal Electrodes as Model Cathode Catalysts in Polymer Electrolyte Fuel Cells. J. Am. Chem. Soc. 2016, 138, 4194–4200. [Google Scholar] [CrossRef] [PubMed]
- Johnson Matthey. Available online: https://matthey.com/ (accessed on 28 April 2023).
- TANAKA Precious Metals. Available online: https://tanaka-preciousmetals.com/en/products/detail/PEFCs/?nav=func (accessed on 28 April 2023).
- Umicore. Available online: https://www.umicore.com/en/ (accessed on 28 April 2023).
- Pajarito Powder. Available online: https://pajaritopowder.com/ (accessed on 28 April 2023).
- BASF Catalysts. Available online: https://catalysts.basf.com/ (accessed on 28 April 2023).
- Heraeus Group. Available online: https://www.heraeus.com/en/group/home/home.html (accessed on 28 April 2023).
- Premetek.Com-Catalysts and Nanomaterials. Available online: http://premetek.com/ (accessed on 28 April 2023).
- PROMETEY RD LLC. Available online: https://www.prometheusrd.com/ (accessed on 28 April 2023).
- Gerasimova, I.; Belenov, S.; Lyanguzov, N.; Pankov, I.; Tolstunov, M.; Pavlets, A. Role of the Potential Range during Stress Testing of Platinum-Containing Electrocatalysts at Elevated Temperature. Catalysts 2022, 12, 1179. [Google Scholar] [CrossRef]
- Paulus, U.A.; Schmidt, T.J.; Gasteiger, H.A.; Behm, R.J. Oxygen Reduction on a High-Surface Area Pt/Vulcan Carbon Catalyst: A Thin-Film Rotating Ring-Disk Electrode Study. J. Electroanal. Chem. 2001, 495, 134–145. [Google Scholar] [CrossRef]
- Dutta, I.; Carpenter, M.K.; Balogh, M.P.; Ziegelbauer, J.M.; Moylan, T.E.; Atwan, M.H.; Irish, N.P. Electrochemical and Structural Study of a Chemically Dealloyed PtCu Oxygen Reduction Catalyst. J. Phys. Chem. C 2010, 114, 16309–16320. [Google Scholar] [CrossRef]
- Oezaslan, M.; Strasser, P. Activity of Dealloyed PtCo3 and PtCu3 Nanoparticle Electrocatalyst for Oxygen Reduction Reaction in Polymer Electrolyte Membrane Fuel Cell. J. Power Sources 2011, 196, 5240–5249. [Google Scholar] [CrossRef]
- Guterman, V.E.; Belenov, S.V.; Alekseenko, A.A.; Lin, R.; Tabachkova, N.Y.; Safronenko, O.I. Activity and Stability of Pt/C and Pt-Cu/C Electrocatalysts. Electrocatalysis 2018, 9, 550–562. [Google Scholar] [CrossRef]
- Paperzh, K.O.; Alekseenko, A.A.; Volochaev, V.A.; Pankov, I.V.; Safronenko, O.A.; Guterman, V.E. Stability and Activity of Platinum Nanoparticles in the Oxygen Electroreduction Reaction: Is Size or Uniformity of Primary Importance? Beilstein J. Nanotechnol. 2021, 12, 593–606. [Google Scholar] [CrossRef]
- Riese, A.; Banham, D.; Ye, S.; Sun, X. Accelerated Stress Testing by Rotating Disk Electrode for Carbon Corrosion in Fuel Cell Catalyst Supports. J. Electrochem. Soc. 2015, 162, F783–F788. [Google Scholar] [CrossRef]
- Liu, Z.Y.; Zhang, J.L.; Yu, P.T.; Zhang, J.X.; Makharia, R.; More, K.L.; Stach, E.A. Transmission Electron Microscopy Observation of Corrosion Behaviors of Platinized Carbon Blacks under Thermal and Electrochemical Conditions. J. Electrochem. Soc. 2010, 157, B906. [Google Scholar] [CrossRef]
- Pushkareva, I.V.; Pushkarev, A.S.; Kalinichenko, V.N.; Chumakov, R.G.; Soloviev, M.A.; Liang, Y.; Millet, P.; Grigoriev, S.A. Reduced Graphene Oxide-Supported Pt-Based Catalysts for PEM Fuel Cells with Enhanced Activity and Stability. Catalysts 2021, 11, 256. [Google Scholar] [CrossRef]
Figure 1.
Cyclic voltammograms for JM20 and JM40 during the development stage (100 cycles) (a), (b) and after the surface standardization (c), the electrolyte is 0.1 M HClO4, in an Ar atmosphere, the potential sweep rate is 100 mV/s (a,b) and 20 mV/s (c); the Koutetsky–Levich dependence at the potential of 0.90 V (d).

Figure 2.
The charge amount transmitted through the catalyst during the stress testing (a); the ESA and mass activity values of the Pt/C catalysts after the stress testing (b).
Figure 2.
The charge amount transmitted through the catalyst during the stress testing (a); the ESA and mass activity values of the Pt/C catalysts after the stress testing (b).

Figure 3.
Linear sweep voltammograms of the ORR before and after the stress testing: (a,b) JM20; (c,d) JM40. The RDE rotation speed was 1600 rpm; the potential sweep rate was 20 mV/s; the 0.1 M HClO4 solution was saturated with O2 at atmospheric pressure.
Figure 3.
Linear sweep voltammograms of the ORR before and after the stress testing: (a,b) JM20; (c,d) JM40. The RDE rotation speed was 1600 rpm; the potential sweep rate was 20 mV/s; the 0.1 M HClO4 solution was saturated with O2 at atmospheric pressure.

Figure 4.
Tafel slopes for (a) JM20 and (b) JM40 before and after the stress testing.

Figure 5.
TEM micrographs for JM20 (a–c), JM20 after ST-Ar (d–f), and JM20 after ST-O2 (g–i). Histograms of the NPs’ size distribution for the corresponding materials.
Figure 5.
TEM micrographs for JM20 (a–c), JM20 after ST-Ar (d–f), and JM20 after ST-O2 (g–i). Histograms of the NPs’ size distribution for the corresponding materials.

Figure 6.
TEM micrographs for JM40 (a–c), JM40 after ST-Ar (d–f), and JM40 after ST-O2 (g–i). Histograms of the NPs’ size distribution for the corresponding materials.
Figure 6.
TEM micrographs for JM40 (a–c), JM40 after ST-Ar (d–f), and JM40 after ST-O2 (g–i). Histograms of the NPs’ size distribution for the corresponding materials.

Figure 7.
Histograms of the change in the average size of NPs for the electrocatalysts as a result of the stress testing: (a) JM20 and (b) JM40.
Figure 7.
Histograms of the change in the average size of NPs for the electrocatalysts as a result of the stress testing: (a) JM20 and (b) JM40.

Figure 8.
Histograms illustrate the NPs’ distribution by the number of intersections with their “neighbors” (in the initial state and after the stress testing). The proportion of NPs in the initial state (black color), after ST-Ar (dark gray color), and after ST-O2 (pink color) for the JM20 (a) and JM40 (b) samples.


Table 1.
Electrochemical activity of JM20 and JM40 before and after the ADT in the electrolyte saturated with Ar or O2.
Table 1.
Electrochemical activity of JM20 and JM40 before and after the ADT in the electrolyte saturated with Ar or O2.
| Conditions | JM20 | JM40 | ||||||
|---|---|---|---|---|---|---|---|---|
| ESA, m2/g(Pt) | E1/2, V | Ik, mA; | I, A;/g(Pt) | ESA, m2/g(Pt) | E1/2, V | Ik, mA; | I, A;/g(Pt) | |
| Initial | 84 | 0.91 | 1.24 | 254 | 56 | 0.90 | 0.9 | 159 |
| After ST-Ar | 56 | 0.89 | 0.68 | 152 | 43 | 0.87 | 0.63 | 108 |
| After ST-O2 | 48 | 0.87 | 0.51 | 108 | 46 | 0.87 | 0.67 | 135 |
Disclaimer/Publisher’s Note: The statements, opinions and data contained in all publications are solely those of the individual author(s) and contributor(s) and not of MDPI and/or the editor(s). MDPI and/or the editor(s) disclaim responsibility for any injury to people or property resulting from any ideas, methods, instructions or products referred to in the content. |
© 2023 by the authors. Licensee MDPI, Basel, Switzerland. This article is an open access article distributed under the terms and conditions of the Creative Commons Attribution (CC BY) license (https://creativecommons.org/licenses/by/4.0/).
Share and Cite
MDPI and ACS Style
Moguchikh, E.; Paperzh, K.; Pankov, I.; Belenov, S.; Alekseenko, A. Durability of Commercial Catalysts within Relevant Stress Testing Protocols. Catalysts 2023, 13, 923. https://doi.org/10.3390/catal13060923
AMA Style
Moguchikh E, Paperzh K, Pankov I, Belenov S, Alekseenko A. Durability of Commercial Catalysts within Relevant Stress Testing Protocols. Catalysts. 2023; 13(6):923. https://doi.org/10.3390/catal13060923
Chicago/Turabian StyleMoguchikh, Elizaveta, Kirill Paperzh, Ilya Pankov, Sergey Belenov, and Anastasia Alekseenko. 2023. "Durability of Commercial Catalysts within Relevant Stress Testing Protocols" Catalysts 13, no. 6: 923. https://doi.org/10.3390/catal13060923
Note that from the first issue of 2016, this journal uses article numbers instead of page numbers. See further details here.