Article

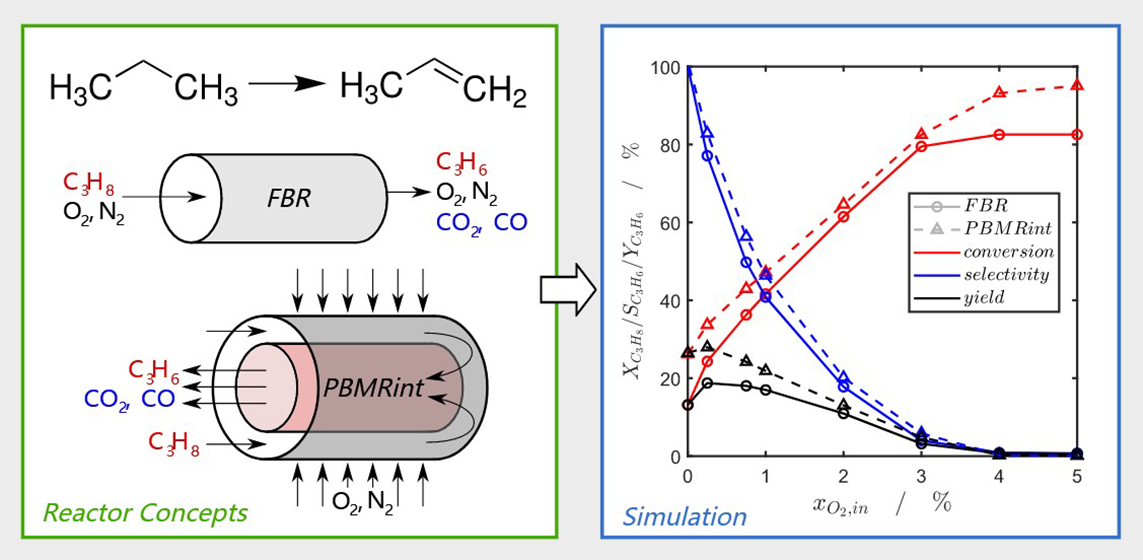
Process Intensification of the Propane Dehydrogenation Considering Coke Formation, Catalyst Deactivation and Regeneration—Transient Modelling and Analysis of a Heat-Integrated Membrane Reactor

by
Jan P. Walter
1,*,
Andreas Brune
1,2,
Andreas Seidel-Morgenstern
1,3 and
Christof Hamel
1,2
1
Institute of Process Engineering, Otto von Guericke University Magdeburg, Universitätsplatz 2, 39106 Magdeburg, Germany
2
Department of Applied Biosciences and Process Engineering, Anhalt University of Applied Sciences, Bernburger Straße 55, 06354 Köthen, Germany
3
Max Planck Institute for Dynamics of Complex Technical Systems, Sandtorstraße 1, 39106 Magdeburg, Germany
*
Author to whom correspondence should be addressed.
Catalysts 2021, 11(9), 1056; https://doi.org/10.3390/catal11091056
Submission received: 26 July 2021 / Revised: 25 August 2021 / Accepted: 25 August 2021 / Published: 31 August 2021
(This article belongs to the Special Issue Catalytic Process Intensification for Green Chemistry)

Abstract

:
A heat-integrated packed-bed membrane reactor is studied based on detailed, transient 2D models for coupling oxidative and thermal propane dehydrogenation in one apparatus. The reactor is structured in two telescoped reaction zones to figure out the potential of mass and heat integration between the exothermic oxidative propane dehydrogenation (ODH) in the shell side, including membrane-assisted oxygen dosing and the endothermic, high selective thermal propane dehydrogenation (TDH) in the inner core. The developing complex concentration, temperature and velocity fields are studied, taking into account simultaneous coke growth corresponding with a loss of catalyst activity. Furthermore, the catalyst regeneration was included in the simulation in order to perform an analysis of a periodic operating system of deactivation and regeneration periods. The coupling of the two reaction chambers in a new type of membrane reactor offers potential at oxygen shortage and significantly improves the achievable propene yield in comparison with fixed bed and well-established membrane reactors in the distributor configuration without inner mass and heat integration. The methods developed allow an overall process optimization with respect to maximum spacetime yield as a function of production and regeneration times.

Graphical Abstract

1. Introduction

To reduce global warming, chemical processes have to be improved in efficiency and sustainability, also known as the topic of green chemistry [1]. The efficiency of chemical processes is limited, e.g., by conversion, selectivity or the demand of heat due to the thermodynamic equilibrium, catalyst deactivation, series and parallel reactions or high activation energies, respectively [2,3,4]. To overcome these limitations new feedstocks, process optimization and process intensification should be taken into account considering the catalyst, operating parameters such as temperature and concentrations and in particular multifunctional reactor concepts [4,5,6,7,8,9,10].
This contribution focuses on the efficient production of propene as a main building block in the chemical industry, e.g., for the production of polypropylene, acronitrile, propylene oxide and cumene [11]. Currently, the main propene production processes are steam cracking (SC, without catalyst [12]) and the fluid catalytic cracking (FCC, with a ZSM-5 zeolite [13]) [11]. Due to a raising gap between the production capacity and the demand of propene during the last decades [14], on-purpose technologies are of increasing interest, in particular thermal propane dehydrogenation (TDH) [11]. During highly selective endothermic ( Δ H R 0 = 124   kJ / mol ) thermal propane dehydrogenation processes (TDH), e.g., the Catofin process, rapid coke growth and accordingly catalyst deactivation occurs [15,16,17]. Thus, a periodic catalyst regeneration is necessary, reducing space-time yield and productivity. To avoid coke formation, various approaches are studied, such as the co-feed of hydrogen and steam, the structure and size of the active catalyst component, the effect of the catalyst promoter and the modification of the catalyst support [18]. In this contribution, the focus lays on the exothermic ( Δ H R 0 = 118   kJ / mol ) oxidative propane dehydrogenation with oxygen (ODH), since present oxygen depresses coking. One of the major efforts in the research field of the ODH is to find capable reactor concepts to reach high propene selectivity at high propane conversion [19,20,21], since undesired series oxidations of propene occur, as can be seen in the derived reaction network, presented in Figure 1a [17,22]. The model catalyst used in the performed experiments is V O x / Al 2 O 3 with 1.4% V [23,24,25]. In comparison with a conventional fixed-bed reactor (FBR, Figure 1b) a packed-bed membrane reactor (PBMR, Figure 1b) in distributor configuration offers potential by coupling compound dosing (e.g., oxygen) and chemical reaction, since the propene yield can be increased up to 7% due to higher propene selectivity caused by locally lowered oxygen concentrations [22,23]. To combine the advantages of TDH (high selectivity) and ODH (exothermic, high conversion, depressing coke formation), a heat-integrated membrane reactor concept with an internal flow reversal (PBMRint, Figure 1c) is developed, applying process intensification in a new highly integrated multifunctional reactor. The PBMRint is separated into two telescoped reaction chambers: the shell-side with membrane flow for distributed oxygen dosing for the ODH and the tube-side for highly selective TDH. The local oxygen concentrations are kept low by the distributed dosing along the reactor. Oxygen should be completely consumed at the outlet of the shell-side. Thus, in the tube-side TDH mainly occurs due to the absence of oxygen, consuming non-converted propane by ODH in the shell-side. The released heat of reaction by ODH is transferred directly by heat conduction and convection to the tube-side, supporting the endothermic TDH in one apparatus. Thus, the process efficiency can be improved by increasing the propene yield.
The aim of this study is to apply the concept of the PBMRint to the ODH of propane. The selected reactor geometry is based on an experimental setup, which is shown in detail in Section 3, Modelling. To study and evaluate suitable reaction conditions for high propene selectivity and yield, detailed 2D simulations of the PBMRint are carried out initially in a steady-state operating mode. The results are compared with model-based investigations of the FBR and the PBMR to figure out the potential of coupled ODH and TDH by heat integration in one apparatus with two separated reaction chambers. Additionally, instructive studies of the PBMRint are conducted considering detailed coke growth kinetics and an approach to describe the activity–time relationship in transient simulations for an evaluation of the developed PBMRint.

2. Results and Discussion

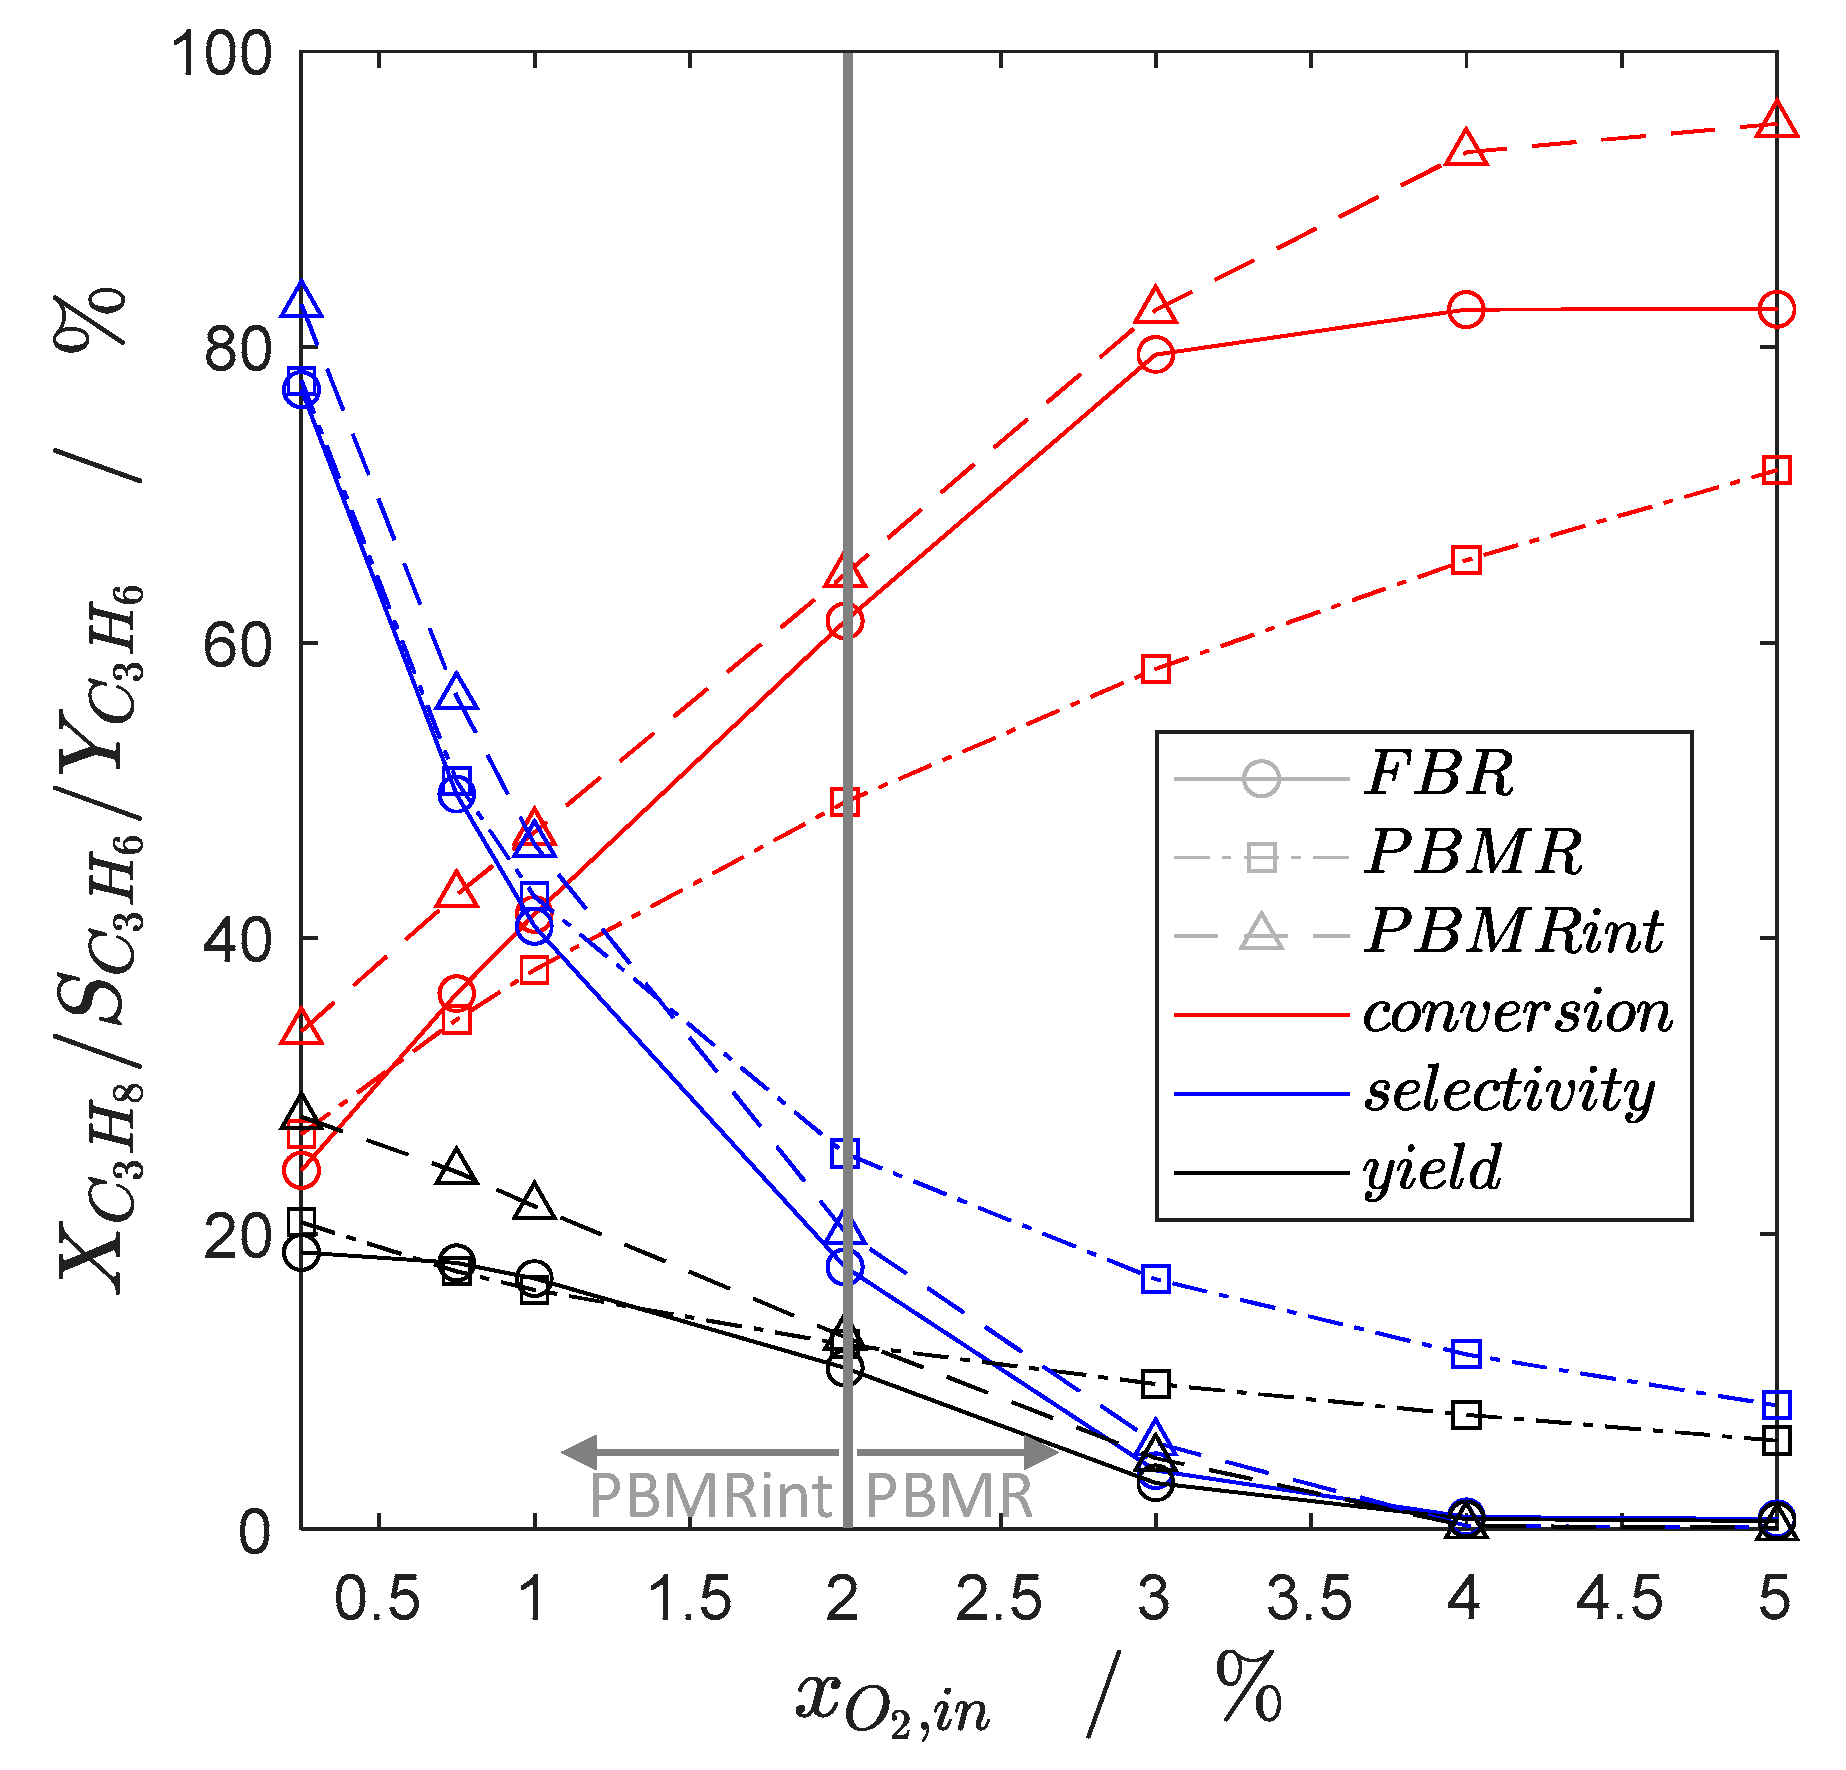
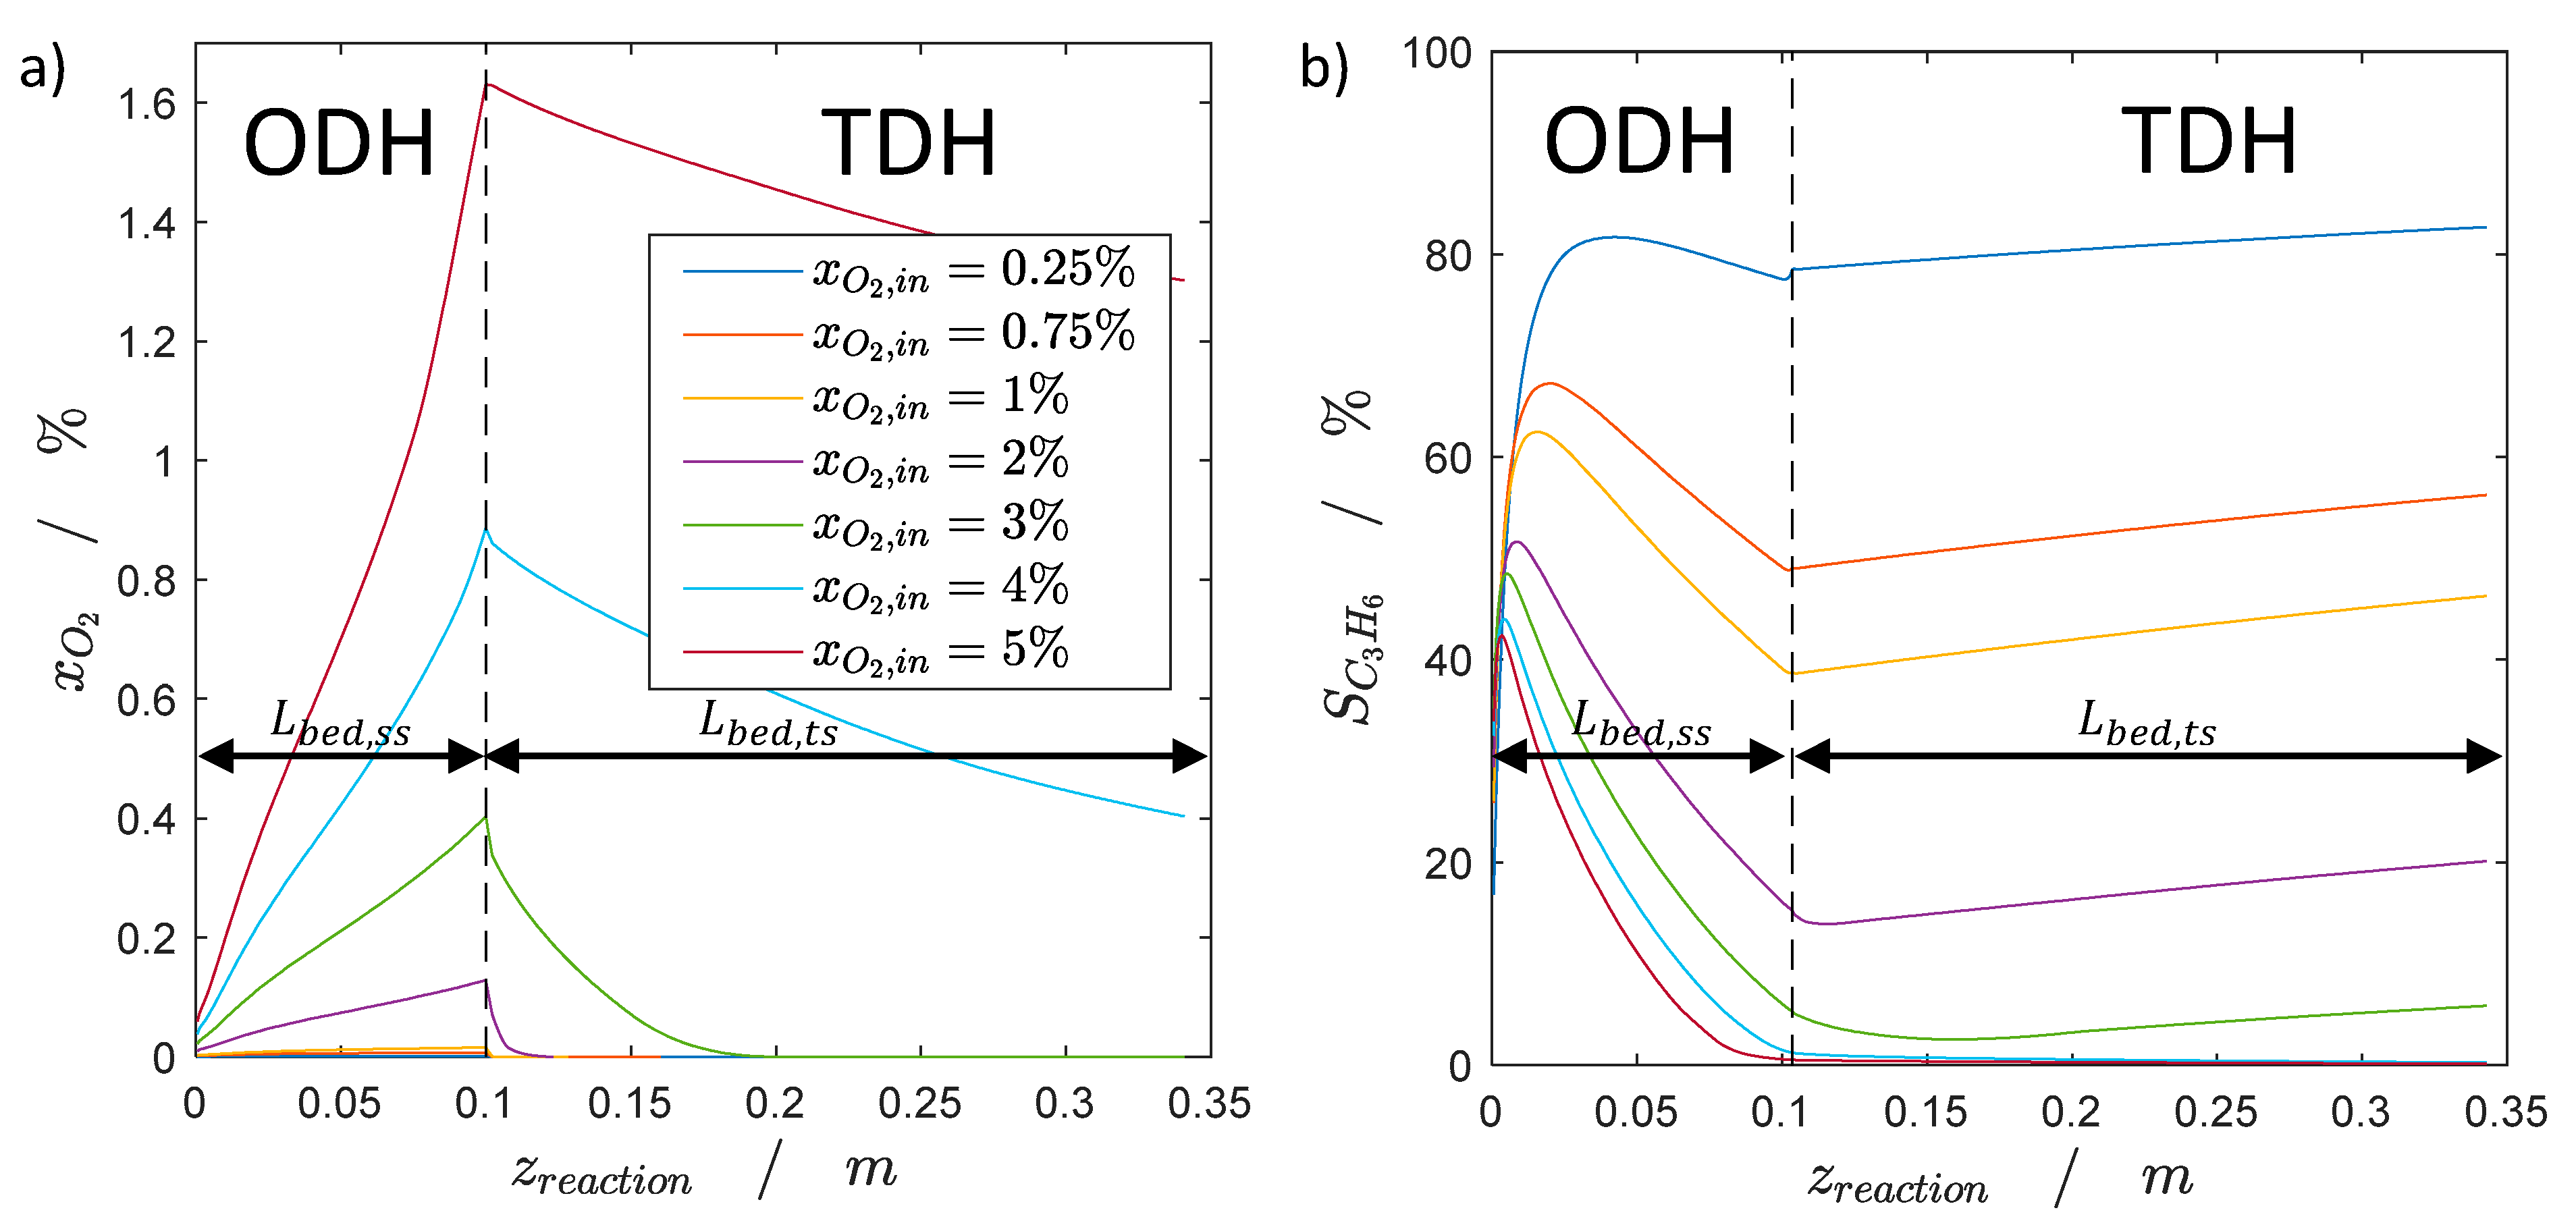
2.1. Steady-State Simulation Studies

Detailed steady-state 2D simulations are conducted to investigate suitable oxygen inlet concentrations with respect to propane conversion and propene selectivity. The propane conversion increases at high oxygen concentrations, but low oxygen concentrations lead to improved propene selectivity. Furthermore, the interaction between the oxygen concentration and the local hot spot formation is analyzed to evaluate the potential of a forced TDH in the tube-side by heat integration in the PBMRint at various oxygen inlet concentrations. To achieve comparability with previous results for the FBR and the PBMR, the wall temperature ( T W ), the inlet temperature ( T in ), the weight hourly space velocity (WHSV = m c a t , s s V · ) and the inlet concentration of propane ( x C 3 H 8 , i n ) are constant for all simulations performed [22]. The reactor operating conditions are summarized in Table 1. The concept design and the detailed geometry are given in Figure 14 (Section 3, Modelling).
The concentration of oxygen dosed in co-feed mode (FBR) or by distributed dosing (PBMR, PBMRint) is varied between x O 2 , i n = 0.25 % 5 % . The key performance indicators (propane conversion ( X C 3 H 8 ), propene selectivity ( S C 3 H 6 ) and propene yield ( Y C 3 H 6 )) are illustrated and compared in Figure 2.
The maximum yield of each reactor type is reached at an inlet concentration of x O 2 , i n = 0.25 % due to the highest selectivity. The significant best performance at oxygen shortage reveals the PBMRint with a maximum yield of propene of about 28%, compared with the PBMR (21%) and the FBR (18%). At conditions of oxygen excess, the PBMR outperforms the PBMRint and the FBR. The reasons are a locally high oxygen concentration in the FBR and unconsumed oxygen by ODH ( R 1 ) in the shell-side of the PBMRint. The unconsumed oxygen penetrates into the tube-side, promoting series oxidations of propene ( R 2 , R 3 ), which proceed instead of the desired highly selective TDH ( R 5 ) (Figure 3a).
The reaction chamber of the shell-side is smaller than the reaction chamber of the tube-side, as can be recognized in Figure 3a,b (see also the geometry in Figure 14, Section 3, Modelling). It can be seen in Figure 3b that the locally highest propene selectivity is obtained close to the inlet of the shell-side, since the propane concentration is at the inlet maximal, and the membrane-assisted dosed oxygen concentration is low. Hence, the main reaction in this region is the highly selective TDH. The selectivity decreases with an increasing oxygen concentration over the reactor length by series oxidations ( R 2 , R 3 ). At oxygen excess ( x O 2 , i n     2 % ) the propene selectivity at the inlet of the tube-side further decreases according to the unconsumed oxygen in the shell-side. This leads to series oxidations of propene and thus to the formation of significant hot spots in the tube-side (Figure 4), since the height and local hot spot position strongly depend on the local oxygen concentration and resulting reaction rates, as the 2D simulations reveal.
With respect to the heat integration, the previously discussed results show that it is senseful to operate the PBMRint with an oxygen/propane inlet ratio up to one ( x O 2 , i n / x C 3 H 8 , i n     1 ). Due to the absence of oxygen in the tube-side (Figure 3a) and the endothermic heat of reaction of TDH ( Δ H R   0 = 124   kJ / mol ), the temperature in the tube-side would decrease, as can be recognized in Figure 5 at z = 0.05 m. Furthermore, Figure 5 depicts that the temperatures in the shell- and the tube-side increase and that the hot spots are nearly at the same axial position with the higher temperature in the shell-side. Thus, the internal heat integration between both reaction chambers takes place with the beneficial direction, supporting TDH in the tube-side. Since the heat coupling is more pronounced at higher oxygen concentrations due to higher reaction rates, and thus more released heat of reactions in the shell-side, an oxygen inlet concentration of 1% is favorable.
Consequently, the steady-state simulations show a significant potential of the PBMRint at suitable oxygen inlet concentrations ( x O 2 , i n     1 % ) with the best performance of heat integration by avoiding series oxidations in the tube-side at x O 2 , i n = 1 % .
Nevertheless, the studied inlet concentration of propane ( x C 3 H 8 , i n = 1 % ) will lead to large reactor volumes in the case of an industrial application. The inlet concentration is chosen due to the lower explosion limit of propane [26], which has to be considered in further experimental validations, what is difficult for a comparison between the performance of the PBMRint and industrially established processes. Furthermore, the hot spot temperatures in the shell-side and thus the transferred heat to the tube-side are small at the used reaction conditions. In the case of suitable safety concepts, the reactor could be operated at higher propane and oxygen concentrations, leading to a more pronounced effect of the heat integration and smaller required reactor volumes. Consequently, the studied reactor concept is currently in a research state. Overcoming these limitations will lead to a competitive reaction (ODH) to the industrially established TDH process, since the potential of heat integration is proofed by the achieved results of this study.
Due to the complex correlations between the oxygen and temperature field and the resulting reaction rates, detailed 2D simulations are required to highlight this potential. As described in the introduction, the main disadvantage of TDH is a rapid catalyst coking, which is primarily based on propene as precursor [17]. Due to forced TDH in the tube-side at the absence of oxygen, coke formation and catalyst deactivation have to be considered by applying an activity function a(t) in transient simulations.

2.2. Transient Simulation Studies

The aim of the transient simulations is to get a deeper understanding of the influence of concentration, temperature and velocity profiles on local coke formation and catalyst deactivation, considering distributed dosing in membrane reactors. Furthermore, the impact of catalyst activity on the key performance indicators, the hot spot positions and thus the applicability of the heat integration are analyzed. Therefore, the derived models for coke formation (Equation (18)) and catalyst activity (Equation (25)) are implemented into the 2D models, corresponding to the scheme shown in Figure 16 (see Section 3, Modelling). Finally, the regeneration of the coked catalyst is model-based investigated to figure out necessary regeneration times for a complete coke burning. These results provide the basis for overall process optimizations with respect to space-time yield, including production/deactivation periods as well as regeneration/reactivation periods by applying a coke-based catalyst activity.

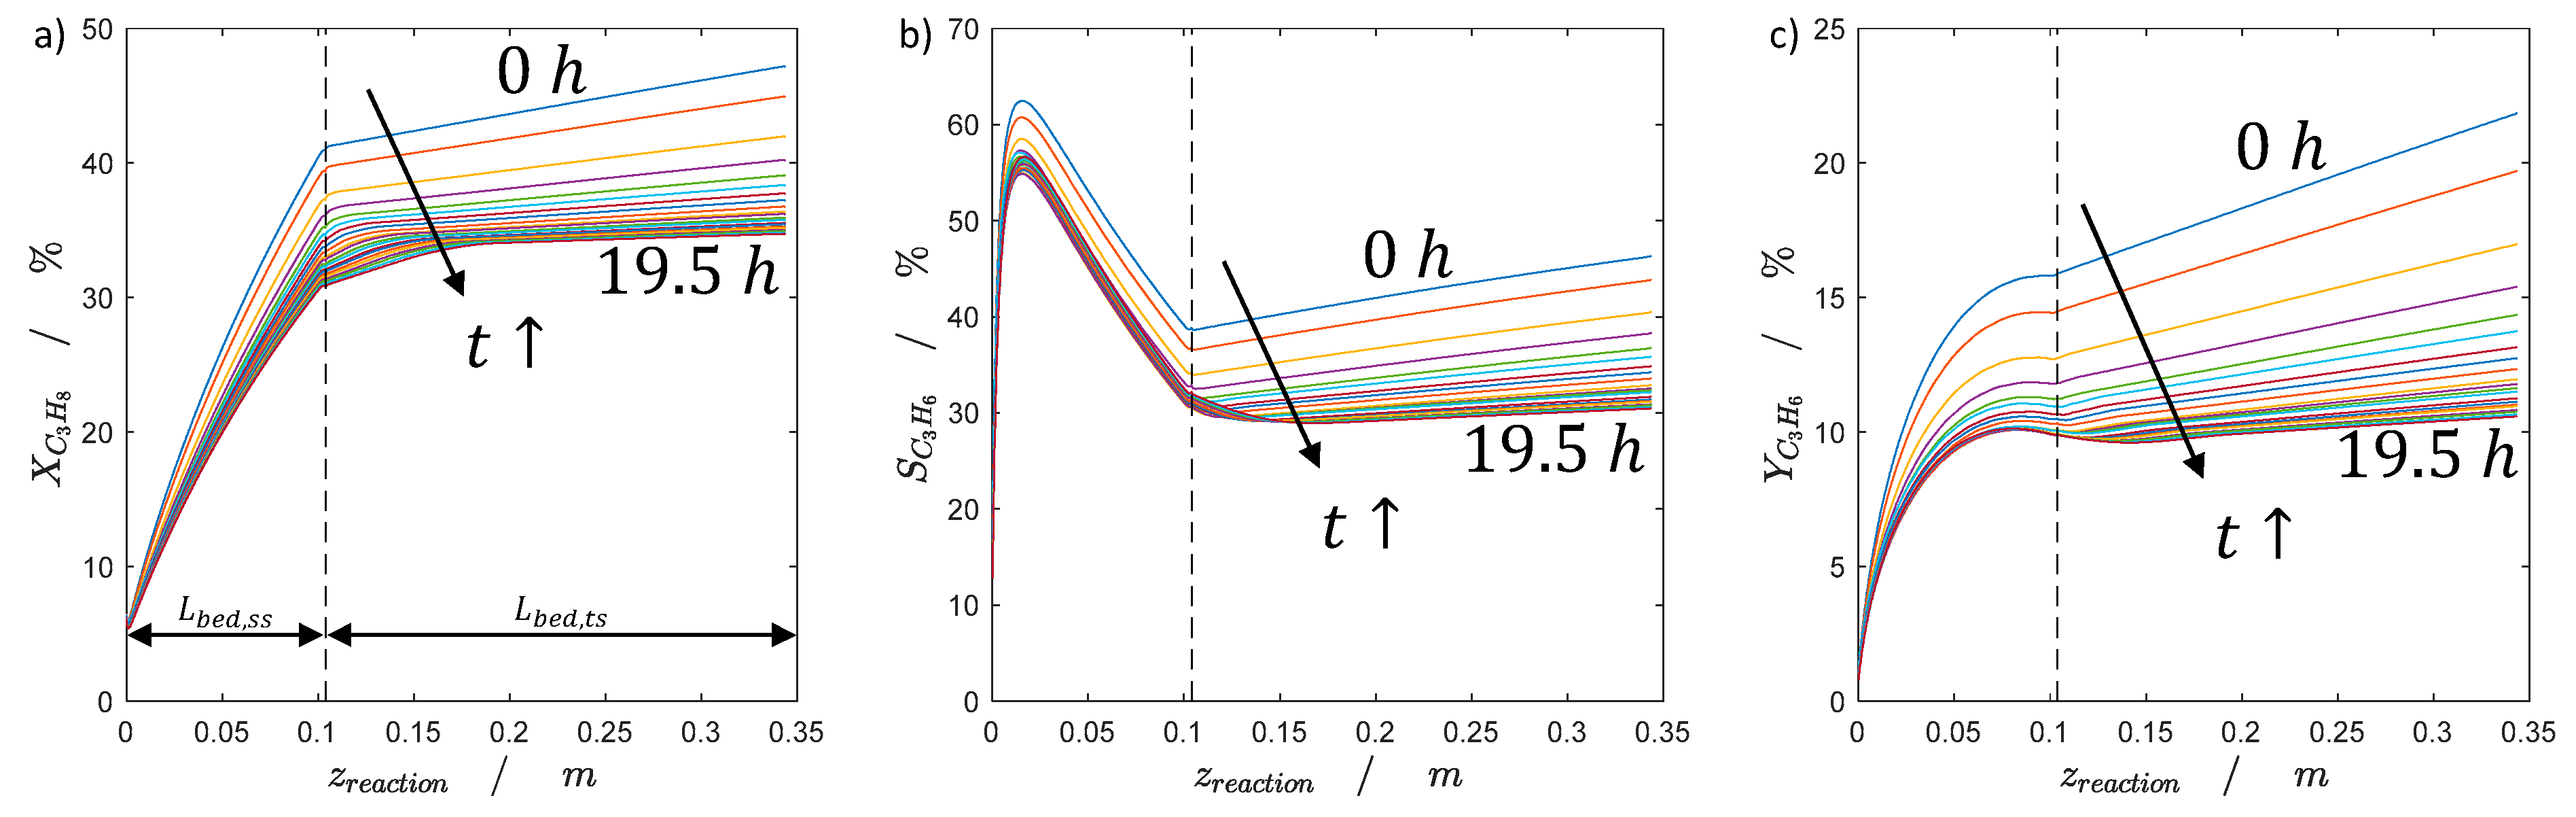
2.2.1. Catalyst Coking and Deactivation

The catalyst coking and deactivation is investigated in a long-term case study over a process time of up to t = 20   h , corresponding to the scheme of Figure 19. Since the results of the steady-state simulations revealed that x O 2 , i n   = 1 % is the favorable condition with respect to heat integration and avoiding series oxidations, it is applied in this case study of the PBMRint. Other operating conditions are identical to those used for the steady-state simulations ( x C 3 H 8 , i n = 1 % ,   T W = T in = 600   ° C , WHSV = 400   kg s m 3 ). The resulting activity–time relationship a(t) based on the reaction conditions is illustrated in Figure 6 (see Section 3.3.2).
The results of the transient 2D long-term simulations after t = 1, 10, 20 h are summarized in Figure 7. It can be seen that the oxygen concentration inside the catalyst-bed of the shell-side (ODH) increases significantly over time due to the decreasing catalyst activity and reduced reaction rates (Figure 7a). Hence, a lowered oxygen consumption into the shell-side results in higher oxygen concentrations and a deeper oxygen penetration into the shell-side (ODH) and the tube-side (TDH). Thus, the formed propene decreases over time due to series oxidations, which occur at higher oxygen concentrations (Figure 7b).
The highest propene concentrations occur at the beginning of the shell-side, since the local oxygen concentration is low and the propane concentration is high. The coke profiles correspond to the propene profiles, since propene is the precursor of coke formation [17] (see Section 3.3.1). Thus, the highest coke concentrations occur in the center of the shell-side caused by the high local propene concentrations, which result due to the radially limited oxygen by distributed dosing via membrane (Figure 7c). Furthermore, it can be seen that the coke concentration firstly increases in regions with an absence of oxygen (between t = 1   h and t = 10   h ) and later decreases (between t = 10   h and t = 20   h ) due to the deeper penetration of oxygen into these regions, leading to higher oxygen concentrations and thus to increased coke burning. The deeper oxygen penetration also leads to an unwanted shift of the hot spot from the shell-side into the tube-side. Thus, a negative effect of the applied heat integration can be observed, as shown in Figure 8 and Figure 9.
As clearly shown in Figure 8, the hot spot location shifts between t = 3.5   h and t = 4.5   h from the shell-side into the tube-side. This leads to a negative effect of the heat integration, since the heat transfer occurs from the tube-side to the shell-side due to higher temperatures in the tube-side, as shown in Figure 9.
As can be recognized in Figure 9, the temperature in the tube-side at t = 19.5   h is significantly higher, as in the shell-side, due to the deeper penetration of oxygen into the tube-side, forcing series oxidations of propene. This leads to a decreasing propene selectivity (see Figure 10). Hence, the production period should be stopped between t = 3.5   h and t = 4.5   h to regenerate the catalyst, since the aim of the PBMRint is a forced TDH in the tube-side by heat integration. In order to analyze the reactor performance in dependency of a temporal decreasing catalyst activity, the key performance indicators of the case study are shown in Figure 10.
Based on Figure 10, it can be recognized that the propane conversion decreases over time due to temporal lower catalyst activity and thus lower reaction rates. Furthermore, it can be seen that the propene selectivity decreases over time too. This can be explained by higher oxygen concentrations, which force the series oxidations of propene. As a result of the lowered propane conversion and propene selectivity, the propene yield decreases. Results obtained for lower oxygen inlet concentrations ( x O 2 , i n = 0.25 % ,   0.75 % ) are shown in Figure 11. Since the previous results with x O 2 , i n = 1 %   revealed that it is beneficial to regenerate the catalyst after t     3.5   h instead of further producing, entailing coking and catalyst deactivation, the simulation studies with x O 2 , i n = 0.25 % ,   0.75 % are stopped after t     3.5   h . Furthermore, the previous results underline the requirement of detailed transient 2D simulations due to the high complexity based on the catalyst deactivation. The lower catalyst activity leads to decreasing reaction rates, with the consequence of increasing oxygen concentrations and shifting hot spot locations. All of these influence the performance of the PBMRint and can be determined only by a temporal and spatial (r, z) resolution of the reactor.
Figure 11 depicts that at the higher oxygen inlet concentration ( x O 2 , i n = 0.75 % ), higher propane conversion occurs due to more available oxygen for ODH, leading also to lower propene selectivity caused by series oxidations. In comparison, the selectivity at the lower oxygen inlet concentration ( x O 2 , i n = 0.25 % ) is higher due to a more pronounced radial limitation of the dosed oxygen via membrane, thus, more TDH occurs, leading to lower propane conversion. However, as a result of the significant higher selectivity the resulting yield of propane is initially also higher at x O 2 , i n = 0.25 % . Since more TDH takes place in the case of x O 2 , i n   = 0.25 % , the catalyst deactivation is faster, leading to a loss of conversion of about 12% during the production period of t = 3.5   h . In the case of x O 2 , i n = 0.75 % , the loss of conversion is lower ( 7%) due to a reduced catalyst deactivation. The selectivity decreases in both cases in a range of about 7%; thus, the difference in the speed of deactivation and resulting propane conversions leads to nearly equal propene yield after t = 3.5   h of about 16%.

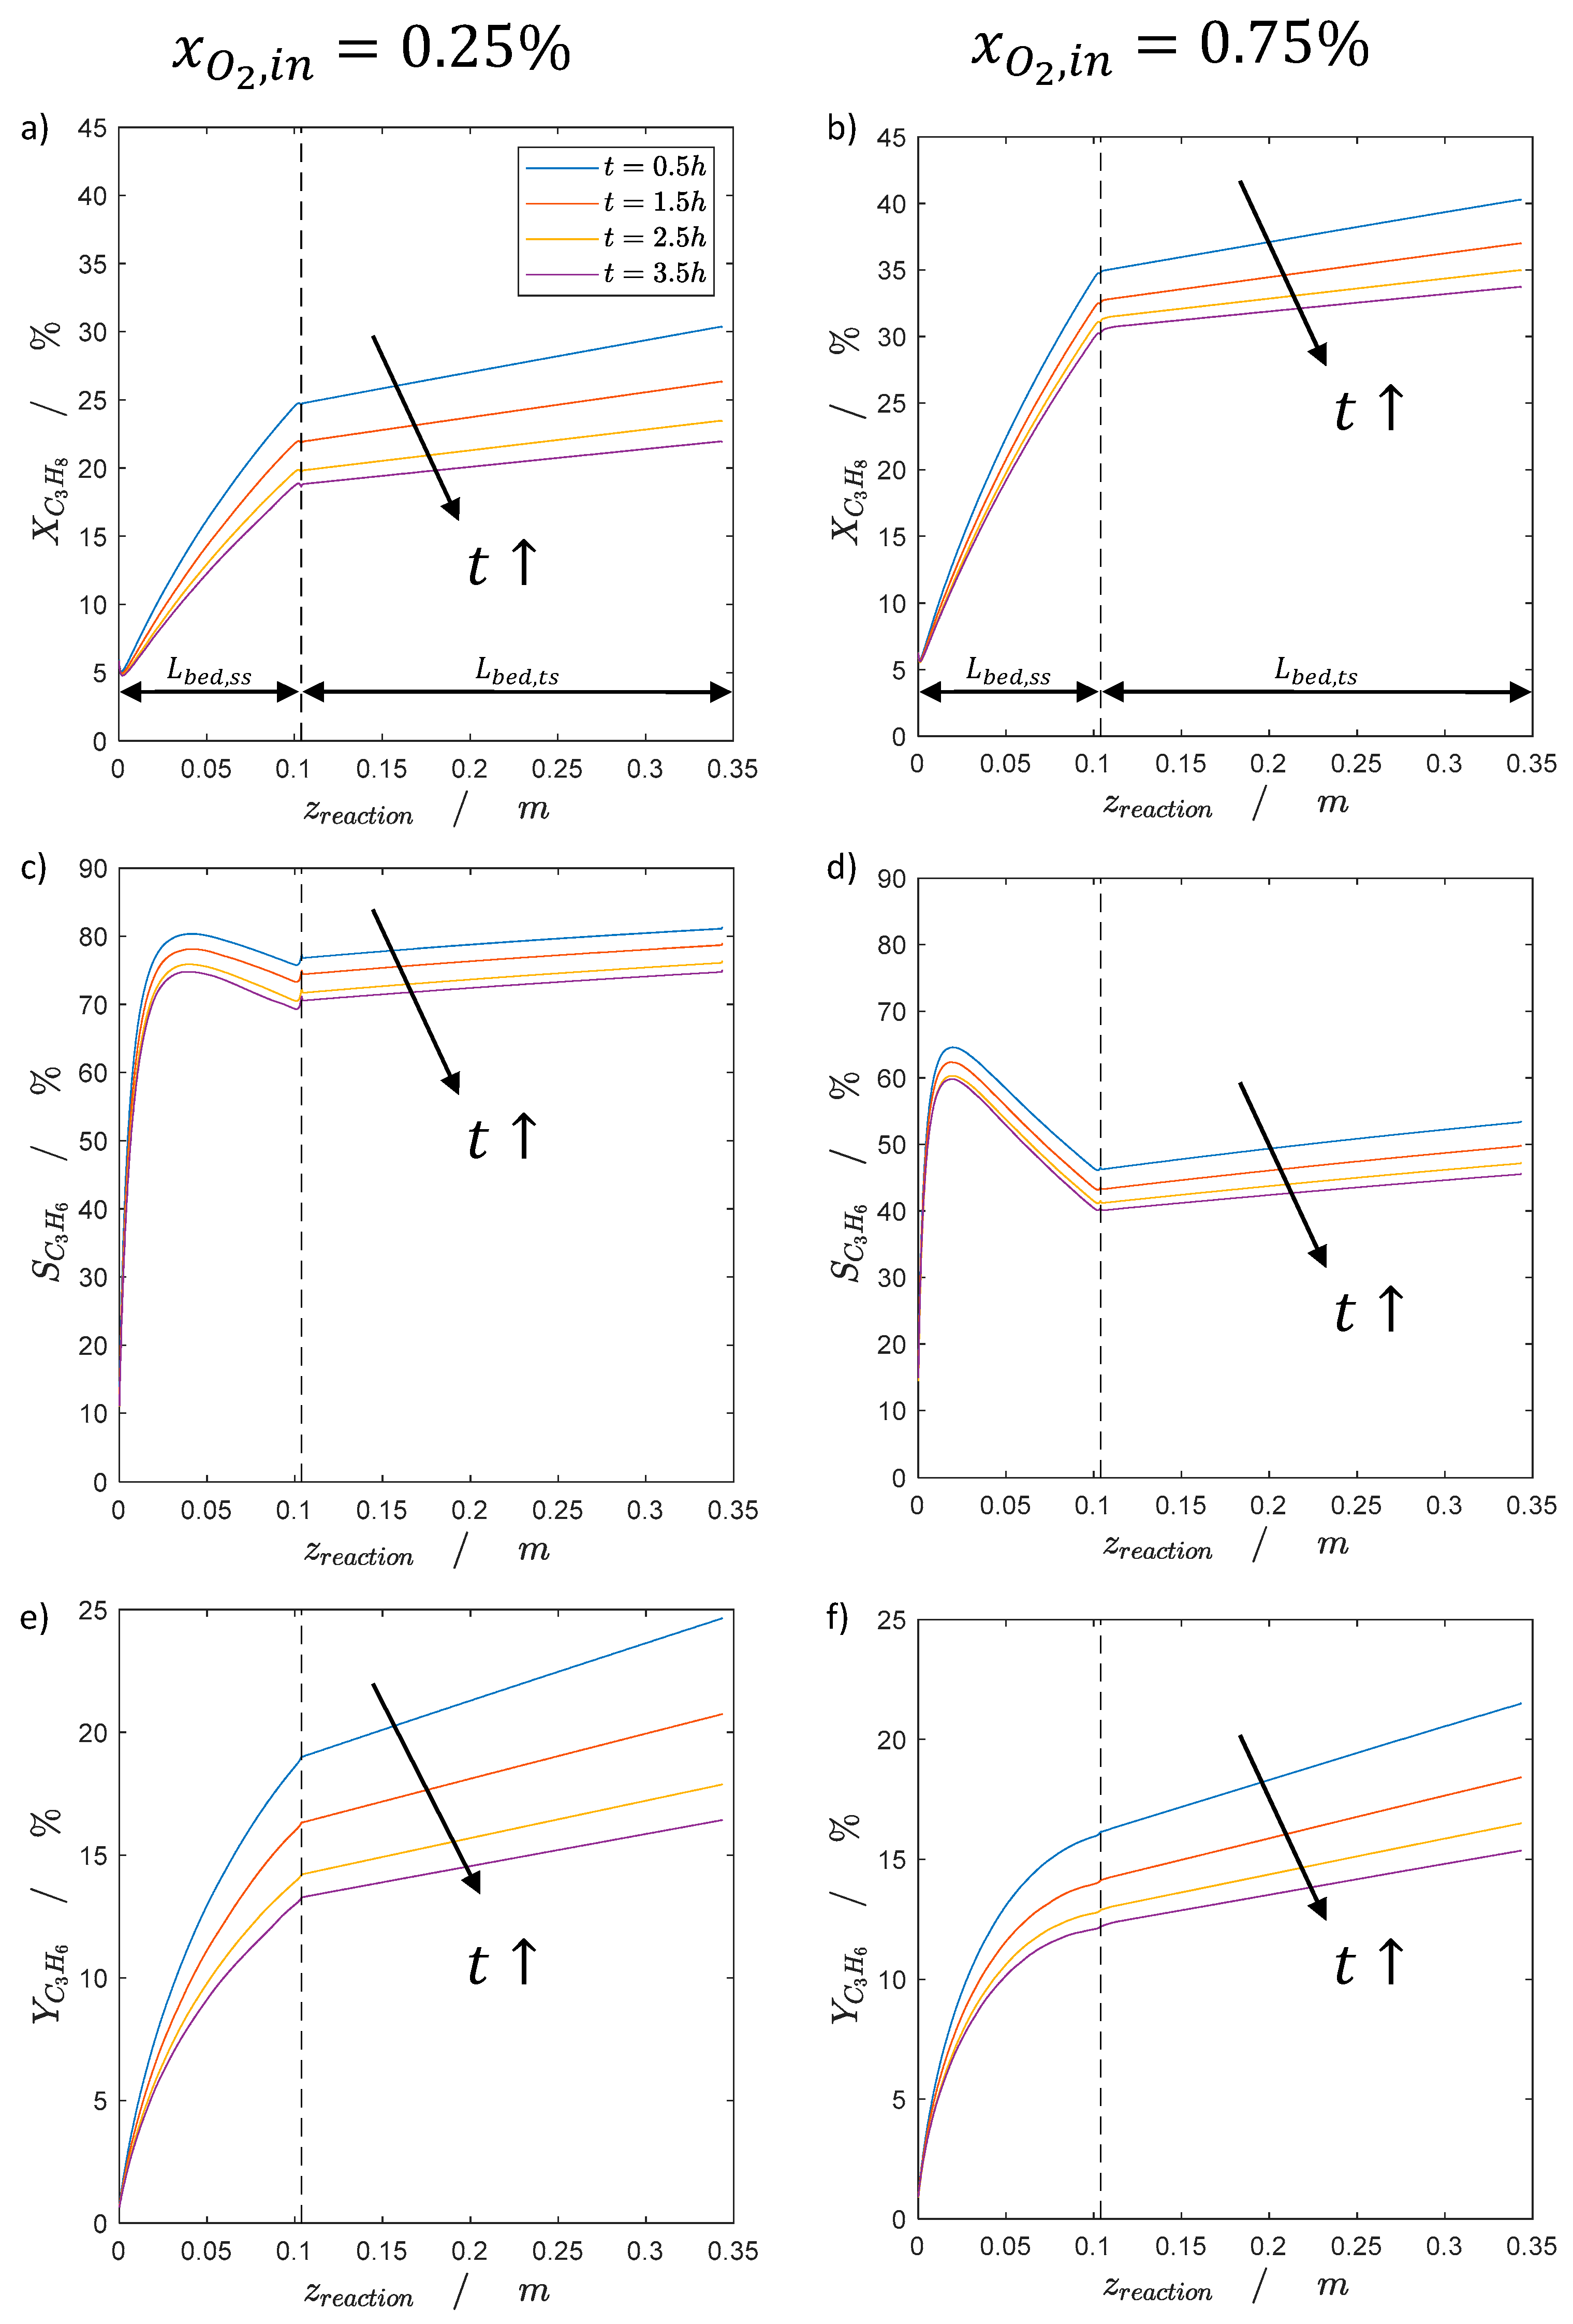
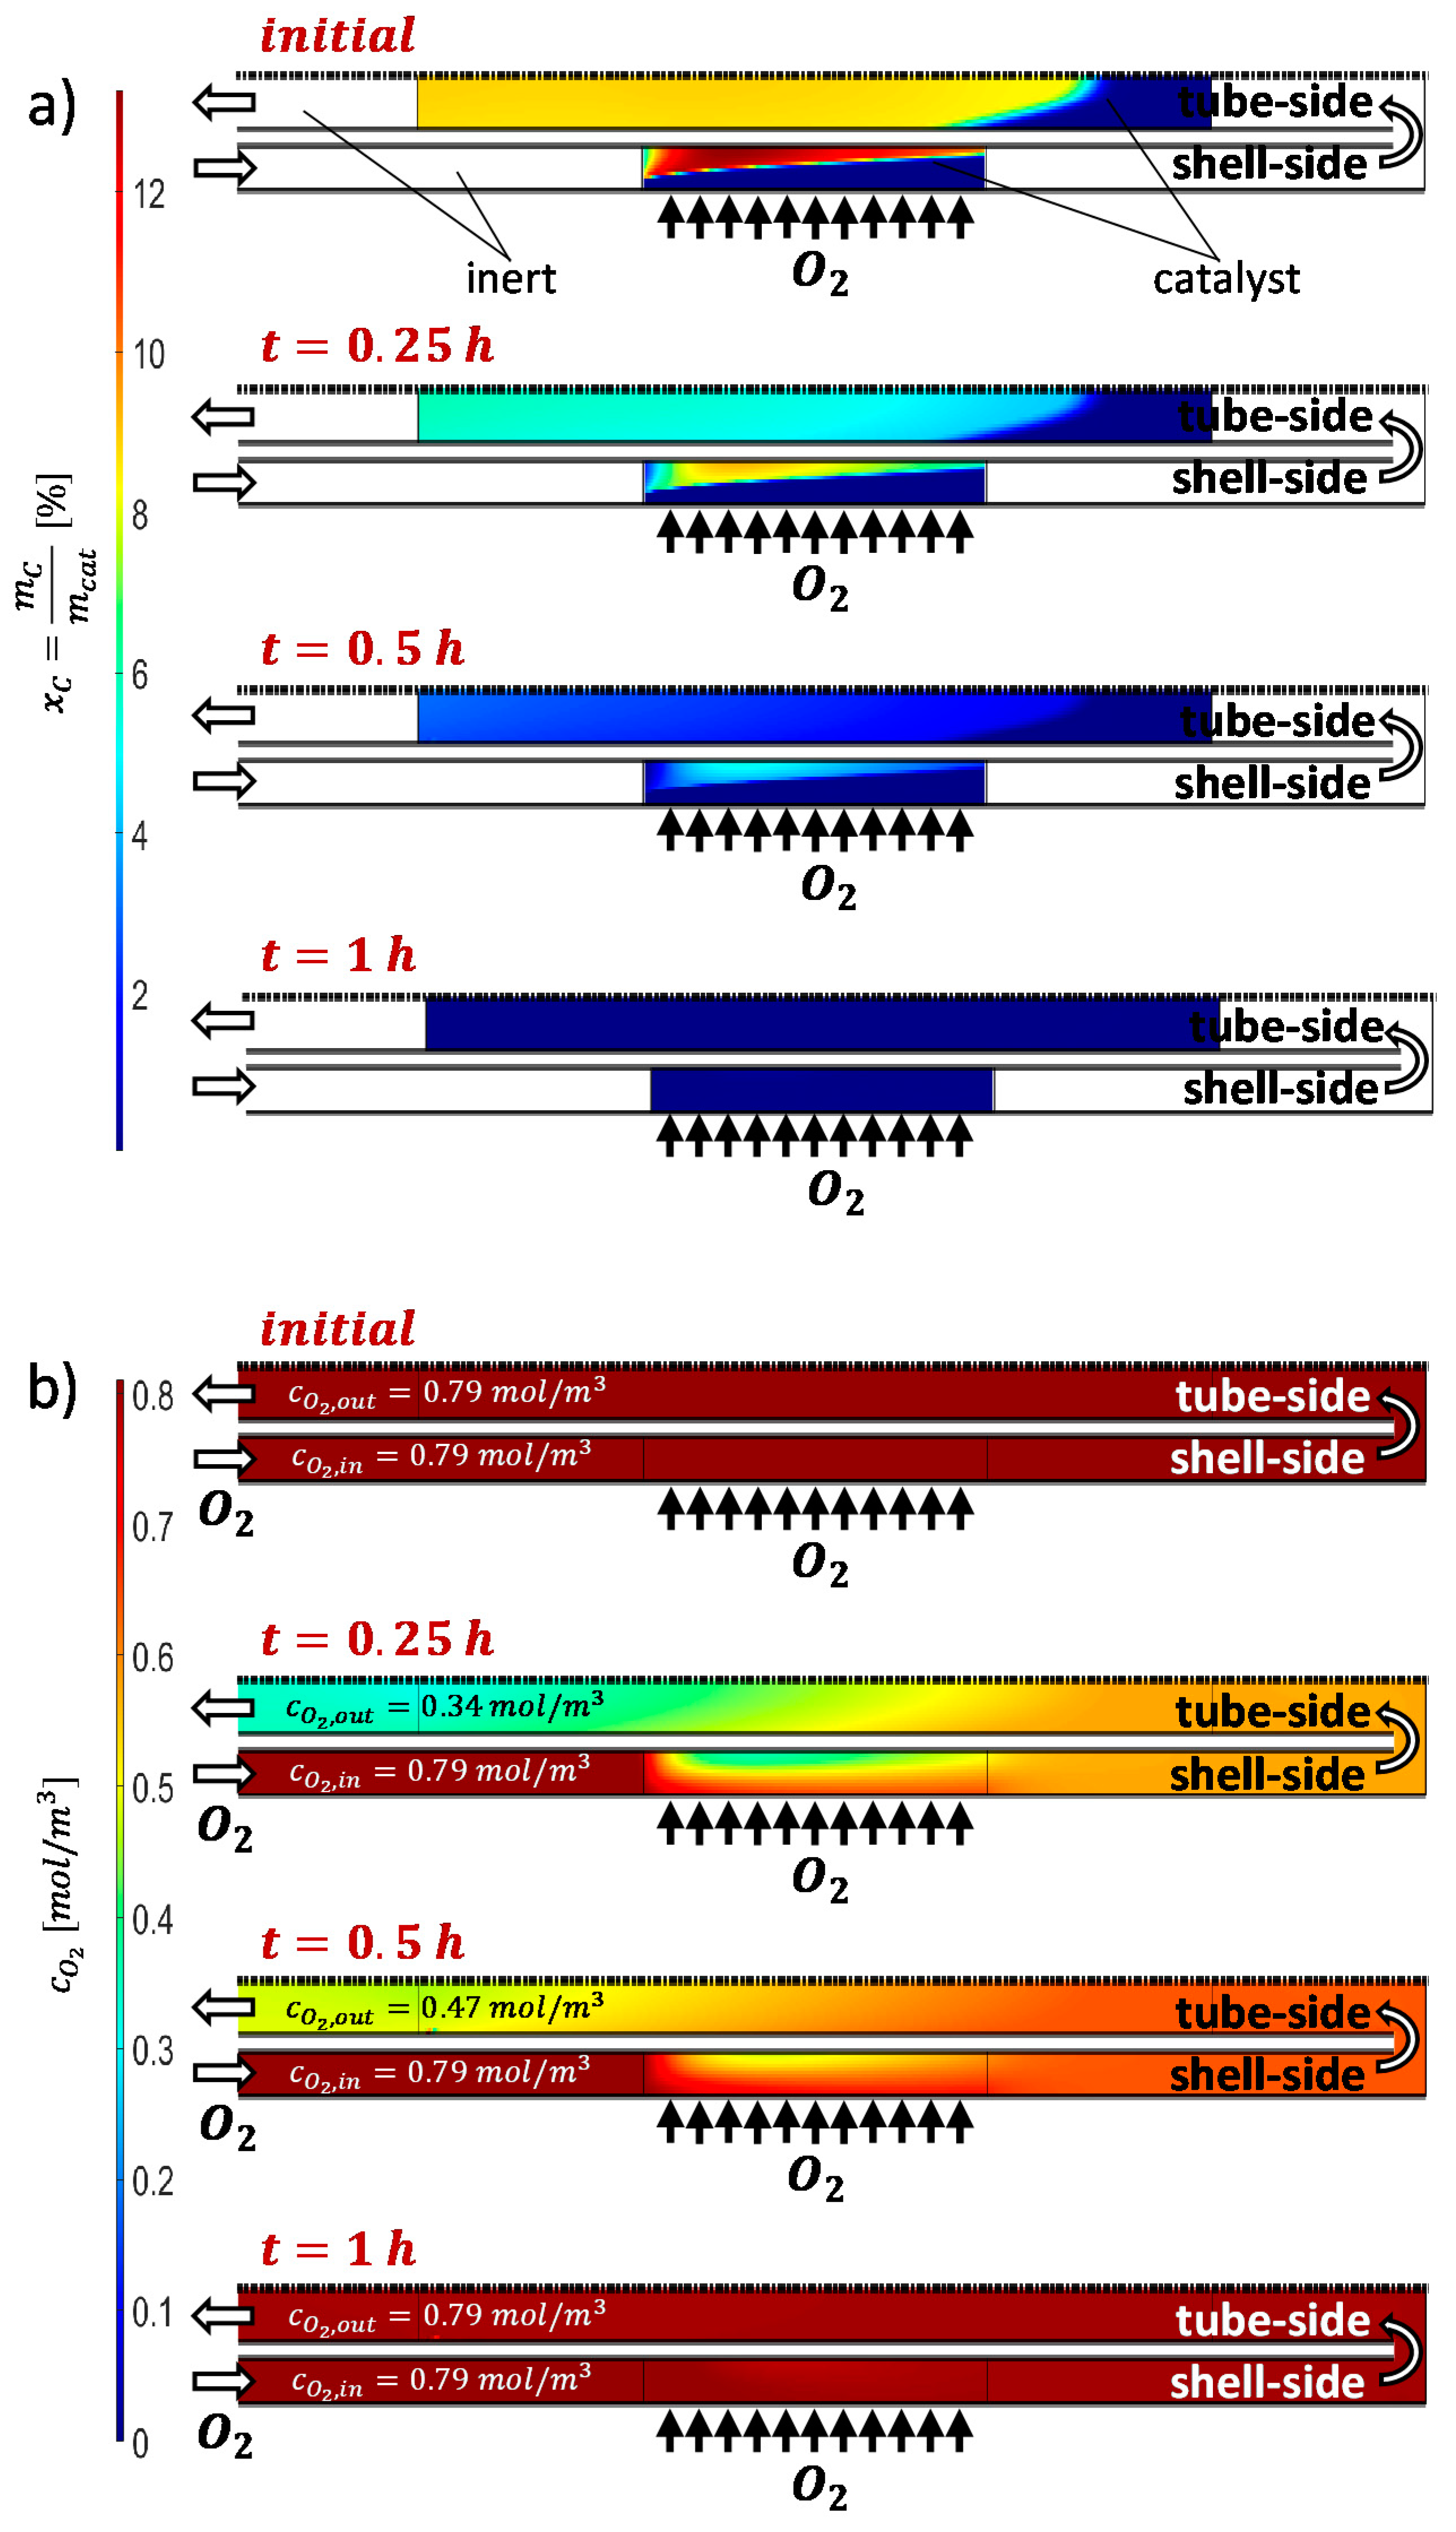
2.2.2. Catalyst Regeneration by Coke Burning

The simulation study of the regeneration uses the calculated coke profile after t = 20   h of the case study illustrated in Figure 7, Figure 8 and Figure 9 as a starting point (Section 2.2.1). In the catalyst regeneration period, the propane inlet concentration is x C 3 H 8 , i n = 0 % , thus no reactions occur, excluding the regeneration. The oxygen inlet concentration is x O 2 , i n = 5 % and the wall and inlet temperatures are set to T W = T i n = 500   ° C to avoid undesired hot spots and damaging of the catalyst by coke burning. Oxygen is dosed into the reactor via both inlets (see Figure 12). The regeneration conditions are chosen based on the primary investigations of Brune et al. [17]. Due to numerical difficulties, it is assumed that the reactor is initially filled with oxygen.
The oxygen consumption is high at the beginning of the regeneration (between t = 0   h and t = 0.25   h ), corresponding to a fast coke decomposition, as can be seen in Figure 12. After t = 0.5   h the coke concentration is reduced to a half. Thus, the oxygen concentration increases. After t = 1   h the coke is converted completely, and the process can be switched back to the production mode. Nevertheless, with respect to the regeneration procedure selected, no propene formation can be realized during the regeneration period, comparable to established processes. However, the concept of the PBMRint allows a switch of the flow direction, as illustrated in Figure 13. If propane and oxygen in excess are dosed in the tube-side (Phase 2), the TDH, ODH and coke burning can proceed simultaneously, allowing propene production in each period.

3. Modelling

For a detailed analysis and evaluation of the PBMRint 2D simulations are required. Therefore, Comsol® Multiphysics 5.6 is applied to calculate axial, radial and temporal complex concentration, temperature and velocity fields, which result due to distributed reactant dosing [22]. To model the difficult heat and mass transfer, taking radial convection and dispersion of the dosed oxygen into account, previous studies figured out that the λ ( r ) heat and mass transfer model [27] fits experimental data of the ODH in a good agreement, since a radial porosity distribution and the laminar boundary layer are considered [22]. To assure comparability between previous results of the FBR and the PBMR, the λ ( r ) model is also applied for the PBMRint. The 2D models are developed based on the following assumptions: pseudo-homogeneous catalyst-bed, ideal gas behavior, incompressible flow and no heat radiation. A detailed description of the reactor modelling can be found in [22]. The geometry of the PBMRint is illustrated in Figure 14. The detailed geometrical parameters are summarized in Table 2.

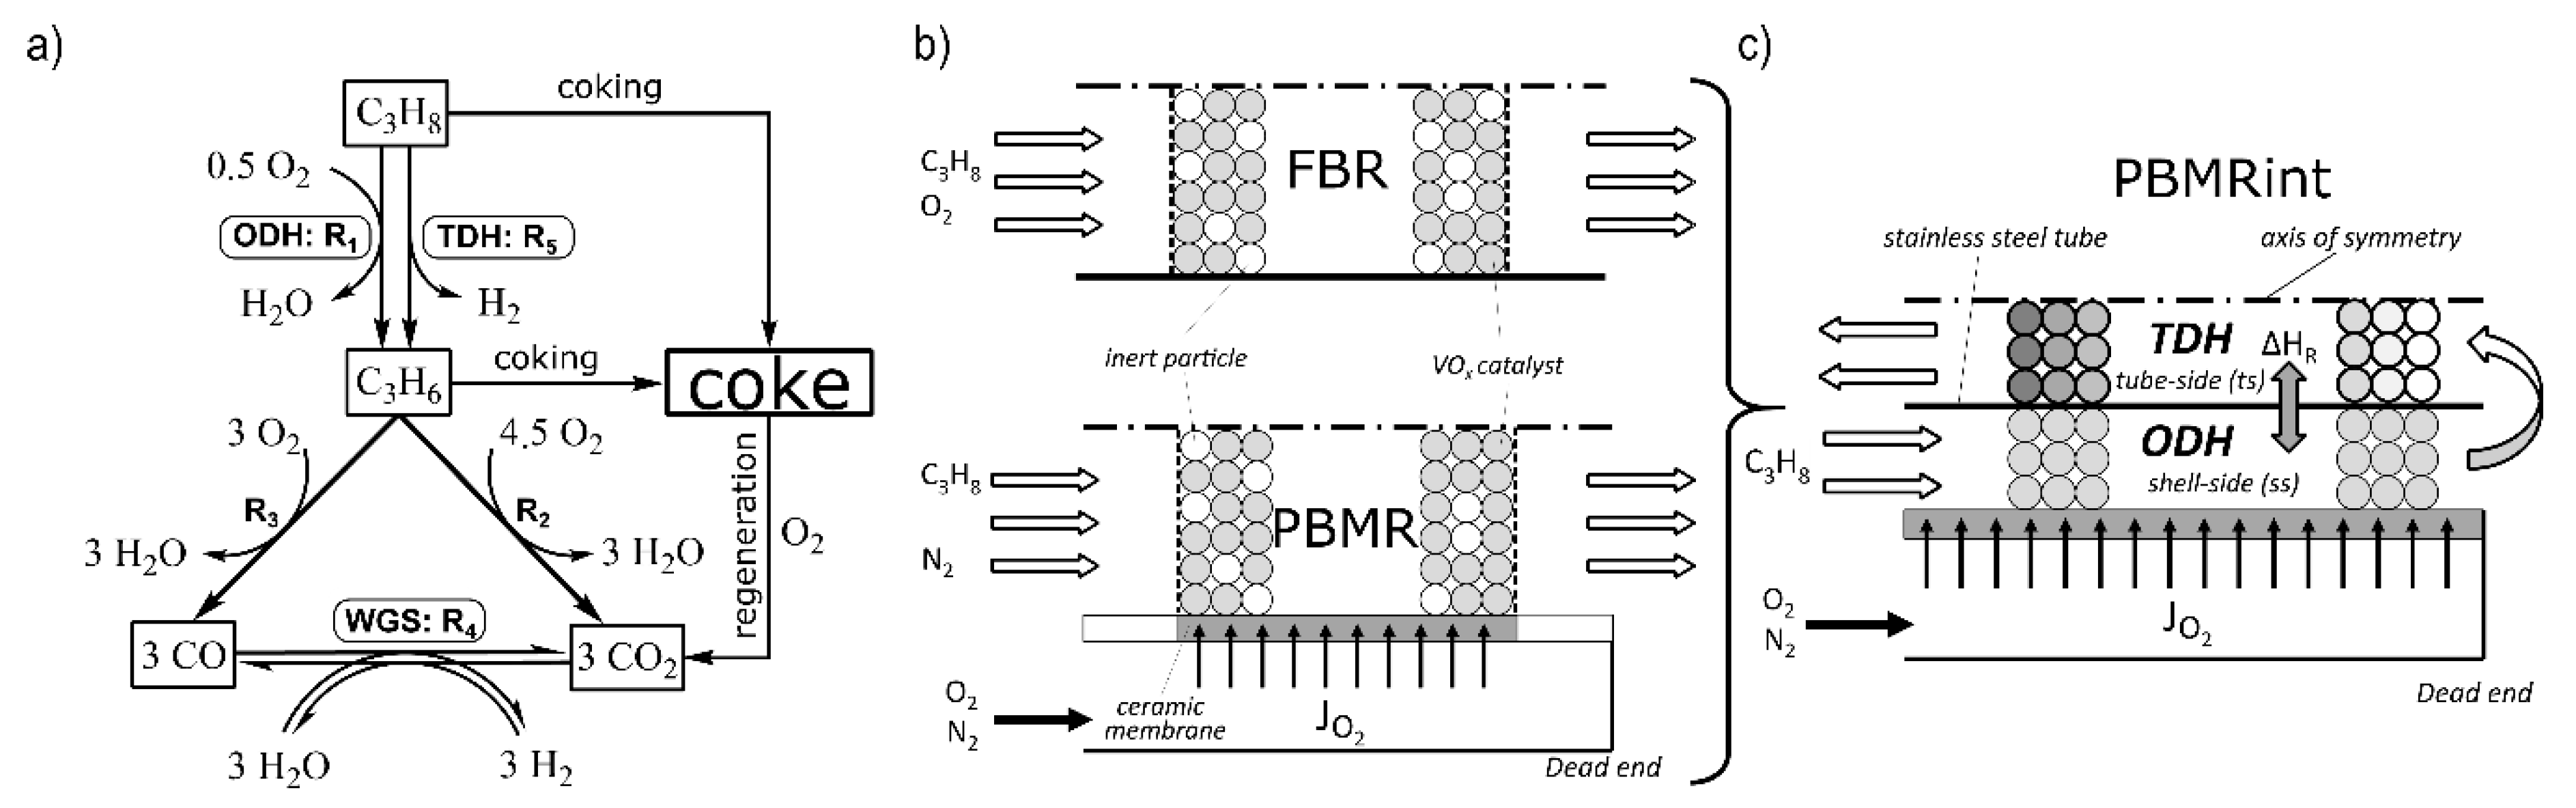
3.1. Reaction Kinetics

The kinetic description of the reaction network is essential for the reactor modelling. Detailed mathematical descriptions for the pure TDH can be found in the literature [28,29]. Brune et al. derived a mathematical description of the reaction network of ODH and TDH of propane on a V O x -catalyst (Figure 1a) based on a power law approach including the water-gas-shift reaction [17,22], which is applied in this study:
R 1 = k 1 p C 3 H 8 a 1 p O 2 b 1
R 2 = k 2 p C 3 H 6 a 2 p O 2 b 2
R 3 = k 3 p C 3 H 6 a 3 p O 2 b 3
R 4 = k 4 p H 2 p C O 2 ( 1 p H 2 O p C O 1 / K W G S p H 2 p C O 2 )
R 5 = k 5 p C 3 H 8 a 5
with the reaction rate R j , the reaction rate constant of reaction j k j , the partial pressure of component i  p i and the reaction orders a j and b j experimentally observed. The temperature dependency of the rate equations is described by the Arrhenius law [17]. Corresponding parameters are summarized in [17]. K W G S is the equilibrium constant of the water-gas shift reaction [30]:
K W G S = 1.767 10 2 exp ( 4400 T )

3.2. Steady-State Balance Equations

3.2.1. Component Mass Balance
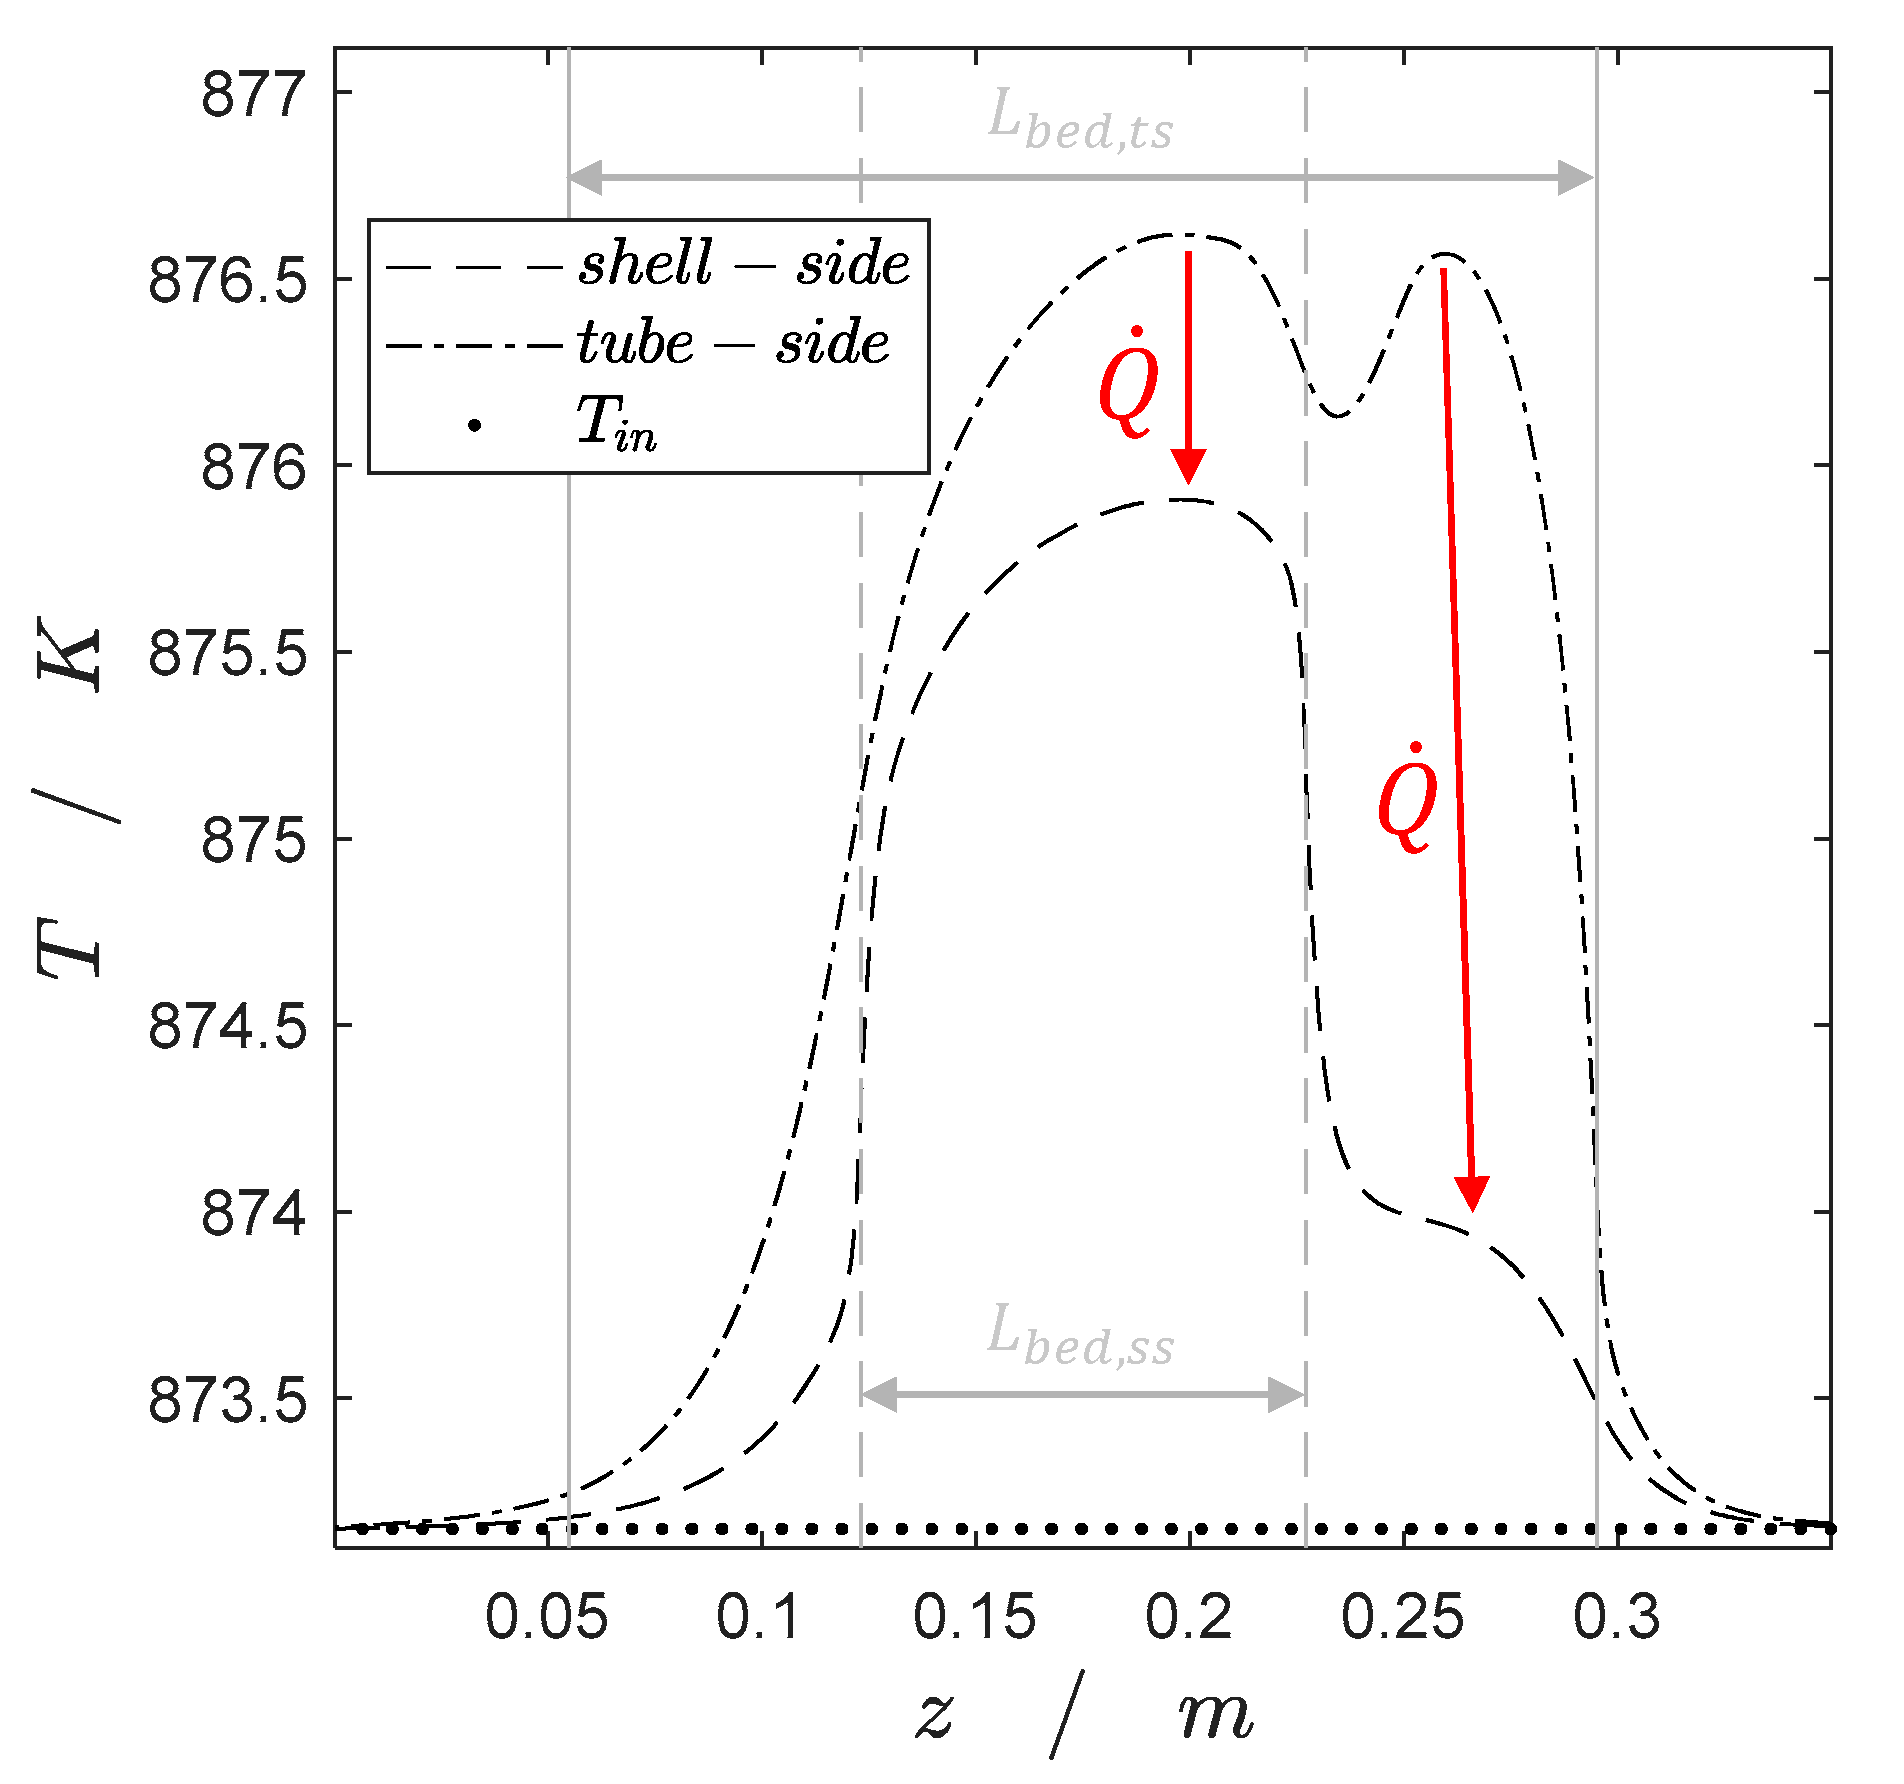
For the steady-state component mass balance of component i, considering axial and radial convection and dispersion, respectively, and chemical reaction holds:
0 = ( ε u z c i ) z 1 r ( ε r u r c i ) r + D i , z e f f 2 c i z 2 + 1 r r [ D i , r e f f r c i r ] + ( 1 ε ) ρ c a t j = 1 M ν i , j R j
The balance equation is used to calculate the FBR, PBMR and PBMRint. The only differences are in the axial and radial dosing of the components, which are considered by the boundary conditions (BC):
general :   c i ( z = 0 ) = c i , i n , A   ( see   Figure   14 ) ;   c i z ( z = Z ) = 0 ;   c i r ( r = 0 ) = 0
FBR :   J i = 0
PBMR , PBMRint :   J i = D i , r e f f c i r ( r = R )
PBMRint : D i , r e f f c i r ( r = R i ;   r = R i + s ) = 0
with the porosity ε , the axial and radial velocity components u z and u r , the molar concentration c i , the effective mass dispersion coefficients in axial and radial direction D i , z e f f and D i , r e f f , the stoichiometric coefficient of component i in reaction j  ν i , j and the catalyst density ρ c a t . The catalyst density is assumed to be constant ( ρ c a t = 1447.3   kg / m 3 ). The molar flux through the membrane wall is calculated as follows:
J i = V ˙ B A m e m c i , i n , B
with the flow rate of the membrane inlet zone B (see Figure 14), the membrane surface area A m e m and the inlet concentration of component i distributed via membrane c i , i n , B . The inlet concentrations are calculated as follows:
c i , i n , A   o r   B = n ˙ i , i n V ˙ A   o r   B ,   with
n ˙ i , i n = n ˙ x i , i n
n ˙ = V ˙ p 0 R u n i T i n
The molar inlet flow rate of component i ( n ˙ i , i n ) is based on the total volumetric flow rate ( V ˙ ), which is identical at the outlet of all studied reactor concepts considering no reactions (Figure 15), to assure comparability between the FBR and the membrane cases (PBMR, PBMRint). The concentration of component i at the inlet A or B (see Figure 14) results as the ratio of the molar inlet flow rate and the volumetric flow rate of the inlet A or B ( V ˙ A   o r   B , see Section 3.2.3). Thus, at the reactor outlet all components have the same concentrations in all reactor concepts, if no reaction takes place. R u n i is the universal gas constant and p 0 the ambient pressure ( p 0 = 101,325 Pa).

3.2.2. Heat Balance

For the steady-state, heat balance holds:
0 = c p , f ( ε u z ρ f T ) z 1 r c p , f ( ε r u r ρ f T ) r + λ z e f f 2 T z 2 + 1 r r [ λ r e f f r T r ] + ( 1 ε ) ρ c a t j = 1 M ( Δ H R ) j R j
BC :   T ( z = 0 ) = T i n ;   T z ( z = Z ) = 0 ;   T r ( r = 0 ) = 0 ;   T ( r = R ) = T W
with the temperature T, the specific isobar heat capacity of the fluid c p , f , the density of the fluid ρ f , the effective heat dispersion coefficients in axial and radial direction λ z e f f and λ r e f f and the heat of reaction j  ( Δ H R ) j . The boundary conditions are identical for all studied reactor concepts.

3.2.3. Momentum Balance

In addition to the component mass balances and the heat balance, the Navier–Stokes equations and the mass continuity equation are solved simultaneously. The following boundary conditions are applied:
general :   u r ( z = 0 ) = 0 ;   p ( z = Z ) = p 0
FBR :   u r ( r = R ) = 0 ;   u z ( r = R ) = 0 ;   u z ( z = 0 ) = V ˙ A c
PBMR , PBMRint :   u r ( r = R ) = V ˙ B A m e m ;   u z ( z = 0 ) = V ˙ A A c
PBMRint :   u r ( r = R i ;   r = R i + s ) = 0 ;   u z ( r = R i ;   r = R i + s ) = 0
with the cross-sectional area A c (circle in the case of the FBR and PBMR and the resulting ring gap between the inner and outer tube in the case of the PBMRint). The extended Brinkman equation [31], coupling the Ergun equation [32] and the Brinkman equation [33], is used to describe the friction of the catalyst-bed and the reactor wall on the fluid flow:
f = 150 ( 1 ε ) 2 ε 3 η f d P 2 u + 1.75 ( 1 ε ) ε 3 ρ f d P u 2 + η f 1 r r ( r u r )
with
u = u z 2 + u r 2
If a membrane is applied for distributed dosing, the total volumetric flow rate is split into two inlet flow rates to assure comparability between the membrane cases (PBMR, PBMRint) and the FBR:
V ˙ A = V ˙ 1 + 1 A / B ;   V ˙ B = V ˙ A 1 A / B ,
with the inlet ratio A / B , which is hold constant in all simulations ( A / B = 1 / 8 ) [22].

3.3. Transient Behavior

The transient analyses are carried out to describe the coke formation and catalyst deactivation over time, as shown in principle in Figure 16. Coke formation, catalyst deactivation and chemical reaction are influenced temporally and locally by each other, leading to a high numerical effort. To overcome numerical difficulties, the catalyst deactivation and coke growth are decoupled by independent functionalities and implemented into the 2D model. The coke formation and the activity–time relationship are described below.

3.3.1. Coke Formation and Regeneration

Coking and regeneration of the used V O x -catalyst is experimentally and model-based investigated in detail by Brune et al. [17]. Both propane and propene have been tested as precursors of the coke formation. Coke growth based on propene is much stronger compared with propane, thus, propene is identified as main coke precursor. The coke growth rate is described by a monolayer term that considers the local propene concentration as precursor [17]:
r c = + k c x C 3 H 6 a c ( x c , m a x x c ) b c
The driving force for coke growth is the difference between the maximum coke concentration/capacity of the monolayer ( x c , max ) and the current coke concentration of the monolayer ( x c ). Furthermore, a regeneration model is derived in previous studies, describing the coke burning rate [17]:
r r = k r x O 2 a r x c b r
The kinetic parameters of the coke growth and the coke burning rate are summarized in Table 3.
To model the overall coke formation, the sum of the coke growth and the coke burning rate is used:
d x c d t = r c + r r = k c x C 3 H 6 a c ( x c , m a x x c ) b c k r x O 2 a r x c b r
The coke concentration results in % (mass of coke per mass of fresh catalyst) [17]. To enhance the degree of accuracy, the oxygen consumption during the catalyst regeneration period is also modelled. Therefore, the regeneration rate (Equation (17)) is modified, thus the resulting oxygen concentration is in mol / m 3   instead of % as the coke concentration:
d c O 2 d t = r R 1 100 % 1 M c 1 ( 1 ε ) ρ c a t
The molar mass of coke is assumed to be the molar mass of elemental carbon ( M c = 12.01 g mol ).

3.3.2. Activity–Time Relationship

Based on experimental observations, concentration and temperature profiles have to be considered time-dependently due to the catalyst deactivation (see Figure 17). Thus, the reaction network has to be modelled considering the local catalyst deactivation in the packed-bed. Therefore, a simplified activity–time relationship is developed to decouple the coke concentration and the catalyst activity, reducing the numerical effort. To describe the reaction rates in dependency of time, the general form, based on two separated terms, is used [34,35,36]:
r ( t ) = r ( t = 0 ) a ( t )
The first term (r(t = 0)) describes the steady-state reaction rates based on fresh catalyst (see Section 3.1). The second term describes the functionality between the catalyst activity and time (a(t)), strongly depended on the deactivation mechanism. In the case of ODH, the catalyst activity decreases by coke decomposition on the catalyst surface, which can be reactivated by coke burning [17]. As described in Section 3.3.1, the coke formation is fundamentally based on propane and propene as precursors [17]. Thus, it is a combination of parallel and serial deactivation, since coke is built in a parallel reaction of propane and a serial reaction of propene [36] (see Figure 1a), leading to the following equation for the deactivation rate:
d a d t = a n k d ( x C 3 H 8 + x C 3 H 6 ) a d
In the case of TDH, which is used by Brune et al. to derive the coke growth kinetics [17], the sum of the propane and the propene concentration is constant and corresponds to the inlet concentration of propane, since propene results from propane. To simplify the deactivation rate by reducing the number of parameters, it is assumed that the inlet concentration of propane is the driving force of the deactivation rate. Thus, the resulting deactivation rate is as follows:
r d = a n k d ( x C 3 H 8 , i n ) a d
Since the regeneration experiments of Brune et al. are carried out in a diluted oxygen atmosphere (oxygen diluted in nitrogen) with the assumption of a constant oxygen concentration [17], it is assumed, that the inlet concentration of oxygen is the driving force of the reactivation rate:
r a = + a n k a ( x O 2 , i n ) b a
The overall catalyst activity results as the sum of the catalyst deactivation and reactivation, similar to the overall coke growth rate (Equation (18)):
d a d t = a n ( k a ( x O 2 , i n ) b a k d ( x C 3 H 8 , i n ) a d )
The mathematical integration leads to the following activity–time relationship:
a ( t ) = ( ( + k a ( x O 2 , i n ) b a k d ( x C 3 H 8 , i n ) a d ) t ( 1 n ) + 1 ) 1 1 n
The derived activity–time relationship is fitted to experimental data of long-term experiments of about t = 40 h (Figure 17) to identify optimal parameters. Therefore, the oxygen inlet concentration is varied ( x O 2 , i n = 0.125 % ,   0.25 % ,   0.5 % ), while the propane inlet concentration is hold constant at x C 3 H 8 , i n = 1 % at a temperature of T = 600 °C. The experiments are carried out in a lab-scale FBR with a mass of catalyst of m c a t = 1.5   g , which corresponds to a bed length of L = 6   cm . The used weight hourly space velocity is W H S V = 400   kg s m 3 . The compositions of the inlet and the outlet gas flows are analyzed by a gas chromatograph (Agilent Technologies 7890B).
For the parameter estimation a simplified 1D mass balance equation (Equation (7)) is used, which is based on the following assumptions: quasi steady-state, isothermal and isobar conditions, 1D and plug flow:
d n ˙ i ( t ) d z = m c a t L a ( t ) j = 1 M ν i , j R j ( t = 0 )
The quasi steady-state assumption results from the significant higher reaction rates R1–R5 (Equations (1)–(5)) in comparison to the overall coke formation rate (Equation (18)). The squared difference between the experimental and simulated values is minimized for the parameter estimation by the objective function:
O F = m i n Γ   R S S = i = 1 N E x p j = 1 N t p o i n t s ( Γ ^ j i S i m Γ ^ j i E x p ) 2
with   Γ ^ j i = Γ j i Γ i ( j = 1 ) ,   Γ j i = [ X C 3 H 8 , S C 3 H 6 , S C O , S C O 2 ] .
The lsqnonlin solver of Matlab® is used for the optimization. N E x p is the number of conducted experiments ( N E x p = 3 ), N t p o i n t s is the number of all measurements per experiment ( N t p o i n t s = 110 ) and Γ are the experimentally ( E x p ) or simulative ( S i m ) investigated conversion of propane ( x C 3 H 8 ), selectivity of propene ( S C 3 H 6 ), selectivity of carbon monoxide ( S C O ) and the selectivity of carbon dioxide ( S C O 2 ), respectively:
X C 3 H 8 ( t ) = n ˙ C 3 H 8 , i n n ˙ C 3 H 8 ( z = Z ,   t ) n ˙ C 3 H 8 , i n ;   S i ( t ) = n ˙ i ( z = Z ,   t ) n ˙ i , i n n ˙ C 3 H 8 , i n n ˙ C 3 H 8 ( z = Z ,   t ) ;   Y C 3 H 6 ( t ) = X C 3 H 8 ( t ) S C 3 H 6 ( t )
The optimized parameters are shown in Table 4. A plot with normalized experimental data and the model results are shown in the Supplementary Material.

3.3.3. Transient Reactor Modelling of Coke Growth Considering Catalyst Activity

The coke formation is mainly dependent on the local concentrations of propane, oxygen and propene and the temperature, which vary with the catalyst activity, as shown in Figure 18.
To simplify these complex phenomenological relationships, the activity–time relationship (Equation (25)) is used as input function, as shown in Figure 19. Thus, the coupling of the resulting coke profiles and the catalyst activity as well as the recoupling of the catalyst activity on the 2D profiles are avoided.
In order to overcome numerical difficulties caused by the complex system of equations, the time is discretized according to the method described by Janssens et al. [37]. It is assumed that the catalyst activity within a time interval of Δ t = 1   h is constant and corresponds to the catalyst activity of the middle of the interval (see Figure 6):
a ( [ t i t i + Δ t ] ) = a ( t ¯ ) ,  
with
t ¯ = t i + Δ t / 2 ; Δ t = 1   h
Since transient behavior is described by Equation (20) ( r ( t ) = r ( t = 0 ) a ( t ) ), constant profiles for component mass, temperature and momentum result due to the temporal discretization of the catalyst activity (a(t)) (see Figure 6, Section 2.2.1). These profiles are calculated via the steady-state equations (Equations (7) and (12) and the momentum balance (see Section 3.2). This enables the time-dependent modelling of the coke growth during the whole time interval, since Equation (18) is simplified to an ordinary differential equation with respect to the coke concentration x c , due to constant propene and oxygen concentrations within the time interval. The coke concentration at the end of each time interval Δ t is the initial coke concentration of the next interval.

4. Conclusions and Outlook

The aim of this theoretical study was to investigate the potential of a heat-integrated packed-bed membrane reactor (PBMRint) for coupling the exothermic ODH and the endothermic TDH of propane in one apparatus, applying a distributed dosing of oxygen. Initially, detailed steady-state 2D simulations were carried out to determine suitable reaction conditions to obtain high propene selectivity and yield due to the integration of released heat of the exothermic oxidations, which mainly occur in the shell-side, including membrane-assisted oxygen dosing, and the tube-side, where endothermic TDH occurs at the absence of oxygen. It was figured out that the PBMRint significantly outperforms a conventional fixed-bed reactor (FBR) and a membrane reactor in simple distributor configuration at oxygen shortage ( x O 2 , i n     1 % ), with a maximum propene yield of about 28% at an oxygen inlet concentration of x O 2 , i n = 0.25 % . This result is competitive to established propene production processes, as shown in Table 5. At this point, the significantly lower propane inlet concentration compared with the industrial established processes has to be mentioned.
The desired heat integration of ODH and TDH is only possible up to an oxygen/propane inlet ratio equal to one, since the local hot spot shifts at oxygen excess into the tube-side, where TDH should take place. However, oxygen excess leads to a deeper penetration of unconsumed oxygen into the shell-side and the tube-side, supporting series oxidations of propene and leading to reduced propene yield. Subsequently, an optimal inlet concentration of oxygen of x O 2 , i n = 1 % was chosen for transient simulations with respect to the height and the location of the local hot spot.
The transient simulations were carried out to consider the reactor performance during catalyst deactivation and overall coke growth in a case study of the PBMRint for a production period up to t = 20 h. Therefore, a detailed mathematical kinetic description of the overall coke growth was applied. To model the catalyst deactivation, an activity–time relationship was derived in this work. It is shown that the production period should be stopped after about t = 4 h, since the hot spot shifts into the tube-side (TDH chamber) due to a deeper penetration of oxygen into the tube-side, caused by lower consumption rates of oxygen due to the lower catalyst activity in the shell-side (ODH chamber). Additionally, the coke burning was studied with the aim of a determination of necessary regeneration times to provide the basis for overall process optimizations including deactivation and regeneration periods with respect to maximal space-time yield. Thereby, the opportunity of a periodic switch of the flow direction should be taken into account for a simultaneous production and catalyst regeneration (see Figure 13). The results revealed that a regeneration time of t = 1 h is sufficient to burn the coke, which was built during a production period of t = 20 h.
Consequently, the results of this contribution have pointed out the necessity of detailed transient 2D modelling to describe the complex relationships between developing coke, concentration and temperature fields due to a decreasing catalyst activity. In particular, the distributed dosing of oxygen via membrane, leading to a deeper oxygen penetration, shifting hot spots and the resulting reactor performance of the PBMRint at a lower catalyst activity can be analyzed and evaluated only by performing simulations taking axial, radial and time coordinates into account.
Future research should focus on an experimental validation of the presented results, which are figured out in this contribution with further respect to higher propane and oxygen concentrations.

Supplementary Materials

The following are available online at https://www.mdpi.com/article/10.3390/catal11091056/s1, Figure S1: Normalized experimental data and model results.

Author Contributions

Conceptualization, C.H.; Methodology, J.P.W.; Software, J.P.W.; Validation, J.P.W., A.B.; Formal Analysis, J.P.W., A.B.; Investigation, J.P.W., A.B.; Resources, A.S.-M., C.H.; Writing—Original Draft Preparation, J.P.W.; Writing—Review and Editing, A.B., C.H.; Visualization, J.P.W.; Supervision, C.H.; Project Administration, A.S.-M., C.H.; Funding Acquisition, A.S.-M., C.H. All authors have read and agreed to the published version of the manuscript.

Funding

The financial support of the German Science Foundation (projects: “Kontrolle und Intensivierung von Reaktionen durch Einsatz zyklisch betriebener Distributoren” (SE 568/23-1/HA 6762/2-1 and SFB/TRR 63: “InPROMPT-Integrated Chemical Processes in Multi-Phase Fluid Systems”) is gratefully acknowledged.

Conflicts of Interest

The authors declare no conflict of interest.

Glossary

Symbols
SymbolUnitMeaning
a -catalyst activity
a -exponent
A m 2 area
b exponent
c mol m 3 concentration
c p J ( mol K ) 1 specific heat capacity
D m inner diameter of the membrane tube
D i m inner diameter of the inner tube
D eff m 2 s 1 effective mass dispersion coefficient
E A J mol 1 activation energy
J mol ( m 2 s ) 1 molar flux
k m 3 n Pa n reaction rate constant
K WGS -equilibrium constant
L m reactor length
L bed mlength of the catalyst-bed
L inert m length of the inert zone
L re m length of the recycle zone
m kg mass
n -exponent
n · mol s 1 molar flow
N exp -number of experiments
N t points -number of measurements per experiment
p Pa pressure
r mol ( kg s ) 1 reaction rate
r m radial coordinate
R m tube radius
smthickness of the inner tube
S -selectivity
tstime
t - smean time of a time interval Δ t
T K temperature
u m s 1 velocity
V · m 3 s 1 volumetric flow
V R m 3 reactor volume
x -molar fraction
x C %Coke concentration ( mass   of   coke / mass   of   fresh   catalyst 100 % )
x -conversion
Y -yield
z m axial coordinate
Greek Letters
Γ -performance indicator (conversion, selectivity, yield)
Δ H R J mol 1 reaction enthalpy
ε -porosity
η Pa s dynamic viscosity
λ eff W ( m K ) 1 effective heat dispersion coefficient
ν -stoichiometric coefficient
ρ kg m 3 density
ρ cat kg m 3 catalyst density
Subscripts
areactivation
ccoking
ccross section
catcatalyst
ddeactivation
expexperimental
ffluid
icomponent index
ininlet
jreaction index
memmembrane
rradial direction
rregeneration
simsimulated
ssshell-side
tstube-side
Wwall
zaxial direction
0ambient
Abbreviations
BCboundary condition
eq.equation
FBRfixed-bed reactor
ODHoxidative dehydrogenation
OFobjective function
PBMRpacked-bed membrane reactor
PBMRintHeat-integrated packed-bed membrane reactor
RSSresidual sum of squares
TDHthermal dehydrogenation
A/Binlet ratio
WHSVweight hourly space velocity

References

  1. Isac-García, J.; Dobado, J.A.; Calvo-Flores, F.G.; Martínez-García, H. Experimental Organic Chemistry; Elsevier: Amsterdam, The Netherlands, 2016. [Google Scholar]
  2. Dittmeyer, R.; Caro, J. Handbook of Heterogeneous Catalysis; Ertl, G., Knözinger, H., Schüth, F., Weitkamp, J., Eds.; Wiley-VCH Verlag GmbH & Co. KGaA: Weinheim, Germany, 2008. [Google Scholar]
  3. Perea, L.A.; Wolff, T.; Hamel, C.; Seidel-Morgenstern, A. Experimental Study of the Deactivation of Ni/AlMCM-41 Catalyst in the Direct Conversion of Ethene to Propene. Appl. Catal. A Gen. 2017, 533, 121–131. [Google Scholar] [CrossRef]
  4. Sundmacher, K.; Kienle, A.; Seidel-Morgenstern, A. Integrated Chemical Processes: Synthesis, Operation, Analysis, and Control; Wiley-VCH: Weinheim, Germany, 2005. [Google Scholar]
  5. Dingerdissen, U.; Martin, A.; Herein, D.; Wernicke, H.J. The Development of Industrial Heterogeneous Catalysis. In Handbook of Heterogeneous Catalysis; Ertl, G., Knözinger, H., Schüth, F., Weitkamp, J., Eds.; Wiley-VCH Verlag GmbH & Co. KGaA: Weinheim, Germany, 2008; ISBN 3527312412. [Google Scholar]
  6. Keil, F.J. Process Intensification. Rev. Chem. Eng. 2018, 34, 135–200. [Google Scholar] [CrossRef] [Green Version]
  7. Agar, D.W. Multifunctional Reactors: Old Preconceptions and New Dimensions. Chem. Eng. Sci. 1999, 54, 1299–1305. [Google Scholar] [CrossRef]
  8. Jurtz, N.; Srivastava, U.; Moghaddam, A.A.; Kraume, M. Particle-Resolved Computational Fluid Dynamics as the Basis for Thermal Process Intensification of Fixed-Bed Reactors on Multiple Scales. Energies 2021, 14, 2913. [Google Scholar] [CrossRef]
  9. Gallucci, F. Membrane Reactors: A Way to Increase Efficiency. J. Membr. Sci. Res. 2019, 5, 259–260. [Google Scholar] [CrossRef]
  10. Marín, P.; Hamel, C.; Ordóñez, S.; Díez, F.V.; Tsotsas, E.; Seidel-Morgenstern, A. Analysis of a fluidized bed membrane reactor for butane partial oxidation to maleic anhydride: 2D modelling. Chem. Eng. Sci. 2010, 65, 3538–3548. [Google Scholar] [CrossRef]
  11. Zimmermann, H. Propene. In Ullmann’s Encyclopedia of Industrial Chemistry; Wiley-VCH Verlag GmbH & Co. KGaA: Weinheim, Germany, 2000; ISBN 3527306730. [Google Scholar]
  12. Zimmermann, H.; Walzl, R. Ethylene. In Ullmann’s Encyclopedia of Industrial Chemistry; Wiley-VCH Verlag GmbH & Co. KGaA: Weinheim, Germany, 2000; ISBN 3527306730. [Google Scholar]
  13. Bai, P.; Etim, U.J.; Yan, Z.; Mintova, S.; Zhang, Z.; Zhong, Z.; Gao, X. Fluid Catalytic Cracking Technology: Current Status and Recent Discoveries on Catalyst Contamination. Catal. Rev. 2019, 61, 333–405. [Google Scholar] [CrossRef]
  14. Najari, S.; Saeidi, S.; Gallucci, F.; Drioli, E. Mixed Matrix Membranes for Hydrocarbons Separation and Recovery: A Critical Review. Rev. Chem. Eng. 2021, 37, 363–406. [Google Scholar] [CrossRef]
  15. Won, W.; Lee, K.S.; Lee, S.; Jung, C. Repetitive Control and Online Optimization of Catofin Propane Process. Comput. Chem. Eng. 2010, 34, 508–517. [Google Scholar] [CrossRef]
  16. Staszak, K.; Wieszczycka, K.; Tylkowski, B.; Staszak, K. Chemical Technologies and Processes; Staszak, K., Wieszczycka, K., Tylkowski, B., Eds.; De Gruyter: Berlin, Germany, 2020; ISBN 9783110656275. [Google Scholar]
  17. Brune, A.; Seidel-Morgenstern, A.; Hamel, C. Analysis and Model-Based Description of the Total Process of Periodic Deactivation and Regeneration of a VOx Catalyst for Selective Dehydrogenation of Propane. Catalysts 2020, 10, 1374. [Google Scholar] [CrossRef]
  18. Lian, Z.; Si, C.; Jan, F.; Zhi, S.; Li, B. Coke Deposition on Pt-Based Catalysts in Propane Direct Dehydrogenation: Kinetics, Suppression, and Elimination. ACS Catal. 2021, 11, 9279–9292. [Google Scholar] [CrossRef]
  19. Cavani, F.; Ballarini, N.; Cericola, A. Oxidative Dehydrogenation of Ethane and Propane: How Far From Commercial Implementation? Catal. Today 2007, 127, 113–131. [Google Scholar] [CrossRef]
  20. Bhasin, M.M.; McCain, J.H.; Vora, B.V.; Imai, T.; Pujadó, P.R. Dehydrogenation and Oxydehydrogenation of Paraffins to Olefins. Appl. Catal. A Gen. 2001, 221, 397–419. [Google Scholar] [CrossRef]
  21. Albonetti, S.; Cavani, F.; Trifirò, F. Key Aspects of Catalyst Design for the Selective Oxidation of Paraffins. Catal. Rev. 1996, 38, 413–438. [Google Scholar] [CrossRef]
  22. Walter, J.P.; Brune, A.; Seidel-Morgenstern, A.; Hamel, C. Model-based Analysis of Fixed-bed and Membrane Reactors of Various Scale. Chem. Ing. Tech. 2021, 93, 819–824. [Google Scholar] [CrossRef]
  23. Brune, A.; Wolff, T.; Seidel-Morgenstern, A.; Hamel, C. Analysis of Membrane Reactors for Integrated Coupling of Oxidative and Thermal Dehydrogenation of Propane. Chem. Ing. Tech. 2019, 91, 645–650. [Google Scholar] [CrossRef] [Green Version]
  24. Hamel, C.; Tóta, Á.; Klose, F.; Tsotsas, E.; Seidel-Morgenstern, A. Analysis of Single and Multi-Stage Membrane Reactors for the Oxidation of Short-Chain Alkanes—Simulation Study and Pilot Scale Experiments. Chem. Eng. Res. Des. 2008, 86, 753–764. [Google Scholar] [CrossRef]
  25. Klose, F.; Wolff, T.; Thomas, S.; Seidel-Morgenstern, A. Concentration and Residence Time Effects in Packed Bed Membrane Reactors. Catal. Today 2003, 82, 25–40. [Google Scholar] [CrossRef]
  26. Steen, H. Handbuch des Explosionsschutzes; Wiley: Hoboken, NJ, USA, 2000. [Google Scholar]
  27. Winterberg, M.; Tsotsas, E.; Krischke, A.; Vortmeyer, D. A Simple and Coherent Set of Coefficients for Modelling of Heat and Mass Transport With and Without Chemical Reaction in Tubes Filled with Spheres. Chem. Eng. Sci. 2000, 55, 967–979. [Google Scholar] [CrossRef]
  28. Huš, M.; Kopač, D.; Likozar, B. Kinetics of Non-Oxidative Propane Dehydrogenation on Cr2O3 and the Nature of Catalyst Deactivation from First-Principles Simulations. J. Catal. 2020, 386, 126–138. [Google Scholar] [CrossRef]
  29. Phadke, N.M.; Mansoor, E.; Bondil, M.; Head-Gordon, M.; Bell, A.T. Mechanism and Kinetics of Propane Dehydrogenation and Cracking over Ga/H-MFI Prepared via Vapor-Phase Exchange of H-MFI with GaCl3. J. Am. Chem. Soc. 2019, 141, 1614–1627. [Google Scholar] [CrossRef] [PubMed] [Green Version]
  30. Hou, K.; Hughes, R. The Kinetics of Methane Steam Reforming over a Ni/α-Al2O Catalyst. Chem. Eng. J. 2001, 82, 311–328. [Google Scholar] [CrossRef]
  31. Chandrasekhara, B.C.; Vortmeyer, D. Flow Model for Velocity Distribution in Fixed Porous Beds under Isothermal Conditions. Wärme- und Stoffübertragung 1979, 12, 105–111. [Google Scholar] [CrossRef] [Green Version]
  32. Ergun, S. Fluid Flow through Packed Columns. Chem. Eng. Prog. 1952, 48, 89–94. [Google Scholar]
  33. Brinkman, H.C. A Calculation of the Viscous Force Exerted by a Flowing Fluid on a Dense Swarm of Particles. Appl. Sci. Res. 1949, 1. [Google Scholar] [CrossRef]
  34. Bartholomew, C.H.; Farrauto, R.J. Fundamentals of Industrial Catalytic Processes; John Wiley & Sons, Inc.: Hoboken, NJ, USA, 2005; ISBN 9780471730071. [Google Scholar]
  35. Castleman, A.W.; Schäfer, F.P.; Toennies, J.P.; Zinth, W. Basic Principles in Applied Catalysis; Baerns, M., Ed.; Springer: Berlin/Heidelberg, Germany, 2004; ISBN 978-3-642-07310-6. [Google Scholar]
  36. Levenspiel, O. Chemical Reaction Engineering, 3rd ed.; Wiley: Hoboken, NJ, USA, 1999; ISBN 047125424X. [Google Scholar]
  37. Janssens, T.V.W.; Svelle, S.; Olsbye, U. Kinetic Modeling of Deactivation Profiles in the Methanol-to-hydrocarbons (MTH) Reaction: A Combined Autocatalytic–Hydrocarbon Pool Approach. J. Catal. 2013, 308, 122–130. [Google Scholar] [CrossRef]
  38. Nawaz, Z. Light Alkane Dehydrogenation to Light Olefin Technologies: A Comprehensive Review. Rev. Chem. Eng. 2015, 31. [Google Scholar] [CrossRef]
Figure 1. (a) Reaction network of ODH including coke formation; (b) schemes of reactor concepts FBR and PBMR; (c) scheme of the new developed PBMRint.
Catalysts 11 01056 g001
Figure 2. Conversion, selectivity, yield, of the FBR, PBMR and PBMRint for different oxygen inlet concentrations ( x C 3 H 8 , i n = 1 % ;   x O 2 , i n = 0.25 % 5 % ; T W = T in = 600   ° C ; WHSV = 400   kg s m 3 ).
Catalysts 11 01056 g002
Figure 3. (a) Radial averaged oxygen concentrations in the reaction zones of the shell-side and the tube-side of the PBMRint; (b) radial averaged propene selectivity in the reaction zones of the shell-side and the tube-side of the PBMRint ( x C 3 H 8 , in = 1 % ;   x O 2 , i n = 0.25 % 5 % ;   T W   = T in = 600   ° C ;   WHSV = 400   kg s m 3 ).
Catalysts 11 01056 g003
Figure 4. Hot spot positions in the PBMRint in dependency of the inlet concentration of oxygen ( x C 3 H 8 , i n = 1 % ;   x O 2 , i n = 0.25 % 5 % ;   T W = T in = 600   ° C ;   WHSV = 400   kg s m 3 ).
Catalysts 11 01056 g004
Figure 5. Radial averaged temperature profiles of the shell-side and the tube-side of the PBMRint along the axial coordinate ( x C 3 H 8 , i n = x O 2 , i n = 1 % ;   T W   = T in   = 600   ° C ;   WHSV = 400   kg s m 3 ).
Catalysts 11 01056 g005
Figure 6. Activity–time relationship and discretization; x C 3 H 8 , i n   = x O 2 , i n = 1 % ;   T = 600   ° C .
Catalysts 11 01056 g006
Figure 7. Calculated 2D profiles of the oxygen, propene and coke concentrations at t = 1 ,   10 ,   20   h ( x C 3 H 8 , i n = x O 2 , i n = 1 % ;   T W = T in = 600   ° C ;   WHSV = 400   kg s m 3 ).
Catalysts 11 01056 g007
Figure 8. Hot spot positions in the PBMRint in dependency of time during deactivation ( x C 3 H 8 , i n x O 2 , i n = 1 % ;   T W = T in = 600   ° C ;   WHSV = 400   kg s m 3 ).
Catalysts 11 01056 g008
Figure 9. Radial averaged temperature profiles of the shell-side and the tube-side of the PBMRint along the axial coordinate at t = 19.5   h ( x C 3 H 8 , i n = x O 2 , i n = 1 % ;   T W = T in = 600   ° C ;   WHSV = 400   kg s m 3 ).
Catalysts 11 01056 g009
Figure 10. (a) propane conversion, (b) propene selectivity, (c) propene yield over 20 h considering a decreasing catalyst activity ( x C 3 H 8 , i n = x O 2 , i n = 1 % ;   T W = T in   = 600   ° C ;   WHSV = 400   kg s m 3 ).
Catalysts 11 01056 g010
Figure 11. Propane conversion, propene selectivity and propene yield over time ( t = 0.5 ,   1.5 ,   2.5 ,   3.5   h ); (a,c,e) for x O 2 , i n = 0.25 % and (b,d,f) for x O 2 , i n = 0.75 % ( x C 3 H 8 , i n = 1 % ;   T W = T i n = 600   ° C ;   WHSV = 400   kg s m 3 ).
Catalysts 11 01056 g011
Figure 12. Calculated 2D profiles of the coke and oxygen concentrations at t = initial ,   0.25 ,   0.5 ,   1   h ( x C 3 H 8 , i n = 0 % ;   x O 2 , i n = 5 % ;   T W = T i n = 500   ° C ;   WHSV = 400   kg s m 3 ).
Catalysts 11 01056 g012
Figure 13. Periodic switch of the flow direction of the PBMRint for a simultaneous production and regeneration.
Catalysts 11 01056 g013
Figure 14. Conceptual design of the heat-integrated packed-bed membrane reactor (PBMRint), including boundary conditions.
Catalysts 11 01056 g014
Figure 15. Total volumetric flow rates of the FBR and the membrane cases (PBMR, PBMRint) along the axial reactor coordinate.
Catalysts 11 01056 g015
Figure 16. Scheme of coke growth (left) and catalyst activity (right) over time during production/coking/deactivation periods and regeneration/reactivation periods.
Catalysts 11 01056 g016
Figure 17. (a) Measured propane conversion over time, (b) measured propene selectivity over time ( WHSV = 400   kg s m 3 ;   x C 3 H 8 , i n = 1 % ;   T W   = T in = 600   ° C ).
Catalysts 11 01056 g017
Figure 18. Scheme of the phenomenological relationships between 2D profiles, coking and catalyst activity.
Catalysts 11 01056 g018
Figure 19. Scheme of the simplified modelling strategy to consider the influence of the catalyst activity on coke formation.
Catalysts 11 01056 g019
Table 1. Reaction conditions of the steady-state simulations.
ParameterValueDescription
TW600 °CWall temperature
Tin600 °CInlet temperature
WHSV 400   kg s m 3 Weight hourly space velocity
mcat,ss0.017 kgMass of catalyst in the shell-side
x C 3 H 8 , i n 1%Inlet concentration of propane
Table 2. Geometrical parameters of the PBMRint.
ParameterValueDescription
L b e d , t s 0.24 mLength of catalyst-bed of tube-side
L i n e r t , t s 0.055 mLength of inert zone of tube-side
D i 0.0098 mInner diameter of inner tube
s 0.0015 mThickness of inner tube
L b e d , s s 0.104 mLength of catalyst-bed of shell-side
L i n e r t , s s 0.123 mLength of inert zone of shell-side
D 0.021 mInner diameter of membrane tube
L r e 0.01 mLength of the reversal zone
Table 3. Optimized kinetic parameters of the coke growth and the coke burning/catalyst regeneration.
ParameterOpt. ValueConfidence IntervalsUnit
k 0 , c 9.83 × 10 7 33.21 % 11.26 % % c 1 b c min 1
E A , c 106 , 367 0.13 % 0.12 % J mol 1
a c 0.7 0.3 % 0.30 %
b c 6.4 0.38 % 1.27 %
x c , m a x 87.06 0.45 % 0.82 % % c = kg C kg cat 1 100 %
k 0 , r 6.96 × 10 6 2.37 % 2.37 % % O 2 a r % c 1 b r min 1
E A , r 120 , 907 0.12 % 0.12 % J mol 1
a r 0.69 0.16 % 0.16 % -
b r 0.55 0.12 % 0.12 % -
Table 4. Optimized kinetic parameters of the activity–time relationship.
ParameterOpt. ValueConfidence IntervalsUnit
k d 9987.23 ± 9.77 10 7 ( h % a d ) 1
a d 2.18 ± 1.1 10 3
k a 3.15 ± 6.02 10 2 ( h % b a ) 1
b a 0.76 ± 9.49 10 7
n 2.22 ± 3.2 10 3
Table 5. Maximum yield of propene of different production processes.
ProcessMaximum Yield of PropeneReference
SC (industrial) 17 % [12]
FCC (industrial) 20 % [11]
TDH (Catofin, industrial) 57 % [38]
ODH (PBMRint, research study) 28 % This study
Publisher’s Note: MDPI stays neutral with regard to jurisdictional claims in published maps and institutional affiliations.

