Article

Catalytic Deactivation of HY Zeolites in the Dehydration of Glycerol to Acrolein

by
Israel Pala-Rosas
1,
José L. Contreras
2,*,
José Salmones
1,
Beatriz Zeifert
1,
Ricardo López-Medina
2,
Juan Navarrete-Bolaños
3,
Sofía Hernández-Ramírez
2,
Jennipher Pérez-Cabrera
2 and
Andrés A. Fragoso-Montes de Oca
3
1
Instituto Politécnico Nacional, Departamento de Ingeniería Química Industrial, 07738 Mexico City, Mexico
2
Departamento de Energía, CBI, Universidad Autónoma Metropolitana-Azcapotzalco, Av. San Pablo 180, Col. Reynosa, 02200 Mexico City, Mexico
3
Instituto Mexicano del Petróleo, Eje Central Lázaro Cárdenas No. 152, Col. San Bartolo Atepehuacan, 07730 Mexico City, Mexico
*
Author to whom correspondence should be addressed.
Catalysts 2021, 11(3), 360; https://doi.org/10.3390/catal11030360
Submission received: 1 January 2021 / Revised: 27 February 2021 / Accepted: 4 March 2021 / Published: 10 March 2021

Abstract

:
The study of the deactivation of HY zeolites in the dehydration reaction of glycerol to acrolein has represented a challenge for the design of new catalysts. HY zeolites with SiO2/Al2O3 molar ratios between 3.5 and 80 were studied. The solids were characterized by XRD, N2 physisorption, SEM-EDXS, Raman and UV-vis spectroscopies, infrared spectroscopy of pyridine (FTIR-Py) and catalytic activity tests from 250 °C to 325 °C. It was found that the total amount of acid sites per unit area of catalyst decreased as the SiO2/Al2O3 molar ratio increased from 3.5 to 80, resulting in the decrease in the initial glycerol conversion. The initial acrolein selectivity was promoted with the increase of the Brønsted/Lewis acid sites ratio at any reaction temperature. The deactivation tests showed that the catalyst lifetime depended on the pore structure, improving with the presence of large surface areas as evidenced by the deactivation rate constants. The characterization of the deactivated catalysts by XRD, N2 physisorption and thermogravimetric analysis indicated that the deposition of coke resulted in the total obstruction of micropores and the partial blockage of mesopores. Moreover, the presence of large mesopores and surface areas allowed the amount of coke deposited at the catalyst surface to be reduced.

1. Introduction

The production of biodiesel for its use as fuel in diesel engines has gained importance during recent decades, leading to the rapid growth of the biodiesel industry. Since the process yields glycerol as a byproduct in quantities around 10% of the volume of produced biodiesel, the global production of glycerol has increased, resulting in a decrease in its market price [1]. Currently, crude glycerol has low economic value due to the presence of impurities, reaching 0.22 USD·kg−1, while pure glycerol price ranges between 0.6 and 0.9 USD·kg−1 [2,3]. Additionally, according to the Organization for Economic Cooperation and Development (OECD) and the Food and Agriculture Organization of the United Nations (FAO), it is expected that glycerol production from the biodiesel industry will reach and remain around 4.4 billion liters per year between 2020 and 2028 [4].
In this context, the valorization of glycerol by means of catalytic reactions has been investigated in recent years in order to change the current status of glycerol as a byproduct into raw material for the synthesis of value-added compounds [1,2,5,6,7]. The catalytic dehydration of glycerol has become important since it may yield acrolein as the main reaction product, representing a route for its renewable production in comparison with the current process based on the partial oxidation of propylene derived from fossil resources [8].
The interest in acrolein production lies in its high reactivity induced by the presence of conjugated carbonyl and vinyl groups, finding applications as reagent and intermediary in the industrial synthesis of methionine, acrylic acid and its derivatives, propionaldehyde, allyl alcohol, 1,2- and 1,3-propanediol, and acrolein acetals as well as pyridine bases and their derivatives [9].
Several solid acids have been evaluated to carry out the glycerol dehydration reaction in gaseous phase, mainly supported by heteropolyacids, mixed metallic oxides, functionalized oxides and protonated and metal-promoted zeolites [10,11,12]. The main property of these catalysts that affect the glycerol dehydration reaction is the amount and type of acid sites present at the catalyst surface, either Brønsted or Lewis acid sites, which are known to promote the dehydration reactions of alcohols [13]. Depending on the reaction conditions and the physicochemical properties of the catalyst, several byproducts such as aldehydes, ketones, carboxylic acids and alcohols in the range of C1–C3 may be obtained from the glycerol dehydration reaction [14,15,16].
Although most of the mentioned catalysts exhibit high dehydration activity, many of them are thermally unstable, produce a wide variety of reaction byproducts in large amounts, are expensive and/or require complex preparation methods. Thus, zeolites remain as potential catalytic materials for the conversion of glycerol to acrolein due to their tunable acidity and pore structure, either during their preparation or by post-synthesis treatments, besides their thermal stability and low cost.
The glycerol dehydration activities of several protonated zeolites were tested by Kim et al. [17,18] in a fixed-bed reactor. The most active catalysts were zeolites H-ZSM-5 (150) and H-ferrierite (55) at 340 °C, reaching maximum conversions of 93.7% and 70.9%, respectively, and acrolein yields of 53.8% and 54.6% in the same order. These authors found that the catalytic activity was associated with the surface area of the catalysts and their surface acidity, related to the SiO2/Al2O3 ratio.
Gu et al. [19] studied the influence of the channel structure on the catalytic performance of a set of protonated zeolites, namely H-ZSM-5, H-ZSM-11, Hβ and HY, on the gaseous conversion of a 20 wt% glycerol-water mixture to acrolein at 320 °C and gas hourly space velocity (GHSV) equal to 873 h−1. Their results demonstrated that channels with diameters slightly larger than the molecular diameter of glycerol improve the catalytic performance of the catalysts, as was the case of H-ZSM-5 and H-ZSM-11 zeolites, which produced 13.7% and 31.3% more acrolein yield than the HY zeolite, respectively.
Subsequently, most of the research developed on zeolite catalysts for the glycerol dehydration has focused on the improvement of the catalytic performance of H-ZSM-5 zeolite. For instance, Possato et al. [20] reported the use of micro-/mesoporous MFI zeolites, obtained by desilication of the microporous zeolite, to produce acrolein from a 10 wt% glycerol aqueous solution at 300 °C. The authors concluded that the catalysts with mesoporous structure diminished diffusion limitations, increasing the glycerol conversion. However, no improvement in acrolein selectivity was observed despite the fact that the concentrations of Brønsted and Lewis acid sites were modified with the desilication treatment.
Zhang et al. [21] synthesized a set of hierarchical ZSM-5 zeolites, with different mesoporous structure but similar acidity, and compared their catalytic performance in the glycerol dehydration with a conventional ZSM-5 zeolite. The mesoporous catalysts showed enhanced activity and high stability with time-on-stream (TOS). The best results were an acrolein yield of 87% with complete glycerol conversion during 14 h, while the conventional zeolite reached 81% of acrolein yield deactivated after 3 h of TOS, at 320 °C, weight hourly space velocity (WHSV) equal to 2.4 h−1 and 20 wt% of glycerol in the feedstock. The authors concluded that open and interconnected mesopore architectures are more effective than closed and small mesopores.
Neves et al. [22] synthesized micro-/mesoporous ZSM-5 zeolites with Si/Al ratios of 25, 50 and 75 and tested them in the gaseous phase reaction of 10 wt% glycerol-water mixture at 300 °C and WHSV = 38.5 h−1. The results showed a favorable effect of the mesoporosity on the catalytic activity, increasing the glycerol conversion from 88% to 99%, as well as the acrolein yield from 77% to 85%, with the increase of the mesopore volume from 0.073 to 0.13 cm3·g−1 at 1 h of TOS. The deactivation behavior of the catalysts was also improved with the presence of mesoporosity, maintaining glycerol conversions around 65%, 46% and 16% in the order Si/Al = 25, 50 and 75 at 4 h of reaction, respectively.
Since zeolite Y, with faujasite-type structure, has been widely used as an effective catalyst for a variety of acid-catalyzed reactions, this study presents the use of commercial HY zeolites with different SiO2/Al2O3 molar ratios as catalysts in the gas-phase glycerol dehydration to acrolein, taking into account the effect of the reaction temperature as well as the surface acidity and the textural properties of the catalysts on their catalytic activity.

2. Results and Discussion

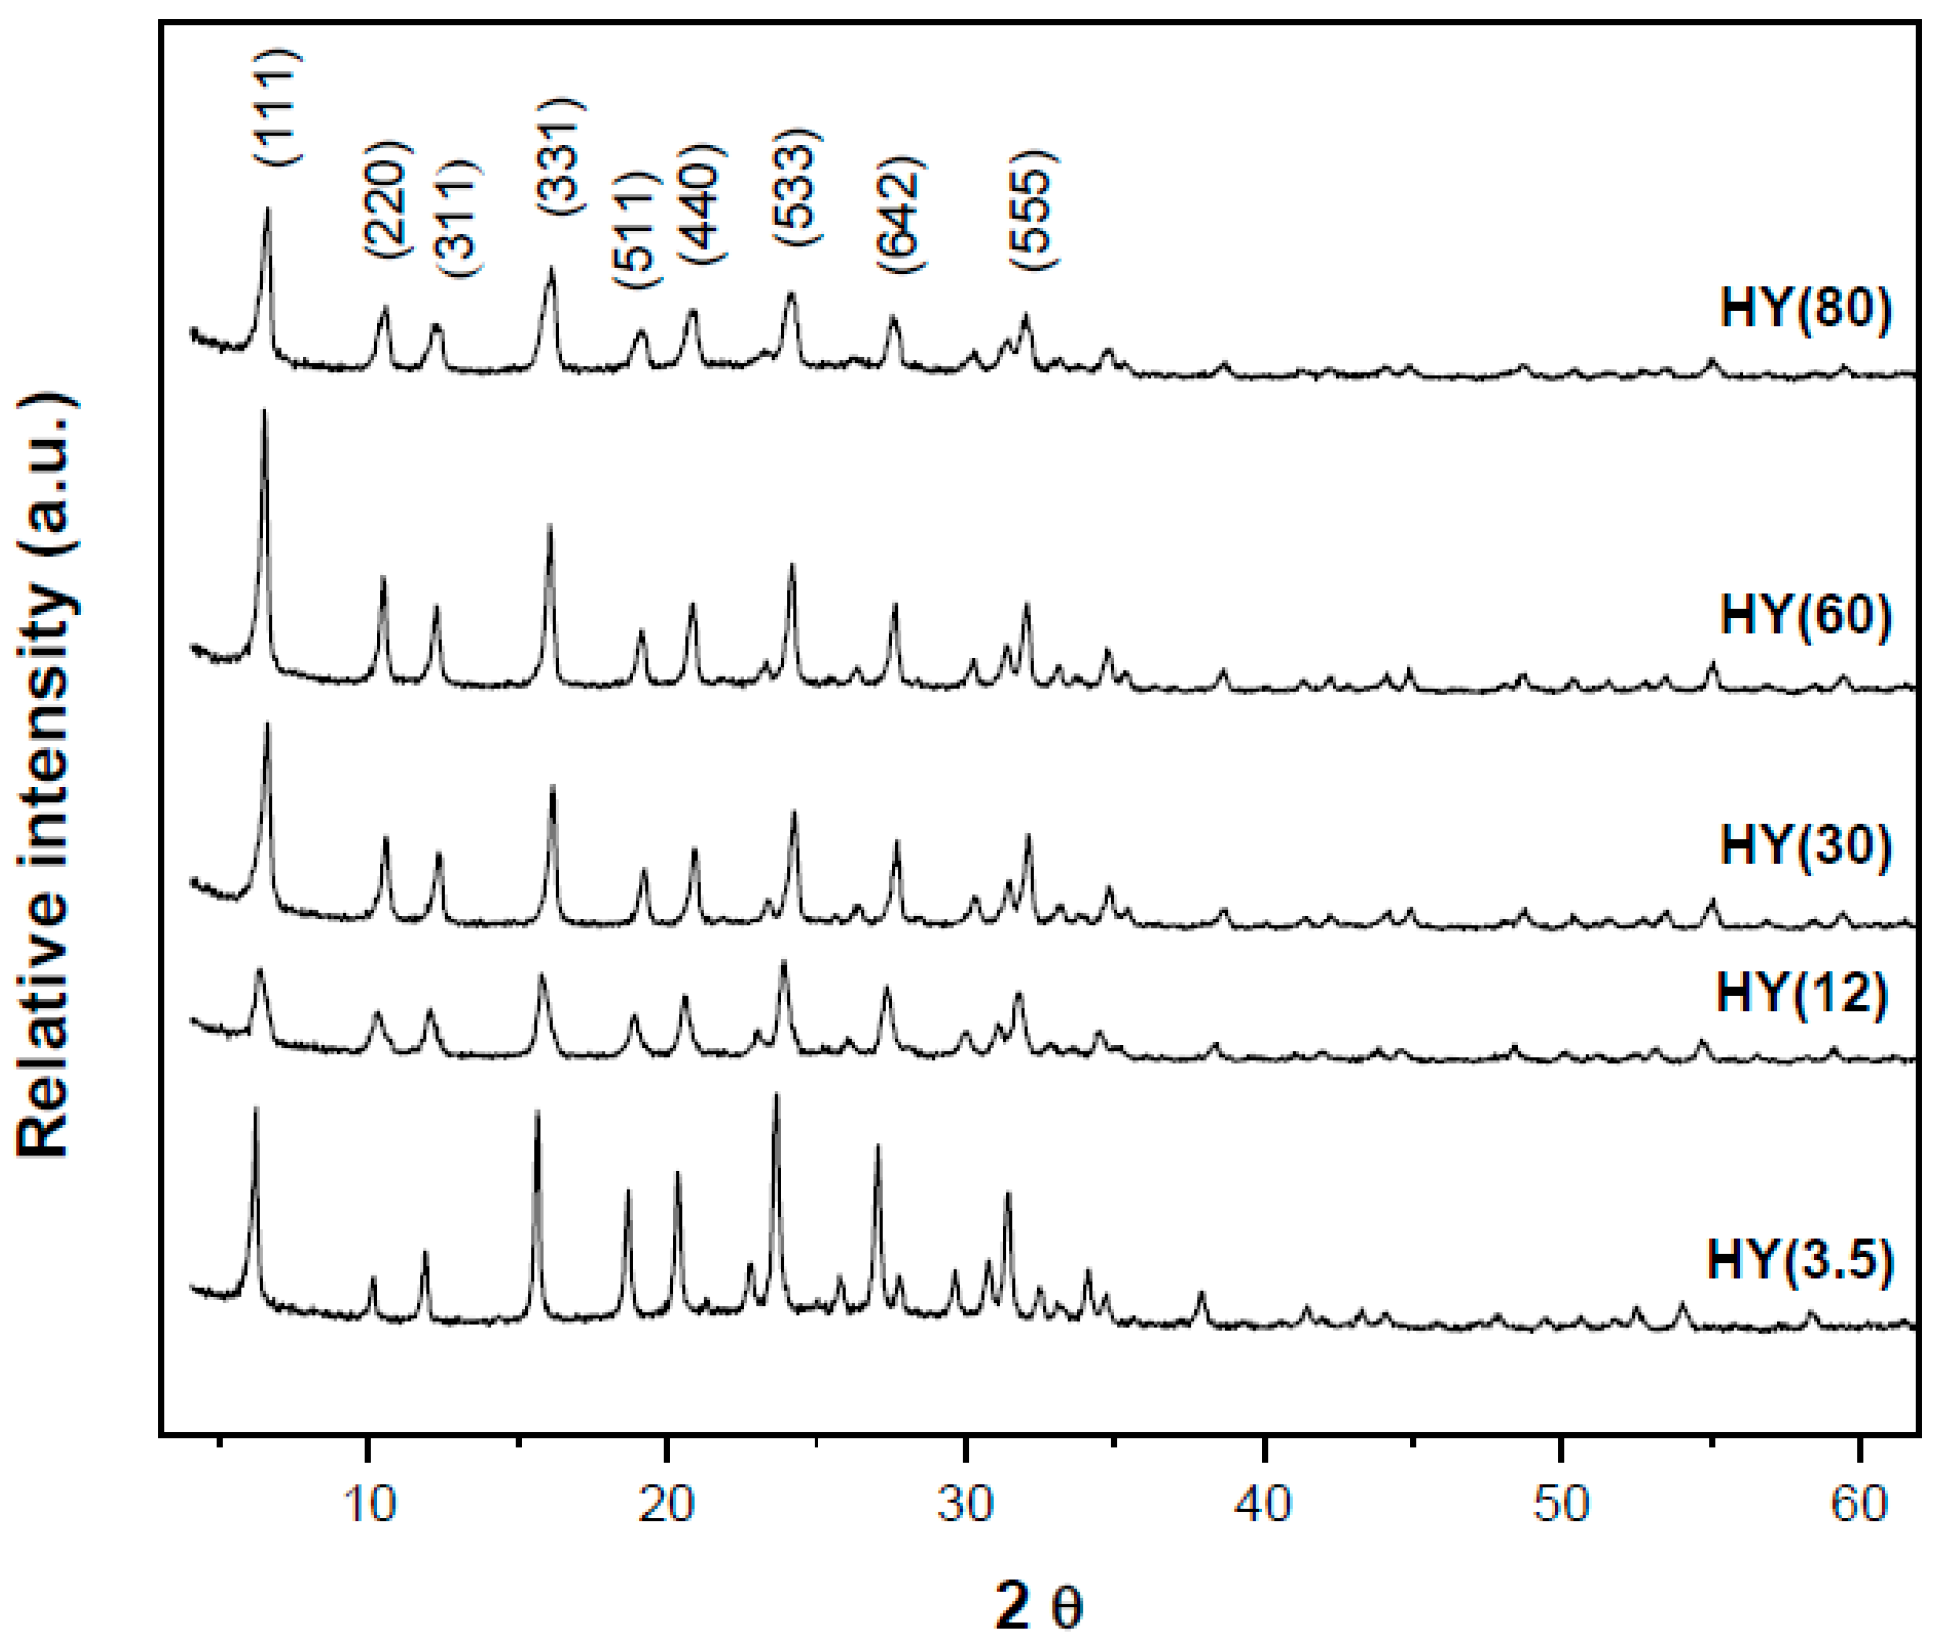
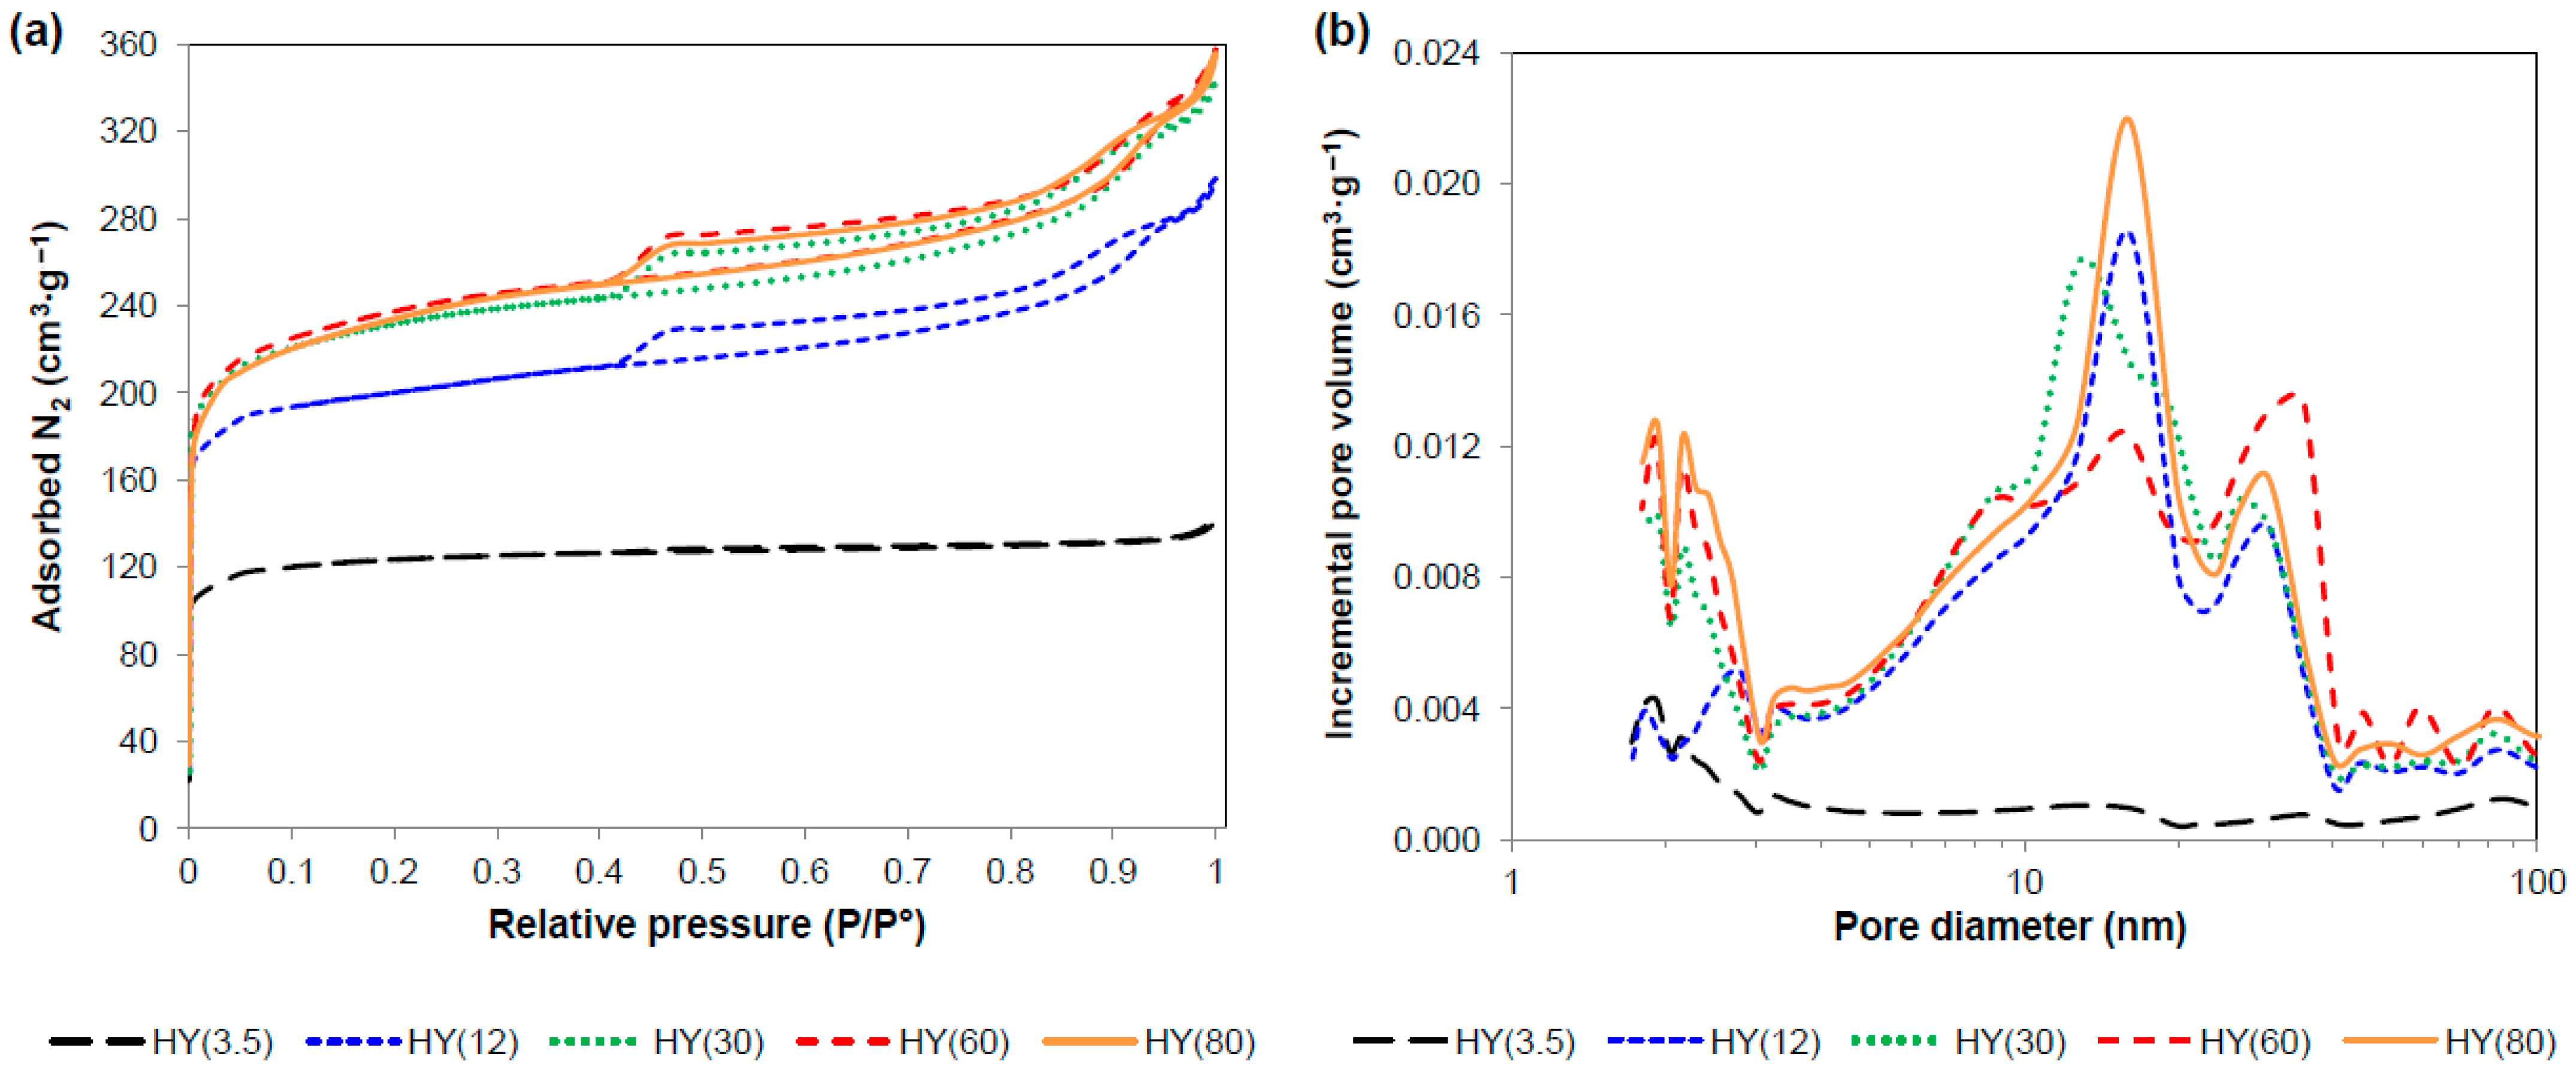
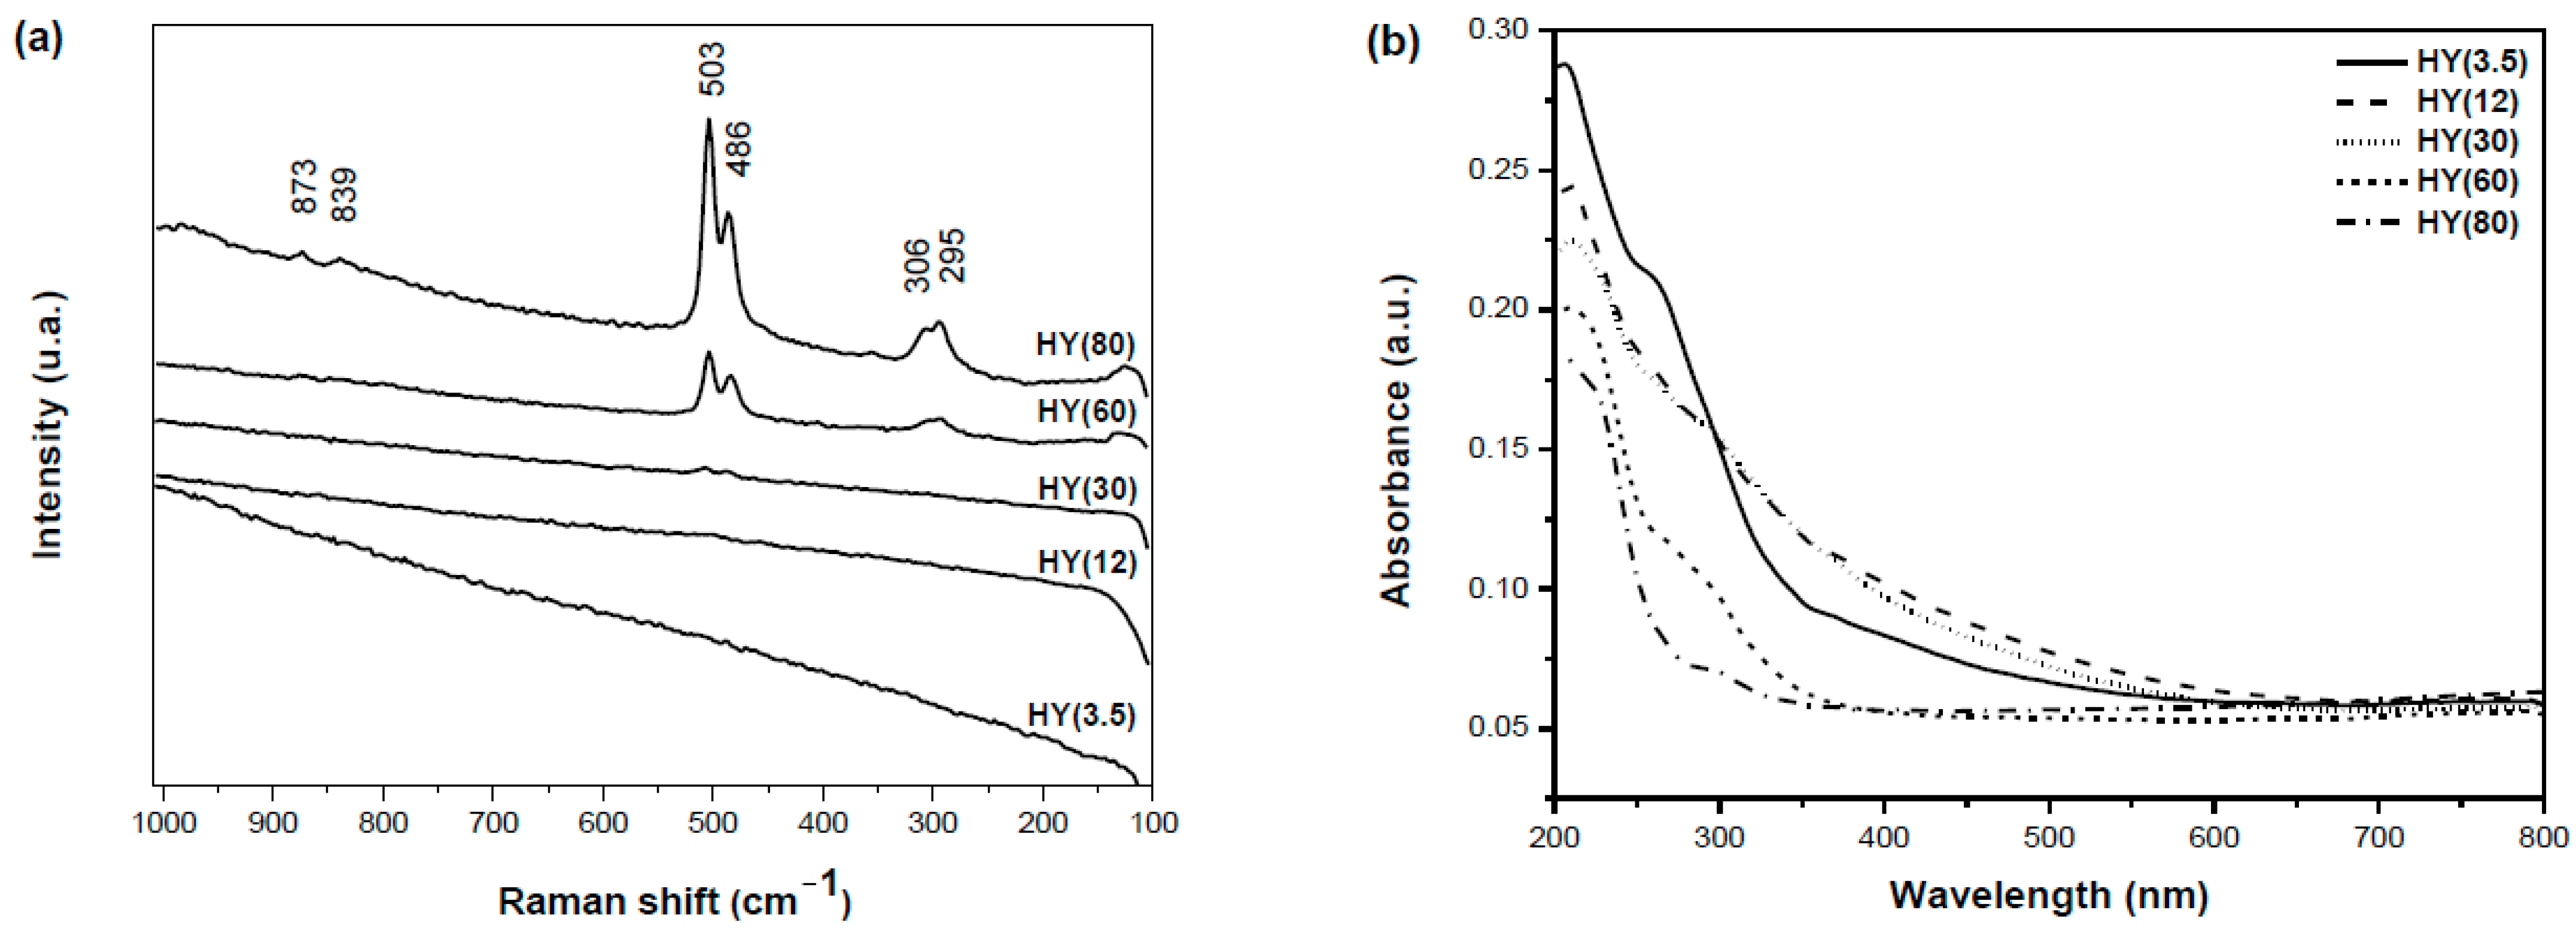
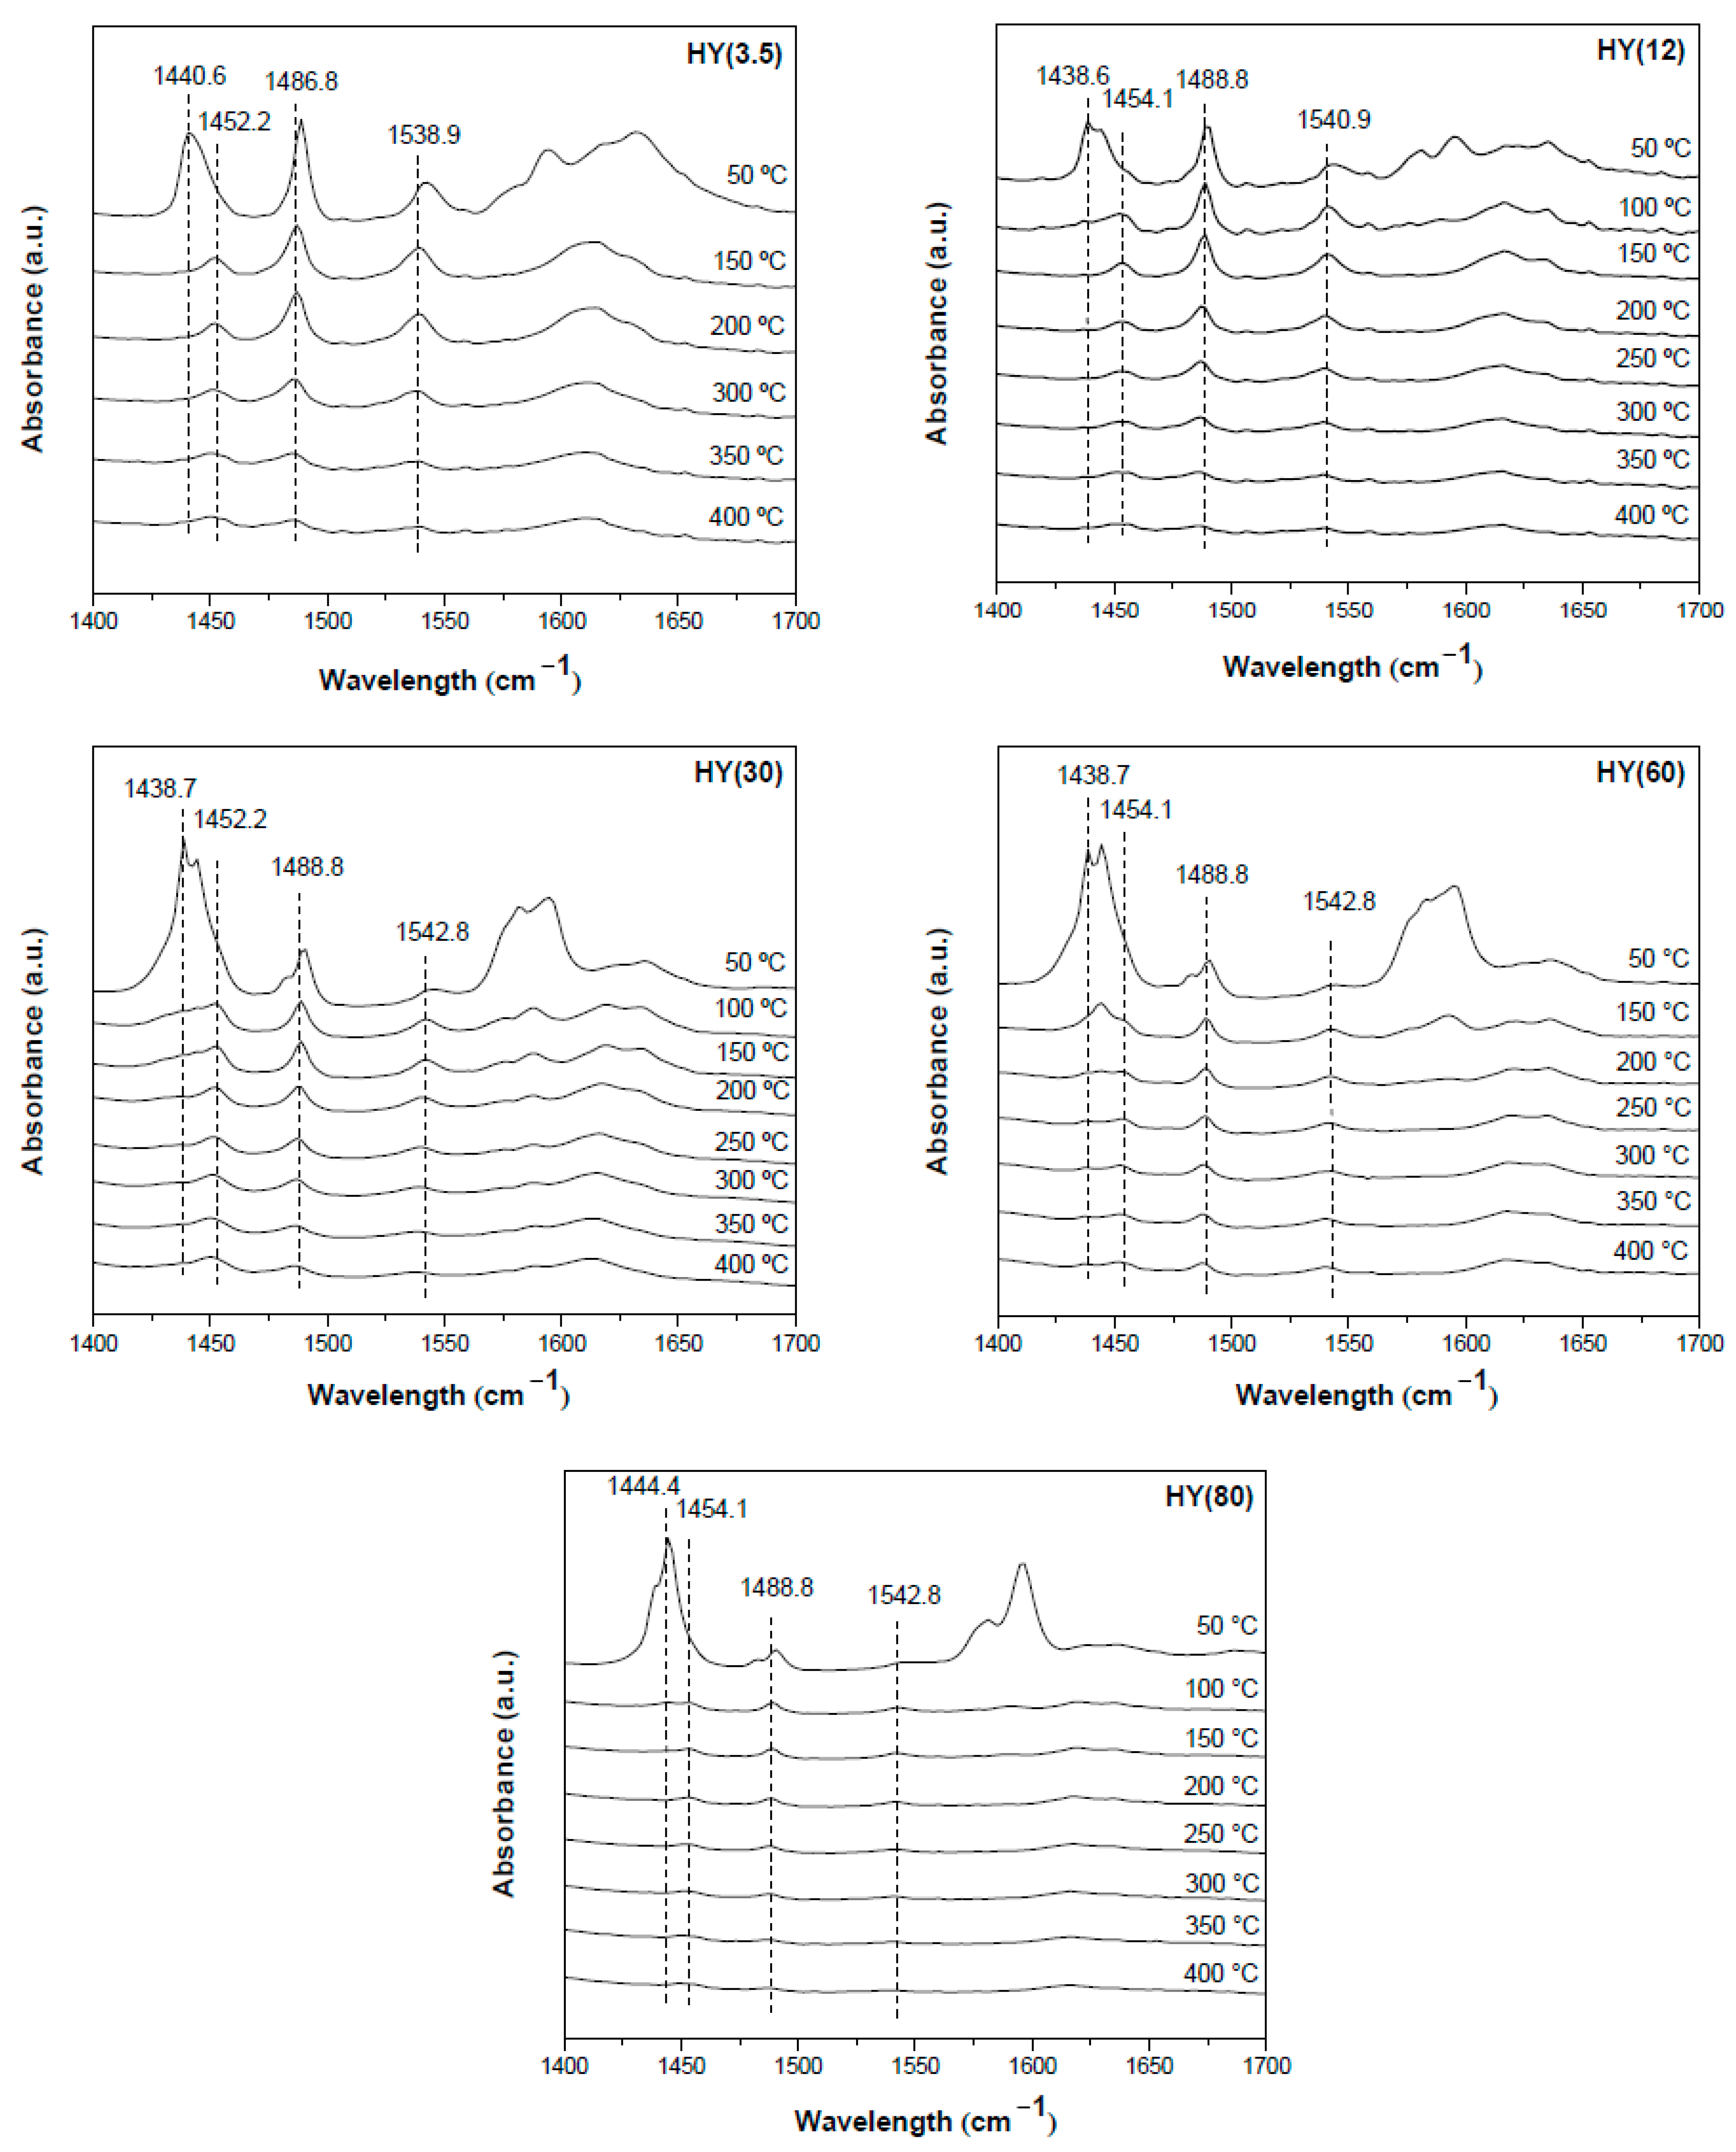
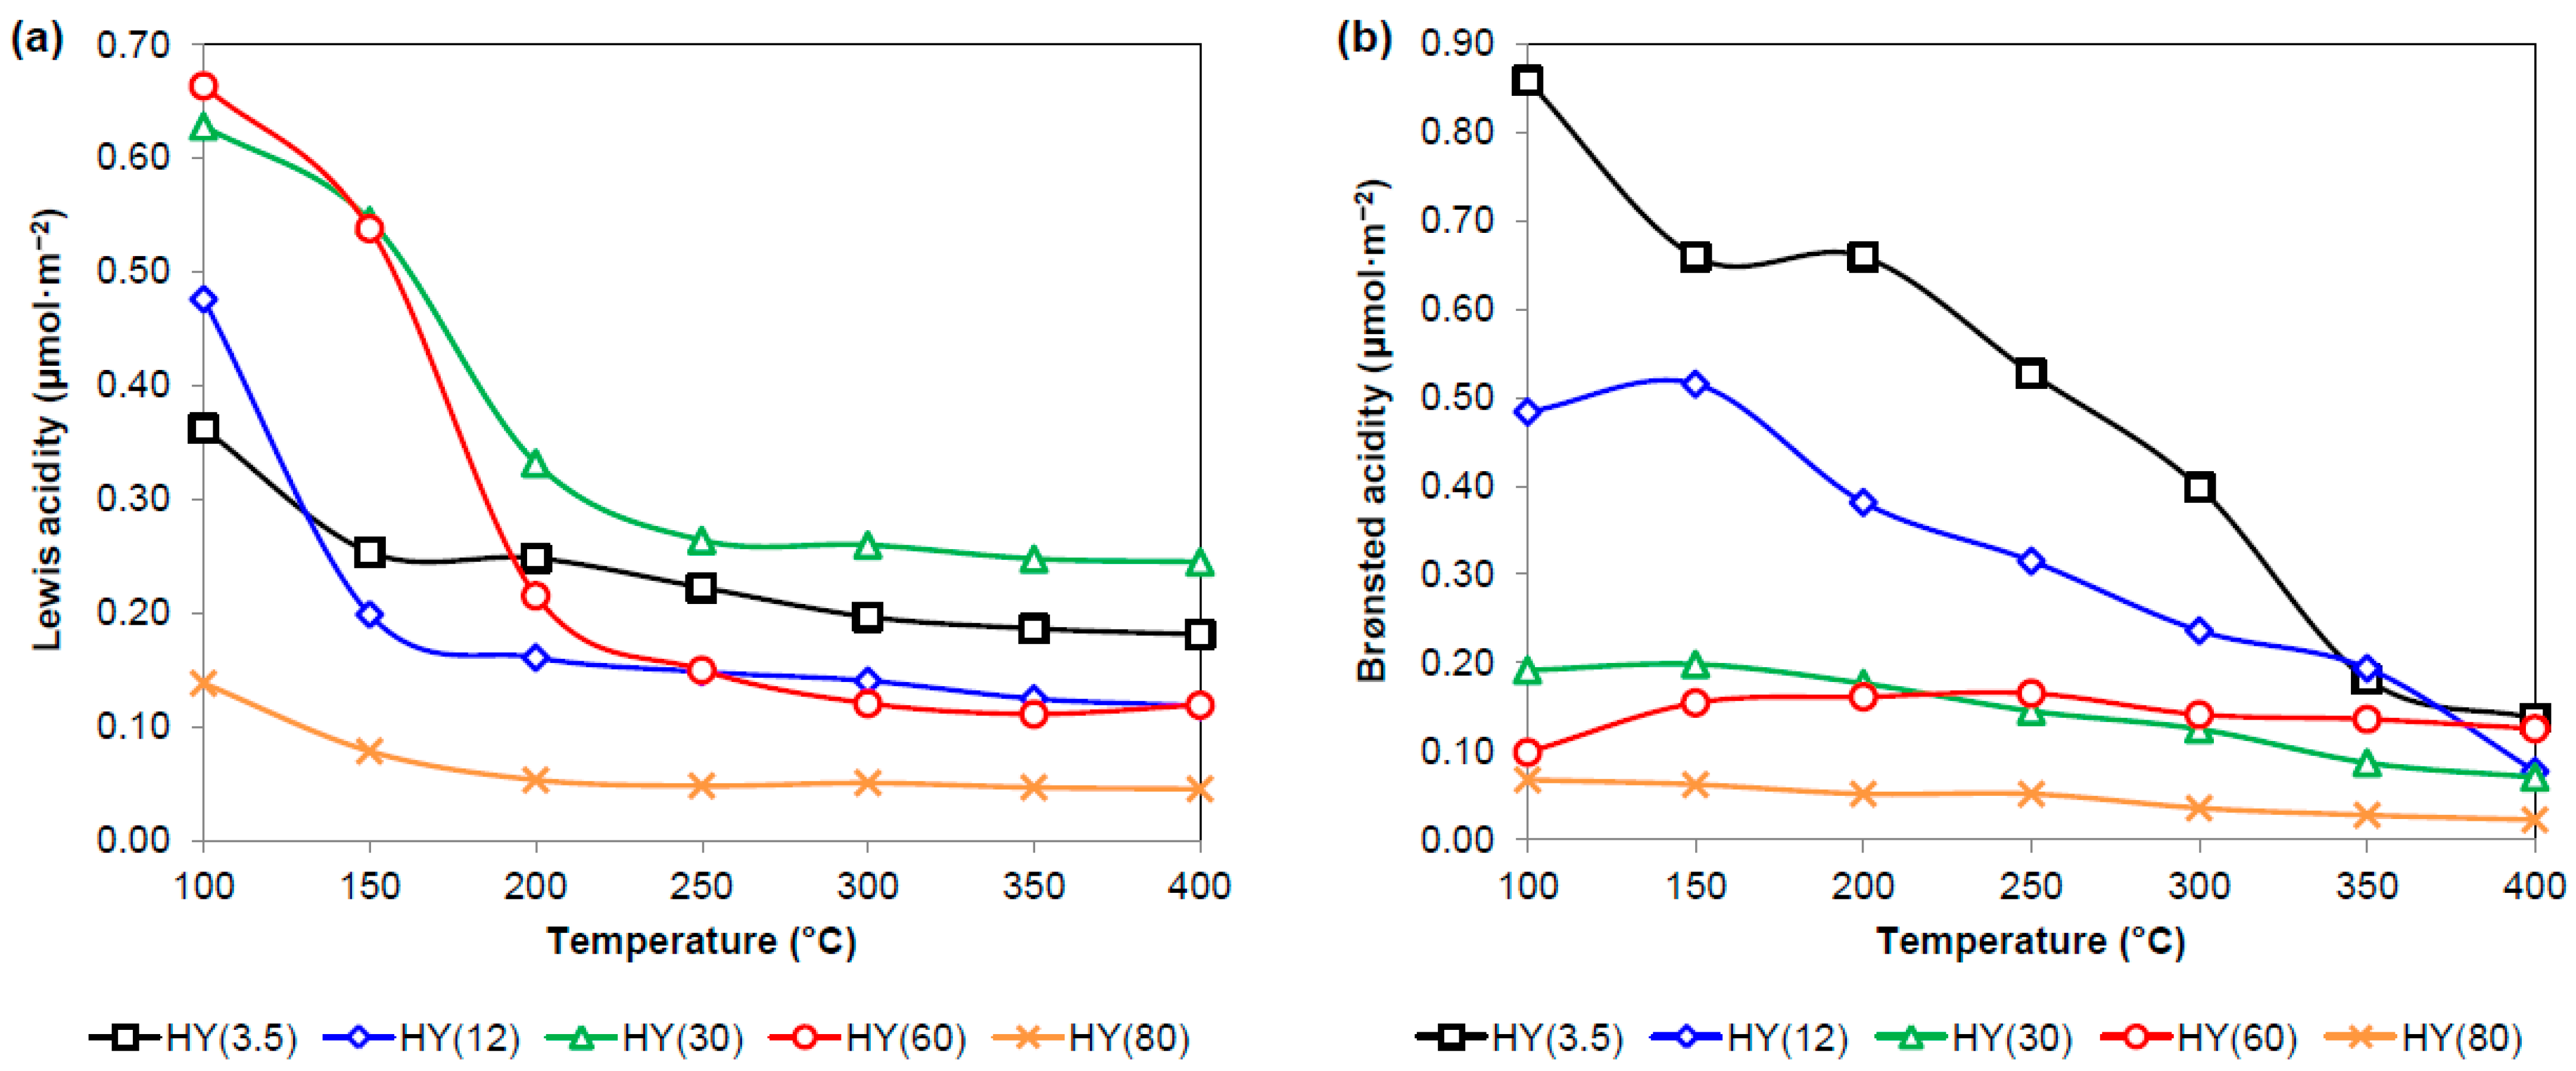
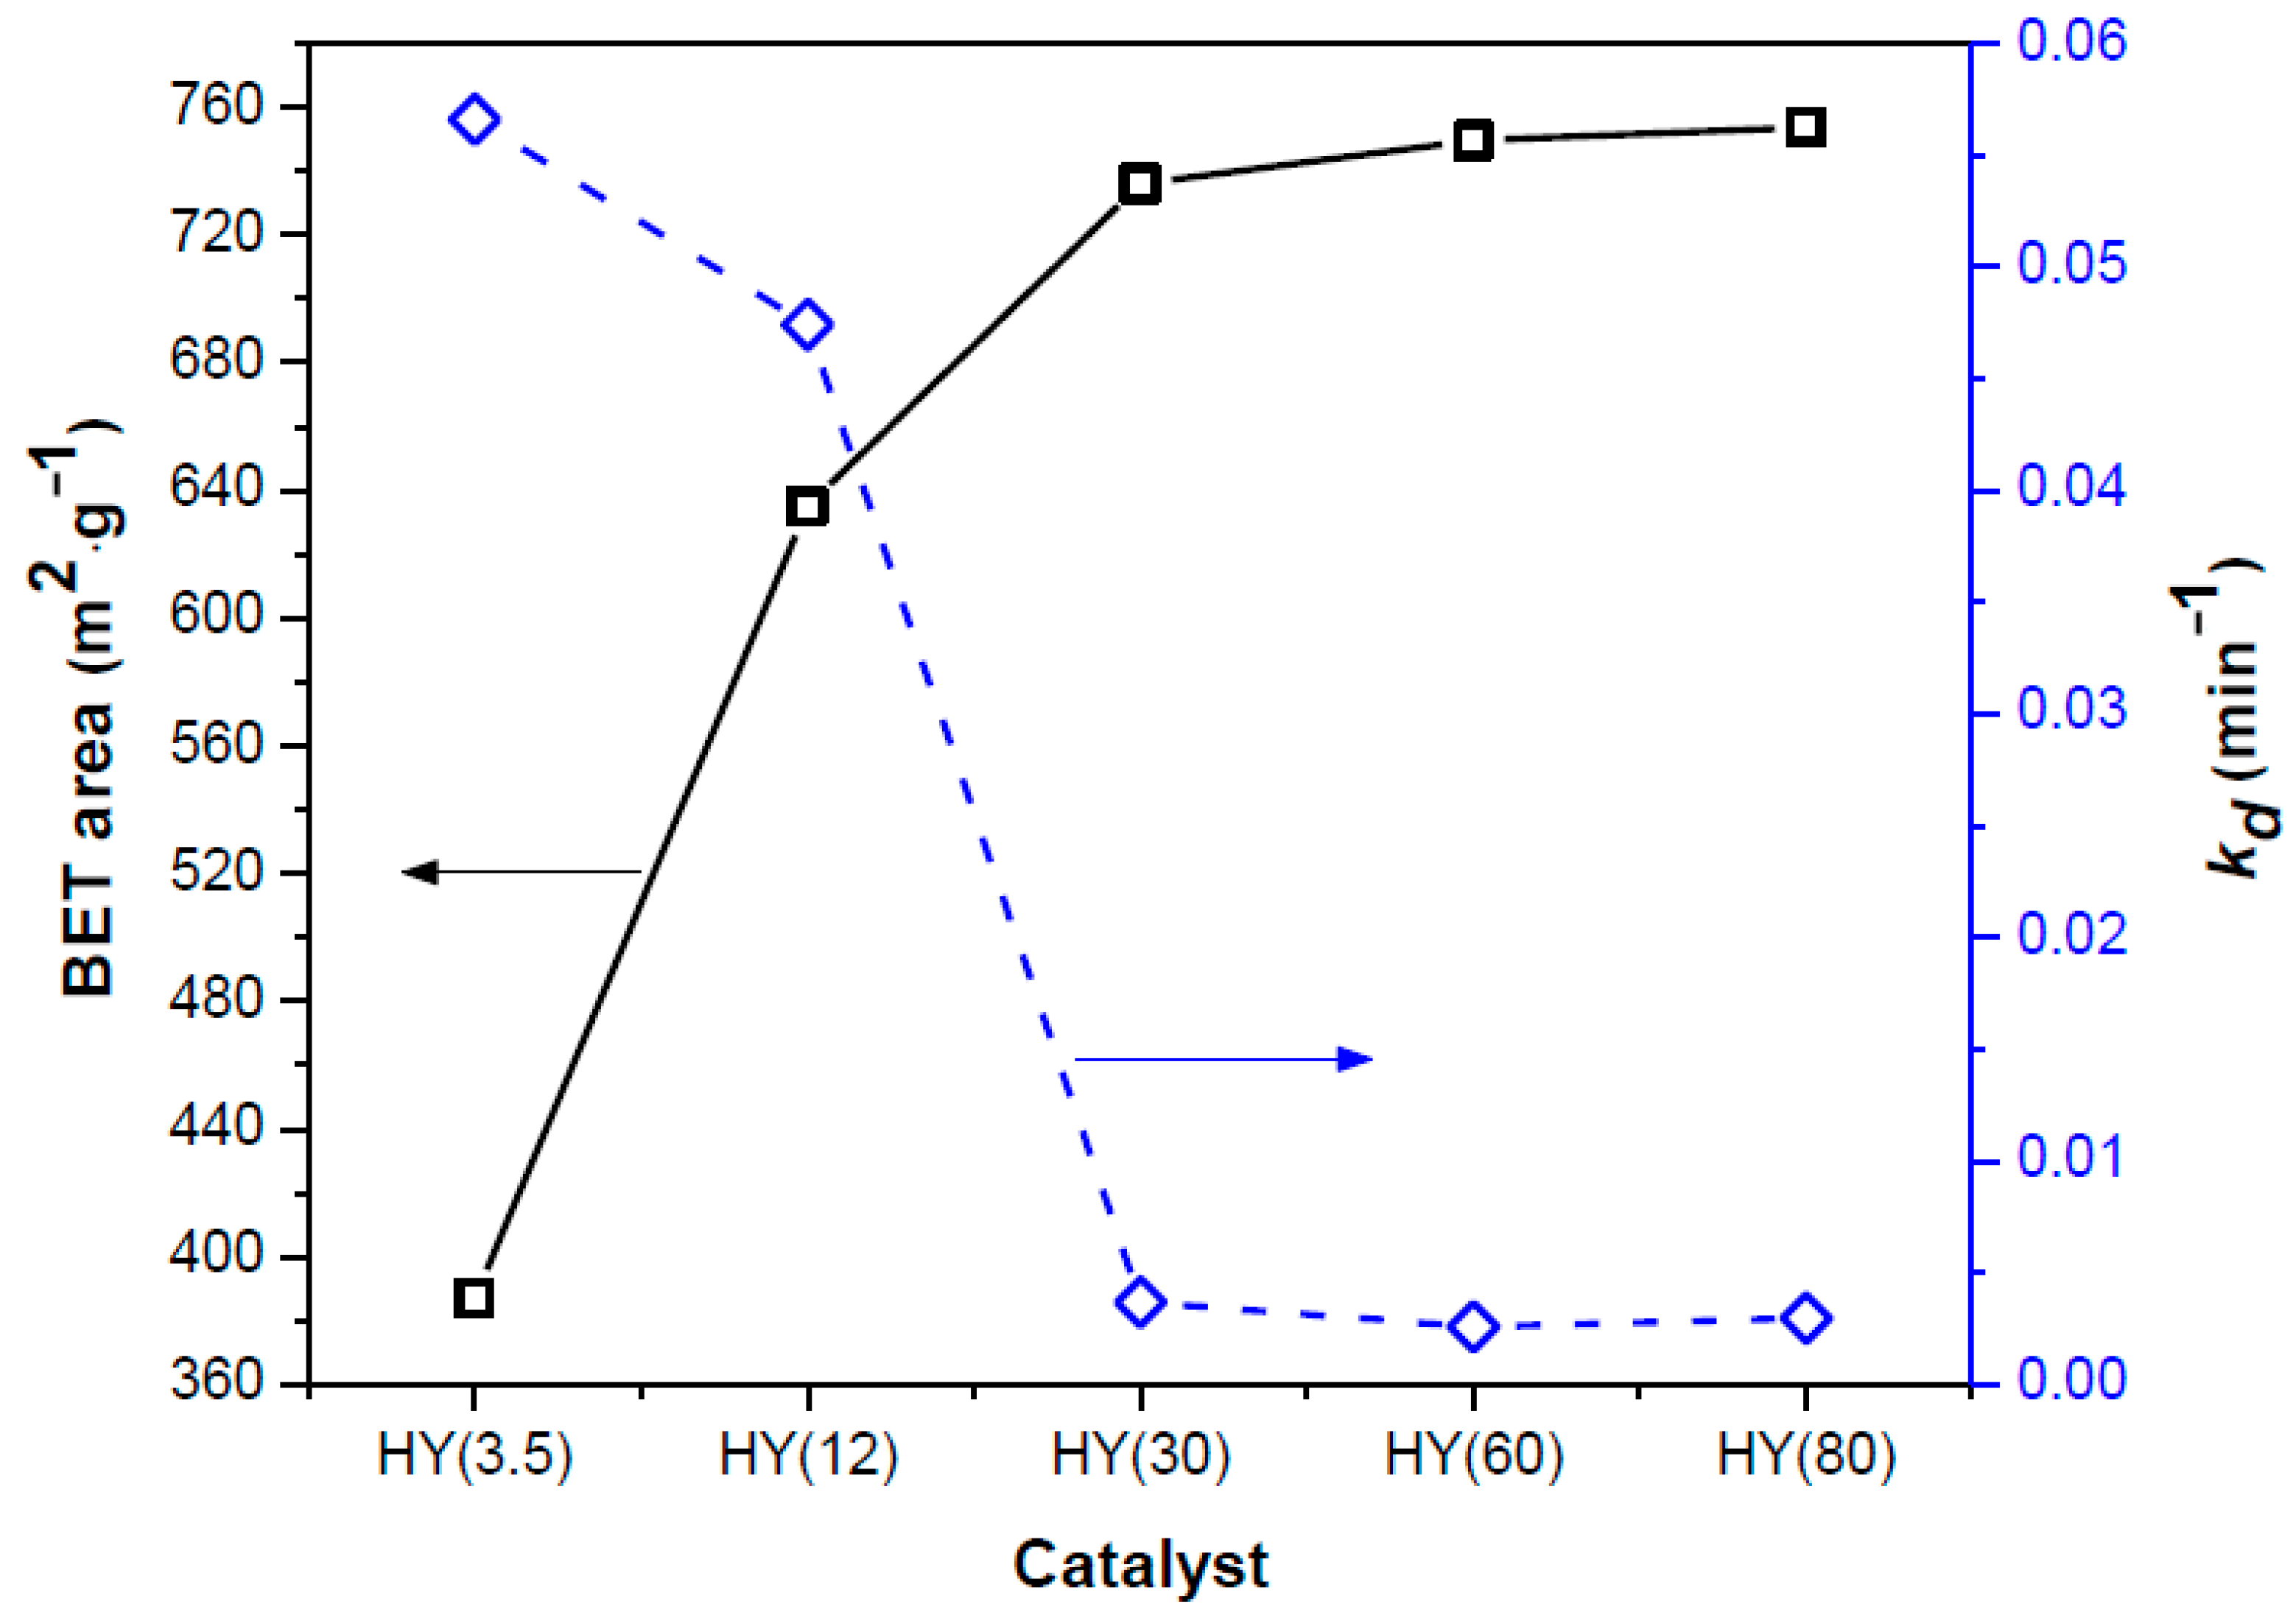
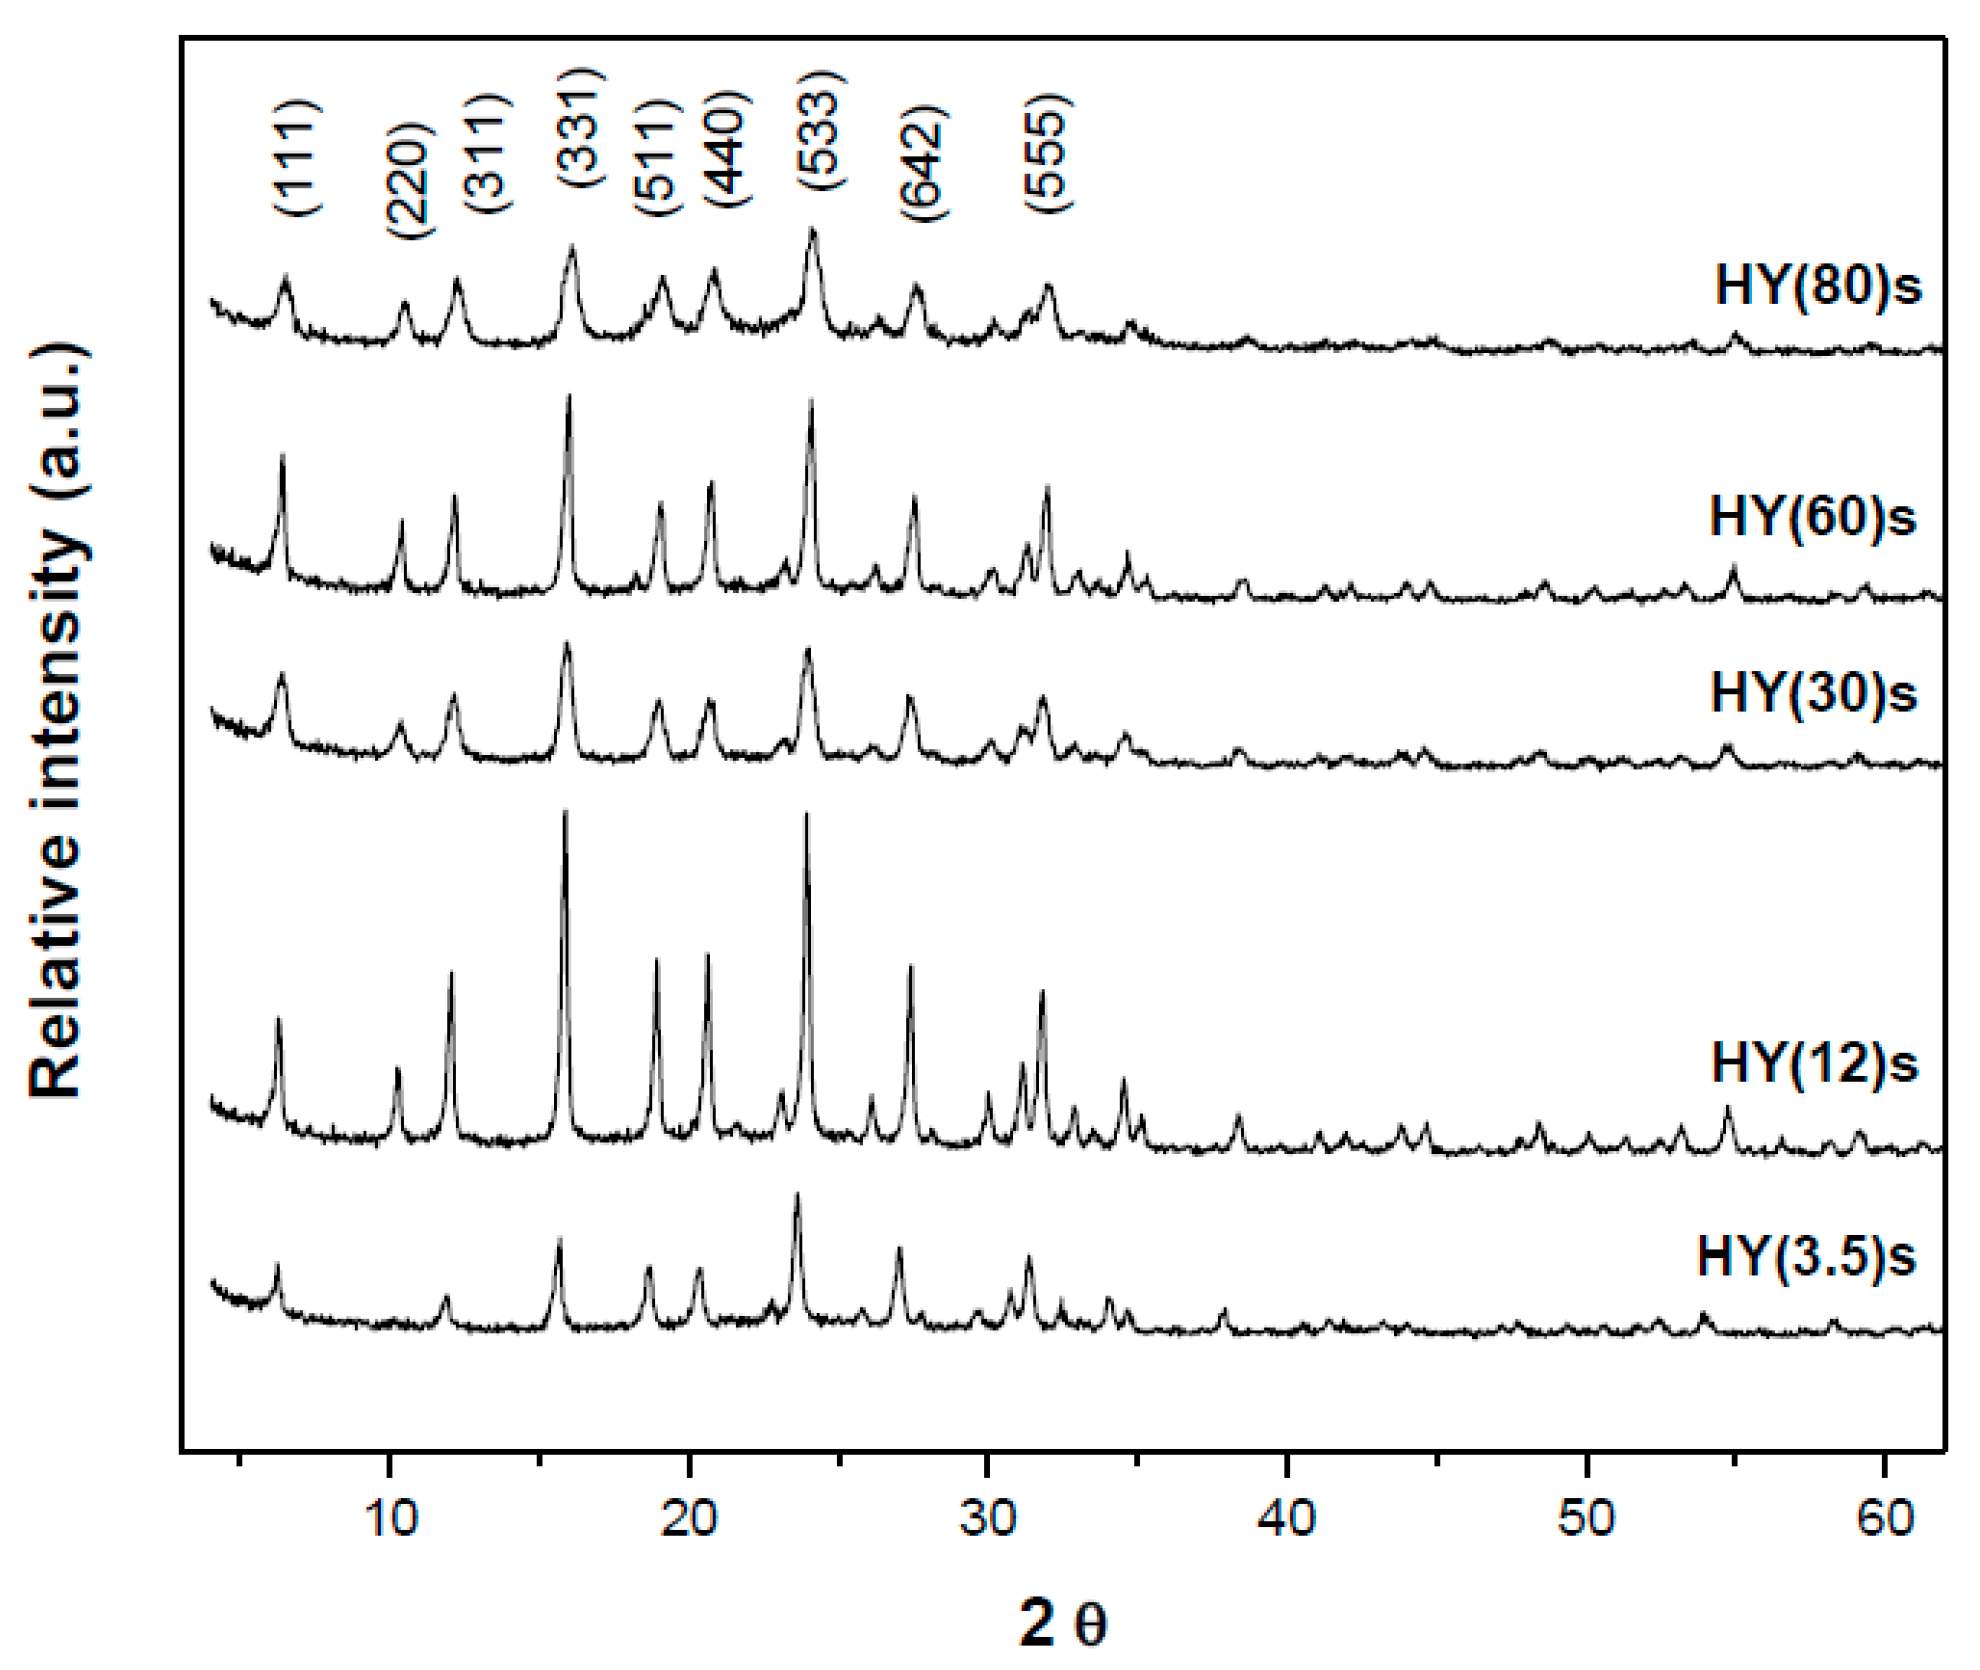
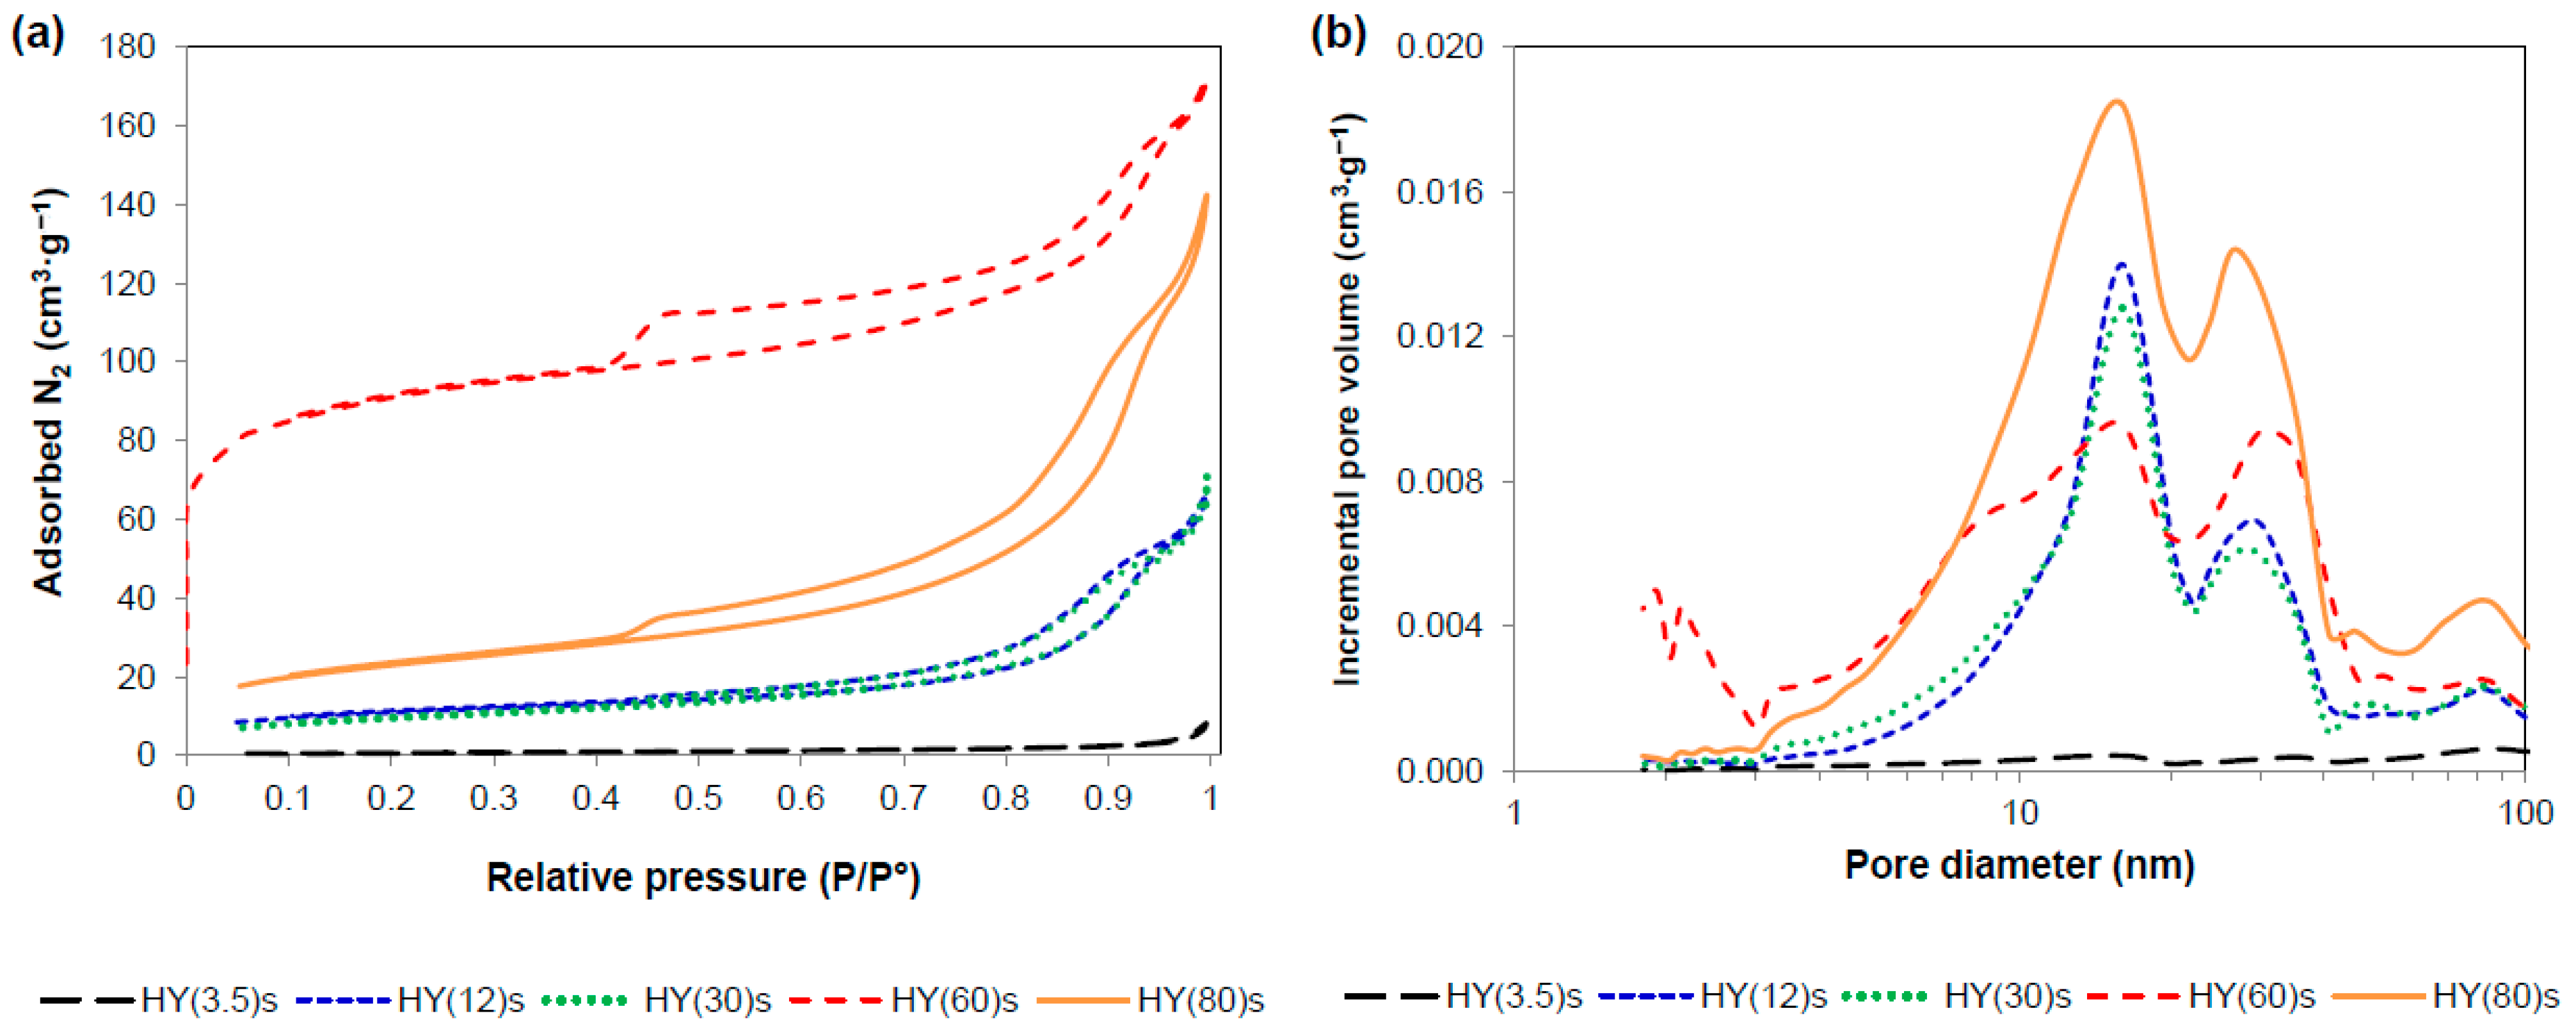
2.1. Characterization of Catalysts

The crystalline structures of the zeolite samples were confirmed by X-ray diffraction (XRD). As shown in Figure 1, the XRD patterns presented the characteristic reflections of aluminum silicate hydrated with faujasite-type structure (JCPDS card 00-043-0168). For each sample, the most intense reflection corresponded to the (111) plane located at 6.19–6.33° of the 2θ scale.
Presented in Table 1, the crystallite sizes were estimated from the integrated area of the most intense reflection taking into account the Scherrer equation. The zeolite HY(3.5) showed the largest crystal size, around 57.1 nm, in comparison with the samples with SiO2/Al2O3 molar ratios of 12, 30, 60 and 80, whose sizes were estimated at 32.7 nm, 52.8 nm, 44.3 nm and 45.8 nm, respectively. This behavior in the crystal size is in agreement with the study of Lutz et al. [23], who reported the decrease in the average crystal size from 100 nm to 85 nm of a series of Y zeolites obtained by dealumination.
Figure 2a shows the N2 adsorption–desorption isotherms of the HY zeolites with different SiO2/Al2O3 ratios. The HY(3.5) zeolite exhibited an adsorption isotherm type I, characteristic of microporous materials, while the rest of the zeolite samples presented isotherms type IV, related to mesoporous solids. The samples showed hysteresis loops of type H4 with steep declines at the desorption isotherms, characteristic of aggregates or agglomerates of particles forming slit-shaped pores (plates or particles with edges such as cubes) with uniform size and shape [24,25].
According to the data in Table 1, the increase in the SiO2/Al2O3 molar ratio of the zeolites from 3.5 to 80 resulted in the increase in the specific surface area from 387.05 m2·g−1 to 753.77 m2·g−1, as well as in the increase of the pore volume from 0.053 cm3·g−1 to 0.287 cm3·g−1.
Regarding the porosity of the solids, the HY(3.5) zeolite presented mainly micropores between 1.7 nm and 2 nm, and a minor fraction of small mesopores between 2 nm and 3 nm. On the other hand, the samples with SiO2/Al2O3 molar ratios of 12, 30, 60 and 80 exhibited mostly mesopores of sizes between 8 nm and 60 nm as shown in Figure 2b. The pores in particular are known as the slit-shaped parallel plate type. In the ideal case, the plates are flat and parallel, so the shape of the meniscus during adsorption is planar; on the other hand, in evaporation, the meniscus has a cylindrical shape and evaporates under pressure, causing the appearance of the hysteresis cycle. The mechanisms for filling and emptying the pore are completely different: the first is due to the formation of multilayers, and the second is due to capillary evaporation.
The SEM micrographs of the HY zeolites are presented in Figure A1 (Appendix A). In all cases, the images showed particles with rough and porous surfaces, as well as polygonal, faceted and irregular morphologies, of hexagonal, pyramidal tetrahedral and elongated parallelepipeds type, which are characteristic of the zeolite with faujasite structure [19,26,27]. However, there was not an effect of the SiO2/Al2O3 molar ratio on the morphology and particle size.
Quantitative elemental analysis obtained from EDXS is presented in Table A1 (Appendix A). The samples were constituted by silicon, aluminum and oxygen, as confirmed by the EDXS spectra. The SiO2/Al2O3 molar ratios of the samples were confirmed by atomic absorption spectroscopy (AAS) as presented in Table 1, with a mean absolute error of 6.53% and standard deviation of 0.85.
Figure 3a shows the Raman spectra of the HY zeolites. The samples with high aluminum content, HY(3.5) and HY(12), showed spectra with no noticeable bands, while the spectrum of the sample HY(30) presented very weak bands at 503 cm−1 and 486 cm−1. For the samples with SiO2/Al2O3 molar ratios of 60 and 80, these two bands were intense, and additional bands at 873 cm−1, 839 cm−1, 306 cm−1 and 295 cm−1 were observed. A similar behavior was observed by Dutta et al. [28] for a series of Y zeolites with variable Si/Al ratio and a siliceous faujasite. The bands at 873 cm−1 and 839 cm−1 correspond to the displacement of silicon atoms from the cavity formed with the four bonded oxygen atoms as well as the stretch vibrations of the Si-O bonds [29,30]. On the other hand, the prominent bands between 300 cm−1 and 600 cm−1 are sensitive to the type of rings present at the zeolite structure. In the case of zeolites with even rings (4, 6, 8, 10 or 12 members), such as the faujasite-type structure, the most intense bands are shown around 500 cm−1. Specifically, Y zeolites with high silicon contents show the appearance of a band at approximately 490 cm−1, which, besides the band at 500 cm−1, are related to the bond angles of 141° and 147° formed by the Si-O-Si bonds, involving the mixed vibration of stretching and bending of the oxygen atom [28,31,32,33]. The torsional modes of low frequency and the cation-oxygen modes are related to the bands between 200 cm−1 and 400 cm−1 [28].
The UV-vis spectra of the zeolites are shown in Figure 3b. The samples HY(3.5), HY(12), HY(30), HY(60) and HY(80) presented a main band at 260, 283, 285 280 and 280 nm, respectively, decreasing the absorbance with the decrease in the aluminum content. This band is related to the charge transfer of the πp-πd transition between oxygen species (O2-) and tetrahedral aluminum (Al3+) of the zeolite structure. The band extends up to 335 nm due to the presence of extra-framework aluminum species. Similar behavior has been reported for zeolite-type solids such as silicalite-1 and ZSM-5 [34,35].
Fourier transform infrared spectra with adsorbed pyridine (FTIR-Py) of the zeolites with different SiO2/Al2O3 molar ratios at different temperatures are shown in Figure 4. In all cases, the adsorption of pyridine resulted in the appearance of bands at 1438–1440 cm−1, 1452–1454 cm−1, 1486–1488 cm−1, 1538–1542 cm−1 and a set of overlapping bands between 1575–1660 cm−1. According to the literature, the strong band between 1440–1447 cm−1 is related to hydrogen-bonded pyridine, the bands between 1447–1460 cm−1 are evidence of the coordination of pyridine with the Lewis acid sites (LAS) and the band at 1540 cm−1 is associated to the protonation of pyridine over Brønsted acid sites (BAS) [36]. The multi-peak at 1580–1660 cm−1 results from ring vibrations of the molecule [37]. For the HY zeolites of this study, the doublet between 1438–1444 cm−1 was appointed to hydrogen-bonded pyridine and in all the samples disappeared with the increase in the desorption temperature from 50 °C to 100 °C. On the other hand, the Lewis acidity was associated with the bands at 1452–1454 cm−1, and the Brønsted acidity was related to the bands between 1538–1542 cm−1. The bands at 1486–1488 cm−1 were attributed to pyridine adsorbed on both BAS and LAS [36].
In any case, the increase in the desorption temperature of pyridine resulted in a gradual decrease of the intensity of the bands at 1452–1454 cm−1 and 1538–1542 cm−1, indicating the decline of the amount of both types of acid sites. Moreover, after the desorption of the hydrogen-bonded pyridine, the comparison of the spectra of the HY zeolites evidenced a decrease in the absorbance with the increase in the SiO2/Al2O3 molar ratio. This trend suggests that the decrease in the aluminum content in the zeolites resulted in minor amounts of acid sites at the catalyst surface. A similar behavior has been reported for zeolites such as H-ZSM-5 [17,38], HY [39], Hβ [40] and MCM-22 [41] with varying aluminum compositions.
Figure 5a,b present the respective quantification of LAS and BAS of the HY zeolites at different temperatures obtained by the integrated areas of the bands at 1452–1454 cm−1 and 1538–1542 cm−1, respectively. Both types of acid sites were present in high concentrations at low temperatures, while the increase in the desorption temperature from 100 °C to 250 °C resulted in a considerable decrease in the Lewis acidity, maintaining its concentration almost constant up to 400 °C. The Brønsted acidity diminished gradually with the increase in temperature from 100 °C to 400 °C. On the other hand, a decrease in the total amount of acid sites was observed with the increase in the SiO2/Al2O3 molar ratio of the zeolites from 3.5 to 80. However, the trends for both types of acid sites were not directly related to their composition. As seen in Figure 5a, the sample HY(30) possessed more Lewis acidity than the rest of the samples at any temperature. The zeolites HY(3.5) and HY(12) presented higher amounts of BAS than the rest of the solids, (Figure 5b), and the HY(80) zeolite exhibited similar proportions of both types of acid sites.
In our studies on the relationship between Brønsted and Lewis acid sites and the type of Al atom coordination in aluminas prepared with CTAB using 27Al NMR spectroscopy and infrared spectroscopy of adsorbed pyridine [42], we found that when the Brønsted/Lewis site ratio increases, the ratio of aluminum in tetrahedral coordination (AlIV) to aluminum in pentahedral coordination (AlV) also increases. It appears that the presence of AlIV favors the formation of Brønsted sites and the presence of AlV favors the formation of Lewis sites.
If we use these correlations between acidic sites and the two types of coordination in aluminum for these zeolites, it would seem that Al atoms in tetrahedral coordination would prevail more at low Si/Al ratios of 3.5 and 12, while Al atoms in pentahedral coordination Si/Al ratios of 60 and 30 would prevail more.

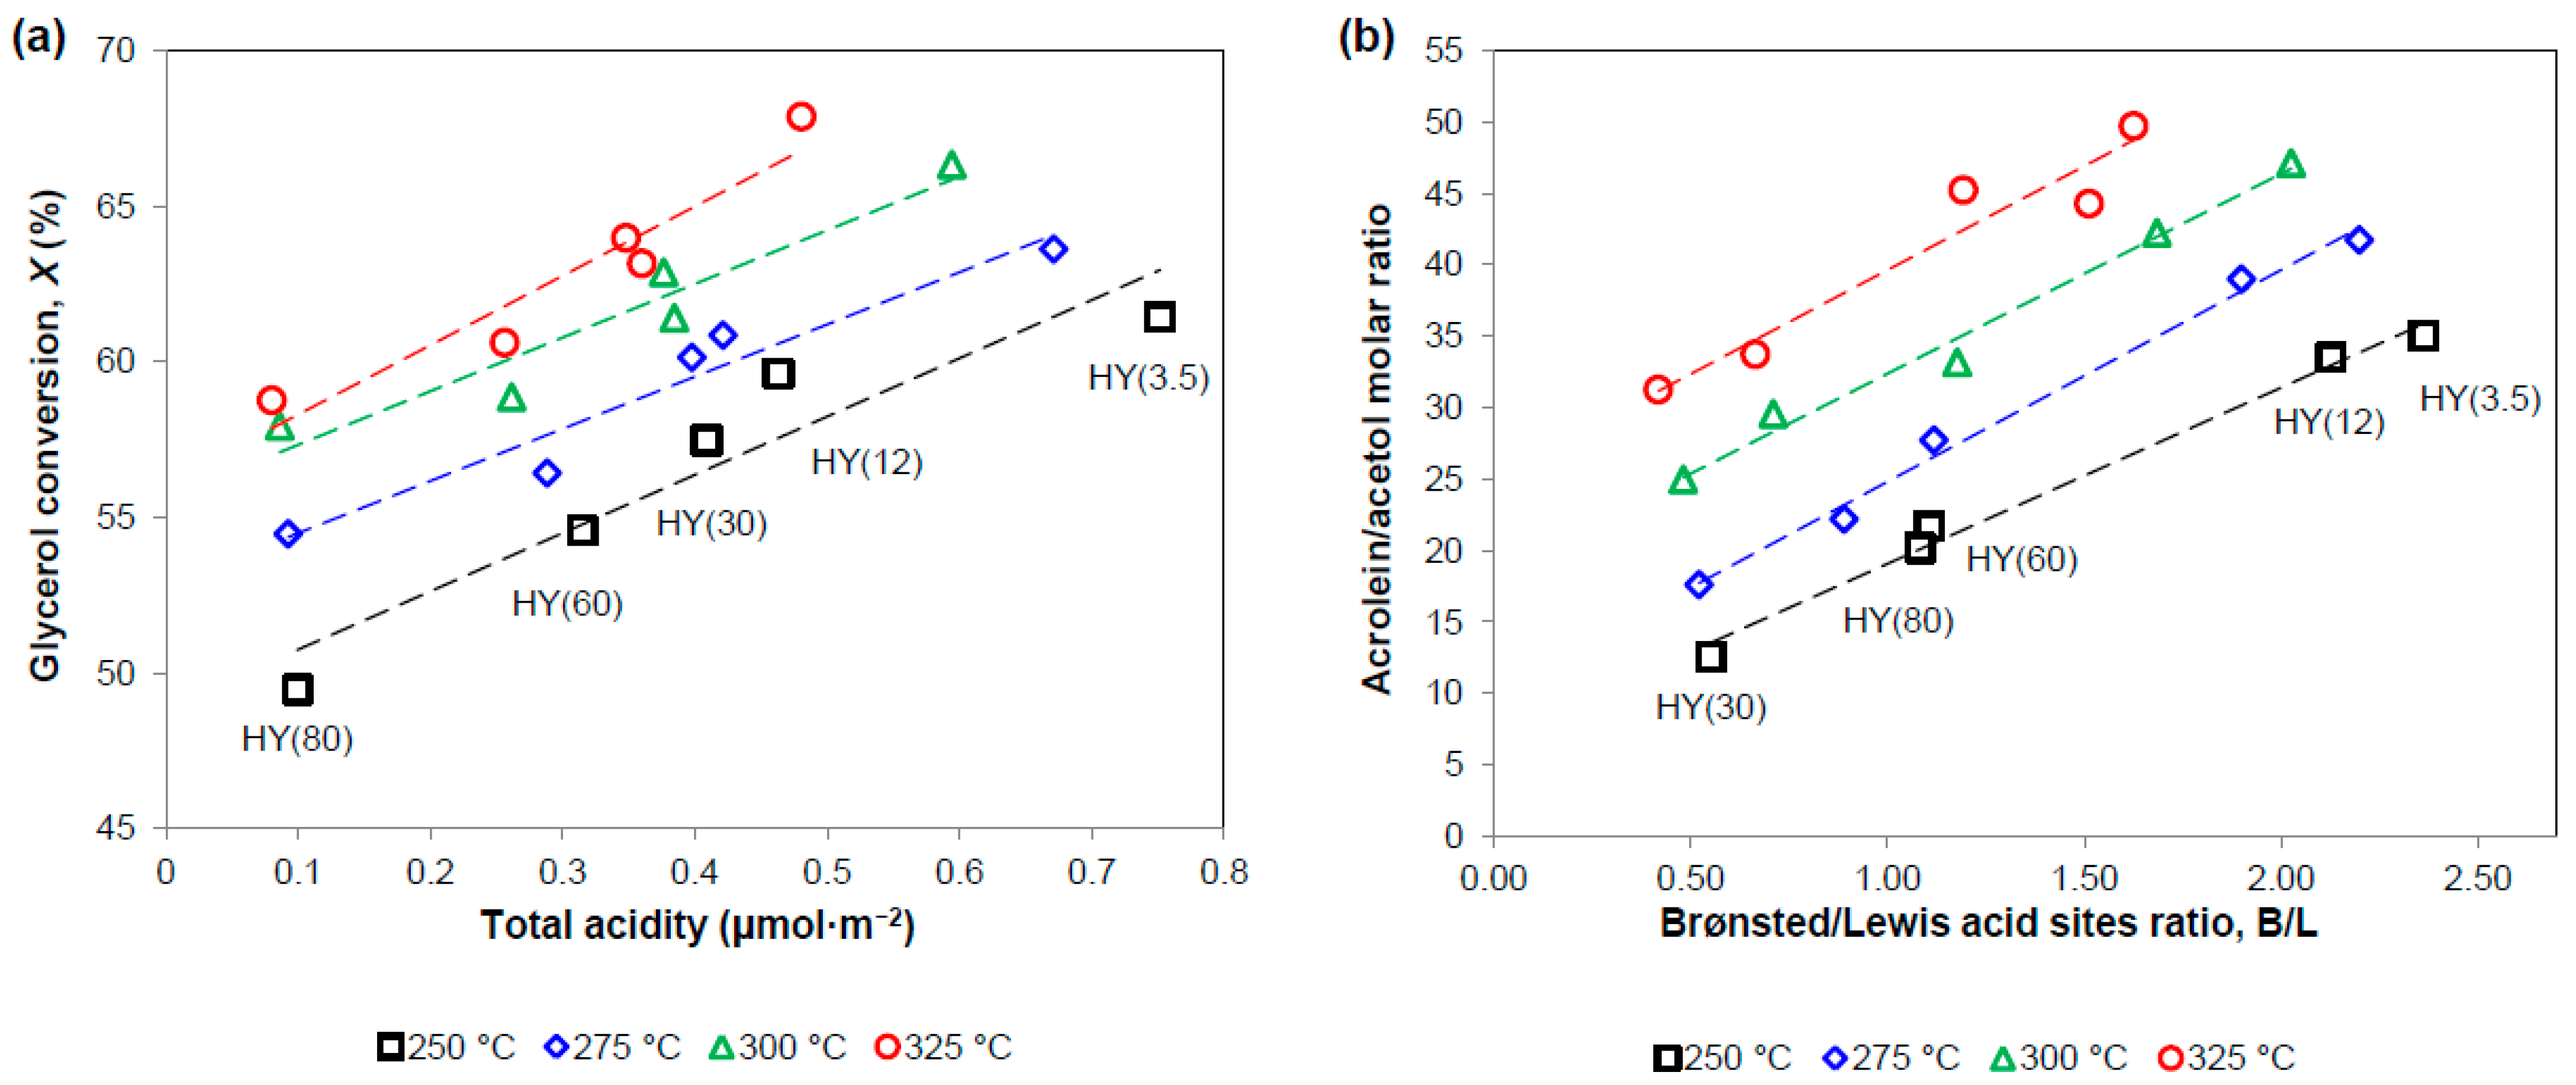
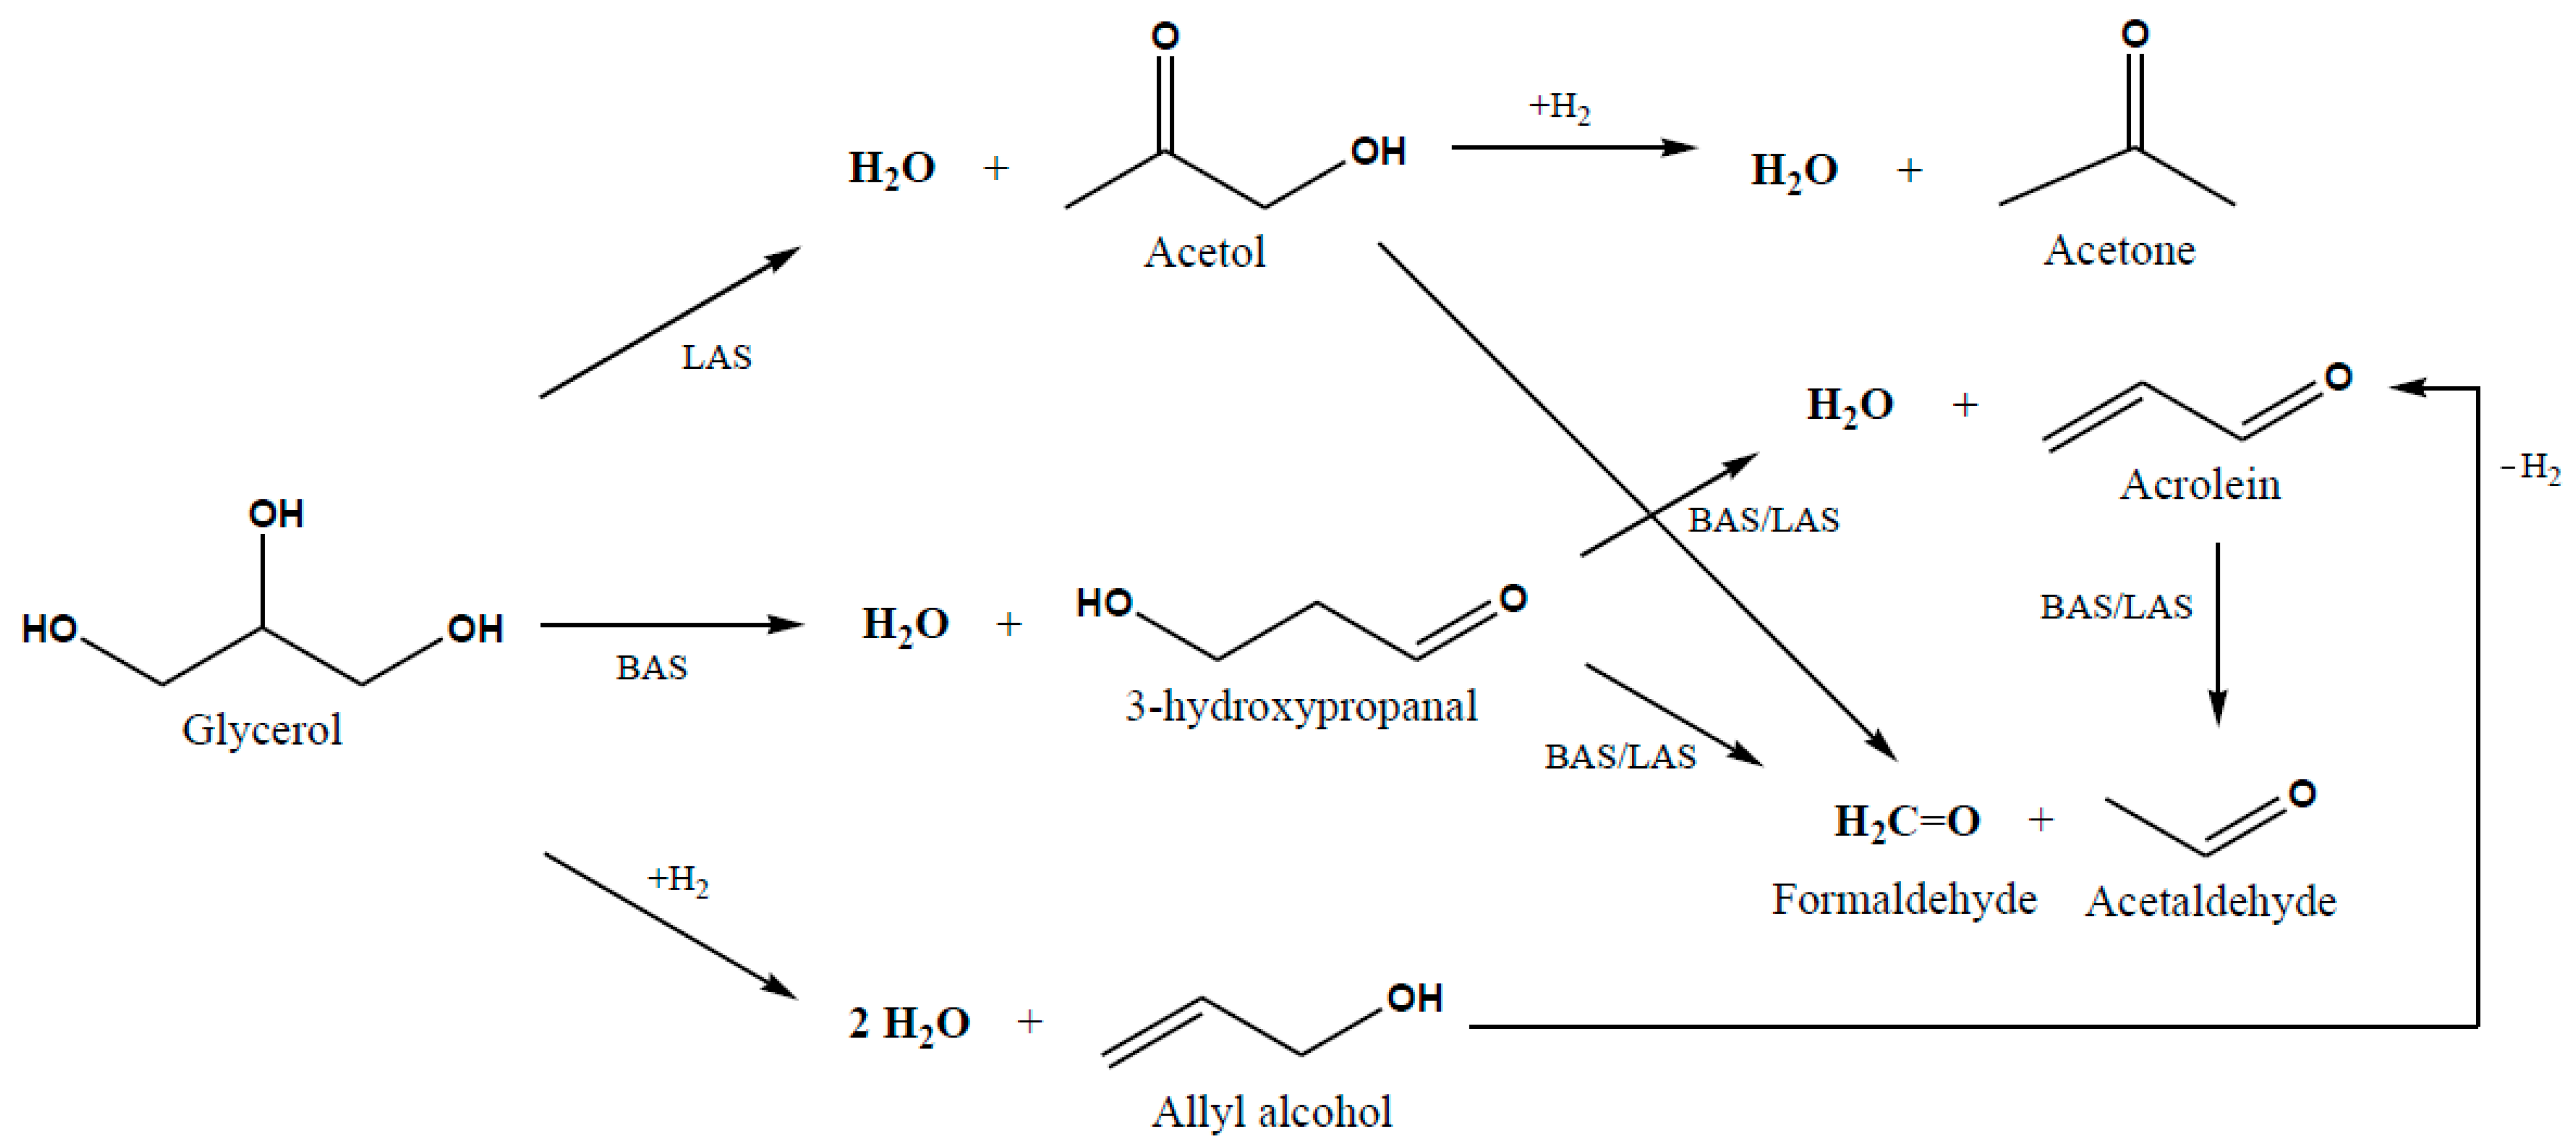
2.2. Catalytic Activity

The HY zeolites with different SiO2/Al2O3 molar ratios were active as catalysts in the dehydration of glycerol at temperatures between 250 °C and 325 °C and gas hourly space velocity (GHSV) of 7910 h−1. As presented in Table 2, the initial conversions (TOS = 5 min) increased with temperature, reaching maximum values at 325 °C. The compounds identified by gas chromatography at the output stream from the reactor were acetol, acrolein, acetaldehyde, formaldehyde, acetone and allyl alcohol.
In agreement with thermodynamic calculations [43], in all cases, acrolein was the major product at the output stream from the reactor, improving its formation with the increase in temperature, with exception of the reaction over HY(3.5) zeolite, which mostly promoted the acetaldehyde production. For all the catalysts, acetol was produced to a minor extent compared to the other products and decreased with the increase in temperature, while the formation of acetaldehyde was notably enhanced up to 325 °C. Moreover, acetone and allyl alcohol were present in varied proportions up to 27.29% and 20.95%, respectively, without a clear trend regarding the temperature. The carbon balance was above 50% for all the catalysts, between 54% and 67%, which was attributed to the formation of coke over the catalysts. Comparable values have been reported for MFI and Al doped SBA-15 catalysts [20,44].
On the other hand, the increase in the SiO2/Al2O3 molar ratio from 3.5 to 80, resulted in the decrease in the glycerol conversion at any temperature. As seen in Figure 6a, this trend was related to the total amount of acid sites of the zeolites, which also diminished with the decrease in the aluminum content. A similar behavior has been reported for other zeolite catalysts with varying Al content [22,38,45]. Furthermore, the selectivity of dehydration products was found to be correlated with the type of acid sites present at the catalyst surface. As shown in Figure 6b, the increase in the Brønsted/Lewis acid sites ratio (B/L) resulted in the increase in the acrolein/acetol molar ratio at any reaction temperature. Such influence of the type of acid sites on the dehydration products distribution has been reported for SiO2-Al2O3 [46], ASN and ASPN catalysts [47].
It is accepted that the conversion of glycerol to acrolein proceeds over BAS, while the reaction towards acetol occurs over LAS [10,12]. However, it was noticeable that even when the HY(30) and HY(80) zeolites exhibited higher amounts of LAS than Brønsted acidity (B/L < 1), acrolein remained as the major dehydration product. This suggests that the LAS may also participate in the conversion of glycerol to acrolein, in agreement with the study of Wang et al. [48], in which the controlled incorporation of Lewis acidity to an H-ZSM-5 catalyst, with no addition of BAS, resulted in the increase in the acrolein yield in 36% more than the non-modified zeolite.
From these findings, it is proposed that the glycerol dehydration reaction over HY zeolites occurred according to the reaction scheme depicted in Figure 7. Initially, the removal of a first water molecule from glycerol proceeds through two possible reaction pathways: the removal of a primary hydroxyl moiety preferably over LAS to produce acetol, or the elimination of the secondary hydroxyl group catalyzed by the BAS at the catalyst surface, producing 3-hydroxypropanal (3-HP) [12,48]. Then, 3-HP dehydrates, yielding acrolein, or may be fragmented to produce acetaldehyde and formaldehyde, either over BAS or LAS. Both 3-HP reactions are thermodynamically favored with temperature increasing from 250 °C [43]. Subsequent cracking of dehydration products, acetol and/or acrolein, may occur over acid sites enhancing the acetaldehyde formation. On the other hand, acetol may be hydrogenated to acetone [16], which is in agreement with the low quantities of acetol observed with the HY zeolites of this study. Alternately, allyl alcohol was directly produced from glycerol, presumably through dehydration and hydrogen transfer reactions at the expense of a hydrogen donor [49,50], possibly undergoing subsequent dehydrogenation to produce acrolein [16].

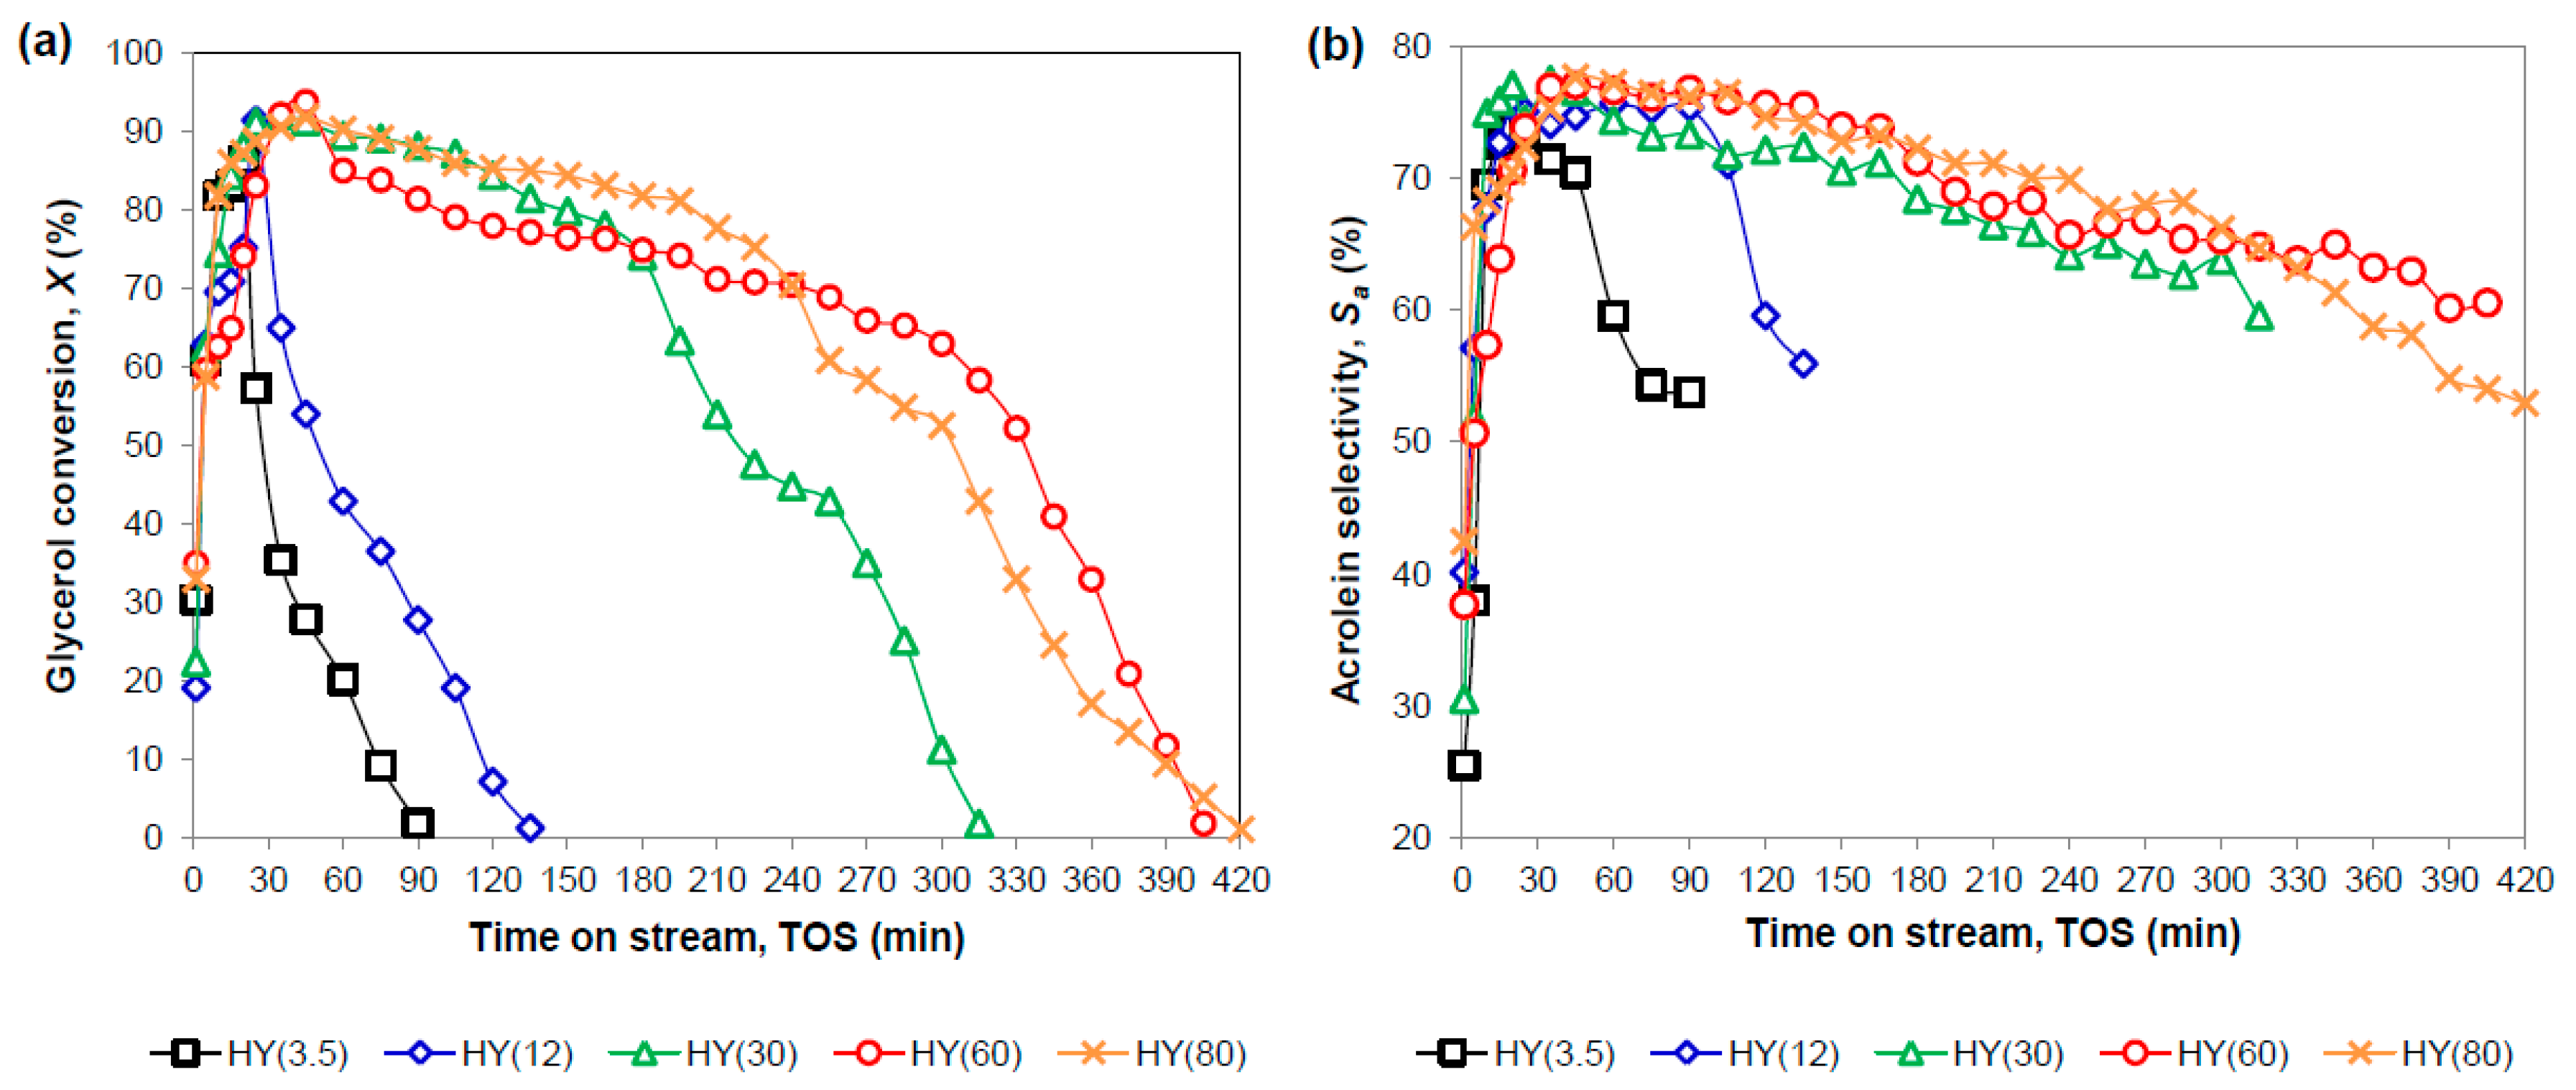
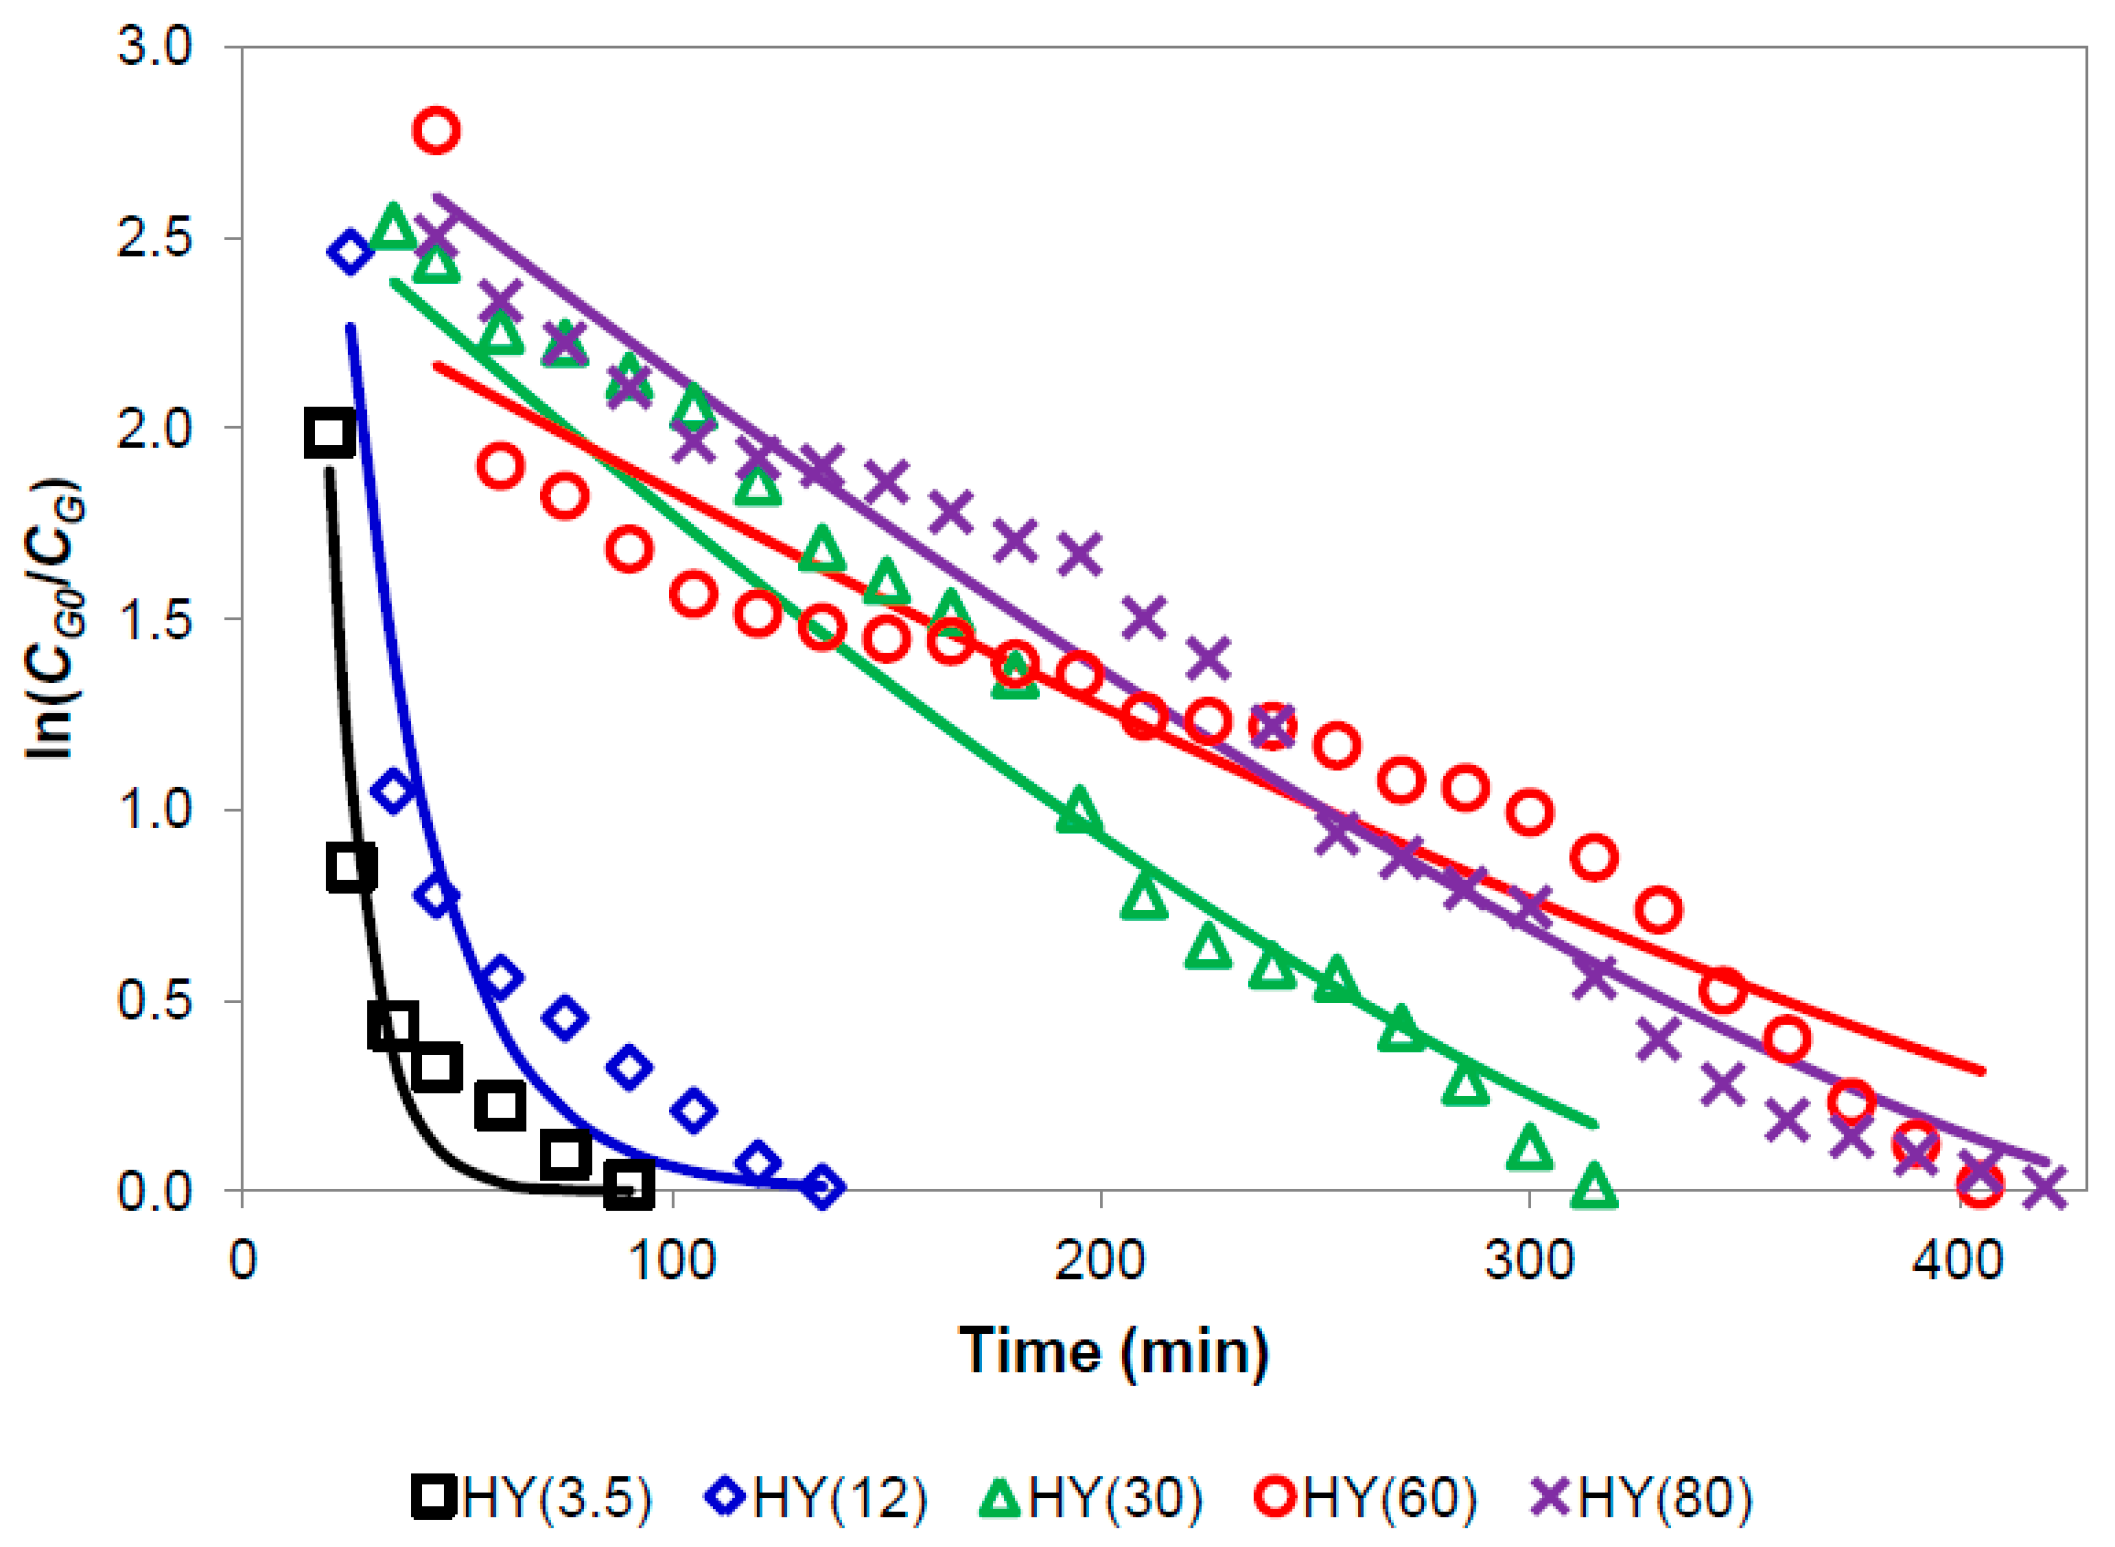
2.3. Catalyst Deactivation

A stability test for each catalyst was performed at 325 °C and GHSV = 7910 h−1 until total deactivation (glycerol conversion~1%). As shown in Figure 8a,b, the activity of the zeolites in the glycerol dehydration exhibited differences with time on stream (TOS). At the beginning of the process, the catalysts presented an induction period in which glycerol conversion gradually increases, reaching the maximum conversions at 20, 25, 35, 45 and 45 min in the order HY(3.5), HY(12), HY(30), HY(60) and HY(80), and maximum acrolein selectivities at 20, 20, 35, 45 and 45 min in the same order.
After reaching the maximum activity, the HY(3.5) zeolite showed an abrupt decrease in the glycerol conversion from 86.3% to 35.4% with a change in TOS from 20 to 35 min, deactivating totally at 90 min. Similarly, the HY(12) catalyst exhibited a rapid loss of activity in a short period of time, completely diminishing the conversion between 25 and 135 min. On the other hand, the lifetimes of the zeolites HY(30), HY(60) and HY(80) were longer than those of HY(3.5) and HY(12), presenting gradual and mild conversion losses, requiring 315, 405 and 420 min to achieve total deactivation, respectively.
The acrolein selectivity with TOS was also influenced by the catalyst, as presented in Figure 8b. Both the HY(3.5) and the HY(12) zeolites showed the same shape in the decrease of the acrolein selectivity with TOS. The HY(3.5) catalyst exhibited the most pronounced change in a short time, decreasing from 73.8% to 53.7% with the increase in TOS from 20 to 90 min. When using the HY(12) catalyst, the acrolein selectivity presented a steady behavior between 15 and 90 min, with values around 73% and 75%, subsequently decreasing to 56% at 135 min. Conversely, the acrolein selectivity of the catalysts with SiO2/Al2O3 molar ratios of 30, 60 and 80 smoothly decreased with TOS, maintaining values higher than 53% even when the glycerol conversion reached minimum values, suggesting a different mechanism for the decrease in acrolein selectivity.
The results of the glycerol conversion with TOS were used to establish a rate equation to describe the deactivation behavior of each catalyst during the glycerol dehydration reaction, which is known to obey first-order kinetics regarding glycerol (n = 1) [51,52]. Thus the rate of disappearance of glycerol (−r’G) in the presence of a solid catalyst can be expressed as:
r G = k C G a
where k is the reaction rate constant, CG is the concentration of glycerol and a is the catalyst activity function, which starts at unity and drops to zero with time [53].
After coupling Equation (1) with the deactivation expressions (Equations (10) and (11)) and with the design equation for a packed bed reactor (Equation (12)), the deactivation kinetic models (Equations (2)–(5)) for deactivation orders d = 0.25, 0.5, 1 and 2, were obtained, respectively:
ln ( C G 0 C G ) = τ k ( 1 0.75 k d t ) 4 3
ln ( C G 0 C G ) = τ k ( 1 0.5 k d t ) 2
ln ( C G 0 C G ) = τ k e k d t
ln ( C G 0 C G ) = τ k 1 + k d t
where CG0 is the initial concentration of glycerol; τ’ is the capacity factor of the reactor called weight-time; τ’ = WcatCG0/FG0, where Wcat is the weight of catalyst loaded into the reactor and FG0 is the molar feed rate of glycerol; k is the reaction rate constant; kd is the deactivation rate constant; and t is time. These models allowed us to find the rate constants (k and kd) from the experimental results of this type of reactor [53].
The kinetic deactivation models with different deactivation orders (Equations (2)–(5)) were fitted to the experimental data by non-linear regression, minimizing the sum of square residuals as the objective function and discriminated in terms of their determination coefficients (Appendix B). The minimization results presented in Table A2 clearly showed that for HY(3.5) and HY(12) catalysts, the best fit was obtained for a first-order deactivation model, while for the rest of the catalysts the deactivation order was found to be 0.25. The different deactivation order was attributed to different deactivation mechanisms among the catalysts and/or to the number of sites involved in the deactivation step [54,55] which is in agreement with the experimental deactivation results (Figure 8).
The comparison between the observed activity of each catalyst and the estimated curves is shown in Figure A3 (Appendix B). It is noticeable that the activity of the HY(3.5) and HY(12) catalysts decreases more rapidly than in the other catalysts, which is related to larger deactivation orders and deactivation rate constants.
The reaction and deactivation rate constants obtained for each catalyst are reported in Table 3. The reaction rate constants decreased with the decrease in the aluminum content in the catalyst, following the trend of the total acidity. Moreover, the deactivation rate constants for the catalysts with SiO2/Al2O3 ratios of 3.5 and 12 were an order of magnitude larger than those for the HY(30), HY(60) and HY(80) zeolites, which, besides the deactivation order, explained the rapid loss of activity of the former. The gradual deactivation of the catalysts HY(30), HY(60) and HY(80) was attributed to their textural properties since the deactivation rate constants were found to be inverse to the BET surface areas of the fresh zeolites, as shown in Figure 9.
It is noteworthy that the values of the deactivation rate constants for the HY(30), HY(60) and HY(80) catalysts were smaller than those reported for HZSM-5 and ASPN-40 catalysts (between 2.25–4.97 × 10⁻² min−1 and 1.18–4.27 × 10⁻² min−1, respectively, at reaction temperature T = 250 °C and contact time Wcat/FG0 between 3000–6250 g·min·mol−1) [50], even though the reaction conditions in the present study were more severe (T = 325 °C and Wcat/FG0 = 1870 g·min·mol−1).
It is known that the decrease in activity of solid acid catalysts during the reaction of organic compounds proceeds by the formation and accumulation of heavy secondary products (commonly known as coke), which cover the active sites and block the catalyst pores [56,57]. In the case of the glycerol dehydration reaction, it has been stated that the carbonaceous compounds responsible for the catalyst deactivation are formed mainly by polycondensation and cyclization of glycerol, acrolein and byproducts forming polyglycols and/or polyaromatics, depending on the reaction conditions and on the physicochemical properties of the catalyst [58].
In this context and from the stability tests, it is assumed that the deactivation of the HY(3.5) and HY(12) catalysts proceeds initially by the rapid blocking of the catalyst micropores, avoiding the transport of glycerol through the zeolite internal channel system, immediately reducing the conversion, as seen in Figure 8a. Additionally, the abrupt decrease in the acrolein selectivity with TOS (Figure 8b) was a result of the coverage of the BAS, since both catalysts showed higher amounts of BAS (in μmol·m−2) and larger BAS/LAS molar ratios than the rest of the zeolites, as evidenced by the surface acidity characterization by FTIR-Py.
Since the zeolites with less aluminum content presented improved textural properties and more prolonged activities than the HY(3.5) zeolite, it is inferred that their large surface areas and pore volumes enabled the active sites to be more effectively exposed to the reactant, allowing glycerol to be converted despite a lower amount of acid sites.
Furthermore, due to mesoporosity increased both surface area and pore volume, the diffusion of reactants and products through the porous system was improved, decreasing the rate of reactions that give rise to coke, reducing the pore blockage and the coverage of active sites, resulting in a smooth decline of glycerol conversion and acrolein selectivity, in agreement with Figure 8 and with the deactivation rate constants.

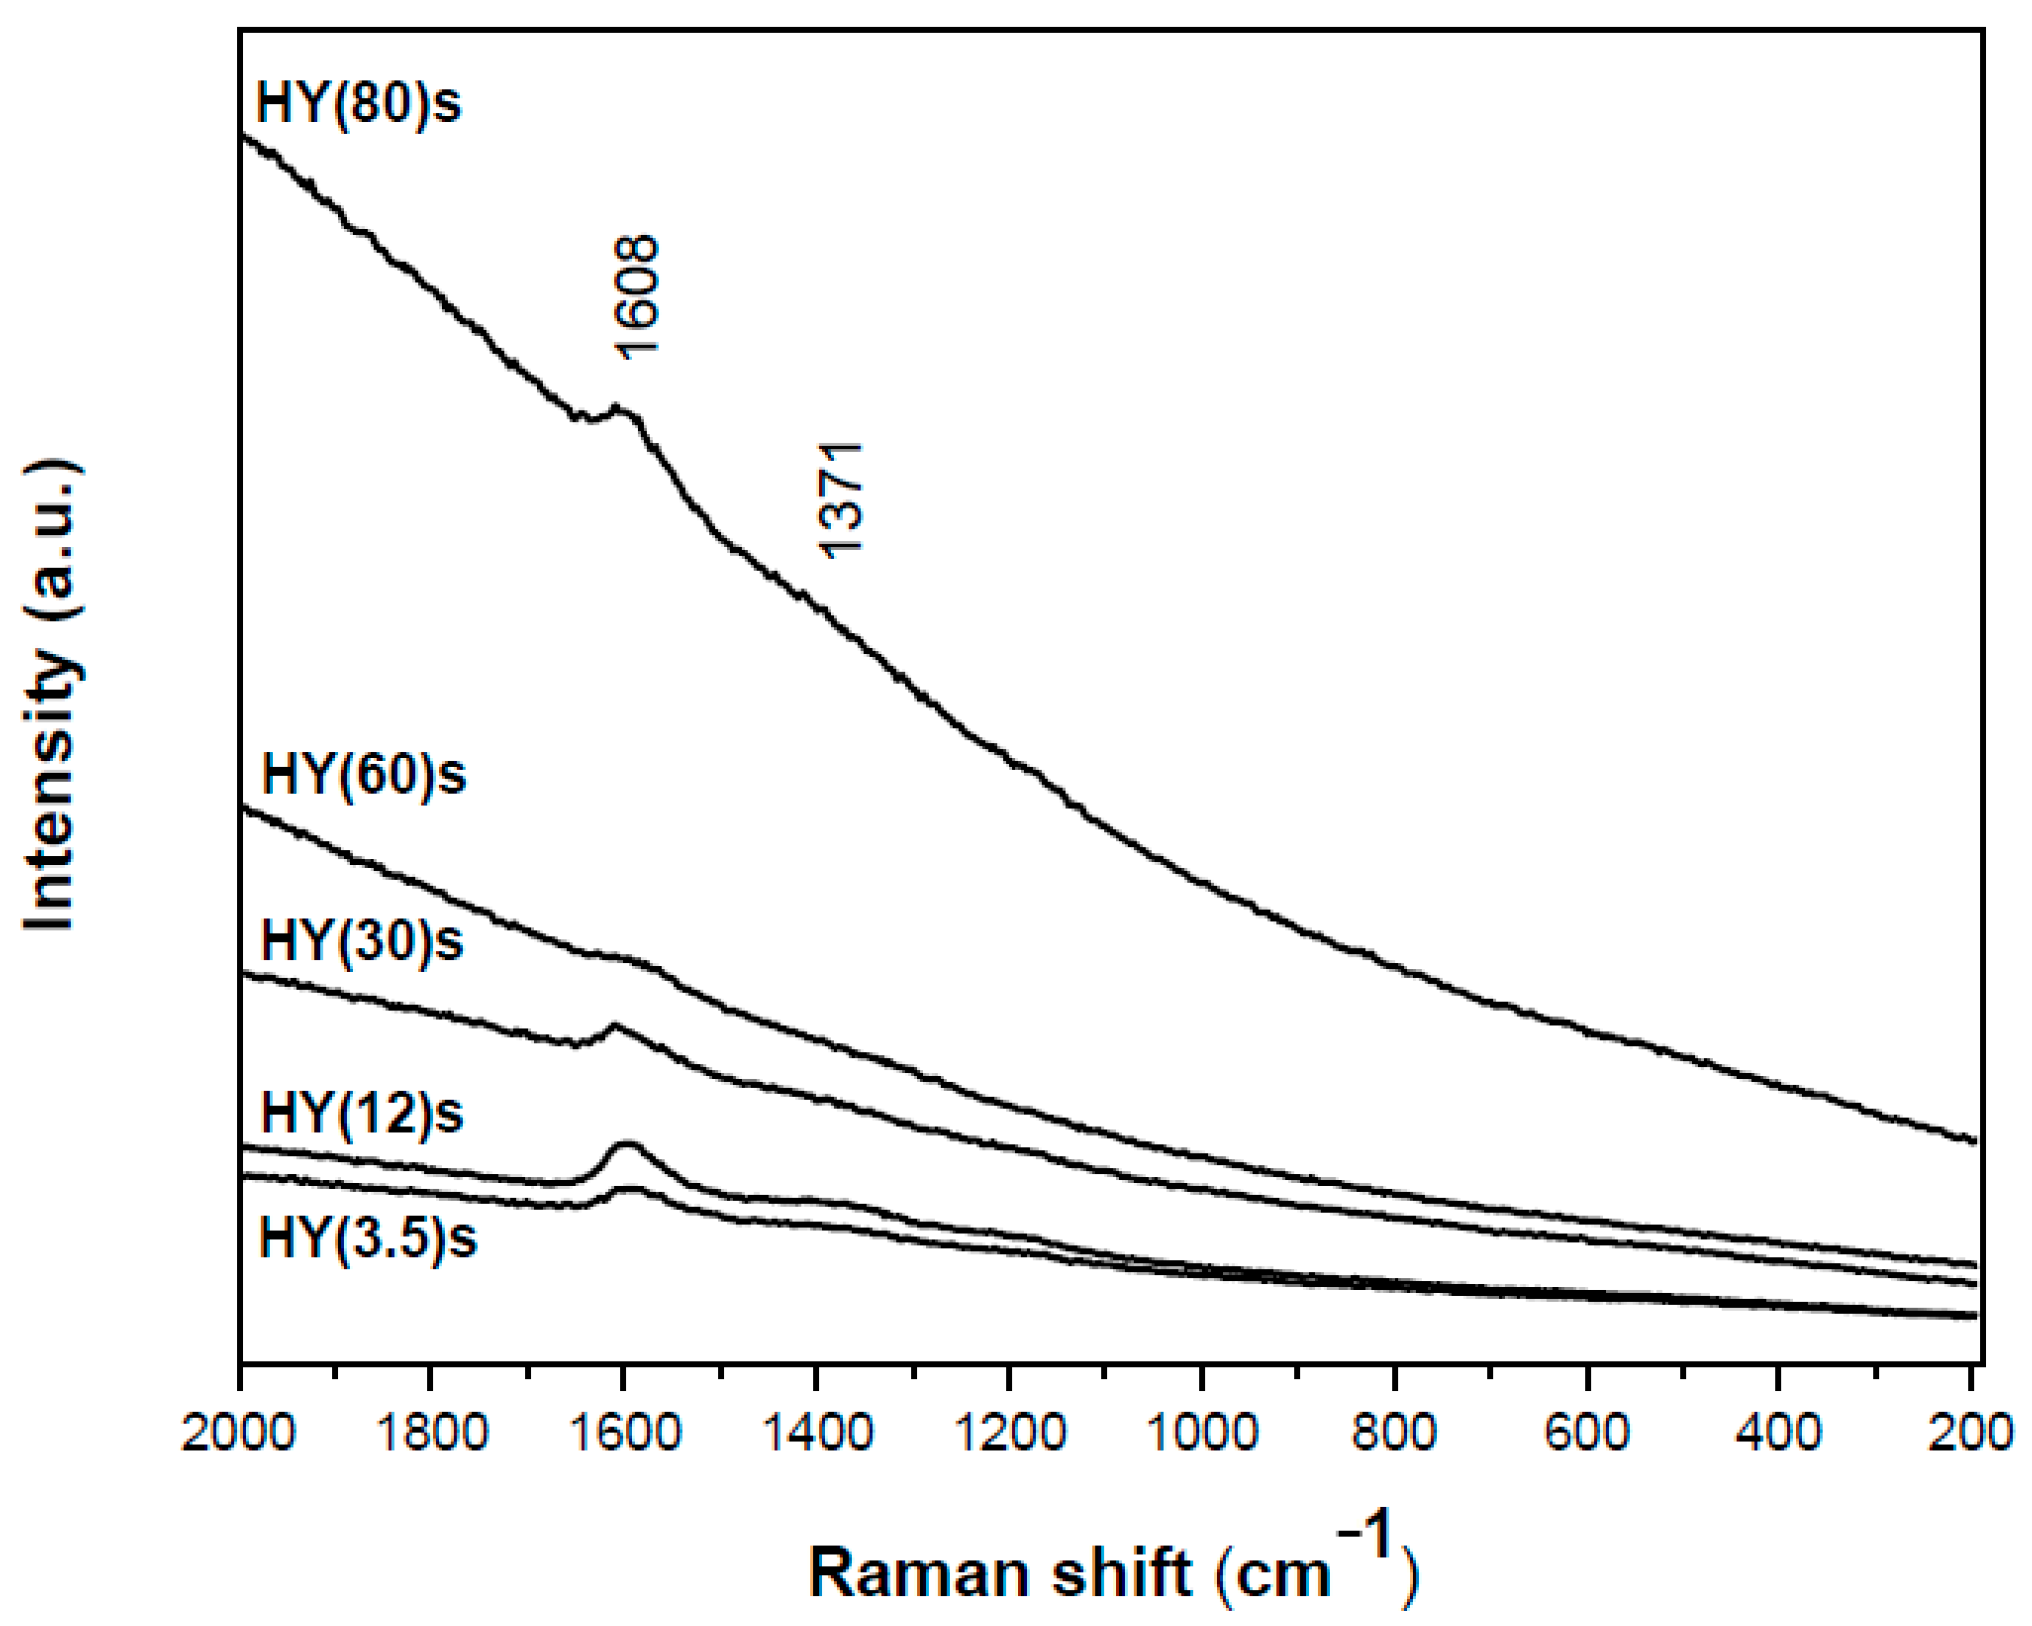
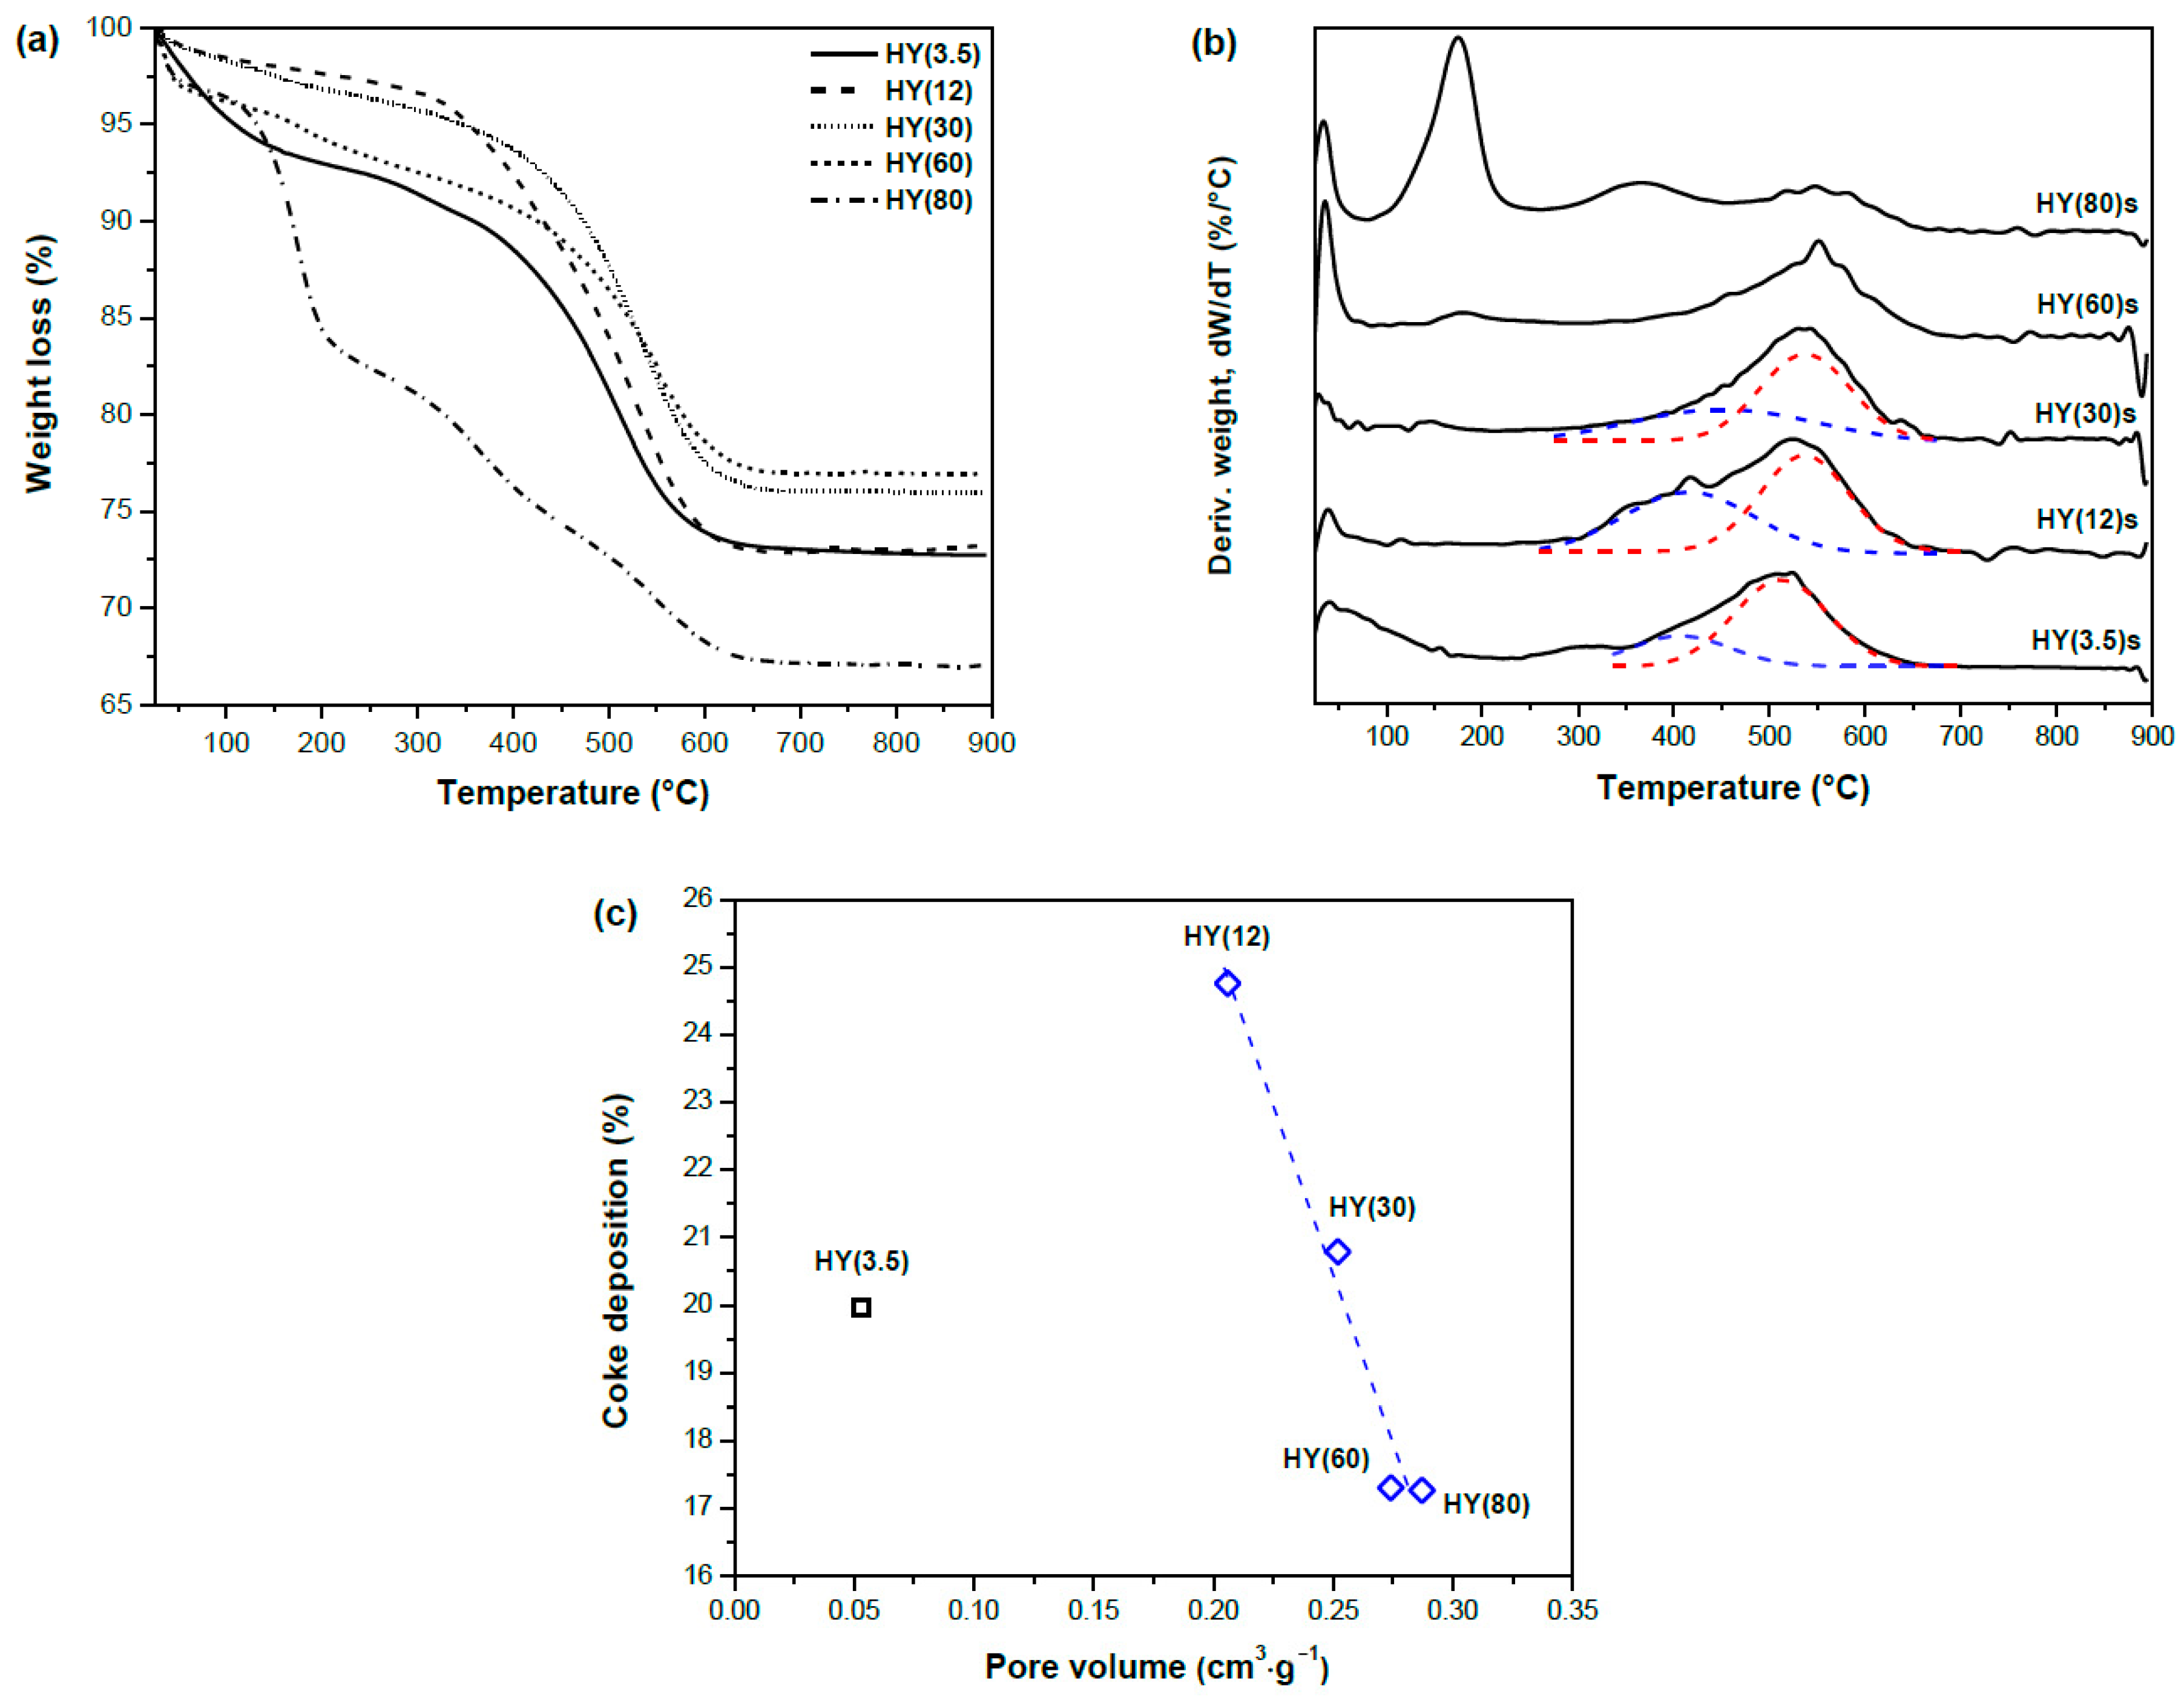
2.4. Characterization of Deactivated Catalysts

After the deactivation tests at 325 °C and GHSV = 7910 h−1, the spent zeolites, denoted as HY(3.5)s, HY(12)s, HY(30)s, HY(60)s and HY(80)s, were characterized by different techniques to determine the changes occurred in the solids.
The XRD patterns of the spent catalysts are shown in Figure 10. After the deactivation tests in the glycerol dehydration reaction, the zeolites maintained the faujasite-type structure (JCPDS card 00-043-0168). In comparison with the fresh samples, the XRD patterns of the spent zeolites exhibited a decrease in their intensity, indicating the loss of crystallinity presumably caused by the deposition of carbonaceous compounds. However, no crystalline or amorphous carbon phases were evidenced.
The average crystallite sizes of the spent catalysts were estimated from the integrated area of the reflection corresponding to the (111) plane and are reported in Table 4. In comparison with the respective fresh zeolites, the crystallites of the spent samples increased by 1.38%, 2.14%, 1.53%, 0.97% and 0.92% in the order HY(3.5)s, HY(12)s, HY(30)s, HY(60)s and HY(80)s. This increase in the crystal sizes was attributed to the deposition of coke inside the micropores, causing an expansion of the unit cell of the zeolites.
From the N2 physisorption isotherms of the spent zeolites, presented in Figure 11a, it is noticeable that all the samples presented lower amounts of adsorbed N2 than the fresh zeolites, indicating a decrease in the surface areas. Additionally, the HY(3.5)s, HY(12)s, HY(30)s and HY(80)s samples did not exhibit N2 adsorption at low relative pressures, suggesting the absence of microporosity. The HY(3.5)s solid presented an adsorption isotherm of type III, characteristic of nonporous solids, in which the adsorbent–adsorbate interactions are relatively weak and the adsorbed molecules are clustered around the most favorable sites on the surface of the nonporous material [25]. On the other hand, the HY(12)s, HY(30)s and HY(80)s zeolites showed adsorption isotherms of type V, whose characteristics are similar to those of isotherm type III. However, the step at high relative pressures is indicative that the molecular clustering is followed by the filling of pores [25], suggesting the presence of some porosity in these spent catalysts. Conversely, the HY(60)s sample presented N2 adsorption at low relative pressures, maintaining the adsorption isotherm of type IV as before the deactivation process. The behavior of this spent sample suggests the conservation of microporosity after the reaction, associated with the presence of mesopores. Additionally, it was related to the catalytic activity and the conversion values, reported for the sample HY(60), as well as with the fact that it has longer deactivation times, as seen in Figure 8a.
Furthermore, the HY(3.5)s sample presented a very steep desorption branch that proceeds closely along with the adsorption isotherm as a result of pore blocking. The spent catalysts, with SiO2/Al2O3 molar ratios of 12, 30, 60 and 80, showed desorption isotherms with steep declines, resulting in hysteresis loops of type H4, characteristic of aggregates or agglomerates of particles with uniform size and shape [24,25].
From the textural properties of the spent catalysts reported in Table 4, it was evidenced that, after reaching total deactivation on the glycerol dehydration reaction, the zeolites HY(3.5), HY(12), HY(30), HY(60) and HY(80) lost around 99%, 94%, 95%, 61% and 89% of their surface areas, and retained about 15%, 44%, 37%, 62% and 69% of the pore volume in the same order, respectively. Additionally, the average pore diameters of the spent catalysts were higher than those of the fresh zeolites, indicating the loss of microporosity and the conservation of the mesoporous system. As confirmed by the pore size distribution curves presented in Figure 11b, with the exception of the HY(60)s sample, all the spent catalysts lacked microporosity and the amount of mesopores between 2 and 10 nm substantially decreased, exhibiting mainly mesopores of sizes between 10 and 40 nm.
The SEM micrographs of the spent zeolites, presented in Figure A2 (Appendix A), did not show significant difference in particle size and morphology regarding the fresh zeolites, without the presence of coke agglomerates or stacks. This similarity in micro-morphology suggested that coke could be deposited within the porous system and also uniformly dispersed on the external surface of the catalysts. On the other hand, the elemental analysis performed by EDXS indicated that large amounts of carbon were deposited over the surface of the spent catalysts, as presented in Table 4.
From the comparison of the textural properties of the fresh and the spent zeolites and the EDXS analysis, it is evidenced that the pore volume and the surface area of the catalysts played a key role in the deactivation process. This is because in any case the micropores were partially or totally blocked, it is plausible that the carbonaceous compounds formed at the external surface of the catalyst accumulating near the microporous entrances, resulting in their blockage (Figure 11b) and in the loss of activity of the HY(3.5) zeolite. On the other hand, the HY(12), HY(30), HY(60) and HY(80) zeolites maintained their catalytic activity, even after the blockage of the microporous fraction due to the large surface areas where the active sites remained exposed and accessible through the wide mesopores. Given that the mesopores were partially blocked even after the total deactivation, it is assumed that the deactivation of the mesoporous catalysts occurred by the coverage of the active sites by the carbonaceous compounds inside the porous system besides the micropore blockage.
The Raman spectra of the spent zeolites are shown in Figure 12. The samples presented a main band at 1608 cm−1, which is characteristic of aromatic compounds [59,60,61], and a very weak band at 1371 cm−1 related to C3 hydrocarbon species adsorbed on the catalyst [59]. This suggested that the carbonaceous compounds deposited on the HY zeolites may be produced by the condensation–polymerization of acrolein rather than glycerol, since its polymerization results in the production of polyglycols [58].
The thermogravimetric analysis of the spent zeolites is shown in Figure 13a. It was observed that the increase in temperature from 25 °C to 900 °C caused total weight losses of 26.9%, 27.1%, 23.9%, 23% and 32.9% in the order HY(3.5)s, HY(12)s, HY(30)s, HY(60)s and HY(80)s. The weight loss attributed to the carbonaceous compounds deposited on the catalysts varied from 17% to 24% as presented in Table 4.
From the derivative thermogravimetry plots presented in Figure 13b, two main thermal transitions were observed: a first one between room temperature and 200 °C, and a second change between 250 °C and 700 °C. During the first temperature range, the weight loss was ascribed to the elimination of adsorbed water. The second thermal transition was attributed to the combustion of coke deposits formed and accumulated on the catalysts during the reaction.
On the other hand, as the SiO2/Al2O3 molar ratio of the zeolites increased from 3.5 to 80, the temperature of the thermal transition between 250 °C and 700 °C also increased, as shown in Figure 13b. Additionally, the derivative curves of the samples HY(3.5)s, HY(12)s, HY(30)s and HY(80)s exhibited two temperature peaks, suggesting the presence of carbonaceous deposits that decomposed at different temperatures. The first temperature peak was found at 415 °C for both the HY(3.5)s and HY(12)s samples, while for the HY(30)s and HY(80) solids, the first peaks were observed at 451 °C and 365 °C, respectively. The high-temperature peaks were found at 512 °C, 536 °C, 537 °C and 551 °C, in the same order, while the HY(60)s sample showed a unique temperature peak at 551 °C.
From the estimation of the weight loss between 200 °C and 700 °C (Table 4), it was observed that the quantity of coke deposited on the catalysts decreased systematically with the increase of the SiO2/Al2O3 molar ratio from 12 to 80, while the HY(3.5)s sample showed an intermediate value among the samples. The coke content of the spent zeolites followed the same order as the increase in their crystal sizes. Similarly, the amount of coke was inversely proportional to the pore volume of the fresh mesoporous zeolites, while the HY(3.5) catalyst presented a value out from this trend due to its microporous nature, as shown in Figure 13c. Similar behaviors have been found for MFI [20] and MWW [62] zeolites.

2.5. Comparison of the HY Zeolites with Other Zeolite Catalysts Reported in the Literature

Table 5 presents the catalytic performance of representative zeolite catalysts reported in the literature and of HY zeolites in this study. This comparison is not simple, owing to different operating conditions employed during the catalytic tests, which are known to influence the activity and deactivation of catalysts [10,58,63].
Among several microporous protonated zeolites tested in the gas-phase glycerol dehydration reaction, H-ZSM-5 and H-ferrierite were the most active catalysts with medium deactivation after 12 h of TOS [17,18]. In contrast, the HY zeolite exhibited poor conversion and acrolein selectivity, with a severe decrease in catalytic activity in an equal or shorter period of time [18,19]. In agreement with these reports, the microporous HY(3.5) catalyst of this study showed a rapid loss of activity. For any of these catalysts, amounts of coke between 8 and 15 wt % were quantified, but this value may vary depending on the reaction conditions and catalyst.
On the other hand, besides the improvement in the initial activity, the use of zeolites with mesoporous structure results in a slower deactivation than the microporous catalysts, maintaining the glycerol conversion and acrolein selectivity at high values for long periods, as in the case of the H-ZSM-5 zeolites with micro- and mesopores, generated either by post-synthesis treatments or during the synthesis procedure [20,21,22,38,64]. Similarly, for the HY zeolites of this study, the presence of mesoporosity and large surface areas enhanced the initial glycerol conversion, while the increase in the pore diameter and pore volume allowed it to extend the time on stream.
It is noticeable that the zeolite catalysts reported in the literature did not achieve total deactivation after several hours of TOS, while the HY zeolites of this study reached conversion values around 1% at the end of the catalytic tests with a maximum value of TOS = 7 h. This relatively rapid loss of activity of the HY catalysts, compared with mesoporous H-ZSM-5 zeolites, is attributed to more severe reaction conditions, i.e., the high carrier gas flow rate that resulted in a short contact time and thus a very high space velocity value, which has been reported to accelerate the catalyst deactivation [21,38,63]. This is supported by the deactivation rate constants of the HY catalysts, which are comparable with those reported for HZSM-5 and ASPN-40 catalysts at moderate reaction conditions [51].

3. Materials and Methods

3.1. Materials

A commercial Y zeolite with SiO2/Al2O3 molar ratio of 3.5 was acquired from Sigma-Aldrich (Toluca, Estado de México, Mexico), and Y zeolites with ratios 12, 30, 60 and 80 were obtained from Zeolyst International (Conshohocken, PA, USA). Before their characterization and testing in the reaction, the solids were calcined in an electrical furnace at 450 °C for 4 h, cooled to room temperature and sieved through 100 mesh. The final samples were labeled as HY(3.5), HY(12), HY(30), HY(60) and HY(80), where the number between parenthesis refers to the SiO2/Al2O3 molar ratio. For the catalytic reactions, glycerol (purity ≥ 99.5%) was obtained from Sigma-Aldrich (Mexico) and used with any further purification.

3.2. Characterization of Catalysts

The solids were characterized by X-ray diffraction (XRD) to verify the crystalline structure. The XRD patterns of the calcined samples were obtained in a Bruker AXS model D8 diffractometer (Bruker Mexicana S.A, Mexico) using CuKα radiation (1.5406 Å) with a step size of 0.02° and a counting time of 2 s in a range between 5° and 70° of the 2θ scale. The verification of the crystalline structure of the samples was realized by the comparison of the obtained diffraction patterns with the crystallographic cards of the Joint Committee on Power Diffraction Standards (JCPDS). The crystallite size were estimated from the integrated area of the most intense reflection, taking into account the Scherrer equation, L = 0.9·λ/β·cosθ, where L is the crystallite size, λ is the X-ray wavelength, β is the line broadening and θ is the Bragg angle [65].
The textural properties of the HY zeolites were determined from the nitrogen (N2) adsorption–desorption isotherms obtained at −196 °C using a Micromeritics ASAP-2450 equipment (Nanometrix, Tlalnepantla, Mexico). Each sample was degassed at 300 °C under vacuum at 1 × 10⁻³ Torr for 3 h. During the determination of the adsorption isotherm, successive charges of N2 increasing the pressure were introduced into a vessel containing the sample, leaving 15 s to achieve balance at each point, thereby obtaining one adsorption isotherm characteristic of each solid. The values of specific surface area were obtained considering the Brunauer, Emmet and Teller method (BET) [66], while the model of Barrett, Joyner and Halenda (BJH) was used for the porosity analysis [67].
High-resolution observations of the catalysts were realized in a field emission scanning electron microscope (SEM) Jeol model JSM 6701 F coupled with a SEM probe with energy-dispersive X-ray spectroscopy (EDXS) (Jeol de México S.A, Mexico) to obtain the respective spectra, as well as qualitative and quantitative chemical analyses of the HY zeolites. For the observation, the catalyst powder was spread on a graphite tape and covered with Au atoms to make the sample conductive.
The composition of the HY zeolites was evaluated by atomic absorption spectroscopy (AAS) using a Perkin Elmer AAnalyst 400 instrument (Perkin Elmer, Mexico). Previously, the samples were dissolved with the Lithium metaborate fusion procedure (Perkin Elmer manual part No. 0303-0152, 1996).
Raman spectra of the catalysts were collected in a Renishaw inVia spectrometer (Renishaw Mexico), and the samples were excited with the green line laser λ = 532 nm line, power 9 mW, 1 mW on the sample, equipped with a cooled CCD detector and a holographic super-Notch filter to remove the elastic scattering; the spectral resolution was ca. 3 cm−1, and spectra acquisition consisted of 5 accumulations of 10 s.
The UV-vis spectra with diffuse reflectance of each catalyst were obtained at 25 °C in a spectrophotometer Varian Cary 100 (Agilent Technologies Mexico). The samples consisted of powder sieved through 100 mesh. The analysis range was from 200 to 800 nm with a sensibility of 1 nm.
The surface acidity of the catalysts was studied by Fourier transform infrared spectroscopy with adsorbed pyridine (FTIR-Py) using a Nicolet equipment, model 170-SX (Thermo Fisher Scientific Inc., Mexico). Each sample, in the form of pressed powder, was placed in a glass cell with controlled temperature and vacuum. Before the adsorption of pyridine, the sample was degassed with a vacuum at 1 × 10⁻³ Torr and heating at 300 °C at a rate of 20 °C·min−1, allowing its subsequent cooling to room temperature. Afterward, the sample was exposed to a mixture of pyridine in N2 (4%) over 15 min for the chemisorption process at 25 °C. The excess pyridine was removed by vacuum, and the FTIR spectrum was obtained in situ for every 50 °C between 50 °C and 400 °C. The Brønsted and Lewis acid sites were identified according to the characteristic bands of the interaction of pyridine with each acid site. The interaction of pyridine con the Brønsted acid sites (BAS) results in the appearance of characteristic infrared bands at 1540 cm−1 and 1640 cm−1, while the coordination of pyridine with Lewis acid sites (LAS) exhibit a band between 1447 cm−1 and 1460 cm−1, and two additional bands at 1580 cm−1 and 1600 cm−1. The interaction with both types of acid sites develops a band at 1490 cm−1 [36]. The quantification of BAS and LAS was performed regarding the integrated areas of the bands at 1540 cm−1 and 1450 cm−1, respectively.

3.3. Catalytic Activity Tests

The glycerol dehydration reactions were performed at atmospheric pressure and controlled temperature in a system comprising mainly of two consecutive saturation vessels for water and glycerol, respectively, and a stainless steel fixed-bed reactor (32 cm length and 1 cm internal diameter).
To produce a gaseous stream with 20 wt% of glycerol, the water vapor produced at 90 °C in the first saturator was carried with an N2 flow of 80 mL·min−1 and then bubbled into the glycerol contained in the second saturator heated at 220 °C. The reactor was loaded with 0.30 g of catalyst (Wcat) deposited over a porous fiberglass bed and heated at 450 °C during 1 h in an electrical furnace with a N2 flow of 80 mL·min−1. Afterward, the reactor was allowed to reach the required reaction temperature (250 °C, 275 °C, 300 °C or 325 °C) and fed with the previously described gaseous mixture. According to the feeding conditions, the gas hourly space velocity (GHSV) was 7910 h−1.
The reactor output stream passed through a separation device consisting of a flask cooled at 20 °C to condense water and unreacted glycerol, and a column packed with glass Raschig rings coupled to a condenser cooled at 3–5 °C and a flask to recover the reaction products. The glycerol concentration at the input and output of the reactor was monitored by measuring the refractive index with the use of a calibration curve of glycerol-water mixtures from 0–100 wt % of glycerol with an Abbe refractometer Atago 1211, as reported in [43]. Additionally, the calibration curve of the refractive index of the glycerol-water mixtures was validated with the spectrophotometric method reported by Bondioli et al. [68]. The reaction products were analyzed in a Varian 3400 gas chromatograph (Agilent Technologies Mexico) equipped with a DB-WAX capillary column (30 m × 0.25 mm × 0.25 μm) and a flame ionization detector (FID). The glycerol conversion (X) and the product selectivity (Si) were calculated by the Equations (6) and (7):
X   ( % ) =   M o l e s   o f   r e a c t e d   g l y c e r o l M o l e s   o f   f e d   g l y c e r o l   × 100
S i   ( % ) =   M o l e s   o f   p r o d u c t   i M o l e s   o f   r e a c t e d   g l y c e r o l   × 100

3.4. Catalyst Deactivation Behavior

A stability test for each catalyst was performed at 325 °C and GHSV = 7910 h−1 until total deactivation (glycerol conversion~1%). The results of the glycerol conversion with TOS were used to establish a rate equation to describe the deactivation behavior of each catalyst during the glycerol dehydration reaction according to the deactivation kinetic model proposed by Levenspiel [53], which defines the rate of disappearance of the reactant A (−rA) in a heterogeneous reaction as:
r A = k C A n a
where k is the reaction rate constant, CA is the concentration of reactant A, n is the reaction order, and a is the catalyst activity function, which starts at unity and usually drops to zero with time.
The rate at which the catalyst activity decreases with time on stream may be expressed as:
d a d t = k d a d
where t is time, kd is the deactivation rate constant and d is the deactivation order.
Assuming a first-order deactivation process (d = 1), integration of Equation (9) gives:
a = e k d t
For any deactivation order (d ≠ 1) the deactivation expression becomes of the type:
a = [ 1 + ( d 1 ) k d t ] 1 d 1
Coupling the above deactivation equations with expression 8 and with the design equation for a packed bed reactor (Equation (12)) gives expressions that allow one to find the rate constants (k and kd) by experiments from this type of reactor:
W c a t F A 0 = 0 X d X r A
where Wcat is the mass of catalyst, FA0 is the initial molar flow rate of the reactant A and X is the reactant conversion.
The resulting kinetic deactivation models can be fitted to the experimental data by non-linear regression and discriminated in terms of their determination coefficients (Appendix B).

3.5. Characterization of Spent Catalysts

After the deactivation tests, the spent zeolites, denoted as HY(3.5)s, HY(12)s, HY(30)s, HY(60)s and HY(80)s, were characterized by XRD, N2 physisorption, SEM-EDXS and Raman spectroscopy under the same conditions as mentioned in Section 3.2. Additionally, the solids were also subjected to thermogravimetric analysis (TGA) in a TA Instruments equipment, model SDT Q600 at temperatures between 25 °C and 900 °C with a heating rate of 10 °C·min−1 and an air flow of 10 mL·min−1.

4. Conclusions

The HY zeolites with different SiO2/Al2O3 molar ratios were active as catalysts in the conversion of glycerol to acrolein, improving with the increase in temperature, as well as with the total number of acid sites. For all the catalysts, acrolein was the main reaction product, and its selectivity was enhanced with the temperature increment, with the exception of the HY(3.5), which promoted the production of acetaldehyde. The acrolein selectivity was also favored with the increase of the Brønsted/Lewis acid sites ratio at any reaction temperature.
The use of HY zeolites as catalysts for the glycerol dehydration reaction allowed the formation of acetol to be minimized. Instead, high-value allyl alcohol and acetone were produced in significant amounts.
The deactivation tests and the proposed kinetic deactivation models indicated that the stability of the catalysts with time on stream was influenced by their textural properties. The characterization of the spent catalysts by XRD, N2 physisorption and TGA suggested that the deposition of coke resulted in the blockage of micropores, which resulted in the loss of activity of the HY(3.5) zeolite. In contrast, the mesoporous zeolites retained their catalytic activity, even after the partial or total blockage of the micropores, due to the large surface areas where the active sites remained exposed and accessible to the glycerol molecules through the wide mesopores.

Author Contributions

Conceptualization, I.P.-R., J.L.C. and J.S.; Data curation, I.P.-R.; Formal analysis, I.P.-R., J.L.C. and J.S.; Funding acquisition, J.L.C. and J.S.; Investigation, I.P.-R. and J.L.C.; Methodology, I.P.-R., B.Z., R.L.-M., J.N.-B., S.H.-R., J.P.-C. and A.A.F.-M.d.O.; Project administration, I.P.-R. and J.L.C.; Resources, J.L.C. and J.S.; Supervision, I.P.-R., J.L.C. and B.Z.; Validation, J.L.C.; Writing—original draft, I.P.-R.; Writing—review and editing, I.P.-R., J.L.C., J.S., B.Z., R.L.-M. and J.N.-B. All authors have read and agreed to the published version of the manuscript.

Funding

This research received no external funding.

Data Availability Statement

The authors declare the free availability of research data.

Acknowledgments

The authors acknowledge the Universidad Autónoma Metropolitana, the Instituto Politécnico Nacional and the Instituto Mexicano del Petróleo for the support to develop this investigation. I. Pala-Rosas thanks the support of the company Síntesis y Aplicaciones Industriales S.A.

Conflicts of Interest

The authors declare no conflict of interest.

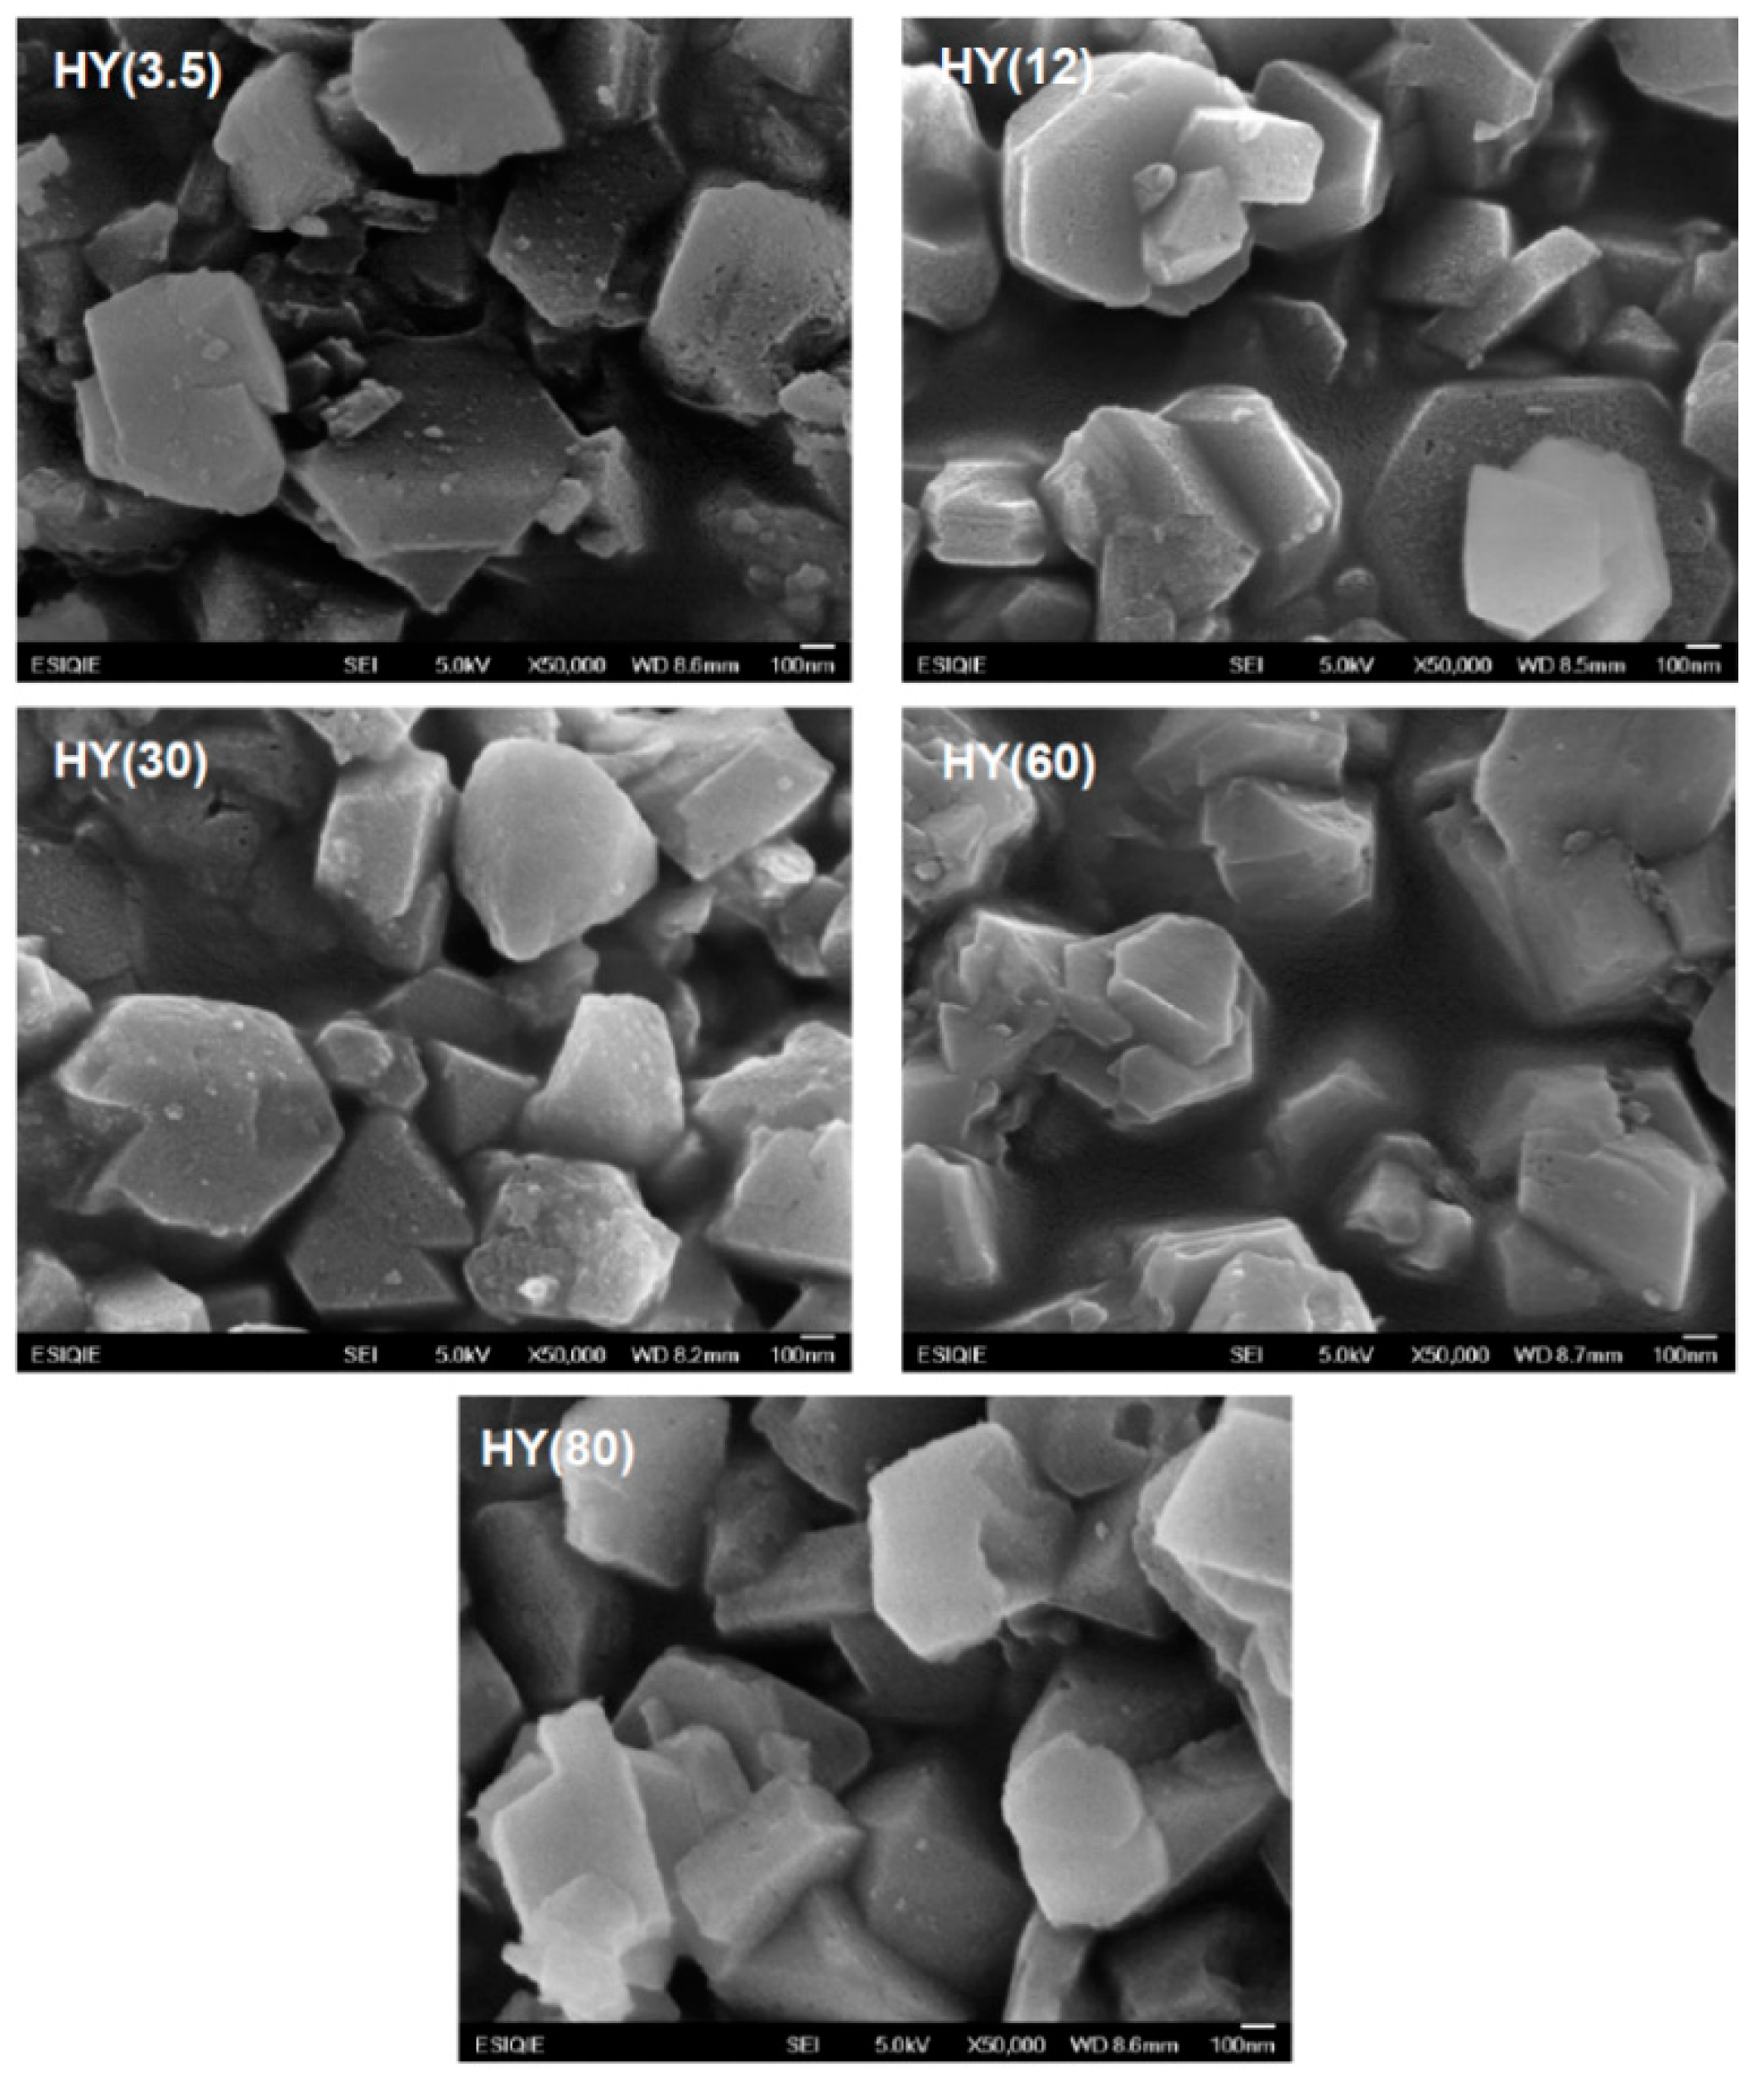
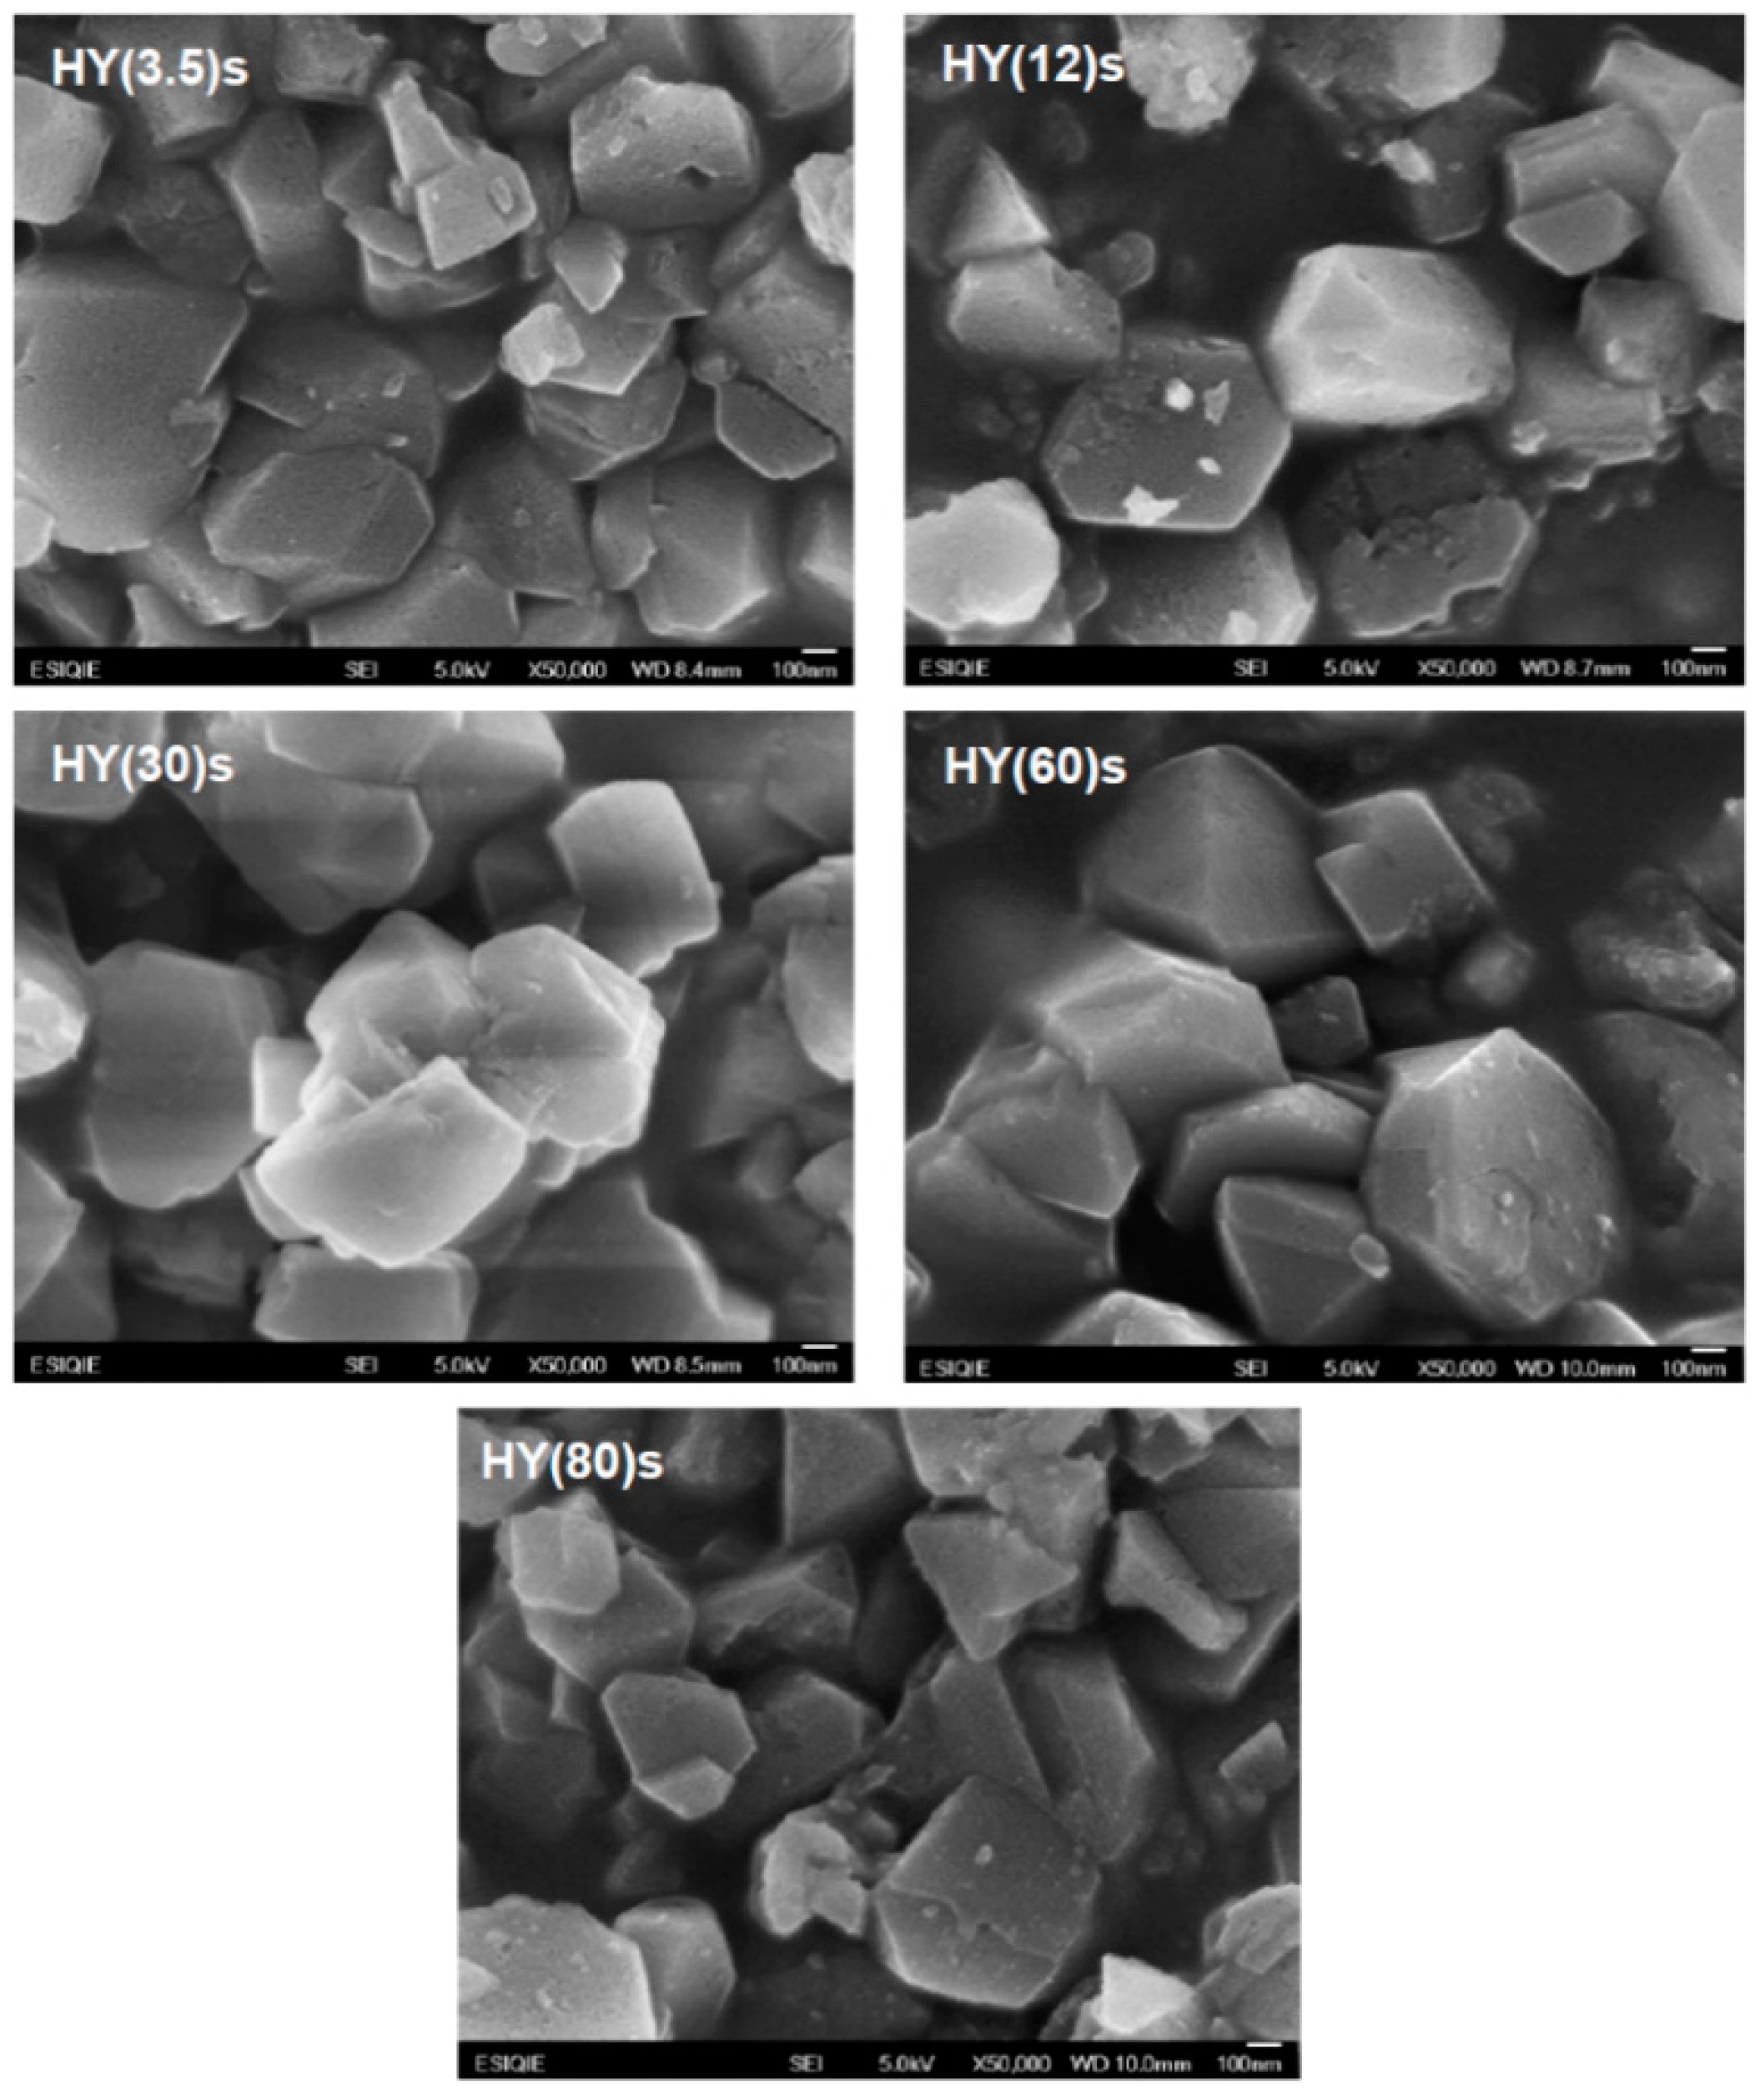
Appendix A. Analysis of the Fresh and Spent Catalysts by SEM and Chemical Compositions Determined by EDXS

Figure A1. SEM micrographs of the fresh HY zeolites.
Catalysts 11 00360 g0a1
Figure A2. SEM micrographs of the spent HY zeolites.
Catalysts 11 00360 g0a2
Table A1. Elemental composition of the HY zeolites determined by EDXS.
CatalystElement (Atom %)
SiAlO
HY(3.5)19.752.7577.5
HY(12)24.780.4374.79
HY(30)20.072.9476.99
HY(60)20.077.0472.89
HY(80)25.780.8673.36

Appendix B. Discrimination of the Kinetic Deactivation Models

The resulting kinetic deactivation models were fitted to the experimental data by non-linear regression, minimizing the sum of square residuals (SSR) as the objective function by use of the Microsoft Excel Solver tool and compared in terms of the determination coefficient (R2), according to the following equations:
S S R =   ( y i , e s t y i , e x p ) 2
R 2 = 1 S S R T S S
T S S =   ( y i , e x p y ¯ e x p ) 2
where the yi,est and yi,exp are the estimated and experimental values of the dependent variable, respectively, TSS is the total sum of squares and y ¯ e x p is the mean of the experimental values of the dependent variable.
Table A2. Values of the sum of square residuals (SSR) and determination coefficient (R2) for each deactivation model with different deactivation orders (d).
Catalystd = 0.25d = 0.50d = 1d = 2
SSRR2SSRR2SSRR2SSRR2
HY(3.5)1.010.640.540.810.160.940.880.69
HY(12)1.320.710.750.830.330.930.880.81
HY(30)0.720.956.440.511.100.922.530.81
HY(60)1.050.881.150.871.350.851.710.81
HY(80)0.440.970.790.951.680.903.570.78
Figure A3. Catalytic activity as a function of time on stream of the HY zeolites.
Catalysts 11 00360 g0a3

References

  1. Monteiro, M.R.; Kugelmeier, C.L.; Pinheiro, R.S.; Batalha, M.O.; Da Silva, A. Glycerol from biodiesel production: Technological paths for sustainability. Renew. Sustain. Energy Rev. 2018, 88, 109–122. [Google Scholar] [CrossRef]
  2. Almena, A.; Bueno, L.; Díez, M.; Martín, M. Integrated biodiesel facilities: Review of glycerol based production of fuels and chemicals. Clean Technol. Environ. Policy 2018, 20, 1639–1661. [Google Scholar] [CrossRef]
  3. Mota, C.J.A.; Peres Pinto, B.; de Lima, A. Chapter 1: Biomass and biofuels. In Glycerol. A Versatile Renewable Feedstock for the Chemical Industry; Mota, C.J.A., Peres Pinto, B., de Lima, A., Eds.; Springer International Publishing AG: Cham, Switzerland, 2017; pp. 1–10. [Google Scholar]
  4. OCDE/FAO. OCDE-FAO Perspectivas Agrícolas 2019–2028; OECD Publishing, París/Organización de las Naciones Unidas para la Alimentación y la Agricultura (FAO): Roma, Italy, 2019. [Google Scholar]
  5. Bagheri, S.; Julkapli, N.M.; Yehye, W.A. Catalytic conversion of biodiesel derived raw glycerol to value added products. Renew. Sustain. Energy Rev. 2015, 41, 113–127. [Google Scholar] [CrossRef]
  6. Cornejo, A.; Barrio, I.; Campoy, M.; Lázaro, J.; Navarrete, B. Oxygenated fuel additives from glycerol valorization. Main production pathways and effects on fuel properties and engine performance: A critical review. Renew. Sustain. Energy Rev. 2017, 79, 1400–1413. [Google Scholar] [CrossRef]
  7. Varma, R.S.; Len, C. Glycerol valorization under continuous flow conditions-recent advances. Curr. Opin. Green Sustain. Chem. 2019, 15, 83–90. [Google Scholar] [CrossRef]
  8. Liu, L.; Ye, X.P.; Bozell, J.J. A comparative review of petroleum-based and bio-based acrolein production. ChemSusChem 2012, 5, 1162–1180. [Google Scholar] [CrossRef]
  9. Etzkorn, W.G. Acrolein and derivatives. In Kirk-Othmer Encyclopedia of Chemical Technology; John Wiley & Sons, Inc.: New York, NY, USA, 2009; pp. 1–29. [Google Scholar]
  10. Talebian-Kiakalaieh, A.; Amin, N.A.S.; Hezaveh, H. Glycerol for renewable acrolein production by catalytic dehydration. Ren. Sustain. Energy Rev. 2014, 40, 28–59. [Google Scholar] [CrossRef]
  11. Galadima, A.; Muraza, O. A review on glycerol valorization to acrolein over solid acid catalysts. J. Taiwan Inst. Chem. Eng. 2016, 67, 29–44. [Google Scholar] [CrossRef]
  12. Cecilia, J.A.; García-Sancho, C.; Jiménez-Gómez, C.P.; Moreno-Tost, R.; Maireles-Torres, P. Porous silicon-based catalysts for the dehydration of glycerol to high value-added products. Materials 2018, 11, 1569. [Google Scholar] [CrossRef] [Green Version]
  13. Guisnet, M.; Pinard, L. Characterization of acid-base catalysts through model reactions. Catal. Rev. 2018, 60, 337–436. [Google Scholar] [CrossRef]
  14. Suprun, W.; Lutecki, M.; Haber, T.; Papp, H. Acidic catalysts for the dehydration of glycerol: Activity and deactivation. J. Mol. Catal. A Chem. 2009, 309, 71–78. [Google Scholar] [CrossRef]
  15. Massa, M.; Anderson, A.; Finocchio, E.; Busca, G. Gas-phase dehydration of glycerol to acrolein over Al2O3-, SiO2-, and TiO2- supported Nb- and W-oxide catalysts. J. Catal. 2013, 307, 170–184. [Google Scholar] [CrossRef]
  16. Martinuzzi, I.; Azizi, Y.; Devaux, J.F.; Tretjak, S.; Zahraa, O.; Leclerc, J.P. Reaction mechanism for glycerol dehydration in the gas phase over a solid acid catalyst determined with on-line gas chromatography. Chem. Eng. Sci. 2014, 116, 118–127. [Google Scholar] [CrossRef]
  17. Kim, Y.; Jung, K.D.; Park, E.D. Gas-phase dehydration of glycerol over ZSM-5 catalysts. Microporous Mesoporous Mater. 2010, 131, 28–36. [Google Scholar] [CrossRef]
  18. Kim, Y.; Jung, K.D.; Park, E.D. A comparative study for gas-phase dehydration of glycerol over H zeolites. Appl. Catal. A Gen. 2011, 393, 275–287. [Google Scholar] [CrossRef]
  19. Gu, Y.; Cui, N.; Yu, Q.; Li, C.; Cui, Q. Study on the influence of channel structure properties in the dehydration of glycerol to acrolein over H-zeolite catalysts. Appl. Catal. A Gen. 2012, 429–430, 9–16. [Google Scholar] [CrossRef]
  20. Possato, L.G.; Diniz, R.N.; Garetto, T.; Pulcinelli, S.H.; Santilli, C.V.; Martins, L. A comparative study of glycerol dehydration catalyzed by micro/mesoporous MFI zeolites. J. Catal. 2013, 300, 102–112. [Google Scholar] [CrossRef]
  21. Zhang, H.; Hu, Z.; Huang, L.; Zhang, H.; Song, K.; Wang, L.; Shi, Z.; Ma, J.; Zhuang, Y.; Shen, W.; et al. Dehydration of glycerol to acrolein over hierarchical ZSM-5 zeolites: Effects of mesoporosity and acidity. ACS Catal. 2015, 5, 2548–2558. [Google Scholar] [CrossRef]
  22. Neves, T.M.; Fernandes, J.O.; Morais Liāo, L.; da Silva, E.D.; da Rosa, C.A.; Bongalhardo Mortola, V. Glycerol dehydration over micro- and mesoporous ZSM-5 synthesized from a one-step method. Microporous Mesoporous Mater. 2019, 275, 244–252. [Google Scholar] [CrossRef]
  23. Lutz, W.; Rüscher, C.H.; Gesing, T.M. Investigations of the mechanism of dealumination of zeolite Y by steam: Tuned mesopore formation versus the Si/Al ratio. In Recent Advances in the Science and Technology of Zeolites and Related Materials Part B: Proceedings of the 14th International Zeolite Conference; Volume 154 of Studies in Surface Science and Catalysis; van Steen, E., Callanan, L.H., Claeys, M., Eds.; Elsevier: London, UK, 2004; pp. 1411–1417. [Google Scholar]
  24. Leofanti, G.; Padovan, M.; Tozzola, G.; Venturelli, B. Surface area and pore texture of catalysts. Catal. Today 1998, 41, 207–219. [Google Scholar] [CrossRef]
  25. Thommes, M.; Kaneko, K.; Neimark, A. Physisorption of gases, with special reference to the evaluation of surface area and pore size distribution (IUPAC Technical Report). Pure Appl. Chem. 2015, 87, 1051–1069. [Google Scholar] [CrossRef] [Green Version]
  26. Singh, L.; Rekha, P.; Chand, S. Cu-impregnated zeolite Y as highly active and stable heterogeneous Fenton-like catalyst for degradation of Congo red dye. Sep. Purif. Technol. 2016, 170, 321–336. [Google Scholar] [CrossRef]
  27. Zhang, R.; Xu, S.; Raja, D.; Khusni, N.B.; Liu, J.; Zhang, J.; Abdulridha, S.; Xiang, H.; Jiang, S.; Guan, Y.; et al. On the effect of mesoporosity of FAU Y zeolites in the liquid-phase catalysis. Microporous Mesoporous. Mater. 2019, 278, 297–306. [Google Scholar] [CrossRef]
  28. Dutta, P.K.; Twu, J. Influence of framework Si/Al ratio on the Raman spectra of faujasitic zeolites. J. Phys. Chem. 1991, 95, 2498–2501. [Google Scholar] [CrossRef]
  29. Laughlin, R.B.; Joannopoulous, J.D. Phonons in amorphous silica. Phys. Rev. B 1977, 16, 2942–2952. [Google Scholar] [CrossRef]
  30. De Man, A.J.M.; van Beest, B.H.W.; Leslie, M.; van Santen, R.A. Lattice dynamics of zeolitic silica polymorphs. J. Phys. Chem. 1990, 94, 2524–2534. [Google Scholar] [CrossRef]
  31. Dutta, P.K.; Rao, K.M.; Park, J.Y. Correlation of Raman spectra of zeolites with framework architecture. J. Phys. Chem. 1991, 95, 6654–6656. [Google Scholar] [CrossRef]
  32. Brémard, C.; Le Maire, M. Low-frequency Raman spectra of dehydrated faujasitic zeolites. J. Phys. Chem. 1993, 97, 9695–9702. [Google Scholar] [CrossRef]
  33. Yu, Y.; Xiong, G.; Li, C.; Xiao, F.S. Characterization of aluminosilicate zeolites by UV Raman spectroscopy. Microporous Mesoporous Mater. 2001, 46, 23–34. [Google Scholar] [CrossRef]
  34. Li, C.; Wu, Z. Chapter 11 Microporous materials characterized by vibrational spectroscopies. In Handbook of Zeolite Science and Technology; Auerbach, S.M., Carrado, K.A., Dutta, P.K., Eds.; CRC Press: Boca Raton, FL, USA, 2003; pp. 423–514. [Google Scholar]
  35. Meng, Y.; Genuino, H.C.; Kuo, C.H.; Huang, H.; Chen, S.Y.; Zhang, L.; Rossi, A.; Suib, S.L. One-step hydrothermal synthesis of Manganese-Containing MFI-type zeolite, Mn-ZSM-5, characterization, and catalytic oxydation of hydrocarbons. J. Am. Chem. Soc. 2013, 135, 8594–8605. [Google Scholar] [CrossRef]
  36. Parry, E.P. An infrared study of pyridine adsorbed on acidic solids. Characterization of surface acidity. J. Catal. 1963, 2, 371–379. [Google Scholar] [CrossRef]
  37. Sandoval-Díaz, L.E.; González-Amaya, J.A.; Trujillo, C.A. General aspects of zeolite acidity characterization. Microporous Mesoporous Mater. 2015, 215, 229–243. [Google Scholar] [CrossRef]
  38. Shan, J.; Li, Z.; Zhu, S.; Liu, H.; Li, J.; Wang, J.; Fan, W. Nanosheet MFI zeolites for gas phase glycerol dehydration to acrolein. Catalysts 2019, 9, 121. [Google Scholar] [CrossRef] [Green Version]
  39. Echoufi, N.; Gélin, P. Brønsted acidity in HY zeolites measured by IR study of pyridine adsorption: Influence of steric effects. Catal. Lett. 1996, 40, 249–252. [Google Scholar] [CrossRef]
  40. Marques, J.P.; Gener, I.; Ayrault, P.; Bordado, J.C.; Lopes, J.M.; Ramoa Ribeiro, F.; Guisnet, M. Infrared spectroscopic study of the acid properties of dealuminated BEA zeolites. Microporous Mesoporous Mater. 2003, 60, 251–262. [Google Scholar] [CrossRef]
  41. Meloni, D.; Laforge, S.; Martin, D.; Guisnet, M.; Rombi, E.; Solinas, V. Acidic and catalytic properties of H-MCM-22 zeolites 1. Characterization of the acidity by pyridine adsorption. Appl. Catal. A Gen. 2001, 215, 55–66. [Google Scholar] [CrossRef]
  42. Contreras, J.L.; Gómez, G.; Zeifert, B.; Salmones, J.; Vázquez, T.; Fuentes, G.A.; Navarrete, J.; Nuño, L. Synthesis of Pt/Al2O3 catalyst using mesoporous alumina prepared with a cationic surfactant. Catal. Today 2015, 250, 72–86. [Google Scholar] [CrossRef]
  43. Pala Rosas, I.; Contreras, J.L.; Salmones, J.; Tapia, C.; Zeifert, B.; Navarrete, J.; Vázquez, T.; García, D.C. Catalytic dehydration of glycerol to acrolein over a catalyst of Pd/LaY zeolite and comparison with the chemical equilibrium. Catalysts 2017, 7, 73. [Google Scholar] [CrossRef]
  44. Cecilia, J.A.; García-Sancho, C.; Mérida-Robles, J.M.; Santamaría-González, J.; Infantes-Molina, A.; Moreno-Tost, R.; Maireles-Torres, P. Aluminum doped mesoporous silica SBA-15 for glycerol dehydration to value-added chemicals. J. Sol-Gel Sci. Technol. 2017, 83, 342–354. [Google Scholar] [CrossRef]
  45. Lago, C.D.; Decolatti, H.P.; Tonutti, L.G.; Dalla Costa, B.O.; Querini, C.A. Gas phase glycerol dehydration over H-ZSM-5 zeolite modified by alkaline treatment with Na2CO3. J. Catal. 2018, 366, 16–27. [Google Scholar] [CrossRef]
  46. Kim, Y.T.; Jung, K.D.; Park, E.D. Gas-phase dehydration of glycerol over silica-alumina catalysts. Appl. Catal. B Environ. 2011, 107, 177–187. [Google Scholar] [CrossRef]
  47. Choi, Y.; Park, H.; Yun, Y.S.; Yi, J. Effects of catalyst pore structure and acid properties on the dehydration of glycerol. ChemSusChem 2014, 8, 974–979. [Google Scholar] [CrossRef]
  48. Wang, Z.; Wang, L.; Jiang, Y.; Hunger, M.; Huang, J. Cooperativity of Brønsted and Lewis acid sites on zeolite for glycerol dehydration. ACS Catal. 2014, 4, 1144–1147. [Google Scholar] [CrossRef]
  49. Liu, Y.; Tüysüz, H.; Jia, C.J.; Schwickardi, M.; Rinaldi, R.; Lu, A.H.; Schmidt, W.; Schüth, F. From glycerol to allyl alcohol: Iron oxide catalyzed dehydration and consecutive hydrogen transfer. Chem. Commun. 2010, 46, 1238–1240. [Google Scholar] [CrossRef] [PubMed]
  50. Sánchez, G.; Friggieri, J.; Adesina, A.A.; Dlugogorski, B.Z.; Kennedy, E.M.; Stockenhuber, M. Catalytic conversion of glycerol to allyl alcohol; effect of a sacrificial reductant on the product yield. Catal. Sci. Technol. 2014, 4, 3090. [Google Scholar] [CrossRef]
  51. Park, H.; Yun, Y.S.; Kim, T.Y.; Lee, K.R.; Baek, J.; Yi, J. Kinetics of the dehydration of glycerol dehydration over acid catalysts with an investigation of deactivation mechanism by coke. Appl. Catal. B Environ. 2015, 176–177, 1–10. [Google Scholar] [CrossRef]
  52. Talebian-Kiakalaieh, A.; Saidina Amin, N.A. Kinetic modeling, thermodynamic, and mass transfer studies of gas-phase glycerol dehydration to acrolein over supported silicotungstic acid catalyst. Ind. Eng. Chem. Res. 2015, 54, 8113–8121. [Google Scholar] [CrossRef]
  53. Levenspiel, O. Experimental search for a simple rate equation to describe deactivating porous catalyst particles. J. Catal. 1972, 25, 265–272. [Google Scholar] [CrossRef]
  54. Fuentes, G.A. Catalyst deactivation and steady-state activity: A generalized power-law equation model. Appl. Catal. 1985, 15, 33–40. [Google Scholar] [CrossRef]
  55. Monzón, A.; Romeo, E.; Borgna, A. Relationship between the kinetic parameters of different catalyst deactivation models. Chem. Eng. J. 2003, 94, 19–28. [Google Scholar] [CrossRef]
  56. Guisnet, M.; Magnoux, P. Deactivation by coking of zeolite catalysts. Prevention of deactivation. Optimal conditions for regeneration. Catal. Today 1997, 36, 477–483. [Google Scholar] [CrossRef]
  57. Guisnet, M.; Magnoux, P. Organic chemistry of coke formation. Appl. Catal. A Gen. 2001, 212, 83–96. [Google Scholar] [CrossRef]
  58. Jiang, X.C.; Zhou, C.H.; Tesser, R.; Di Serio, M.; Tong, D.S.; Zhang, J.R. Coking of catalysts in catalytic glycerol dehydration to acrolein. Ind. Eng. Chem. Res. 2018, 57, 10736–10753. [Google Scholar] [CrossRef]
  59. Li, C.; Stair, P.C. Ultraviolet Raman spectroscopy characterization of coke formation in zeolites. Catal. Today 1997, 33, 353–360. [Google Scholar] [CrossRef]
  60. An, H.; Zhang, F.; Guan, Z.; Liu, X.; Fan, F.; Li, C. Investigating the coke formation mechanism of H-ZSM-5 during methanol dehydration using operando UV-Raman spectroscopy. ACS Catal. 2018, 8, 9207–9215. [Google Scholar] [CrossRef]
  61. Chen, K.; Zhang, H.; Ibrahim, U.K.; Xue, W.Y.; Liu, H.; Guo, A. The quantitative assessment of coke morphology based on the Raman spectroscopic characterization of serial petroleum cokes. Fuel 2019, 246, 60–68. [Google Scholar] [CrossRef]
  62. Rodrigues, M.V.; Vignatti, C.; Garetto, T.; Pulcinelli, S.H.; Santilli, C.V.; Martins, L. Glycerol dehydration catalyzed by MWW zeolites and the changes in the catalyst deactivation by porosity modification. Appl. Catal. A Gen. 2015, 495, 84–91. [Google Scholar] [CrossRef]
  63. Carriço, C.S.; Cruz, F.T.; Santos, M.B.; Pastore, H.O.; Andrade, H.M.C.; Mascarenhas, A.J.S. Efficiency of zeolite MCM-22 with different SiO2/Al2O3 molar ratios in gas phase glycerol dehydration to acrolein. Microporous Mesoporous Mater. 2013, 181, 74–82. [Google Scholar] [CrossRef]
  64. Decolatti, H.P.; Dalla Costa, B.O.; Querini, C.A. Dehydration of glycerol to acrolein using H-ZSM-5 zeolite modified by alkali treatment with NaOH. Microporous Mesoporous Mater. 2015, 204, 180–189. [Google Scholar] [CrossRef]
  65. Azaroff, L.V.; Buerger, M.J. The Powder Method in X-ray Crystallography; McGraw-Hill: New York, NY, USA, 1958. [Google Scholar]
  66. Brunauer, S.; Emmett, P.H.; Teller, E. Adsorption of gases in multimolecular layers. J. Am. Chem. Soc. 1938, 60, 309–319. [Google Scholar] [CrossRef]
  67. Barrett, E.P.; Joyner, L.G.; Halenda, P.P. The determination of pore volume and area distributions in porous substances. I. Computations from nitrogen isotherms. J. Am. Chem. Soc. 1951, 73, 373–380. [Google Scholar] [CrossRef]
  68. Bondioli, P.; Della Bella, L. An alternative spectrophotometric method for the determination of free glycerol in biodiesel. Eur. J. Lipid. Sci. Technol. 2005, 107, 153–157. [Google Scholar] [CrossRef]
Figure 1. X-ray diffraction patterns of the HY zeolites.
Catalysts 11 00360 g001
Figure 2. (a) N2 adsorption-desorption isotherms and (b) pore size distribution of the HY zeolites.
Catalysts 11 00360 g002
Figure 3. (a) Raman and (b) UV-vis spectra of the HY zeolites.
Catalysts 11 00360 g003
Figure 4. FTIR-Py spectra of the HY zeolites at different temperatures.
Catalysts 11 00360 g004
Figure 5. Quantification of (a) Lewis and (b) Brønsted acid sites of the HY zeolites at different temperatures.
Catalysts 11 00360 g005
Figure 6. (a) Effect of the total acidity on the glycerol conversion and (b) effect of the Brønsted/Lewis acid sites ratio on the acrolein/acetol molar ratio.
Catalysts 11 00360 g006
Figure 7. Glycerol dehydration reaction routes over HY zeolites.
Catalysts 11 00360 g007
Figure 8. (a) Glycerol conversion and (b) acrolein selectivity of HY zeolites with time on stream.
Catalysts 11 00360 g008
Figure 9. Comparison of the BET surface areas and the deactivation constants of the HY zeolites.
Catalysts 11 00360 g009
Figure 10. X-ray diffraction patterns of the spent zeolites.
Catalysts 11 00360 g010
Figure 11. (a) N2 adsorption-desorption isotherms and (b) pore size distribution of the spent zeolites.
Catalysts 11 00360 g011
Figure 12. Raman spectra of the spent zeolites.
Catalysts 11 00360 g012
Figure 13. (a) TGA thermograms, (b) DTG analysis of the spent zeolites and (c) correlation between the fresh catalyst pore volume and the coke amount of the spent zeolites.
Catalysts 11 00360 g013
Table 1. Crystal size, textural properties and experimental SiO2/Al2O3 molar ratios of the HY zeolites.
CatalystL(111) a (nm)SBET b (m2·g−1)Vp c (cm3·g−1)dp d (nm)SiO2/Al2O3 e
HY(3.5)57.06387.050.0531.923.7
HY(12)32.67634.990.2065.9412.9
HY(30)52.82736.040.2525.2728.4
HY(60)44.33749.420.2745.0464.2
HY(80)45.83753.770.2874.7185.7
a Average crystal size, b BET surface area, c pore volume, d mean pore diameter, e determined by AAS.
Table 2. Initial glycerol conversions and product selectivities of the HY zeolites at different temperatures.
CatalystT (C°)Glycerol Conversion a (%)Product Selectivity a (%)Carbon Balance b (%)
AcetolAcroleinAcetaldehydeFormaldehydeAcetoneAllyl Alcohol
HY(3.5)25061.421.8061.8816.598.464.716.5664.78
27563.611.4659.8216.879.626.975.2763.99
30066.331.1652.7119.2411.934.9310.0361.35
32567.870.7637.9621.6113.837.6018.2360.67
HY(12)25059.612.1968.090.030.0329.650.0160.01
27560.331.8172.055.903.8416.340.0659.75
30062.871.6370.208.315.668.525.6858.08
32563.971.1057.1010.927.1012.4211.3754.25
HY(30)25057.475.0163.997.915.6613.693.7363.17
27560.333.7066.957.955.6511.304.4462.15
30061.402.8973.648.205.664.744.8659.09
32563.151.5951.8417.777.4012.988.4257.38
HY(60)25054.583.1970.825.013.843.0914.0566.85
27556.422.5472.405.403.386.0010.2865.73
30058.862.1572.726.824.766.237.3265.01
32560.611.0850.6813.306.5413.6814.7163.35
HY(80)25049.472.7357.277.094.7615.4112.7467.05
27554.472.5959.378.155.6612.7611.4665.21
30057.942.2066.289.097.412.9612.0665.58
32558.761.9266.3011.298.261.5010.7263.71
a Reaction conditions: gaseous feedstock with 20 wt % glycerol, QN2 = 80 mL·min−1, Wcat = 0.30 g, GHSV = 7910 h−1, TOS = 5 min. b Carbon balance = (Cout/Cin) × 100 according to [20].
Table 3. Reaction rate constants (k), deactivation rate constants (kd) and deactivation orders (d) for the glycerol dehydration over HY zeolites.
Catalystk
(mol·gcat−1·min−1)
kd
(min−1)
d
HY(3.5)2.416 × 10−35.659 × 10−21
HY(12)3.961 × 10−34.742 × 10−21
HY(30)1.461 × 10−33.695 × 10−30.25
HY(60)1.308 × 10−32.585 × 10−30.25
HY(80)1.605 × 10−32.971 × 10−30.25
Reaction conditions: T = 325 °C, QN2 = 80 mL·min−1, Wcat = 0.30 g, GHSV = 7910 h−1, 20 wt % glycerol in the gaseous feedstock.
Table 4. Crystal size, textural properties and carbon content of the spent zeolites.
CatalystL(111) a (nm)SBET b (m2·g−1)Vp c (cm3·g−1)dp d (nm)C e (wt %)Coke Content f (wt %)
HY(3.5)s57.852.480.008--29.5419.96
HY(12)s33.3737.340.09113.5643.0824.76
HY(30)s53.6333.860.09412.9842.3020.79
HY(60)s44.76294.880.17012.4944.4917.31
HY(80)s46.2580.390.19812.6446.0217.27
a Average crystal size, b BET surface area, c pore volume, d mean pore diameter, e determined by EDXS, f determined by TGA.
Table 5. Catalytic performance and deactivation during the glycerol dehydration over different zeolite catalysts.
CatalystReaction Conditions aPerformance bTOS (h)Coke (wt %)Reference
H-ZSM-5 (150)T = 340 °C, 8.3 mol% glycerol, 76 mol% H2O in He, FG = 23.4 mmol·h−1, Wcat = 0.30 gX = 93.7 (39.1)
S = 57.4 (45.9)
1210.1[17]
H-ferrierite (55)T = 340 °C, 8.3 mol% glycerol, 76.3 mol% H2O in He, FG = 23.4 mmol·h−1, Wcat = 0.30 gX = 70.9 (26.3)
S = 77.1 (62.9)
128.1[18]
HY (5.1)T = 315 °C, 8.3 mol% glycerol, 76.3 mol% H2O in He, FG = 23.4 mmol·h−1, Wcat = 0.30 gX = 29.7 (13.2)
S = 29.7 (29.6)
1215.4
HY (12)T = 320 °C, 20 wt % glycerol aq. soln., Wcat = 1 g, GHSV = 873 h−1X = 85 (28)
S = 21 (38)
30.05 mol %[19]
Desilicated
MFI (18)
T = 300 °C, 10 wt % glycerol aq. soln., Wcat = 0.1 g, Qg = 15 mL·min−1, Ql = 0.1 mL·min−1X = 85 (38)
S = 22 (46)
819[20]
Desilicated
H-ZSM-5 (13.9)
T = 275 °C, 20 wt % glycerol aq. soln., Wcat = 0.4 g, Qg = 50 mL·min−1, WHSV = 0.75 h−1X = 89.6 (77.6)
S = 80.4 (69.5)
514.8[64]
Hierarchical
H-ZSM-5 (110)
T = 320 °C, 20 wt % glycerol aq. soln., WHSV = 2.4 h−1X = 100 (83)
S = 86 (86)
2611[21]
Hierarchical
H-ZSM-5 (23.5)
T = 300 °C, 10 wt % glycerol aq. soln., Wcat = 0.08 g, Qg = 30 mL·min−1, Ql = 0.05 mL·min−1, WHSV = 38.5 h−1X = 100 (65)
S = 86 (76)
46.3[22]
Mesoporous H-ZSM-5 (46) nanosheetsT = 320 °C, 20 wt % glycerol aq. soln., Wcat = 0.25 g, WHSV = 2.1 h−1X = 100 (84)
S = 84.5 (87)
3627.5[38]
HY(3.5)T = 325 °C, 20 wt % glycerol aq. soln., Wcat = 0.3 g, Qg = 80 mL·min−1, GHSV = 7910 h−1X = 86.3 (1.7)
S = 80.9 (58.9)
1.520This study
HY(12)X = 91.5 (1.2)
S = 78.2 (57.9)
2.2524.8
HY(30)X = 92 (1.8)
S = 80.3 (61.8)
5.2520.8
HY(60)X = 93.8 (1.8)
S = 79.7 (62.7)
6.7517.3
HY(80)X = 91.8 (1.1)
S = 82.9 (56.5)
717.3
a T = reaction temperature, FG = glycerol molar feed rate, Wcat = weight of catalyst, GHSV = gas hourly space velocity, WHSV = weight hourly space velocity, Qg = carrier gas flow rate, Ql = liquid flow rate. b X = glycerol conversion (%), S = acrolein selectivity (%). Data in parentheses refer to values at the final TOS.
Publisher’s Note: MDPI stays neutral with regard to jurisdictional claims in published maps and institutional affiliations.

