Hydrogenation of Furfural to Furfuryl Alcohol over Ru Particles Supported on Mildly Oxidized Biochar


Département de Génie Chimique, Université Laval, 1065 Avenue de la Médecine, Québec, QC G1V 0A6, Canada
*
Author to whom correspondence should be addressed.
Catalysts 2020, 10(8), 934; https://doi.org/10.3390/catal10080934
Submission received: 21 July 2020
/
Revised: 5 August 2020
/
Accepted: 6 August 2020
/
Published: 13 August 2020
(This article belongs to the Special Issue Commemorative Issue in Honor of Professor Hugo de Lasa)
Abstract
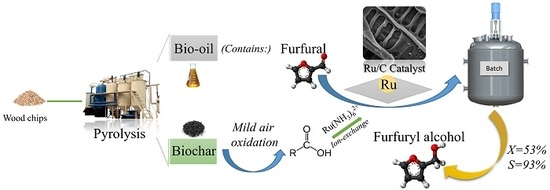
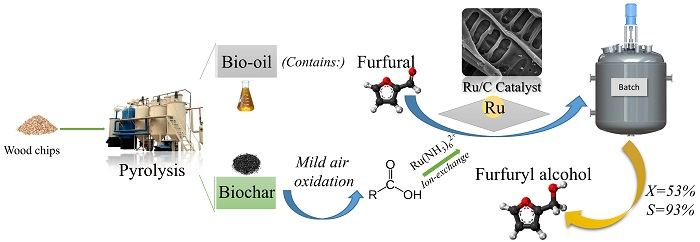
:Catalytic hydrogenation of aldehydes is required as the stabilizing step in bio-oils conversion. Ruthenium supported on carbon was used in the present work for hydrogenation of furfural (FF) to furfuryl alcohol (FA). Converting a biochar with no surface area and low carboxyl groups surface density to an outstanding catalyst support using a very simple mild air/steam oxidation is the original contribution of this work. The mildly oxidized biochar is impregnated with a targeted loading of 2.5 wt.% Ru via ion-exchange, using precursor. ICP analysis shows that the mild oxidation increases Ru adsorption capacity of untreated biochar from 1.2 to 2.2 wt.%. chemisorption and TEM analysis indicate that the preliminary mild oxidation leads to higher Ru dispersion. XPS analysis also shows that the treatment prevents Ru from surface segregation. The highest value of 93% FA selectivity at 53% FF conversion was obtained in a batch autoclave reactor under optimized conditions.
1. Introduction
In an effort to find alternatives to fossil fuel, biomass has been proposed as a source of carbon to produce bio-oil [1]. The bio-oil, however, has much lower energy than traditional petroleum fuels, due to its high oxygen content (45 to 50 wt.%), low pH value, complex composition, and instability leading to phase separation with time. Bio-oil conversion to liquid fuel thus requires refining processes typically performed on crude-oil, such as aqueous-phase processing, hydrotreating, and thermal cracking [2,3].
Sanna et al. [4] mentioned that despite the expenses of hydrotreating processes, they should be implemented as they provide higher selectivities to desired hydrocarbon products. Elliott [5] suggested considering hydrodeoxygenation (HDO) as a crucial step of bio-oils treatment, removing the oxygen present in unsaturated oxygen-containing functionalities in the liquid. Following earlier suggestions [6], he has thus proposed two-step HDO processes for pyrolysis oil, first performing mild hydrogenation under low temperature conditions, e.g., 100 to 140 , to saturate aldehydes and ketones. This step increases the stability of the oil and reduces the rate of coke formation under the severe conditions of HDO [7]. The second step is then bio-oil hydrotreating at higher temperature (200 to 300 ), with the aim of completely deoxygenating the bio-oil. The present work focuses on the first step, namely aldehyde conversion exemplified by furfural hydrogenation.
Investigating the opportunities for bio-based products, Bozell and Petersen [8] have listed furfural as one of the top ten chemicals, possessing nine special criteria and having received significant attention in the literature, to be considered to be an energy platform molecule. Furfuryl alcohol is one of the most interesting furfural derivatives, used in the production of dark thermostatic resins, synthetic fibers, and some dietary supplements, such as vitamin C [9,10,11]. Furfuryl alcohol is the almost exclusive intermediate in the commercial production of levulinic acid, another identified platform molecule [12].
Hydrogenation of furfural to furfuryl alcohol requires catalysts. As reviewed by Long et al. [13], it was performed using non-precious metal such as Cu-based catalysts, ferrous metal (Fe, Ni, Co)-based catalysts, solid acid-based catalysts such as , and precious metals such as Ru, Pt, Pd-based catalysts. Apart from reaction conditions, the type of metal indeed affects product selectivity. For instance, Cu-based catalysts could not open furan rings due to their exclusion from copper surfaces, but they have been reported to strongly react with C=O bonds. Using these catalysts, the reaction should however be performed under severe high temperature and pressure conditions [14]. According to a review of aqueous-phase hydrogenation of bio-sourced chemicals published by Besson et al. [15], ruthenium metal particles supported on carbons and oxides have been reported as the most promising catalysts, resulting in a rapid and selective conversion of carbonyl moieties of aldehydes into their corresponding alcohols [16]. To the best of our knowledge, Kaliaguine’s group was the first to report successful hydrogenation of aldehydes in bio-oils using Ru-based catalysts [6].
Ru catalysts can be synthesized in supported or unsupported form. The deposition of active metals on a support prevents their sintering, thereby improving the catalytic activity. Among the different types of supports such as silica [17], alumina [18], and zeolites [19], carbonaceous materials have been vastly used, notably owing to their unique characteristics [20]. These include high surface area, the presence of oxygen-containing surface functional groups, physical stability, and chemical inertness [21,22]. Most of biochars show however poor specific surface area and surface density of oxygen-containing functional groups, thus requiring surface modification [23]. A common method of catalysts preparation is incipient wetness impregnation (IWI), where a porous support is filled with a certain quantity of precursor solution equivalent to its total pore volume. Catalysts preparation via adsorption process is another method [24,25,26,27,28,29,30,31,32,33,34]. Adsorption from aqueous solutions is based on ion-exchange (IE), mainly performed when a low metal loading is targeted [35]. In comparison with IWI, adsorption is used for supports with high density of acidic surface functional groups. It was reported that IE results in higher dispersion than IWI [24,36].
In the 2017 review reported by Lee et al. [37], biochar was mentioned as an excellent catalyst support, but there is still meager research in this particular application. The main problem is still finding an efficient approach toward biochar impregnation with metal particles. A unique pyrolysis biochar with very low specific surface area was produced by Pyrovac Inc. [38]. In the present work, this biochar surface was modified by mild air/steam oxidation to provide this material with high density of carboxylic surface functional groups, allowing catalysts preparation via ion-exchange. The prepared catalysts were characterized using physisorption, elemental and ICP analyses, SEM/EDX, TEM, chemisorption, TPR, and XPS. Catalysts activity was examined in the hydrogenation of furfural under mild temperature conditions using an autoclave batch reactor. The products were quantified using GC analysis. The effects of reaction parameters including temperature, pressure, mass of catalyst, and agitation time were also investigated.
2. Results and discussion
2.1. TPR, Nitrogen Physisorption, and Elemental Analyses
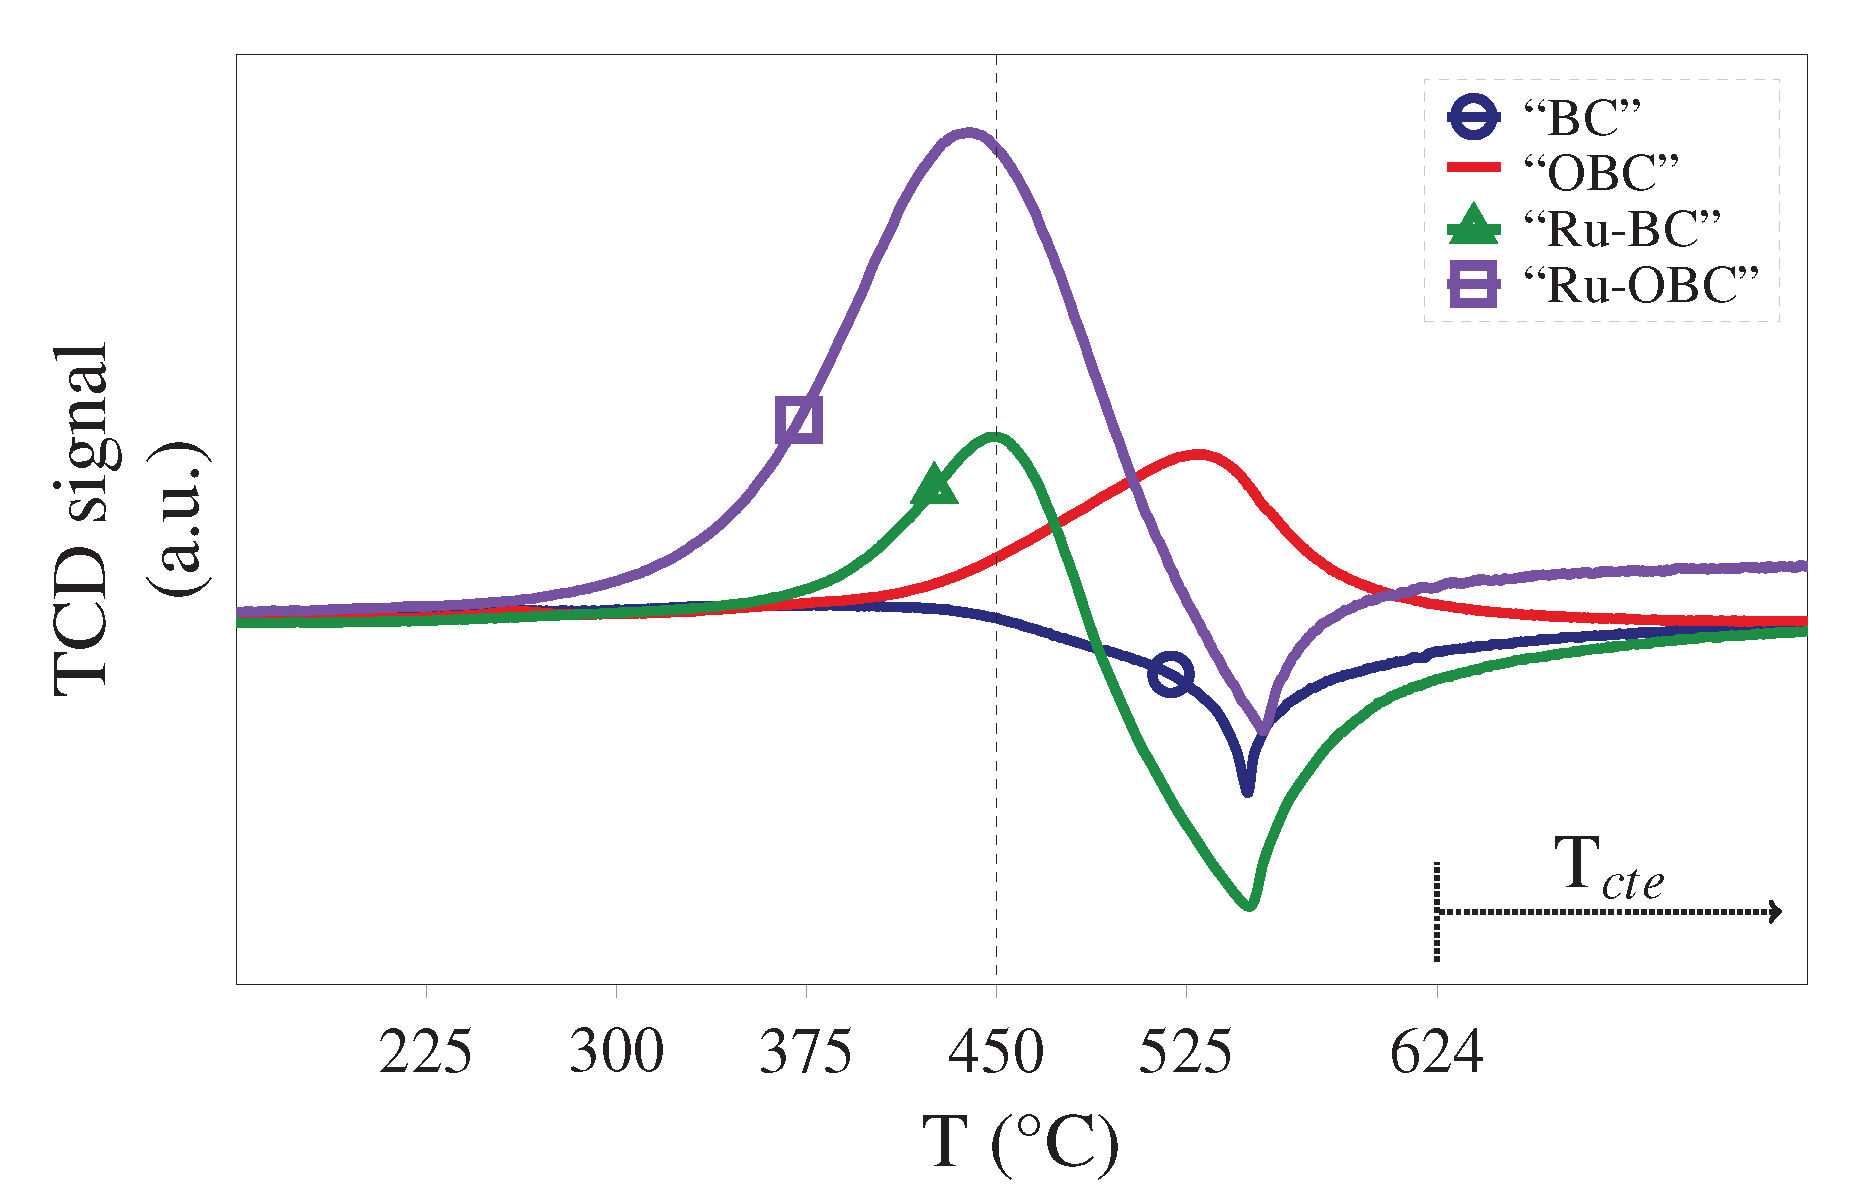
The results of TPR analysis are presented in Figure 1. The positive peaks of TPR analysis detected as TCD signals, indicate adsorption over the sample surface from a constant gas flow, while the negative ones represent desorption from the surface into the flow.
Implementing the method of Inelastic Neutron Scattering (INS), Mitchell et al. [39] have predicted four expected phenomena during hydrogen adsorption over carbons and carbon supported metal catalysts, as follows: (I) spillover mobile hydrogen atoms weakly bound to the saturated/unsaturated carbons, (II) spillover hydrogen atoms strongly bound to unsaturated carbons, likely at carbon edge and/or defective basal planes, (III) hydrogen adsorption as dihydrogen molecular ions (), and (IV) hydrogen atoms bound to Ru particles. Biochar sample (“BC”) shows only a negative TPR peak. Hydrogen atoms may possibly be accumulated around unsaturated carbons at lower temperature by the first above-mentioned process (I), and then easily released to the flowing Ar above 450 . These bonds, however, seem to become saturated upon oxidation. Oxidized biochar (sample “OBC”), therefore, shows only a positive TPR peak over the same temperature range, where the hydrogen desorption from the surface of sample “BC” has been observed. This peak might be related to hydrogen reacting with C—OH bonds of recalcitrant oxygen-containing surface functional groups like phenols, resulting in the formation of C—H and water. For the samples loaded with Ru, two peaks at 450 and 530 were observed. According to literature, the first positive peak is attributed to Ru particles, proposing the best temperature of catalyst reduction to be around 450 [24]. The area below this peak in sample “Ru-OBC” was apparently found to be much higher than sample “Ru-BC”, corresponding to a higher Ru loading and dispersion on the former. Both samples showed a secondary negative TPR peak. Conner and Falconer [40] have attributed this observation to the hydrogen spillover from Ru particles. Mitchell et al. [39] also reported that the type of active site influences hydrogen uptake. For instance, Ru uptakes more hydrogen than Pt both supported on carbon, thereby resulting in a higher spillover. Some or all the above-mentioned possibilities might thus result in the release of hydrogen molecules as the negative peak in TPR profiles. This phenomenon may thus be responsible for the broader negative TPR peak in sample “Ru-BC” than “BC” with no Ru. The area of the peak in the former is also higher than that of sample “Ru-OBC”, due to the combination of the negative peak in TPR profile of sample “BC” with spilt over hydrogen generated on Ru. This difference could be also discussed according to the work of Li and Lueking [41]. They have reported that lactonic functional groups provide a stronger hydrogen adsorption binding energy than the other types, thereby resulting in more spilt over hydrogen. Lactonic surface concentrations measured by Boehm titration have been discussed in detail in our previous works [38,42]. The results show that these groups form 37 and 20 mol.% of total acidic surface functional groups in samples “BC” and “OBC”, respectively (see Table 1).
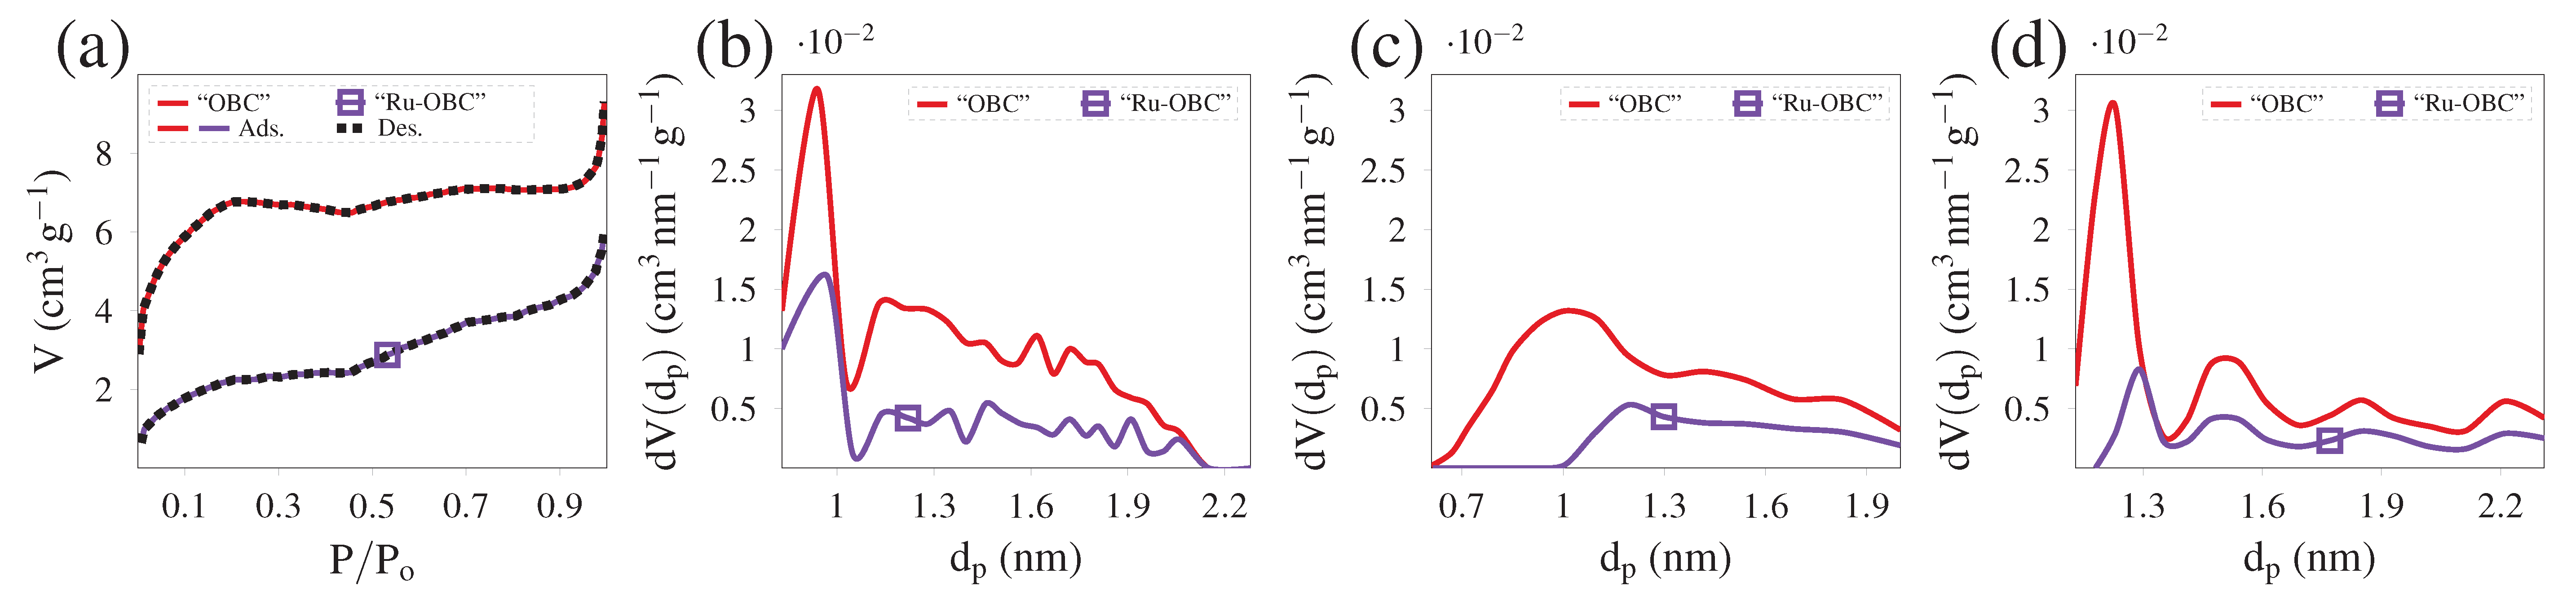
Samples were analyzed using nitrogen physisorption equilibrium isotherms with the corresponding results being presented in Figure 2a and Table 2. A maximum degassing temperature of 300 is mostly used by researchers for carbonaceous materials. Higher temperature may change the surface morphology of the sample, resulting in an overestimated specific surface area [43]. As mentioned above (Section 3.3), all samples of this work have been degassed under vacuum at 300 . Using these degassing conditions, no nitrogen physisorption was obtained neither for sample “BC”, nor sample “Ru-BC”. This might be due to pore filling or coverage of the external particle surfaces of the biochar with heavy fractions of pyrolysis bio-oil (tar), which easily undergo polymerization. Biochar oxidation with air/steam under the mild conditions used in this work, moderately released the “BC” surface, resulting in nitrogen adsorption-desorption isotherms of type I for sample “OBC”, as depicted in Figure 2a. With a final yield of 15 wt.% (based on initial dry biomass) due to the sample burn-off, the oxidation leads to a biochar with (Table 2). A similar isotherm, but with lower adsorption capacity was also observed for the oxidized biochar loaded with Ru (sample “Ru-OBC”). This isotherm type is a typical feature of materials with narrow micropores.
Pore size distributions (PSD) are depicted in Figure 2b–d, representing PSD estimated using BJH, QSDFT, and NLDFT, respectively. As summarized in Table 2, average pore diameters of 0.9, 1 and 1.2 were found for sample “OBC” using the above-mentioned approaches. These methods yielded estimates of average pore diameters of 1, 1.2 and 1.3 for sample “Ru-OBC”. For both samples, NLDFT yielded a slightly higher average pore diameter, which is a commonly reported result (see for example Ref. [44]). Comparing Figure 2b–d shows that the NLDFT method provides a more detailed representation of a multimode PSD, with a selective pore volume decrease of the lower diameter mode, upon Ru adsorption.
All samples except the reduced ones were submitted to elemental analysis, and the results are presented in Table 3. The oxygen fraction of sample “BC” increases upon oxidation from 24 to 40.8 wt.%, with resulting carbon content decrease from 71.8 to 62.5 wt.%. A same order of magnitude in the range of 2.8 to 3.7 wt.% was observed for hydrogen content of all samples. The nitrogen fraction of 0.5 wt.% in samples “BC” and “OBC” increased upon their impregnation with ruthenium species to 1.5 and 3.7 wt.%, respectively. These increases may be due to some nitrogen of , as well as used in the catalyst’s preparation. Considering the targeted Ru loading of 2.5 wt.%, the Ru contents on samples “Ru-BC” and “Ru-OBC”, were respectively equal to 1.2 and 2.2 wt.%. The higher nitrogen amount of sample “Ru-OBC” is related to a higher adsorption of the cationic complexes. The maximal adsorption capacity of sample “OBC” for Ru cations can be estimated equivalent to the concentration of carboxylic groups ( summarized in Table 1). Having 2.2 wt.% Ru on sample “Ru-OBC” reveals that its surface has been over exchanged by impregnation.
2.2. SEM/EDX, TEM, and Chemisorption Analyses
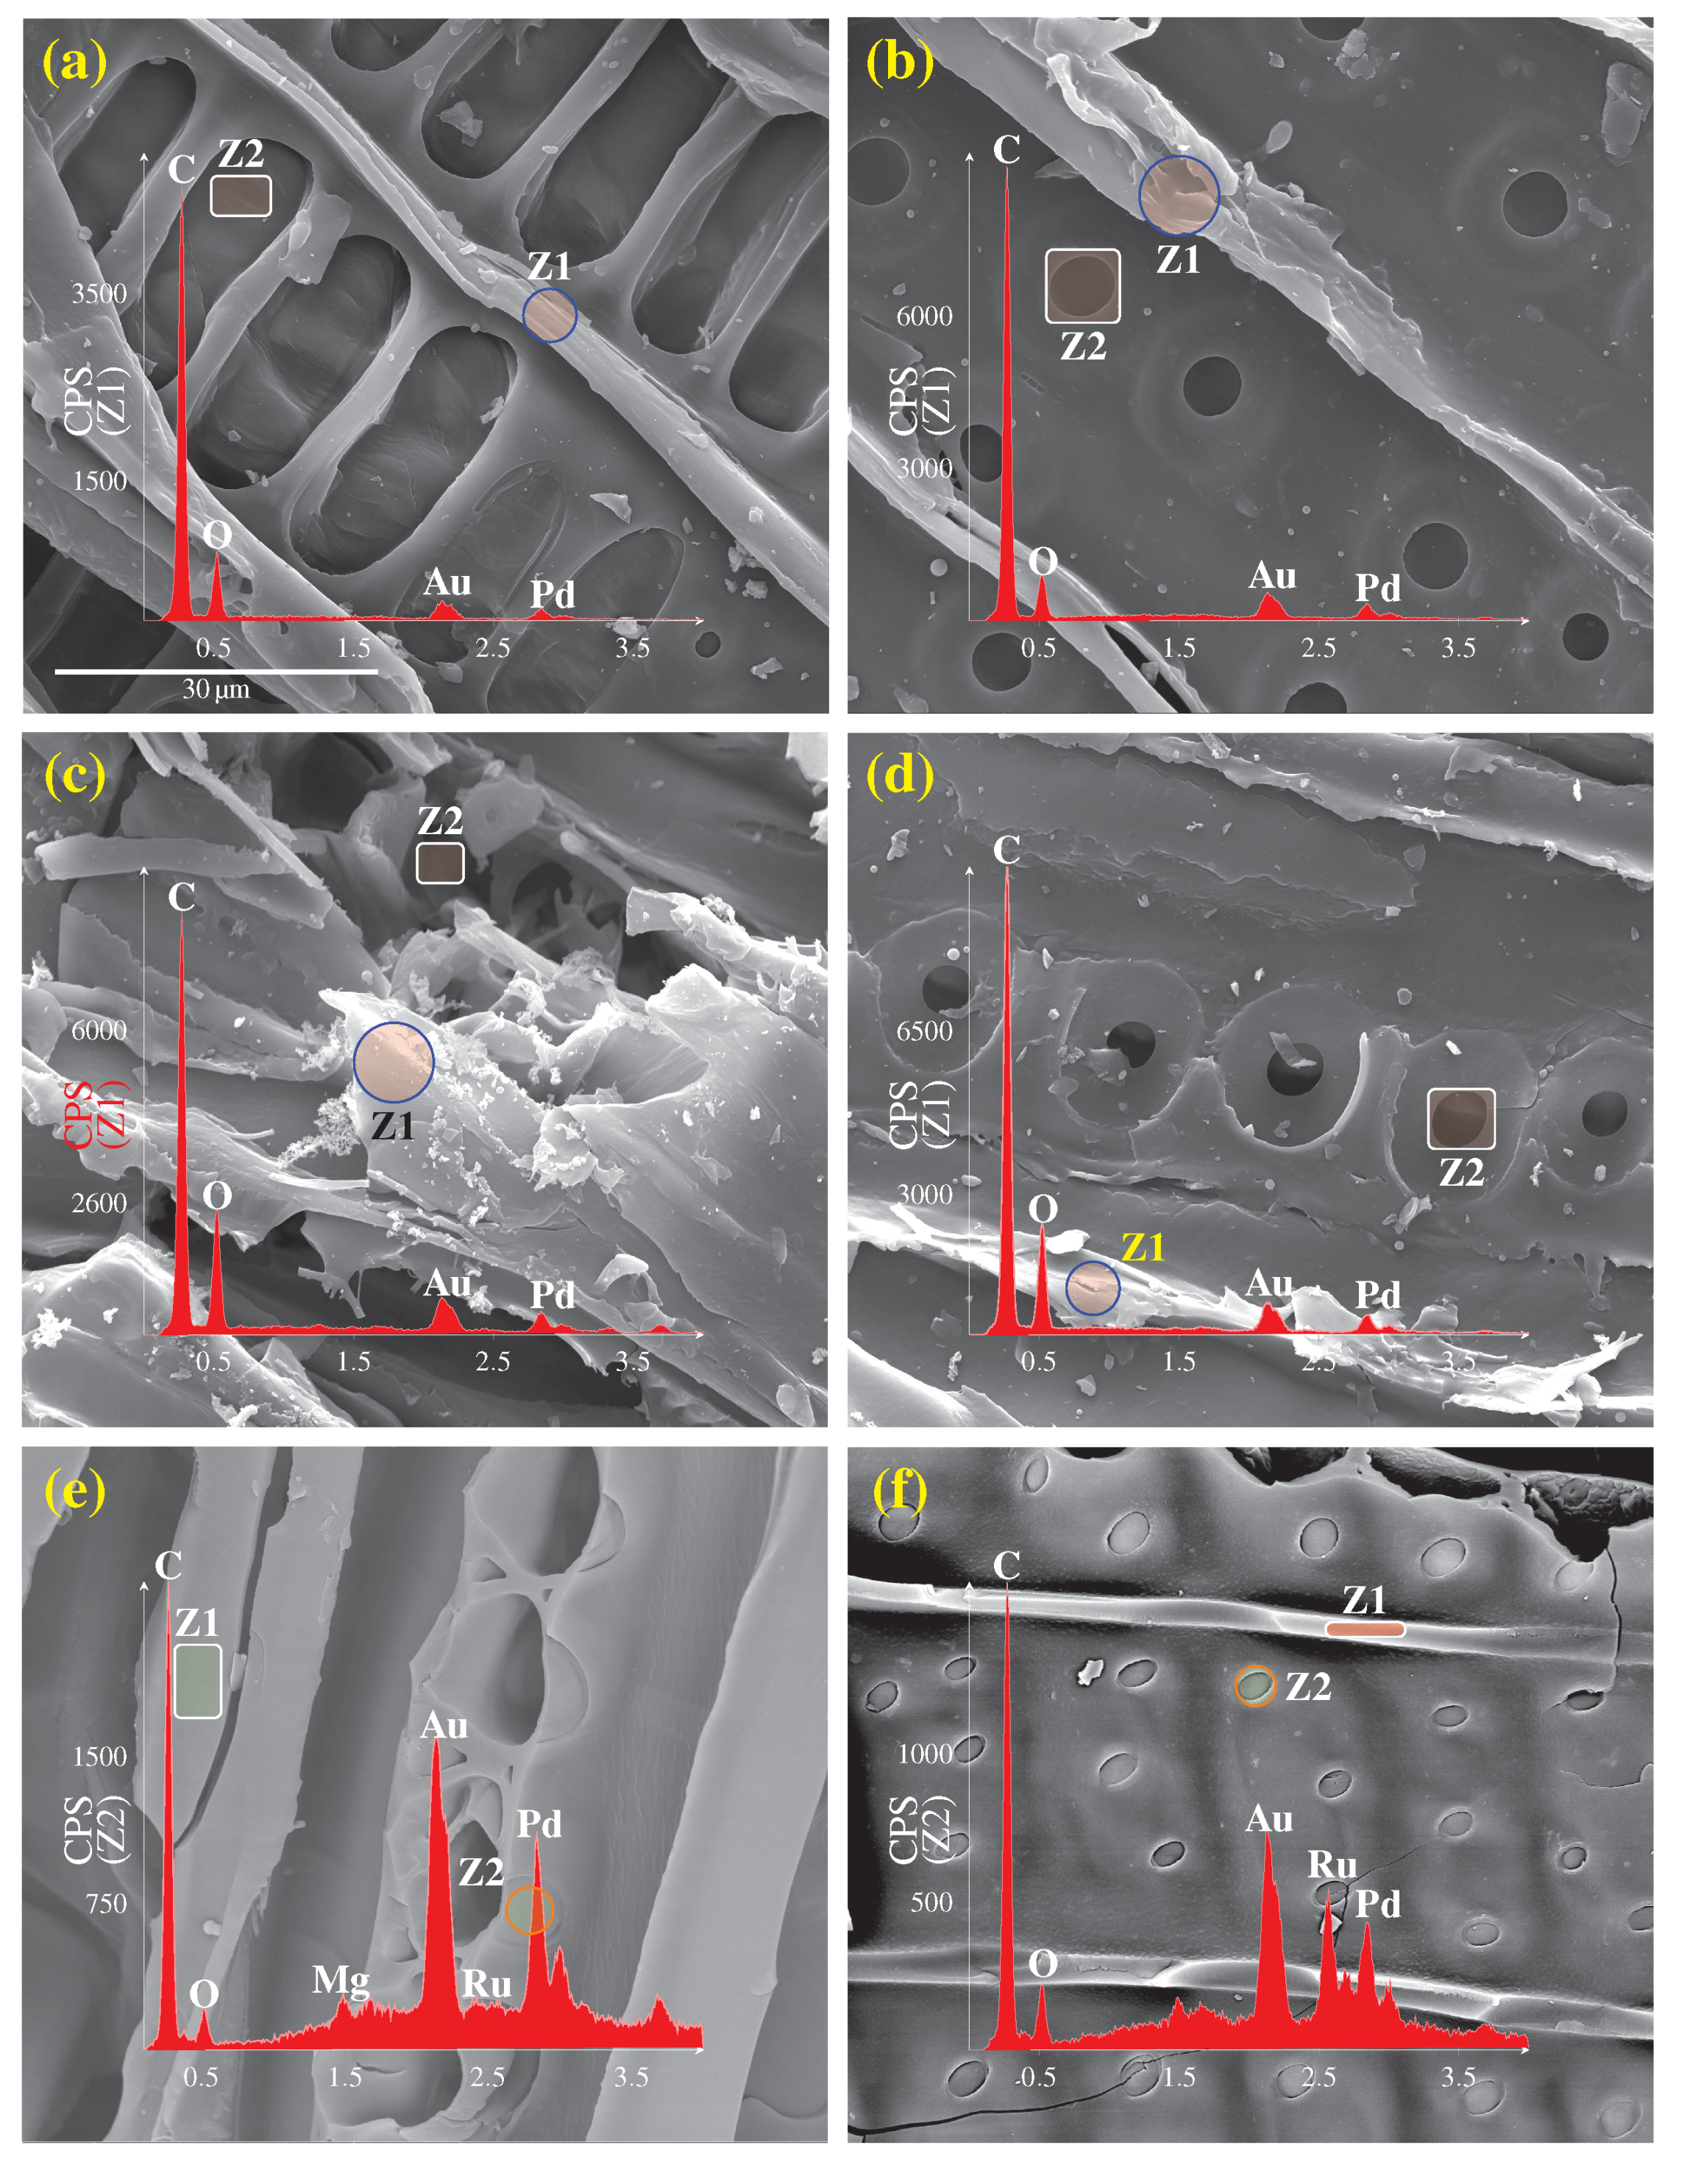
SEM photographs are shown in Figure 3. Figure 3a–d show secondary electron images of samples “BC” and “OBC”. In these figures, the presented EDX spectra are corresponding to the zone, i.e., Z1, where the highest oxygen content was observed. Instead, in Figure 3e–f captured from back-scattered electrons, the EDX spectra of the zone with the highest content of Ru, i.e., Z2, are shown. The atomic percentages of the elements found by EDX are also summarized in Table 4. In all photographs, zone Z1 with the highest oxygen fraction was observed at the outer edge of ducts, parallel to biochar fibrils. The highest values of oxygen fraction found in Figure 3a–c, were thus equal to 18 and 29 at.% for samples “BC” and “OBC”, respectively. Instead, the highest values of Ru fraction in both samples “Ru-BC” and “Ru-OBC” were found on pore entrance (i.e., Z2) shown in Figure 3e–f, where oxygen content is lower. The atomic percentage of Ru in samples “Ru-BC” and “Ru-OBC” zones Z2 were equal to 0.5 and 5.5 at.%, respectively. This zone of the samples also showed the highest content of minerals (the total amount of Mg, Ca, K, and Na), equal to 5 and 1.5 at.%. Our previous work on cation-exchange showed that zone Z1 of the oxidized biochar is the most convenient place for lead ions to adsorb [42]. In this case, the concentration was however lower than the sorbent saturation capacity. Finding Ru in zone Z2 supports the previous claim about the over exchange of sample “OBC” with ruthenium.
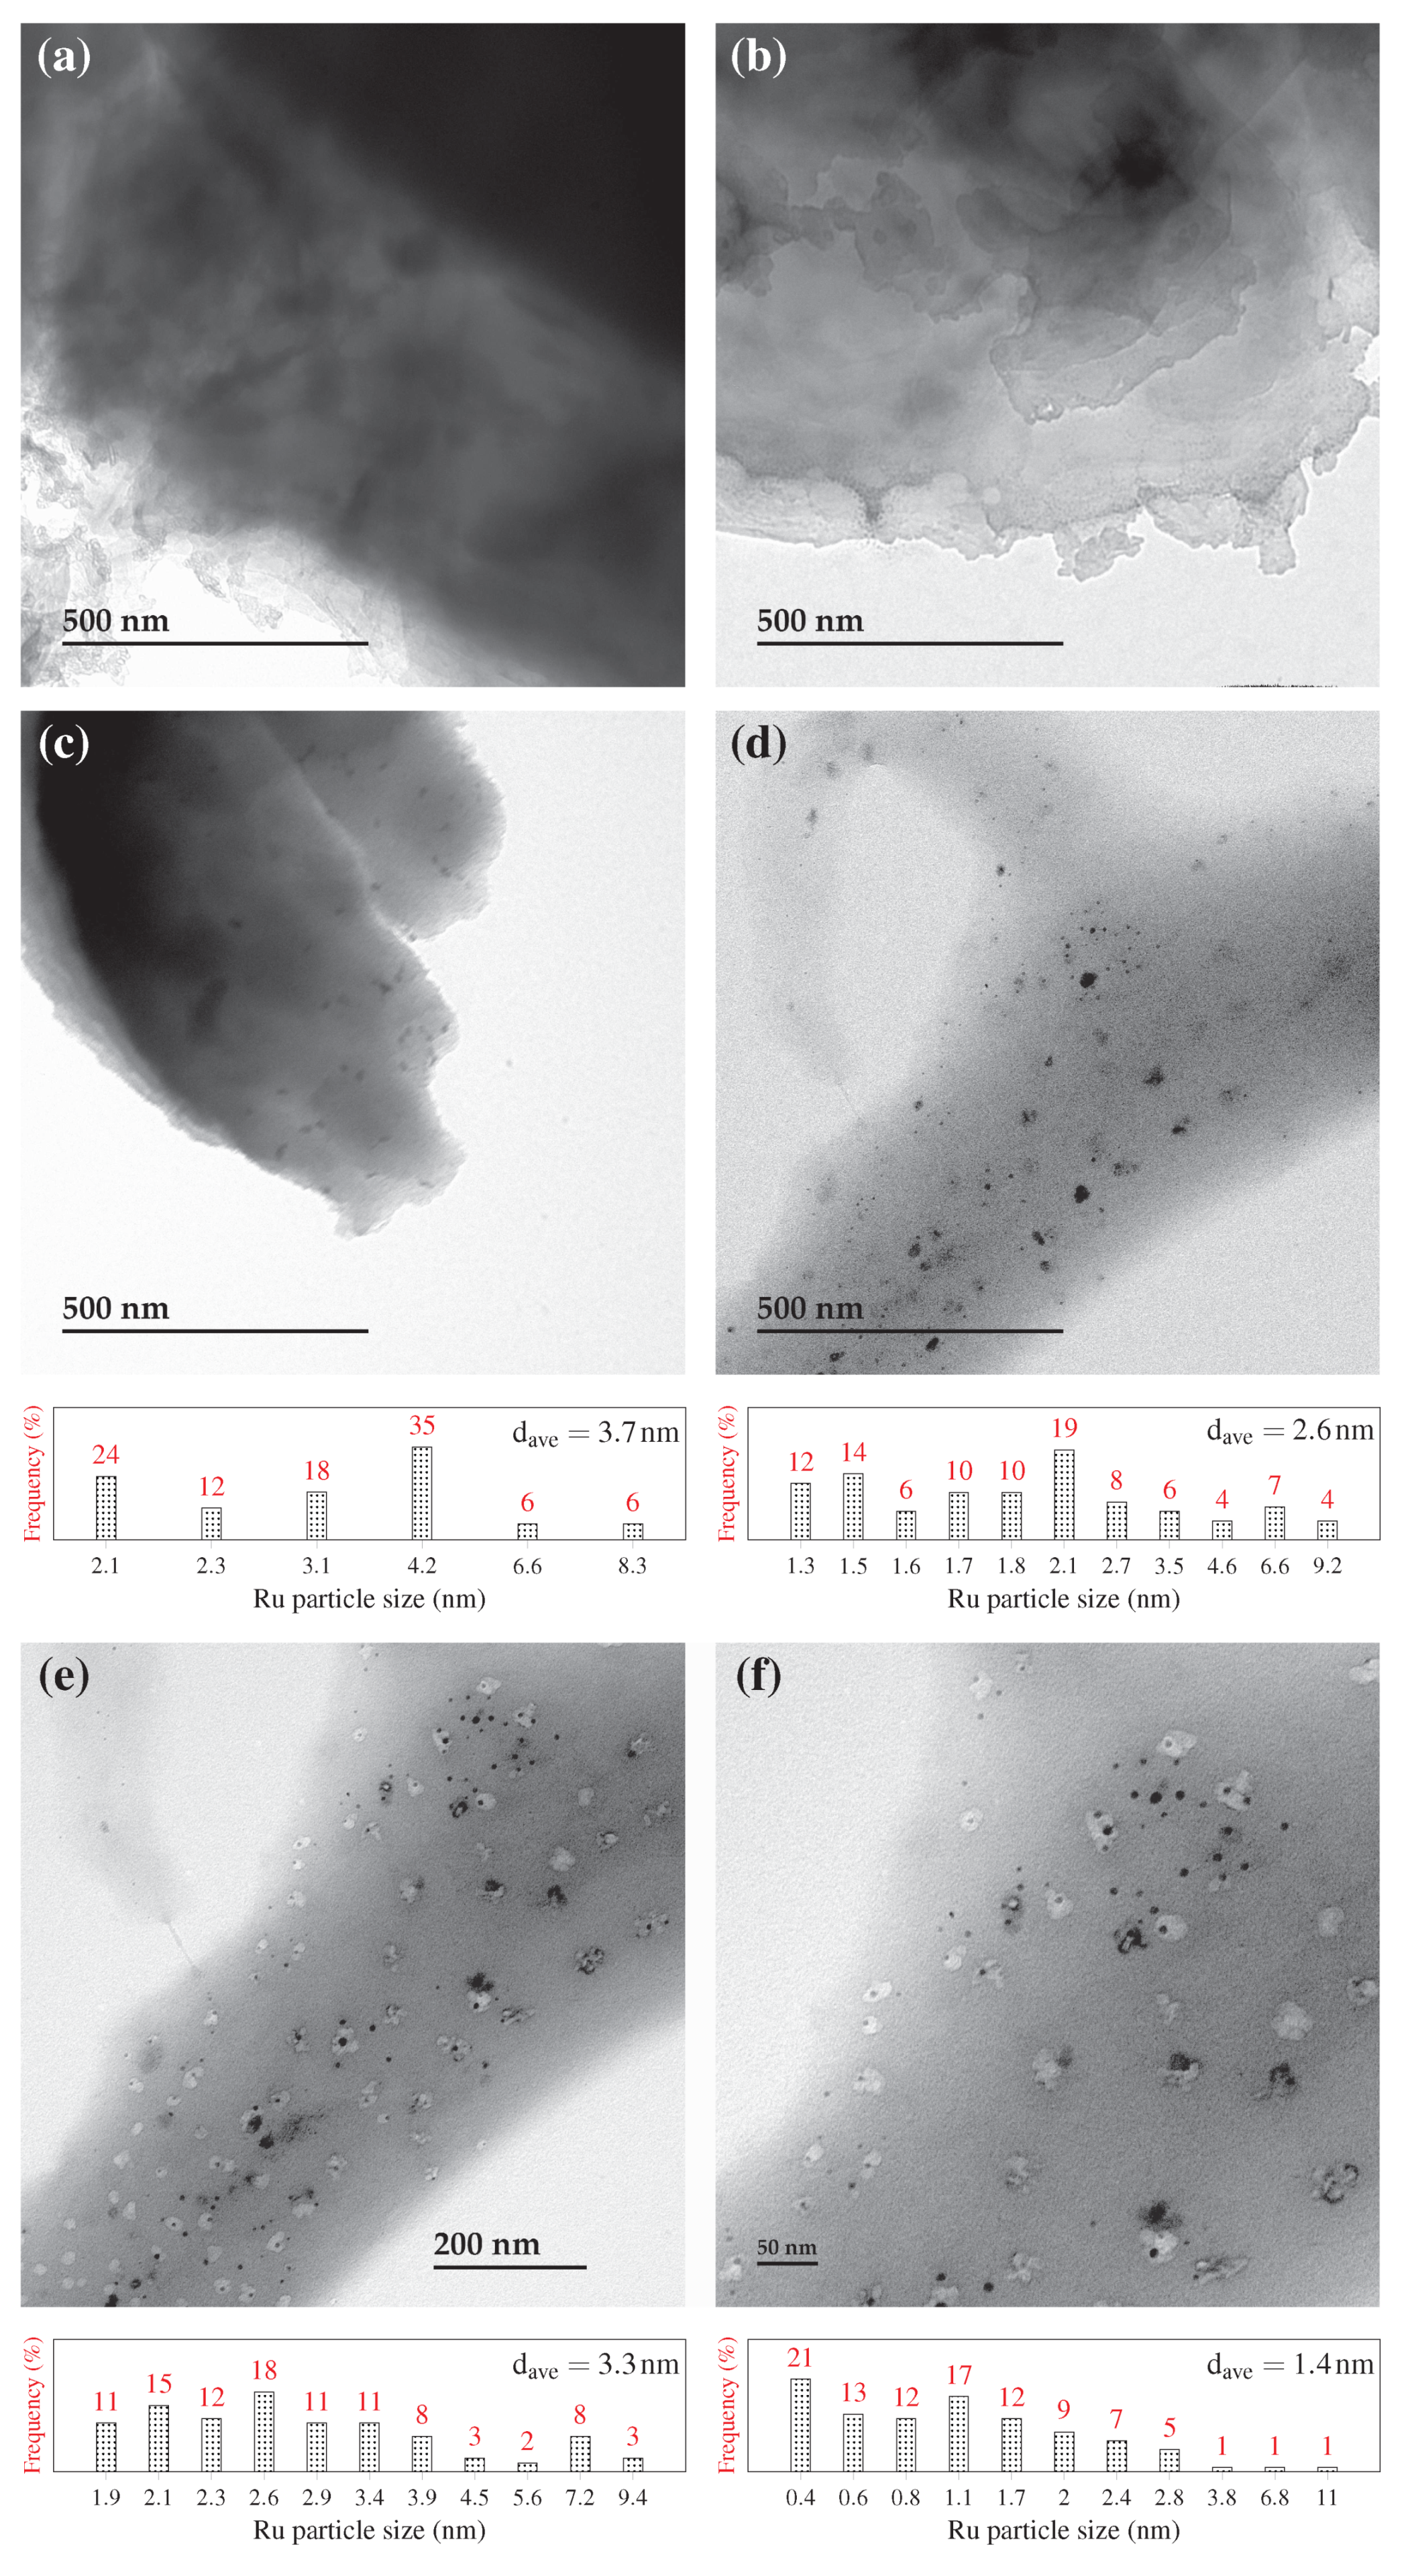
TEM photographs are shown in Figure 4. As found in Figure 4a, sample “BC” has obviously bulky nonporous particles. The transparent edge of the specimen surface in Figure 4b shows that mild air/steam oxidation has introduced a minor porosity in the pyrolysis biochar. The average Ru particle size and its dispersion in samples “Ru-BC” and “Ru-OBC” are determined using Figure 4c,d, and summarized in Table 5. According to the TEM results, Ru particles have a smaller average particle size () on specimen “Ru-OBC” than “Ru-BC”, equal to 2.6 and 3.7 , respectively. These data indicate that the former has a higher Ru dispersion of 50% compared to the “Ru-BC” value of 35%. Figure 4e,f show that Ru particles are better-dispersed on sample “Ru-OBC” obtained via IE, as increasing the photograph resolution allows detecting finer Ru particles. The average Ru particle size of 3.3 and 1.4 were obtained from those images, respectively. The latter, with more significance, is in good accordance with the work of Toebes et al. [45] who studied the effect of oxygen-containing surface groups on synthesizing carbon nanofiber-supported Ru catalysts, even if these authors have used STEM images with much higher resolution.
Metal dispersion can also be found from gas chemisorption. The results obtained for chemisorption are summarized in Table 5. The amount of strongly adsorbed hydrogen on samples “Ru-BC” and “Ru-OBC” were equal to 0.18 and 0.34 , respectively. Ru dispersion values were also found equal to 7.4 and 13.9%. As with that observed by Lin et al. [46,47] and Nguyen-Huy et al. [48], Ru dispersion of both samples measured by chemisorption are significantly lower than those obtained from TEM images. The size of ruthenium particles on samples “Ru-BC” and “Ru-OBC” were respectively determined from chemisorption as equal to 18 and 9.5 . In both cases, Ru average particle size measured by chemisorption is higher than that obtained from TEM analysis. Toebes et al. [45] also reported similar observation. The much lower dispersion of Ru particles measured by chemisorption and necessarily their higher average size are very likely associated with anionic impurities such as Cl and N originating from the catalyst preparation. The presence of these residuals may result in the blockage of the Ru sites from molecules, necessitating further sorption and thereby overestimating the value of in Table 5 [47]. Whatever the method, smaller particle size and therefore higher dispersion is observed when the oxidized biochar is used as the catalyst support. The lower Ru dispersion of sample “Ru-BC” is likely associated with its lower concentration of carboxylic groups ( ) presented in Table 1 [49]. This result strongly suggests that the initially exchanged Ru ions serve as centers on which further Ru atoms aggregate during the sintering process.
2.3. X-ray Photoelectron Spectroscopy (XPS)
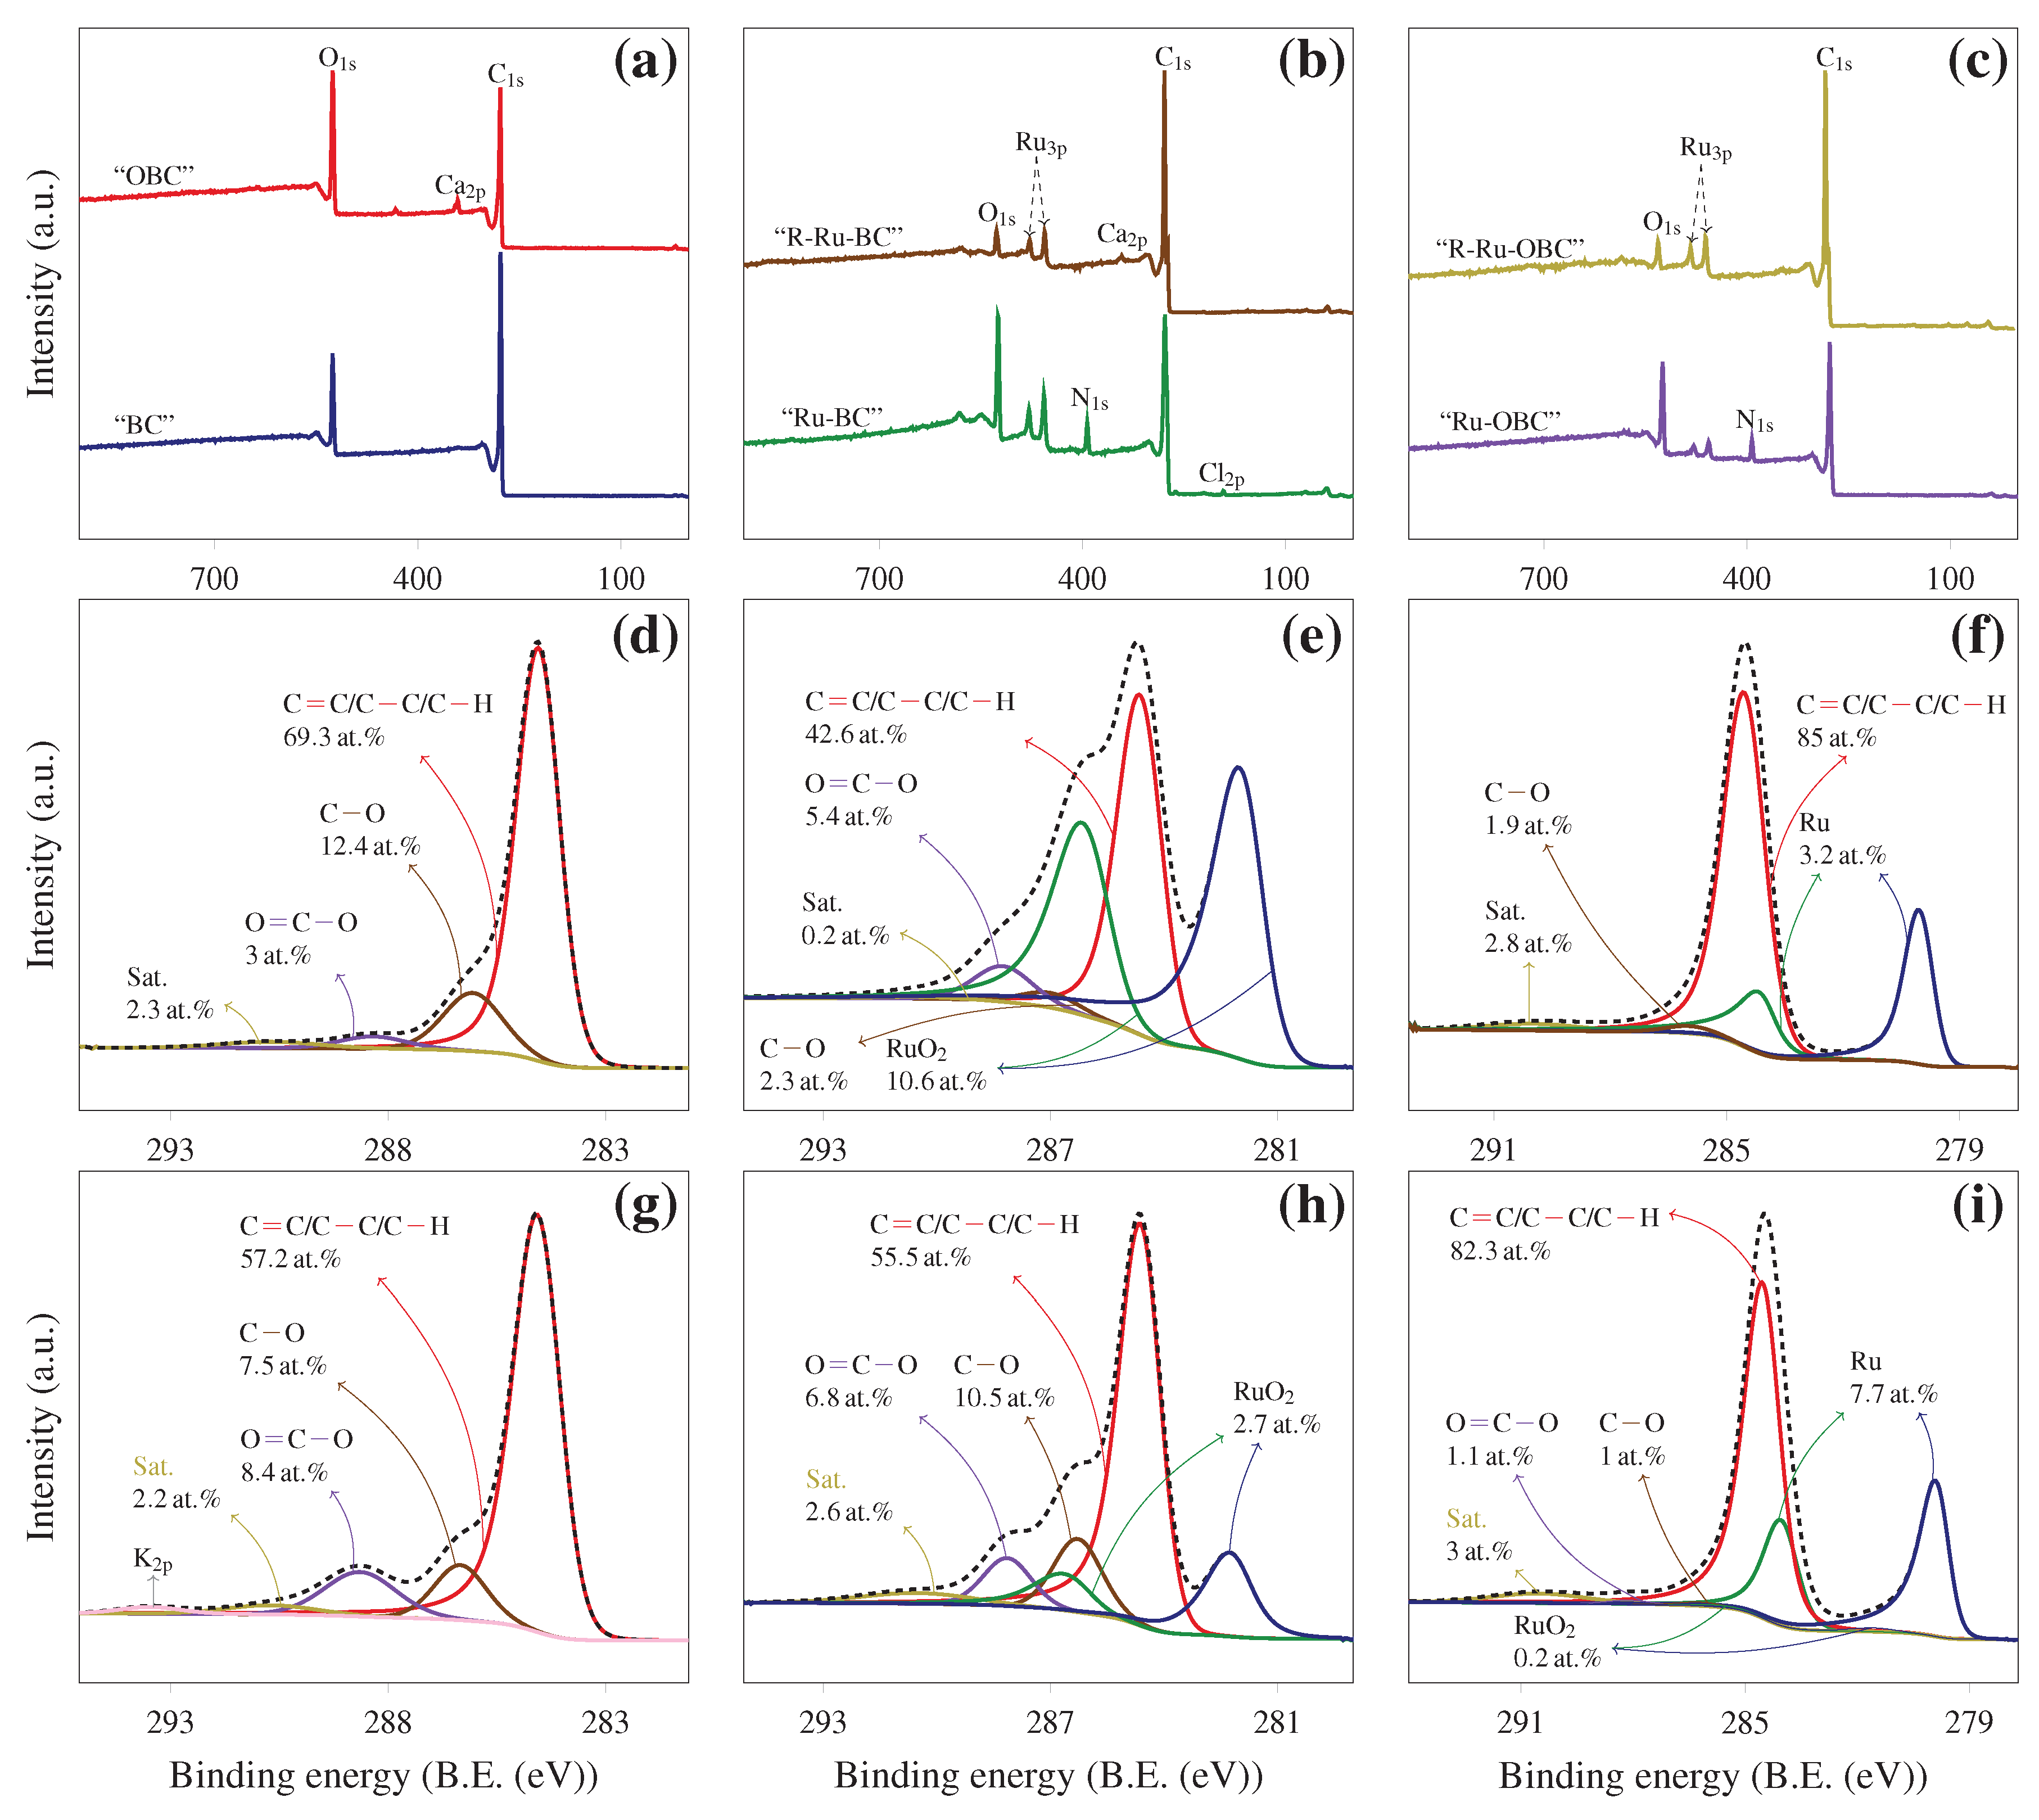
The full-range XPS surveys are presented in Figure 5a–c. Table 6 also summarizes the results extracted from the surveys, representing the surface atomic percentages of the elements.
Minerals including Al, Si, Ca, Mn, Cu, and Zn found in some samples, are all corresponding to ash content [50]. Chlorine, nitrogen, and fluorine were only detected on the non-reduced samples loaded with Ru, stemming from contamination during the catalyst’s preparation. The anionic impurities were all removed by in situ reduction prior to XPS analysis (see samples “R-Ru-BC” and “R-Ru-OBC” in Table 6). The increase in oxygen fraction of sample “BC” from 13 to 23.5 at.% upon oxidation, is due to its surface functionalization with carboxylic groups, which is in agreement with Boehm titration. Oxygen increase of sample “BC” from 13 and 27 at.% is due to the oxygen atoms of ruthenium oxides on the carbon surface. The decrease in the oxygen fraction of sample “OBC” after the impregnation indicates that oxygenated functionalities participate in the cation adsorption. Owing to the reduction of ruthenium oxides into the metallic form, oxygen fractions of samples “Ru-BC” and “Ru-OBC” were significantly decreased in their reduced form (samples “R-Ru-BC” and “R-Ru-OBC”). The value of in sample “Ru-BC”, contrary to sample “Ru-OBC”, was significantly reduced upon reduction from 0.16 to 0.05. This indicates that using non-oxidized biochar as catalyst support, Ru surface segregation does take place upon Ru deposition on sample “BC”. This segregation is intensified upon heating in hydrogen, suggesting that Ru is transferred in the biochar during hydrogen treatment. Preliminary oxidation, actually, suppresses this segregation process, likely associated with an inward motion of Ru ions during deposition, the electrostatic interaction acting as the driving force in this case [51,52,53].
The deconvolutions of XPS photo lines in terms of atomic concentration of surface moieties are presented in Figure 5d–i. The peak at a binding energy of eV is assigned to carbon in the moieties consisting of -unsaturated C=C, -saturated C—C, and C—H [54]. The atomic fraction of these moieties in sample “BC” was reduced by the impregnation. The signal of C—O bonds found at , was reduced from 12.4 to 2.3 at.%. Moreover, satellite peak of aromatic observed at , decreased from 2.3 to 0.2 at.%. All these observations suggest that cation interaction with C=C bonds of aromatic rings and cation-exchange with hydroxyl functionalities are both involved in Ru adsorption [55]. Oxidation of sample “BC” yielding sample “OBC”, decreased the fraction of C—O bonds from 12.4 to 7.5 at.%, while that of O—C=O in carboxylic groups, found at , increased from 3 to 8.4 at.% (compare Figure 5d with Figure 5g. This observation is associated with possible intramolecular reaction of oxygenated functionalities under some conditions [56]. Thus, the fraction of carbon-carbon/hydrogen bonds were reduced in favor of carbon-oxygen moieties. Due to ion-exchange with , the concentration of carboxylic groups decreased after the impregnation of sample “OBC” with ruthenium. The unexpected increases in the area of peaks associated with O—C=O and C—O respectively observed upon the impregnation of samples “BC” and “OBC”, might be related to ruthenium oxides whose peaks interfere with those of these carbon groups. Sample reduction changed the binding energies of ruthenium oxides from 282 ± 3 and 286 ± 4 eV, to 280.0 ± 0.2 and 284.0 ± 0.1 eV, respectively (compare Figure 5e with Figure 5f, and Figure 5h with Figure 5i. These changes are associated with reduction into metallic Ru [57]. The significant decrease in the fraction of carbon-oxygen bonds upon the reduction is possibly related to these oxygen moieties being covered by Ru particles in addition to biochar reduction.
2.4. Hydrogenation of Furfural over Ru Supported on Oxidized Biochar
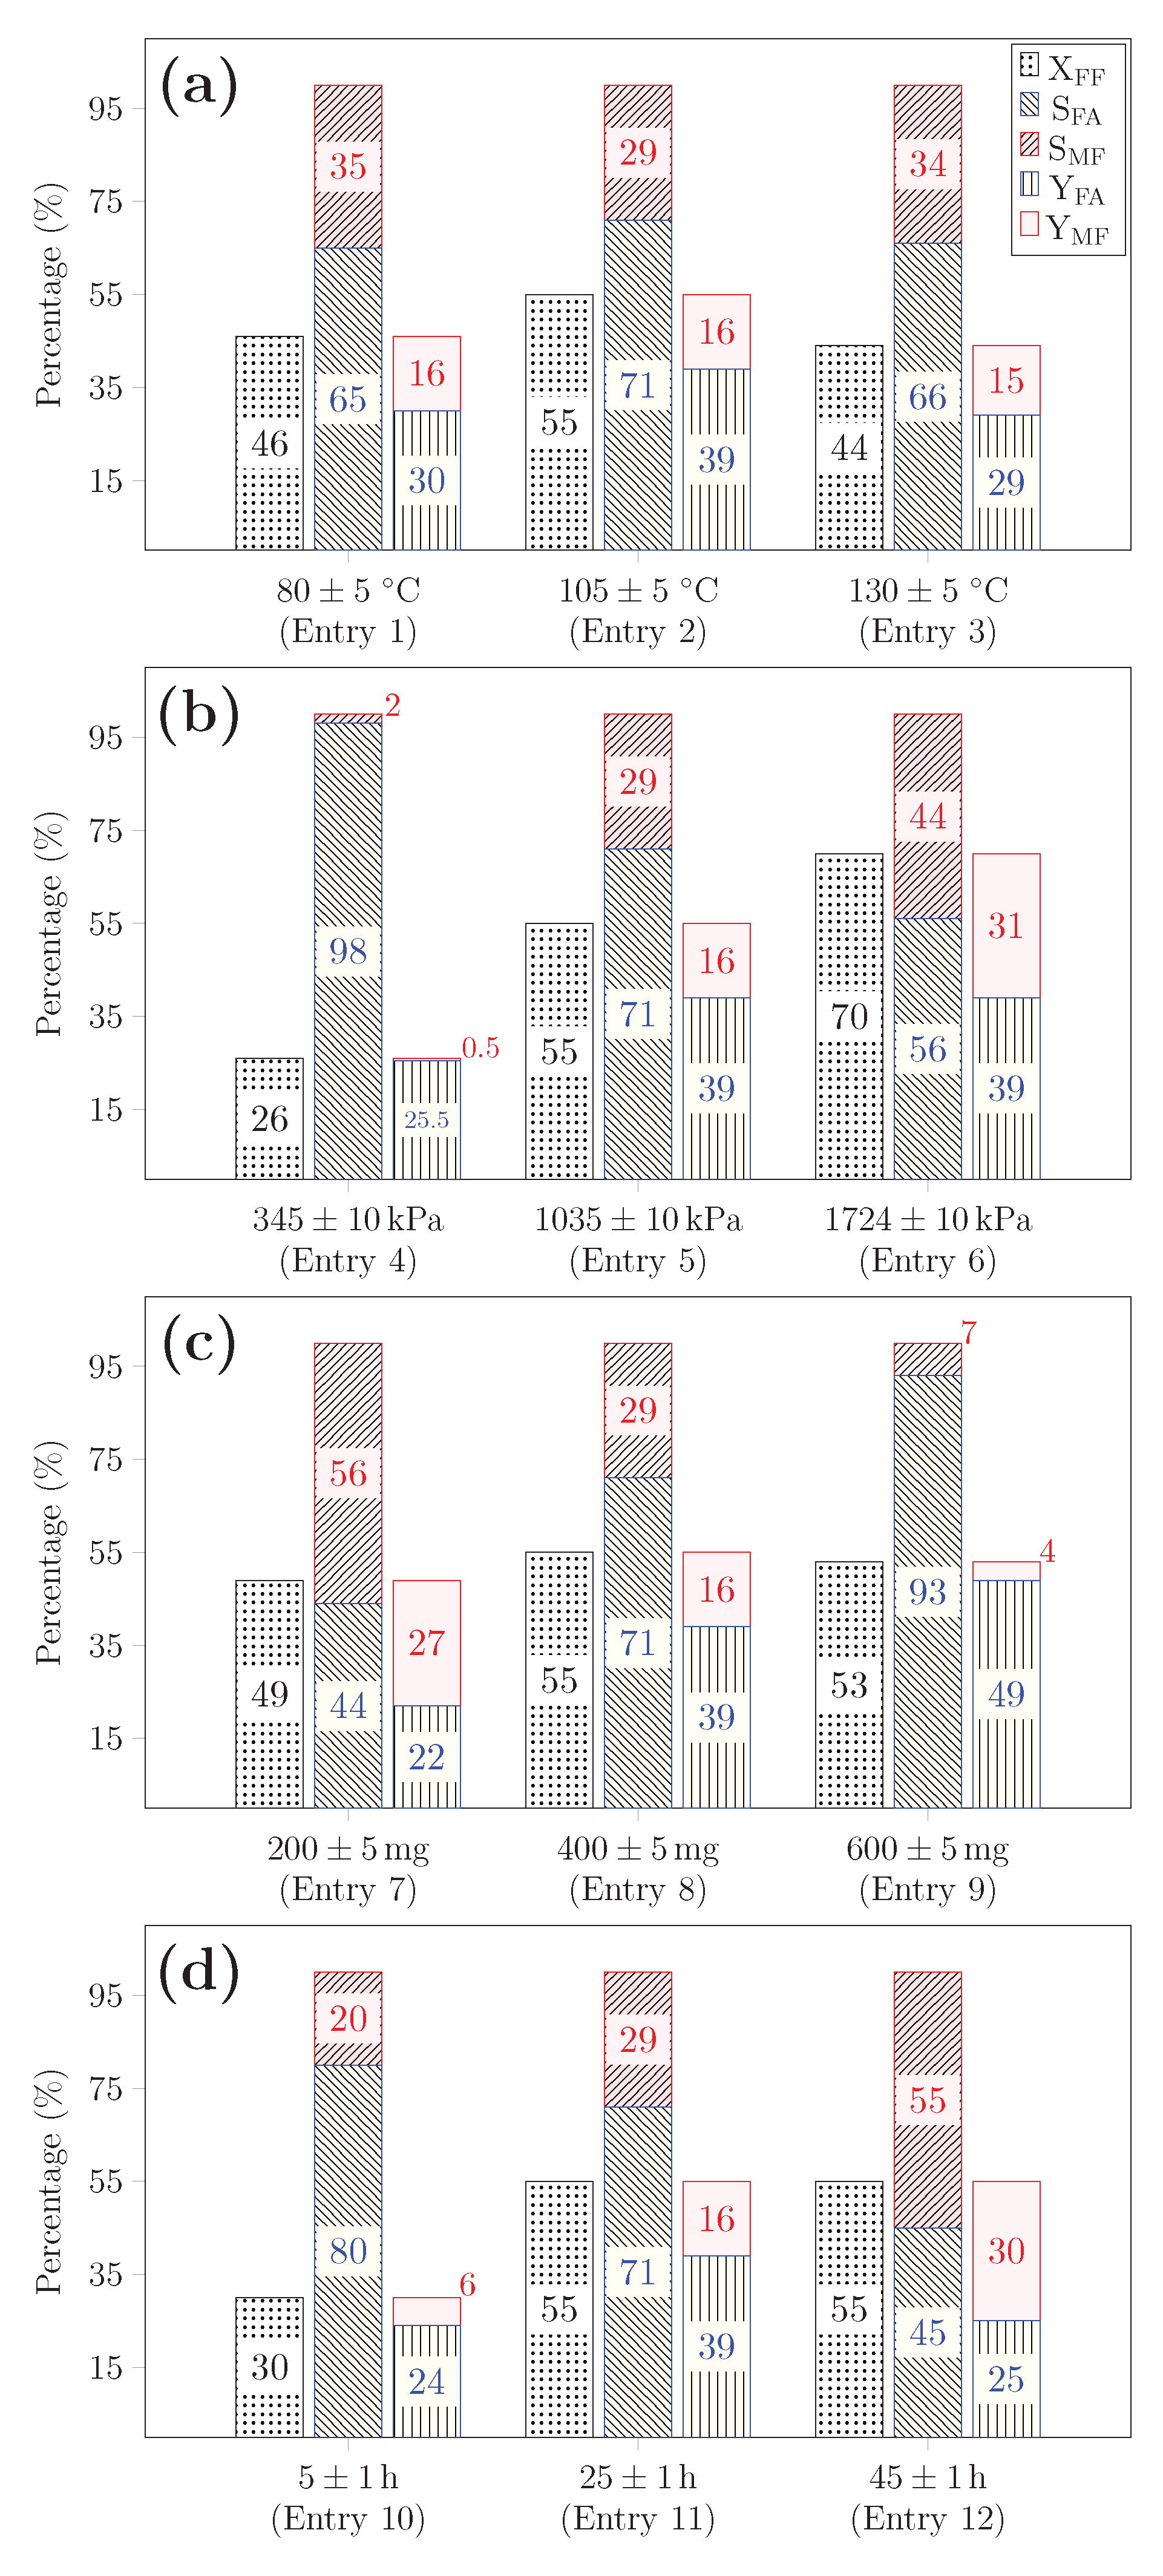
Catalytic activity of sample “R-Ru-OBC” was examined in the hydrogenation of furfural to furfuryl alcohol under different reaction conditions, indicated in Figure 6.
The effects of temperature at a constant initial pressure () on the sample activity are presented in Figure 6a. Performing the hydrogenation at 80 led to 65% furfuryl alcohol selectivity () at 46% furfural conversion (). 2-methylfuran with a yield of 16% () was found as a byproduct. Increasing temperature from 80 to 105 raised to 55%, improving to 71%. Under the same conditions (i.e., , , per 50 volume of reaction mixture, and ), sample “R-Ru-BC” showed a lower activity, with and respectively equal to 25;60% (not shown). Further temperature increase to 130 reduced the conversion over sample “R-Ru-OBC”.
Figure 6b shows that raising from 345 to 1724 and keeping all other parameters constant, increases from 26 to 70%. As a result, FA selectivity decreased from 98 to 56%. Performing the same reaction at 90 under pressure of 500 , Mironenko et al. [58] reported 100% FA selectivity at only 8% FF conversion, using Ru catalyst supported on carbon nanotubes—CNTs.
The effects of the catalyst mass on conversion and selectivity are shown in Figure 6c. Two blank tests were performed at 105 under of 1035 for 24 , one with no catalyst and one with 400 of oxidized biochar (sample “OBC”) (not shown). No FF conversion was observed in any of the two cases. As shown in Figure 6c, only minor changes in FF conversion () were observed upon increasing the catalyst mass. This unambiguously indicates that the rate of surface reaction is not the rate-determining step, suggesting that dissolution or diffusion in the reaction mixture is the likely rate limiting step. This would be in line with decreasing at T (Figure 6a, and increasing with hydrogen pressure (Figure 6b).
Figure 6d represents the effects of reaction time on conversion and selectivity. Increasing the time from 5 to 25 in otherwise similar conditions, enhanced FF conversion from 30 to 55%. No change in the conversion was observed upon further time increase to 45 . FA selectivity was significantly reduced from 71 to 45%. The latter change strongly suggests that MF is a secondary product of FA hydrogenation.
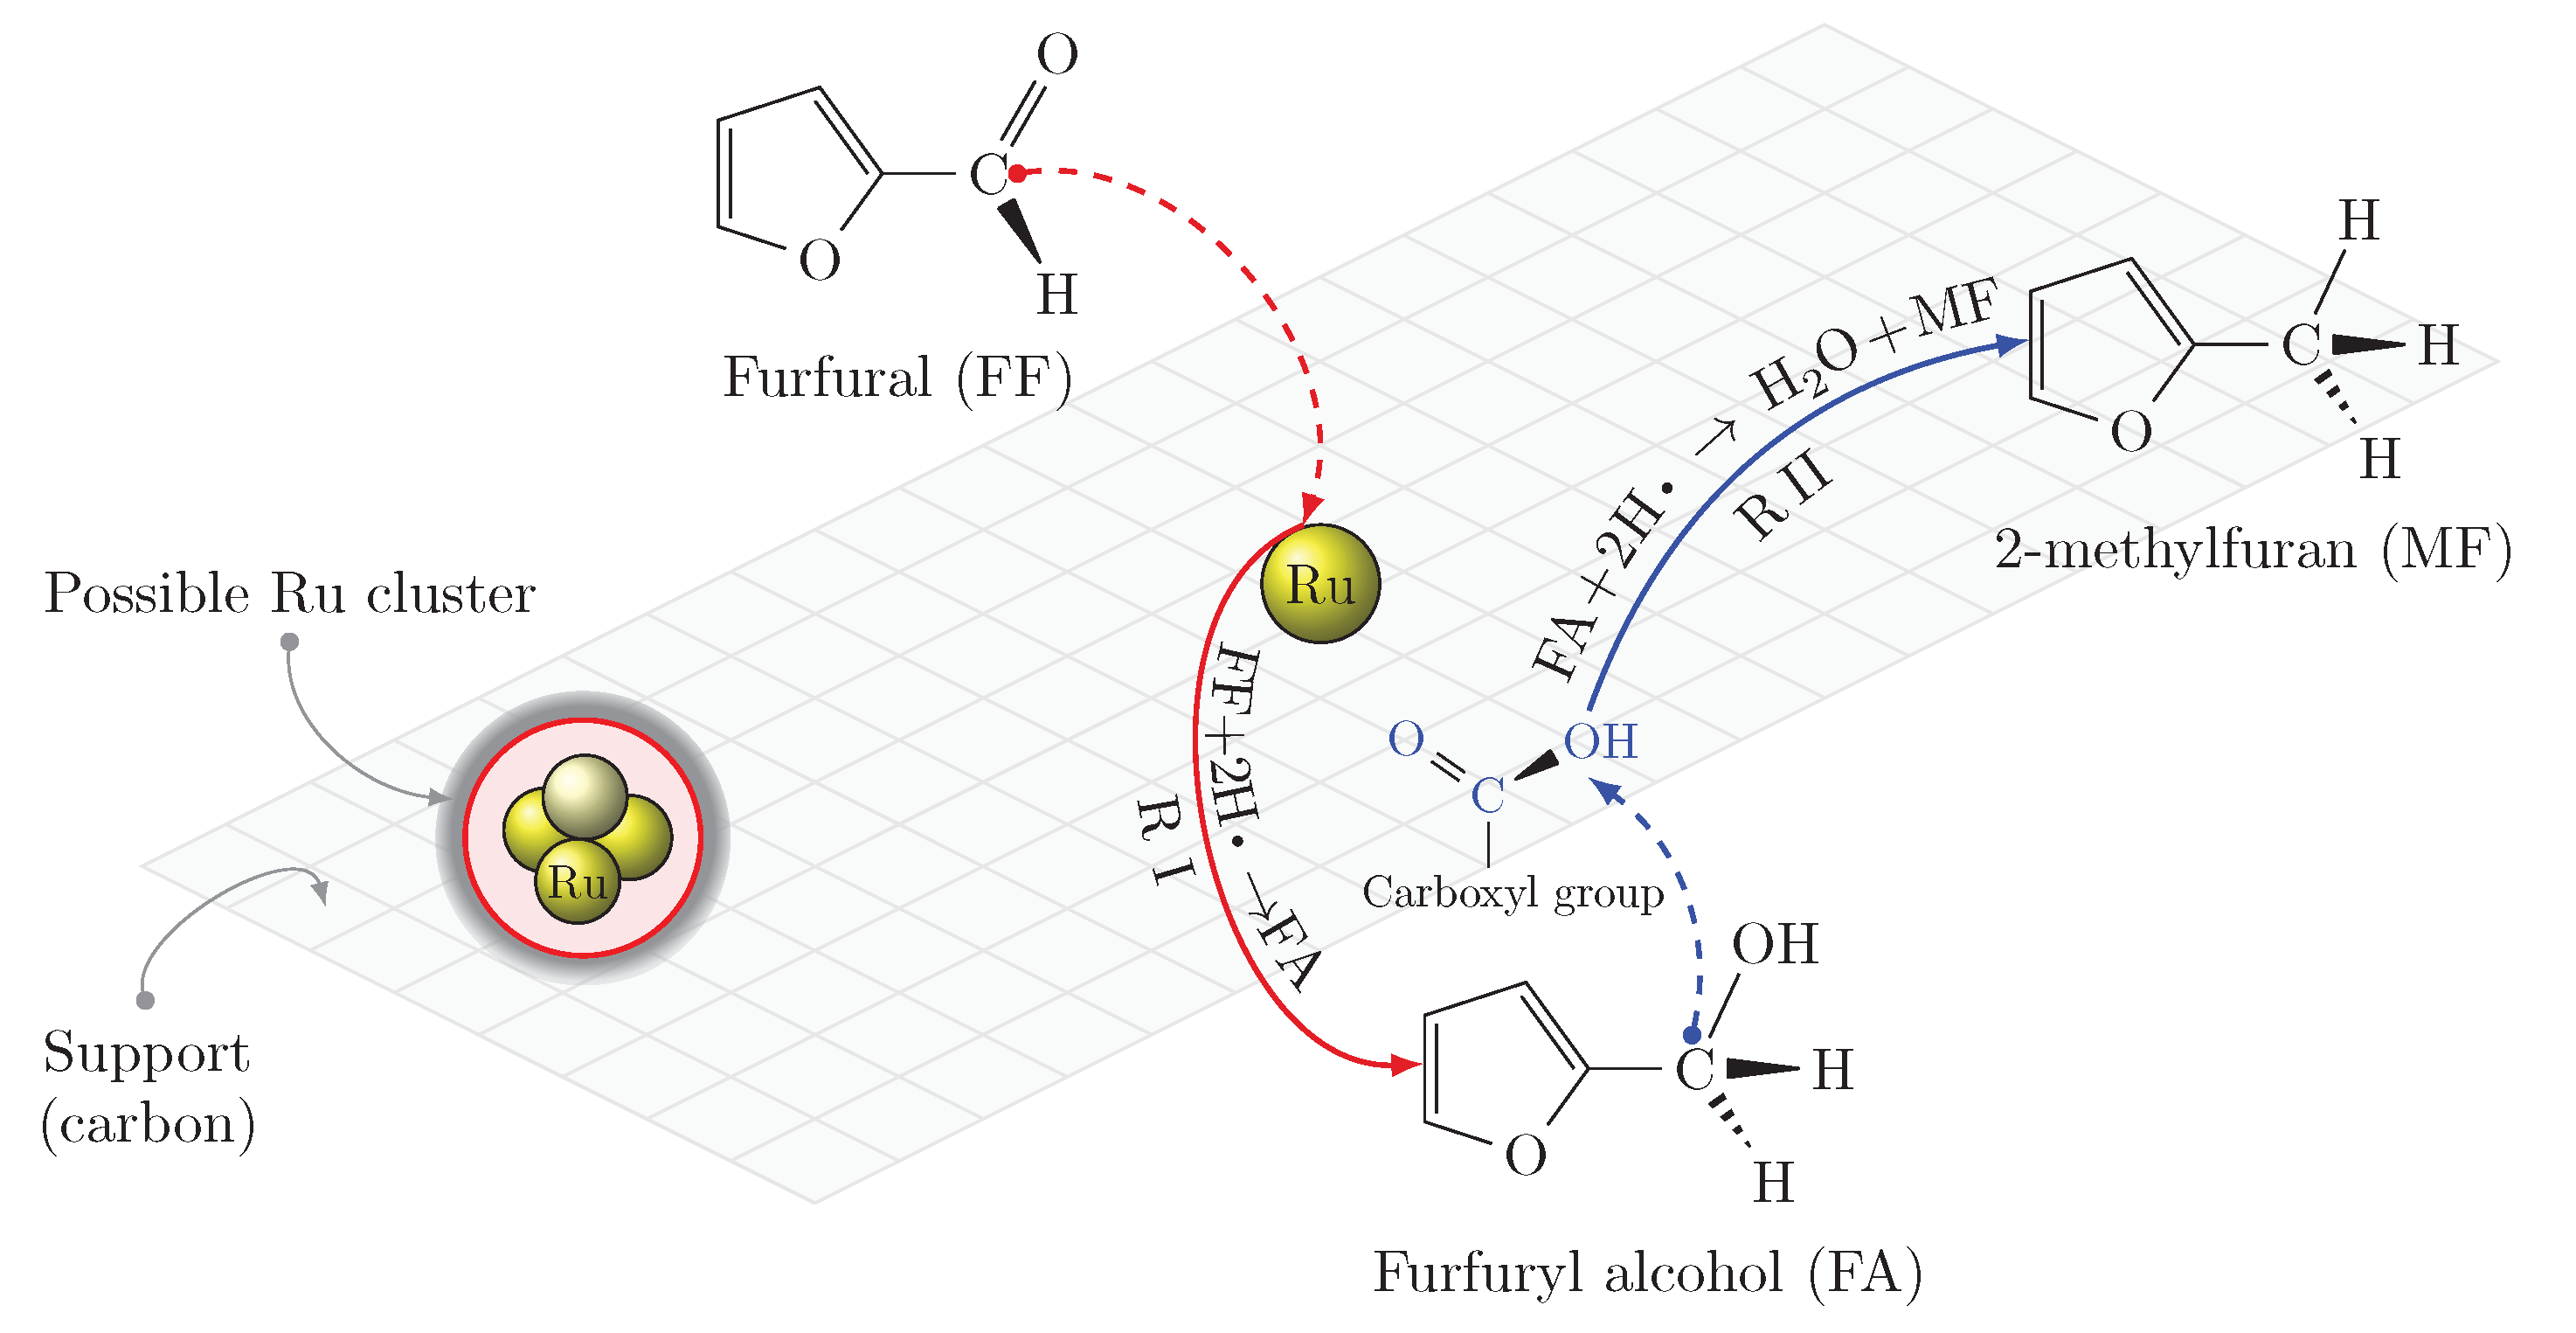
Based on the above observations, the literature proposed reaction pathways [18,59,60,61,62], have been modified as described in Scheme 1.
As expected, the initial step of FF hydrogenation is going on metallic Ru particles.
A dehydrated intermediate of the FA product would be generated over surface acidic functional groups of the oxidized biochar, and not necessarily on the Ru particles. Since the carbonaceous support stores spilt over hydrogen atoms (see discussion of Figure 1), this intermediate may also be hydrogenated to MF. The effect of increased FA selectivity at increasing catalyst content (Figure 6c would be associated with a faster consumption of the dissolved hydrogen, leading to a decreased surface concentration of spilt over hydrogen on the catalyst surface.
The likely control of primary reaction rate by hydrogen mass transfer suggests that the overall reaction rate could be enhanced through an increase of the gas-liquid interface area. Moreover, controlling the surface density of residual acid sites and increasing the mass of catalyst appear as two independent means of increasing FA selectivity by decreasing the rate of secondary hydrogenation to MF.
The values of FA selectivity under batch conditions of FF hydrogenation summarized in Table 7, allow a comparison with literature [63,64,65,66,67,68,69]. It is found that the results of the present study, e.g., Entry 13 to 15 of Table 7, are among the very best catalysts reported in the literature. Water was found as the most convenient solvent. A comparison with Ru supported on carbonaceous materials shows that the simply oxidized biochar (OBC) is a viable alternative to the advanced and sophisticated ones such as activated carbon (AC) and carbon nanotubes (CNTs).
3. Experimental
3.1. Materials and Methods
Chemicals were all purchased from Sigma-Aldrich® Co. (Oakville, ON, Canada) and Alfa Aesar (Fisher Scientific™ Inc. (Ottawa, ON, Canada)). Gases were acquired from Praxair Inc. of Canada. Biochar sample designated as “BC” was provided by Pyrovac Inc. (Saint-Lambert-de-Lauzon, Quebec, Canada), and produced using the pyrolysis process described elsewhere [42].
Oxidation was performed in multiple steps under flowing steam and air at 230 . About 4 of sample was placed in the center of a furnace using stainless steel sample holder. Temperature was raised with heating ramp of 3 /−1. Boehm titration was used to quantify the concentration of total acidic functional groups (), as described elsewhere [38]. The best results in terms of the highest value of equal to , were obtained for 4 of sample oxidation under the conditions described below.
At 230 , air was fed into the reactor at a flow rate of −1 for 1 . The temperature detected by a thermocouple on sample surface was suddenly raised and reached 375 after 40 under flowing air, and then dropped off very slowly. After 1 of air injection when the recorded temperature was still of 345 , steam at 230 was fed to the reactor keeping the air flow. This step was considered to control the raise in temperature arising from the biochar heat of combustion. The temperature monitored from sample surface went back to 230 after 30 of steam injection. After 2 of the steam injection, the sample was held in the reactor for an extra hour under dry air, while no change in the final recorded temperature was observed. The oxidized sample was designated as sample “OBC”.
3.2. Catalysts Preparation and Reaction Procedures
A Ru loading of 2.5 wt.% was targeted in the synthesis of catalysts. Around 272 of was added to 1 of distilled water mixed with 10 of (35 wt.%), to prevent the hydrolysis of ruthenium cations. About 4 of samples “BC” or “OBC” were separately added to the prepared solutions, mixed for 24 , and then filtered. The filtrates were analyzed by ICP, and the solids were dried overnight at 75 . The catalyst particle size was about 105 (a sieve no. 140). Samples “BC” and “OBC” loaded with ruthenium were designated as “Ru-BC” and “Ru-OBC”, respectively.
The catalytic activity was investigated in the hydrogenation of furfural using a high-pressure autoclave reactor, connected to a pressurized pure hydrogen cylinder. Reaction mixture was prepared by vigorously mixing 1 of FF in 50 deionized water. Prior to each reaction test, the catalyst was first reduced at 450 (heating ramp of 7 −1) for 2 , using a 20 −1 flow of pure hydrogen. The reduced catalyst was cooled down to room temperature under flowing hydrogen, and immediately transferred to the reaction mixture. The reactor was sealed, and slowly purged with pure hydrogen for 30 . It was then pressurized to the desired pressure, followed by rising temperature to a targeted value. The mixture was continuously agitated. To stop the reaction, the reactor was first placed in a bath of iced water, then slowly depressurized. The reaction mixtures were separated from catalysts by filtration. Furfural conversion (X), furfuryl alcohol selectivity () and yield () were established using Equations (1)–(3):
and are the initial and the total consumed moles of furfural, respectively. is the number of moles of furfuryl alcohol.
3.3. Analyses
Surface area and pore size distribution of catalyst samples were obtained from nitrogen adsorption-desorption isotherms analysis using a Quantachrome NOVA 2000 surface area analyzer. Sample degassing was performed at 300 for 48 under vacuum. Adsorption-desorption isotherms were analyzed using the Quantachrome Autosorb 1 software (version 1.55). Specific surface area was obtained using BET equation. Pore size distribution was established using BJH method and the Density Functional Theory (DFT) (two approaches of Non-Linear (NLDFT) and Quenched Solid (QSDFT)).
Elemental analysis was obtained by CHN and Inductively Coupled Plasma-Optical Emission Spectrometry (ICP-OES) analyses, using a LECO CHN 628 series elemental analyzer (LECO Inc., St. Joseph, MI, USA) and an Agilent 5110 SVDV spectrometer (Agilent Inc., Santa Clara, CA, USA), respectively.
Samples were analyzed by Temperature-Programmed Reduction (TPR) using an (ASDI, RXM-100 model) analyzer. The results were collected using the ASDI software (version 4.12). About 100 of sample was placed in a quartz U-shaped tube reactor. Temperature was raised from room temperature to 450 at a heating ramp of 7 −1 and kept under pure flowing argon for 2 . The sample was then cooled down to room temperature under flowing argon. TCD signal was recorded upon heating the sample from room temperature to 625 under flowing 5 vol.% in Ar. Reaching 625 , the sample was held for an extra hour. Moisture leaving the sample surface was trapped prior to the TCD, in a long loop immersed in a bath of dry ice/ethanol.
Ruthenium dispersion was measured by pulse -chemisorption using an AutoChem II chemisorption analyzer of Micromeritics Inc. To ascertain the metallic form of ruthenium, 100 sample was first heated to 450 with heating ramp of 8 −1 and kept for 2 under flowing pure hydrogen at a flow rate of 40 −1. It was then cooled down to room temperature after switching to pure Ar. The first sorption of 5 vol.% in Ar was performed at 75 as suggested by Shen et al. [70], using a 100 loop. Then, the sample was again heated to 350 to remove reversibly adsorbed hydrogen atoms, cooled down to 75 , and followed by a second sorption in the same conditions. The stoichiometric ratio of H/Ru was considered equal to 1. The difference in the volume of adsorbed between the first and the second sorptions indicates the amount of strongly adsorbed hydrogen. Dispersion and particle average size calculations were made from this amount, using Refs. [45,71].
The morphology of samples was investigated using a Scanning Electron Microscope (SEM) equipped with Energy Dispersive X-Ray (EDX) and a Transmission Electron Microscope (TEM) (JSM-840A and JEM-1230 JEOL series microscopes, respectively). For SEM analysis, the dried specimen was mounted on a copper sample holder, then sputtered with palladium and gold in a vacuum chamber. For samples loaded with Ru, the specimen surface was first examined with SEM electron back-scattering. The EDX signals were thus recorded from places of interest using SEM secondary images. For TEM analysis, dried specimen in form of fine powder was first suspended in methanol. The solution was then deposited on a nickel grid support, followed by drying at room temperature. TEM images were processed using MATLAB® software (MathWorks Inc., version R2018a), to determine the particle size distribution of Ru, assuming spherical particles. Ruthenium dispersion () was determined from TEM photographs using Equation (4) [72]:
and are the volume and the surface occupied by a Ru atom equal to and , respectively. The average Ru particle diameter was obtained from using TEM images, where is the frequency of a particle with diameter .
The surface chemistry of sample specimen was investigated by quantitative X-ray Photoelectron Spectroscopy (XPS) analysis using an ESCA spectrometer (Shimadzu Kratos AXIS-Ultra instrument, Shimadzu Inc., Wharfside Manchester, UK). The deconvolution of XPS spectra was obtained by setting binding energy scales to eV for graphitic carbon , using Gaussian-Lorentzian (GL) curve fitting. The XPS results were then treated using the CasaXPS software (version 2.3.15). Samples “Ru-BC” and “Ru-OBC”, were analyzed before (as made) and after reduction. The reduced samples were respectively designated as “R-Ru-BC” and “R-Ru-OBC”. Reduction was performed prior to the XPS analysis under conditions suggested by TPR analysis namely at 450 for 2 with a heating ramp of 7 −1 under pure flowing hydrogen.
In the catalytic tests, the concentrations of the reactant and products were obtained in −1 according to calibration curves obtained from standard solutions of detected components, using a Varian CP-3800 Gas Chromatograph (GC).
4. Conclusions
There have always been very strong demands for catalysts in the stabilization of bio-based oils, necessitating further research and development in the preparation of these materials. Considering pyrolysis biochar as an inexpensive catalyst support, the main problem of this material is the lack of favorable physico-chemical surface properties. In the present investigation, we have shown that in comparison with complex chemical activation methods, very simple mild oxidation of a pyrolysis biochar using a mixture of air and steam is a successful approach for the valorization of this material as catalyst support. By the use of a proper metal precursor adsorbed as cations from aqueous solutions, the oxidized biochar is effectively impregnated via an initial ion-exchange, owing to its surface carboxylic functional groups. Under the same impregnation conditions, the oxidized biochar showed about 84% higher Ru content than the unoxidized one. Moreover, TEM and chemisorption both showed that biochar mild oxidation doubles the dispersion of Ru particles. XPS analysis revealed that biochar oxidation also prevents Ru particles from surface segregation. As a result, under same conditions of furfural hydrogenation to furfuryl alcohol, Ru supported on the oxidized biochar showed higher activity than the unoxidized one.
Author Contributions
Conceptualization and methodology, R.B. (Raoof Bardestani), R.B. (Rouholamin Biriaei) and S.K.; software and validation, R.B. (Raoof Bardestani), R.B. (Rouholamin Biriaei) and S.K.; formal analysis, R.B. (Raoof Bardestani); investigation, R.B. (Raoof Bardestani) and R.B. (Rouholamin Biriaei); resources, S.K.; data curation, R.B. (Raoof Bardestani); writing–original draft preparation, R.B. (Raoof Bardestani) and R.B. (Rouholamin Biriaei); writing–review and editing, S.K. and R.B. (Raoof Bardestani); visualization, R.B. (Raoof Bardestani) and R.B. (Rouholamin Biriaei); supervision, S.K.; project administration and funding acquisition, S.K. All authors have read and agreed to the published version of the manuscript.
Funding
This research received no external funding.
Acknowledgments
The authors would like to thank Alain Adnot for XPS analysis, Marc Choquette and Suzie Côté for SEM analysis, Richard Janvier for TEM analysis, Alain Brousseau for ICP analysis, Guillaume Labrecque, Pierre Audet for GC-MS, and Soheil Akbari for image processing, and Hossein Rahmani for interesting discussion. Thanks are also due to the BioFuelNet Center of Excellence (Task force 4E) and the Natural Science and Engineering Council of Canada (NSERC-CRDPJ 471001-14) for financial support.
Conflicts of Interest
The authors declare no conflict of interest.
References
- Bridgwater, A. Review of fast pyrolysis of biomass and product upgrading. Biomass Bioenergy 2012, 38, 68–94. [Google Scholar] [CrossRef]
- Bridgwater, A.; Meier, D.; Radlein, D. An overview of fast pyrolysis of biomass. Org. Geochem. 1999, 30, 1479–1493. [Google Scholar] [CrossRef]
- Carlson, T.; Vispute, T.; Huber, G. Green gasoline by catalytic fast pyrolysis of solid biomass derived compounds. ChemSusChem 2008, 1, 397–400. [Google Scholar] [CrossRef] [PubMed] [Green Version]
- Sanna, A.; Vispute, T.P.; Huber, G.W. Hydrodeoxygenation of the aqueous fraction of bio-oil with Ru/C and Pt/C catalysts. Appl. Catal. B 2015, 165, 446–456. [Google Scholar] [CrossRef] [Green Version]
- Elliott, D.C. Historical developments in hydroprocessing bio-oils. Energy Fuels 2007, 21, 1792–1815. [Google Scholar] [CrossRef]
- Gagnon, J.; Kaliaguine, S. Catalytic hydrotreatment of vacuum pyrolysis oils from wood. Ind. Eng. Chem. Res. 1988, 27, 1783–1788. [Google Scholar] [CrossRef]
- Han, Y.; Gholizadeh, M.; Tran, C.C.; Kaliaguine, S.; Li, C.Z.; Olarte, M.; Garcia-Pérez, M. Hydrotreatment of pyrolysis bio-oil: A review. Fuel Process. Technol. 2019, 195, 106140. [Google Scholar] [CrossRef]
- Bozell, J.J.; Petersen, G.R. Technology development for the production of bio-based products from biorefinery carbohydrates: The US Department of Energy’s Top 10 revisited. Green Chem. 2010, 12, 539–554. [Google Scholar] [CrossRef]
- Kijeński, J.; Winiarek, P.; Paryjczak, T.; Lewicki, A.; Mikołajska, A. Platinum deposited on monolayer supports in selective hydrogenation of furfural to furfuryl alcohol. Appl. Catal., A 2002, 233, 171–182. [Google Scholar] [CrossRef]
- Nakagawa, Y.; Tamura, M.; Tomishige, K. Catalytic reduction of biomass-derived furanic compounds with hydrogen. ACS Catal. 2013, 3, 2655–2668. [Google Scholar] [CrossRef]
- Wu, J.; Gao, G.; Li, J.; Sun, P.; Long, X.; Li, F. Efficient and versatile CuNi alloy nanocatalysts for the highly selective hydrogenation of furfural. Appl. Catal. B 2017, 203, 227–236. [Google Scholar] [CrossRef]
- Rackemann, D.; Doherty, W. A review on the production of levulinic acid and furanics from sugars. Int. Sugar J. 2013, 115, 28–34. [Google Scholar]
- Long, J.; Xu, Y.; Zhao, W.; Li, H.; Yang, S. Heterogeneous catalytic upgrading of biofuranic aldehydes to alcohols. Front. Chem. 2019, 7, 529. [Google Scholar] [CrossRef] [PubMed]
- Vargas-Hernández, D.; Rubio-Caballero, J.; Santamaría-González, J.; Moreno-Tost, R.; Mérida-Robles, J.; Pérez-Cruz, M.; Jiménez-López, A.; Hernández-Huesca, R.; Maireles-Torres, P. Furfuryl alcohol from furfural hydrogenation over copper supported on SBA-15 silica catalysts. J. Mol. Catal. A Chem. 2014, 383–384, 106–113. [Google Scholar] [CrossRef]
- Besson, M.; Gallezot, P.; Pinel, C. Conversion of biomass into chemicals over metal catalysts. Chem. Rev. 2014, 114, 1827–1870. [Google Scholar] [CrossRef] [PubMed]
- Michel, C.; Gallezot, P. Why is ruthenium an efficient catalyst for the aqueous-phase hydrogenation of biosourced carbonyl compounds? ACS Catal. 2015, 5, 4130–4132. [Google Scholar] [CrossRef]
- Madadi, S.; Charbonneau, L.; Bergeron, J.Y.; Kaliaguine, S. Aerobic epoxidation of limonene using cobalt substituted mesoporous SBA-16 Part 1: Optimization via Response Surface Methodology (RSM). Appl. Catal. B 2020, 260, 118049. [Google Scholar] [CrossRef]
- Taylor, M.J.; Durndell, L.J.; Isaacs, M.A.; Parlett, C.M.; Wilson, K.; Lee, A.F.; Kyriakou, G. Highly selective hydrogenation of furfural over supported Pt nanoparticles under mild conditions. Appl. Catal. B 2016, 180, 580–585. [Google Scholar] [CrossRef]
- Biriaei, R.; Nohair, B.; Kaliaguine, S. A facile route to synthesize mesoporous ZSM-5 with hexagonal arrays using P123 triblock copolymer. Microporous Mesoporous Mater. 2020, 298, 110067. [Google Scholar] [CrossRef]
- Lam, E.; Luong, J.H.T. Carbon materials as catalyst supports and catalysts in the transformation of biomass to fuels and chemicals. ACS Catal. 2014, 4, 3393–3410. [Google Scholar] [CrossRef]
- Rodríguez-reinoso, F. The role of carbon materials in heterogeneous catalysis. Carbon 1998, 36, 159–175. [Google Scholar] [CrossRef]
- El-Hendawy, A.N.A. Surface and adsorptive properties of carbons prepared from biomass. Appl. Surf. Sci. 2005, 252, 287–295. [Google Scholar] [CrossRef]
- Darmstadt, H.; Pantea, D.; Sümmchen, L.; Roland, U.; Kaliaguine, S.; Roy, C. Surface and bulk chemistry of charcoal obtained by vacuum pyrolysis of bark: Influence of feedstock moisture content. J. Anal. Appl. Pyrolysis 2000, 53, 1–17. [Google Scholar] [CrossRef]
- Jiao, L.; Regalbuto, J.R. The synthesis of highly dispersed noble and base metals on silica via strong electrostatic adsorption: I. Amorphous silica. J. Catal. 2008, 260, 329–341. [Google Scholar] [CrossRef]
- Jiao, L.; Regalbuto, J. The synthesis of highly dispersed noble and base metals on silica via strong electrostatic adsorption: II. Mesoporous silica SBA-15. J. Catal. 2008, 260, 342–350. [Google Scholar] [CrossRef]
- Toupance, T.; Kermarec, M.; Louis, C. Metal particle size in silica-supported copper catalysts: Influence of the conditions of preparation and of thermal pretreatments. J. Phys. Chem. B 2000, 104, 965–972. [Google Scholar] [CrossRef]
- Toupance, T.; Kermarec, M.; Lambert, J.F.; Louis, C. Conditions of formation of copper phyllosilicates in silica-supported copper catalysts prepared by selective adsorption. J. Phys. Chem. B 2002, 106, 2277–2286. [Google Scholar] [CrossRef]
- Guerreiro, E.; Gorriz, O.; Rivarola, J.; Arrúa, L. Characterization of Cu/SiO2 catalysts prepared by ion exchange for methanol dehydrogenation. Appl. Catal. A 1997, 165, 259–271. [Google Scholar] [CrossRef]
- Rao, R.S.; Walters, A.B.; Vannice, M.A. Influence of crystallite size on acetone hydrogenation over copper catalysts. J. Phys. Chem. B 2005, 109, 2086–2092. [Google Scholar] [CrossRef]
- Lambert, S.; Job, N.; D’Souza, L.; Pereira, M.F.R.; Pirard, R.; Heinrichs, B.; Figueiredo, J.L.; Pirard, J.P.; Regalbuto, J.R. Synthesis of very highly dispersed platinum catalysts supported on carbon xerogels by the strong electrostatic adsorption method. J. Catal. 2009, 261, 23–33. [Google Scholar] [CrossRef]
- Cao, S.; Monnier, J.R.; Williams, C.T.; Diao, W.; Regalbuto, J.R. Rational nanoparticle synthesis to determine the effects of size, support, and K dopant on Ru activity for levulinic acid hydrogenation to γ-valerolactone. J. Catal. 2015, 326, 69–81. [Google Scholar] [CrossRef]
- Cho, H.R.; Regalbuto, J.R. The rational synthesis of Pt—Pd bimetallic catalysts by electrostatic adsorption. Catal. Today 2015, 246, 143–153. [Google Scholar] [CrossRef]
- Miller, J.T.; Schreier, M.; Kropf, A.; Regalbuto, J.R. A fundamental study of platinum tetraammine impregnation of silica: 2. The effect of method of preparation, loading, and calcination temperature on (reduced) particle size. J. Catal. 2004, 225, 203–212. [Google Scholar] [CrossRef]
- Hao, X.; Barnes, S.; Regalbuto, J. A fundamental study of Pt impregnation of carbon: Adsorption equilibrium and particle synthesis. J. Catal. 2011, 279, 48–65. [Google Scholar] [CrossRef]
- Munnik, P.; de Jongh, P.E.; de Jong, K.P. Recent developments in the synthesis of supported catalysts. Chem. Rev. 2015, 115, 6687–6718. [Google Scholar] [CrossRef] [PubMed]
- Zhang, L.; Wen, G.; Liu, H.; Wang, N.; Su, D.S. Preparation of palladium catalysts supported on carbon nanotubes by an electrostatic adsorption method. ChemCatChem 2014, 6, 2600–2606. [Google Scholar] [CrossRef]
- Lee, J.; Kim, K.H.; Kwon, E.E. Biochar as a catalyst. Renew. Sustain. Energy Rev. 2017, 77, 70–79. [Google Scholar] [CrossRef]
- Bardestani, R.; Kaliaguine, S. Steam activation and mild air oxidation of vacuum pyrolysis biochar. Biomass Bioenergy 2018, 108, 101–112. [Google Scholar] [CrossRef]
- Mitchell, P.C.H.; Ramirez-Cuesta, A.J.; Parker, S.F.; Tomkinson, J.; Thompsett, D. Hydrogen spillover on carbon-supported metal catalysts studied by inelastic neutron scattering: Surface vibrational states and hydrogen riding modes. J. Phys. Chem. B 2003, 107, 6838–6845. [Google Scholar] [CrossRef]
- Conner, W.C.; Falconer, J.L. Spillover in heterogeneous catalysis. Chem. Rev. 1995, 95, 759–788. [Google Scholar] [CrossRef]
- Li, Q.; Lueking, A.D. Effect of surface oxygen groups and water on hydrogen spillover in Pt-doped activated carbon. J. Phys. Chem. C 2011, 115, 4273–4282. [Google Scholar] [CrossRef]
- Bardestani, R.; Roy, C.; Kaliaguine, S. The effect of biochar mild air oxidation on the optimization of lead(II) adsorption from wastewater. J. Environ. Manag. 2019, 240, 404–420. [Google Scholar] [CrossRef] [PubMed]
- Bardestani, R.; Patience, G.S.; Kaliaguine, S. Experimental methods in chemical engineering: Specific surface area and pore size distribution measurements–BET, BJH, and DFT. Can. J. Chem. Eng. 2019, 97, 2781–2791. [Google Scholar] [CrossRef]
- Joshi, H.; Jalalpoor, D.; Ochoa-Hernández, C.; Schmidt, W.; Schüth, F. Ozone treatment: A versatile tool for the postsynthesis modification of porous silica-based materials. Chem. Mater. 2018, 30, 8905–8914. [Google Scholar] [CrossRef]
- Toebes, M.L.; Prinsloo, F.F.; Bitter, J.H.; Van Dillen, A.; De Jong, K.P. Influence of oxygen-containing surface groups on the activity and selectivity of carbon nanofiber supported ruthenium catalysts in the hydrogenation of cinnamaldehyde. J. Catal. 2003, 214, 78–87. [Google Scholar] [CrossRef]
- Lin, B.; Wei, K.; Ma, X.; Lin, J.; Ni, J. Study of potassium promoter effect for Ru/AC catalysts for ammonia synthesis. Catal. Sci. Technol. 2013, 3, 1367–1374. [Google Scholar] [CrossRef]
- Lin, B.; Wei, K.; Ni, J.; Lin, J. KOH activation of thermally modified carbon as a support of Ru catalysts for ammonia synthesis. ChemCatChem 2013, 5, 1941–1947. [Google Scholar] [CrossRef]
- Nguyen-Huy, C.; Kim, J.S.; Yoon, S.; Yang, E.; Kwak, J.H.; Lee, M.S.; An, K. Supported Pd nanoparticle catalysts with high activities and selectivities in liquid-phase furfural hydrogenation. Fuel 2018, 226, 607–617. [Google Scholar] [CrossRef]
- Lin, B.; Guo, Y.; Cao, C.; Ni, J.; Lin, J.; Jiang, L. Carbon support surface effects in the catalytic performance of Ba-promoted Ru catalyst for ammonia synthesis. Catal. Today 2018, 316, 230–236. [Google Scholar] [CrossRef]
- Monti, A.; Virgilio, N.D.; Venturi, G. Mineral composition and ash content of six major energy crops. Biomass Bioenergy 2008, 32, 216–223. [Google Scholar] [CrossRef] [Green Version]
- van den Oetelaar, L.C.A.; Nooij, O.W.; Oerlemans, S.; Denier van der Gon, A.W.; Brongersma, H.H.; Lefferts, L.; Roosenbrand, A.G.; van Veen, J.A.R. Surface segregation in supported Pd-Pt nanoclusters and alloys. J. Phys. Chem. B 1998, 102, 3445–3455. [Google Scholar] [CrossRef]
- An, N.; Zhang, M.; Zhang, Z.; Dai, Y.; Shen, Y.; Tang, C.; Yuan, X.; Zhou, W. High-performance palladium catalysts for the hydrogenation toward dibenzylbiotinmethylester: Effect of carbon support functionalization. J. Colloid Interface Sci. 2018, 510, 181–189. [Google Scholar] [CrossRef] [PubMed]
- Castillejos, E.; García-Minguillán, A.M.; Bachiller-Baeza, B.; Rodríguez-Ramos, I.; Guerrero-Ruiz, A. When the nature of surface functionalities on modified carbon dominates the dispersion of palladium hydrogenation catalysts. Catal. Today 2018, 301, 248–257. [Google Scholar] [CrossRef]
- Shafeeyan, M.S.; Daud, W.M.A.W.; Houshmand, A.; Shamiri, A. A review on surface modification of activated carbon for carbon dioxide adsorption. J. Anal. Appl. Pyrolysis 2010, 89, 143–151. [Google Scholar] [CrossRef]
- Sizmur, T.; Fresno, T.; Akgül, G.; Frost, H.; Moreno-Jiménez, E. Biochar modification to enhance sorption of inorganics from water. Bioresour. Technol. 2017, 246, 34–47. [Google Scholar] [CrossRef]
- Boehm, H.P. Surface oxides on carbon and their analysis: A critical assessment. Carbon 2002, 40, 145–149. [Google Scholar] [CrossRef]
- Rey-Raap, N.; Ribeiro, L.S.; de Melo Órfão, J.J.; Figueiredo, J.L.; Pereira, M.F.R. Catalytic conversion of cellulose to sorbitol over Ru supported on biomass-derived carbon-based materials. Appl. Catal. B 2019, 256, 117826. [Google Scholar] [CrossRef]
- Mironenko, R.M.; Belskaya, O.B.; Gulyaeva, T.I.; Nizovskii, A.I.; Kalinkin, A.V.; Bukhtiyarov, V.I.; Lavrenov, A.V.; Likholobov, V.A. Effect of the nature of carbon support on the formation of active sites in Pd/C and Ru/C catalysts for hydrogenation of furfural. Catal. Today 2015, 249, 145–152. [Google Scholar] [CrossRef]
- Merlo, A.B.; Vetere, V.; Ruggera, J.F.; Casella, M.L. Bimetallic Pt-Sn catalyst for the selective hydrogenation of furfural to furfuryl alcohol in liquid-phase. Catal. Commun. 2009, 10, 1665–1669. [Google Scholar] [CrossRef]
- Sharma, R.V.; Das, U.; Sammynaiken, R.; Dalai, A.K. Liquid phase chemo-selective catalytic hydrogenation of furfural to furfuryl alcohol. Appl. Catal. A 2013, 454, 127–136. [Google Scholar] [CrossRef]
- Kosydar, R.; Duraczyńska, D.; Gurgul, J.; Kryściak-Czerwenka, J.; Drelinkiewicz, A. Liquid phase hydrogenation of furfural under mild conditions over Pd/C catalysts of various acidity. React. Kinet. Mech. Cat. 2019, 126, 417–437. [Google Scholar] [CrossRef]
- Zhong, R.; Sels, B.F. Sulfonated mesoporous carbon and silica-carbon nanocomposites for biomass conversion. Appl. Catal. B 2018, 236, 518–545. [Google Scholar] [CrossRef]
- Huang, R.; Cui, Q.; Yuan, Q.; Wu, H.; Guan, Y.; Wu, P. Total hydrogenation of furfural over Pd/Al2O3 and Ru/ZrO2 mixture under mild conditions: Essential role of tetrahydrofurfural as an intermediate and support effect. ACS Sustain. Chem. Eng. 2018, 6, 6957–6964. [Google Scholar] [CrossRef]
- Musci, J.J.; Merlo, A.B.; Casella, M.L. Aqueous phase hydrogenation of furfural using carbon-supported Ru and Ru-Sn catalysts. Catal. Today 2017, 296, 43–50. [Google Scholar] [CrossRef]
- Panagiotopoulou, P.; Vlachos, D.G. Liquid phase catalytic transfer hydrogenation of furfural over a Ru/C catalyst. Appl. Catal. A 2014, 480, 17–24. [Google Scholar] [CrossRef]
- Ramirez-Barria, C.; Isaacs, M.; Wilson, K.; Guerrero-Ruiz, A.; Rodríguez-Ramos, I. Optimization of ruthenium based catalysts for the aqueous phase hydrogenation of furfural to furfuryl alcohol. Appl. Catal. A 2018, 563, 177–184. [Google Scholar] [CrossRef] [Green Version]
- Yu, W.; Tang, Y.; Mo, L.; Chen, P.; Lou, H.; Zheng, X. One-step hydrogenation–esterification of furfural and acetic acid over bifunctional Pd catalysts for bio-oil upgrading. Bioresour. Technol. 2011, 102, 8241–8246. [Google Scholar] [CrossRef]
- Villaverde, M.; Bertero, N.; Garetto, T.; Marchi, A. Selective liquid-phase hydrogenation of furfural to furfuryl alcohol over Cu-based catalysts. Catal. Today 2013, 213, 87–92. [Google Scholar] [CrossRef]
- Yan, K.; Liao, J.; Wu, X.; Xie, X. A noble-metal free Cu-catalyst derived from hydrotalcite for highly efficient hydrogenation of biomass-derived furfural and levulinic acid. RSC Adv. 2013, 3, 3853–3856. [Google Scholar] [CrossRef]
- Shen, X.; Garces, L.J.; Ding, Y.; Laubernds, K.; Zerger, R.P.; Aindow, M.; Neth, E.J.; Suib, S.L. Behavior of H2 chemisorption on Ru/TiO2 surface and its application in evaluation of Ru particle sizes compared with TEM and XRD analyses. Appl. Catal. A 2008, 335, 187–195. [Google Scholar] [CrossRef]
- Scholten, J.J.F.; Pijpers, A.P.; Hustings, A.M.L. Surface characterization of supported and nonsupported hydrogenation catalysts. Catal. Rev. 1985, 27, 151–206. [Google Scholar] [CrossRef]
- Singh, K.S.W.; Rouquerol, J.; Bergeret, G.; Gallezot, P.; Vaarkamp, M.; Koningsberger, D.C.; Datye, A.K.; Niemantsverdriet, J.W.; Butz, T.; Engelhardt, G.; et al. Characterization of solid catalysts: Section 3.1.1–3.1.3. In Handbook of Heterogeneous Catalysis; John Wiley & Sons, Ltd.: Weinheim, Germany, 2008; Chapter 3; pp. 427–582. [Google Scholar]
Figure 1.
TPR analysis.

Figure 2.
(a) Adsorption-desorption isotherms of nitrogen physisorption analysis; Pore size distribution (PSD) obtained by (b) BJH method, (c) QSDFT, and (d) NLDFT methods, considering slit type pores. Note: V is the volume of adsorbed , dV() is the differential cumulative adsorbed volume as a function of pore diameter (), and the relative pressure.

Figure 3.
EDX spectra and photographs of secondary electrons (SEM) for samples (a,b): “BC”, (c,d): “OBC”; Back-scattered electrons (BSE) for samples (e): “Ru-BC”, (f): “Ru-OBC” (scale of 30).
Figure 3.
EDX spectra and photographs of secondary electrons (SEM) for samples (a,b): “BC”, (c,d): “OBC”; Back-scattered electrons (BSE) for samples (e): “Ru-BC”, (f): “Ru-OBC” (scale of 30).

Figure 4.
TEM analysis of samples: (a) “BC”; (b) “OBC”; (c) “Ru-BC”; (d–f) “Ru-OBC”.

Figure 5.
XPS analysis: (a) full-range surveys of biochar before and after oxidation (samples “BC” and “OBC”); (b) full-range surveys of original biochar, loaded with Ru before and after reduction (samples “Ru-BC” and “R-Ru-BC”); (c) full-range surveys oxidized biochar, loaded with Ru before and after reduction (samples “Ru-OBC” and “R-Ru-OBC”); (d) C1s deconvolution of sample “BC”; (e) C1s deconvolution of sample “Ru-BC”; (f) C1s deconvolution of sample “R-Ru-BC”; (g) C1s deconvolution of sample “OBC”; (h) C1s deconvolution of sample “Ru-OBC”; (i) C1s deconvolution of sample “R-Ru-OBC”.

Figure 6.
Hydrogenation of furfural (1 FF in 50 ), using sample “R-Ru-OBC” under different reaction conditions of: (a) temperature (T), (80 to 130 ), , , . (b) hydrogen pressure, () (345 to 1724 ), , , . (c) mass of catalyst (), (200 to 600 ), , , . (d) time (t), 6.5 mm (5 to 45 ), , , . Notations: : initial pressure, : furfural conversion, : selectivity of furfuryl alcohol, : selectivity of 2-methylfuran, : yield of furfuryl alcohol, : yield of 2-methylfuran.

Scheme 1.
Possible pathways of furfural hydrogenation in this study redrawn from references [18,59,60,61,62].


Table 1.
Boehm’s Concentration of Oxygenated Functionalities ( ).
| Sample | Total | Carboxyl | Lactone | Phenol | pHpzc | |||||
|---|---|---|---|---|---|---|---|---|---|---|
| BC | 2.2 | 0.4 | 0.8 | 1 | 5.8 | |||||
| OBC | 6.8 | 4.2 | 1.4 | 1.2 | 4.1 | |||||
Table 2.
Nitrogen Adsorption-Desorption Analysis.
| SBET | () | Vtotal | Yield | |||||||||
|---|---|---|---|---|---|---|---|---|---|---|---|---|
| () | BJH | QSDFT | NLDFT | () | (wt.%) | |||||||
| BC | - | - | - | - | - | 27.8 | ||||||
| OBC | 26 | 0.9 | 1 | 1.2 | 14 × 10−3 | 15 | ||||||
| Ru-OBC | 9 | 1 | 1.2 | 1.3 | 9 × 10⁻³ | - | ||||||
Biomass feedstock.
Table 3.
Elemental Analysis (Mass Percentages).
| C | N | H | O | Ru | ||||||
|---|---|---|---|---|---|---|---|---|---|---|
| BC | 71.8 | 0.5 | 3.7 | 24 | 0 | |||||
| OBC | 62.5 | 0.5 | 2.8 | 40.8 | 0 | |||||
| Ru-BC | 70.9 | 1.5 | 3.7 | 22.7 | 1.2 | |||||
| Ru-OBC | 57.4 | 3.7 | 2.9 | 33.8 | 2.2 | |||||
Table 4.
EDX Analyses (Atomic Percentages).
| C | O | Ru | Minerals | |||||
|---|---|---|---|---|---|---|---|---|
| Z1 | Z2 | Z1 | Z2 | Z1 | Z2 | Z1 | Z2 | |
| BC (Figure 3a) | 82 | 82 | 18 | 17.5 | - | - | 0 | 0.5 |
| BC (Figure 3b) | 87 | 96.5 | 12.5 | 0 | - | - | 0.5 | 3.5 |
| OBC (Figure 3c) | 70 | 80 | 29 | 18.5 | - | - | 0.2 | 1 |
| OBC (Figure 3d) | 75.4 | 85.5 | 24.4 | 13.5 | - | - | 0.2 | 1 |
| Ru-BC (Figure 3e) | 89.2 | 91 | 10.6 | 3.5 | 0.2 | 0.5 | 0 | 5 |
| Ru-OBC (Figure 3f) | 75 | 76 | 24 | 17 | 0.3 | 5.5 | 0.7 | 1.5 |
Letter Z represents the zones indicated in Figure 3.
Table 5.
TEM and Chemisorption Analyses.
| TEM Analysis | Chemisorption | |||||||
|---|---|---|---|---|---|---|---|---|
| DRu(%) | dave() | V () | DRu (%) | dave () | ||||
| Ru-BC | 35 | 3.7 | 0.18 | 7.4 | 18 | |||
| Ru-OBC | 50 | 2.6 | 0.34 | 13.9 | 9.5 | |||
Table 6.
The Results of XPS Survey (Atomic Percentages).
| Sample | |||||||||||||
|---|---|---|---|---|---|---|---|---|---|---|---|---|---|
| BC | - | - | - | - | - | 87 | - | 13 | - | - | - | - | - |
| Ru-BC | - | - | 0.7 | - | 8.8 | 54 | 9.4 | 27 | - | 0.1 | - | - | 0.16 |
| R-Ru-BC | 1 | - | - | 0.4 | 4.4 | 88.3 | - | 5.7 | - | - | - | 0.2 | 0.05 |
| OBC | - | - | - | 0.9 | - | 75.3 | - | 23.5 | 0.2 | - | - | 0.1 | - |
| Ru-OBC | - | - | 0.1 | - | 2.5 | 73.7 | 5.6 | 17.9 | - | 0.2 | - | - | 0.04 |
| R-Ru-OBC | - | 0.5 | - | 0.2 | 6 | 87.3 | - | 5.5 | - | - | 0.5 | - | 0.07 |
Table 7.
Comparison of Catalyst Performance with Literature Data.
| Entry | Catalyst | Pres. | Temp. | t | Solvent | Ref. | ||||
|---|---|---|---|---|---|---|---|---|---|---|
| () | () | / | (%) | (%) | (%) | |||||
| 1 | (2.2 wt.%) | 500 | 30 | 4 | 21.5 | 23 | 95 | 0 | [63] | |
| 2 | (1.7 wt.%) | 500 | 30 | 3 | 16.6 | 28 | 97 | 0 | ||
| 3 | Ru/AC (3 wt.%) | 1250 | 90 | 5 | 14.7 | 85 | 47 | 0 | [64] | |
| 4 | Ru/C (5 wt.%) | 2040 | 180 | 10 | 24.5 | 2-propanol | 95 | <1 | 64 | [65] |
| 5 | Ru/CNTs (1.5 wt.%) | 2000 | 90 | 24 | 1.3 | 14 | 88 | 0 | [58] | |
| 6 | Ru/CB (1.5 wt.%) | 2000 | 90 | 24 | 1.3 | 5 | 63 | 0 | ||
| 7 | (4 wt.%) | 1000 | 20 | 5 | 6.5 | 28 | 100 | 0 | [66] | |
| 8 | Pd/AC (5 wt.%) | 2000 | 150 | 4 | 2 | 42 | 35 | 0 | [67] | |
| 9 | (5 wt.%) | 2000 | 150 | 4 | 2 | 57 | 53 | 0 | ||
| 10 | (11.5 wt.%) | 1000 | 110 | 5 | 10.3 | 2-propanol | 1 | 100 | 0 | [68] |
| 11 | Cu/Al (2) e | 6000 | 200 | 4 | 900 e | Octane | 33 | 32 | 0 | [69] |
| 12 | Cu/Fe (2) | 6000 | 200 | 4 | 900 | Octane | 97 | 16 | 37 | |
| 13 | Ru/OBC (2.2 wt.%) | 1035 | 105 | 5 | 8.6 | 30 | 80 | 20 | This work | |
| 14 | Ru/OBC (2.2 wt.%) | 1035 | 105 | 25 | 12.9 | 53 | 93 | 7 | ||
| 15 | Ru/OBC (2.2 wt.%) | 1724 | 105 | 25 | 8.6 | 70 | 56 | 44 |
Initial mole ratio of metal to furfural, before reaction; * In the present work, this ratio is 4.3, 8.6 and 12.9 / using 200, 400 and 600 of sample “R-Ru-OBC”, respectively; Furfural conversion; Furfuryl alcohol selectivity; 2-methylfuran selectivity; e Cu molar ratio.
© 2020 by the authors. Licensee MDPI, Basel, Switzerland. This article is an open access article distributed under the terms and conditions of the Creative Commons Attribution (CC BY) license (http://creativecommons.org/licenses/by/4.0/).
Share and Cite
MDPI and ACS Style
Bardestani, R.; Biriaei, R.; Kaliaguine, S. Hydrogenation of Furfural to Furfuryl Alcohol over Ru Particles Supported on Mildly Oxidized Biochar. Catalysts 2020, 10, 934. https://doi.org/10.3390/catal10080934
AMA Style
Bardestani R, Biriaei R, Kaliaguine S. Hydrogenation of Furfural to Furfuryl Alcohol over Ru Particles Supported on Mildly Oxidized Biochar. Catalysts. 2020; 10(8):934. https://doi.org/10.3390/catal10080934
Chicago/Turabian StyleBardestani, Raoof, Rouholamin Biriaei, and Serge Kaliaguine. 2020. "Hydrogenation of Furfural to Furfuryl Alcohol over Ru Particles Supported on Mildly Oxidized Biochar" Catalysts 10, no. 8: 934. https://doi.org/10.3390/catal10080934
Note that from the first issue of 2016, this journal uses article numbers instead of page numbers. See further details here.