
Childhood and Adolescent Central Nervous System Tumours in Spain: Incidence and Survival over 20 Years: A Historical Baseline for Current Assessment
 ,
,  , , , ,
Abstract
:Simple Summary
Abstract
1. Introduction
2. Materials and Methods
3. Results
3.1. Incidence
3.2. Incidence Rates
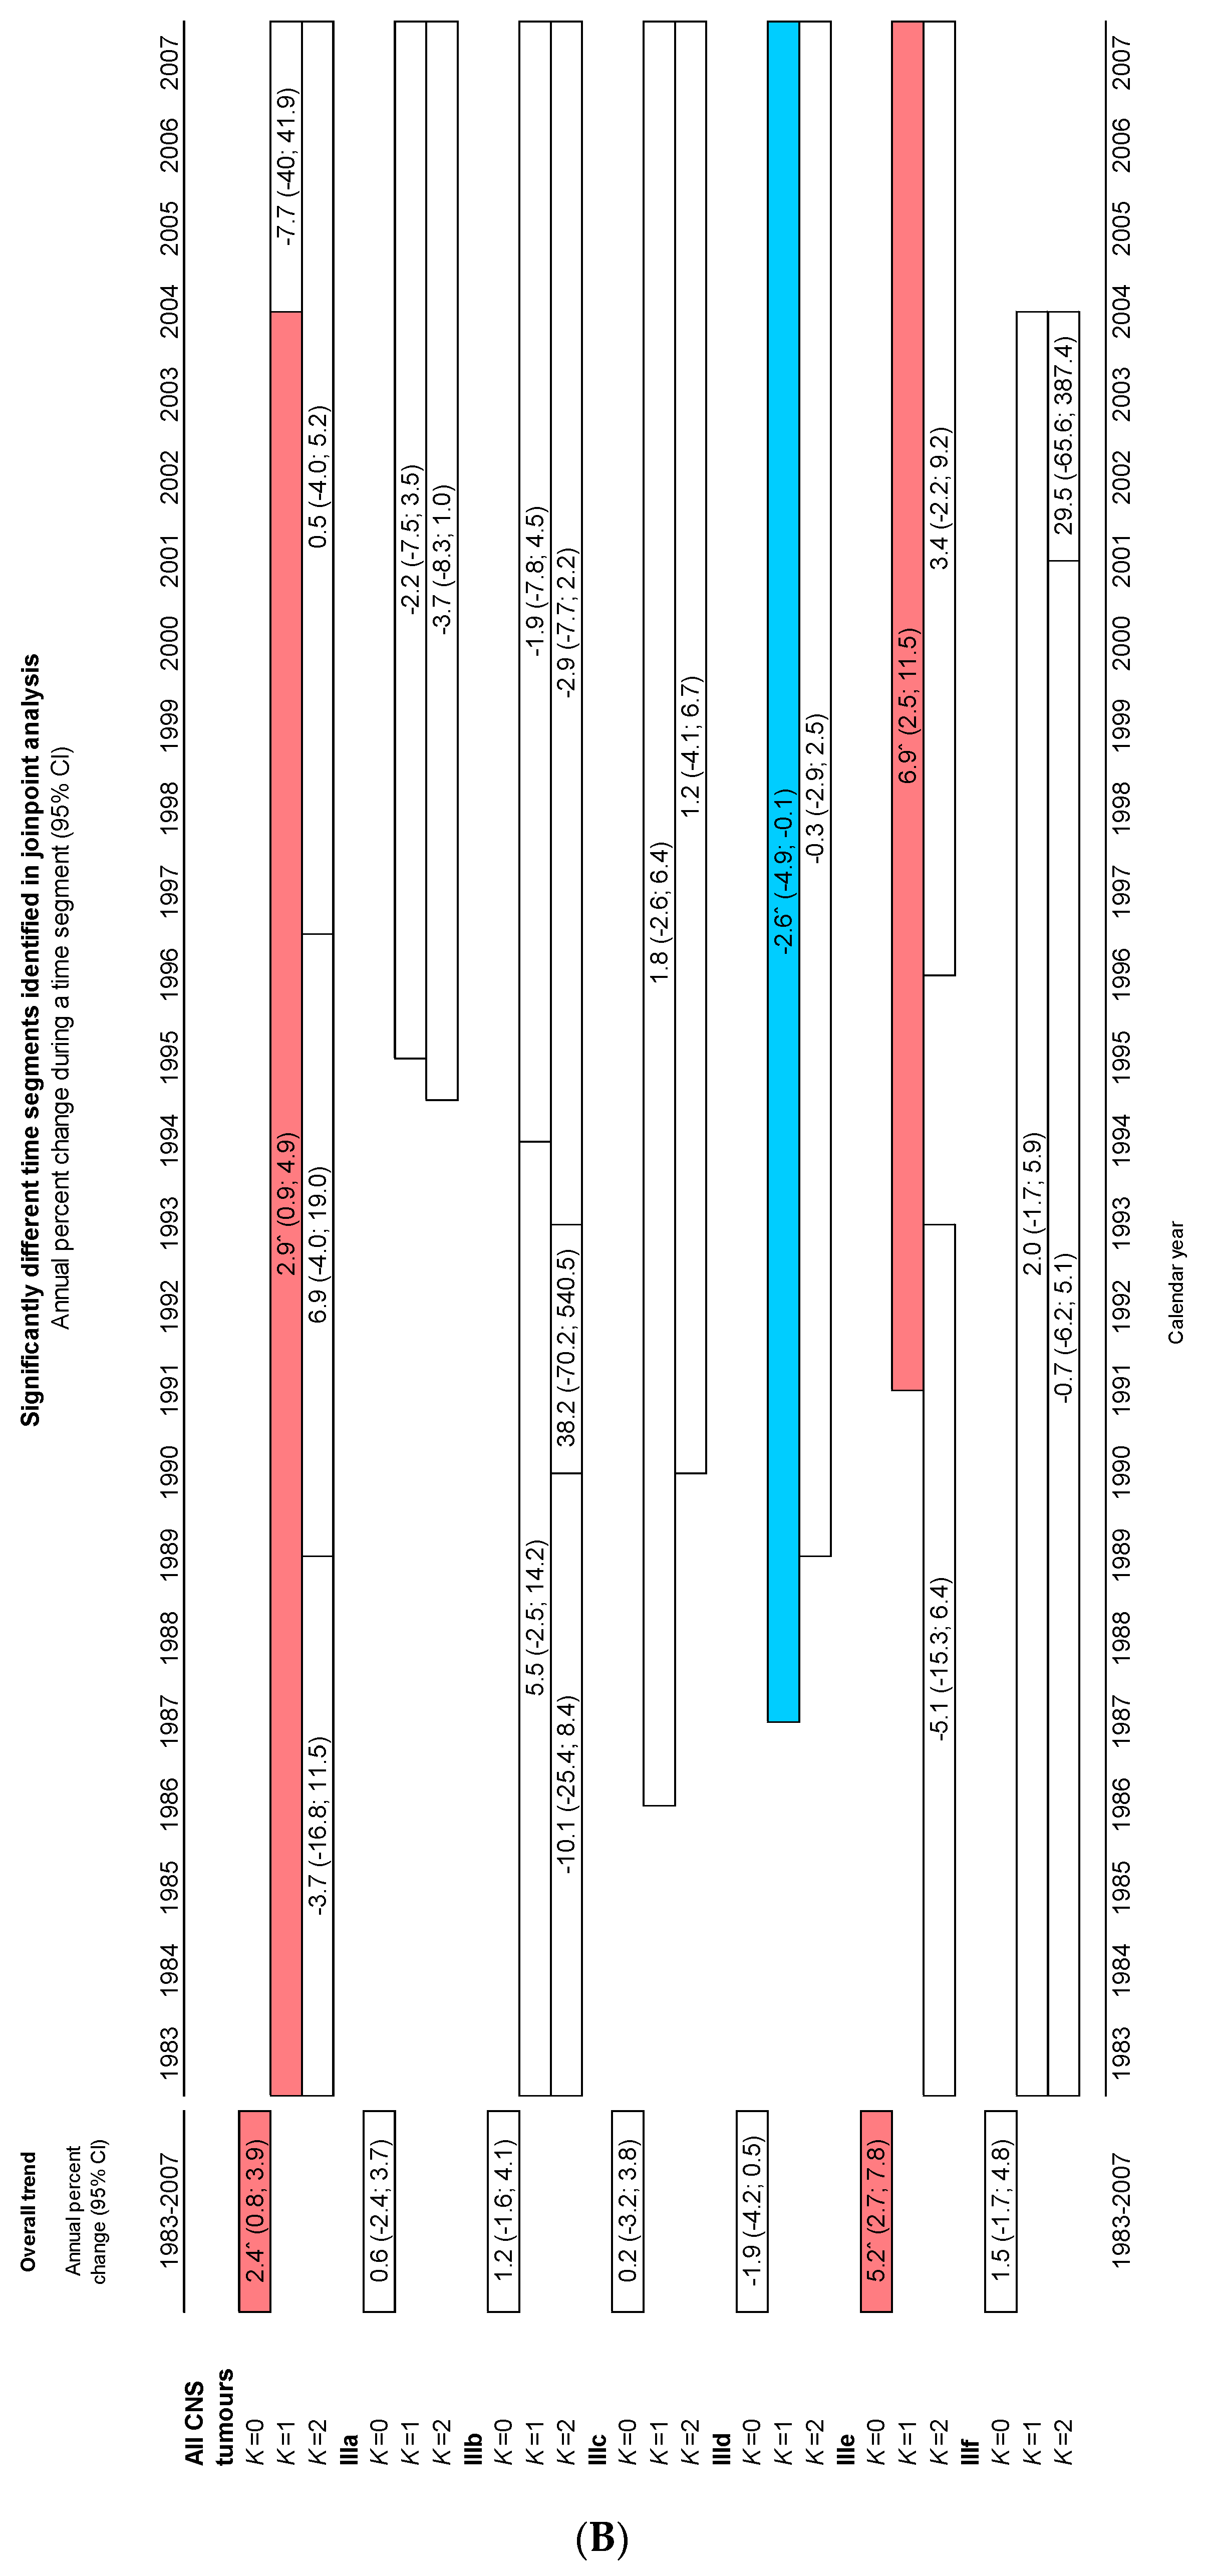
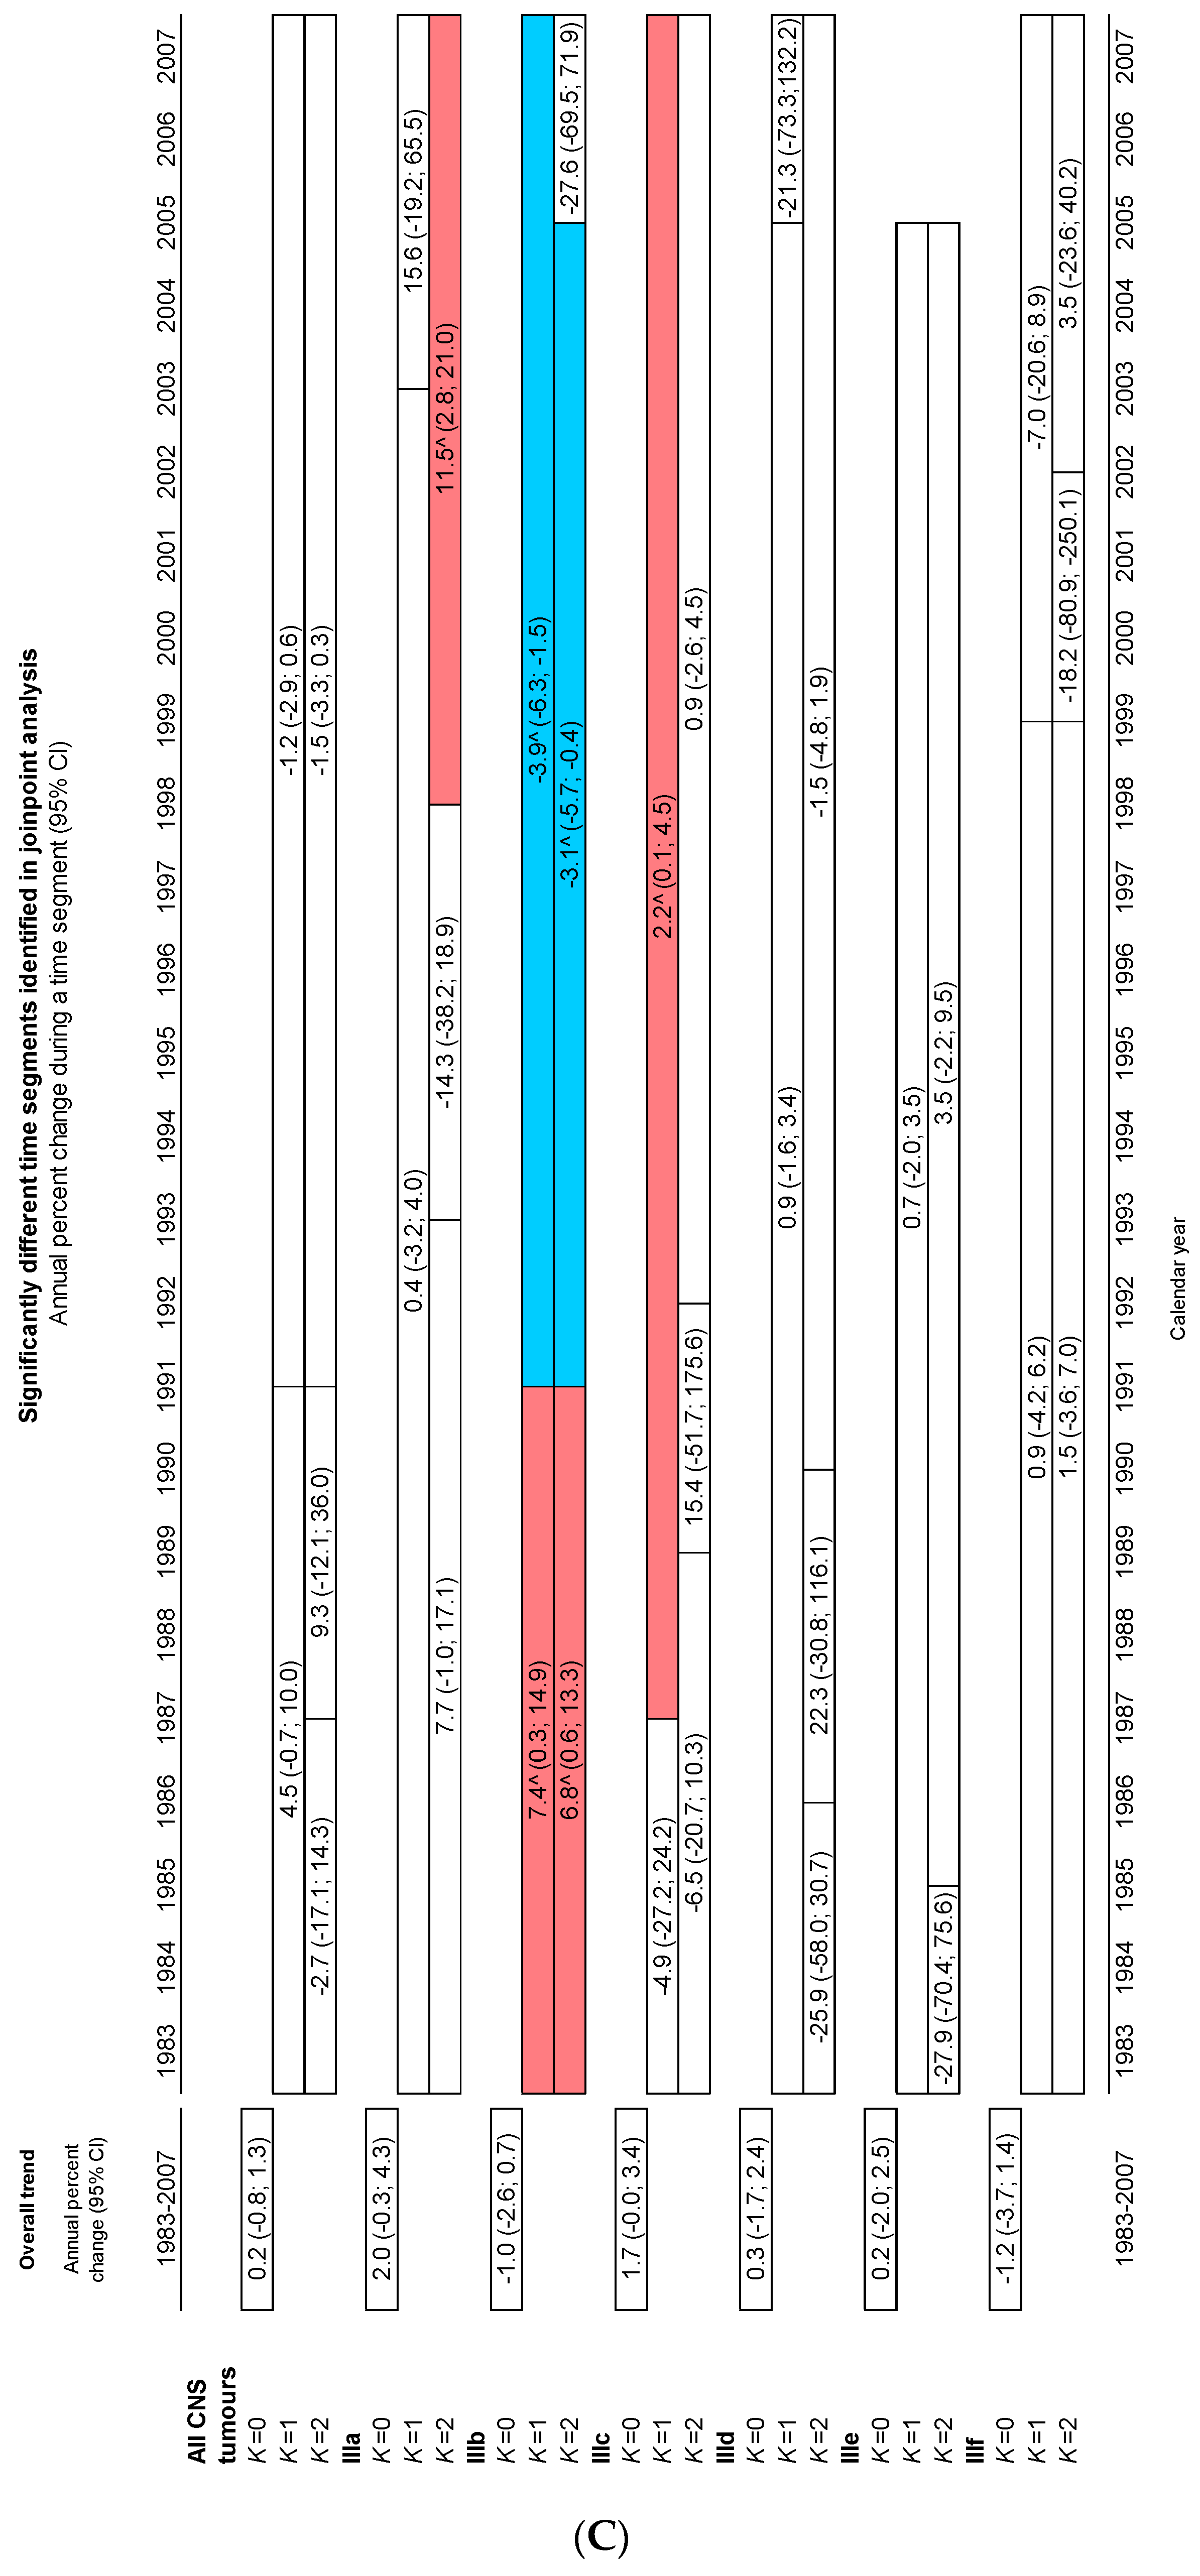
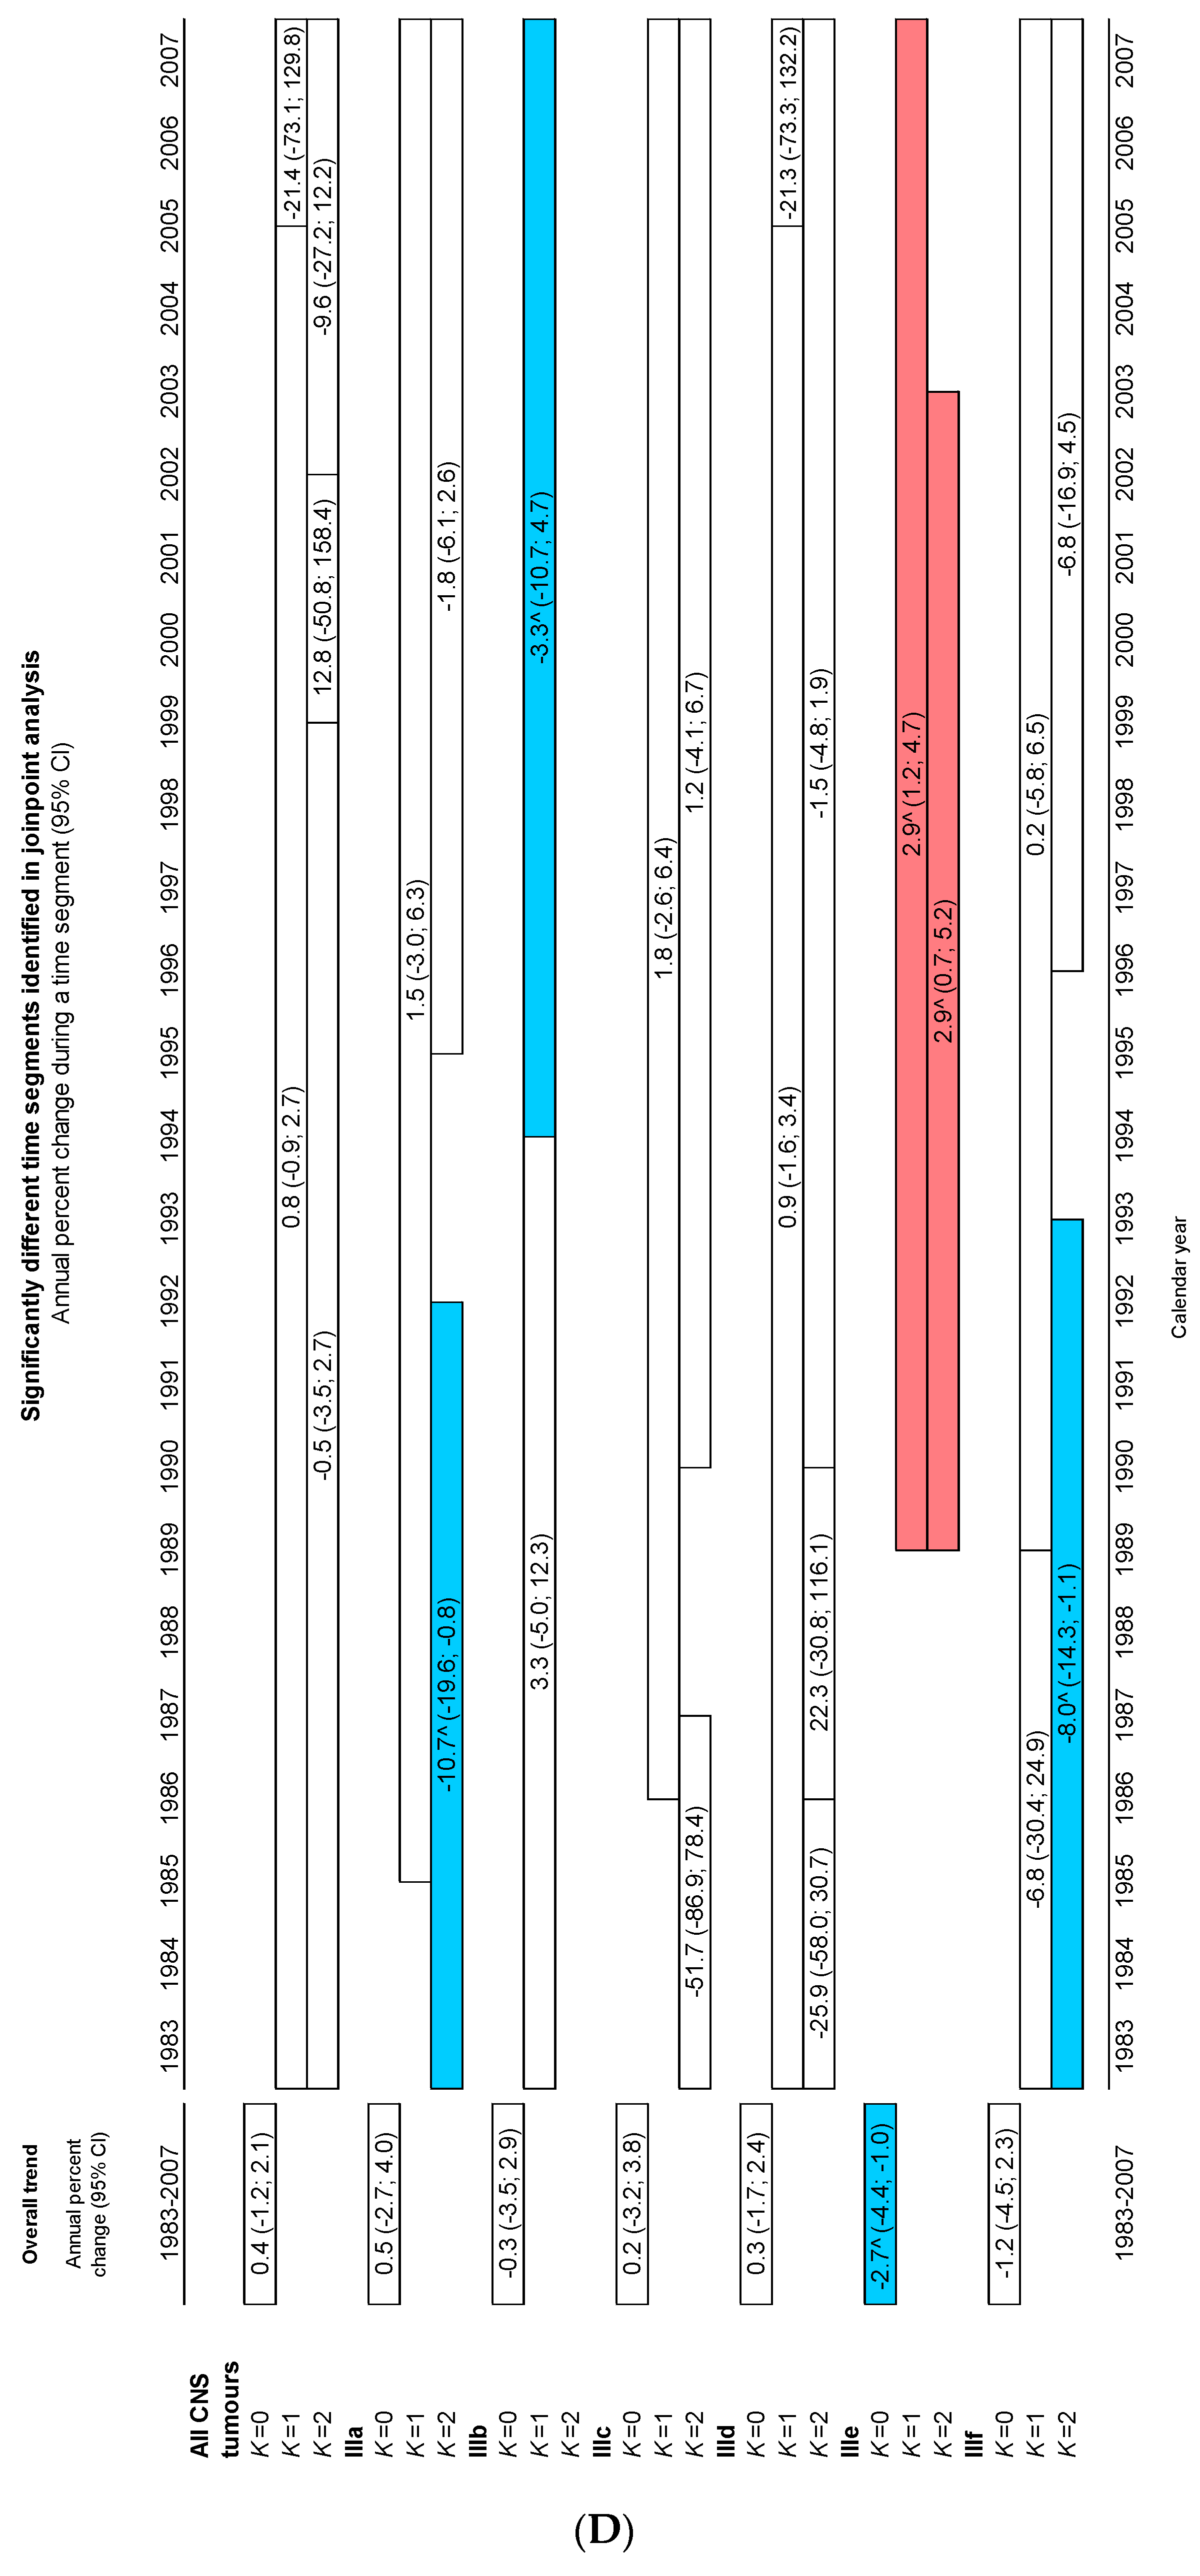
3.3. Incidence Time Trends, 1983–2007
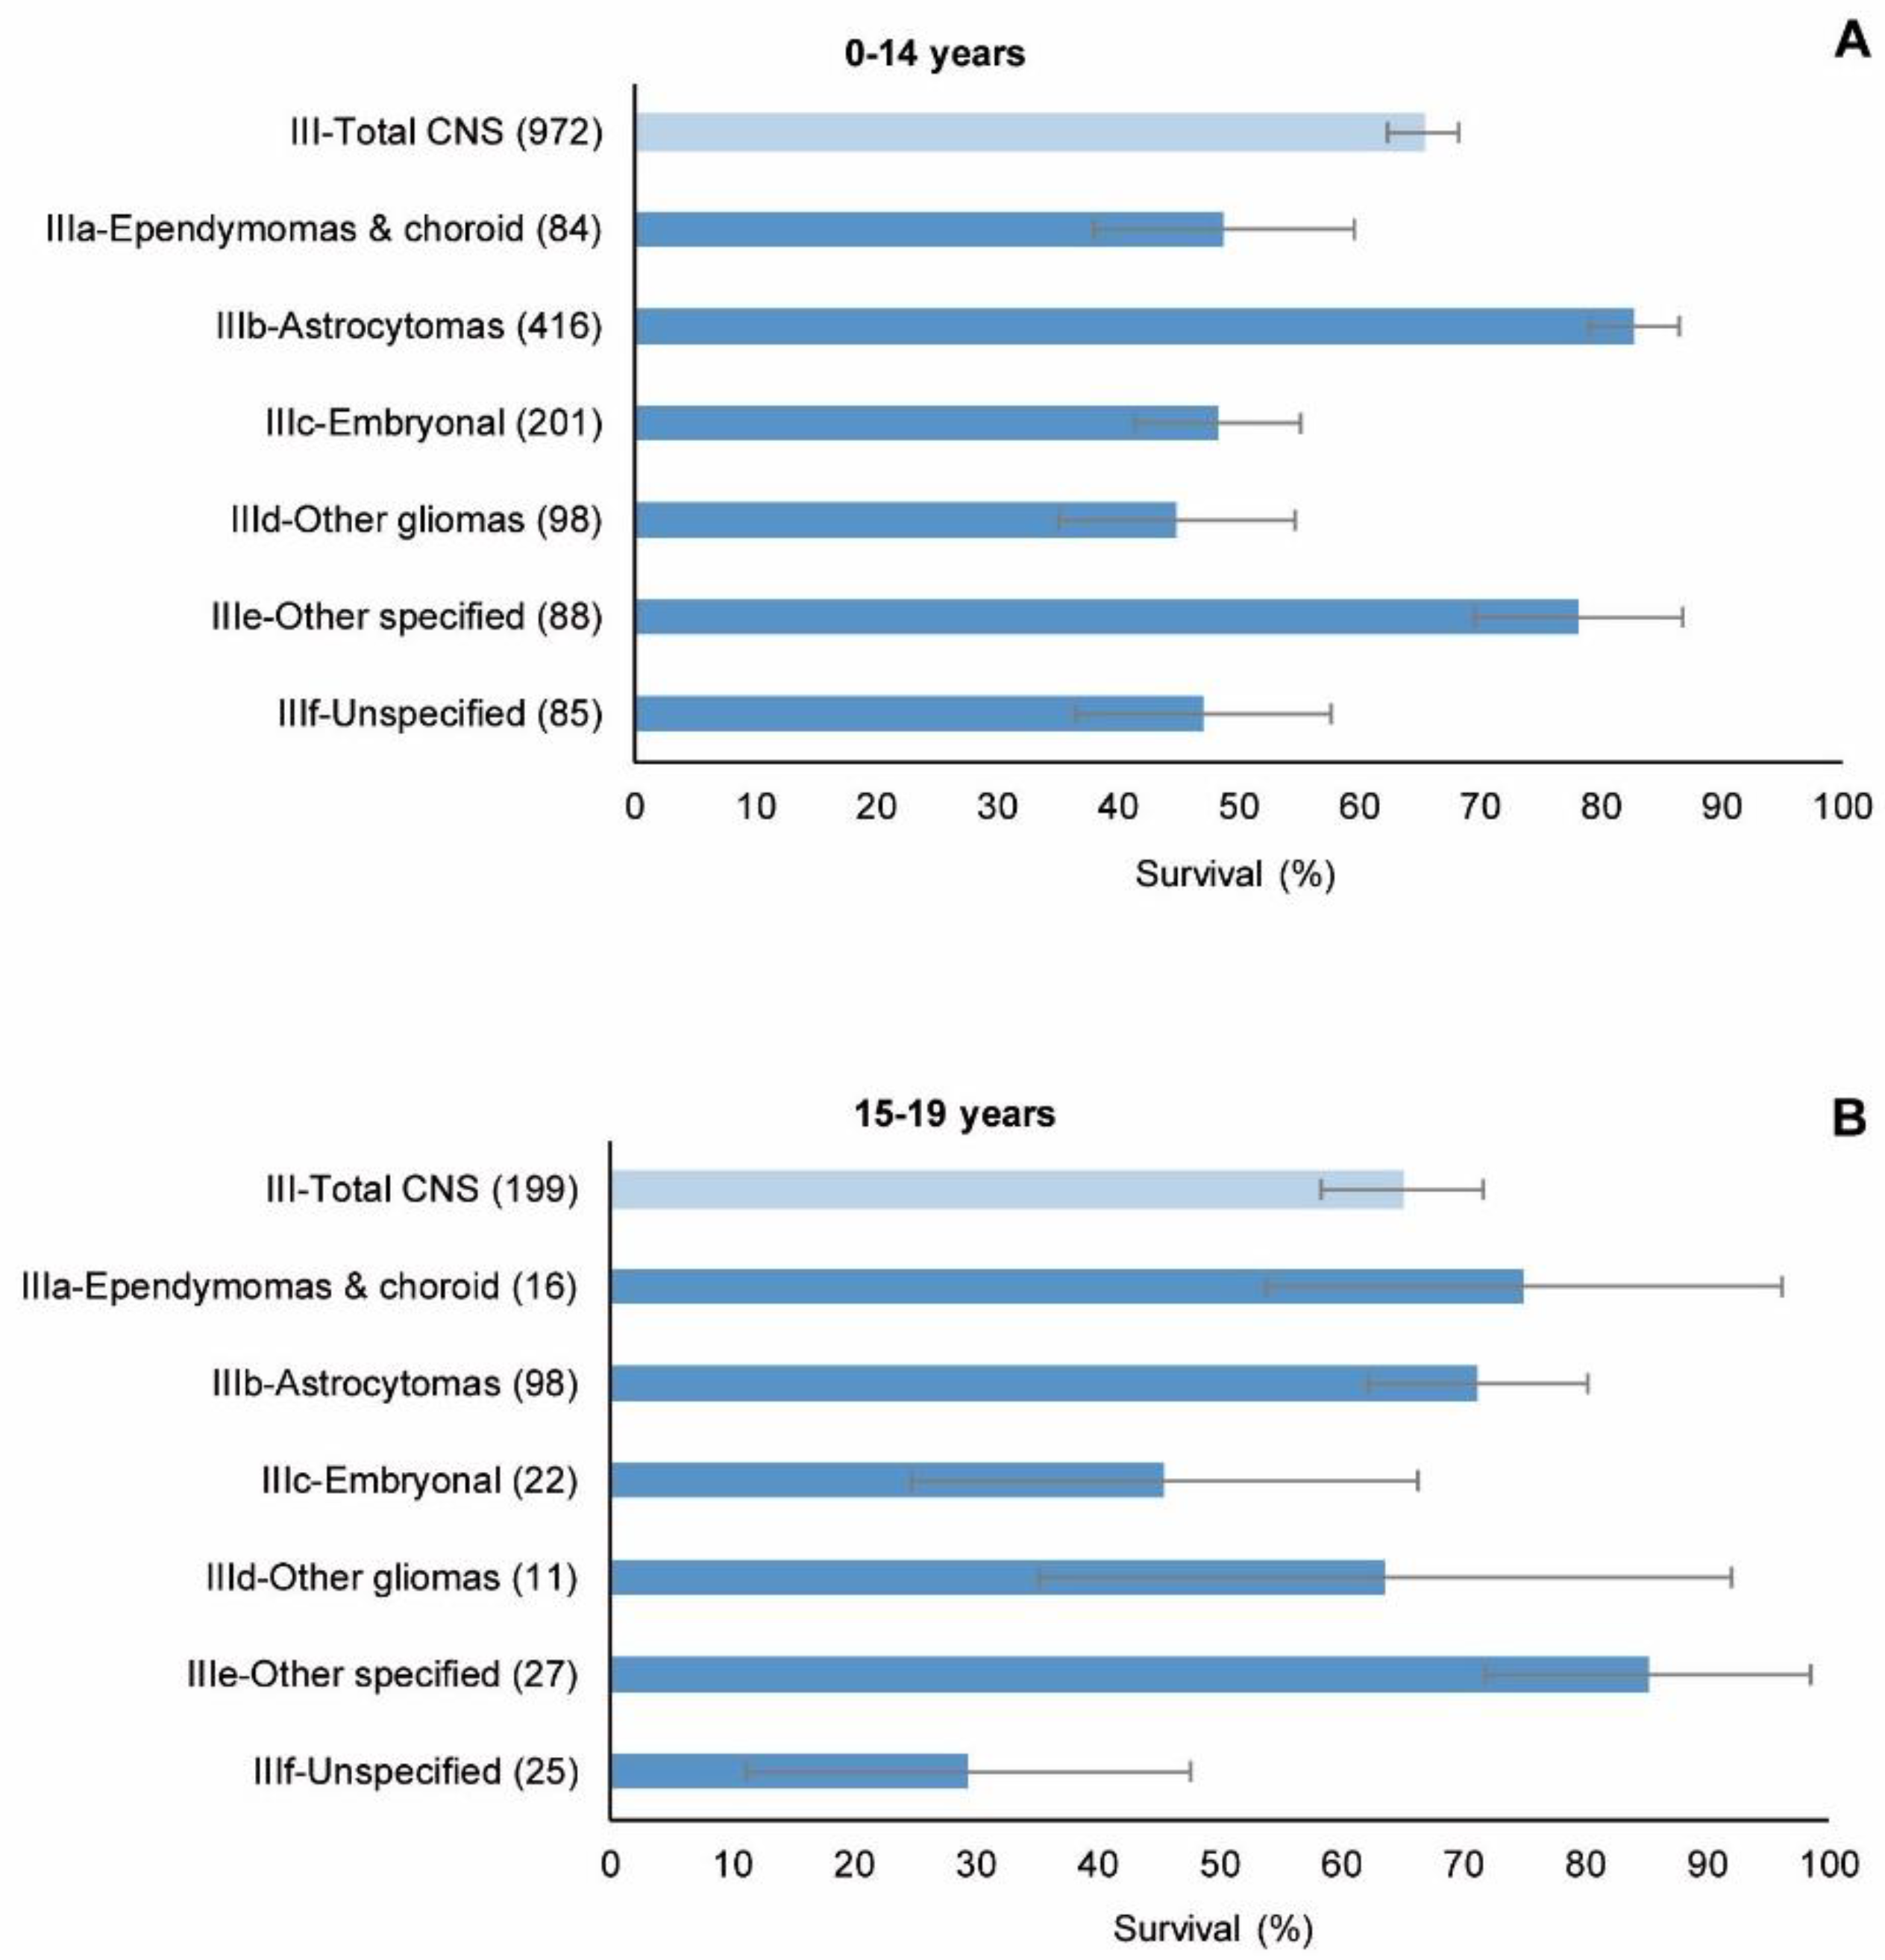
3.4. Survival
4. Discussion
4.1. Incidence
4.2. Survival
- -
- One of the main limitations was the paucity of data, mainly for adolescents, which often made it difficult to obtain meaningful results when dividing the cases by type of tumour and age and/or sex;
- -
- A second limitation was the limited coverage of the 11 PBCRs that were the sources of the cases: the RETI-SEHOP was used solely to detect cases residing in the catchment areas of the regional registries but cared for in other geographical areas. These population-based registries covered 31% and 21% of the Spanish population aged 0–14 and 15–19 years, respectively. This fact restricts the representativeness vis-à-vis Spain as a whole;
- -
- A third limitation was the uneven registration of non-malignant tumours across the study period and between PBCRs;
- -
- Another serious limitation was the underlying complexity of the classification of CNS tumours and the changes made to it across the period [72]; the frequent difficulties of pathological diagnosis [74], which in Spain may be compounded by the dispersion of hospital units attending children and adolescents with CNS tumours; and the variability of registry practices with respect to CNS tumours—a phenomenon that has been observed worldwide [75]. In our study, a certain variability can be seen in the percentages of pilocytic astrocytoma, astrocytoma NOS, gliomas, lethal tumours and unspecified tumours among the participating population-based registries (Table 1), which, despite the small numbers, may be an expression of the abovementioned variability in registry practices. Classification-related problems may have led to exchanges between the different subgroups across the study period and may have created difficulties in interpreting the results for specific groups of tumours in terms of survival and incidence time trends. The progressive incorporation of non-malignant tumours into those eligible for registration and the different registration criteria applied to these tumours should also be borne in mind as a source of problems for the interpretation of results;
- -
- When it comes to survival, the quality of follow-up is decisive. An indicator of follow-up completeness is 5-year survival in lethal tumours. We used the same criteria (see the list of tumours in the Materials and Methods section) as Gatta et al., cited above [37]. In that study, overall 5-year survival for these tumours in Europe was 19%, whereas in Spain, 5-year observed survival in CNS lethal tumours was 33% in the first cohort, rising to 53% in the last (Supplementary Table S10), with very wide 95% CIs. These high survival proportion could, however, indicate some deficit in access to the data required to verify vital status and, as a result, some overestimation of 5-year survival.
5. Conclusions
Supplementary Materials
Author Contributions
Funding
Institutional Review Board Statement
Informed Consent Statement
Data Availability Statement
Acknowledgments
Conflicts of Interest
Appendix A
References
- Steliarova-Foucher, E.; Colombet, M.; Ries, L.A.G.; Moreno, F.; Dolya, A.; Bray, F.; Hesseling, P.; Shin, H.Y.; Stiller, C.A.; IICC-3 Contributors. International incidence of childhood cancer, 2001–2010: A population-based registry study. Lancet Oncol. 2017, 18, 719–731. [Google Scholar] [CrossRef] [PubMed]
- Stiller, C.A.; Nectoux, J. International incidence of childhood brain and spinal tumours. Int. J. Epidemiol. 1994, 23, 458–464. [Google Scholar] [CrossRef]
- Makino, K.; Nakamura, H.; Yano, S.; Kuratsu, J.; Kumamoto Brain Tumor Group. Population-based epidemiological study of primary intracranial tumors in childhood. Child Nerv. Syst. 2010, 26, 1029–1034. [Google Scholar] [CrossRef] [PubMed]
- Liu, A.P.Y.; Liu, Q.; Shing, M.M.K.; Ku, D.T.L.; Fu, E.; Luk, C.-W.; Ling, S.-C.; Cheng, K.K.F.; Kwong, D.L.W.; Ho, W.W.S.; et al. Incidence and outcomes of CNS tumors in Chinese children: Comparative analysis with the Surveillance, Epidemiology, and End Results Program. JCO Global Oncol. 2020, 6, 704–721. [Google Scholar] [CrossRef] [PubMed]
- Reutfors, J.; Kramarova, E.; Weiderpass, E.; Monge, P.; Wesseling, C.; Ahlbom, A. Central nervous system tumours in children in Costa Rica, 1981–1996. Paediatr. Perinat. Epidemiol. 2002, 16, 219–225. [Google Scholar] [CrossRef]
- Stoeter, O.; Seraphin, T.P.; Chitsike, I.; Chokunonga, E.; Kambugu, J.B.; Wabinga, H.; Parkin, D.M.; Kantelhardt, E.J. Trends in childhood cancer incidence in sub-Saharan Africa: Results from 25 years of cancer registration in Harare (Zimbabwe) and Kyadondo (Uganda). Int. J. Cancer 2021, 149, 1002–1012. [Google Scholar] [CrossRef]
- Pongtanakul, B.; Sirachainan, N.; Surapolchai, P.; Charoenkwan, P.; Choeyprasert, W.; Komwilaisak, P.; Chainansamit, S.; Witsanuyothin, N.; Lertrakul, Y.; Rujkijyanont, P.; et al. Pediatric primary central nervous system tumors registry in Thailand under National Health Security Office schemes. J. Neurooncol. 2020, 149, 141–151. [Google Scholar] [CrossRef]
- Girardi, F.; Allemani, C.; Coleman, M.P. Worldwide trends in survival from common childhood brain tumors: A systematic review. J. Glob. Oncol. 2019, 5, 1–25. [Google Scholar] [CrossRef]
- Allemani, C.; Matsuda, T.; Di Carlo, V.; Harewood, R.; Matz, M.; Nikšić, M.; Bonaventure, A.; Valkov, M.; Johnson, C.J.; Estève, J.; et al. Global surveillance of trends in cancer survival 2000-14 (CONCORD-3): Analysis of individual records for 37 513 025 patients diagnosed with one of 18 cancers from 322 population-based registries in 71 countries. Lancet 2018, 391, 1023–1075. [Google Scholar] [CrossRef]
- Botta, L.; Gatta, G.; Capocaccia, R.; Stiller, C.; Cañete, A.; Dal Maso, L.; Innos, K.; Mihor, A.; Erdmann, F.; Spix, C.; et al. Long-term survival and cure fraction estimates for childhood cancer in Europe (EUROCARE-6): Results from a population-based study. Lancet Oncol. 2022, 23, 1525–1536. [Google Scholar] [CrossRef]
- van Kalsbeek, R.J.; van der Pal, H.J.H.; Kremer, L.C.M.; Bardi, E.; Brown, M.C.; Effeney, R.; Winther, J.F.; Follin, C.; den Hartogh, J.; Haupt, R.; et al. European PanCareFollowUp Recommendations for surveillance of late effects of childhood, adolescent, and young adult cancer. Eur. J. Cancer 2021, 154, 316–328. [Google Scholar] [CrossRef]
- Louis, D.N.; Perry, A.; Wesseling, P.; Brat, D.J.; Cree, I.A.; Figarella-Branger, D.; Hawkins, C.; Ng, H.K.; Pfister, S.M.; Reifenberger, G.; et al. The 2021 WHO classification of tumors of the central nervous system: A summary. Neuro Oncol. 2021, 23, 1231–1251. [Google Scholar] [CrossRef]
- Pfister, S.M.; Reyes-Múgica, M.; Chan, J.K.C.; Hasle, H.; Lazar, A.J.; Rossi, S.; Ferrari, A.; Jarzembowski, J.A.; Pritchard-Jones, K.; Hill, D.A.; et al. A summary of the Inaugural WHO Classification of Pediatric Tumors: Transitioning from the optical into the molecular era. Cancer Discov. 2022, 12, 331–355. [Google Scholar] [CrossRef]
- Steliarova-Foucher, E.; Colombet, M.; Ries, L.A.G.; Rous, B.; Stiller, C.A. Classification of tumours. In International Incidence of Childhood Cancer; Steliarova-Foucher, E., Colombet, M., Ries, L.A.G., Hesseling, P., Moreno, F., Shin, H.Y., Stiller, C.A., Eds.; International Agency for Research on Cancer: Lyon, France, 2017; Volume III, (Electronic Version). Available online: http://iicc.iarc.fr/results/ (accessed on 4 November 2022).
- Rizzo, D.; Ruggiero, A.; Martini, M.; Rizzo, V.; Maurizi, P.; Riccardi, R. Molecular biology in pediatric high-grade glioma: Impact on prognosis and treatment. Biomed. Res. Int. 2015, 2015, 215135. [Google Scholar] [CrossRef]
- Funakoshi, Y.; Hata, N.; Kuga, D.; Hatae, R.; Sangatsuda, Y.; Fujioka, Y.; Takigawa, K.; Mizoguchi, M. Pediatric glioma: An update of diagnosis, biology, and treatment. Cancers 2021, 13, 758:1–758:18. [Google Scholar] [CrossRef] [PubMed]
- Silva, A.H.D.; Aquilina, K. Surgical approaches in pediatric neuro-oncology. Cancer Metastasis Rev. 2019, 38, 723–747. [Google Scholar] [CrossRef]
- Gritsch, S.; Batchelor, T.T.; Gonzalez Castro, L.N. Diagnostic, therapeutic, and prognostic implications of the 2021 World Health Organization classification of tumors of the central nervous system. Cancer 2022, 128, 47–58. [Google Scholar] [CrossRef]
- Peris-Bonet, R.; Martinez-Garcia, C.; Lacour, B.; Petrovich, S.; Giner-Ripoll, B.; Navajas, A.; Steliarova-Foucher, E. Childhood central nervous system tumours—Incidence and survival in Europe (1978–1997): Report from Automated Childhood Cancer Information System Project. Eur. J. Can. 2006, 42, 2064–2080. [Google Scholar] [CrossRef]
- Steliarova-Foucher, E.; Fidler, M.M.; Colombet, M.; Lacour, B.; Kaatsch, P.; Piñeros, M.; Soerjomataram, I.; Bray, F.; Coebergh, J.W.; Peris-Bonet, R.; et al. Changing geographical patterns and trends in cancer incidence in children and adolescents in Europe, 1991–2010 (Automated Childhood Cancer Information System): A population-based study. Lancet Oncol. 2018, 19, 1159–1169. [Google Scholar] [CrossRef] [PubMed]
- Peris-Bonet, R.; Salmerón, D.; Martínez-Beneito, M.A.; Galceran, J.; Marcos-Gragera, R.; Felipe, S.; González, V.; Sánchez de Toledo Codina, J.; Spanish Childhood Cancer Epidemiology Working Group. Childhood cancer incidence and survival in Spain. Ann. Oncol. 2010, 21, iii103–iii110. [Google Scholar] [CrossRef] [PubMed]
- Larrañaga, N.; Sánchez, M.J.; Ardanaz, E.; Felipe, S.; Marcos-Gragera, R.; Ramos, M.; Carulla, M.; Chirlaque, M.D.; Argüelles, M.V.; Martos, C.; et al. Incidence patterns and trends of non-central nervous system solid tumours in children and adolescents. A collaborative Study of the Spanish population-based cancer registries. J. Cancer 2016, 7, 335–343. [Google Scholar] [CrossRef] [PubMed]
- Marcos-Gragera, R.; Galceran, J.; Martos, C.; de Munain, A.L.; Vicente-Raneda, M.; Navarro, C.; Quirós-García, J.R.; Sánchez, M.J.; Ardanaz, E.; Ramos, M.; et al. Incidence and survival time trends for Spanish children and adolescents with leukaemia from 1983 to 2007. Clin. Transl. Oncol. 2017, 19, 301–316. [Google Scholar] [CrossRef] [PubMed]
- Marcos-Gragera, R.; Solans, M.; Galceran, J.; Fernandez-Delgado, R.; Fernandez-Teijeiro, A.; Mateos, A.; Quirós-García, J.R.; Fuster-Camarena, N.; De Castro, V.; Sánchez, M.J.; et al. Childhood and adolescent lymphoma in Spain: Incidence and survival trends over 20 years. Clin. Transl. Oncol. 2018, 20, 1289–1301. [Google Scholar] [CrossRef]
- Steliarova-Foucher, E.; Stiller, C.; Lacour, B.; Kaatsch, P. International Classification of Childhood Cancer. Cancer 2005, 103, 1457–1467. [Google Scholar] [CrossRef] [PubMed]
- Fritz, A.; Percy, C.; Jack, A.; Shanmugaratnam, K.; Sobin, L.; Parkin, D.M.; Whelan, S. (Eds.) International Classification of Diseases for Oncology, 3rd ed.; World Health Organisation: Geneva, Switzerland, 2000; ISBN 9241545348.
- International Agency for Research on Cancer (IARC). Available online: https://training.iarc.who.int/cards_page/learning_resources/ (accessed on 4 November 2022).
- International Association of Cancer Registries (IACR). Available online: http://www.iacr.com.fr/ (accessed on 4 November 2022).
- European Network of Cancer Registries (ENCR). Available online: https://www.encr.eu/encr-members-contact-list (accessed on 4 November 2022).
- ACCIS. Automated Childhood Cancer Information System. Available online: https://accis.iarc.fr/ (accessed on 4 November 2022).
- EUROCARE. Survival of Cancer Patients in Europe. Available online: http://www.eurocare.it/ (accessed on 4 November 2022).
- Steliarova-Foucher, E.; Colombet, M.; Ries, L.A.G.; Hesseling, P.; Moreno, F.; Shin, H.Y.; Stiller, C.A. (Eds.) International Incidence of Childhood Cancer; Electronic Version; International Agency for Research on Cancer: Lyon, France, 2017; Volume III. Available online: http://iicc.iarc.fr/results/ (accessed on 4 November 2022).
- Cancer Incidence in Five Continents (CI5C). Available online: https://ci5.iarc.fr/Default.aspx (accessed on 4 November 2022).
- REDECAN Red Española de Registros de Cáncer. Available online: https://redecan.org/es/redecan (accessed on 4 November 2022).
- Cáncer infantil en España. Estadísticas 1980–2022. Registro Español de Tumores Infantiles (RETI-SEHOP). 2022. Available online: https://www.uv.es/rnti/informes.html (accessed on 4 November 2022).
- INE. Instituto Nacional de Estadística. Available online: http://www.ine.es/dynt3/inebase/index.htm?padre=1949&capsel=1951 (accessed on 5 November 2022).
- Gatta, G.; Peris-Bonet, R.; Visser, O.; Stiller, C.; Marcos-Gragera, R.; Sánchez, M.J.; Lacour, B.; Kaatsch, P.; Berrino, F.; Rutkowski, S.; et al. Geographical variability in survival of European children with central nervous system tumours. Eur. J. Cancer 2017, 82, 137–148. [Google Scholar] [CrossRef] [PubMed]
- Ferlay, J.; Burkhard, C.; Whelan, S.; Parkin, D.M. Check and Conversion Programs for Cancer Registries (IARC/IACR Tools for Cancer Registries); Technical Report No 42; IARC: Lyon, France, 2005. Available online: http://www.iacr.com.fr/images/doc/TechRep42.pdf (accessed on 5 November 2022).
- Waterhouse, J.A.H.; Muir, C.S.; Shanmugaratnam, K.; Powell, J. (Eds.) Cancer Incidence in Five Continents; Scientific Publication No. 42; IARC: Lyon, France, 1982; Volume IV, ISBN 978-92-832-1142-6.
- Kim, H.J.; Fay, M.P.; Feuer, E.J.; Midthune, D.N. Permutation tests for joinpoint regression with applications to cancer rates. Stat. Med. 2000, 19, 335–351. [Google Scholar] [CrossRef]
- Joinpoint Regression Program [Computer Program] Version 4.1.1. 2014. Available online: https://surveillance.cancer.gov/joinpoint/ (accessed on 5 November 2022).
- Neidhardt, M.K.; Bailey, C.C. Prospective randomized cooperative medulloblastoma trial (MED 84) of the International Society of Paediatric Oncology (SIOP) and of the German Society of Paediatric Oncology (GPO). Child’s Nerv. Syst. 1987, 3, 70–73. [Google Scholar] [CrossRef] [PubMed]
- Freeman, C.R.; Taylor, R.E.; Kortmann, R.D.; Carrie, C. Radiotherapy for medulloblastoma in children: A perspective on current international clinical research efforts. Med. Pediatr. Oncol. 2002, 39, 99–108. [Google Scholar] [CrossRef]
- Taylor, R.E.; Bailey, C.C.; Robinson, K.J.; Weston, C.L.; Walker, D.A.; Ellison, D.; Ironside, J.; Pizer, B.L.; Lashford, L.S. Outcome for patients with metastatic (M2-3) medulloblastoma treated with SIOP/UKCCSG PNET-3 chemotherapy. Eur. J. Cancer 2005, 41, 727–734. [Google Scholar] [CrossRef]
- Lannering, B.; Rutkowski, S.; Doz, F.; Pizer, B.; Gustafsson, G.; Navajas, A.; Massimino, M.; Reddingius, R.; Benesh, M.; Carrie, C.; et al. Hyperfractionated versus conventional radiotherapy followed by chemotherapy in standard-risk medulloblastoma: Results from the randomized multicenter HIT-SIOP PNET 4 trial. J. Clin. Oncol. 2012, 30, 3187–3193. [Google Scholar] [CrossRef]
- Kaplan, E.L.; Meier, P. Nonparametric estimation from incomplete observations. J. Am. Stat. Assoc. 1958, 53, 457–481. [Google Scholar] [CrossRef]
- Bland, J.M.; Altman, D.G. The Logrank Test. BMJ 2004, 328, 1073. [Google Scholar] [CrossRef] [PubMed]
- Peto, R.; Pike, M.C.; Armitage, P.; Breslow, N.E.; Cox, D.R.; Howard, S.V.; Mantel, N.; McPherson, M.; Peto, J.; Smith, P.G. Design and analysis of randomized clinical trials requiring prolonged observation of each patient. II Analysis and examples. Br. J. Cancer 1977, 35, 1–39. [Google Scholar] [CrossRef] [PubMed]
- Louis, D.N.; Ohgaki, H.; Wiestler, O.D.; Cavenee, W.K.; Burger, P.C.; Jouvet, A.; Scheithauer, B.W.; Kleihues, P. The 2007 WHO classification of tumours of the central nervous system. Acta Neuropathol. 2007, 114, 97–109. [Google Scholar] [CrossRef]
- Benjamini, Y.; Hochberg, Y. Controlling the false discovery rate: A practical and powerful approach to multiple testing. J. R. Stat. Soc. B 1995, 7, 289–300. Available online: https://www.jstor.org/stable/2346101 (accessed on 8 November 2022). [CrossRef]
- Lannering, B.; Sandström, P.E.; Holm, S.; Lundgren, J.; Pfeifer, S.; Samuelsson, U.; Strömberg, B.; Gustafsson, G.; Swedish Childhood CNS Tumor Working Group (VCTB). Classification, incidence and survival analyses of children with CNS tumours diagnosed in Sweden 1984–2005. Acta Paediatr. 2009, 98, 1620–1627. [Google Scholar] [CrossRef]
- Schmidt, L.S.; Schmiegelow, K.; Lahteenmaki, P.; Träger, C.; Stokland, T.; Grell, K.; Gustafson, G.; Sehested, A.; Raashou-Nielsen, O.; Johansen, C.; et al. Incidence of childhood central nervous system tumors in the Nordic countries. Pediatr. Blood Cancer 2011, 56, 65–69. [Google Scholar] [CrossRef] [PubMed]
- Papathoma, P.; Thomopoulos, T.P.; Karalexi, M.A.; Ryzhov, A.; Zborovskaya, A.; Dimitrova, N.; Zivkovic, S.; Eser, S.; Antunes, L.; Sekerija, M.; et al. Childhood central nervous system tumours: Incidence and time trends in 13 Southern and Eastern European cancer registries. Eur. J. Cancer 2015, 51, 1444–1455. [Google Scholar] [CrossRef]
- ENCR. Recommendations for Coding Tumours of the Brain and Central Nervous System. 1998. Available online: https://encr.eu/sites/default/files/pdf/braincns.pdf (accessed on 4 November 2022).
- Mccarthy, B.J.; Kruchko, C. Consensus conference on cancer registration of brain and central nervous system tumors. Neuro Oncol. 2005, 7, 196–201. [Google Scholar] [CrossRef]
- Raja, N.; Hayes, L.; Basta, N.; McNally, R.J.Q. International trends in the incidence of brain tumours in children and young-adults and their association with indicators of economic development. Cancer Epidemiol. 2021, 74, 102006. [Google Scholar] [CrossRef]
- Arora, R.S.; Alston, R.D.; Eden, T.O.B.; Estlin, E.J.; Moran, A.; Birch, J.M. Age–incidence patterns of primary CNS tumors in children, adolescents, and adults in England. Neuro Oncol. 2009, 11, 403–413. [Google Scholar] [CrossRef]
- Liu, Z.; Yang, Q.; Cai, N.; Li, J.; Zhang, T.; Chen, X. Enigmatic differences by sex in cancer incidence: Evidence from childhood cancers. Am. J. Epidemiol. 2019, 188, 1130–1135. [Google Scholar] [CrossRef] [PubMed]
- Pearce, M.S.; Parker, L. Childhood cancer registrations in the developing world: Still more boys than girls. Int. J. Cancer 2001, 91, 402–406. [Google Scholar] [CrossRef] [PubMed]
- Dunford, A.; Weinstock, D.M.; Savova, V.; Schumacher, S.E.; Cleary, J.P.; Yoda, A.; Sullivan, T.J.; Getz, G.; Lane, A.A. Tumor-suppressor genes that escape from X-inactivation contribute to cancer sex bias. Nat. Genet. 2017, 49, 10–16. [Google Scholar] [CrossRef]
- Stiller, C.A.; Bayne, A.M.; Chakrabarty, A.; Kenny, T.; Chumas, P. Incidence of childhood CNS tumours in Britain and variation in rates by definition of malignant behaviour: Population-based study. BMC Cancer 2019, 19, 139. [Google Scholar] [CrossRef] [PubMed]
- Youlden, D.R.; Henshaw, C.; Gottardo, N.G.; Hassall, T.; Aitken, J.F. Incidence and survival for childhood central nervous system tumours in Australia, 1983–2016. J. Neurooncol. 2021, 155, 203–213. [Google Scholar] [CrossRef] [PubMed]
- Hoogendijk, R.; van der Lugt, J.; van Vuurden, D.; Kremer, L.; Wesseling, P.; Hoving, E.; Karim-Kos, H.E. Survival rates of children and young adolescents with CNS tumors improved in the Netherlands since 1990: A population-based study. Neuro-Oncol. Adv. 2022, 4, vdab183. [Google Scholar] [CrossRef]
- Rivas-Vilela, S.; Rubió-Casadevall, J.; Fàbrega-Ribas, A.; Joly-Torta, C.; Vilardell, L.; Marcos-Gragera, R. Incidence and survival of central nervous system tumors in childhood and adolescence in Girona (Spain) 1990–2013: National and international comparisons. Clin. Transl. Oncol. 2019, 21, 1177–1185. [Google Scholar] [CrossRef]
- Tendencias de la Incidencia de los Cánceres del Encéfalo en España entre 1985 y 2015 y su Posible Relación con el Uso de Teléfonos Móviles. Red Española de Registros de Cáncer (REDECAN). 2002. Available online: https://redecan.org/storage/documents/9fd76bac-6f06-400a-a0d3-27f655f3ffa6.pdf (accessed on 4 November 2022).
- Basta, N.O.; James, P.W.; Gomez-Pozo, B.; Craft, A.W.; McNally, R.J.Q. Survival from childhood cancer in northern England, 1968–2005. Br. J. Cancer 2011, 105, 1402–1408. [Google Scholar] [CrossRef]
- Gatta, G.; Zigon, G.; Capocaccia, R.; Coebergh, J.W.; Desandes, E.; Kaatsch, P.; Pastore, G.; Peris-Bonet, R.; Stiller, C.A.; EUROCARE Working Group. Survival of European children and young adults with cancer diagnosed 1995–2002. Eur. J. Cancer 2009, 45, 992–1005. [Google Scholar] [CrossRef]
- Girardi, F.; Di Carlo, V.; Stiller, C.; Gatta, G.; Woods, R.R.; Visser, O.; Lacour, B.; Tucker, T.C.; Coleman, M.P.; Allemani, C. Global survival trends for brain tumours, by histology: Analysis of individual records for 67,776 children diagnosed in 61 countries during 2000–2014 (CONCORD-3). Neuro Oncol. 2022, 10, noac232. [Google Scholar] [CrossRef]
- Trama, A.; Botta, L.; Foschi, R.; Ferrari, A.; Stiller, C.; Desandes, E.; Maule, M.M.; Merletti, F.; Gatta, G.; CONCORD Working Group. Survival of European adolescents and young adults diagnosed with cancer in 2000–2007: Population-based data from EUROCARE-5. Lancet Oncol. 2016, 17, 896–906. [Google Scholar] [CrossRef]
- Kurani, H.; Gurav, M.; Shetty, O.; Chinnaswamy, G.; Moiyadi, A.; Gupta, T.; Jalali, R.; Epari, S. Pilocytic astrocytomas: BRAFV600E and BRAF fusion expression patterns in pediatric and adult age groups. Child’s Nerv. Syst. 2019, 35, 1525–1536. [Google Scholar] [CrossRef]
- Berlanga, P.; Vicente, M.L.; Cañete, A.; Alberich, C.; Castel, V. Cancer in children and adolescents in Spain: Incidence, treatment setting and provider specialty. Clin. Transl. Oncol. 2016, 18, 27–32. [Google Scholar] [CrossRef]
- Scheithauer, B.W. Development of the WHO Classification of Tumors of the Central Nervous System: A historical perspective. Brain. Pathol. 2009, 19, 551–564. [Google Scholar] [CrossRef]
- Cooperative Multicenter Study for Children and Adolescents with Low Grade Glioma; SIOP-LGG 2004 (RG_09-201). EudraCT number 2005-005377-29. Available online: https://www.clinicaltrialsregister.eu/ctr-search/search?query=2005-005377-29 (accessed on 15 December 2022).
- Gilles, F.H.; Tavare, C.J.; Becker, L.E.; Burger, P.C.; Yates, A.J.; Pollack, I.F.; Finlay, J.L. Pathologist interobserver variability of histologic features in childhood brain tumours: Results from the CCG-945 study. Pediatr. Dev. Pathol. 2008, 11, 108–117. [Google Scholar] [CrossRef]
- Girardi, F.; Rous, B.; Stiller, C.A.; Gatta, G.; Fersht, N.; Storm, H.H.; Rodrigues, J.R.; Herrmann, C.; Marcos-Gragera, R.; Peris-Bonet, R.; et al. The histology of brain tumors for 67,331 children and 671,085 adults diagnosed in 60 countries during 2000–2014: A global, population-based study (CONCORD-3). Neuro Oncol. 2021, 23, 1765–1776. [Google Scholar] [CrossRef]


| Registry | Incidence Analysis | Survival Analysis (Period of Incidence: 1991–2005) | ||||||||||||
|---|---|---|---|---|---|---|---|---|---|---|---|---|---|---|
| Period | Period Length (Years) | Person-Years | n | Non-Malignant (%) | MV (%) | n | Non-Malignant (%) | Pilocytic (%) | Glioma (%) | Lethal (%) | IIIf (%) | Astrocytoma NOS (%) | Follow-Up ≥ 5 Years (%) | |
| 0–14 years | ||||||||||||||
| Albacete | 1991–2007 | 17 | 1,067,452 | 19 | 0.0 | 84.2 | 15 | 0.0 | 0.0 | 13.3 | 13.3 | 0.0 | 33.3 | 93.3 |
| Asturias | 1983–2007 | 25 | 3,859,144 | 92 | 18.5 | 83.7 | 49 | 28.6 | 22.4 | 16.3 | 2.0 | 2.0 | 16.3 | 100.0 |
| Balearic Is * | 1988–2007 | 20 | 1,955,526 | 62 | 24.2 | 79.0 | 49 | 28.6 | 18.4 | 6.1 | 4.1 | 16.3 | 14.3 | 98.0 |
| Basque Country | 1986–2007 | 22 | 6,715,925 | 267 | 30.3 | 80.5 | 172 | 34.3 | 12.8 | 2.3 | 4.1 | 19.2 | 14.5 | 100.0 |
| Girona | 1983–2007 | 25 | 2,336,906 | 89 | 27.0 | 87.6 | 57 | 29.8 | 15.8 | 14.0 | 5.3 | 5.3 | 15.8 | 93.0 |
| Granada | 1985–2007 | 23 | 3,719,973 | 87 | 25.3 | 82.8 | 54 | 27.8 | 24.1 | 1.9 | 3.7 | 14.8 | 11.1 | 100.0 |
| Murcia | 1983–2007 | 25 | 5,792,723 | 139 | 0.0 | 86.3 | 97 | 0.0 | 0.0 | 10.3 | 3.1 | 4.1 | 29.9 | 100.0 |
| Navarre | 1983–2007 | 25 | 2,207,823 | 81 | 21.0 | 82.7 | 47 | 21.3 | 17.0 | 10.6 | 14.9 | 6.4 | 12.8 | 100.0 |
| Tarragona | 1983–2007 | 25 | 2,531,824 | 64 | 15.6 | 82.8 | 29 | 17.2 | 17.2 | 3.4 | 0.0 | 20.7 | 20.7 | 100.0 |
| Valencian Community | 1983–2007 | 25 | 18,101,912 | 624 | 23.1 | 79.3 | 403 | 24.8 | 8.9 | 9.2 | 1.7 | 4.7 | 27.5 | 100.0 |
| Zaragoza | 1983–2006 | 24 | 3,163,796 | 111 | 26.1 | 96.4 | - | - | - | - | - | - | - | - |
| All registries | 51,453,004 | 1635 | 22.0 | 82.5 | 972 | 24.1 | 11.6 | 8.1 | 3.5 | 8.7 | 21.8 | 99.4 | ||
| 15–19 years | ||||||||||||||
| Albacete | 1991–2007 | 17 | 432,893 | 7 | 28.6 | 57.1 | 7 | 28.6 | 0.0 | 0.0 | 14.3 | 14.3 | 28.6 | 100.0 |
| Asturias | 1983–2007 | 25 | 1,774,905 | 30 | 43.3 | 90.0 | 16 | 37.5 | 12.5 | 0.0 | 0.0 | 6.3 | 37.5 | 100.0 |
| Balearic Is * | 1988–2007 | 20 | 798,482 | 18 | 22.2 | 94.4 | 15 | 20.0 | 20.0 | 0.0 | 40.0 | 6.7 | 20.0 | 100.0 |
| Basque Country | 1986–2007 | 22 | 3,124,106 | 93 | 43.0 | 81.7 | 66 | 43.9 | 19.7 | 3.0 | 6.1 | 12.1 | 12.1 | 100.0 |
| Girona | 1983–2007 | 25 | 905,361 | 20 | 25.0 | 75.0 | 17 | 23.5 | 17.6 | 5.9 | 5.9 | 23.5 | 17.6 | 88.2 |
| Granada | 1985–2007 | 23 | 1,500,706 | 25 | 36.0 | 88.0 | 15 | 33.3 | 20.0 | 0.0 | 20.0 | 13.3 | 20.0 | 100.0 |
| Murcia | 1983–2007 | 25 | 2,257,232 | 49 | 0.0 | 93.9 | 28 | 0.0 | 0.0 | 14.3 | 3.6 | 10.7 | 35.7 | 100.0 |
| Navarre | 1983–2007 | 25 | 917,627 | 26 | 38.5 | 80.8 | 19 | 52.6 | 5.3 | 0.0 | 0.0 | 10.5 | 15.8 | 100.0 |
| Tarragona | 1983–2007 | 25 | 1,007,151 | 25 | 0.0 | 76.0 | 16 | 0.0 | 0.0 | 0.0 | 6.3 | 18.8 | 43.8 | 100.0 |
| Valencian Community | - | - | - | - | - | - | - | - | - | - | - | - | - | - |
| Zaragoza | 1983–2003 | 21 | 1,250,000 | 35 | 28.6 | 85.7 | - | - | - | - | - | - | - | - |
| All registries | 13,968,463 | 328 | 28.4 | 84.5 | 199 | 29.6 | 12.6 | 3.5 | 8.5 | 12.6 | 22.6 | 99.0 | ||
| ICCC-3 CNS Group | Age 0–4 | Age 5–9 | Age 10–14 | Age 15–19 | Age 0–14 | Age 0–19 | ||||||
|---|---|---|---|---|---|---|---|---|---|---|---|---|
| N | % | N | % | N | % | N | % | N | % | N | % | |
| IIIa. Ependymomas and choroid plexus tumours | 81 | 14.2 | 44 | 7.9 | 38 | 7.5 | 20 | 6.1 | 163 | 10.0 | 183 | 9.3 |
| IIIb. Astrocytomas | 231 | 40.5 | 221 | 39.8 | 230 | 45.2 | 145 | 44.2 | 682 | 41.7 | 827 | 42.1 |
| IIIc. Intracranial and intraspinal embryonal tumours | 133 | 23.3 | 135 | 24.3 | 77 | 15.1 | 40 | 12.2 | 345 | 21.1 | 385 | 19.6 |
| IIId. Other gliomas | 61 | 10.7 | 59 | 10.6 | 50 | 9.8 | 26 | 7.9 | 170 | 10.4 | 196 | 10.0 |
| IIIe. Other specified intracranial and intraspinal neoplasms | 25 | 4.4 | 46 | 8.3 | 65 | 12.8 | 52 | 15.9 | 136 | 8.3 | 188 | 9.6 |
| IIIf. Unspecified intracranial and intraspinal neoplasms | 40 | 7.0 | 50 | 9.0 | 49 | 9.6 | 45 | 13.7 | 139 | 8.5 | 184 | 9.4 |
| III. All CNS | 571 | 100.0 | 555 | 100.0 | 509 | 100.0 | 328 | 100.0 | 1635 | 100.0 | 1963 | 100.0 |
| ICCC-3 CNS Group | Age-Specific Rates | ASRws | |||||
|---|---|---|---|---|---|---|---|
| 0–4 | 5–9 | 10–14 | 0–14 | 15–19 | 0–14 | 15–19 | |
| IIIa. Ependymomas and choroid plexus tumours | 5.3 | 2.6 | 2.0 | 3.2 | 1.4 | 3.5 | 3.0 |
| IIIb. Astrocytomas | 15.0 | 13.1 | 12.0 | 13.3 | 10.4 | 13.5 | 12.8 |
| IIIc. Intracranial and intraspinal embryonal tumours | 8.6 | 8.0 | 4.0 | 6.7 | 2.9 | 7.1 | 6.1 |
| IIId. Other gliomas | 4.0 | 3.5 | 2.6 | 3.3 | 1.9 | 3.4 | 3.1 |
| IIIe. Other specified intracranial and intraspinal neoplasms | 1.6 | 2.7 | 3.4 | 2.6 | 3.7 | 2.5 | 2.8 |
| IIIf. Unspecified intracranial and intraspinal neoplasms | 2.6 | 3.0 | 2.6 | 2.7 | 3.2 | 2.7 | 2.8 |
| III. All CNS | 37.1 | 32.9 | 26.5 | 31.8 | 23.5 | 32.7 | 30.6 |
| Diagnostic Subgroup | Age Group | Log-Rank (p) | |||
|---|---|---|---|---|---|
| Children | Adolescents | ||||
| n | 5-y Observed Survival (%) (95% CI) | n | 5-y Observed Survival (%) (95% CI) | ||
| IIIa. Ependymomas and choroid plexus tumours | 84 | 49 (38; 60) | 16 | 75 (54; 96) | 0.071 |
| IIIb. Astrocytomas | 416 | 83 (79; 87) | 98 | 71 (62; 80) | 0.010 |
| IIIc. Embryonal | 201 | 48 (41; 55) | 22 | 46 (25; 66) | 0.926 |
| IIId. Other gliomas | 98 | 45 (35; 55) | 11 | 64 (35; 92) | 0.278 |
| IIIe. Other specified | 88 | 78 (70; 87) | 27 | 85 (72; 99) | 0.436 |
| IIIf. Unspecified | 85 | 47 (37; 58) | 25 | 29 (11; 48) | 0.063 |
| III. Total CNS | 972 | 65 (62; 68) | 199 | 65 (58; 72) | 0.952 |
| Log-rank (p) | <0.001 | <0.001 | |||
| Cohort of Diagnosis | Age Group | Log-Rank (p) | ||||
|---|---|---|---|---|---|---|
| Children | Adolescents | |||||
| n | 5-y Survival (%) (95% CI) | n | 5-y Observed Survival (%) (95% CI) | |||
| Observed | Standardised | |||||
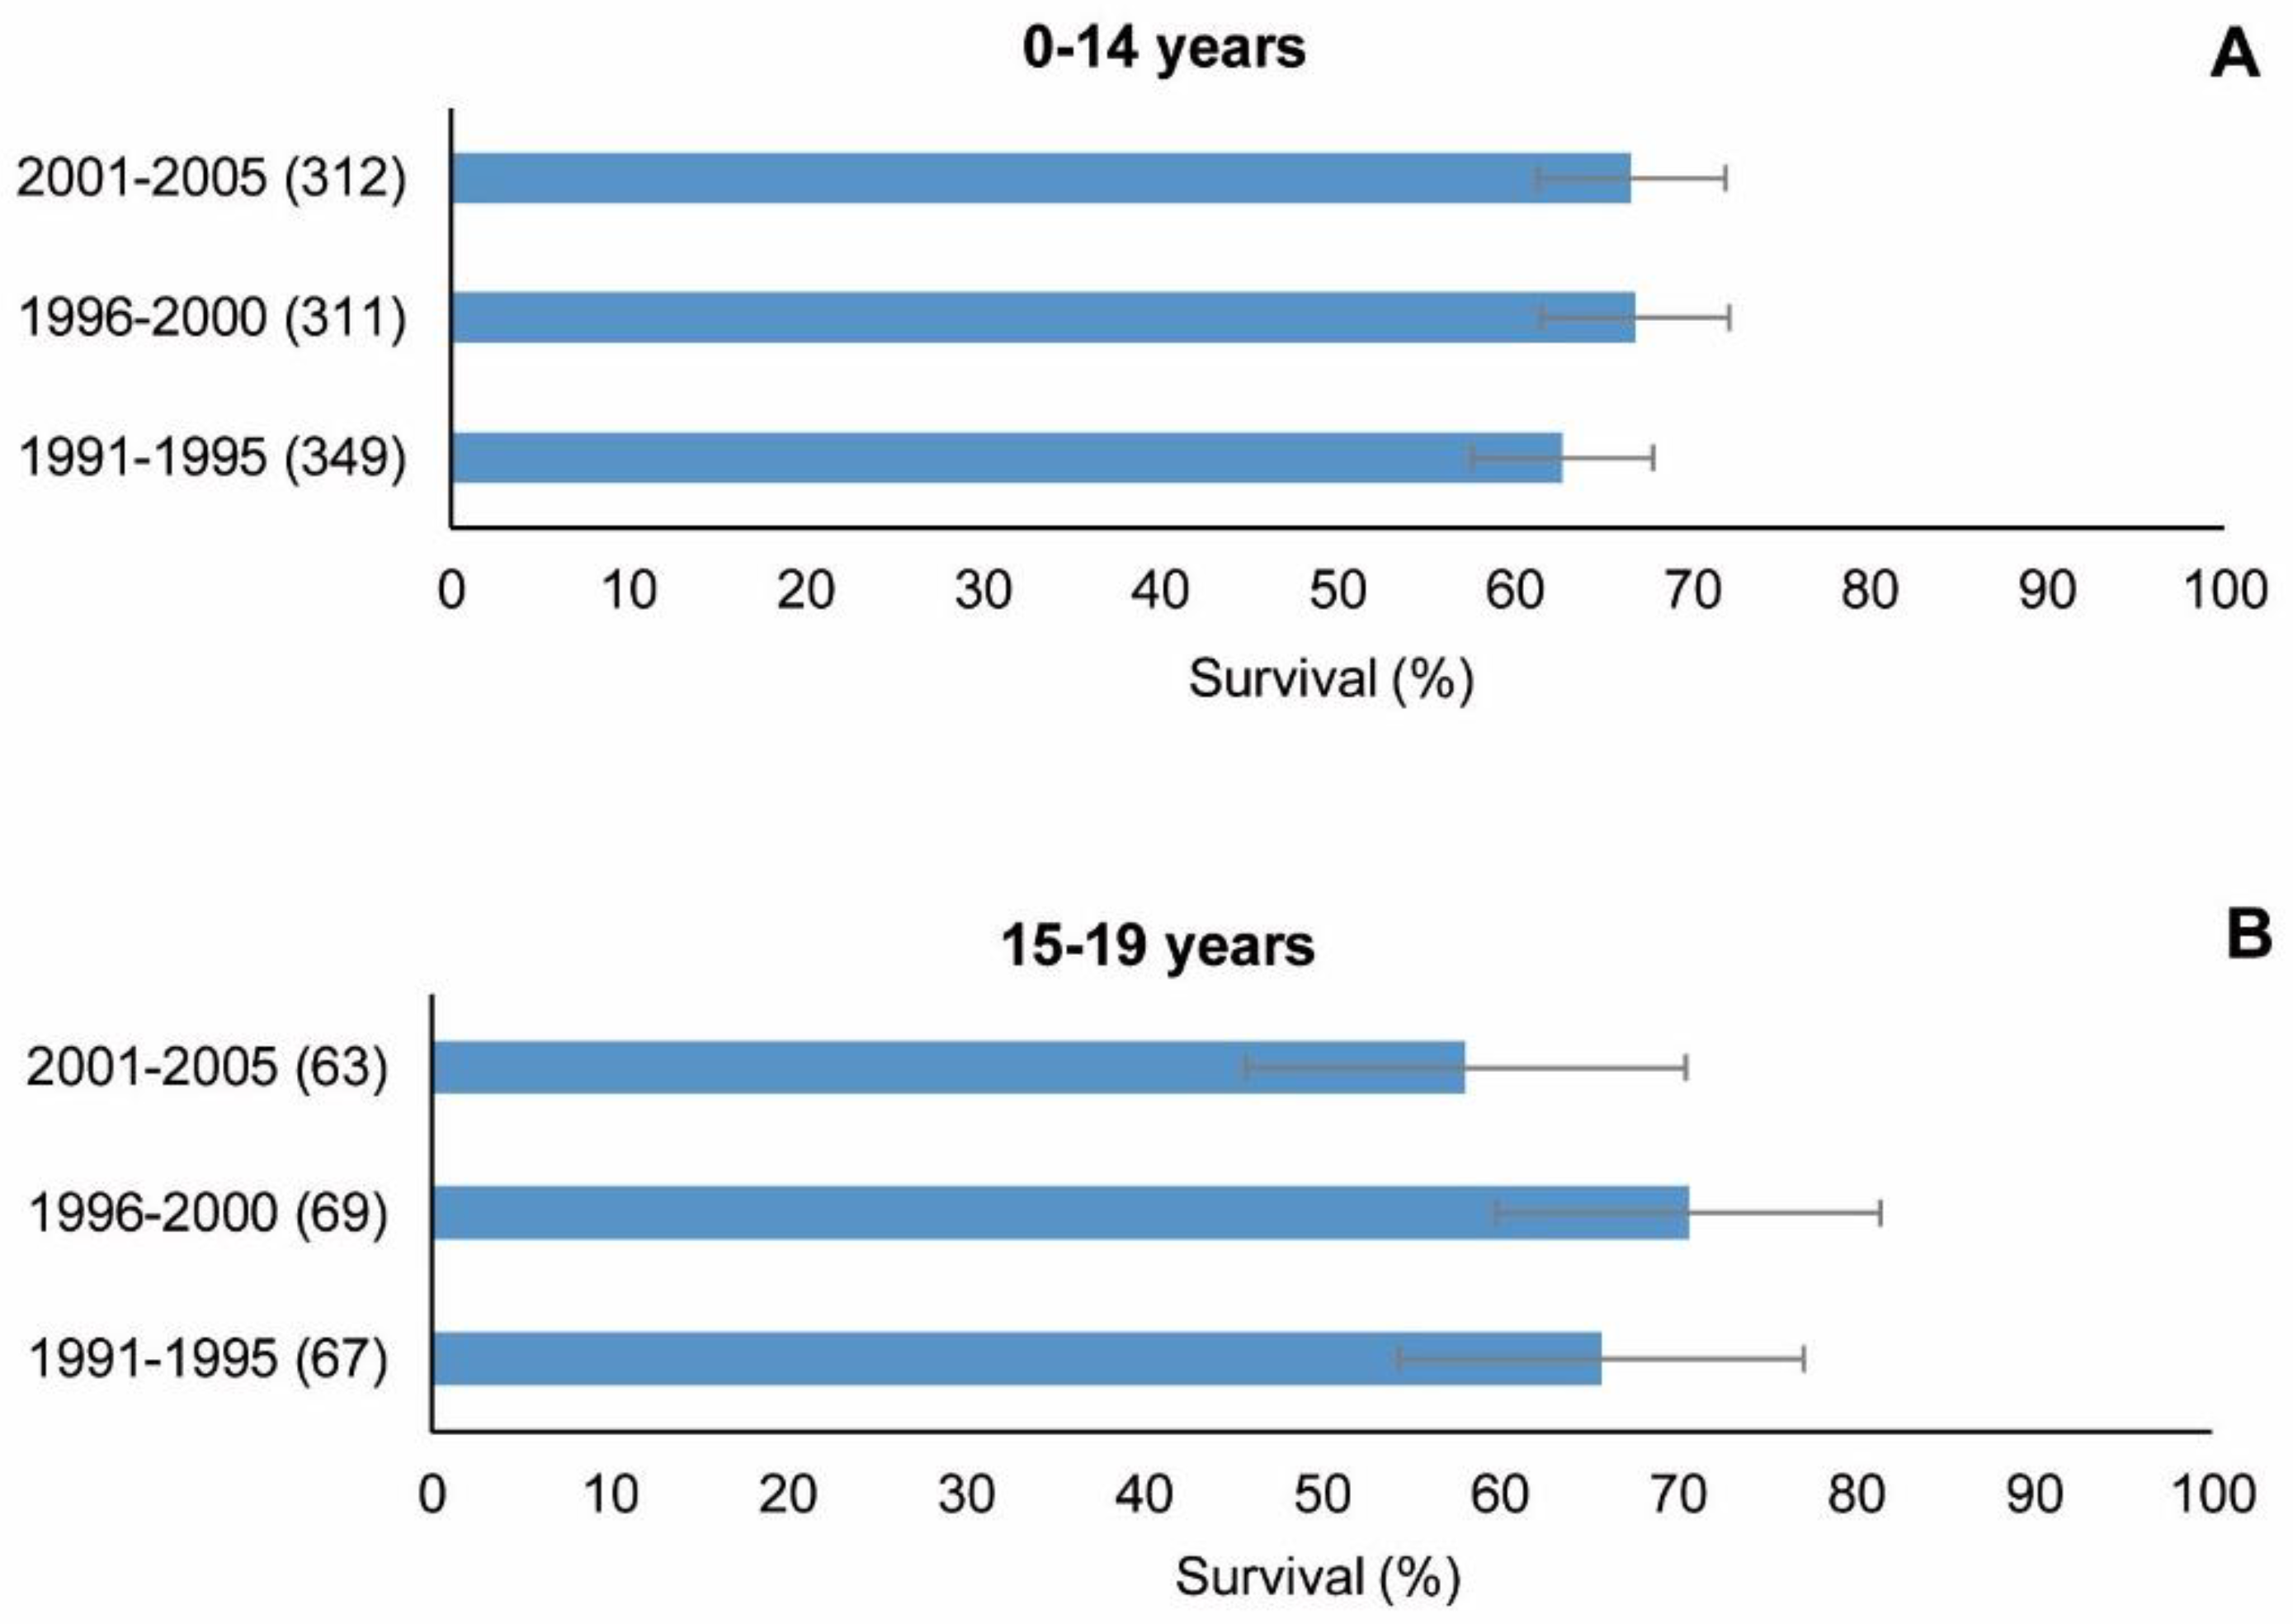
| 1991–1995 | 349 | 63 (58; 68) | 62 (57; 67) | 67 | 66 (54; 77) | 0.601 |
| 1996–2000 | 311 | 67 (62; 72) | 67 (62; 72) | 69 | 71 (60; 81) | 0.589 |
| 2001–2005 | 312 | 67 (61; 72) | 67 (62; 72) | 63 | 58 (46; 70) | 0.202 |
| Total | 972 | 199 | ||||
| Log-rank trend (p) | 0.260 | 0.380 | ||||
| Standardised survival trend APC (95% CI) | 4 (−19; 34) | |||||
| Diagnostic Subgroup and Selected Tumours | n | Standardised Survival Trend APC (95% CI) |
|---|---|---|
| III. Total CNS | 972 | 4 (−19; 34) |
| IIIa. Ependymomas and choroid plexus tumours | 84 | 8 (−26; 58) |
| IIIb. Astrocytomas | 416 | 6 (−15; 31) |
| IIIc. Embryonal | 201 | 4 (−49; 112) |
| IIId. Other gliomas | 98 | −14 (−87; 455) |
| IIIe. Other specified | 201 | 4 (−60; 170) |
| IIIf. Unspecified | 85 | 4 (−37; 72) |
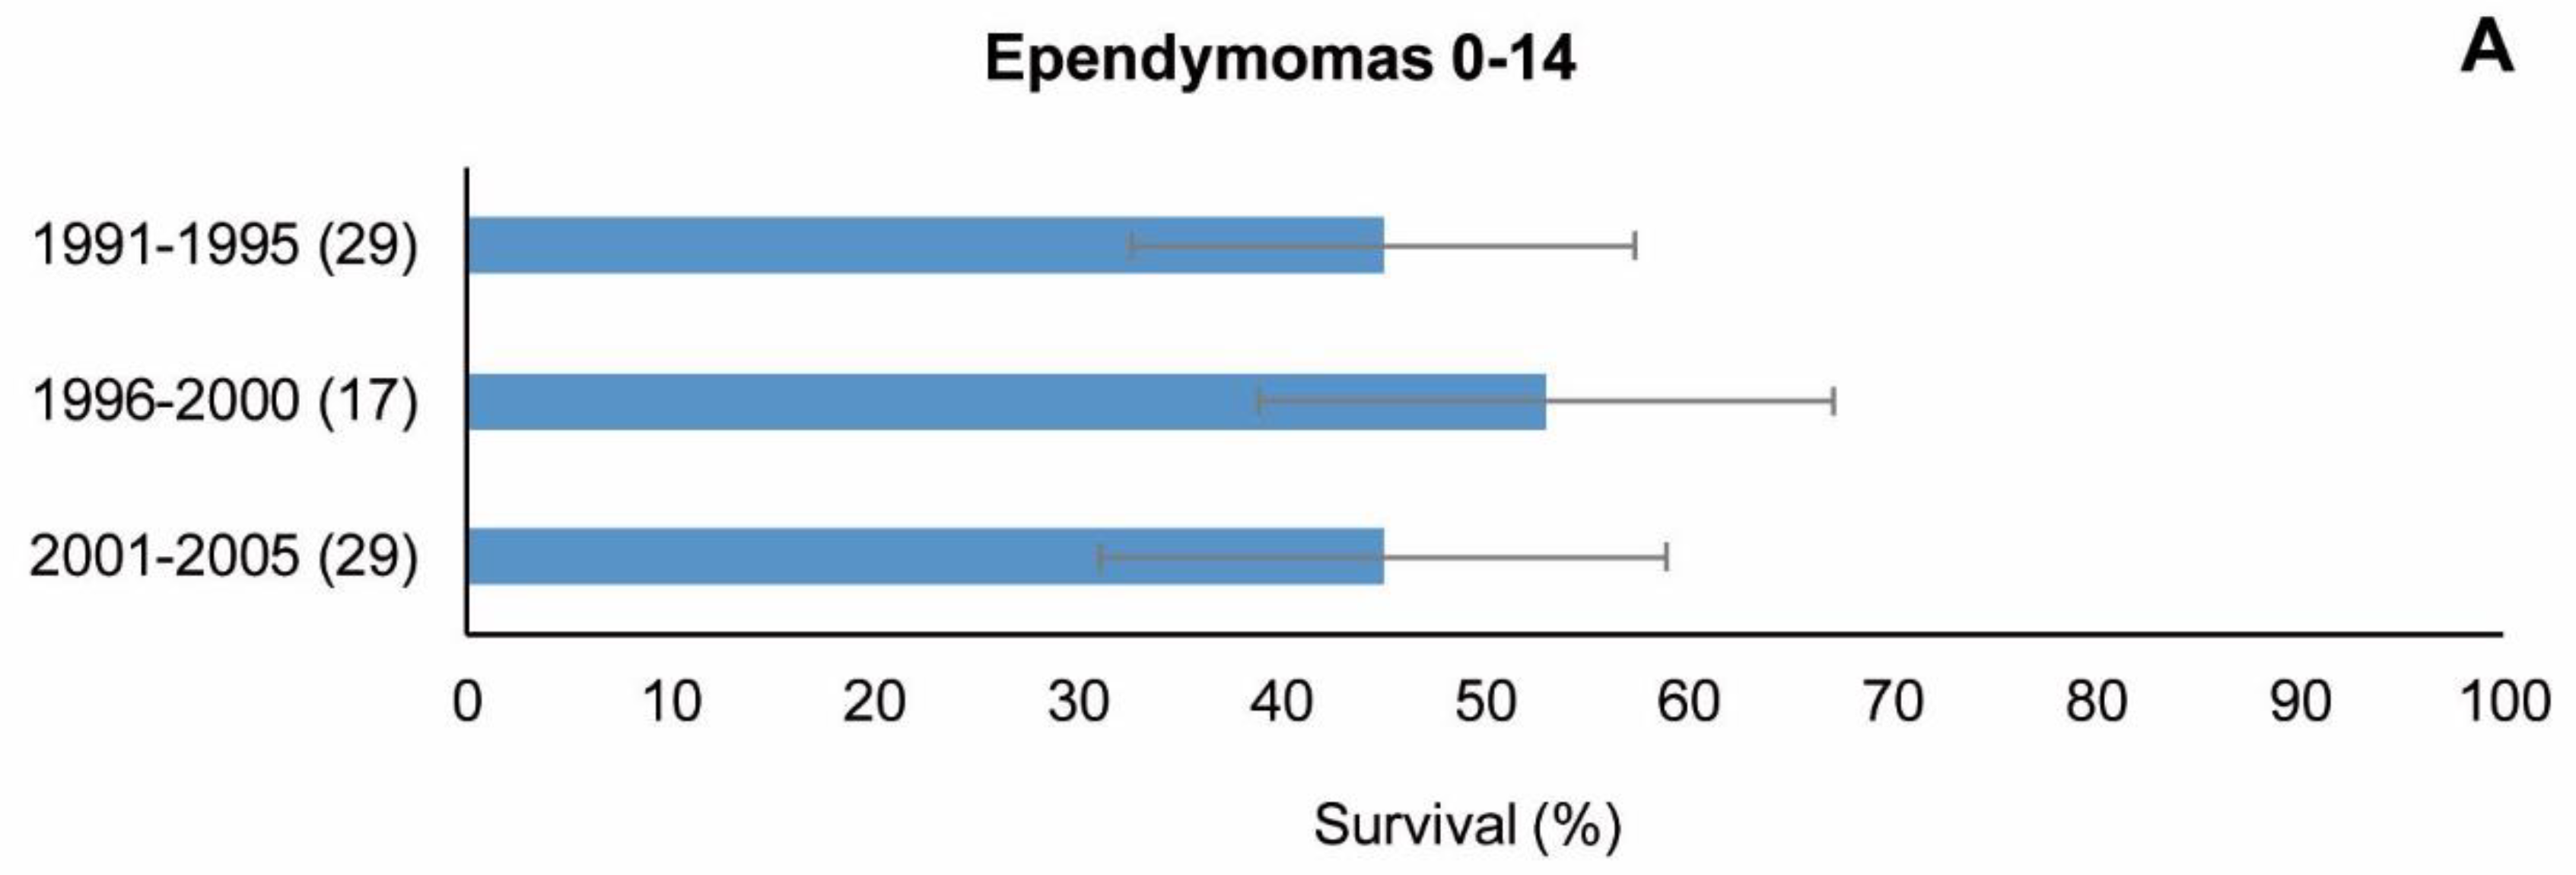
| Ependymomas a | 75 | 11 (−23; 62) |
| Medulloblastomas b | 160 | 11 (−32; 80) |
| Pilocytic astrocytoma c | 113 | −1 (−19; 21) |
| Astrocytoma NOS d | 212 | 6 (−8; 22) |
| Malignant e | 738 | 1 (−8; 11) |
| Non-malignant f | 234 | 4 ^ (2; 6) |
| Gliomas h | 79 | −14 (−89; 581) |
| Cohort of Diagnosis | Age Group | Log-Rank (p) | ||||
|---|---|---|---|---|---|---|
| Children | Adolescents | |||||
| n | 5-y Survival (%) (95% CI) | n | 5-y Observed Survival (%) (95% CI) | |||
| Observed | Standardised | |||||
| 1991–1995 | 145 | 80 (73; 86) | 80 (73; 86) | 40 | 73 (59; 86) | 0.370 |
| 1996–2000 | 148 | 81 (75; 87) | 82 (75; 88) | 30 | 76 (61; 91) | 0.520 |
| 2001–2005 | 123 | 89 (83; 94) | 88 (83; 94) | 28 | 64 (46; 82) | <0.001 |
| Total | 416 | |||||
| Log-rank trend (p) | 0.133 | 0.650 | ||||
| Standardised survival trend APC (95% CI) | 6 (−15; 31) | |||||
| Age Group | Cohort of Diagnosis | Log-Rank Trend (p) | |||||
|---|---|---|---|---|---|---|---|
| 1991–1995 | 1996–2000 | 2001–2005 | |||||
| n | 5-y Observed Survival (%) (95% CI) | n | 5-y Observed Survival (%) (95% CI) | n | 5-y Observed Survival (%) (95% CI) | ||
| 0 | 2 | 2 | 2 | ||||
| 1–4 | 20 | 35 (14; 56) | 19 | 42 (20; 64) | 18 | 39 (16; 61) | 0.967 |
| 5–9 | 24 | 50 (30; 70) | 17 | 47 (23; 71) | 20 | 60 (38; 82) | 0.745 |
| 10–14 | 17 | 65 (42; 87) | 10 | 80 (55; 100 *) | 9 | ||
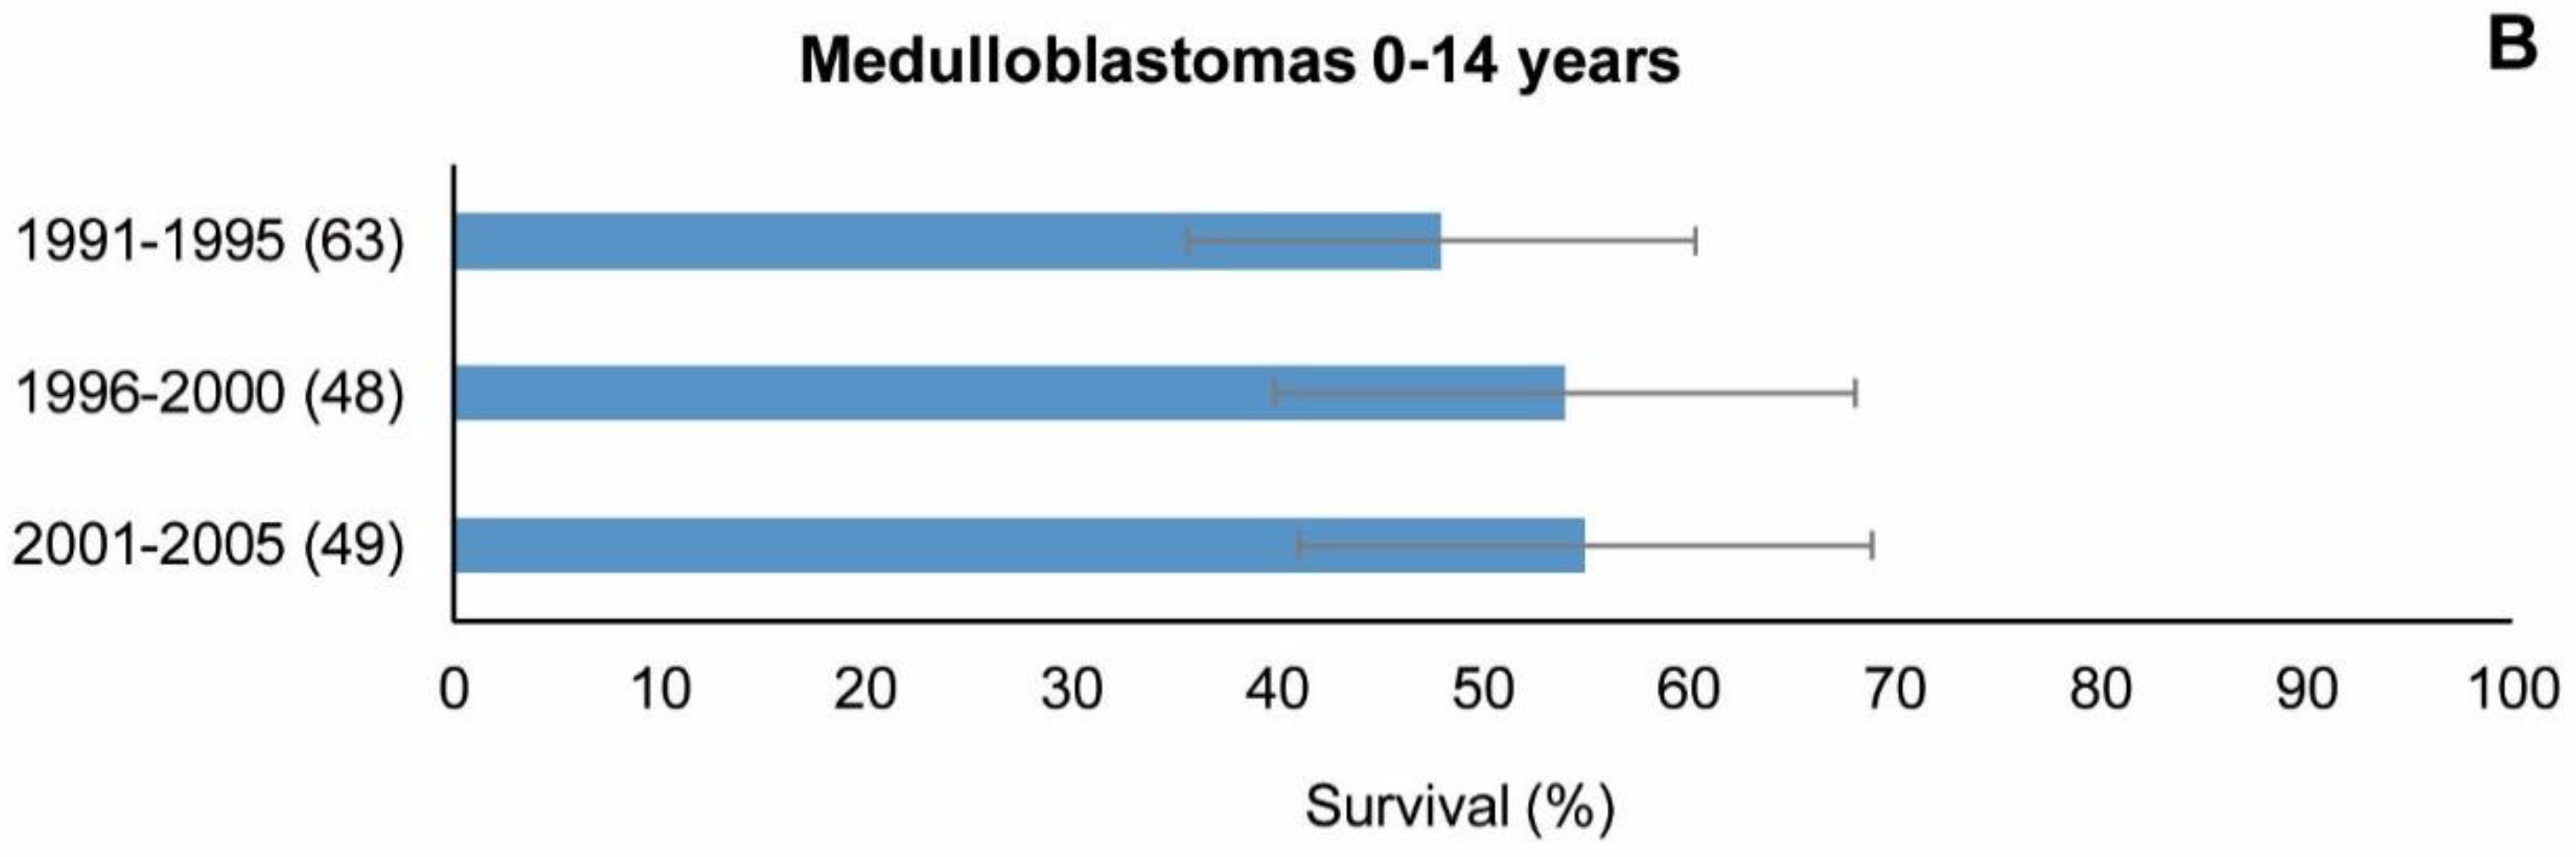
| 0–14 | 63 | 48 (35; 60) | 48 | 54 (40; 68) | 49 | 55 (41; 69) | 0.662 |
| Standardised survival 0–14 years | 46(34;58) | 55 (41; 68) | 57 (44; 69) | APC (95% CI) | |||
| 11 (−32; 80) | |||||||
| Diagnostic Group | Children | Adolescents | Log-Rank (p) | ||
|---|---|---|---|---|---|
| n | 5-y Observed Survival (%) (95% CI) | n | 5-y Observed Survival (%) (95% CI) | ||
| Malignant a | 738 | 58 (55; 62) | 140 | 54 (46; 63) | 0.381 |
| Non-malignant b | 234 | 87 (83; 91) | 59 | 90 (82; 97) | 0.562 |
| Log-rank (p) | <0.001 | <0.001 | |||
| Diagnostic Subgroup (Group III of the ICCC-3) | 5-y Survival (%) (95%CI) | |
|---|---|---|
| Spain 2001–2005 | Europe b 2000–2007 | |
| IIIa. Ependymomas and choroid plexus tumours a | 47 (30; 64) | 70 (67; 72) |
| IIIb. Astrocytomas a | 89 (83; 94) | 80 (79; 81) |
| IIIc. Embryonal a | 49 (37; 60) | 57 (55; 59) |
| IIId. Other gliomas a | 30 (14; 46) | 46 (43; 49) |
| IIIe. Other specified a | 85 (73; 97) | 93 (91; 94) |
| IIIf. Unspecified a | 52 (32; 72) | 64 (60; 67) |
| III. Total CNS c | 66 (60; 72) d | 71 (71; 72) e |
| Behaviour | ||
| Malignant c,f | 60 (53; 66) | 57 (56; 58) |
| Non-malignant c,g | 88 (81; 95) d | 94 (94; 95) e |
Disclaimer/Publisher’s Note: The statements, opinions and data contained in all publications are solely those of the individual author(s) and contributor(s) and not of MDPI and/or the editor(s). MDPI and/or the editor(s) disclaim responsibility for any injury to people or property resulting from any ideas, methods, instructions or products referred to in the content. |
© 2023 by the authors. Licensee MDPI, Basel, Switzerland. This article is an open access article distributed under the terms and conditions of the Creative Commons Attribution (CC BY) license (https://creativecommons.org/licenses/by/4.0/).
Share and Cite
Chirlaque, M.D.; Peris-Bonet, R.; Sánchez, A.; Cruz, O.; Marcos-Gragera, R.; Gutiérrez-Ávila, G.; Quirós-García, J.R.; Almela-Vich, F.; López de Munain, A.; Sánchez, M.J.; et al. Childhood and Adolescent Central Nervous System Tumours in Spain: Incidence and Survival over 20 Years: A Historical Baseline for Current Assessment. Cancers 2023, 15, 5889. https://doi.org/10.3390/cancers15245889
Chirlaque MD, Peris-Bonet R, Sánchez A, Cruz O, Marcos-Gragera R, Gutiérrez-Ávila G, Quirós-García JR, Almela-Vich F, López de Munain A, Sánchez MJ, et al. Childhood and Adolescent Central Nervous System Tumours in Spain: Incidence and Survival over 20 Years: A Historical Baseline for Current Assessment. Cancers. 2023; 15(24):5889. https://doi.org/10.3390/cancers15245889
Chicago/Turabian StyleChirlaque, Maria D., Rafael Peris-Bonet, Antonia Sánchez, Ofelia Cruz, Rafael Marcos-Gragera, Gonzalo Gutiérrez-Ávila, José R. Quirós-García, Fernando Almela-Vich, Arantza López de Munain, Maria J. Sánchez, and et al. 2023. "Childhood and Adolescent Central Nervous System Tumours in Spain: Incidence and Survival over 20 Years: A Historical Baseline for Current Assessment" Cancers 15, no. 24: 5889. https://doi.org/10.3390/cancers15245889