
Association of MGMT Promoter and Enhancer Methylation with Genetic Variants, Clinical Parameters, and Demographic Characteristics in Glioblastoma
 , , ,
, , ,
Abstract
:Simple Summary
Abstract
1. Introduction
2. Materials and Methods
2.1. Samples and Cell Culturing
2.2. DNA Methylation Analysis
2.3. Determination of Genetic Variants and Clinical Parameters
2.4. Data Analysis and Statistics
3. Results
3.1. Clinical Parameters and Demographic Characteristics of the Patient Cohort
3.2. Methylation Status of the MGMT Promoter and Enhancers for the Patient Cohort
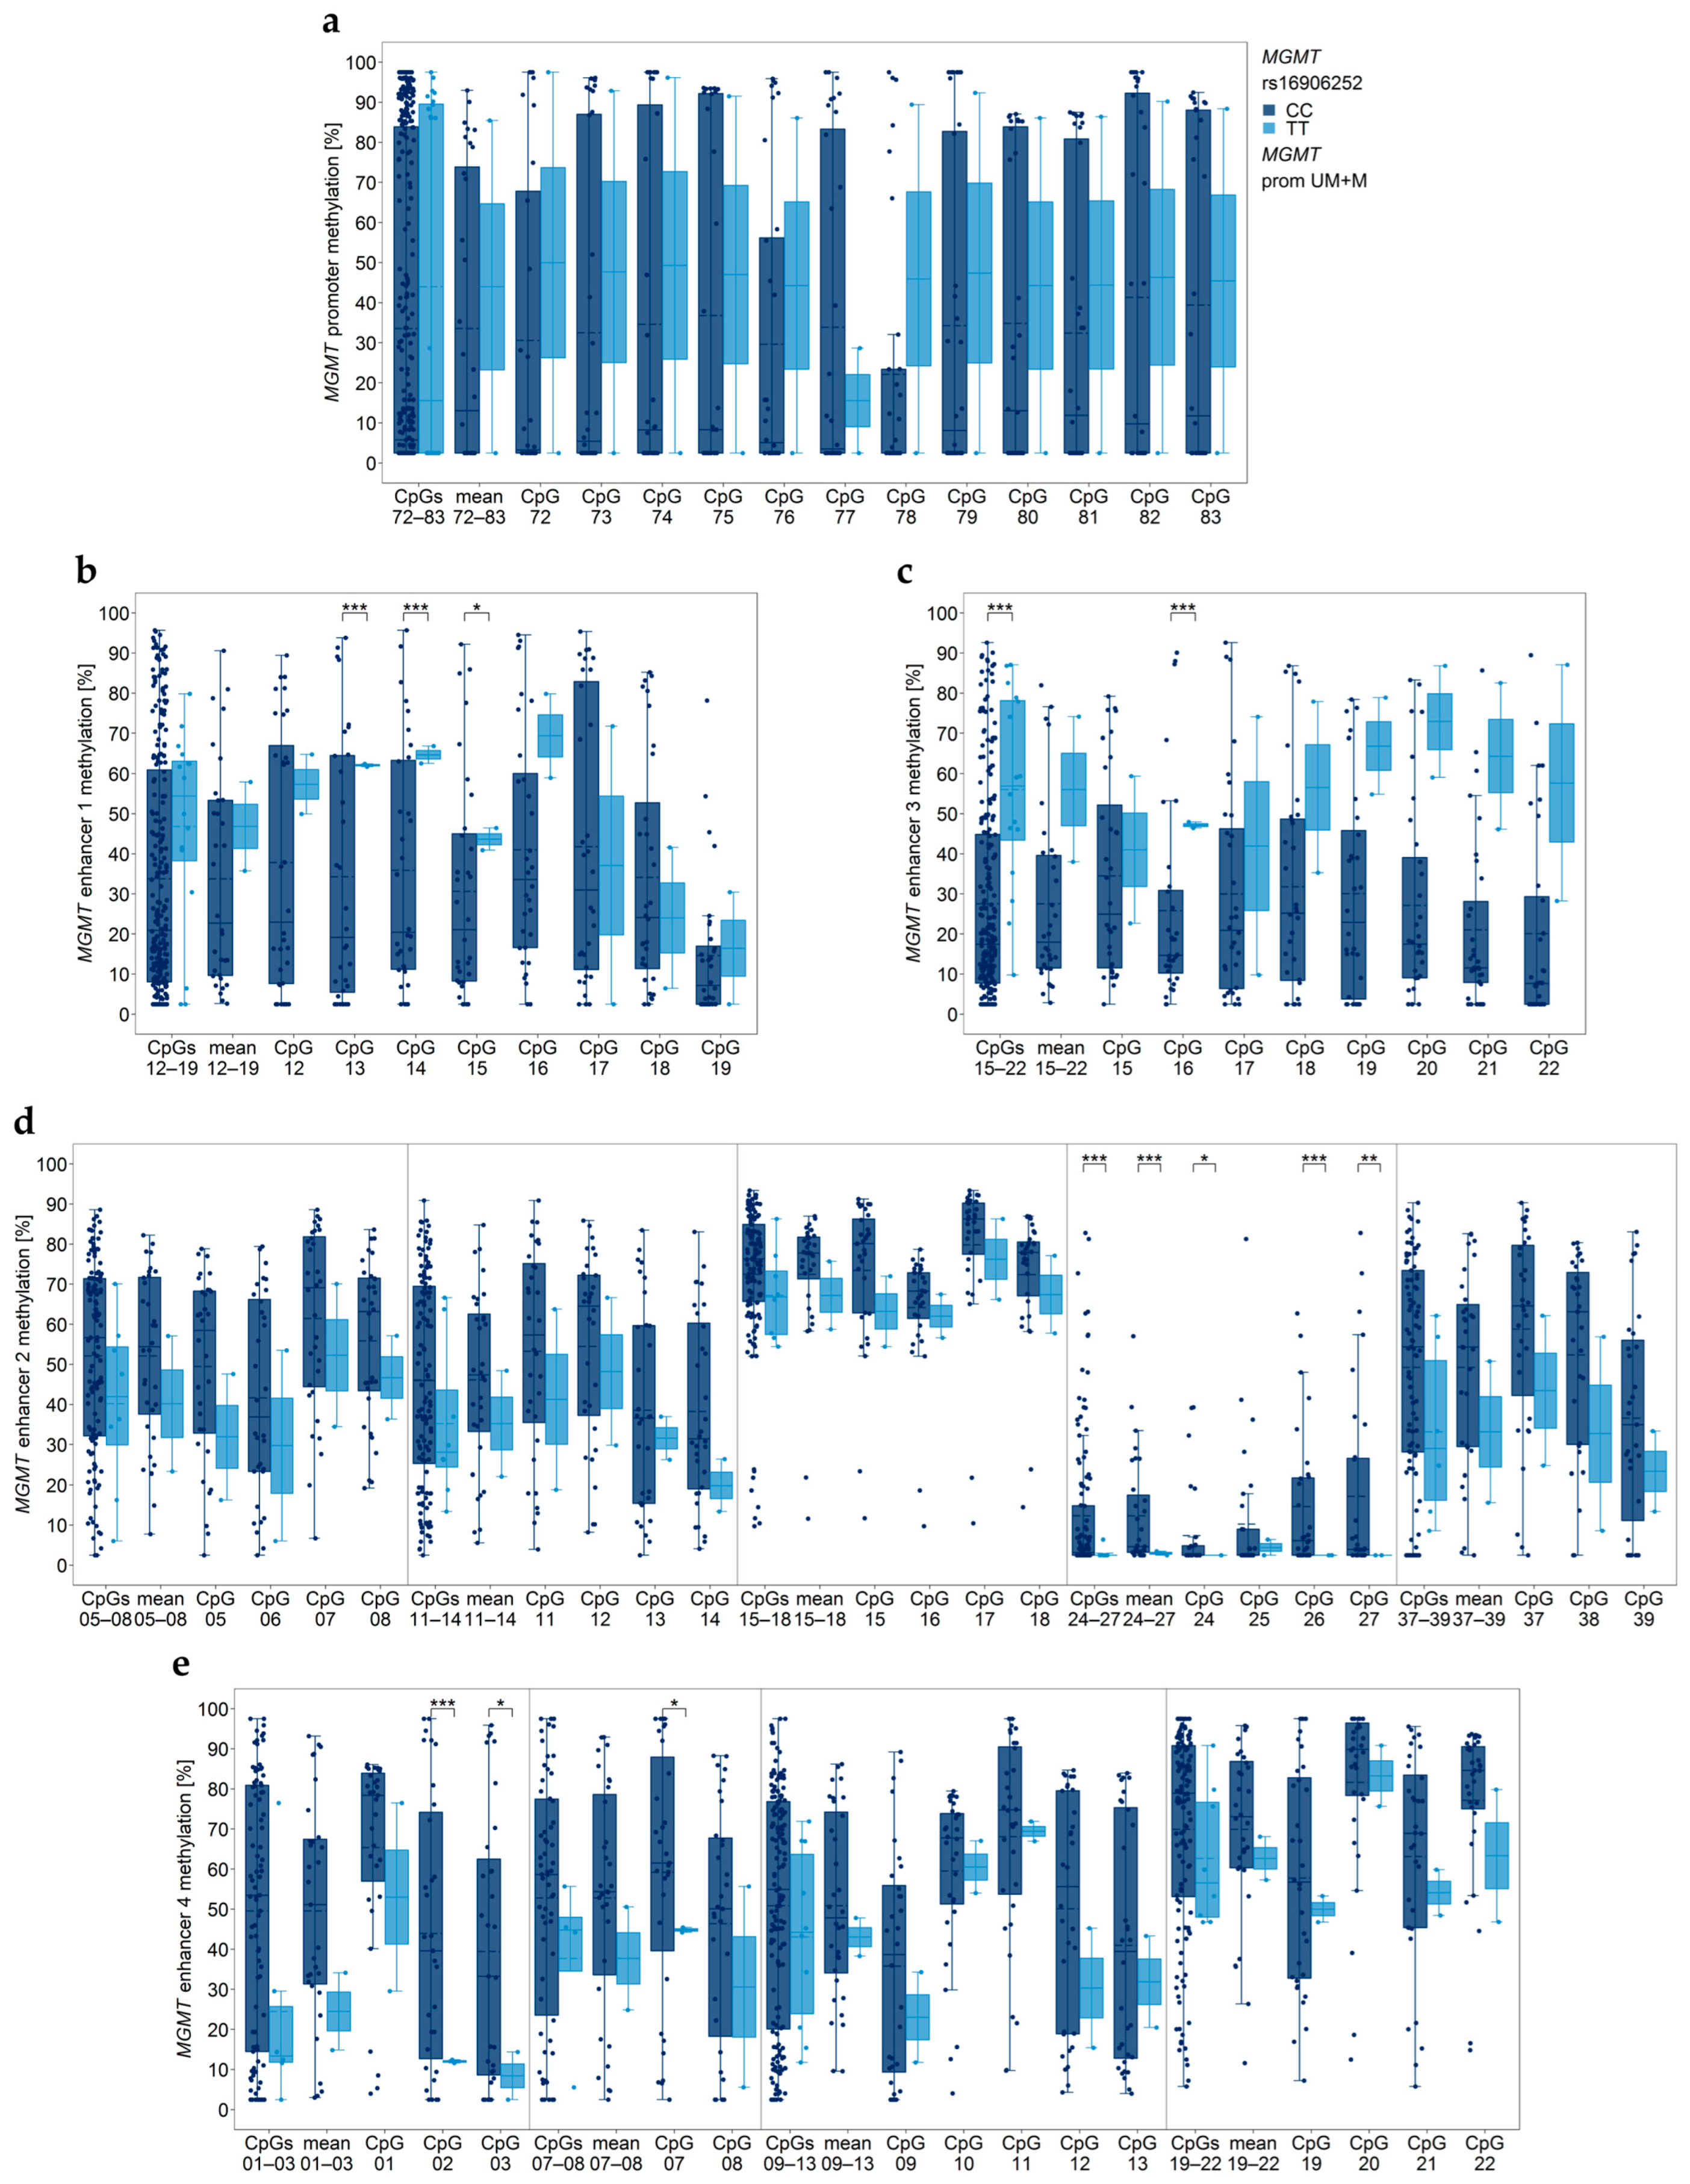
3.3. Association between MGMT Promoter/Enhancer Methylation and MGMT SNP rs16906252 C>T
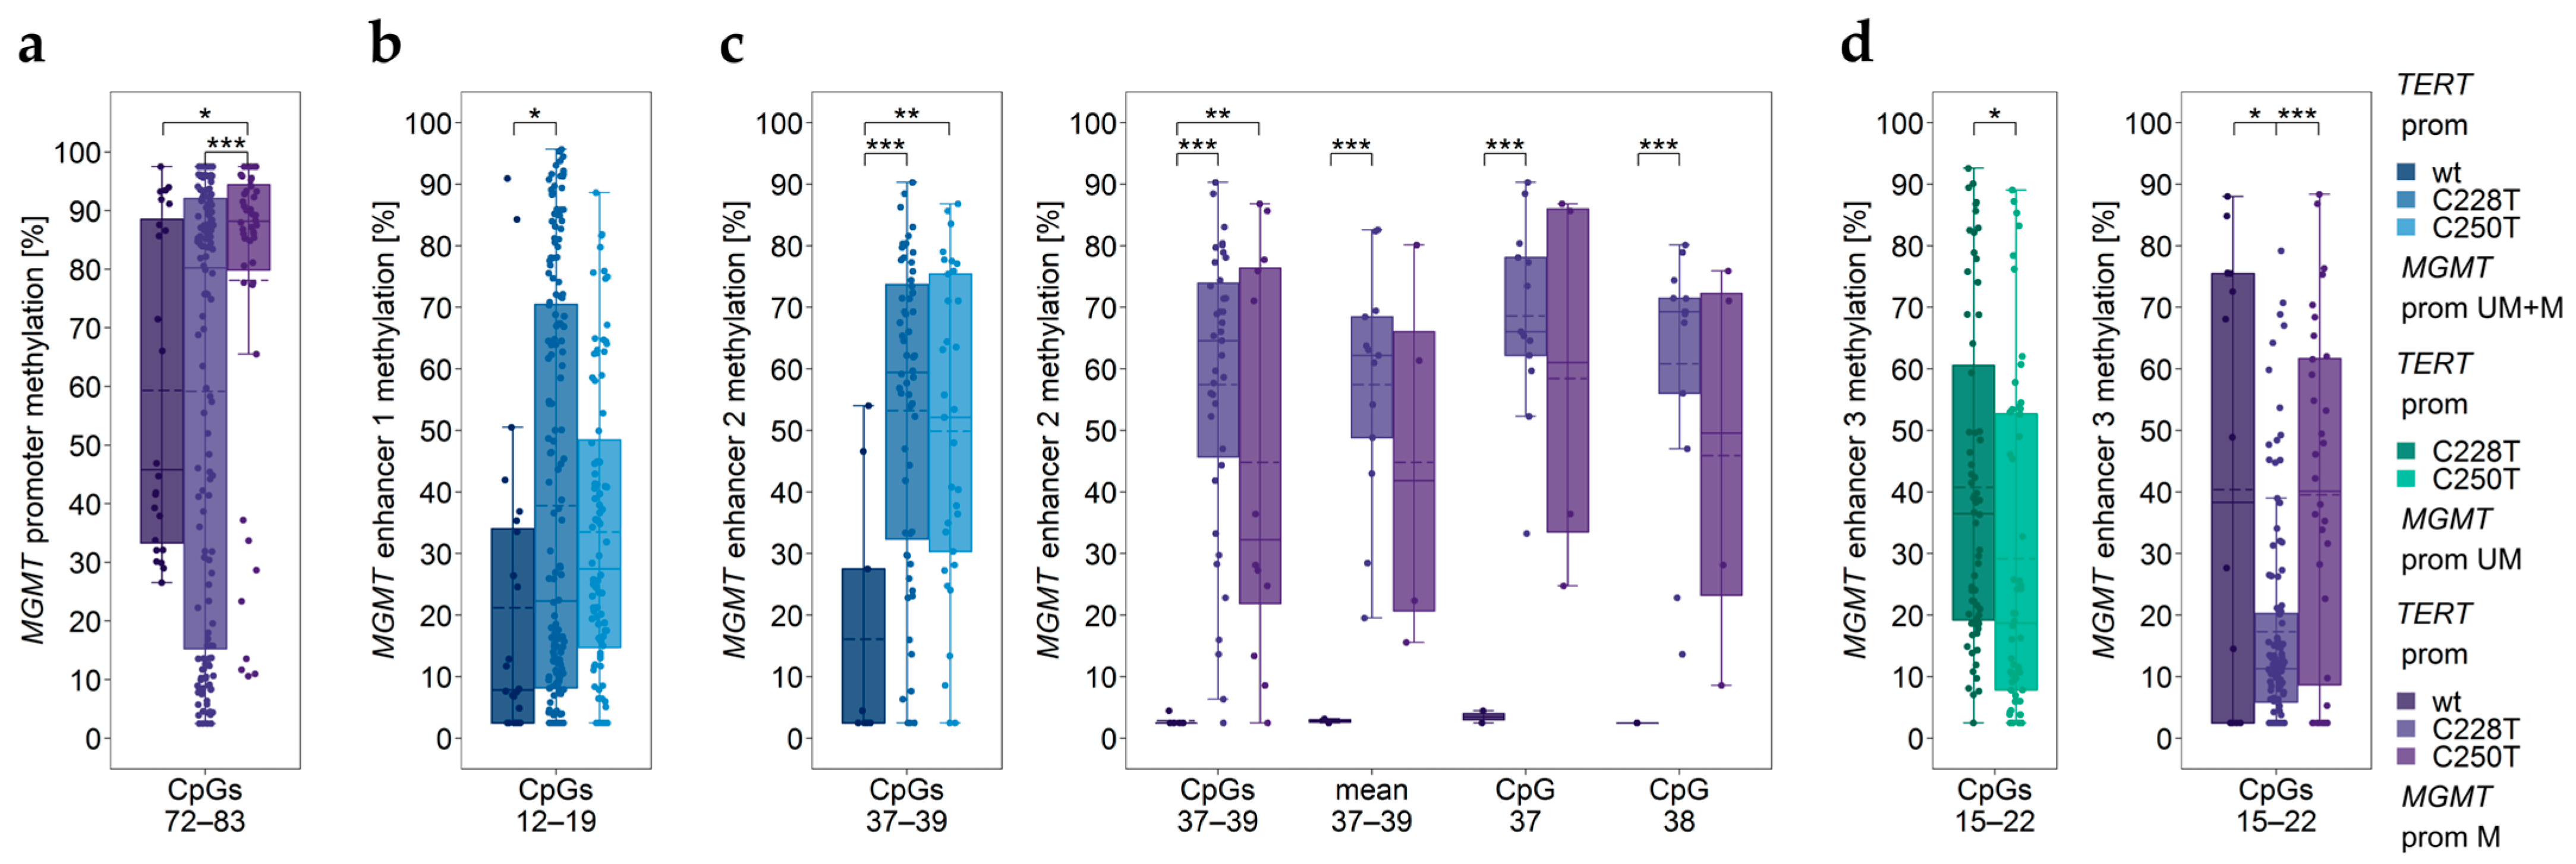
3.4. Association between MGMT Promoter/Enhancer Methylation and TERT Promoter Mutations C228T and C250T
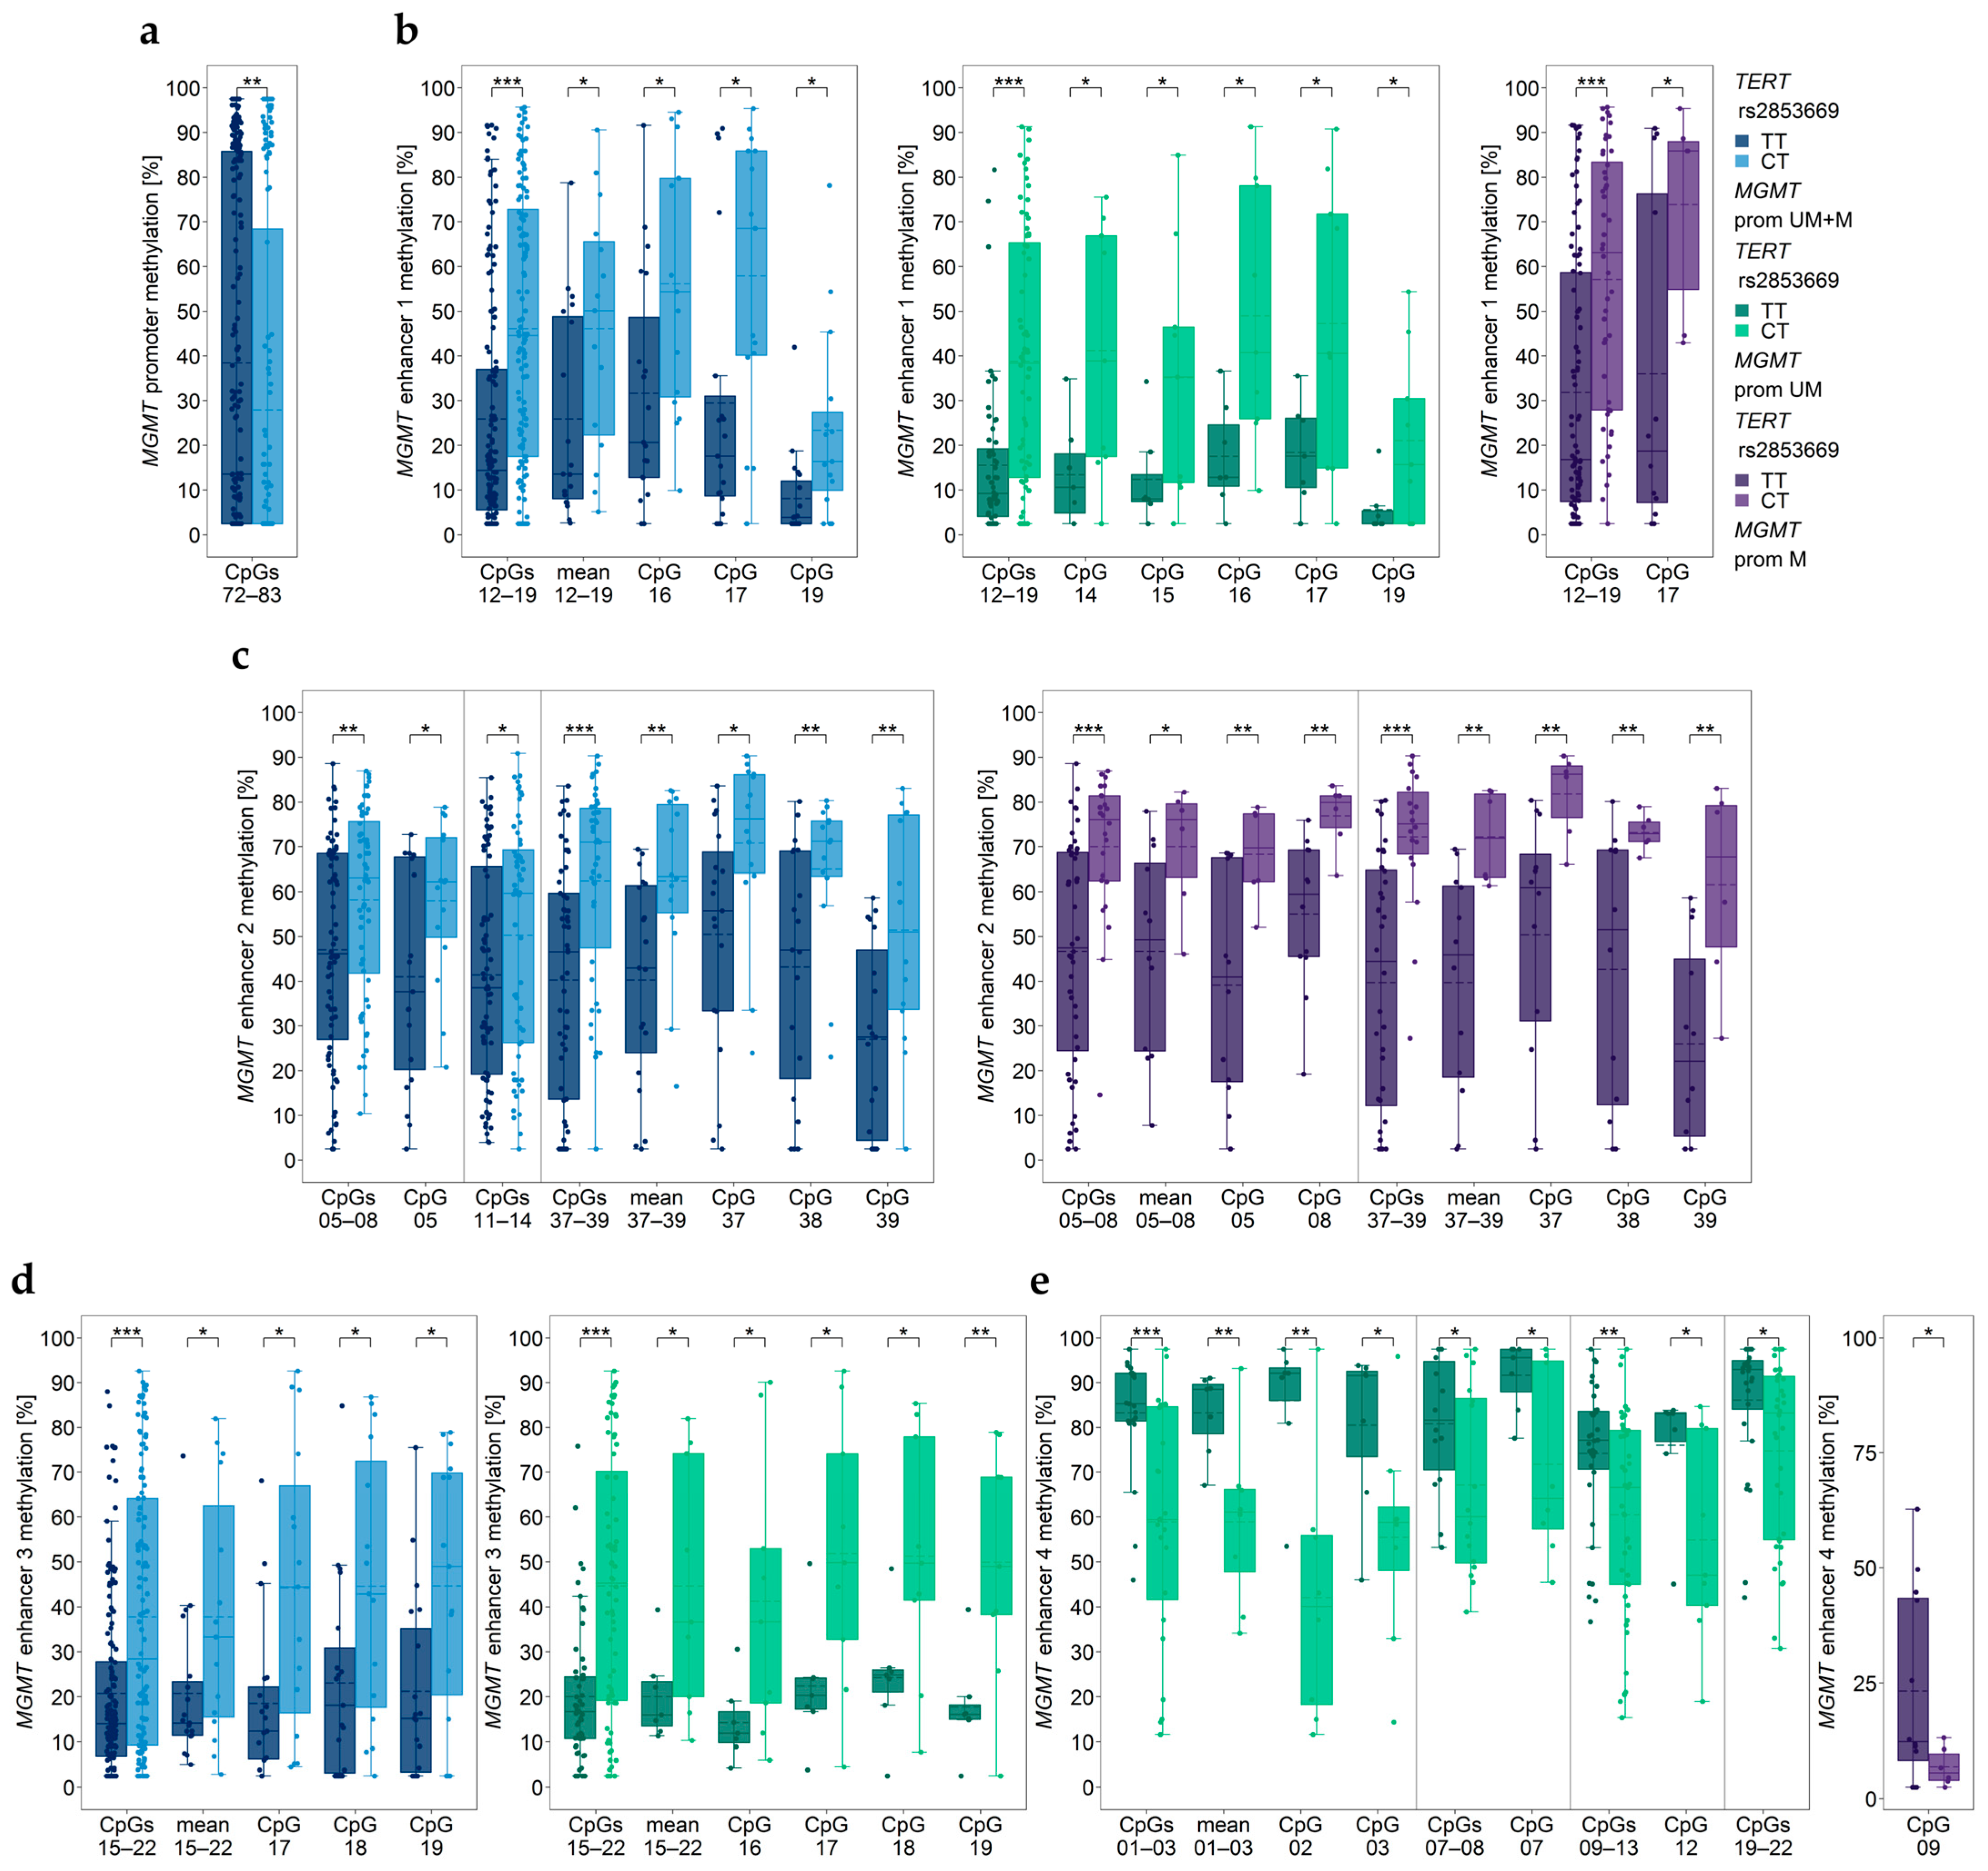
3.5. Association between MGMT Promoter/Enhancer Methylation and TERT SNP rs2853669
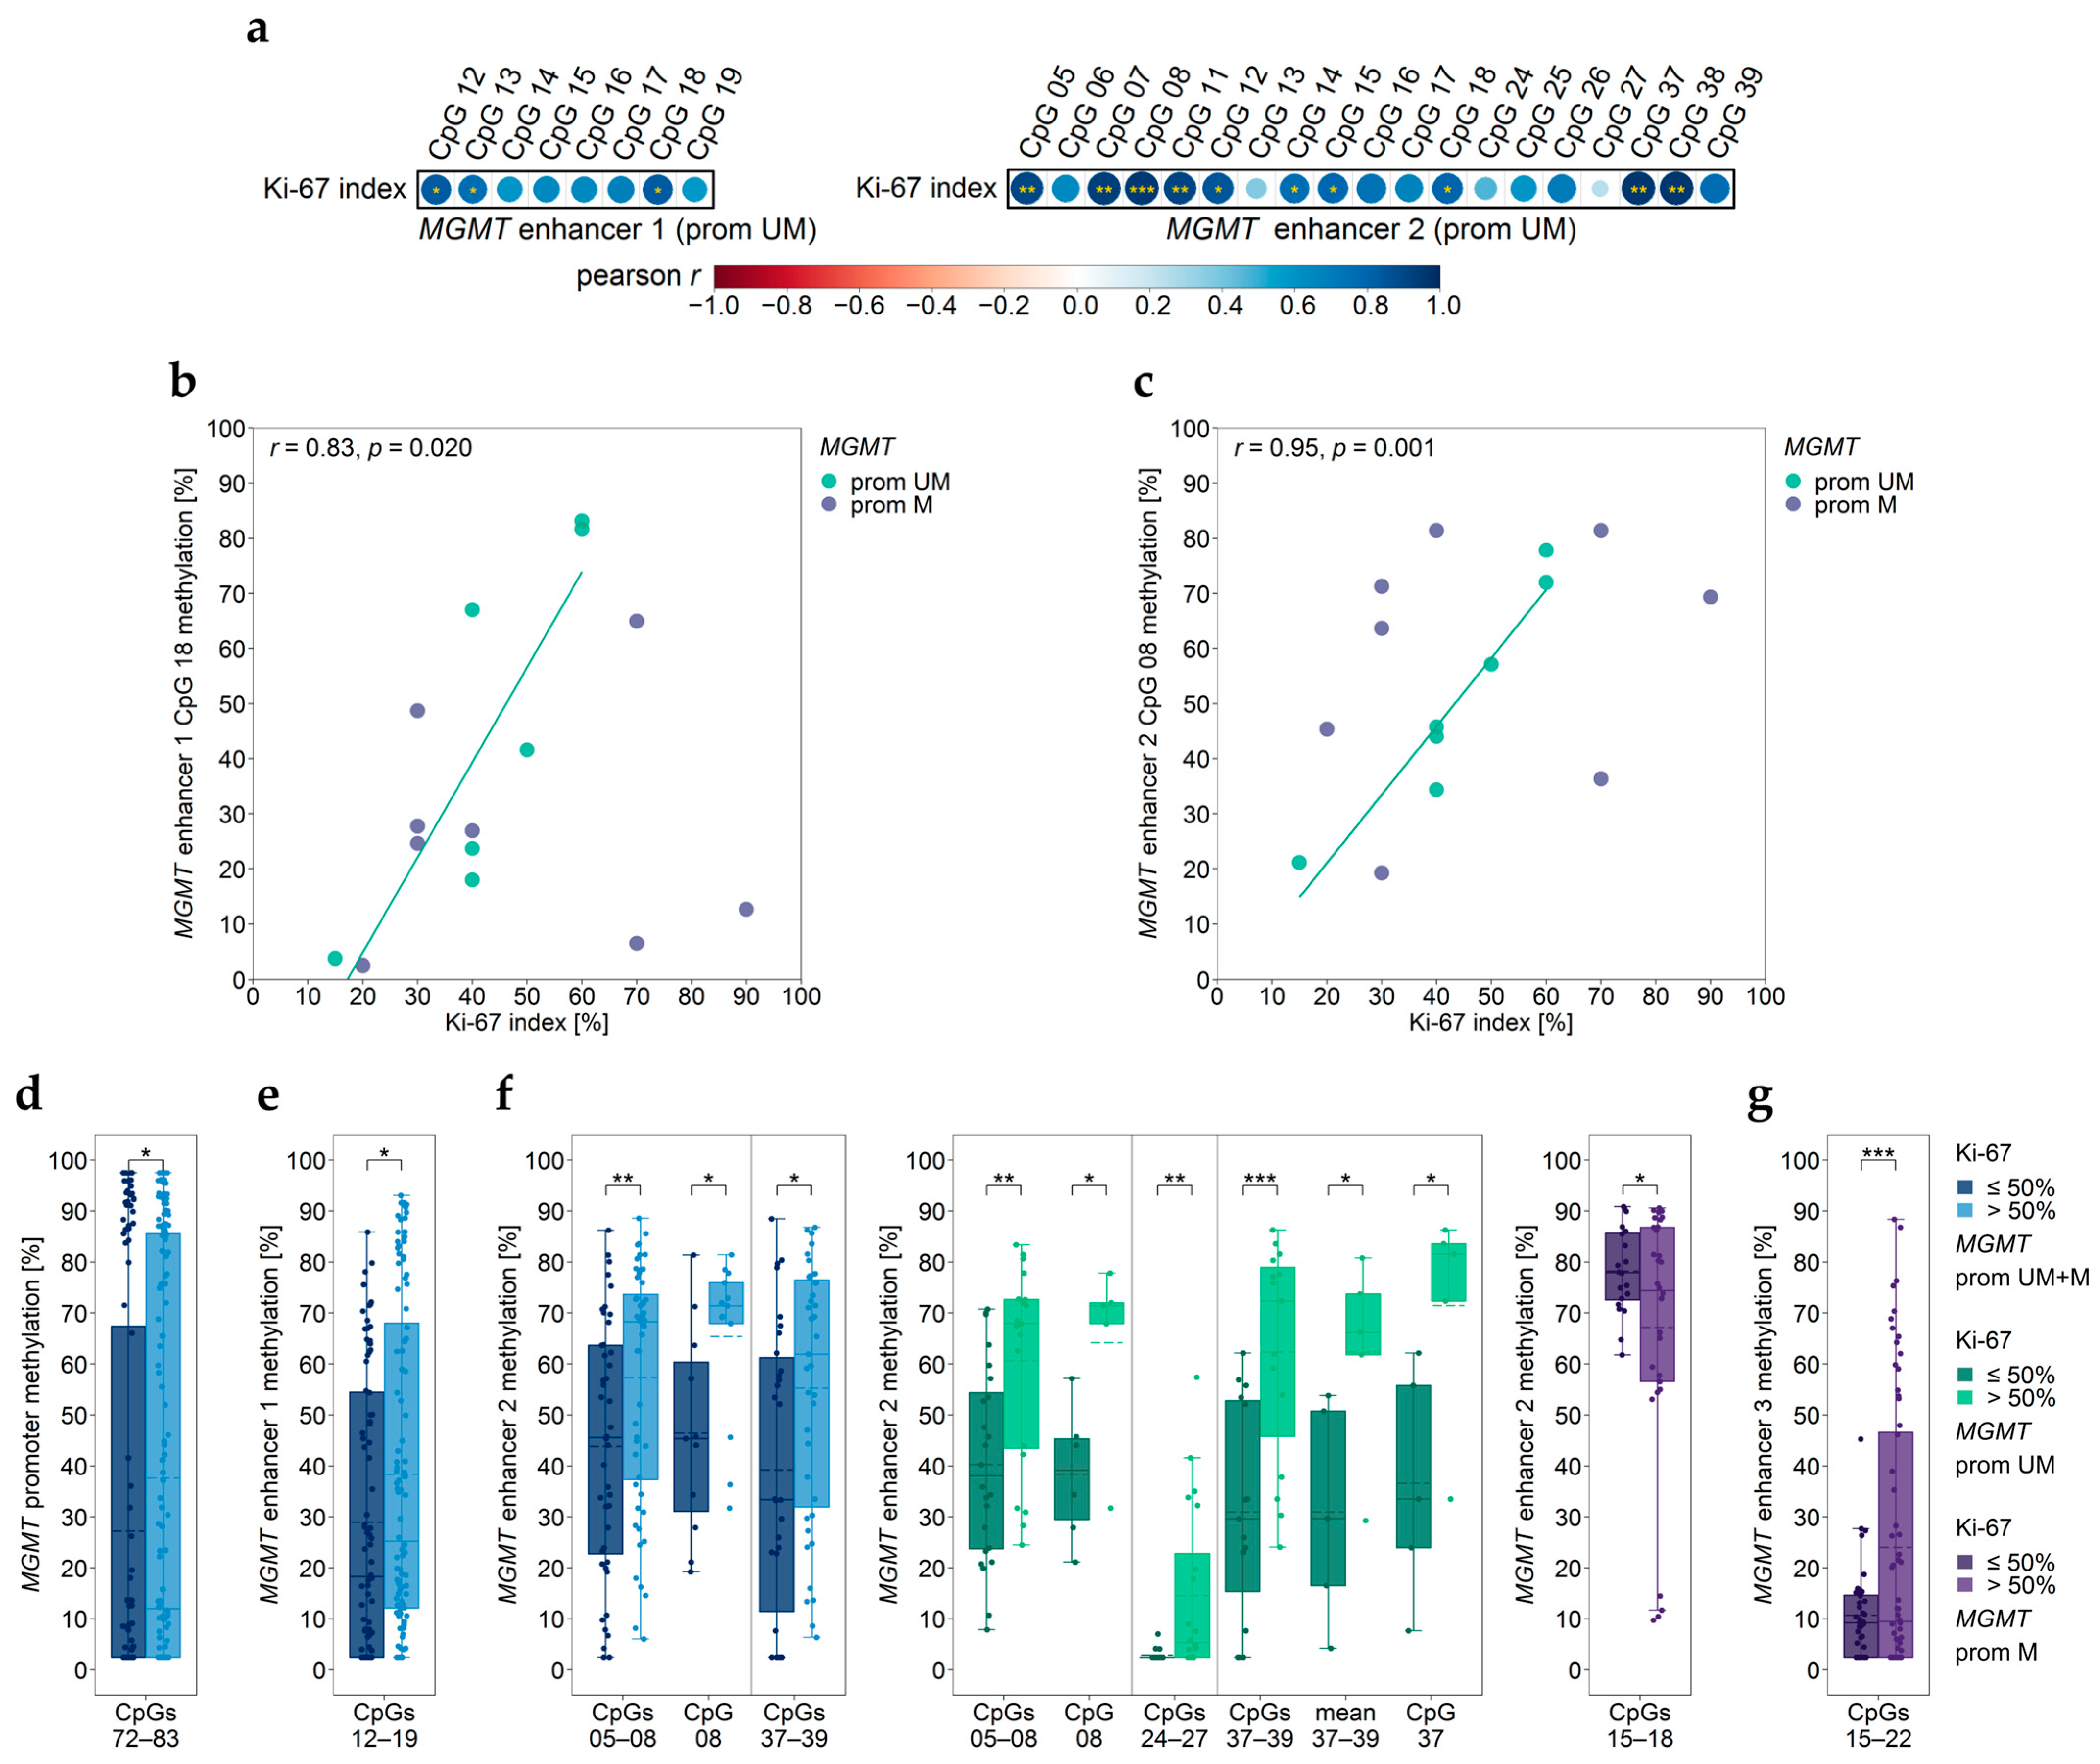
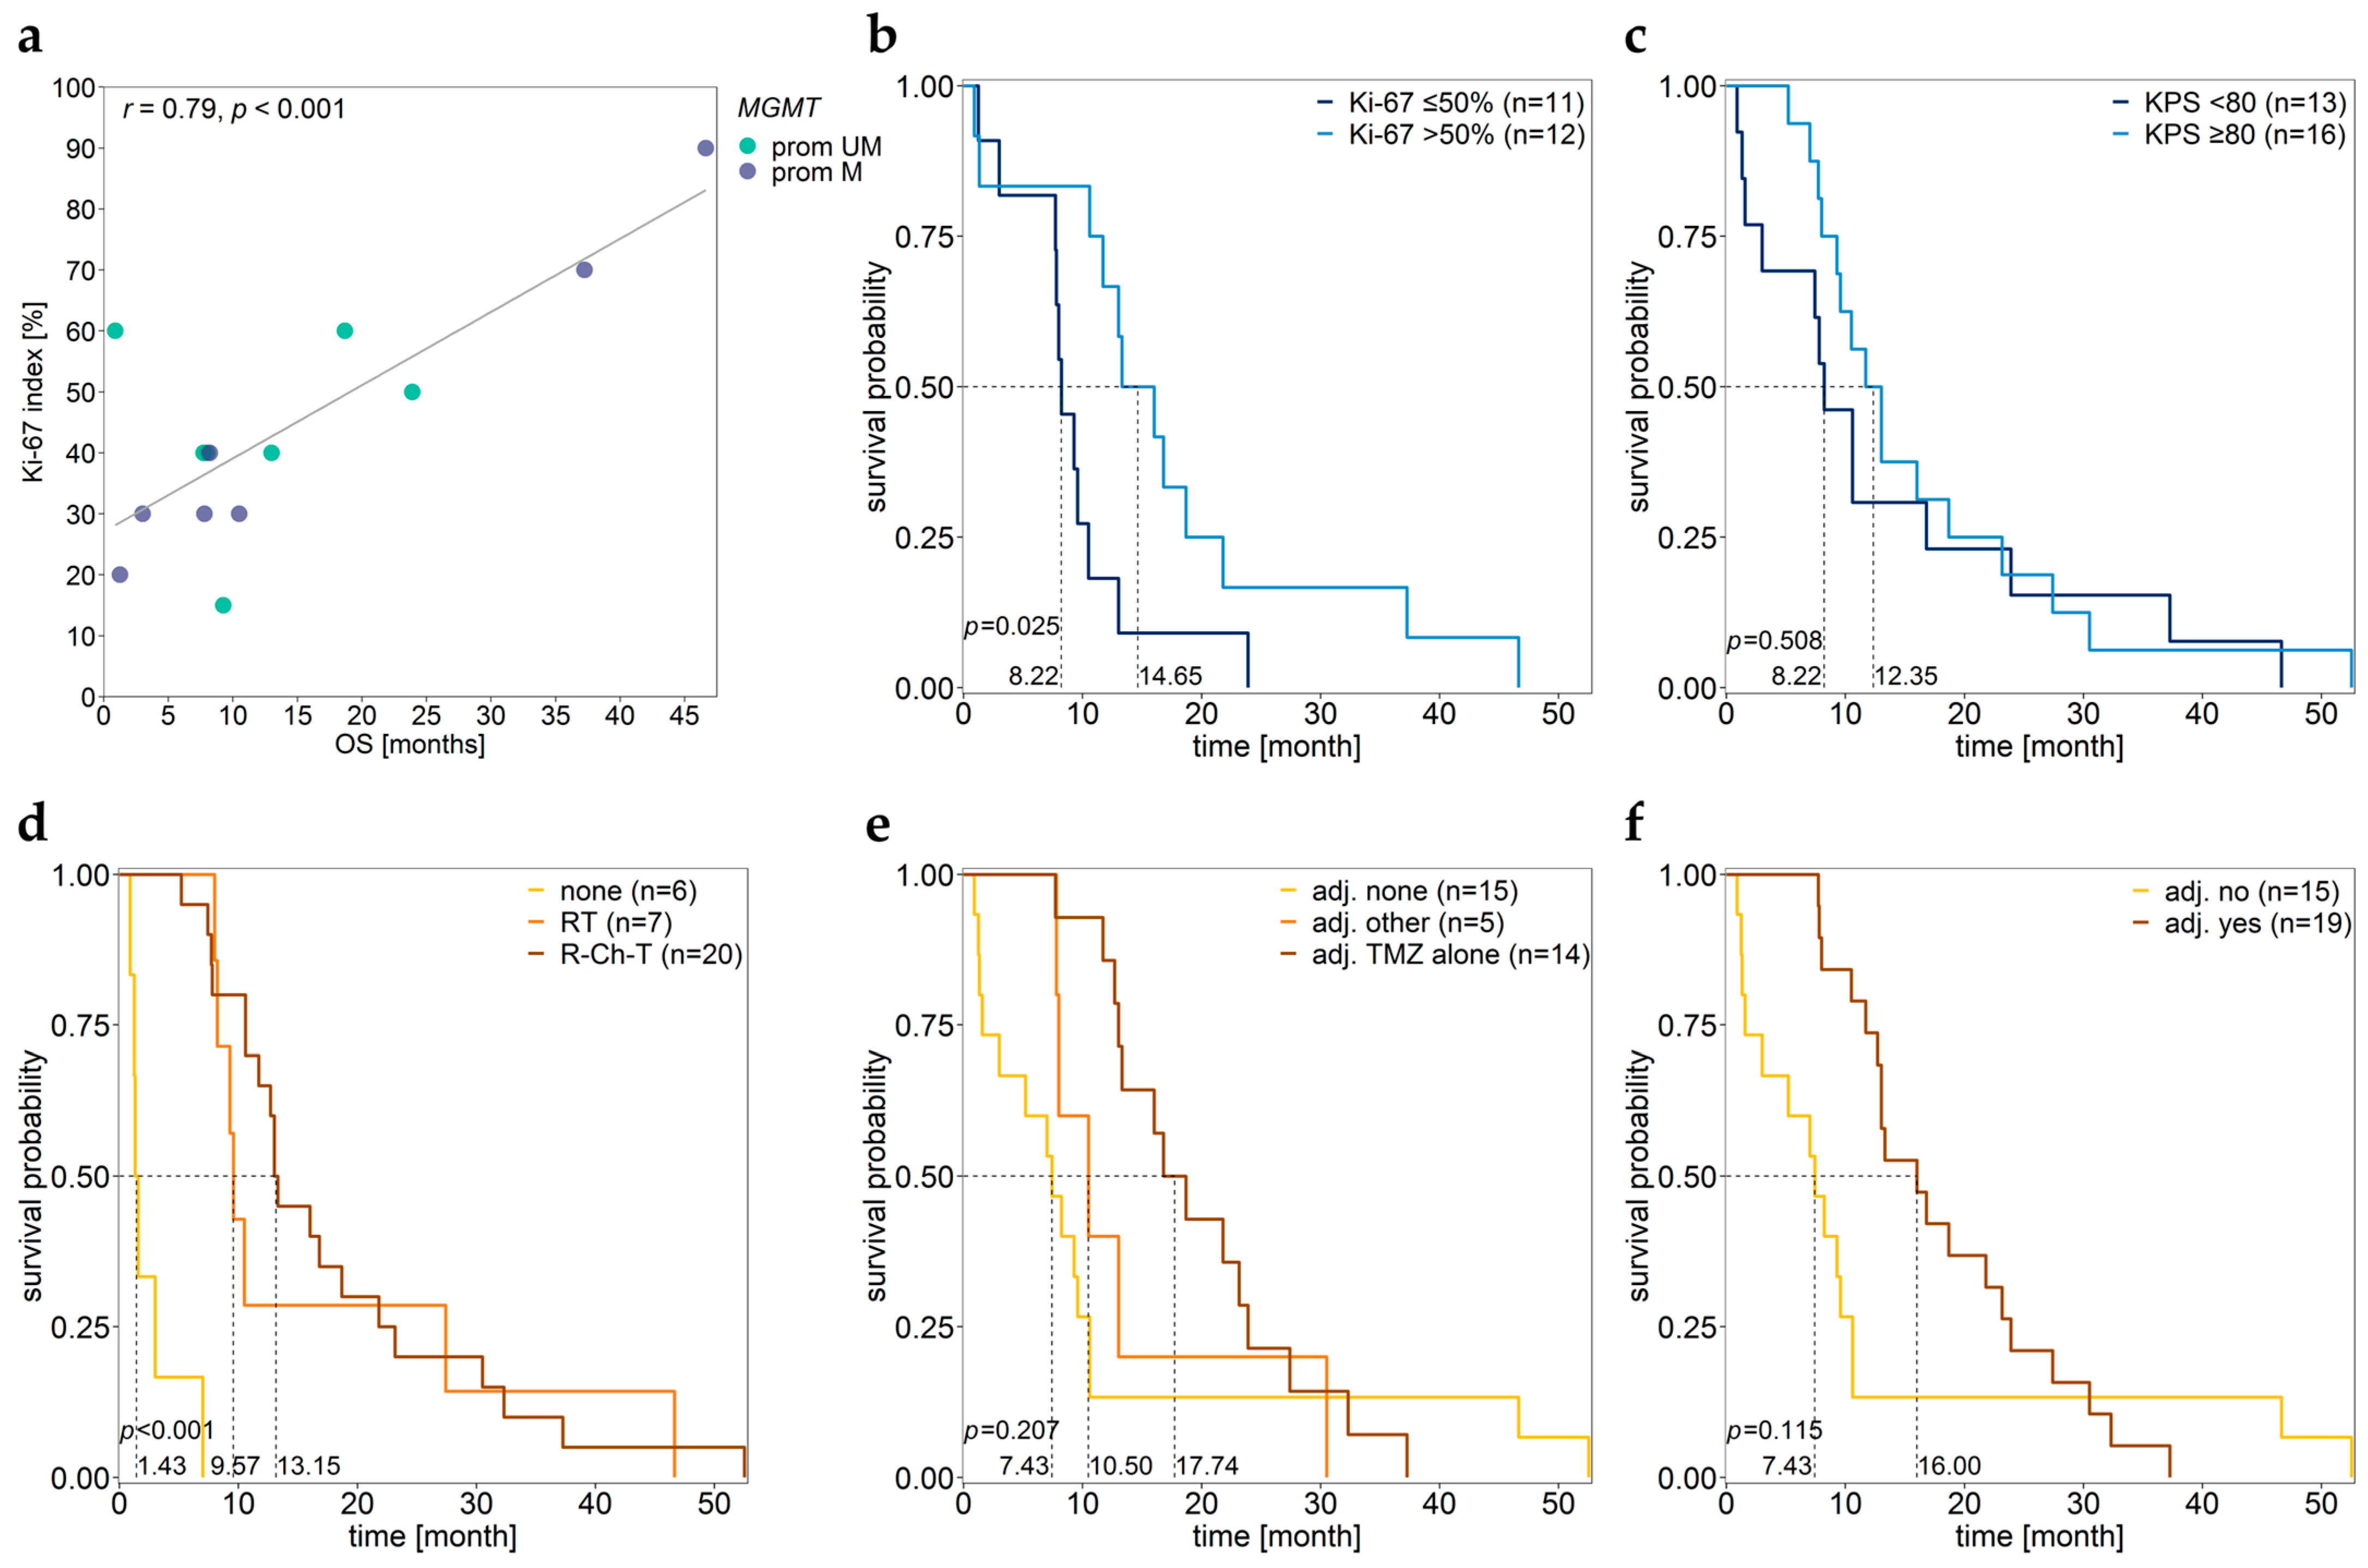
3.6. Association between MGMT Promoter/Enhancer Methylation and Proliferation Index Ki-67
3.7. Association between MGMT Promoter/Enhancer Methylation and KPS
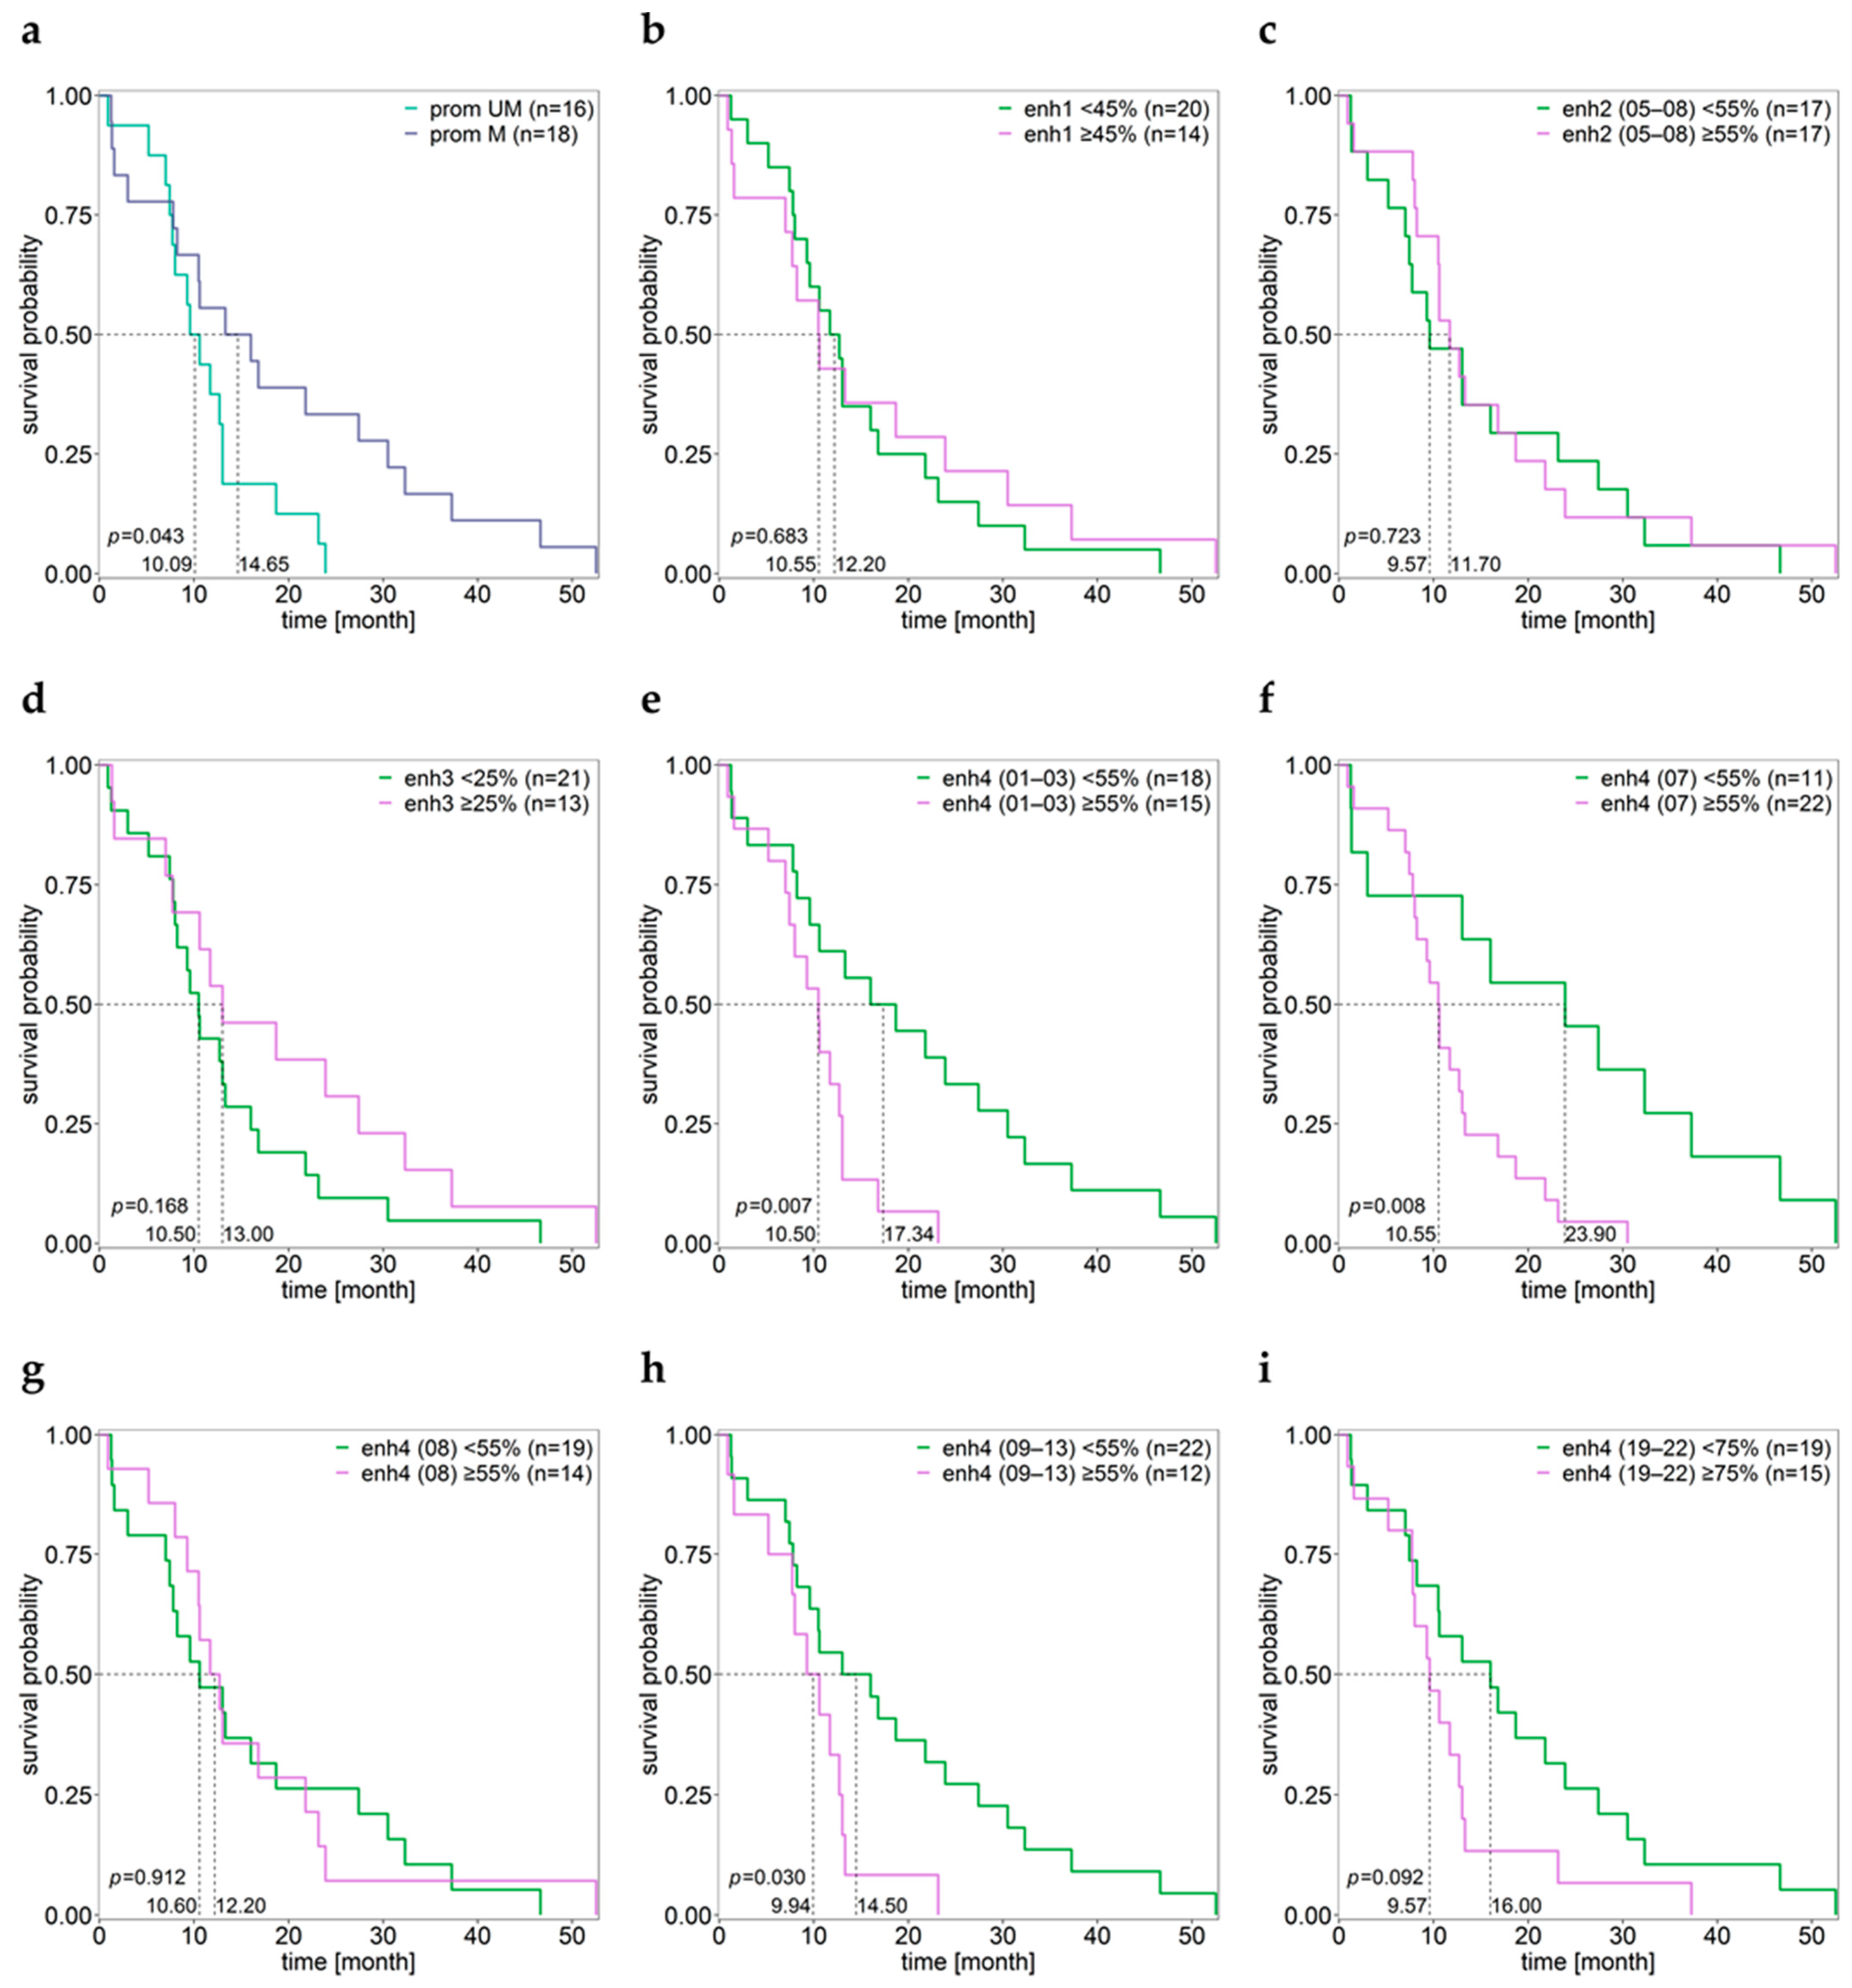
3.8. Association between MGMT Promoter/Enhancer Methylation and PFS
3.9. Association between MGMT Promoter/Enhancer Methylation and OS
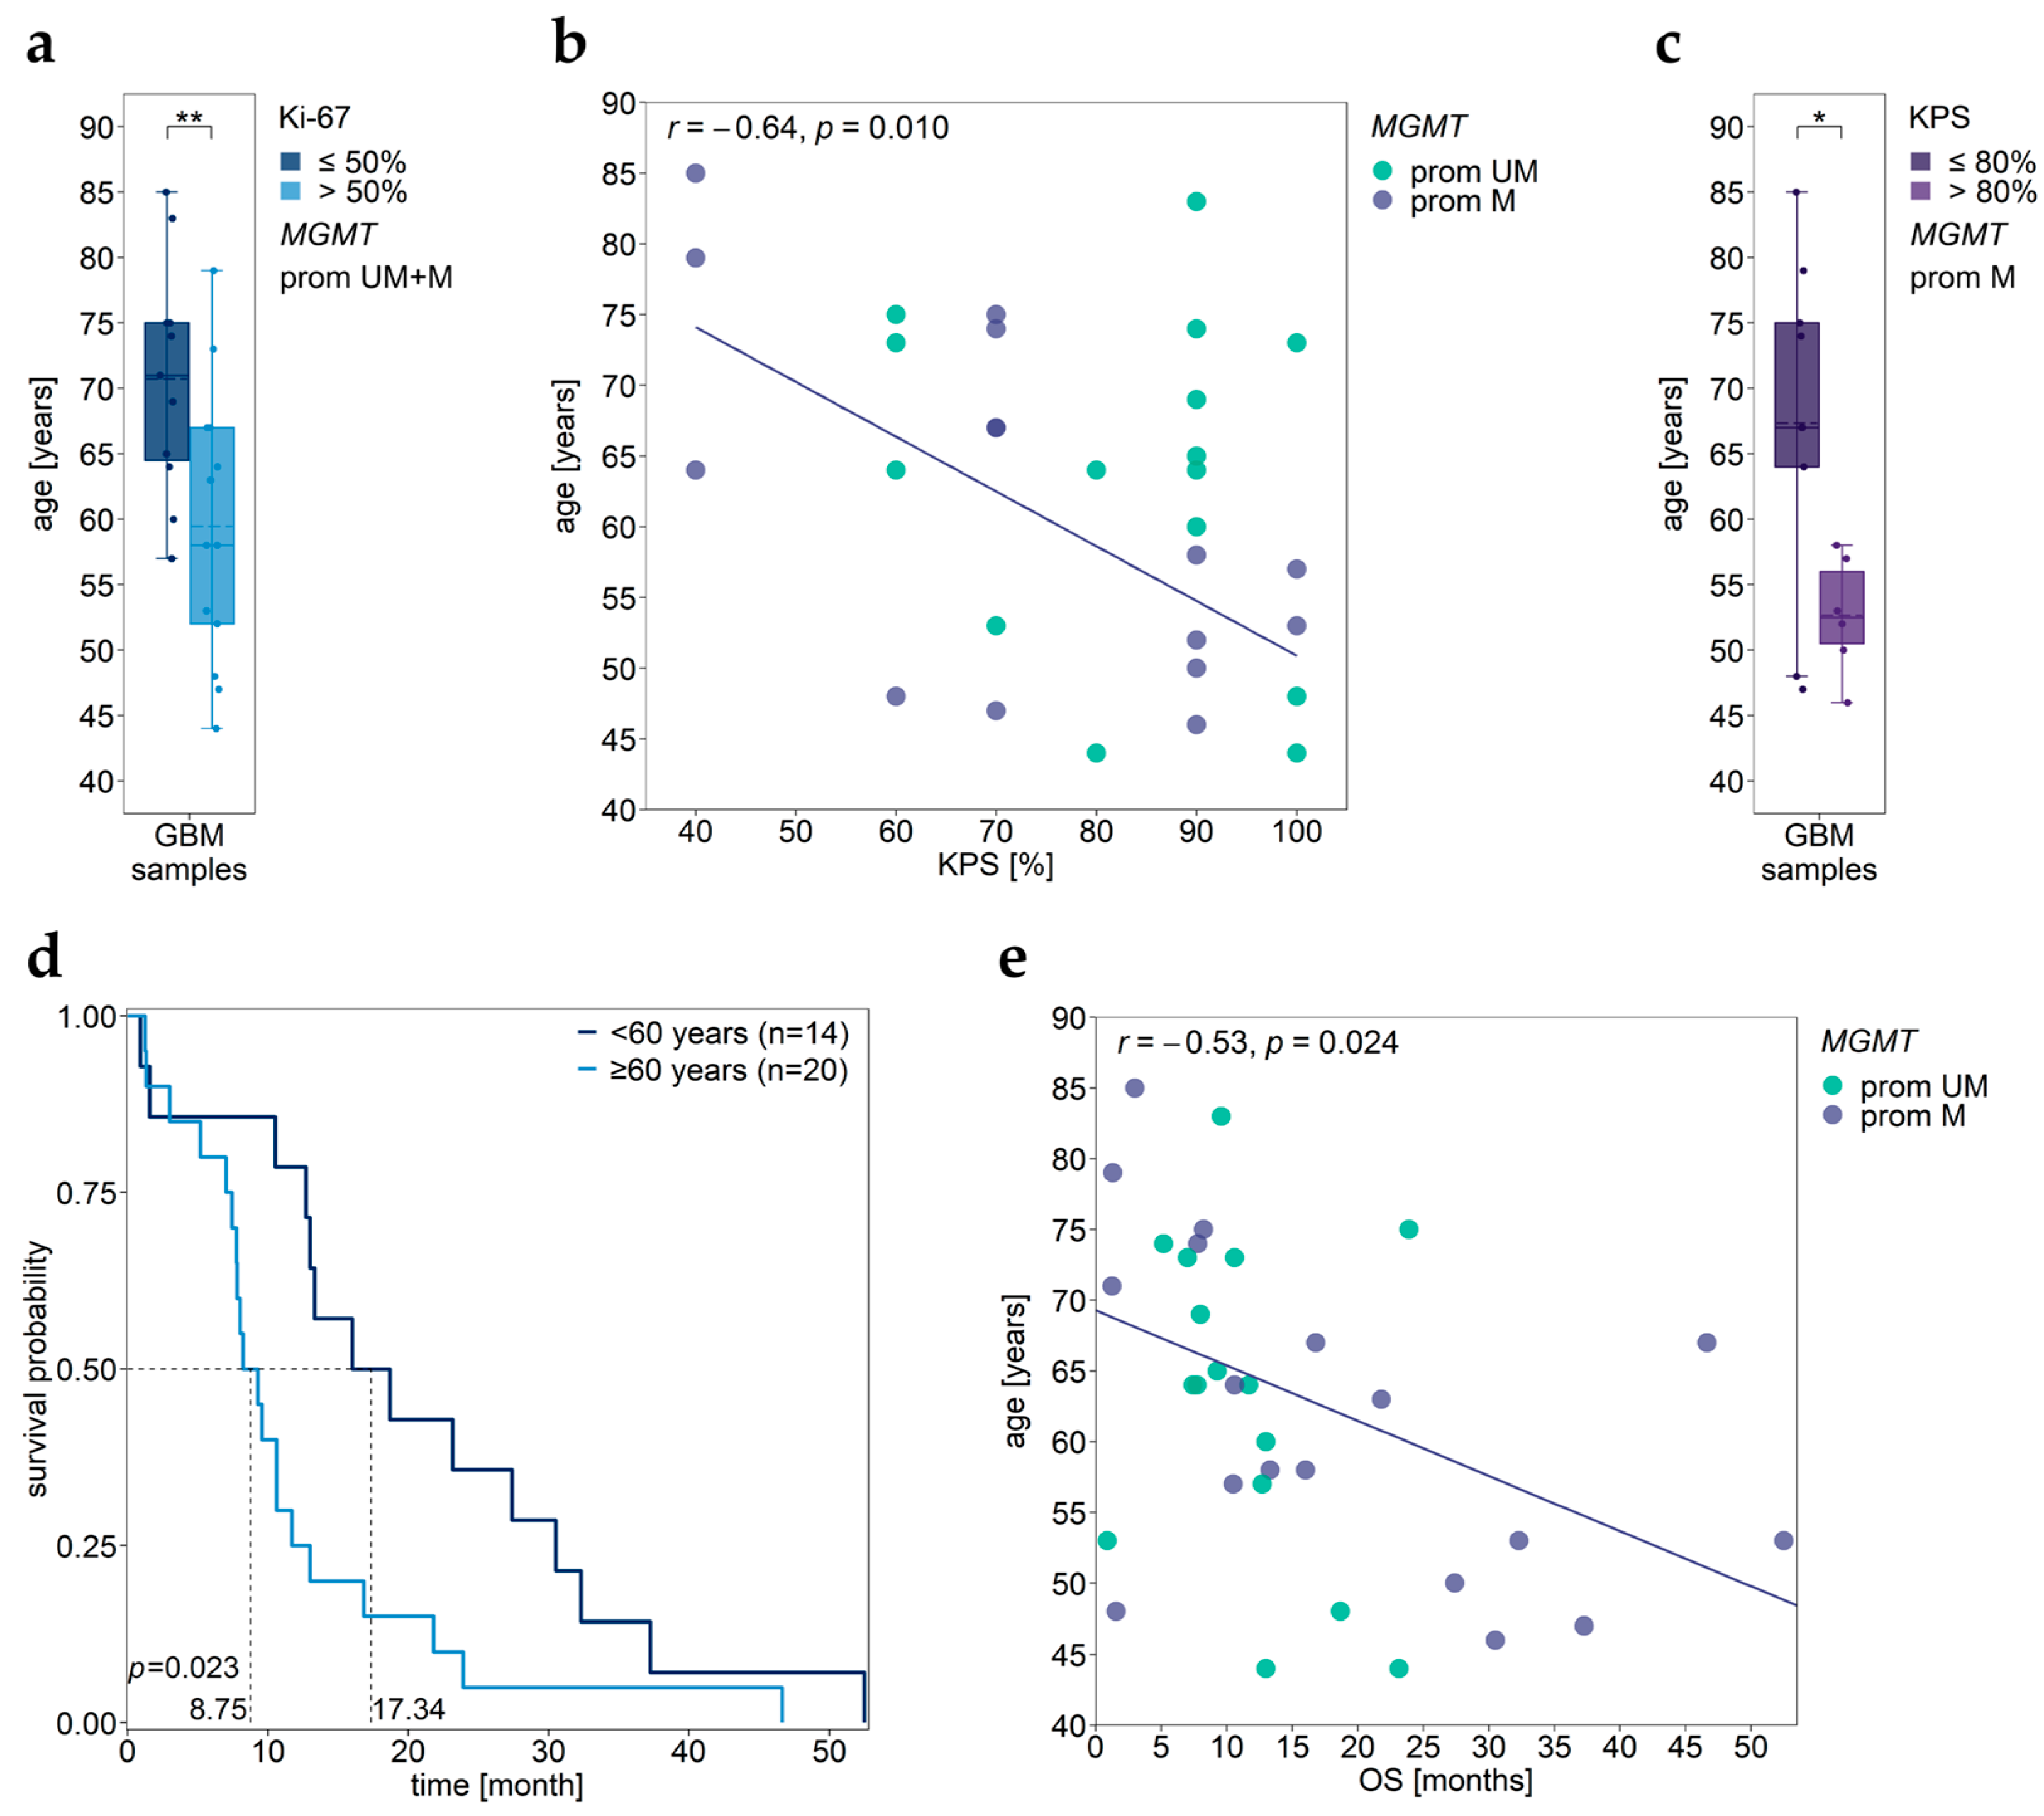
3.10. Associations of Various Clinical Parameters
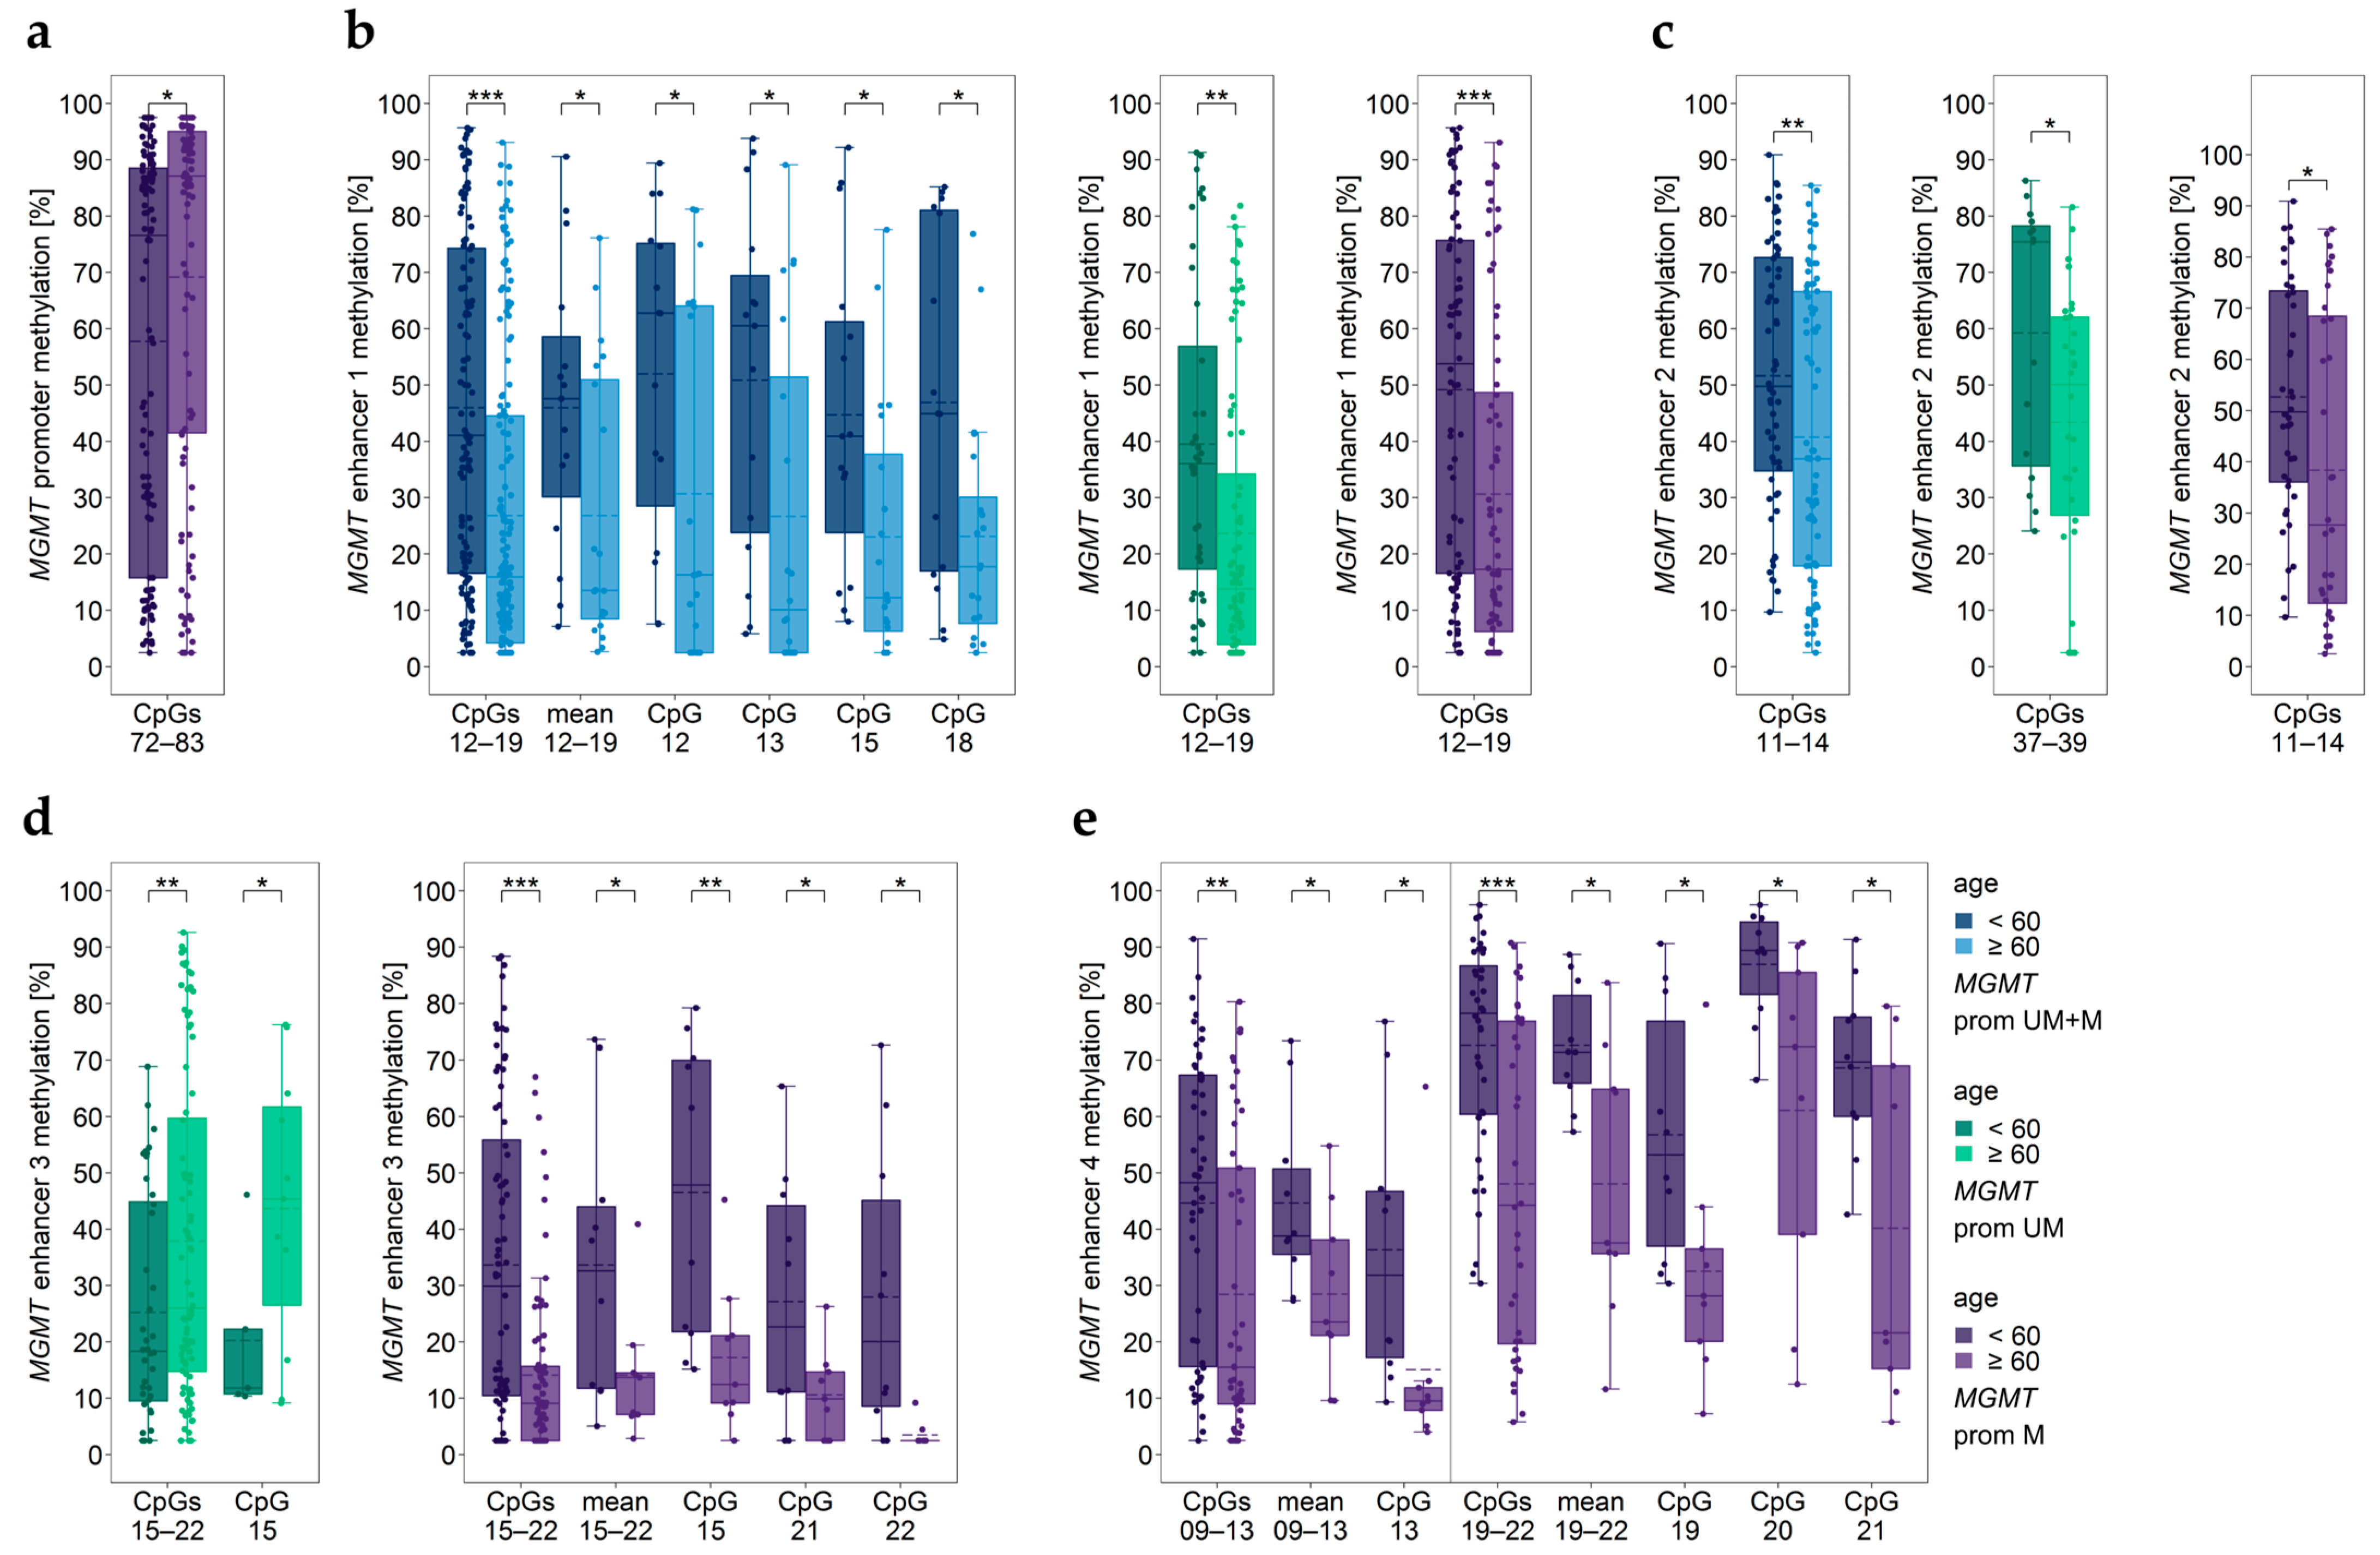
3.11. Impact of Age
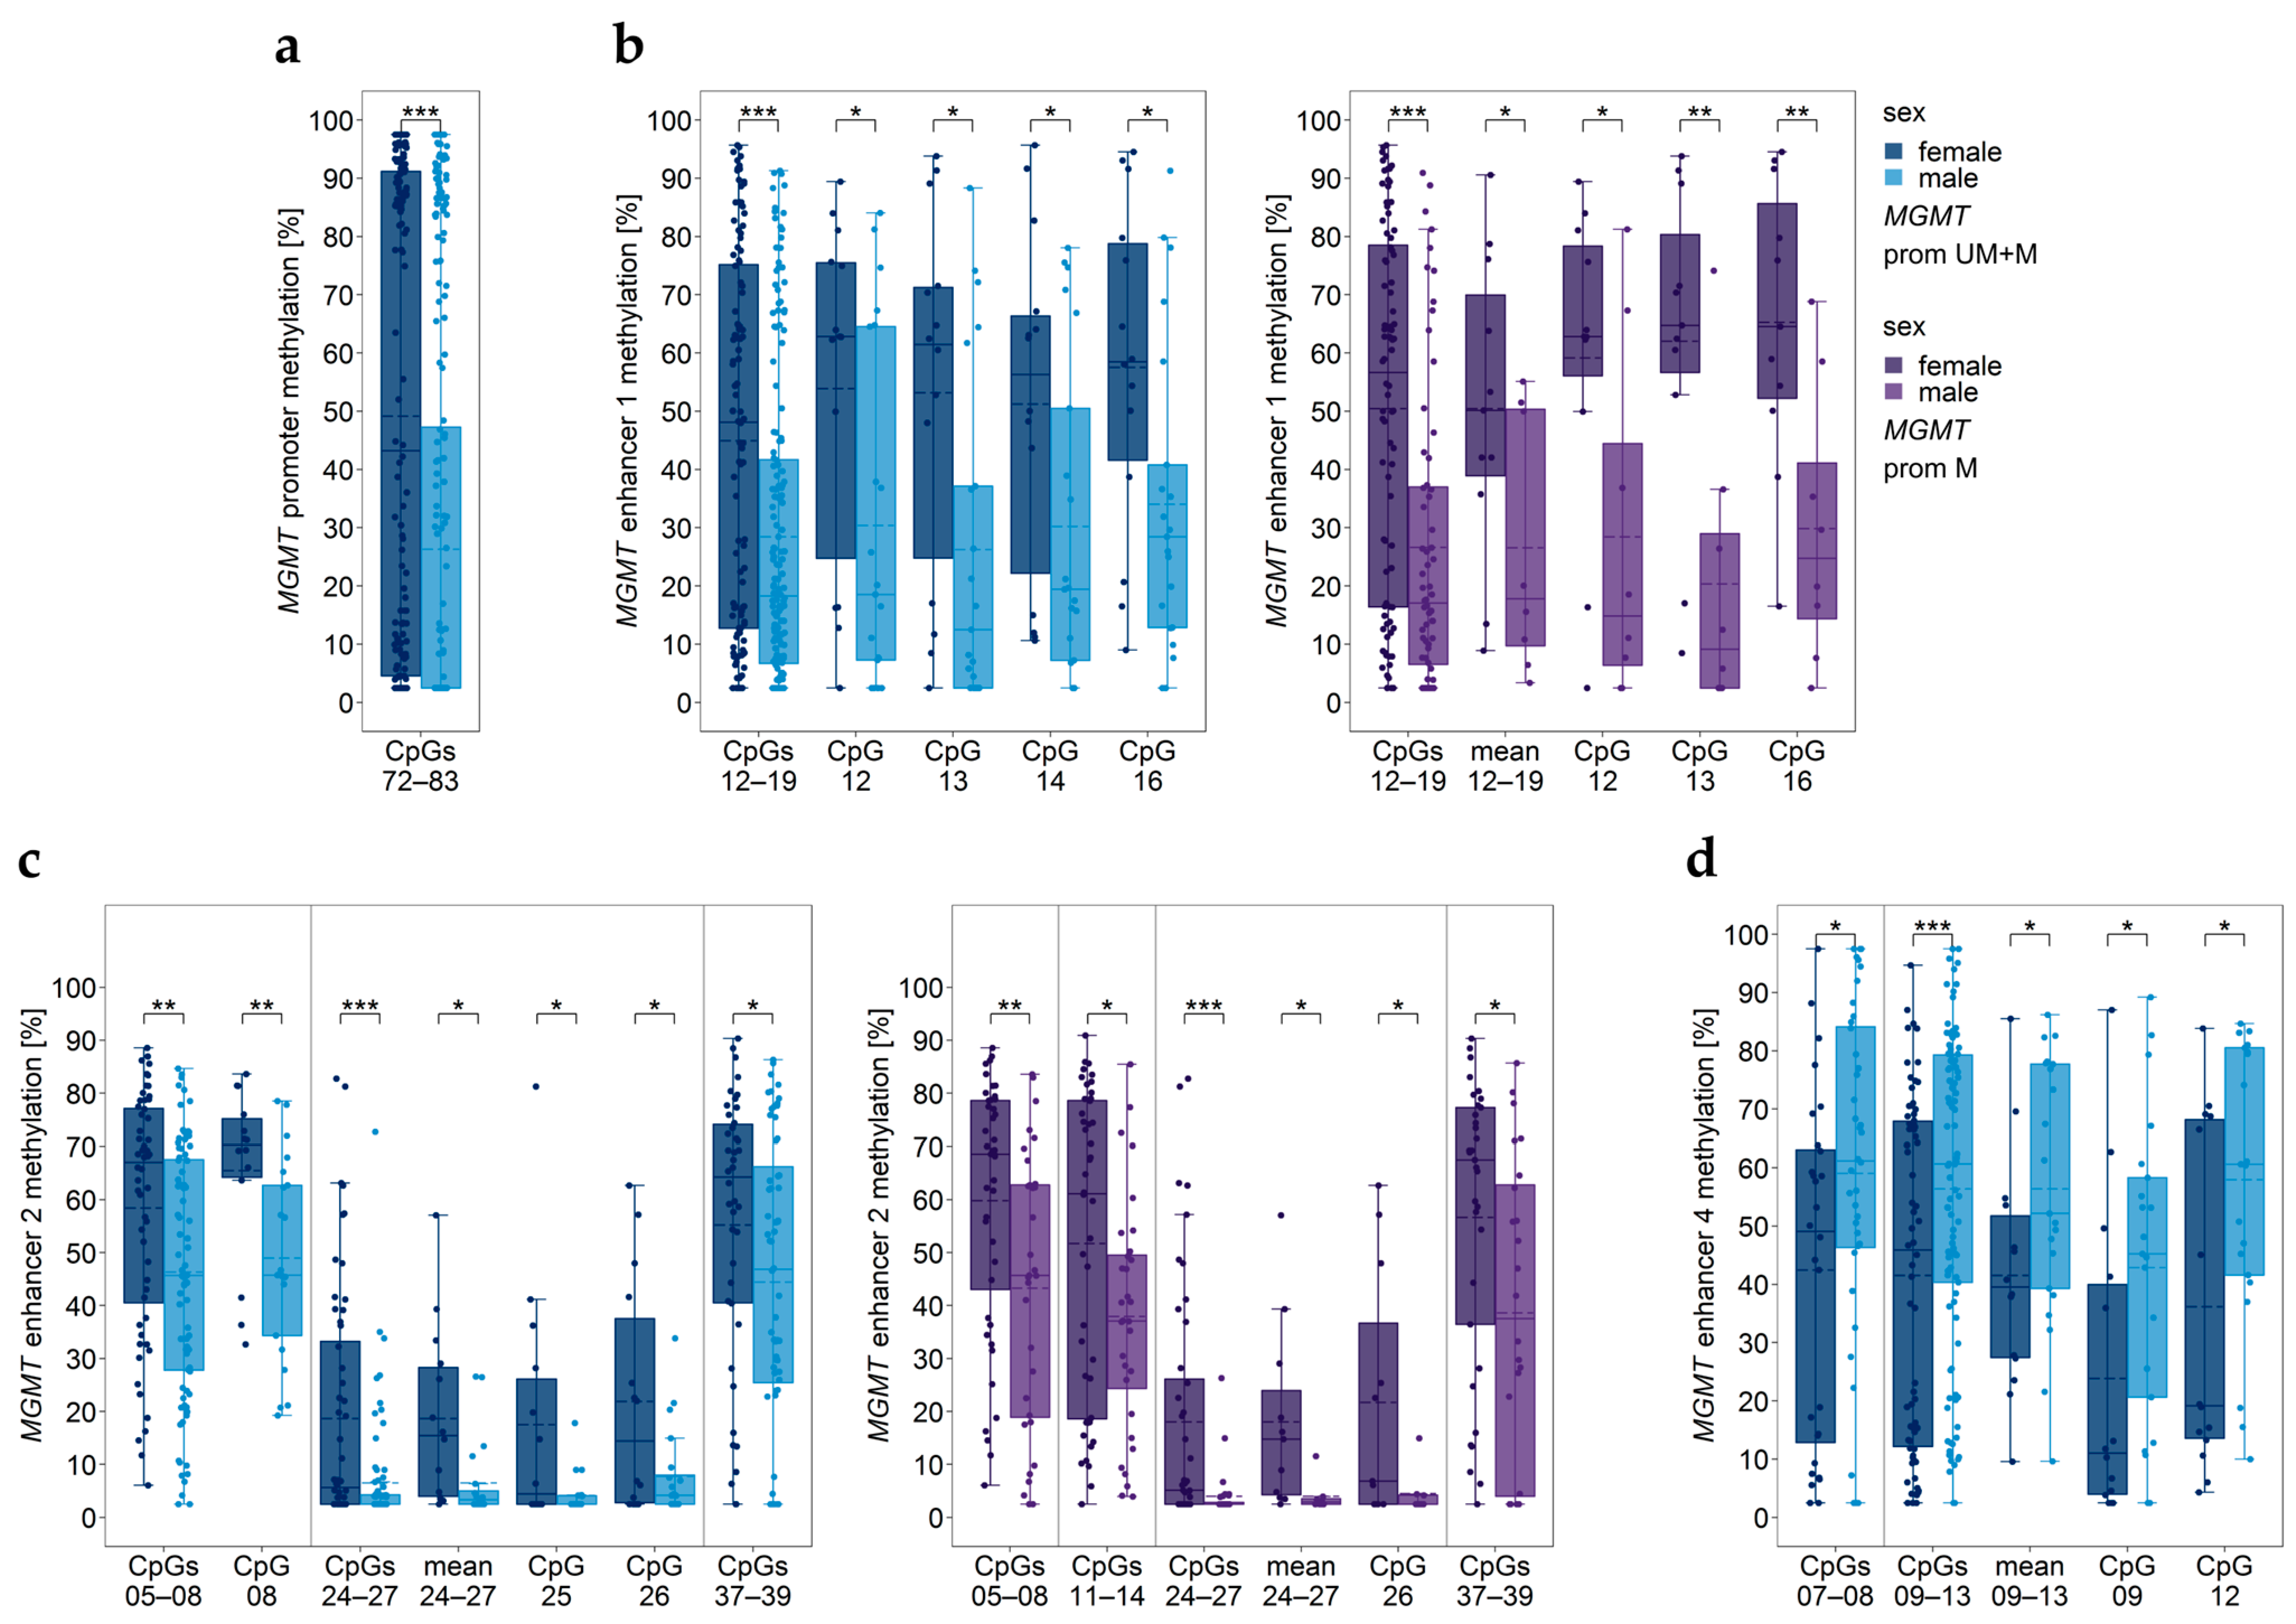
3.12. Impact of Sex
3.13. Two-Way ANOVA Considering Age and Sex
3.14. Cell Lines Resulting in Unstable Cell Cultures
4. Discussion
5. Conclusions
Supplementary Materials
Author Contributions
Funding
Institutional Review Board Statement
Informed Consent Statement
Data Availability Statement
Conflicts of Interest
Abbreviations
References
- Louis, D.N.; Perry, A.; Wesseling, P.; Brat, D.J.; Cree, I.A.; Figarella-Branger, D.; Hawkins, C.; Ng, H.K.; Pfister, S.M.; Reifenberger, G.; et al. The 2021 WHO classification of tumors of the central nervous system: A summary. Neuro Oncol. 2021, 23, 1231–1251. [Google Scholar] [CrossRef]
- Stupp, R.; Mason, W.P.; Van Den Bent, M.J.; Weller, M.; Fisher, B.; Taphoorn, M.J.B.; Belanger, K.; Brandes, A.A.; Marosi, C.; Bogdahn, U.; et al. Radiotherapy plus concomitant and adjuvant temozolomide for glioblastoma. N. Engl. J. Med. 2005, 352, 987–996. [Google Scholar] [CrossRef]
- Soll, J.M.; Sobol, R.W.; Mosammaparast, N. Regulation of DNA Alkylation Damage Repair: Lessons and Therapeutic Opportunities. Trends Biochem. Sci. 2017, 42, 206–218. [Google Scholar] [CrossRef]
- Lee, S.Y. Temozolomide resistance in glioblastoma multiforme. Genes Dis. 2016, 3, 198–210. [Google Scholar] [CrossRef]
- Deaton, A.M.; Bird, A. CpG islands and the regulation of transcription. Gene Dev. 2011, 25, 1010–1022. [Google Scholar] [CrossRef]
- Nakagawachi, T.; Soejima, H.; Urano, T.; Zhao, W.; Higashimoto, K.; Satoh, Y.; Matsukura, S.; Kudo, S.; Kitajima, Y.; Harada, H.; et al. Silencing effect of CpG island hypermethylation and histone modifications on O6-methylguanine-DNA methyltransferase (MGMT) gene expression in human cancer. Oncogene 2003, 22, 8835–8844. [Google Scholar] [CrossRef]
- Hegi, M.E.; Diserens, A.C.; Gorlia, T.; Hamou, M.F.; De Tribolet, N.; Weller, M.; Kros, J.M.; Hainfellner, J.A.; Mason, W.; Mariani, L.; et al. MGMT gene silencing and benefit from temozolomide in glioblastoma. N. Engl. J. Med. 2005, 352, 997–1003. [Google Scholar] [CrossRef]
- Brandes, A.A.; Franceschi, E.; Tosoni, A.; Benevento, F.; Scopece, L.; Mazzocchi, V.; Bacci, A.; Agati, R.; Calbucci, F.; Ermani, M. Temozolomide concomitant and adjuvant to radiotherapy in elderly patients with glioblastoma: Correlation with MGMT promoter methylation status. Cancer 2009, 115, 3512–3518. [Google Scholar] [CrossRef]
- Malmström, A.; Grønberg, B.H.; Marosi, C.; Stupp, R.; Frappaz, D.; Schultz, H.; Abacioglu, U.; Tavelin, B.; Lhermitte, B.; Hegi, M.E.; et al. Temozolomide versus standard 6-week radiotherapy versus hypofractionated radiotherapy in patients older than 60 years with glioblastoma: The Nordic randomised, phase 3 trial. Lancet Oncol. 2012, 13, 916–926. [Google Scholar] [CrossRef] [PubMed]
- Reifenberger, G.; Hentschel, B.; Felsberg, J.; Schackert, G.; Simon, M.; Schnell, O.; Westphal, M.; Wick, W.; Pietsch, T.; Loeffler, M.; et al. Predictive impact of MGMT promoter methylation in glioblastoma of the elderly. Int. J. Cancer 2012, 131, 1342–1350. [Google Scholar] [CrossRef] [PubMed]
- Binabaj, M.M.; Bahrami, A.; ShahidSales, S.; Joodi, M.; Joudi Mashhad, M.; Hassanian, S.M.; Anvari, K.; Avan, A. The prognostic value of MGMT promoter methylation in glioblastoma: A meta-analysis of clinical trials. J. Cell. Physiol. 2018, 233, 378–386. [Google Scholar] [CrossRef] [PubMed]
- Brown, N.F.; Ottaviani, D.; Tazare, J.; Gregson, J.; Kitchen, N.; Brandner, S.; Fersht, N.; Mulholland, P. Survival Outcomes and Prognostic Factors in Glioblastoma. Cancers 2022, 14, 3161. [Google Scholar] [CrossRef] [PubMed]
- Kreth, S.; Thon, N.; Eigenbrod, S.; Lutz, J.; Ledderose, C.; Egensperger, R.; Tonn, J.C.; Kretzschmar, H.A.; Hinske, L.C.; Kreth, F.W. O6-methylguanine-DNA methyltransferase (MGMT) mRNA expression predicts outcome in malignant glioma independent of MGMT promoter methylation. PLoS ONE 2011, 6, e17156. [Google Scholar] [CrossRef] [PubMed]
- Zappe, K.; Pühringer, K.; Pflug, S.; Berger, D.; Böhm, A.; Spiegl-Kreinecker, S.; Cichna-Markl, M. Association between MGMT Enhancer Methylation and MGMT Promoter Methylation, MGMT Protein Expression, and Overall Survival in Glioblastoma. Cells 2023, 12, 1639. [Google Scholar] [CrossRef]
- Visel, A.; Minovitsky, S.; Dubchak, I.; Pennacchio, L.A. VISTA Enhancer Browser—A database of tissue-specific human enhancers. Nucleic Acids Res. 2007, 35, D88–D92. [Google Scholar] [CrossRef]
- Chen, X.; Zhang, M.; Gan, H.; Wang, H.; Lee, J.H.; Fang, D.; Kitange, G.J.; He, L.; Hu, Z.; Parney, I.F.; et al. A novel enhancer regulates MGMT expression and promotes temozolomide resistance in glioblastoma. Nat. Commun. 2018, 9, 2949. [Google Scholar] [CrossRef]
- Spiegl-Kreinecker, S.; Pirker, C.; Marosi, C.; Buchroithner, J.; Pichler, J.; Silye, R.; Fischer, J.; Micksche, M.; Berger, W. Dynamics of chemosensitivity and chromosomal instability in recurrent glioblastoma. Br. J. Cancer 2007, 96, 960–969. [Google Scholar] [CrossRef]
- James Kent, W.; Sugnet, C.W.; Furey, T.S.; Roskin, K.M.; Pringle, T.H.; Zahler, A.M.; Haussler, D. The human genome browser at UCSC. Genome Res. 2002, 12, 996–1006. [Google Scholar] [CrossRef]
- Wick, W.; Weller, M.; Van Den Bent, M.; Sanson, M.; Weiler, M.; Von Deimling, A.; Plass, C.; Hegi, M.; Platten, M.; Reifenberger, G. MGMT testing—The challenges for biomarker-based glioma treatment. Nat. Rev. Neurol. 2014, 10, 372–385. [Google Scholar] [CrossRef]
- Spiegl-Kreinecker, S.; Lötsch, D.; Ghanim, B.; Pirker, C.; Mohr, T.; Laaber, M.; Weis, S.; Olschowski, A.; Webersinke, G.; Pichler, J.; et al. Prognostic quality of activating TERT promoter mutations in glioblastoma: Interaction with the rs2853669 polymorphism and patient age at diagnosis. Neuro Oncol. 2015, 17, 1231–1240. [Google Scholar] [CrossRef]
- Zappe, K.; Pirker, C.; Miedl, H.; Schreiber, M.; Heffeter, P.; Pfeiler, G.; Hacker, S.; Haslik, W.; Spiegl-Kreinecker, S.; Cichna-Markl, M. Discrimination between 34 of 36 possible combinations of three C>T SNP genotypes in the MGMT promoter by high resolution melting analysis coupled with pyrosequencing using a single primer set. Int. J. Mol. Sci. 2021, 22, 12527. [Google Scholar] [CrossRef]
- R Core Team. R: A Language and Environment for Statistical Computing. Available online: https://www.R-project.org/ (accessed on 15 August 2023).
- Leske, H.; Camenisch Gross, U.; Hofer, S.; Neidert, M.C.; Leske, S.; Weller, M.; Lehnick, D.; Rushing, E.J. MGMT methylation pattern of long-term and short-term survivors of glioblastoma reveals CpGs of the enhancer region to be of high prognostic value. Acta Neuropathol. Commun. 2023, 11, 139. [Google Scholar] [CrossRef] [PubMed]
- McDonald, K.L.; Rapkins, R.W.; Olivier, J.; Zhao, L.; Nozue, K.; Lu, D.; Tiwari, S.; Kuroiwa-Trzmielina, J.; Brewer, J.; Wheeler, H.R.; et al. The T genotype of the MGMT C>T (rs16906252) enhancer single-nucleotide polymorphism (SNP) is associated with promoter methylation and longer survival in glioblastoma patients. Eur. J. Cancer 2013, 49, 360–368. [Google Scholar] [CrossRef] [PubMed]
- Rapkins, R.W.; Wang, F.; Nguyen, H.T.N.; Cloughesy, T.F.; Lai, A.; Ha, W.; Nowak, A.K.; Hitchins, M.P.; McDonald, K.L. The MGMT promoter SNP rs16906252 is a risk factor for MGMT methylation in glioblastoma and is predictive of response to temozolomide. Neuro Oncol. 2015, 17, 1589–1598. [Google Scholar] [CrossRef] [PubMed]
- Simon, M.; Hosen, I.; Gousias, K.; Rachakonda, S.; Heidenreich, B.; Gessi, M.; Schramm, J.; Hemminki, K.; Waha, A.; Kumar, R. TERT promoter mutations: A novel independent prognostic factor in primary glioblastomas. Neuro Oncol. 2015, 17, 45–52. [Google Scholar] [CrossRef] [PubMed]
- Olympios, N.; Gilard, V.; Marguet, F.; Clatot, F.; Fiore, F.D.; Fontanilles, M. TERT promoter alterations in glioblastoma: A systematic review. Cancers 2021, 13, 1147. [Google Scholar] [CrossRef] [PubMed]
- Bell, R.J.A.; Rube, H.T.; Xavier-Magalhães, A.; Costa, B.M.; Mancini, A.; Song, J.S.; Costello, J.F. Understanding TERT promoter mutations: A common path to immortality. Mol. Cancer Res. 2016, 14, 315–323. [Google Scholar] [CrossRef]
- Heidenreich, B.; Rachakonda, P.S.; Hemminki, K.; Kumar, R. TERT promoter mutations in cancer development. Curr. Opin. Genet. Dev. 2014, 24, 30–37. [Google Scholar] [CrossRef]
- Nencha, U.; Rahimian, A.; Giry, M.; Sechi, A.; Mokhtari, K.; Polivka, M.; Schmitt, Y.; Di Stefano, A.L.; Alentorn, A.; Labussière, M.; et al. TERT promoter mutations and rs2853669 polymorphism: Prognostic impact and interactions with common alterations in glioblastomas. J. Neurooncol. 2016, 126, 441–446. [Google Scholar] [CrossRef]
- Giunco, S.; Padovan, M.; Angelini, C.; Cavallin, F.; Cerretti, G.; Morello, M.; Caccese, M.; Rizzo, B.; d’Avella, D.; Puppa, A.D.; et al. Prognostic role and interaction of TERT promoter status, telomere length and MGMT promoter methylation in newly diagnosed IDH wild-type glioblastoma patients. ESMO Open 2023, 8, 101570. [Google Scholar] [CrossRef]
- Gao, K.; Li, G.; Qu, Y.; Wang, M.; Cui, B.; Ji, M.; Shi, B.; Hou, P. TERT promoter mutations and long telomere length predict poor survival and radiotherapy resistance in gliomas. Oncotarget 2016, 7, 8712–8725. [Google Scholar] [CrossRef] [PubMed]
- Arita, H.; Yamasaki, K.; Matsushita, Y.; Nakamura, T.; Shimokawa, A.; Takami, H.; Tanaka, S.; Mukasa, A.; Shirahata, M.; Shimizu, S.; et al. A combination of TERT promoter mutation and MGMT methylation status predicts clinically relevant subgroups of newly diagnosed glioblastomas. Acta Neuropathol. Commun. 2016, 4, 79. [Google Scholar] [CrossRef] [PubMed]
- Nguyen, H.N.; Lie, A.; Li, T.; Chowdhury, R.; Liu, F.; Ozer, B.; Wei, B.; Green, R.M.; Ellingson, B.M.; Wang, H.J.; et al. Human TERT promoter mutation enables survival advantage from MGMT promoter methylation in IDH1 wild-type primary glioblastoma treated by standard chemoradiotherapy. Neuro Oncol. 2017, 19, 394–404. [Google Scholar] [CrossRef] [PubMed]
- Alkhaibary, A.; Alassiri, A.H.; AlSufiani, F.; Alharbi, M.A. Ki-67 labeling index in glioblastoma; does it really matter? Hematology Oncol. Stem Cell Ther. 2019, 12, 82–88. [Google Scholar] [CrossRef] [PubMed]
- Sun, X.; Kaufman, P.D. Ki-67: More than a proliferation marker. Chromosoma 2018, 127, 175–186. [Google Scholar] [CrossRef] [PubMed]
- Armocida, D.; Frati, A.; Salvati, M.; Santoro, A.; Pesce, A. Is Ki-67 index overexpression in IDH wild type glioblastoma a predictor of shorter Progression Free survival? A clinical and Molecular analytic investigation. Clin. Neurol. Neurosurg. 2020, 198, 106126. [Google Scholar] [CrossRef] [PubMed]
- Nielsen, L.A.G.; Bangsø, J.A.; Lindahl, K.H.; Dahlrot, R.H.; Hjelmborg, J.V.B.; Hansen, S.; Kristensen, B.W. Evaluation of the proliferation marker Ki-67 in gliomas: Interobserver variability and digital quantification. Diagn. Pathol. 2018, 13, 38. [Google Scholar] [CrossRef] [PubMed]
- Henker, C.; Kriesen, T.; Schneider, B.; Glass, Ä.; Scherer, M.; Langner, S.; Erbersdobler, A.; Piek, J. Correlation of Ki-67 Index with Volumetric Segmentation and its Value as a Prognostic Marker in Glioblastoma. World Neurosurg. 2019, 125, e1093–e1103. [Google Scholar] [CrossRef]
- Aung, T.N.; Acs, B.; Warrell, J.; Bai, Y.; Gaule, P.; Martinez-Morilla, S.; Vathiotis, I.; Shafi, S.; Moutafi, M.; Gerstein, M.; et al. A new tool for technical standardization of the Ki67 immunohistochemical assay. Modern Pathol. 2021, 34, 1261–1270. [Google Scholar] [CrossRef]
- Dahlrot, R.H.; Bangsø, J.A.; Petersen, J.K.; Rosager, A.M.; Sørensen, M.D.; Reifenberger, G.; Hansen, S.; Kristensen, B.W. Prognostic role of Ki-67 in glioblastomas excluding contribution from non-neoplastic cells. Sci. Rep. 2021, 11, 17918. [Google Scholar] [CrossRef]
- Bredel, M.; Piribauer, M.; Marosi, C.; Birner, P.; Gatterbauer, B.; Fischer, I.; Ströbel, T.; Rössler, K.; Budka, H.; Hainfellner, J.A. High expression of DNA topoisomerase IIα and Ki-67 antigen is associated with prolonged survival in glioblastoma patients. Eur. J. Cancer 2002, 38, 1343–1347. [Google Scholar] [CrossRef] [PubMed]
- Cavalheiro, G.R.; Pollex, T.; Furlong, E.E. To loop or not to loop: What is the role of TADs in enhancer function and gene regulation? Curr. Opin. Genet. Dev. 2021, 67, 119–129. [Google Scholar] [CrossRef] [PubMed]
- Panigrahi, A.; O’Malley, B.W. Mechanisms of enhancer action: The known and the unknown. Genome Biol. 2021, 22, 108. [Google Scholar] [CrossRef] [PubMed]
- Dunn, J.; Baborie, A.; Alam, F.; Joyce, K.; Moxham, M.; Sibson, R.; Crooks, D.; Husband, D.; Shenoy, A.; Brodbelt, A.; et al. Extent of MGMT promoter methylation correlates with outcome in glioblastomas given temozolomide and radiotherapy. Br. J. Cancer 2009, 101, 124–131. [Google Scholar] [CrossRef] [PubMed]
- Gurrieri, L.; De Carlo, E.; Gerratana, L.; De Maglio, G.; Macerelli, M.; Pisa, F.E.; Masiero, E.; Aprile, G.; Follador, A.; Puglisi, F.; et al. MGMT pyrosequencing-based cut-off methylation level and clinical outcome in patients with glioblastoma multiforme. Future Oncol. 2018, 14, 699–707. [Google Scholar] [CrossRef]
- Madhugiri, V.S.; Moiyadi, A.V.; Shetty, P.; Gupta, T.; Epari, S.; Jalali, R.; Subeikshanan, V.; Dutt, A.; Sasidharan, G.M.; Roopesh Kumar, V.R.; et al. Analysis of Factors Associated with Long-Term Survival in Patients with Glioblastoma. World Neurosurg. 2021, 149, e758–e765. [Google Scholar] [CrossRef]
- Smits, A.; Lysiak, M.; Magnusson, A.; Rosell, J.; Söderkvist, P.; Malmström, A. Sex disparities in mgmt promoter methylation and survival in glioblastoma: Further evidence from clinical cohorts. J. Clin. Med. 2021, 10, 556. [Google Scholar] [CrossRef]
- Delgado-López, P.D.; Corrales-García, E.M. Survival in glioblastoma: A review on the impact of treatment modalities. Clin. Transl. Oncol. 2016, 18, 1062–1071. [Google Scholar] [CrossRef]
- Wong, E.; Nahar, N.; Hau, E.; Varikatt, W.; Gebski, V.; Ng, T.; Jayamohan, J.; Sundaresan, P. Cut-point for Ki-67 proliferation index as a prognostic marker for glioblastoma. Asia Pac. J. Clin. Oncol. 2019, 15, 5–9. [Google Scholar] [CrossRef]
- Chen, W.J.; He, D.S.; Tang, R.X.; Ren, F.H.; Chen, G. Ki-67 is a valuable prognostic factor in gliomas: Evidence from a systematic review and meta-analysis. Asian Pac. J. Cancer Prev. 2015, 16, 411–420. [Google Scholar] [CrossRef]
- Dumke, R.; Dumke, C.; Eberle, F.; Nimsky, C.; Keber, U.; Engenhart-Cabillic, R.; Lautenschläger, S. Monocentric evaluation of Ki-67 labeling index in combination with a modified RPA score as a prognostic factor for survival in IDH-wildtype glioblastoma patients treated with radiochemotherapy. Strahlenther. Und Onkol. 2022, 198, 892–906. [Google Scholar] [CrossRef] [PubMed]
- Maskowitz, S.I.; Jin, T.; Prayson, R.A. Role of MIB1 in predicting survival in patients with glioblastomas. J. Neurooncol. 2006, 76, 193–200. [Google Scholar] [CrossRef] [PubMed]
- Liu, Q.; Peng, Z.; Shen, L.; Shen, L. Prognostic and Clinicopathological Value of Ki-67 in Melanoma: A Meta-Analysis. Front. Oncol. 2021, 11, 737760. [Google Scholar] [CrossRef] [PubMed]
- Denkert, C.; Budczies, J.; von Minckwitz, G.; Wienert, S.; Loibl, S.; Klauschen, F. Strategies for developing Ki67 as a useful biomarker in breast cancer. Breast 2015, 24, S67–S72. [Google Scholar] [CrossRef]
- Stupp, R.; Hegi, M.E.; Mason, W.P.; van den Bent, M.J.; Taphoorn, M.J.; Janzer, R.C.; Ludwin, S.K.; Allgeier, A.; Fisher, B.; Belanger, K.; et al. Effects of radiotherapy with concomitant and adjuvant temozolomide versus radiotherapy alone on survival in glioblastoma in a randomised phase III study: 5-year analysis of the EORTC-NCIC trial. Lancet Oncol. 2009, 10, 459–466. [Google Scholar] [CrossRef]


| Patient | Age [year] | Sex | KPS [%] | Ki-67 [%] | Primary Therapy | Adjuvant Therapy | OS [m] | PFS [m] | MGMT Exp | MGMT rs16906252 | TERT Prom | TERT rs2853669 |
|---|---|---|---|---|---|---|---|---|---|---|---|---|
| GBM01 | 64 | f | 60 | n.s. | R-Ch-T | none | 7.43 | 4.00 | 0.00 | CC | C250T | TT |
| GBM02 | 85 | m | 40 | ≤50 (30) | none | none | 3.00 | n.s. | 0.00 | CC | wt | TT |
| GBM03 | 53 | f | 100 | n.s. | R-Ch-T | none | 52.50 | 4.50 | 0.00 | CC | C228T | CT |
| GBM04 | 67 | f | 70 | >50 (90) | RT | none | 46.63 | 0.53 | 0.00 | CC | C228T | TT |
| GBM05 | 57 | f | 100 | ≤50 (30) | RT | CCNU | 10.50 | 6.00 | 0.00 | CC | C228T | TT |
| GBM06 | 46 | m | 90 | n.s. | R-Ch-T | TMZ + CCNU | 30.50 | 4.00 | 0.00 | CT (atyp.) | C228T | TT |
| GBM07 | 50 | f | 90 | n.s. | RT | TMZ | 27.40 | n.s. | 0.00 | CC | C250T | n.s. |
| GBM08 | 74 | f | 70 | ≤50 (30) | R-Ch-T 1 | Avastin + TMZ | 7.79 | n.s. | 0.00 | CC | C228T | CT |
| GBM09 | 48 | m | 60 | n.s. | none | none | 1.55 | n.s. | 0.00 | CC | wt | TT |
| GBM10 | 64 | m | 80 | >50 | R-Ch-T | TMZ | 11.70 | n.s. | 0.20 | CC | C228T | CT |
| GBM11 | 73 | f | 60 | >50 | R-Ch-T | no | 10.60 | n.s. | 0.16 | CC | C228T | TT |
| GBM12 | 44 | m | 80 | >50 | R-Ch-T | TMZ | 13.00 | 9.00 | 1.10 | CC | C250T | CT |
| GBM13 | 65 | m | 90 | ≤50 (15) | RT 1 | none | 9.27 | n.s. | 1.20 | CC | C228T | TT |
| GBM14 | 69 | m | 90 | ≤50 (40) | RT | TMZ + CCNU | 8.00 | n.s. | 0.04 | CC | C250T | TT |
| GBM15 | 73 | f | 100 | n.s. | none | none | 7.00 | 2.63 | 1.10 | CC | C250T | CT |
| GBM16 | 83 | m | 90 | ≤50 | RT | none | 9.57 | 9.00 | 1.00 | CC | C228T | CT |
| GBM17 | 74 | m | 90 | n.s. | R-Ch-T | none | 5.19 | n.s. | 1.32 | CC | C250T | CT |
| GBM18 | 44 | m | 100 | n.s. | R-Ch-T | TMZ | 23.15 | n.s. | 0.25 | CC | wt | TT |
| GBM19 | 48 | m | 100 | >50 (60) | R-Ch-T | TMZ | 18.67 | 4.54 | 0.09 | CC | C228T | CT |
| GBM20 | 75 | m | 60 | ≤50 (50) | Ch-T | TMZ | 23.90 | 5.98 | 0.06 | TT | C228T | CT |
| GBM21 | 60 | m | 90 | ≤50 (40) | R-Ch-T | Avastin | 13.00 | 3.00 | 0.40 | CC | C228T | TT |
| GBM22 | 53 | m | 70 | >50 (60) | none | none | 0.89 | n.s. | 0.54 | CC | C250T | TT |
| GBM23 | 47 | f | 70 | >50 (70) | R-Ch-T | TMZ | 37.25 | 8.00 | 0.00 | CC | C250T | CT |
| GBM24 | 64 | m | 90 | ≤50 (40) | R-Ch-T | TMZ | 7.73 | n.s. | 0.49 | CC | C228T | CT |
| GBM25 | 67 | f | 70 | >50 | R-Ch-T | TMZ | 16.80 | 10.00 | 0.00 | CC | C228T | TT |
| GBM26 | 75 | f | 70 | ≤50 (40) | RT | none | 8.22 | n.s. | 0.00 | CC | C228T | CT |
| GBM27 | 52 | f | 90 | >50 (70) | R-Ch-T | TMZ | n.s. | n.s. | 0.00 | TT | C250T | TT |
| GBM28 | 63 | m | n.s. | >50 | R-Ch-T | TMZ | 21.80 | 8.00 | 0.00 | CC | C250T | CT |
| GBM29 | 79 | f | 40 | >50 | none | none | 1.31 | n.s. | 0.00 | CC | C228T | CT |
| GBM30 | 58 | m | 90 | >50 | R-Ch-T | TMZ | 16.00 | 4.31 | 0.00 | CC | C228T | TT |
| GBM31 | 58 | f | n.s. | >50 | R-Ch-T | TMZ | 13.30 | 4.00 | 0.00 | CC | C228T | TT |
| GBM32 | 71 | m | n.s. | ≤50 (20) | none | none | 1.25 | n.s. | 0.00 | CC | C228T | TT |
| GBM33 | 57 | m | n.s. | n.s. | R-Ch-T | TMZ | 12.70 | 6.00 | 0.20 | CC | C250T | CT |
| GBM34 | 53 | m | n.s. | n.s. | R-Ch-T | TMZ | 32.30 | 22.00 | 0.00 | CC | C228T | TT |
| GBM35 | 64 | m | 40 | n.s. | R-Ch-T | none | 10.60 | n.s. | 0.00 | CC | C228T | TT |
| Promoter | Enhancer 4 | ||||||
|---|---|---|---|---|---|---|---|
| Cut-Off | CpG | Hazard Ratio (95% CI) | p-Value | Cut-Off | CpG | Hazard Ratio (95% CI) | p-Value |
| (<8% vs. ≥8%) | mean 72–83 | 2.18 (1.01–4.71) | 0.042 | (≥55% vs. <55%) | mean 01–03 | 2.97 (1.31–6.74) | 0.007 |
| 72 | 2.81 (1.23–6.40) | 0.011 | 01 | 0.71 (0.31–1.60) | 0.402 | ||
| 73 | 2.55(1.15–5.66) | 0.018 | 02 | 2.05 (0.97–4.30) | 0.054 | ||
| 74 | 2.52 (1.16–5.50) | 0.017 | 03 | 2.27 (1.01–5.10) | 0.042 | ||
| 75 | 2.18(1.01–4.71) | 0.042 | mean 07–08 | 1.81 (0.25–1.12) | 0.118 | ||
| 76 | 2.76 (1.24–6.14) | 0.010 | 07 | 3.27 (1.32–8.12) | 0.008 | ||
| 77 | 2.76 (1.24–6.14) | 0.010 | 08 | 0.96 (0.47–1.97) | 0.915 | ||
| 78 | 3.35 (1.43–7.85) | 0.004 | mean 09–13 | 2.34 (1.06–5.13) | 0.030 | ||
| 79 | 2.36 (1.08–5.17) | 0.028 | 09 | 2.19 (0.94–5.08) | 0.063 | ||
| 80 | 2.18 (1.01–4.71) | 0.042 | 10 | 1.93 (0.87–4.27) | 0.102 | ||
| 81 | 2.18 (1.01–4.71) | 0.042 | 11 | 1.83 (0.76–4.37) | 0.172 | ||
| 82 | 2.36 (1.08–5.17) | 0.028 | 12 | 1.18 (0.59–2.35) | 0.641 | ||
| 83 | 2.18 (1.01–4.71) | 0.042 | 13 | 2.30 (1.05–5.07) | 0.033 | ||
| (≥75% vs. <75%) | mean 19–22 | 1.84 (0.90–3.75) | 0.092 | ||||
| 19 | 1.43 (0.69–3.00) | 0.337 | |||||
| 20 | 1.22 (0.52–2.83) | 0.647 | |||||
| 21 | 1.11 (0.56–2.23) | 0.762 | |||||
| 22 | 0.85 (0.38–1.91) | 0.696 | |||||
| Covariate | Hazard Ratio (95% CI) | p-Value |
|---|---|---|
| Ki-67 index (≤50% vs. >50%) | 2.72 (1.11–6.70) | 0.024 |
| KPS (≥80% vs. <80%) | 0.78 (0.37–1.64) | 0.507 |
| primary therapy (R-Ch-T vs. none or RT) | 0.01 (0.001–0.11) | <0.001 |
| adjuvant therapy (TMZ alone vs. none or other) | 0.50 (0.23–1.09) | 0.201 |
| adjuvant therapy (yes vs. no) | 0.56 (0.27–1.16) | 0.113 |
| age (≥60 vs. <60) | 2.28 (1.11–4.70) | 0.022 |
Disclaimer/Publisher’s Note: The statements, opinions and data contained in all publications are solely those of the individual author(s) and contributor(s) and not of MDPI and/or the editor(s). MDPI and/or the editor(s) disclaim responsibility for any injury to people or property resulting from any ideas, methods, instructions or products referred to in the content. |
© 2023 by the authors. Licensee MDPI, Basel, Switzerland. This article is an open access article distributed under the terms and conditions of the Creative Commons Attribution (CC BY) license (https://creativecommons.org/licenses/by/4.0/).
Share and Cite
Zappe, K.; Pühringer, K.; Pflug, S.; Berger, D.; Weis, S.; Spiegl-Kreinecker, S.; Cichna-Markl, M. Association of MGMT Promoter and Enhancer Methylation with Genetic Variants, Clinical Parameters, and Demographic Characteristics in Glioblastoma. Cancers 2023, 15, 5777. https://doi.org/10.3390/cancers15245777
Zappe K, Pühringer K, Pflug S, Berger D, Weis S, Spiegl-Kreinecker S, Cichna-Markl M. Association of MGMT Promoter and Enhancer Methylation with Genetic Variants, Clinical Parameters, and Demographic Characteristics in Glioblastoma. Cancers. 2023; 15(24):5777. https://doi.org/10.3390/cancers15245777
Chicago/Turabian StyleZappe, Katja, Katharina Pühringer, Simon Pflug, Daniel Berger, Serge Weis, Sabine Spiegl-Kreinecker, and Margit Cichna-Markl. 2023. "Association of MGMT Promoter and Enhancer Methylation with Genetic Variants, Clinical Parameters, and Demographic Characteristics in Glioblastoma" Cancers 15, no. 24: 5777. https://doi.org/10.3390/cancers15245777