Article

Unraveling the Role of Molecular Profiling in Predicting Treatment Response in Stage III Colorectal Cancer Patients: Insights from the IDEA International Study

by
Ippokratis Messaritakis
1,*,
Eleni Psaroudaki
1,
Konstantinos Vogiatzoglou
1,
Maria Sfakianaki
1,
Pantelis Topalis
2,
Ioannis Iliopoulos
3,
Dimitrios Mavroudis
1,4,
John Tsiaoussis
5,
Nikolaos Gouvas
6,
Maria Tzardi
7 and
John Souglakos
1,4
1
Laboratory of Translational Oncology, Medical School, University of Crete, 70013 Heraklion, Greece
2
Institute of Molecular Biology and Biotechnology, Foundation for Research and Technology-Hellas, 70013 Heraklion, Greece
3
Laboratory of Computational Biology, Division of Basic Sciences, School of Medicine, University of Crete, 71003 Heraklion, Greece
4
Department of Medical Oncology, University General Hospital of Heraklion, 71100 Heraklion, Greece
5
Department of Anatomy, School of Medicine, University of Crete, 70013 Heraklion, Greece
6
Medical School, University of Cyprus, 99010 Nicosia, Cyprus
7
Laboratory of Pathology, Medical School, University of Crete, 70013 Heraklion, Greece
*
Author to whom correspondence should be addressed.
Cancers 2023, 15(19), 4819; https://doi.org/10.3390/cancers15194819
Submission received: 16 August 2023 / Revised: 6 September 2023 / Accepted: 28 September 2023 / Published: 30 September 2023
(This article belongs to the Section Cancer Informatics and Big Data)

Abstract

:

Simple Summary

The treatment and prognosis of colorectal cancer (CRC) patients vary depending on their disease stage at diagnosis. Understanding the processes of tumorigenesis and disease development can reveal new therapeutic targets and guide patient management. On the basis of this, we investigated the molecular profiles of 237 patients with stage III CRC enrolled in the international IDEA study. We also correlated the molecular profile with Toll-like and vitamin D receptor polymorphisms, clinicopathological and epidemiological characteristics, and patient outcomes. This study suggests that the molecular characterization of tumor cells may contribute to the understanding of the biological disease course. Mutations can serve as promising prognostic biomarkers leading to better treatment options. If the results are confirmed in larger patient cohorts, then this is expected to guide clinical decision-making and personalized and improved care, and reduce treatment toxicity and patient and health system costs.

Abstract

Background: This study aimed to investigate the molecular profiles of 237 stage III CRC patients from the international IDEA study. It also sought to correlate these profiles with Toll-like and vitamin D receptor polymorphisms, clinicopathological and epidemiological characteristics, and patient outcomes. Methods: Whole Exome Sequencing and PCR-RFLP on surgical specimens and blood samples, respectively, were performed to identify molecular profiling and the presence of Toll-like and vitamin D polymorphisms. Bioinformatic analysis revealed mutational status. Results: Among the enrolled patients, 63.7% were male, 66.7% had left-sided tumors, and 55.7% received CAPOX as adjuvant chemotherapy. Whole exome sequencing identified 59 mutated genes in 11 different signaling pathways from the Kyoto Encyclopedia of Genes and Genomes (KEGG) CRC panel. On average, patients had 8 mutated genes (range, 2–21 genes). Mutations in ARAF and MAPK10 emerged as independent prognostic factors for reduced DFS (p = 0.027 and p < 0.001, respectively), while RAC3 and RHOA genes emerged as independent prognostic factors for reduced OS (p = 0.029 and p = 0.006, respectively). Right-sided tumors were also identified as independent prognostic factors for reduced DFS (p = 0.019) and OS (p = 0.043). Additionally, patients with tumors in the transverse colon had mutations in genes related to apoptosis, PIK3-Akt, Wnt, and MAPK signaling pathways. Conclusions: Molecular characterization of tumor cells can enhance our understanding of the disease course. Mutations may serve as promising prognostic biomarkers, offering improved treatment options. Confirming these findings will require larger patient cohorts and international collaborations to establish correlations between molecular profiling, clinicopathological and epidemiological characteristics and clinical outcomes.

1. Introduction

Colorectal cancer (CRC) is one of the most common malignancies and the second most common cause of death from cancer [1]. In 2020, 1.9 million new cases of CRC and approximately 935,000 deaths were reported [2]. By 2030, the global burden of CRC is predicted to be 60%, with more than 2.2 million new cases and 1.1 million deaths. By 2035, the total number of deaths from rectal and colon cancer is estimated to increase by 60% and 71.5%, respectively [2]. Depending on the stage of the disease at the time of diagnosis, both the treatment and prognosis differ. Patients with stage III CRC have an overall 5-year survival rate of 60%. Adjuvant chemotherapy aims to increase this rate and extend both the overall and disease-free survival [3]. Since 2004, folinic acid, fluorouracil, and oxaliplatin (FOLFOX) or capecitabine and oxaliplatin) for six months has been the standard treatment regimen [3,4]. However, oxaliplatin can lead to adverse effects, particularly peripheral sensory neuropathy [5].
Considering the increased incidence of the disease, toxicity of the treatment, cost, and efforts to reduce the duration of treatment for all the aforementioned reasons [5], the international IDEA study was designed to evaluate the hypothesis of non-inferiority of the 3-month vs. 6-month adjuvant chemotherapy with FOLFOX or CAPOX [6].
Although strong, AJCC/UICC-TNM staging (American Joint Committee on Cancer/Union Internationale Contre le Cancer—extent of primary tumor, regional lymph node involvement, presence of distant metastases) often fails to provide complete prognostic information because the outcome varies even among patients at the same stage [7]. Therefore, there is an urgent need to identify new tools that can contribute to CRC prognosis. The aim of the current study was to investigate the molecular profile of surgical specimens from stage III CRC patients enrolled in the international IDEA study, for whom paraffin-embedded cancer tissue was available. Following genetic profiling, correlations were performed with clinicopathological characteristics, as well as with patient outcomes. Additionally, the patients were tested for vitamin D receptor (VDR) and Toll-like receptor (TLR) gene polymorphisms in peripheral blood, as our previous studies have demonstrated the role of such polymorphisms in tumor development and progression [8,9,10].

2. Patients and Methods

2.1. Patient Enrollment

The Hellenic Oncology Research Group (HORG) enrolled 708 patients with CRC in the international IDEA study (ClinicalTrials.gov Identifier: NCT01308086). Of these, 237 stage III patients enrolled from September 2009–July 2015, with formalin-fixed paraffin-embedded (FFPE) tissues, were included in the current study (Supplementary Table S1). All patients were aged >18 years and received adjuvant chemotherapy with FOLFOX or CAPOX. None of the enrolled subjects had any other documented malignancies.

2.2. Formalin-Fixed Paraffin-Embedded (FFPE) Tissues

All surgical materials were evaluated by a specialized pathologist at the Department of Pathology of the University General Hospital of Heraklion, Crete, and the most representative and enriched tumor areas were selected for dissection. Healthy tissue was used as the control tissue. The specifications of the FFPE sections used for DNA extraction were as follows: a. tissue surface area, 25 mm2; b. section thickness, 10 μm; c. At least 10 sections with >50% cancer cells; d. Cancer cells were collected from areas rich in cancerous tissue and avoiding healthy tissue, adipose tissue, necrotic areas, and lymphocytes that decrease the content of cancer DNA. To facilitate the collection of appropriate cells from the 10 sections, an additional section was stained with hematoxylin-eosin to locate the cancerous areas.

2.3. TLR and VDR Genotyping in Blood Samples

A total of 5 mL of peripheral blood in EDTA was collected from each patient, and DNA was extracted using the QIAamp DNA Blood Mini kit (QIAGEN, Hilden, Germany) according to the manufacturer’s instructions. The DNA concentration was determined using a NanoDrop ND-1000 v3.3 spectrophotometer (Thermo Fisher Scientific, Wilmington, DE, USA).
To determine the genetic variants of TLRs and VDRs, polymerase chain reaction and restriction fragment length polymorphism (PCR-RFLP) were used to determine the genetic variants of TLRs and VDRs. For TLR2 196-to-174 Ins/Del genetic variants, PCR was used, while TLR4 (Asp299Gly-rs4986790 and Thr399Ile-rs4986791) and TLR9 (T1237C-rs5743836 and T1486C-rs187084) genetic variants were determined using PCR-RFLP. The materials and conditions for each gene target have been previously described [8,9]. Similarly, for genotyping of VDR genetic variants at the TaqI (rs731236), ApaI (rs7975232), FokI (rs10735810), and BsmI (rs1544410) positions, PCR-RFLP was used. The reagents and PCR conditions have been previously described in detail [8,9,10]. The patients were classified as wild-type, heterozygous, or homozygous for each single nucleotide polymorphism, based on the absence or presence of the restriction site in both alleles.

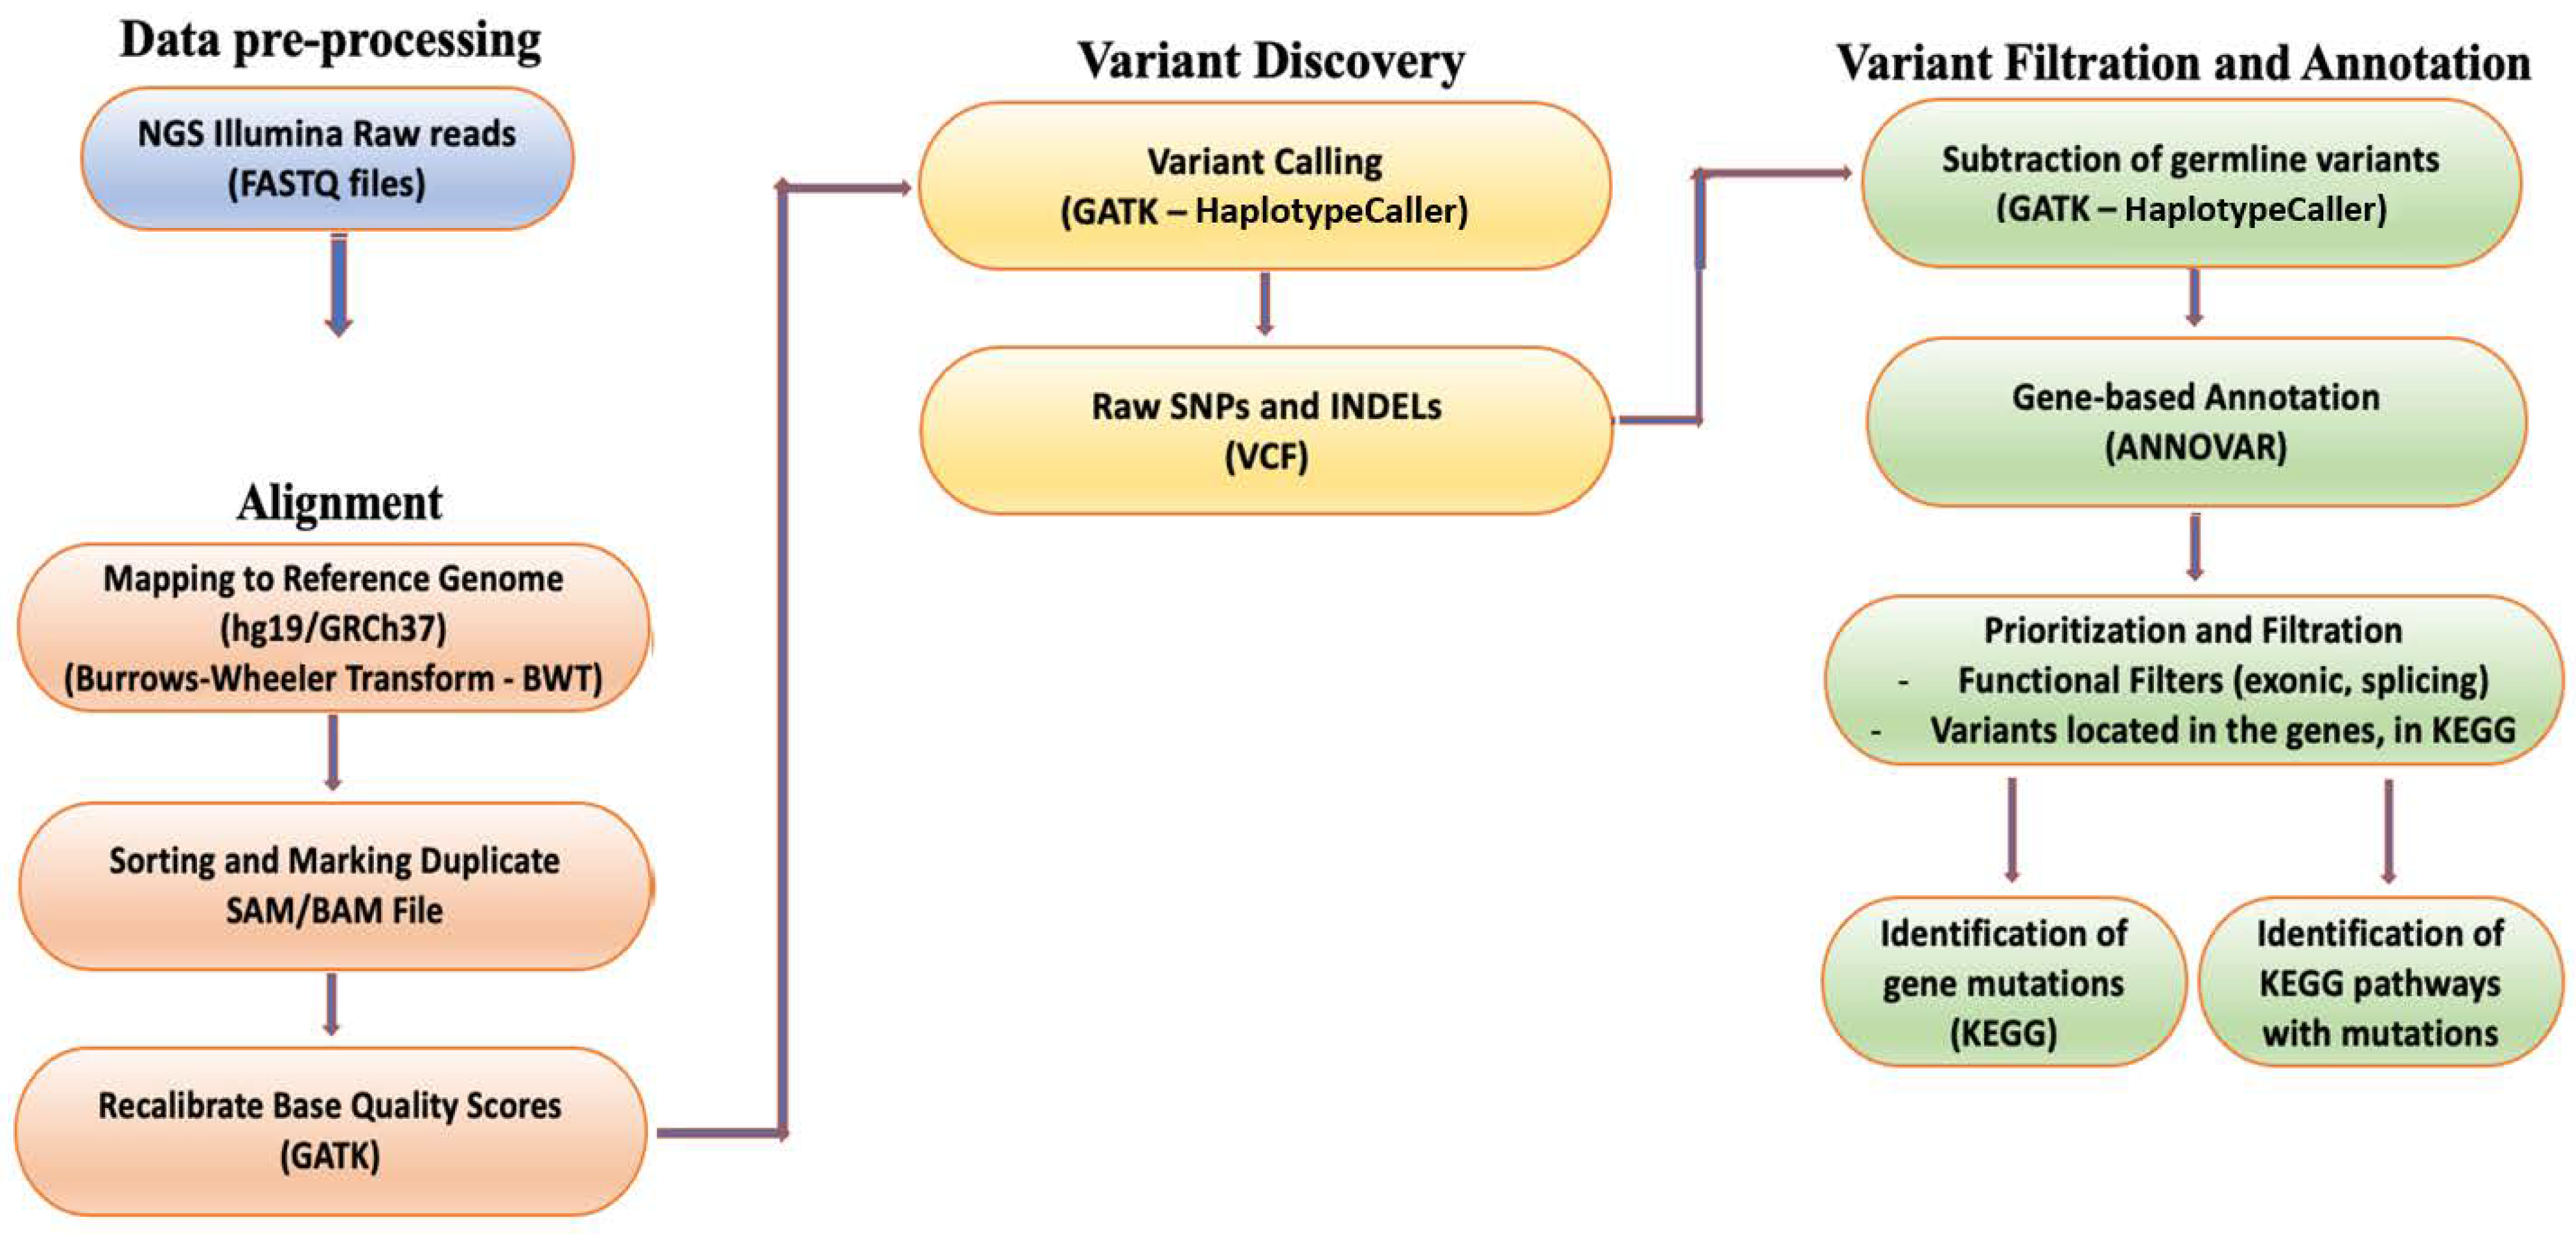
2.4. Whole Exome Sequencing (WES)

The Illumina DNA Prep with Enrichment kit (Illumina, San Diego, CA, USA, 92122) was used for library preparation and enrichment, and sequencing of both tumor and normal tissues was conducted using the NovaSeq 6000 system (Illumina) flow cell. For each sample, 250–350 ng of high-quality DNA was quantified using a Qubit Fluorometer (Thermo Fisher Scientific, Paisley, UK), ensuring consistency across all samples. Samples with quality threshold 260/280 ratio of at least 1.8–2.2 were selected to ensure high-quality DNA and used for library preparation. Following the WES, two files (.fastq) containing sequencing data were extracted from each tissue (tumor and normal) using forward and reverse reads (2 × 150 base pairs). The coverage within the designated target region and the number of generated reads exceeded the threshold set by the manufacturer (Illumina). Specifically, the coverage reached a level of 150×, while the number of reads surpassed 40 billion.

2.5. Bioinformatic Analysis

After obtaining the raw data from the WES analysis, a bioinformatics pipeline was used to process the data and generate interpretations. This included alignment to the human genome, variant calling, variant filtering, and annotation of the variants. The processed data were analyzed to identify somatic variants and evaluate their functional significance, particularly those associated with CRC (Figure 1) [11,12,13]. Initially, the raw sequences were aligned to the human genome (version hg19/GRCh37) [14] utilizing the Burrows–Wheeler Transform [15], and variant calling was conducted using the genome analysis toolkit (GATK, version 4.2.3) for SNPs and insertion/deletions (INDELs). This generates two variant call format files (VCF) for each patient: one for the tumor and one for the normal tissue, respectively [16]. The somatic variants were isolated by subtracting the germline variants from the tumor, and a custom gene panel was utilized based on the Kyoto Encyclopedia of Genes and Genomes (KEGG) database on CRC-correlated genes [17] (Supplementary Tables S2 and S3). Subsequently, ANNOVAR software (version 2.17) was employed to annotate the SNPs and INDELs, providing functional information that can determine the biological significance of each variant and identify CRC-associated variants [18].
To identify clinically significant variants and the signaling pathways involved, a filtering strategy was employed based on the functional position of the variants. Variants located in exons and splice sites were isolated as they are more likely to cause diseases [19]. In addition, the variants located in exons were further filtered based on their functional consequences, excluding variants causing synonymous mutations. This step considered synonymous mutations that do not affect the amino acid sequence of proteins and are therefore less likely to be clinically relevant. All analyses were run in the Anaconda Powershell Prompt (Anaconda3, Inc., Wang and Oliphant, Berlin, Germany) on Ubuntu 20.04.3 LTS.

2.6. Consensus Molecular Subgroups (CMS) Assignation

Regarding the CMS subtypes, patients were classified into four subtypes according to the transcriptomics of CRC [20]. CMS1 (immune) is characterized by microsatellite instability (MSI), high levels of mutations in CpG island methylator phenotype (CIMP) and BRAF genes, and a low prevalence of SNCA gene mutations. It is associated with lymphocyte infiltration and immune activation, along with prominent hypermethylation and reduced signaling through the WNT pathway [21,22]. CMS2 (canonical) demonstrates epithelial characteristics and is marked by high chromosomal instability, an elevated count of somatic copy number alterations, as well as mutations in the WNT and MYC genes, leading to heightened activity in these intracellular signaling pathways [21,22]. CMS3 (metabolic) exhibits a distinctive global genomic and epigenomic profile with mixed features, including metabolic reprogramming and dysregulated pathways. It displays increased activity in glutaminolysis and lipidogenesis, enriched with KRAS-activating mutations. CMS3 presents a moderate or low mixed state of MSI, intermediate CIMP, and moderate activation of WNT and MYC signaling. Additionally, it is characterized by PIK3CA mutations and IGBP3 overexpression but lacks BRAF mutations [21,22]. CMS4 (mesenchymal) is typified by positive gene regulation and the overexpression of proteins involved in stromal infiltration, mesenchymal activation, extracellular matrix remodeling, neoangiogenesis, prominent TGF-β activation, and complement pathways. The presence of CTNNB1 mutations is a distinguishing feature of CMS4 [22].

2.7. Statistical Analysis

After characterizing the patients’ molecular profiles, the clinical, pathological, and epidemiological characteristics were examined to determine their association with patient outcomes. Disease-free survival (DFS) and overall survival (OS) were calculated from the day of tumor excision until the first documented recurrence or death, respectively. Recurrence was defined as the presence of metastatic disease, local recurrence, or a second primary tumor. The possible associations between baseline characteristics, recurrence, and individual or concurrent mutations were compared using the 2-sided Fisher exact test for categorical variables. The association between risk factors and time-to-event endpoints was evaluated using the log–rank test, and the Kaplan–Meier method was used to generate DFS and OS curves. Univariate and multivariate Cox regression analyses were conducted to evaluate the correlation between the potential prognostic factors and DFS or OS. Statistical significance was defined as p ≤ 0.05, and the statistical tool used was SPSS v. 26.
Additionally, Monte Carlo simulation methods were performed. The Monte Carlo approach, named after the Monte Carlo Casino in Monaco due to its reliance on stochastic principles, is a computational procedure that employs random sampling to tackle intricate mathematical and statistical quandaries. This method entails the generation of random samples from known probability distributions, subsequently utilizing these samples to approximate solutions to problems that defy analytical resolution [23,24,25]. The results indicate a high level of confidence (99%), at the 95% significance level, with the predicted statistical power deviating by no more than 4% from the values generated by simulation across various model parameters. This equates to sample size discrepancies of fewer than four subjects and discrepancies in the detectable accuracy difference of less than 0.6%.

3. Results

3.1. Patients

The current investigation enrolled 237 patients with stage III CRC, and their characteristics are displayed in Table 1 and Supplementary Table S1. Among these patients, 151 (63.7%) were male, 159 (67.1%) were <70 years old (median: 64 years, range: 18–84), 158 (66.7%) had tumor localization in the left colon, and 132 (55.7%) patients underwent CAPOX as adjuvant chemotherapy. Of the entire patient population, 116 (48.9%) were administered a 3-month treatment regimen, while 121 (51.1%) were administered a 6-month treatment regimen.

3.2. TLR and VDR Analysis

For VDR and TLR gene polymorphisms, 84 patients were analyzed according to sample availability. Regarding VDRs, 10 (11.9%), 7 (8.2%), 5 (6.0%), and 17 (20.2%) patients presented TaqI, ApaI, FokI, and BsmI homozygous phenotypes, respectively (Table 2). Moreover, regarding TLRs, 48 (57.1%), 38 (46.4%), 38 (46.4%), 37 (44.0%), and 37 (44.0%) patients presented TLR2 196-to-174, TLR4-Asp299Gly, TLR4-Thr399Ile), TLR9-T1237C, and TLR9-T1486C homozygous phenotype, respectively (Table 2). Patients with TaqI, ApaI, and BsmI wild-type alleles are more likely to survive (p = 0.005; p = 0.021 and p = 0.033, respectively).

3.3. Annotated Variants for Each Position

The KEGG CRC panel detected 85,871 uniquely annotated variants. Of these, 602 were detected in exonic positions, including 25 splice variants. The remaining variants were non-coding, with 81,555 intronic variants being the most common, followed by 2184 UTR variants, 788 downstream variants, and 742 upstream variants.

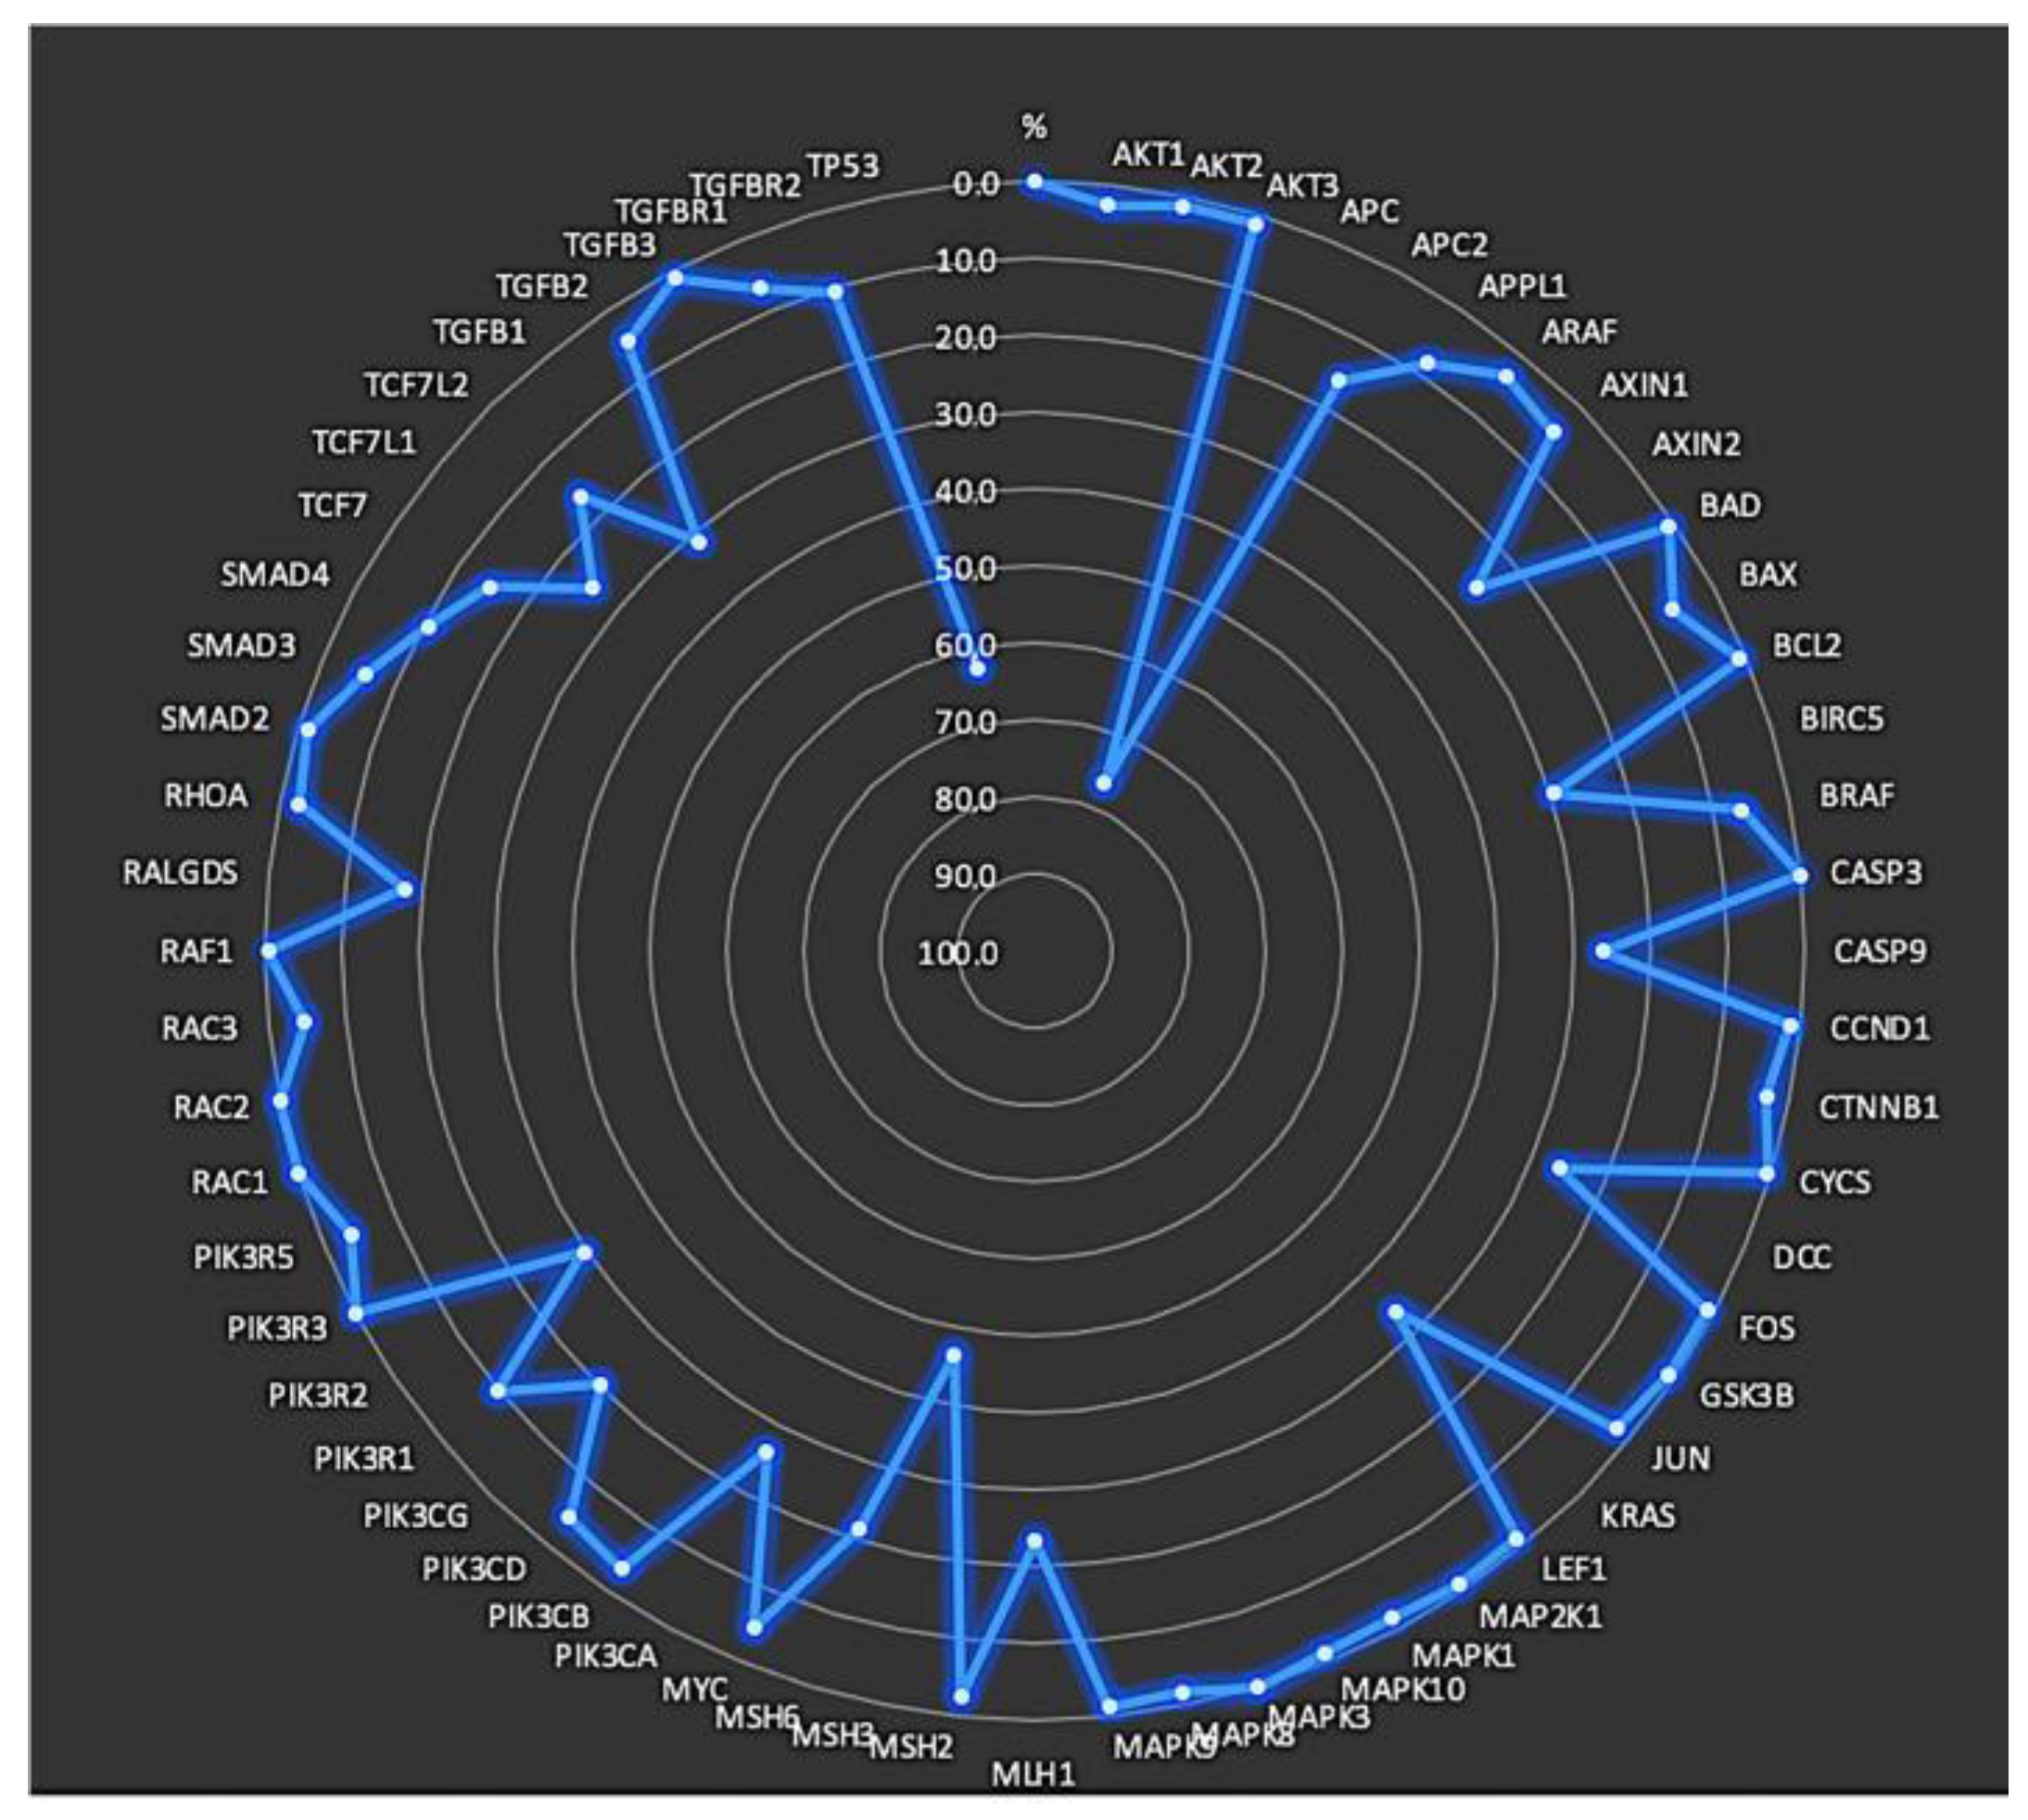
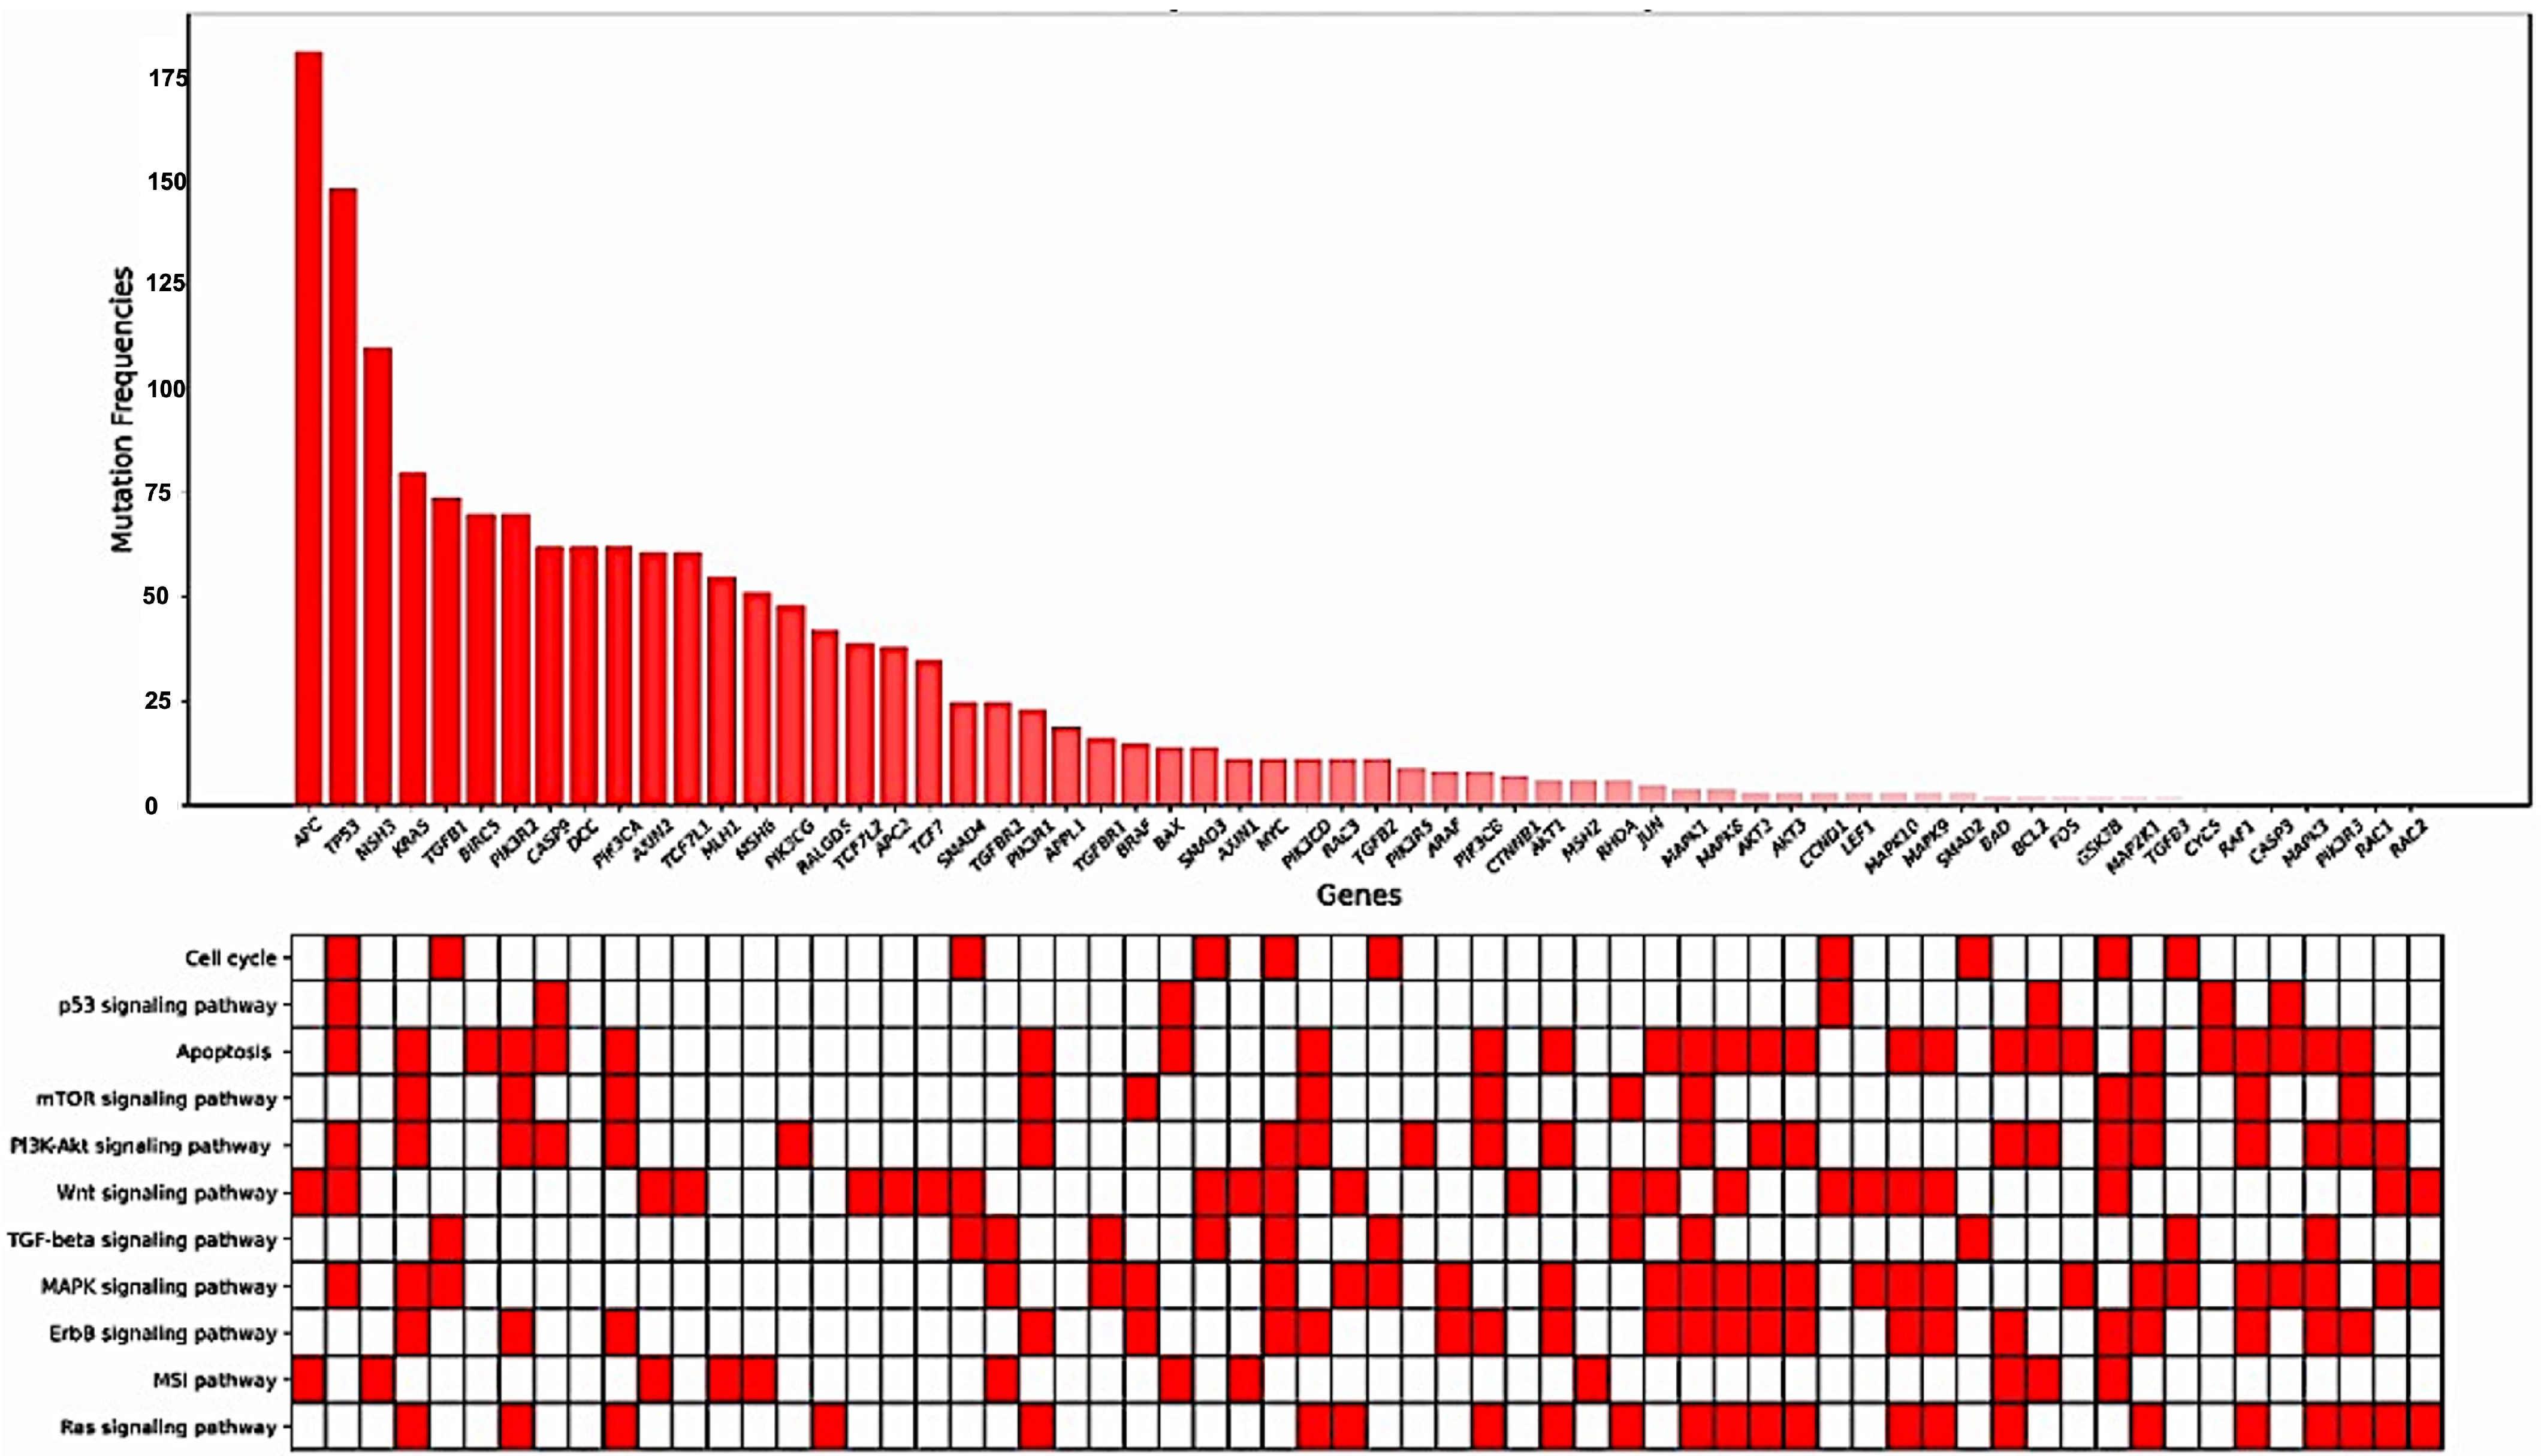
3.4. Identification of Mutated Genes

Mutated genes within the KEGG CRC gene panel for each patient were identified. On average, the patients exhibited eight mutated genes (range, 2–21 genes). The frequencies of mutations in each gene, specifically in exons and splicing sites, are presented in Table 3 and Figure 2 and Figure 3.
From this analysis, it was observed that certain groups of patients had a higher mutation frequency in specific genes (Table 4). In brief, males had a significantly higher frequency of mutations in the JUN and MAPK3 genes than females (p = 0.05, p = 0.05, respectively). In terms of age groups, patients below 70 years of age had a higher frequency of mutations in TGFBR1 than those ≥70 years of age (p = 0.012). Similarly, patients 51–70 years old had more frequent mutations in BAD (p < 0.001), RAC (p = 0.016), AKT, AKT2, AKT3, APC, APPL1, AXIN1, AXIN2, BIRC5, DCC, GSK3B, KRAS, MAPK1, MAPK8, MAPK9, MAPK10, MLH1, MSH6, PΙK3CA, PIK3R1, PIK3R2, PIK3R5, RAF1, RALGDS, SMAD2, SMAD3, TCF7L2, TGFB1, and TGFB2 genes (p = 0.037). Moreover, mutation rates in ARAF, MAPK10, CASP, TCF7, and TGFB3 genes were significantly higher in patients relapsed after adjuvant treatment (p = 0.027, p = 0.044, p = 0.003, and p = 0.037, respectively).
Subsequently, it was demonstrated that patients with tumors located in the transverse colon, homozygous for mutated VDR alleles (TaqI, ApaI, FokI, BsmI) and homozygous for mutated TLR9 alleles (T1237C and T1486C) had mutations in genes that are mainly involved in the apoptosis, PIK3-AKT, Wnt, and MAPK signaling pathways (Table 5).

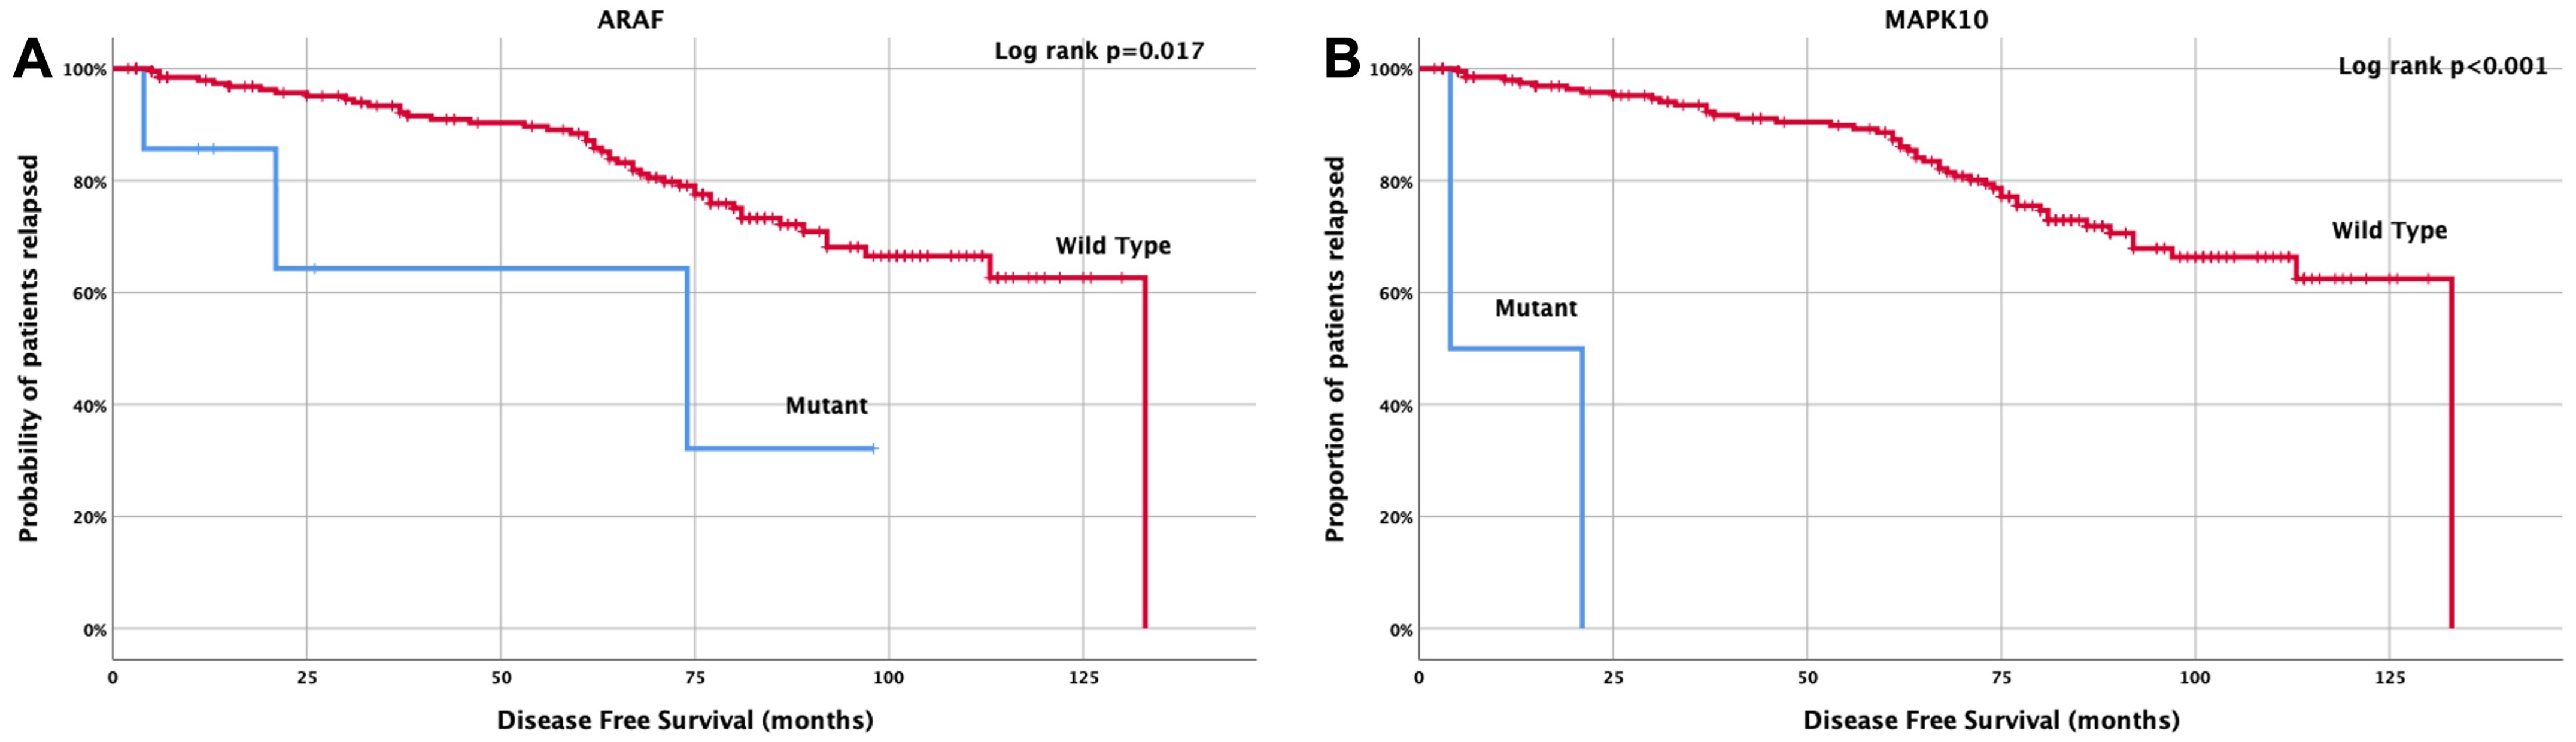
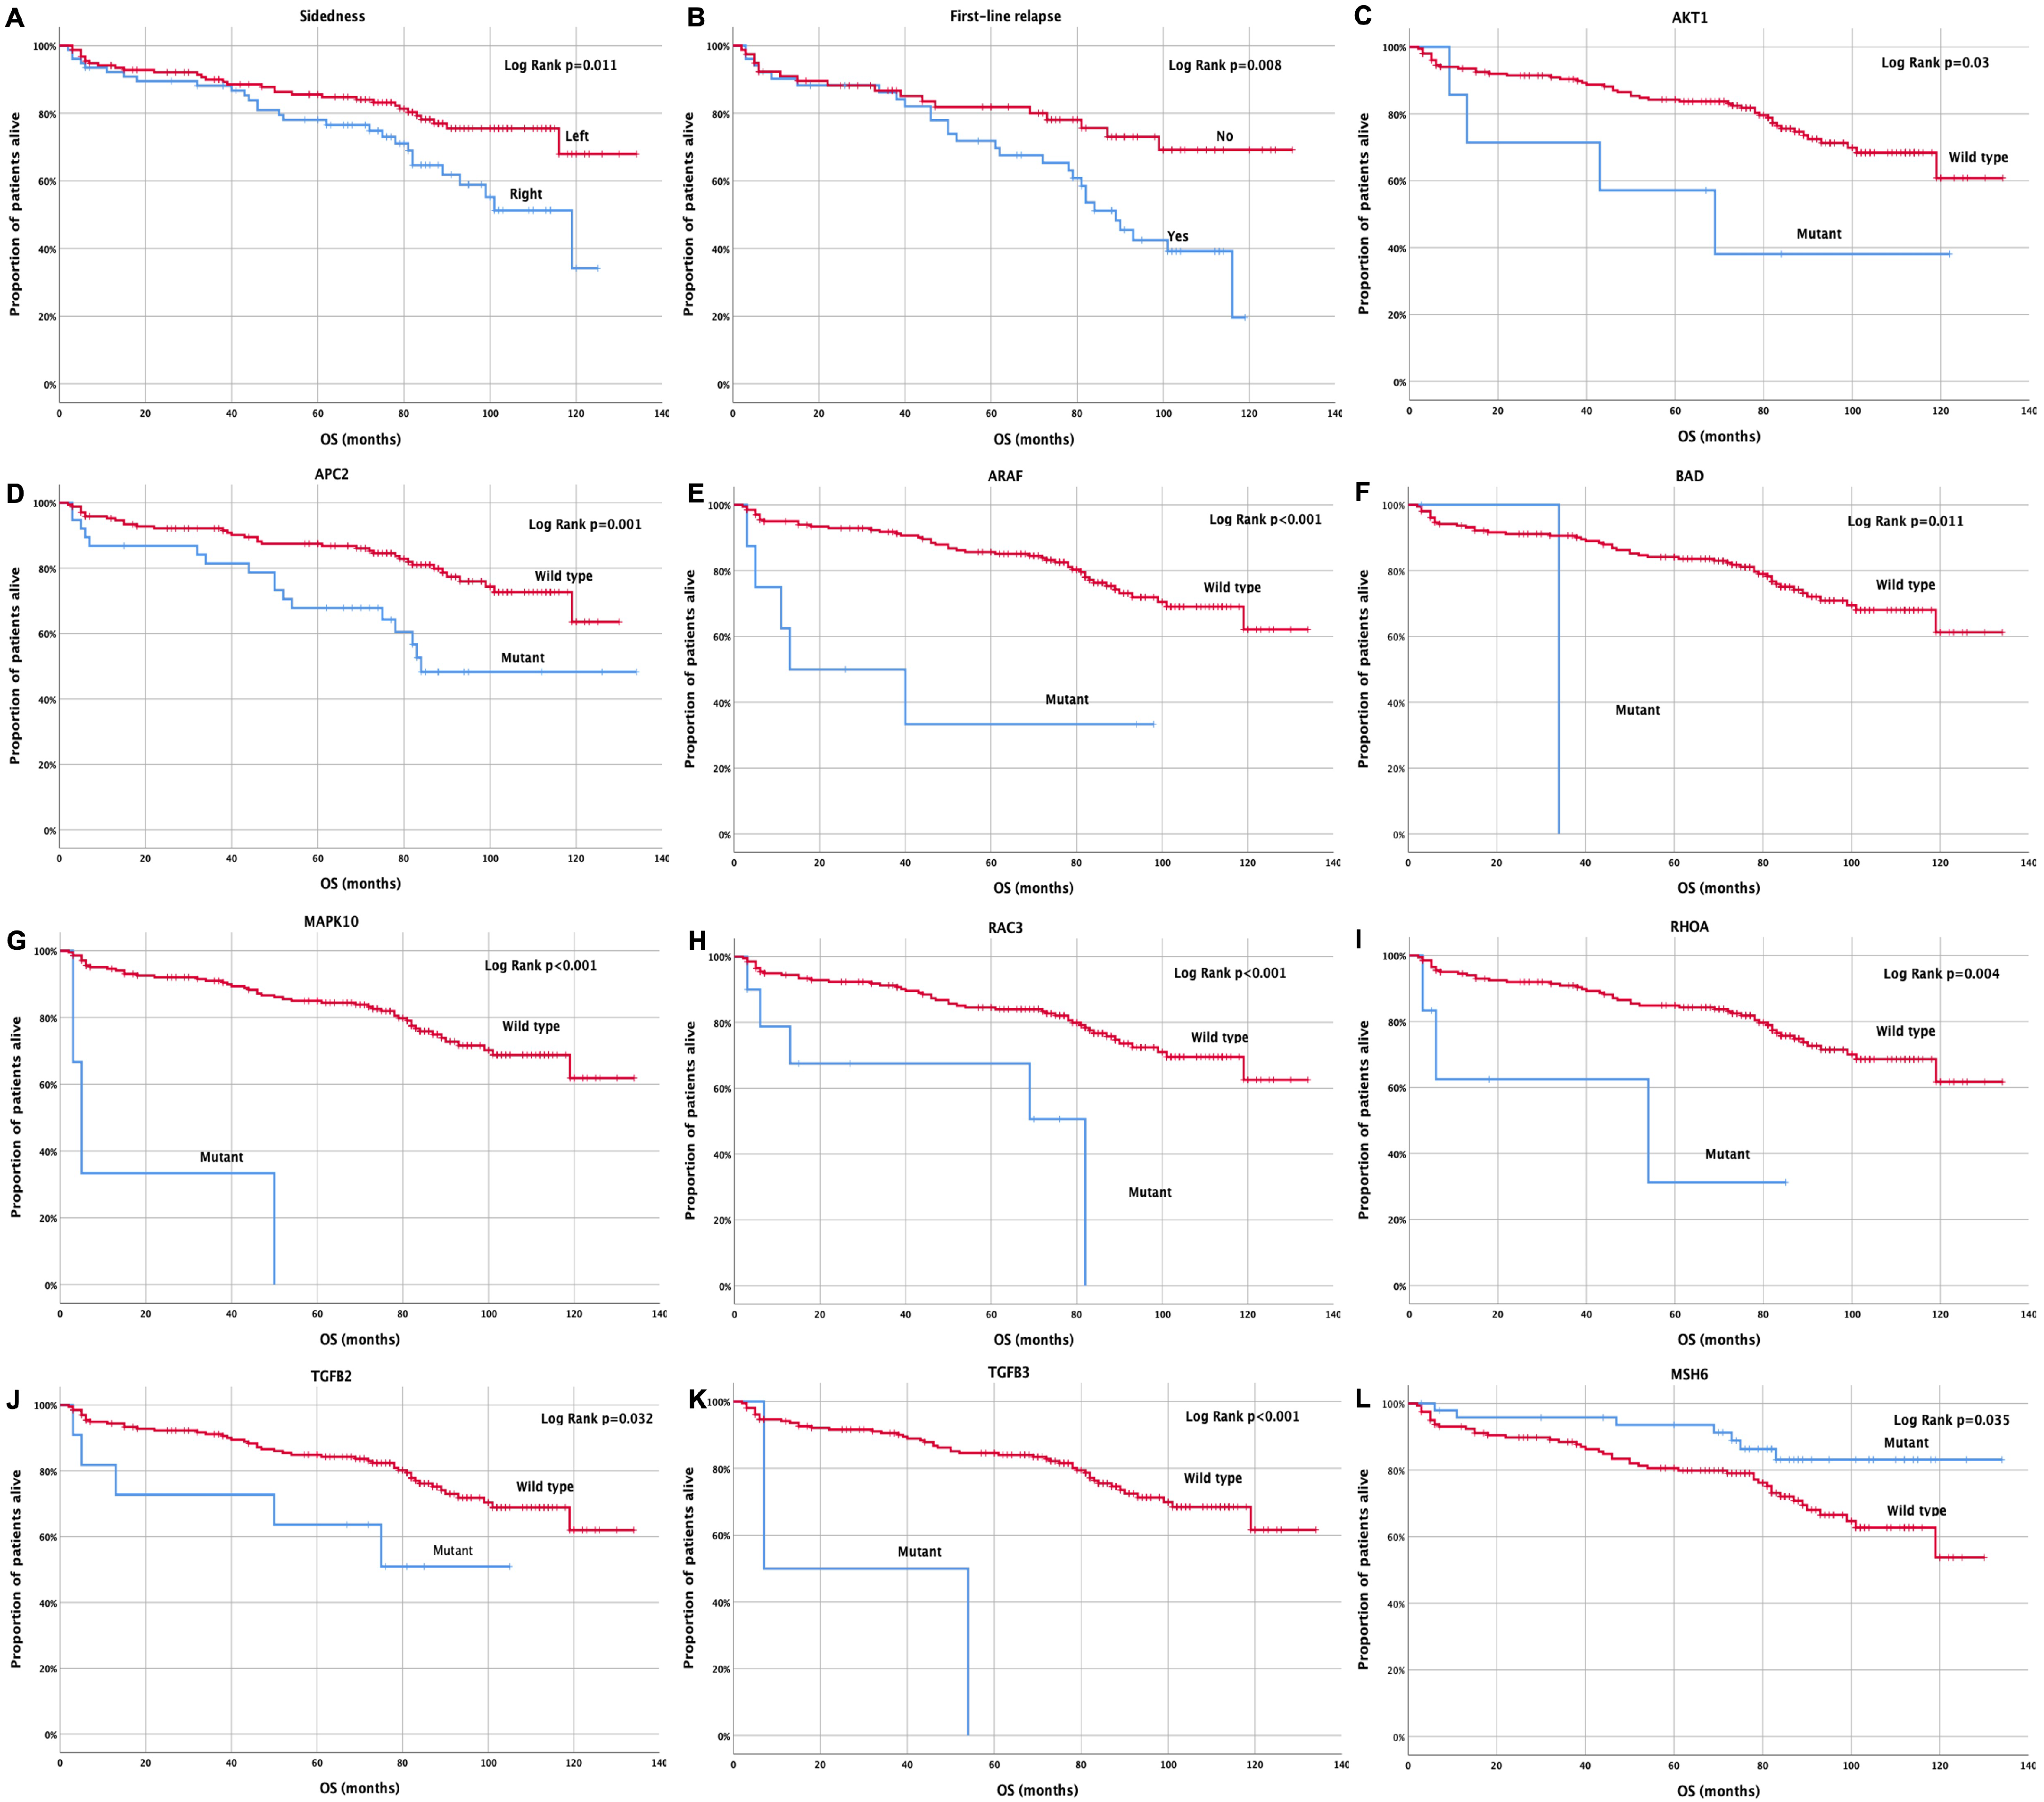
3.5. Clinical Outcome Based on Molecular Profile and Patients’ Characteristics

Regarding disease-free survival (DFS), it was demonstrated that patients with ARAF mutations had a significantly shorter DFS (74 months, 95% CI: 29.3–154.9 months) compared with those with wild-type ARAF mutations (133 months, 95% CI: 101–138 months, p = 0.017) (Figure 4A). Similarly, patients with MAPK10 mutations exhibited a significantly shorter DFS compared with wild-type patients (12.5 months, 95% CI: 0.0–29 months vs. 108 months, 95% CI: 101–114 months; p < 0.001) (Figure 4B).
Similarly, it was demonstrated that patients with right-sided tumors experienced a significantly shorter overall survival (OS) compared with patients with left-sided tumors (92.1 months, 95% CI: 82.5–122 months vs. 111.3 months, 95% CI: 104–135 months; p = 0.011) (Figure 5A). Moreover, relapsed patients demonstrated a significantly shorter OS compared with those non-relapsed (81.1 months, 95% CI: 70.4–118 months vs. 104.3 months, 95% CI: 93.9–130 months; p = 0.008) (Figure 5Β). Moreover, patients with AKT1, APC2, ARAF, BAD, MAPK10, RAC3, RHOA, TGFB2, and TGFB3 mutations exhibited a significantly shorter OS compared to wild-type patients (68.9 vs. 107.9 months, p = 0.03; 89.7 vs. 109.4 months, p = 0.001; 43.3 vs. 109.4 months, p < 0.001; 34 vs. 107.7 months, p = 0.011; 19.3 vs. 108.6 months, p > 0.001; 55.6 vs. 109 months, p < 0.001; 45.2 vs. 108.5 months, p = 0.004; 69.5 vs. 109.7 months, p = 0.032; 30.5 vs. 108.1 months, p < 0.001, respectively) (Figure 5C–K). Finally, patients with MSH6 gene mutations had a significantly longer OS compared with wild-type patients (120.7 months, 95% CI: 111.3–130.1 months vs. 100.9 months, 95% CI: 93.7–108.1 108.1 months; p = 0.008) (Figure 5L). Moreover, regarding the CMS subtypes, 5.5% of the patients were classified as CMS1 subtype based on BRAF and MSI pathway mutations; 2.5% of the patients were classified as CMS2, based on Myc and Wnt pathway mutations; 32.9% of the patients were characterized as CMS3, based on KRAS and PIK3CA mutations; and 3.0% of the patients were classified as CMS4, based on CTNNB1 mutations. Some patients presented mixed subtypes (CMS1/CMS2: 0.4%; CMS1/CMS3: 0.4%; CMS2/CMS3: 1.7%) while 53% of these patients were not categorized in any of the above subtypes, and this might be due to mixed subtypes with intratumoral heterogeneity [21,22] (Supplementary Table S1).

3.6. Univariate and Multivariate Cox-Regression Analysis

Univariate analysis revealed that tumor localization in the right colon and ARAF and MAPK10 mutations were associated with reduced DFS (Table 6). Multivariate analysis confirmed that tumor localization and ARAF and MAPK10 mutations were independent predictive factors of reduced DFS (HR = 2.1; 95% CI: 1.1–4.0; p = 0.019; HR = 3.9; 95% CI: 1.2–13.1; p = 0.027; HR = 49; 95% CI: 9.8–244.1; p < 0.001) (Table 6).
Similarly, right-sided tumors and AKT1, APC2, ARAF, BAD, MAPK10, RAC3, RHOA, TGFB2, and TGFB3 were associated with an increased risk of shorter OS. In contrast, MSH6 mutations were demonstrated to be a good prognostic factor, as they were associated with a reduced risk for shorter OS (Table 6). Moreover, in order to confirm the significant relationship of the aforementioned mutations with patients’ survival, a resampling was performed using the Monte Carlo methodology (Confidence level: 99%). Based on the Monte Carlo method, a significant relationship was observed between most of these mutations and patients’ survival (Table 6). In brief, sidedness and eight genes (AKT1, APC2, ARAF, MAPK10, MSH6, RAC3, and TGFB3) demonstrated statistical significance with 0.799 ± 0.028 sensitivity ± standard deviation and 0.711 ± 0.087 sensitivity ± standard deviation (Table 6). Multivariate analysis revealed that right-sided tumors and RAC3 and RHOA gene mutations emerged as independent predictors of reduced OS (HR = 2.2; 95% CI: 1.0–4.5; p = 0.043; HR = 3.5; 95% CI: 1.1–10.7; p = 0.029 and HR = 9.5; 95% CI: 1.9–47.7; p = 0.006) (Table 6).

4. Discussion

Despite the potential benefits of presymptomatic screening and available treatments, CRC continues to be a significant public health concern [26]. Understanding the processes involved in CRC development and progression can help to identify new targets for treatment. Structural and functional changes in the DNA can offer vital insights into patient management [27,28]. As the normal colonic epithelium transforms into cancerous tissue, various mutations occur, leading to adenoma formation [29,30,31,32,33,34,35,36]. Extensive cancer cell proliferation through the RAS-RAF-MEK-ERK signaling pathway drives carcinogenesis, tumor invasion, and metastasis [37]. Moreover, the immune responses to cancer cells differ among patients with mutations [38,39,40,41,42,43,44].
The objective of this study was to analyze genetic changes in surgical samples from patients with stage III CRC and detect VDR and TLR gene polymorphisms in peripheral blood samples. The study included 237 patients, 84 of whom had available blood samples. The WES and KEGG gene panel for CRC revealed 59 mutated genes belonging to 11 distinct signaling pathways. Of these, mutations in APC2, BRAF, MAPK10, MLH1, MSH6, RHOA, TGFB, and TGFB2 have been linked to a significant impact on patient survival. APC, TP53, KRAS, and MSH3 were the most commonly observed mutations in this study.
APC encodes an anti-tumor protein that competes with the Wnt signaling pathway and is involved in cell migration, adhesion, and apoptosis. APC mutations are responsible for familial adenomatous polyposis (FAP), an autosomal dominant precancerous disease that typically leads to malignancy. APC mutations are commonly observed in CRC cases [45]. Similarly, APC2 mutations, which are directly associated with APC’s tumor-suppressive function [46], have been linked to worse prognosis in CRC patients [47,48]. This study confirms that APC2 mutations in patients with stage III CRC are associated with lower overall survival but do not represent an independent prognostic factor. TP53 encodes an anti-tumor protein that regulates the expression of target genes, leading to cell cycle arrest, apoptosis, senescence, DNA repair, or metabolic changes. Similarly to APC, TP53 are frequently observed in CRC cases [45]. Furthermore, mutations in the APC2 gene, which are directly linked to APC’s tumor-suppressive function [46], are also associated with worse prognosis in CRC patients [47,48]. This study confirms that while APC2 mutations in stage III CRC patients are linked to lower overall survival, they do not represent an independent prognostic factor. Various human cancers, including approximately 60% of CRC, are associated with mutations in the TP53 gene [49,50]. Prior studies have shown that mutations in TP53 resulting in the loss of its transcriptional activity can lead to uncontrolled cellular proliferation in multiple organs, including the colon [51]. Similarly, KRAS mutations are the primary indicators of gastrointestinal cancers and are found in approximately 40% of patients with CRC (stage II-IV) [52]. They serve as negative prognostic factors for carcinogenesis and anti-EGFR therapy [53] because intracellular signal interruption leads to uncontrolled cellular proliferation and cancer. MSH3 mutations have been mainly linked to endometrial cancer, but there are reports of its relationship with inflammatory processes, such as ulcerative colitis and Crohn’s disease, which considerably increase the likelihood of CRC development [54,55]. MSH3-associated CRC seems to follow the classic APC pathway, as patients with adenomas and CRC carrying APC mutations showed MSH3 deficiency [56], as confirmed in this study. In addition to the common mutations detected in the patient group, mutations in AKT1, ARAF, BAD, MAPK10, RAC3, RHOA, TGFB2, and TGFB3 were associated with worse prognosis in this study. Furthermore, mutations in ARAF and MAPK10 were identified as independent prognostic factors for DFS, whereas mutations in RAC3 and RHOA were identified as independent prognostic factors for decreased OS.
Regarding the detection of gene polymorphisms in the blood, it was demonstrated that patients with VDR gene polymorphisms have shorter survival rates, and this is in agreement with our previous demonstrations in various cohorts [8,9,10].
This study sheds light on the association between mutations in genes involved in signaling pathways such as PI3K-Akt, MAPK, apoptosis, and CRC. To the best of our knowledge, this is the first report of its kind in the literature. The reactivation of embryonic self-renewal pathways, such as Hedgehog, Notch, and TGFB/Stat3, is characteristic of most tumors, including CRC. The Wnt pathway is also essential in most CRC. Targeting embryonic pathways directly is likely to be more effective against stem and differentiated cancer cells [57,58,59]. Tumors that are addicted to increased regulated activity of the embryonic pathway, in combination with high tumor heterogeneity, may be more vulnerable to such therapies [60,61,62]. Patients with VDR polymorphisms had concurrent mutations in genes involved in cell cycle, apoptosis, PI3K-Akt, WNT, MAPK, ErbB, MSI, and RAS. Similarly, TLR9 polymorphisms were associated with mutations in genes involved in apoptotic signaling pathways, PI3K-Akt, and Wnt. Previous studies from our group have demonstrated that higher detection of TLR and VDR polymorphisms in CRC patients, especially advanced-stage patients, highlights the role of these polymorphisms in carcinogenesis, disease progression, and ultimately, patient survival [9,10,63]. Regarding DFS, tumors in the sigmoid or right colon and mutations in the ARAF and/or MAPK10 genes were associated with shorter DFS, a fact that has been confirmed in previous studies [64,65,66]. To our knowledge, this is the first study to highlight the role of ARAF and MAPK10 mutations as independent prognostic factors for decreased DFS.
The observation of statistically lower OS in patients with right colon tumors and gene mutations has been confirmed in the literature. Borakati et al. conducted a retrospective study and found that tumors in the right colon were independent prognostic factors for reduced OS after hepatic metastasectomy, regardless of the higher rates of liver metastases and larger metastases in the left colon [67]. Patients with mutations in genes, such as AKT1, APC2, ARAF, BAD, MAPK10, RAC3, RHOA, TGFB2, and TGFB3 had significantly reduced OS, as reported in other studies that also linked APC2, RHOA, and TGFB mutations to worse prognosis [47,48,68]. Conversely, studies have shown that mutations in MSH6 are associated with a lower risk of developing CRC, and patients with such mutations have a milder clinical presentation [69,70]. In the present study, patients with MSH6 mutations had a significantly longer OS, confirming that MSH6 mutations are good prognostic factors. Moreover, regarding the CMS subtypes, in the current study, it was demonstrated that the patients were classified as CMS1 subtype based on BRAF and MSI pathway mutations. Such a subtype may lead to worse survival rates after relapse, as compared to CMS2 subtype, which has been classified based on Myc and Wnt pathway mutations. CMS3 and CMS4 have also been associated with bad survival rates [21,22].
Furthermore, whether the mutations related to patients’ survival were due to chance was assessed via Monte Carlo simulations. Sidedness and eight mutations were associated with patients’ survival, which confirms the univariate analysis results.
To determine whether the results of the present work could be further validated by other studies, we examined the available data on the National Cancer Institute’s GDC data portal [71]. Case filters specifying the location of the primary tumor and clinical filters specifying gender, age, and location were applied, and the information regarding the genes of the study and the corresponding survival plots were analyzed. Consistent with the result of the current study, patients with tumors in the colon had mutations in the KRAS gene more frequently than patients with tumors in the sigmoid (p < 0.001). Moreover, patients with AKT1, ARAF, and RHOA mutations exhibited a significantly shorter OS compared to wild-type patients (p < 0.001, p < 0.001, p < 0.001, and p < 0.001, respectively) [72]. All of the above are in agreement with our results. Moreover, MSH6 mutations are significantly correlated with previous studies, as demonstrated on the National Cancer Institute’s GDC data portal [73], and this is also in agreement with our results [71]. Concurrent mutations (co-mutations) are a significant factor that have been minimally investigated in CRC. Studies in patients with non-small cell lung cancer have shown distinct biological behavior and prognosis in KRAS/LKB1, KRAS/TP53, or KRAS/p16 mutated tumors [74]. Additionally, our group has previously reported the importance of evaluating the loss of LKB1 through immunohistochemistry in early-stage CRC, particularly in BRAFV600E mutated tumors [75]. In the present study, several concurrent mutations were detected in patients, but no correlation was found with clinical/pathological characteristics or patient prognosis.

5. Conclusions

In conclusion, molecular characterization of cancer cells can enhance our understanding of the biological progression of this disease [76,77]. The findings of this study suggest that mutations are promising prognostic biomarkers. As personalized medicine has become the primary mode of therapy, knowledge of the precise mutation status of patients with CRC can lead to better therapeutic choices. However, further research is necessary with a larger patient cohort and international collaborations to confirm the correlation between patients’ molecular profiles, clinicopathological and epidemiological characteristics, and outcomes. Such research is expected to contribute to more precise clinical decision-making, personalized and improved care, and reduced toxicity of treatment, costs to patients, and burden on health systems.

Supplementary Materials

The following supporting information can be downloaded at: https://www.mdpi.com/article/10.3390/cancers15194819/s1, Table S1: Raw patient data; Table S2: Gene panel for colorectal cancer (CRC) based on Kyoto Encyclopedia of Genes and Genomes (KEGG); Table S3: Signaling pathways and the associated genes for colorectal cancer (CRC) based on Kyoto Encyclopedia of Genes and Genomes (KEGG); Table S4: Detection of genes and position in chromosomes for tumor samples.

Author Contributions

Conceptualization, I.M. and J.S.; methodology, I.M., E.P., K.V., M.S. and M.T.; software, I.M., E.P., P.T. and I.I.; validation, I.M., P.T. and M.T.; formal analysis, I.M.; data curation, I.M., D.M., J.T., N.G., M.T. and J.S.; writing—original draft preparation, I.M.; writing—review and editing, I.M., P.T., I.I. and J.S.; supervision, I.M., P.T. and J.S.; funding acquisition, I.M. and J.S. All authors have read and agreed to the published version of the manuscript.

Funding

This research was partially funded by the Hellenic Society of Medical Oncology (HeSMO) and the Gastrointestinal Cancer Study Group (GIC-SG).

Institutional Review Board Statement

This study was approved by the Ethics Committee/Institutional Review Board of the University Hospital of Heraklion (Number 7302/19-8-2009). All procedures were performed in accordance with the ethical standards of the institutional and/or national research committee and the 1964 Helsinki Declaration and its later amendments or comparable ethical standards. All patients signed a written informed consent form for participation.

Informed Consent Statement

Informed consent was obtained from all subjects involved in the study.

Data Availability Statement

All relevant data are within the paper and its Supplementary Information files. Supplementary Table S1: Raw patient data.

Acknowledgments

The authors would like to thank NATERA Inc., San Carlos, CA 94070, USA, for providing whole exome sequencing analysis and sharing the raw data for further bioinformatic analysis.

Conflicts of Interest

The authors declare no conflict of interest.

References

  1. Yu, H.; Hemminki, K. Genetic epidemiology of colorectal cancer and associated cancers. Mutagenesis 2020, 35, 207–219. [Google Scholar] [CrossRef]
  2. Sawicki, T.; Ruszkowska, M.; Danielewicz, A.; Niedzwiedzka, E.; Arlukowicz, T.; Przybylowicz, K.E. A Review of Colorectal Cancer in Terms of Epidemiology, Risk Factors, Development, Symptoms and Diagnosis. Cancers 2021, 13, 2025. [Google Scholar] [CrossRef]
  3. Andre, T.; Boni, C.; Navarro, M.; Tabernero, J.; Hickish, T.; Topham, C.; Bonetti, A.; Clingan, P.; Bridgewater, J.; Rivera, F.; et al. Improved overall survival with oxaliplatin, fluorouracil, and leucovorin as adjuvant treatment in stage II or III colon cancer in the MOSAIC trial. J. Clin. Oncol. 2009, 27, 3109–3116. [Google Scholar] [CrossRef] [PubMed]
  4. Haller, D.G.; Tabernero, J.; Maroun, J.; de Braud, F.; Price, T.; Van Cutsem, E.; Hill, M.; Gilberg, F.; Rittweger, K.; Schmoll, H.J. Capecitabine plus oxaliplatin compared with fluorouracil and folinic acid as adjuvant therapy for stage III colon cancer. J. Clin. Oncol. 2011, 29, 1465–1471. [Google Scholar] [CrossRef] [PubMed]
  5. Sobrero, A.; Grothey, A.; Iveson, T.; Labianca, R.; Yoshino, T.; Taieb, J.; Maughan, T.; Buyse, M.; Andre, T.; Meyerhardt, J.; et al. The hard road to data interpretation: 3 or 6 months of adjuvant chemotherapy for patients with stage III colon cancer? Ann. Oncol. 2018, 29, 1099–1107. [Google Scholar] [CrossRef] [PubMed]
  6. Grothey, A.; Sobrero, A.F.; Shields, A.F.; Yoshino, T.; Paul, J.; Taieb, J.; Souglakos, J.; Shi, Q.; Kerr, R.; Labianca, R.; et al. Duration of Adjuvant Chemotherapy for Stage III Colon Cancer. N. Engl. J. Med. 2018, 378, 1177–1188. [Google Scholar] [CrossRef] [PubMed]
  7. Angell, H.K.; Bruni, D.; Barrett, J.C.; Herbst, R.; Galon, J. The Immunoscore: Colon Cancer and Beyond. Clin. Cancer Res. 2020, 26, 332–339. [Google Scholar] [CrossRef]
  8. Messaritakis, I.; Koulouridi, A.; Boukla, E.; Sfakianaki, M.; Vogiatzoglou, K.; Karagianni, M.; Gouvas, N.; Tsiaoussis, J.; Xynos, E.; Athanasakis, E.; et al. Investigation of Microbial Translocation, TLR and VDR Gene Polymorphisms, and Recurrence Risk in Stage III Colorectal Cancer Patients. Cancers 2022, 14, 4407. [Google Scholar] [CrossRef]
  9. Messaritakis, I.; Vogiatzoglou, K.; Tsantaki, K.; Ntretaki, A.; Sfakianaki, M.; Koulouridi, A.; Tsiaoussis, J.; Mavroudis, D.; Souglakos, J. The Prognostic Value of the Detection of Microbial Translocation in the Blood of Colorectal Cancer Patients. Cancers 2020, 12, 1058. [Google Scholar] [CrossRef]
  10. Messaritakis, I.; Koulouridi, A.; Sfakianaki, M.; Vogiatzoglou, K.; Gouvas, N.; Athanasakis, E.; Tsiaoussis, J.; Xynos, E.; Mavroudis, D.; Tzardi, M.; et al. The Role of Vitamin D Receptor Gene Polymorphisms in Colorectal Cancer Risk. Cancers 2020, 12, 1379. [Google Scholar] [CrossRef]
  11. Hsu, Y.C.; Hsiao, Y.T.; Kao, T.Y.; Chang, J.G.; Shieh, G.S. Detection of Somatic Mutations in Exome Sequencing of Tumor-only Samples. Sci. Rep. 2017, 7, 15959. [Google Scholar] [CrossRef]
  12. Hofmann, A.L.; Behr, J.; Singer, J.; Kuipers, J.; Beisel, C.; Schraml, P.; Moch, H.; Beerenwinkel, N. Detailed simulation of cancer exome sequencing data reveals differences and common limitations of variant callers. BMC Bioinform. 2017, 18, 8. [Google Scholar] [CrossRef] [PubMed]
  13. Hasan, M.S.; Wu, X.; Zhang, L. Performance evaluation of indel calling tools using real short-read data. Hum Genom. 2015, 9, 20. [Google Scholar] [CrossRef] [PubMed]
  14. Illumina. Available online: https://support.illumina.com/sequencing/sequencing_software/igenome.html (accessed on 15 April 2023).
  15. Clarke, J.; Wu, H.C.; Jayasinghe, L.; Patel, A.; Reid, S.; Bayley, H. Continuous base identification for single-molecule nanopore DNA sequencing. Nat. Nanotechnol. 2009, 4, 265–270. [Google Scholar] [CrossRef] [PubMed]
  16. Van der Auwera, G.A.; O’Connor, B.D. Genomics in the Cloud: Using Docker, Gatk, and Wdl in Terra, 1st ed.; O’Reilly Media: Newton, MA, USA, 2020. [Google Scholar]
  17. Kyoto Encyclopedia of Genes and Genomes. Available online: https://www.genome.jp/pathway/hsa05210 (accessed on 15 April 2023).
  18. Wang, K.; Li, M.; Hakonarson, H. ANNOVAR: Functional annotation of genetic variants from high-throughput sequencing data. Nucleic Acids Res. 2010, 38, e164. [Google Scholar] [CrossRef]
  19. Deng, N.; Zhou, H.; Fan, H.; Yuan, Y. Single nucleotide polymorphisms and cancer susceptibility. Oncotarget 2017, 8, 110635–110649. [Google Scholar] [CrossRef]
  20. Guinney, J.; Dienstmann, R.; Wang, X.; de Reynies, A.; Schlicker, A.; Soneson, C.; Marisa, L.; Roepman, P.; Nyamundanda, G.; Angelino, P.; et al. The consensus molecular subtypes of colorectal cancer. Nat. Med. 2015, 21, 1350–1356. [Google Scholar] [CrossRef] [PubMed]
  21. Valenzuela, G.; Canepa, J.; Simonetti, C.; Solo de Zaldivar, L.; Marcelain, K.; Gonzalez-Montero, J. Consensus molecular subtypes of colorectal cancer in clinical practice: A translational approach. World J. Clin. Oncol. 2021, 12, 1000–1008. [Google Scholar] [CrossRef] [PubMed]
  22. Lu, Y.; Gu, D.; Zhao, C.; Sun, Y.; Li, W.; He, L.; Wang, X.; Kou, Z.; Su, J.; Guo, F. Genomic landscape and expression profile of consensus molecular subtype four of colorectal cancer. Front Immunol. 2023, 14, 1160052. [Google Scholar] [CrossRef]
  23. Metropolis, N.; Ulam, S. The Monte Carlo Method. J. Am. Stat. Assoc. 1949, 44, 335–341. [Google Scholar] [CrossRef]
  24. Rubinstein, R.Y.; Kroese, D.P. Simulation and the Monte Carlo Method; John Wiley & Sons: Hoboken, NJ, USA, 2017. [Google Scholar]
  25. George, F.S. Monte Carlo Concepts, Algorithms, and Applications; Springer: Berlin/Heidelberg, Germany, 1996. [Google Scholar]
  26. Brenner, H.; Chen, C. The colorectal cancer epidemic: Challenges and opportunities for primary, secondary and tertiary prevention. Br. J. Cancer 2018, 119, 785–792. [Google Scholar] [CrossRef]
  27. The Cancer Genome Atlas (TCGA) Research Network. Comprehensive molecular characterization of human colon and rectal cancer. Nature 2012, 487, 330–337. [Google Scholar] [CrossRef]
  28. Obuch, J.C.; Ahnen, D.J. Colorectal Cancer: Genetics is Changing Everything. Gastroenterol. Clin. N. Am. 2016, 45, 459–476. [Google Scholar] [CrossRef]
  29. Sullivan, B.A.; Noujaim, M.; Roper, J. Cause, Epidemiology, and Histology of Polyps and Pathways to Colorectal Cancer. Gastrointest. Endosc. Clin. N. Am. 2022, 32, 177–194. [Google Scholar] [CrossRef] [PubMed]
  30. Uhlitz, F.; Bischoff, P.; Peidli, S.; Sieber, A.; Trinks, A.; Luthen, M.; Obermayer, B.; Blanc, E.; Ruchiy, Y.; Sell, T.; et al. Mitogen-activated protein kinase activity drives cell trajectories in colorectal cancer. EMBO Mol. Med. 2021, 13, e14123. [Google Scholar] [CrossRef] [PubMed]
  31. Vogelstein, B.; Papadopoulos, N.; Velculescu, V.E.; Zhou, S.; Diaz, L.A., Jr.; Kinzler, K.W. Cancer genome landscapes. Science 2013, 339, 1546–1558. [Google Scholar] [CrossRef] [PubMed]
  32. Chan, D.K.H.; Buczacki, S.J.A. Tumour heterogeneity and evolutionary dynamics in colorectal cancer. Oncogenesis 2021, 10, 53. [Google Scholar] [CrossRef] [PubMed]
  33. Fennell, L.; Kane, A.; Liu, C.; McKeone, D.; Hartel, G.; Su, C.; Bond, C.; Bettington, M.; Leggett, B.; Whitehall, V. Braf mutation induces rapid neoplastic transformation in the aged and aberrantly methylated intestinal epithelium. Gut 2022, 71, 1127–1140. [Google Scholar] [CrossRef]
  34. Chen, T.; Zeineldin, M.; Johnson, B.A.; Dong, Y.; Narkar, A.; Li, T.; Zhu, J.; Li, R.; Larman, T.C. Colonic epithelial adaptation to EGFR-independent growth induces chromosomal instability and is accelerated by prior injury. Neoplasia 2021, 23, 488–501. [Google Scholar] [CrossRef]
  35. Lee-Six, H.; Olafsson, S.; Ellis, P.; Osborne, R.J.; Sanders, M.A.; Moore, L.; Georgakopoulos, N.; Torrente, F.; Noorani, A.; Goddard, M.; et al. The landscape of somatic mutation in normal colorectal epithelial cells. Nature 2019, 574, 532–537. [Google Scholar] [CrossRef]
  36. Norgaard, K.; Muller, C.; Christensen, N.; Chiloeches, M.L.; Madsen, C.L.; Nielsen, S.S.; Thingholm, T.E.; Belcheva, A. Loss of mismatch repair signaling impairs the WNT-bone morphogenetic protein crosstalk and the colonic homeostasis. J. Mol. Cell Biol. 2020, 12, 410–423. [Google Scholar] [CrossRef] [PubMed]
  37. Eklof, V.; Wikberg, M.L.; Edin, S.; Dahlin, A.M.; Jonsson, B.A.; Oberg, A.; Rutegard, J.; Palmqvist, R. The prognostic role of KRAS, BRAF, PIK3CA and PTEN in colorectal cancer. Br. J. Cancer 2013, 108, 2153–2163. [Google Scholar] [CrossRef] [PubMed]
  38. Fu, X.; Wang, X.; Duanmu, J.; Li, T.; Jiang, Q. KRAS mutations are negatively correlated with immunity in colon cancer. Aging 2020, 13, 750–768. [Google Scholar] [CrossRef] [PubMed]
  39. Sun, J.; Yao, N.; Lu, P.; Wang, Y. Effects of mFOLFOX6 regimen combined with carrelizumab on immune function and prognosis in patients with microsatellite instability colorectal cancer. Cell. Mol. Biol. 2022, 67, 356–362. [Google Scholar] [CrossRef]
  40. Ratovomanana, T.; Cohen, R.; Svrcek, M.; Renaud, F.; Cervera, P.; Siret, A.; Letourneur, Q.; Buhard, O.; Bourgoin, P.; Guillerm, E.; et al. Performance of Next-Generation Sequencing for the Detection of Microsatellite Instability in Colorectal Cancer With Deficient DNA Mismatch Repair. Gastroenterology 2021, 161, 814–826.e817. [Google Scholar] [CrossRef]
  41. Xiao, J.; Li, W.; Huang, Y.; Huang, M.; Li, S.; Zhai, X.; Zhao, J.; Gao, C.; Xie, W.; Qin, H.; et al. A next-generation sequencing-based strategy combining microsatellite instability and tumor mutation burden for comprehensive molecular diagnosis of advanced colorectal cancer. BMC Cancer 2021, 21, 282. [Google Scholar] [CrossRef]
  42. Huang, J.; Liu, H.; Zhao, Y.; Luo, T.; Liu, J.; Liu, J.; Pan, X.; Tang, W. MicroRNAs Expression Patterns Predict Tumor Mutational Burden in Colorectal Cancer. Front. Oncol. 2020, 10, 550986. [Google Scholar] [CrossRef]
  43. Bae, J.M.; Yoo, S.Y.; Kim, J.H.; Kang, G.H. Immune landscape and biomarkers for immuno-oncology in colorectal cancers. J. Pathol. Transl. Med. 2020, 54, 351–360. [Google Scholar] [CrossRef]
  44. Saller, J.; Qin, D.; Felder, S.; Coppola, D. Microsatellite Stable Colorectal Cancer With an Immunogenic Phenotype: Challenges in Diagnosis and Treatment. Clin. Colorectal. Cancer 2020, 19, 123–131. [Google Scholar] [CrossRef]
  45. National Library of Medicine. Available online: https://www.ncbi.nlm.nih.gov/gene/324 (accessed on 20 April 2023).
  46. National Library of Medicine. Available online: https://www.ncbi.nlm.nih.gov/gene/10297 (accessed on 20 April 2023).
  47. Sun, Y.; Tian, H.; Xu, X.; Wang, L. Low expression of adenomatous polyposis coli 2 correlates with aggressive features and poor prognosis in colorectal cancer. Bioengineered 2020, 11, 1027–1033. [Google Scholar] [CrossRef]
  48. Geng, Y.; Zheng, X.; Hu, W.; Wang, Q.; Xu, Y.; He, W.; Wu, C.; Zhu, D.; Wu, C.; Jiang, J. Hsa_circ_0009361 acts as the sponge of miR-582 to suppress colorectal cancer progression by regulating APC2 expression. Clin. Sci. 2019, 133, 1197–1213. [Google Scholar] [CrossRef]
  49. Marcel, V.; Perrier, S.; Aoubala, M.; Ageorges, S.; Groves, M.J.; Diot, A.; Fernandes, K.; Tauro, S.; Bourdon, J.C. Delta160p53 is a novel N-terminal p53 isoform encoded by Delta133p53 transcript. FEBS Lett. 2010, 584, 4463–4468. [Google Scholar] [CrossRef] [PubMed]
  50. Yin, Y.; Stephen, C.W.; Luciani, M.G.; Fåhraeus, R. p53 stability and activity is regulated by Mdm2-mediated induction of alternative p53 translation products. Nat. Cell Biol. 2002, 4, 462–467. [Google Scholar] [CrossRef] [PubMed]
  51. Chen, J. The Cell-Cycle Arrest and Apoptotic Functions of p53 in Tumor Initiation and Progression. Cold Spring Harb. Perspect. Med. 2016, 6, a026104. [Google Scholar] [CrossRef] [PubMed]
  52. Andreyev, H.J.; Norman, A.R.; Cunningham, D.; Oates, J.; Dix, B.R.; Iacopetta, B.J.; Young, J.; Walsh, T.; Ward, R.; Hawkins, N.; et al. Kirsten ras mutations in patients with colorectal cancer: The ‘RASCAL II’ study. Br. J. Cancer 2001, 85, 692–696. [Google Scholar] [CrossRef]
  53. De Roock, W.; Claes, B.; Bernasconi, D.; De Schutter, J.; Biesmans, B.; Fountzilas, G.; Kalogeras, K.T.; Kotoula, V.; Papamichael, D.; Laurent-Puig, P.; et al. Effects of KRAS, BRAF, NRAS, and PIK3CA mutations on the efficacy of cetuximab plus chemotherapy in chemotherapy-refractory metastatic colorectal cancer: A retrospective consortium analysis. Lancet Oncol. 2010, 11, 753–762. [Google Scholar] [CrossRef]
  54. Biscaglia, G.; Latiano, A.; Castellana, S.; Fontana, R.; Gentile, A.; Latiano, T.; Corritore, G.; Panza, A.; Nardella, M.; Martino, G.; et al. Germline Alterations in Patients with IBD-associated Colorectal Cancer. Inflamm. Bowel. Dis. 2022, 28, 447–454. [Google Scholar] [CrossRef]
  55. Xie, Z.; Ke, Y.; Chen, J.; Li, Z.; Wang, C.; Chen, Y.; Ding, H.; Cheng, L. Prevalence and Spectrum of Predisposition Genes with Germline Mutations among Chinese Patients with Bowel Cancer. Front. Genet. 2021, 12, 755629. [Google Scholar] [CrossRef] [PubMed]
  56. Perne, C.; Peters, S.; Cartolano, M.; Horpaopan, S.; Grimm, C.; Altmuller, J.; Sommer, A.K.; Hillmer, A.M.; Thiele, H.; Odenthal, M.; et al. Variant profiling of colorectal adenomas from three patients of two families with MSH3-related adenomatous polyposis. PLoS ONE 2021, 16, e0259185. [Google Scholar] [CrossRef]
  57. Takebe, N.; Harris, P.J.; Warren, R.Q.; Ivy, S.P. Targeting cancer stem cells by inhibiting Wnt, Notch, and Hedgehog pathways. Nat. Rev. Clin. Oncol. 2011, 8, 97–106. [Google Scholar] [CrossRef]
  58. Medema, J.P. Cancer stem cells: The challenges ahead. Nat. Cell. Biol. 2013, 15, 338–344. [Google Scholar] [CrossRef] [PubMed]
  59. Pattabiraman, D.R.; Weinberg, R.A. Tackling the cancer stem cells—What challenges do they pose? Nat. Rev. Drug Discov. 2014, 13, 497–512. [Google Scholar] [CrossRef] [PubMed]
  60. Bienz, M.; Clevers, H. Linking colorectal cancer to Wnt signaling. Cell 2000, 103, 311–320. [Google Scholar] [CrossRef]
  61. Segditsas, S.; Tomlinson, I. Colorectal cancer and genetic alterations in the Wnt pathway. Oncogene 2006, 25, 7531–7537. [Google Scholar] [CrossRef] [PubMed]
  62. Hernandez-Aya, L.F.; Gonzalez-Angulo, A.M. Targeting the phosphatidylinositol 3-kinase signaling pathway in breast cancer. Oncologist 2011, 16, 404–414. [Google Scholar] [CrossRef]
  63. Messaritakis, I.; Stogiannitsi, M.; Koulouridi, A.; Sfakianaki, M.; Voutsina, A.; Sotiriou, A.; Athanasakis, E.; Xynos, E.; Mavroudis, D.; Tzardi, M.; et al. Evaluation of the detection of Toll-like receptors (TLRs) in cancer development and progression in patients with colorectal cancer. PLoS ONE 2018, 13, e0197327. [Google Scholar] [CrossRef]
  64. Deng, J.; Zhou, S.; Wang, Z.; Huang, G.; Zeng, J.; Li, X. Comparison of Prognosis and Lymph Node Metastasis in T1-Stage Colonic and Rectal Carcinoma: A Retrospective Study. Int. J. Gen. Med. 2022, 15, 3651–3662. [Google Scholar] [CrossRef]
  65. Kim, S.Y.; Kim, K.; Cho, S.H.; Chun, S.M.; Tak, E.; Hong, Y.S.; Kim, J.E.; Kim, T.W. Longitudinal change of genetic variations in cetuximab-treated metastatic colorectal cancer. Cancer Genet. 2021, 258–259, 27–36. [Google Scholar] [CrossRef] [PubMed]
  66. Ohnami, S.; Maruyama, K.; Chen, K.; Takahashi, Y.; Hatakeyama, K.; Ohshima, K.; Shimoda, Y.; Sakai, A.; Kamada, F.; Nakatani, S.; et al. BMP4 and PHLDA1 are plausible drug-targetable candidate genes for KRAS G12A-, G12D-, and G12V-driven colorectal cancer. Mol. Cell. Biochem. 2021, 476, 3469–3482. [Google Scholar] [CrossRef]
  67. Borakati, A.; Froghi, F.; Shetye, A.; Fusai, G.K.; Davidson, B.R.; Mirnezami, R. Assessing the Impact of Primary Tumour Location on Survival after Resection of Colorectal Liver Metastases: A Propensity Weighted Retrospective Cohort Study. World J. Surg. 2022, 46, 1734–1755. [Google Scholar] [CrossRef]
  68. Jung, H.I.; Young, C.Y.; Jun, B.M.; Ho, B.S.; Byung, B.S.; Jun, J.D.; Yong, K.S.; Soo, L.M.; Sik, C.M.; Ho, K.C. Expression of RhoA in Colorectal Cancers and Its Clinicopathological Significance. J. Korean Soc. Coloproctol. 2008, 24, 460–466. [Google Scholar] [CrossRef]
  69. Bonadona, V.; Bonaïti, B.; Olschwang, S.; Grandjouan, S.; Huiart, L.; Longy, M.; Guimbaud, R.; Buecher, B.; Bignon, Y.J.; Caron, O.; et al. Cancer risks associated with germline mutations in MLH1, MSH2, and MSH6 genes in Lynch syndrome. JAMA 2011, 305, 2304–2310. [Google Scholar] [CrossRef]
  70. Ramsoekh, D.; Wagner, A.; van Leerdam, M.E.; Dooijes, D.; Tops, C.M.; Steyerberg, E.W.; Kuipers, E.J. Cancer risk in MLH1, MSH2 and MSH6 mutation carriers; different risk profiles may influence clinical management. Hered. Cancer Clin. Pract. 2009, 7, 17. [Google Scholar] [CrossRef] [PubMed]
  71. National Cancer Institute, G.D.C. data portal. Available online: https://gdc.cancer.gov/access-data/gdc-data-portal (accessed on 20 April 2023).
  72. Grossman, R.L.; Heath, A.P.; Ferretti, V.; Varmus, H.E.; Lowy, D.R.; Kibbe, W.A.; Staudt, L.M. Toward a Shared Vision for Cancer Genomic Data. N. Engl. J. Med. 2016, 375, 1109–1112. [Google Scholar] [CrossRef]
  73. National cancer Institute. Available online: https://portal.gdc.cancer.gov/ (accessed on 20 April 2023).
  74. Skoulidis, F.; Heymach, J.V. Co-occurring genomic alterations in non-small-cell lung cancer biology and therapy. Nat. Rev. Cancer 2019, 19, 495–509. [Google Scholar] [CrossRef] [PubMed]
  75. Sfakianaki, M.; Papadaki, C.; Tzardi, M.; Trypaki, M.; Alam, S.; Lagoudaki, E.D.; Messaritakis, I.; Zoras, O.; Mavroudis, D.; Georgoulias, V.; et al. Loss of LKB1 Protein Expression Correlates with Increased Risk of Recurrence and Death in Patients with Resected, Stage II or III Colon Cancer. Cancer Res. Treat. 2019, 51, 1518–1526. [Google Scholar] [CrossRef]
  76. He, K.; Wang, Y.; Zhong, Y.; Pan, X.; Si, L.; Lu, J. KRAS Codon 12 Mutation is Associated with More Aggressive Invasiveness in Synchronous Metastatic Colorectal Cancer (mCRC): Retrospective Research. Onco Targets Ther. 2020, 13, 12601–12613. [Google Scholar] [CrossRef] [PubMed]
  77. Scott, A.; Goffredo, P.; Ginader, T.; Hrabe, J.; Gribovskaja-Rupp, I.; Kapadia, M.R.; Weigel, R.J.; Hassan, I. The Impact of KRAS Mutation on the Presentation and Prognosis of Non-Metastatic Colon Cancer: An Analysis from the National Cancer Database. J. Gastrointest. Surg. 2020, 24, 1402–1410. [Google Scholar] [CrossRef]
Figure 1. Overview of the next generation sequencing (NGS) analysis pipeline.
Cancers 15 04819 g001
Figure 2. Frequency of mutations in each gene located in exons and splicing sites.
Cancers 15 04819 g002
Figure 3. Gene mutation frequencies with KEGG pathway annotations.
Cancers 15 04819 g003
Figure 4. Kaplan Meier curve for disease-free survival (DFS) according to (A) ARAF and (B) MAPK10 mutations.
Cancers 15 04819 g004
Figure 5. Kaplan Meier curve for overall survival (OS) according to (A) tumor sidedness, (B) relapse status, (CL) AKT1, APC2, ARAF, BAD, MAPK10, RAC3, RHOA, TGFB2, TGFB3, and MSH6 mutations.
Cancers 15 04819 g005
Table 1. Patient characteristics.
CharacteristicsNumber of Patients (n = 237)%
Median age (range)64 (18–84)
<7015967.1
≥707832.9
Gender
Males15163.7
Females8636.3
Tumor location
Cecum3816.0
Ascending4217.7
Transverse229.3
Descending2410.1
Sigmoid11146.8
Sidedness
Left15866.7
Right7933.3
Performance status
0–123699.6
>210.4
Regimen
Folfox10544.3
Capox13255.7
Treatment duration
3 months11648.9
6 months12151.1
Table 2. VDR and TLR gene polymorphism detection.
PolymorphismGene TargetDetectionNo of Patients (N-84)%Relapse (p-Value)Better Survival (p-Value)
VDRTaqIHomozygous 10 11.9 0.1850.05
Heterozygous 36 42.9
Wild-type 38 45.2
ApaIHomozygous 7 8.3 0.1440.021
Heterozygous 28 33.3
Wild-type 49 58.3
FokIHomozygous 5 6 0.1330.104
Heterozygous 39 46.4
Wild-type 40 47.6
BsmIHomozygous 17 20.2 0.2200.033
Heterozygous 51 60.7
Wild-type 16 19
TLRTLR2 196-to-174Homozygous 48 57.1 0.1260.180
Heterozygous 36 42.9
Wild-type--
TLR4-Asp299GlyHomozygous 39 46.4 0.2540.115
Heterozygous 43 51.2
Wild-type 2 2.4
TLR4-Thr399IleHomozygous 39 46.4 0.2540.115
Heterozygous 43 51.2
Wild-type 2 2.4
TLR9-T1237C Homozygous 37 44 0.1140.185
Heterozygous 47 56
Wild-type--
TLR9-T1486CHomozygous 37 44 0.1140.185
Heterozygous 47 56
Wild-type--
Table 3. Frequency of mutated patients in each gene.
GeneMutant Patients
AKT16
AKT23
AKT33
APC181
APC238
APPL119
ARAF8
AXIN111
AXIN261
BAD2
BAX14
BCL22
BIRC570
BRAF15
CASP30
CASP962
CCND13
CTNNB17
CYCS1
DCC62
FOS2
GSK3B2
JUN5
KRAS80
LEF13
MAP2K12
MAPK14
MAPK103
MAPK30
MAPK84
MAPK93
MLH155
MSH26
MSH3110
MSH651
MYC11
PIK3CA62
PIK3CB8
PIK3CD11
PIK3CG48
PIK3R123
PIK3R270
PIK3R30
PIK3R59
RAC10
RAC20
RAC311
RAF11
RALGDS42
RHOA6
SMAD23
SMAD314
SMAD425
TCF735
TCF7L161
TCF7L239
TGFB174
TGFB211
TGFB32
TGFBR116
TGFBR225
TP53148
Table 4. Frequency of mutations according to patients’ characteristics.
CharacteristicsGeneNo % (p Value)
Gender
Male vs. FemaleJUN43.4% vs. 25.0% (0.05)
MAPK357.5% vs. 31.1% (0.05)
Sideness
Left vs. RightMLH180% vs. 20% (0.007)
MSH684.3% vs. 15.7% (0.001)
TCF7L177% vs. 33% (0.019)
Location
Colon vs. SigmoidDCC90.3% vs. 9.7% (0.04)
KRAS88.8% vs. 11.2% (0.048)
TGFBR296% vs. 4% (0.043)
Age
<70 vs. ≥70TGFBR157.5% vs. 33% (0.012)
51–70 vs. ≥70 vs. <50BAD56.1% vs. 30.7% vs. 12.7% (<0.001)
51–70 vs. ≥70 vs. <50RAC56.1% vs. 30.7% vs. 12.7% (0.016)
51–70 vs. ≥70 vs. <50AKT, AKT2, AKT3, APC, APPL1, AXIN1, AXIN2, BIRC5, DCC, GSK3B, KRAS, MAPK1, MAPK8, MAPK9, MAPK10, MLH1, MSH6, PIK3CA, PIK3R1, PIK3R2, PIK3R3, PIK3R5, RAF1, RALGD5, SMAD2, SMAD3, TCF7L2, TGFB1, TGFB256.1% vs. 30.7% vs. 12.7% (0.037)
Relapse post Adj Chemotherapy
Yes vs. NoARAF, MAPK1071.7% vs. 20.5% (0.027)
CASP375.5% vs. 22.6% (0.044)
TCF775% vs. 21.2% (0.003)
TGFB374.5% vs. 22.2% (0.037)
Table 5. Correlation of mutated signaling pathways and patients characteristics (X=where correlation was observed.
Cell CycleApoptosisPI3K-AktWntMAPKErbBMSIRAS
Transverse Colon XXXX
TaqI HomozygousXXXX XXX
ApaI Homozygous XXXX
FokI Homozygous XXX
BsmI Homozygous XXX
TLR9-T1237C Homozygous XXX
TLR9-T1486C Homozygous XXX
Table 6. Univariate and multivariate Cox regression analysis.
FeatureUnivariateMonte CarloMultivariate
DFSOSOS DFSOS
FeatureHR (95%CI)p-ValueHR (95%CI)p-Valuep-ValueSensitivitySpecificityHR (95%CI)p-ValueHR (95%CI)p-Value
Sidedness (Right vs. Left)1.9 (1.2–3.2)0.0122.1 (1.0–4.0)0.0430.0040.8220.6352.1 (1.1–4.0)0.0192.2 (1.0–4.5)0.043
AKT1 (Mutant vs. Wild-type) 2.9 (1.1–8.2)0.0390.0480.771 0.721
APC2 (Mutant vs. Wild-type) 2.5 (1.4–4.5)0.0020.0040.806 0.776
ARAF (Mutant vs. Wild-type)3.8 (1.2–12.1)0.0275.0 (2.0–12.7)0.0010.0260.804 0.682 3.9 (1.2–13.1)0.027
BAD (Mutant vs. Wild-type) 8.6 (1.1–64.4)0.0360.3890.773 0.759
MAPK10 (Mutant vs. Wild-type)43.0 (9.1–203.7)<0.00115.1 (4.6–50.3)<0.0010.0170.818 0.654 49.0 (9.8–244.1)<0.001
MSH6 (Wild-type vs. Mutant) 2.3 (1.0–5.1)0.0410.0410.775 0.756
RAC3 (Mutant vs. Wild-type) 4.7 (1.8–11.9)0.0010.0310.794 0.685 3.5 (1.1–10.7)0.029
RHOA (Mutant vs. Wild-type) 4.8 (1.5–15.6)0.0090.1450.823 0.738 9.5 (1.9–47.7)0.006
TGFB2 (Mutant vs. Wild-type) 2.6 (1.1–6.7)0.0400.0910.792 0.717
TGFB3 (Mutant vs. Wild-type) 9.0 (2.1–37.8)0.0030.0480.8000.804
Disclaimer/Publisher’s Note: The statements, opinions and data contained in all publications are solely those of the individual author(s) and contributor(s) and not of MDPI and/or the editor(s). MDPI and/or the editor(s) disclaim responsibility for any injury to people or property resulting from any ideas, methods, instructions or products referred to in the content.

