
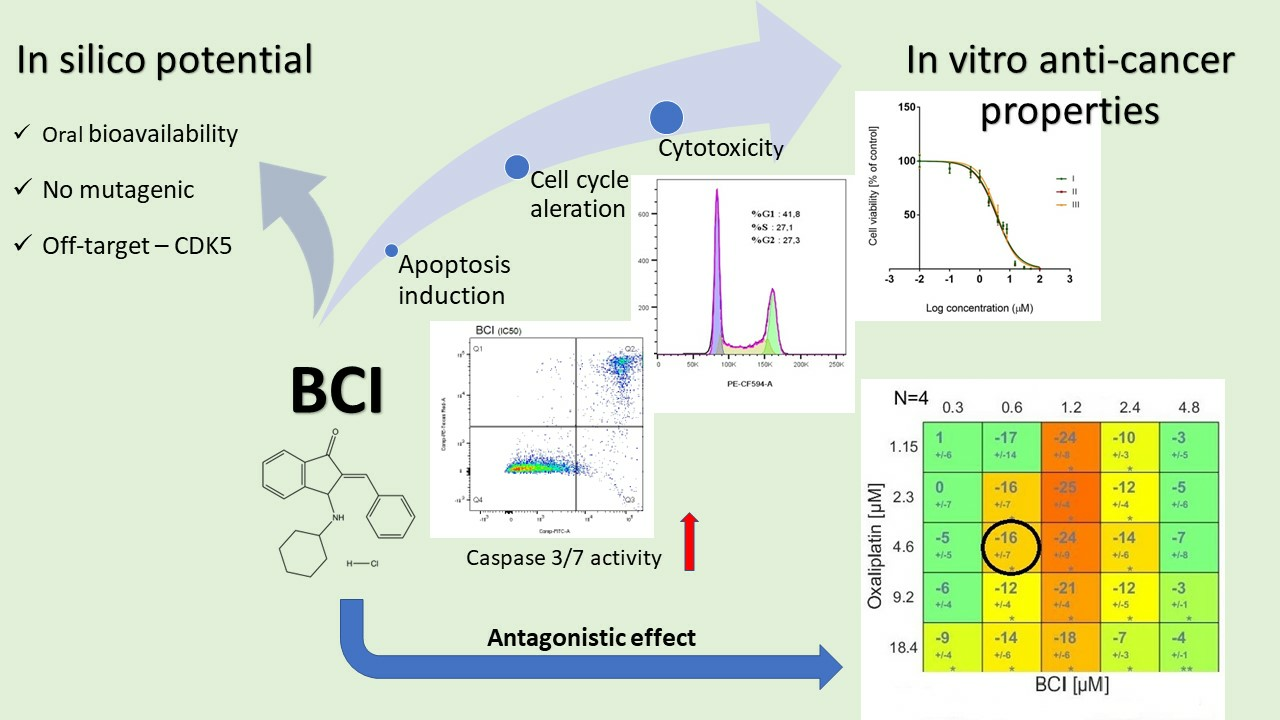
In Vitro and In Silico Investigation of BCI Anticancer Properties and Its Potential for Chemotherapy-Combined Treatments
 , , , and
Abstract
:Simple Summary
Abstract

1. Introduction
2. Material and Methods
2.1. Chemicals
2.2. Cell Culture
2.3. Cytotoxicity Study
2.4. Caspase 3/7 Activity Assay
2.5. Flow Cytometry Cell Cycle Distribution Analysis
2.6. Analysis of BCI Modulation Capacity
2.6.1. Impact BCI on the Cytotoxic Effect of Drugs
2.6.2. Flow Cytometry Analysis of Apoptosis
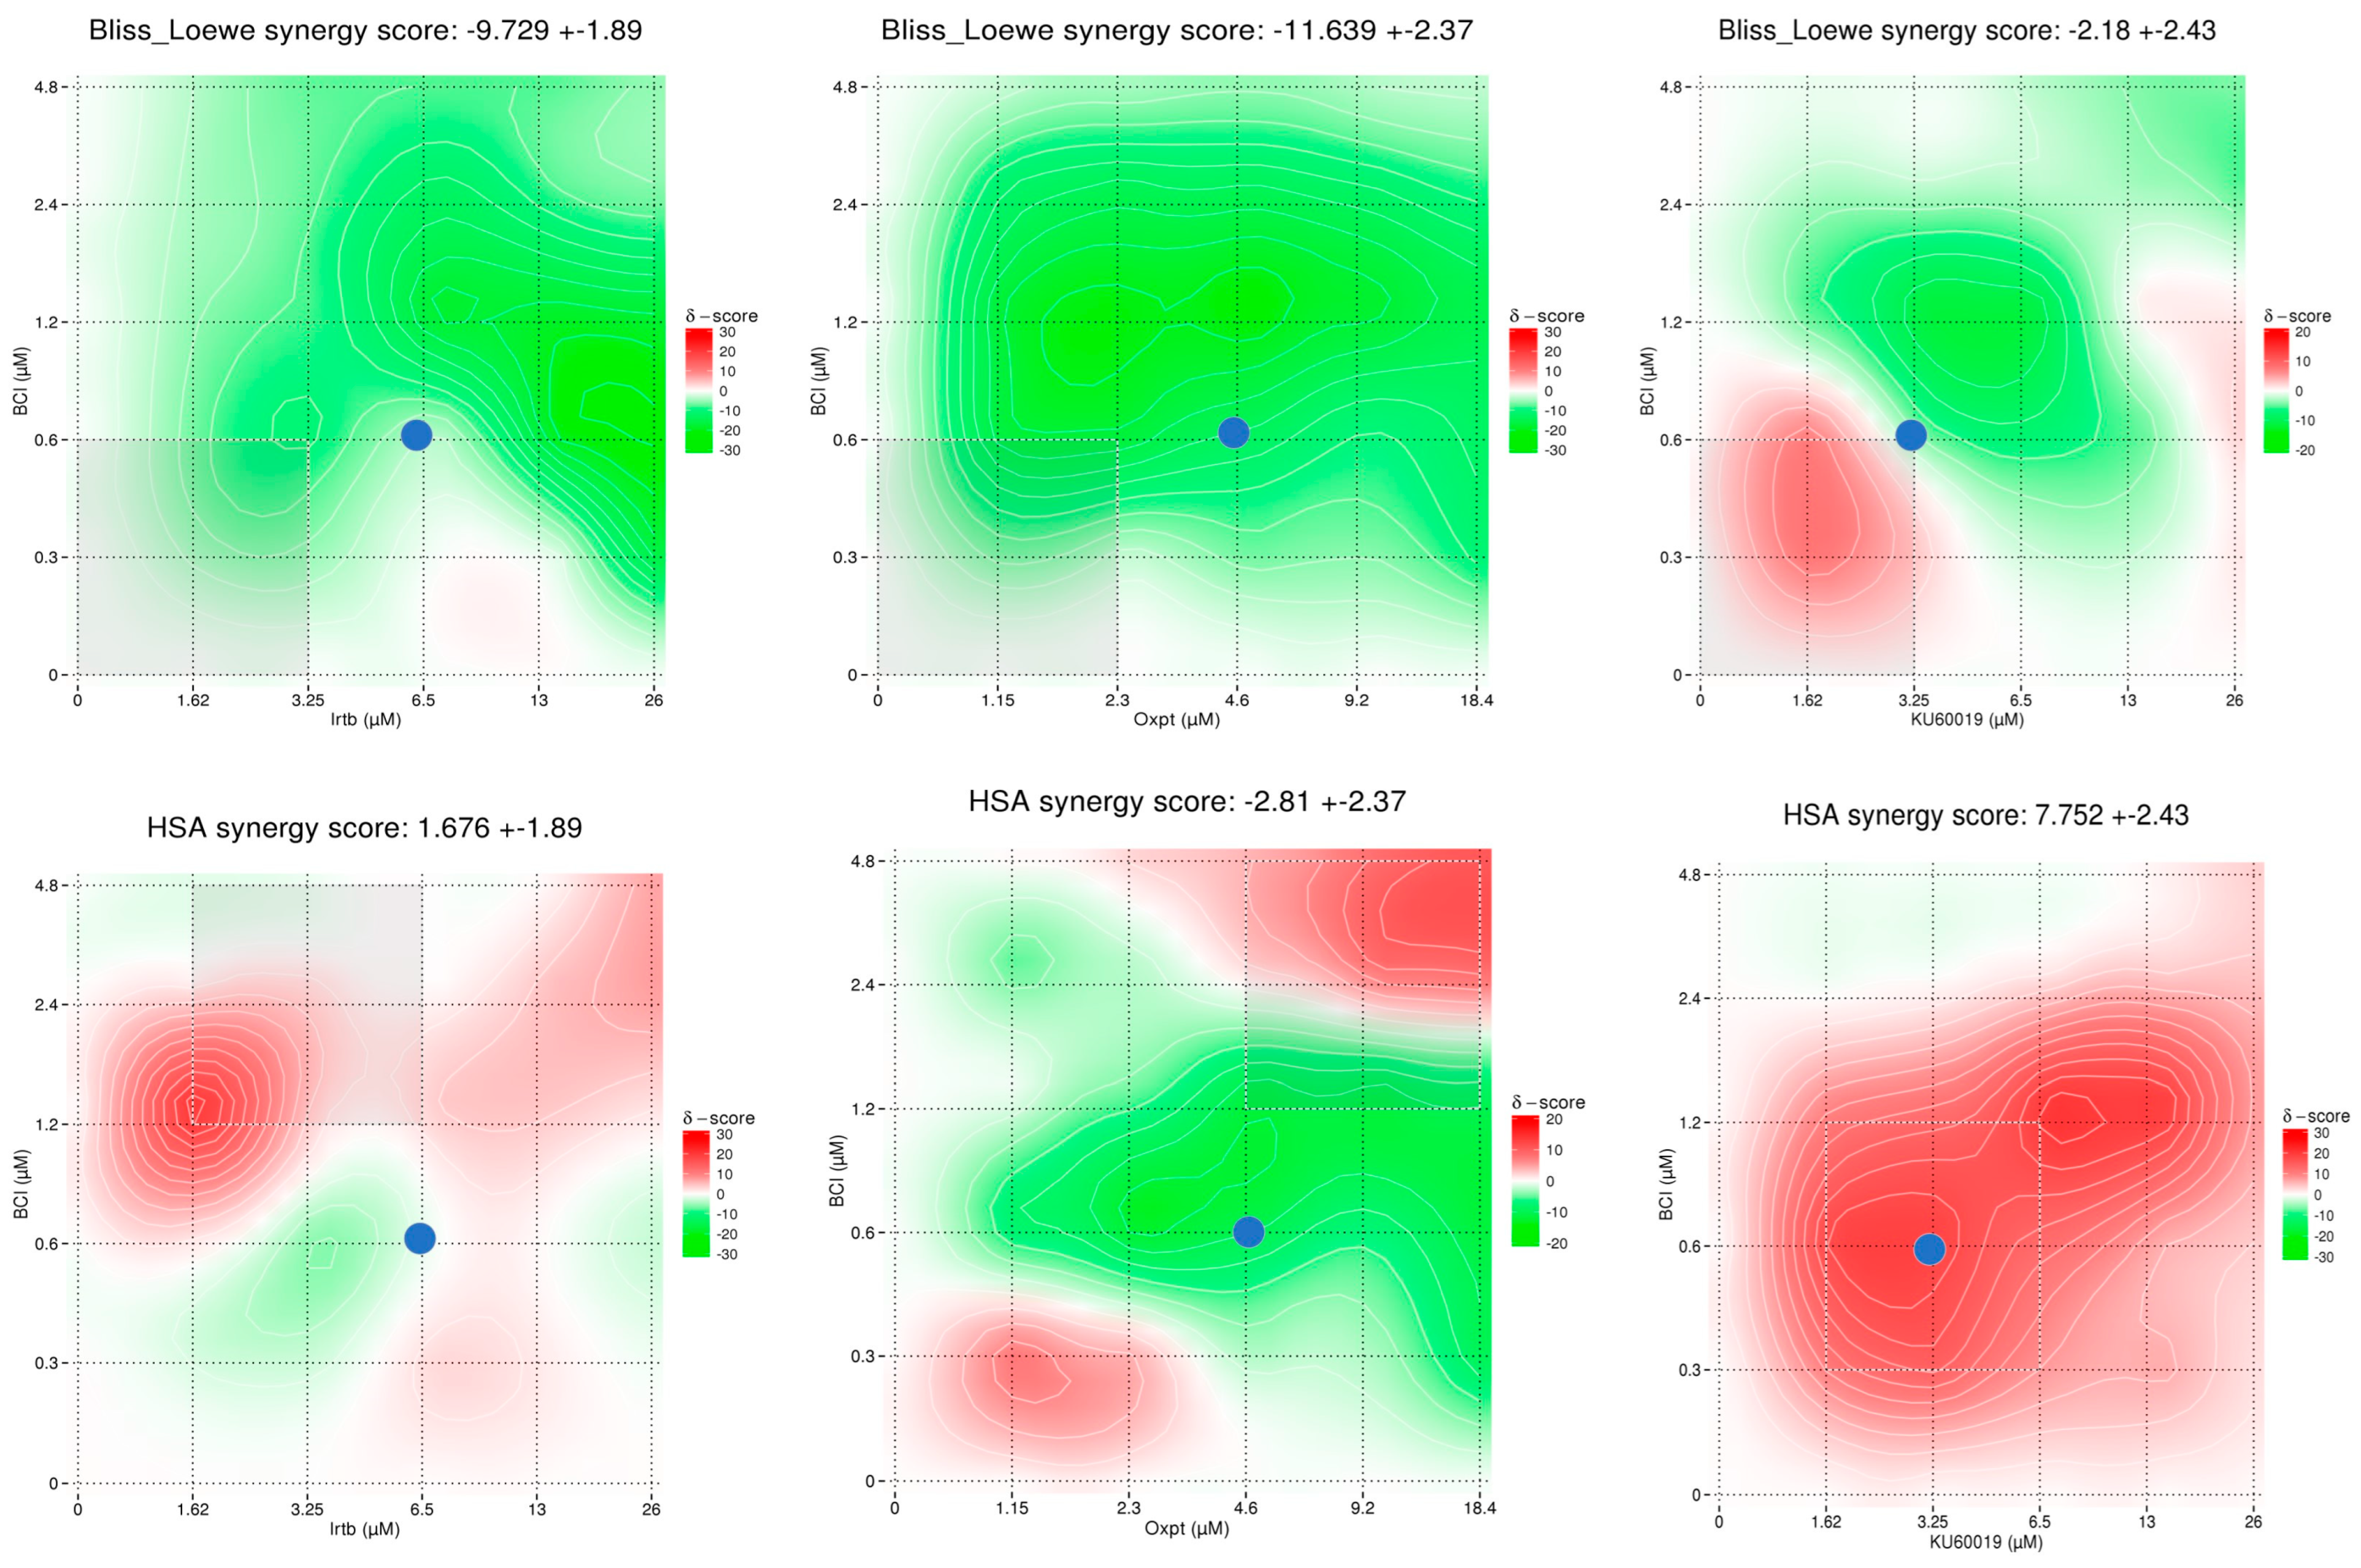
2.6.3. Synergy/Antagonism Investigation
2.7. Statistical Analysis
2.8. Computational Studies
2.8.1. Drug Likeness and ADMET
2.8.2. Target Prediction
2.8.3. Molecular Docking
2.8.4. Molecular Dynamics (MD) Simulation
2.8.5. Prime MM-GBSA Analysis
G = EMM + GSGB + GNP
3. Results
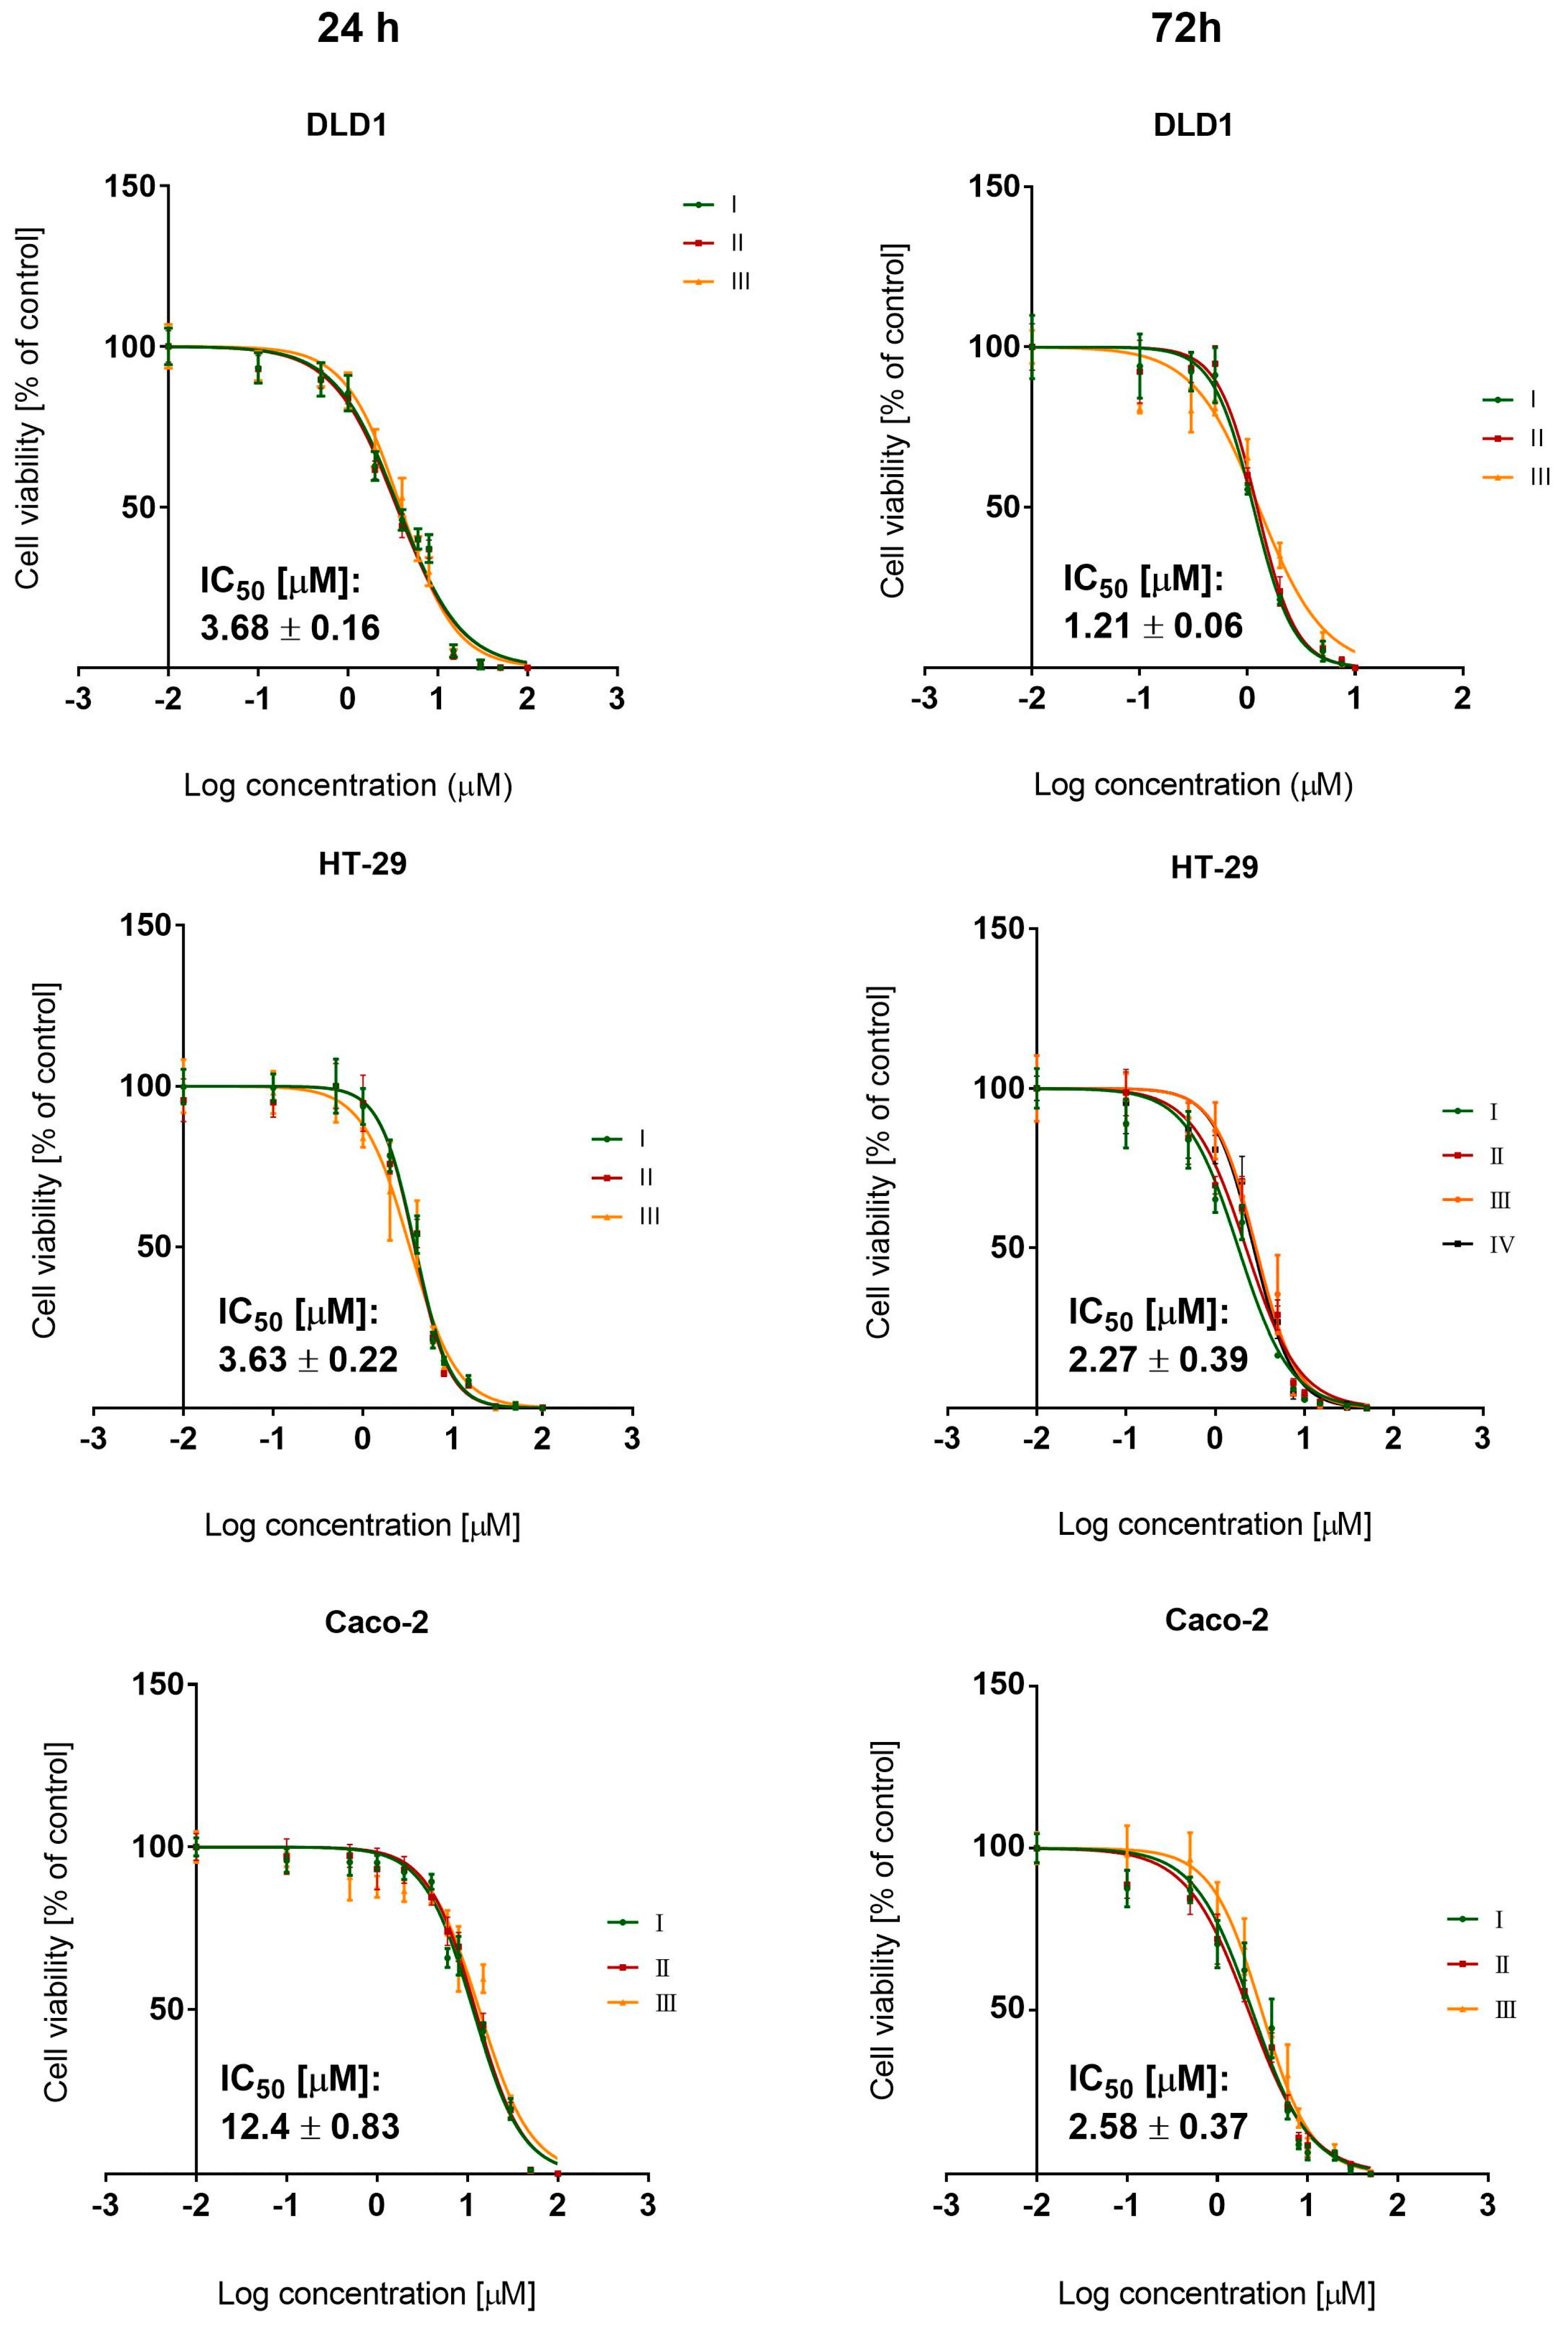
3.1. BCI Cytotoxicity
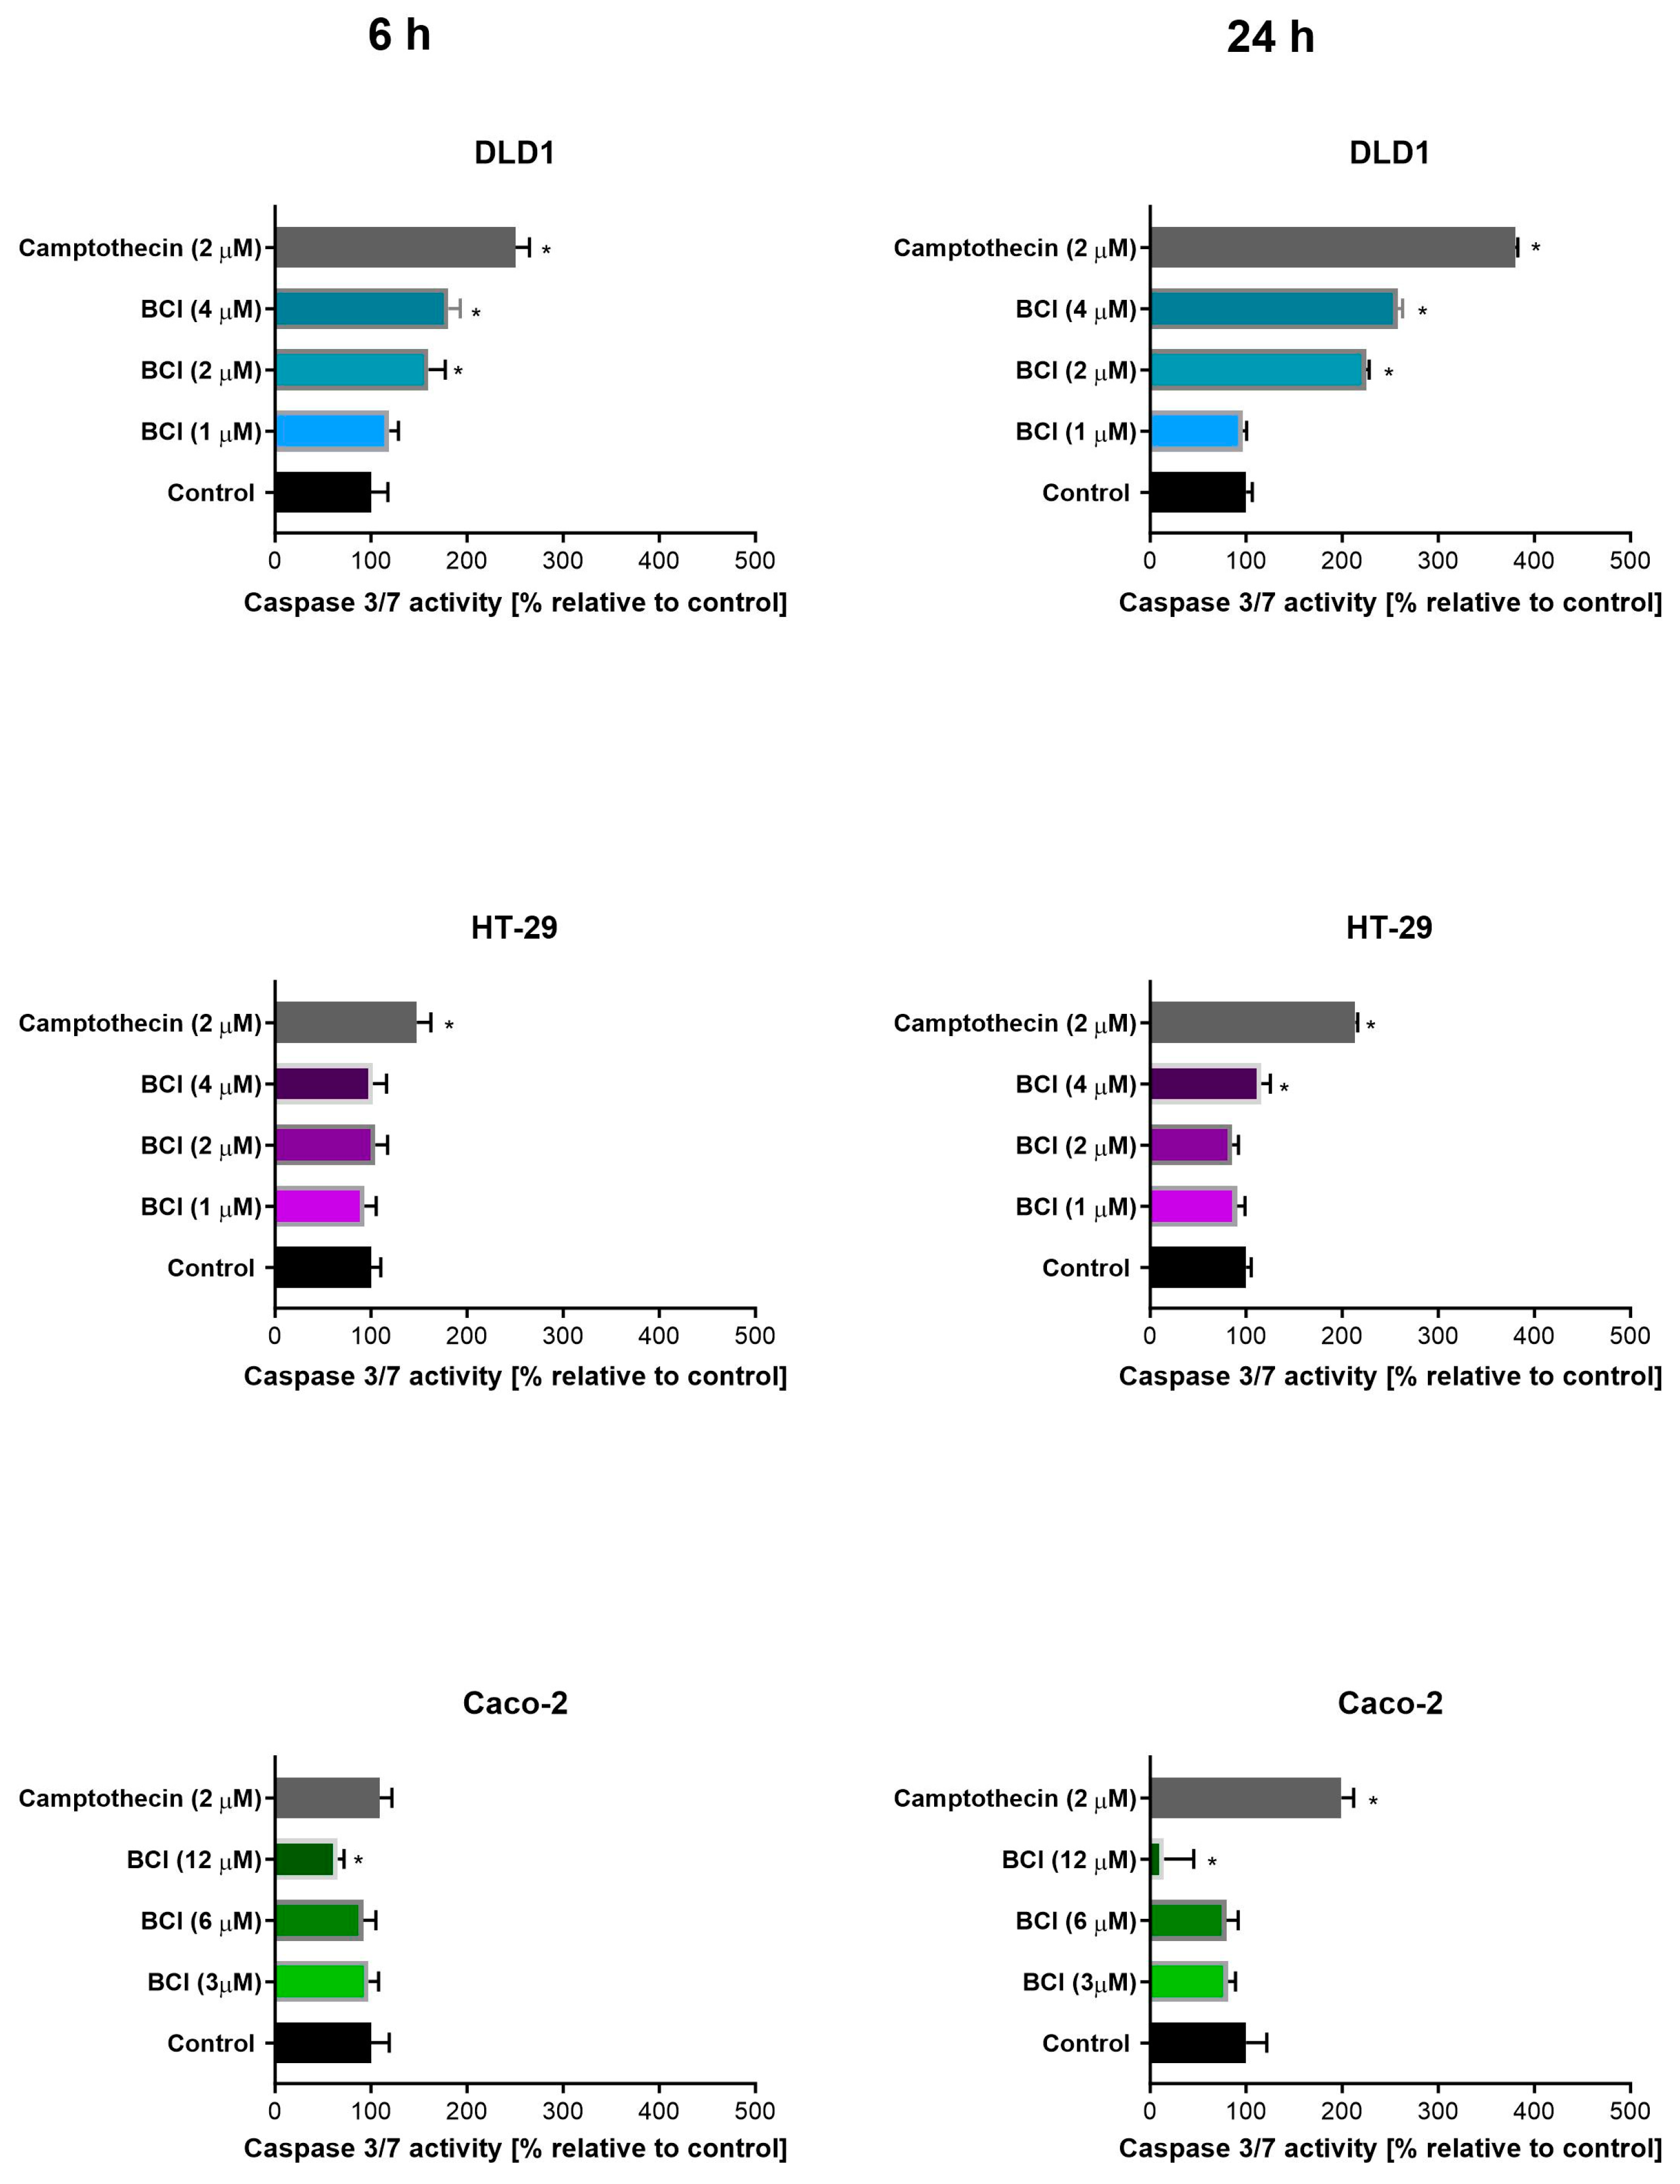
3.2. Study on Caspase 3/7 Activity
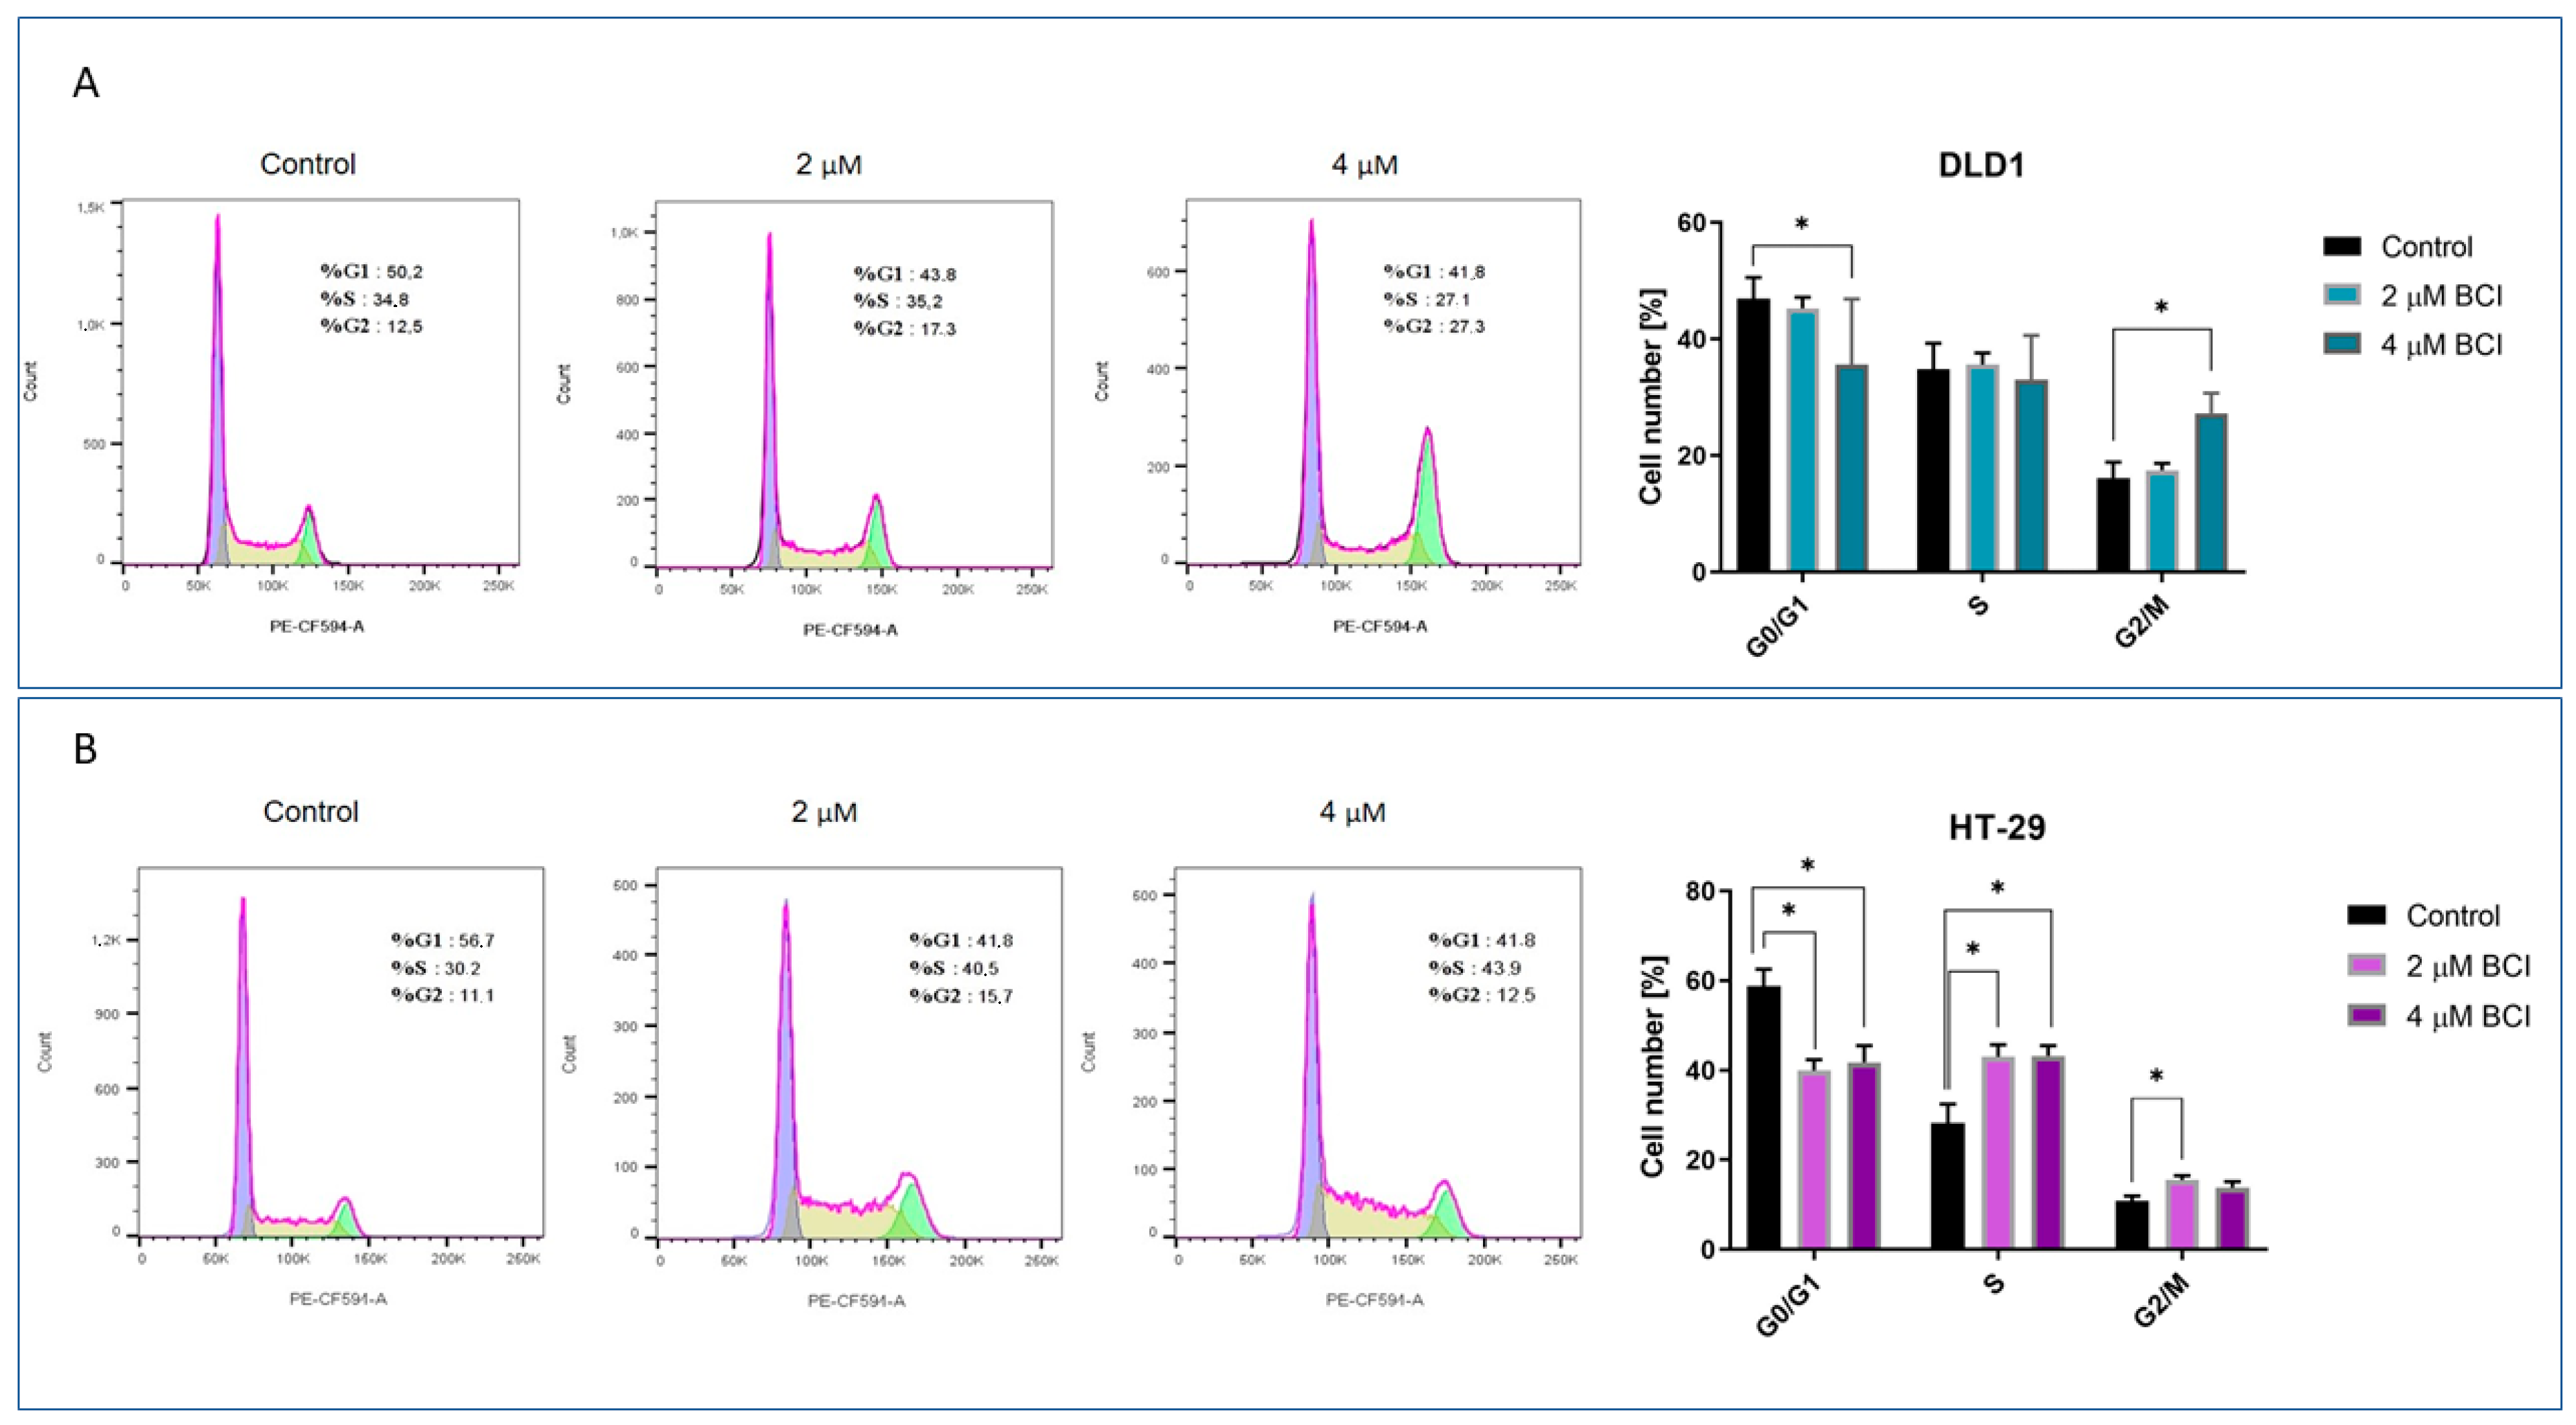
3.3. Cell Cycle Analysis
3.4. Modulation of Chemotherapeutic Agent Activity
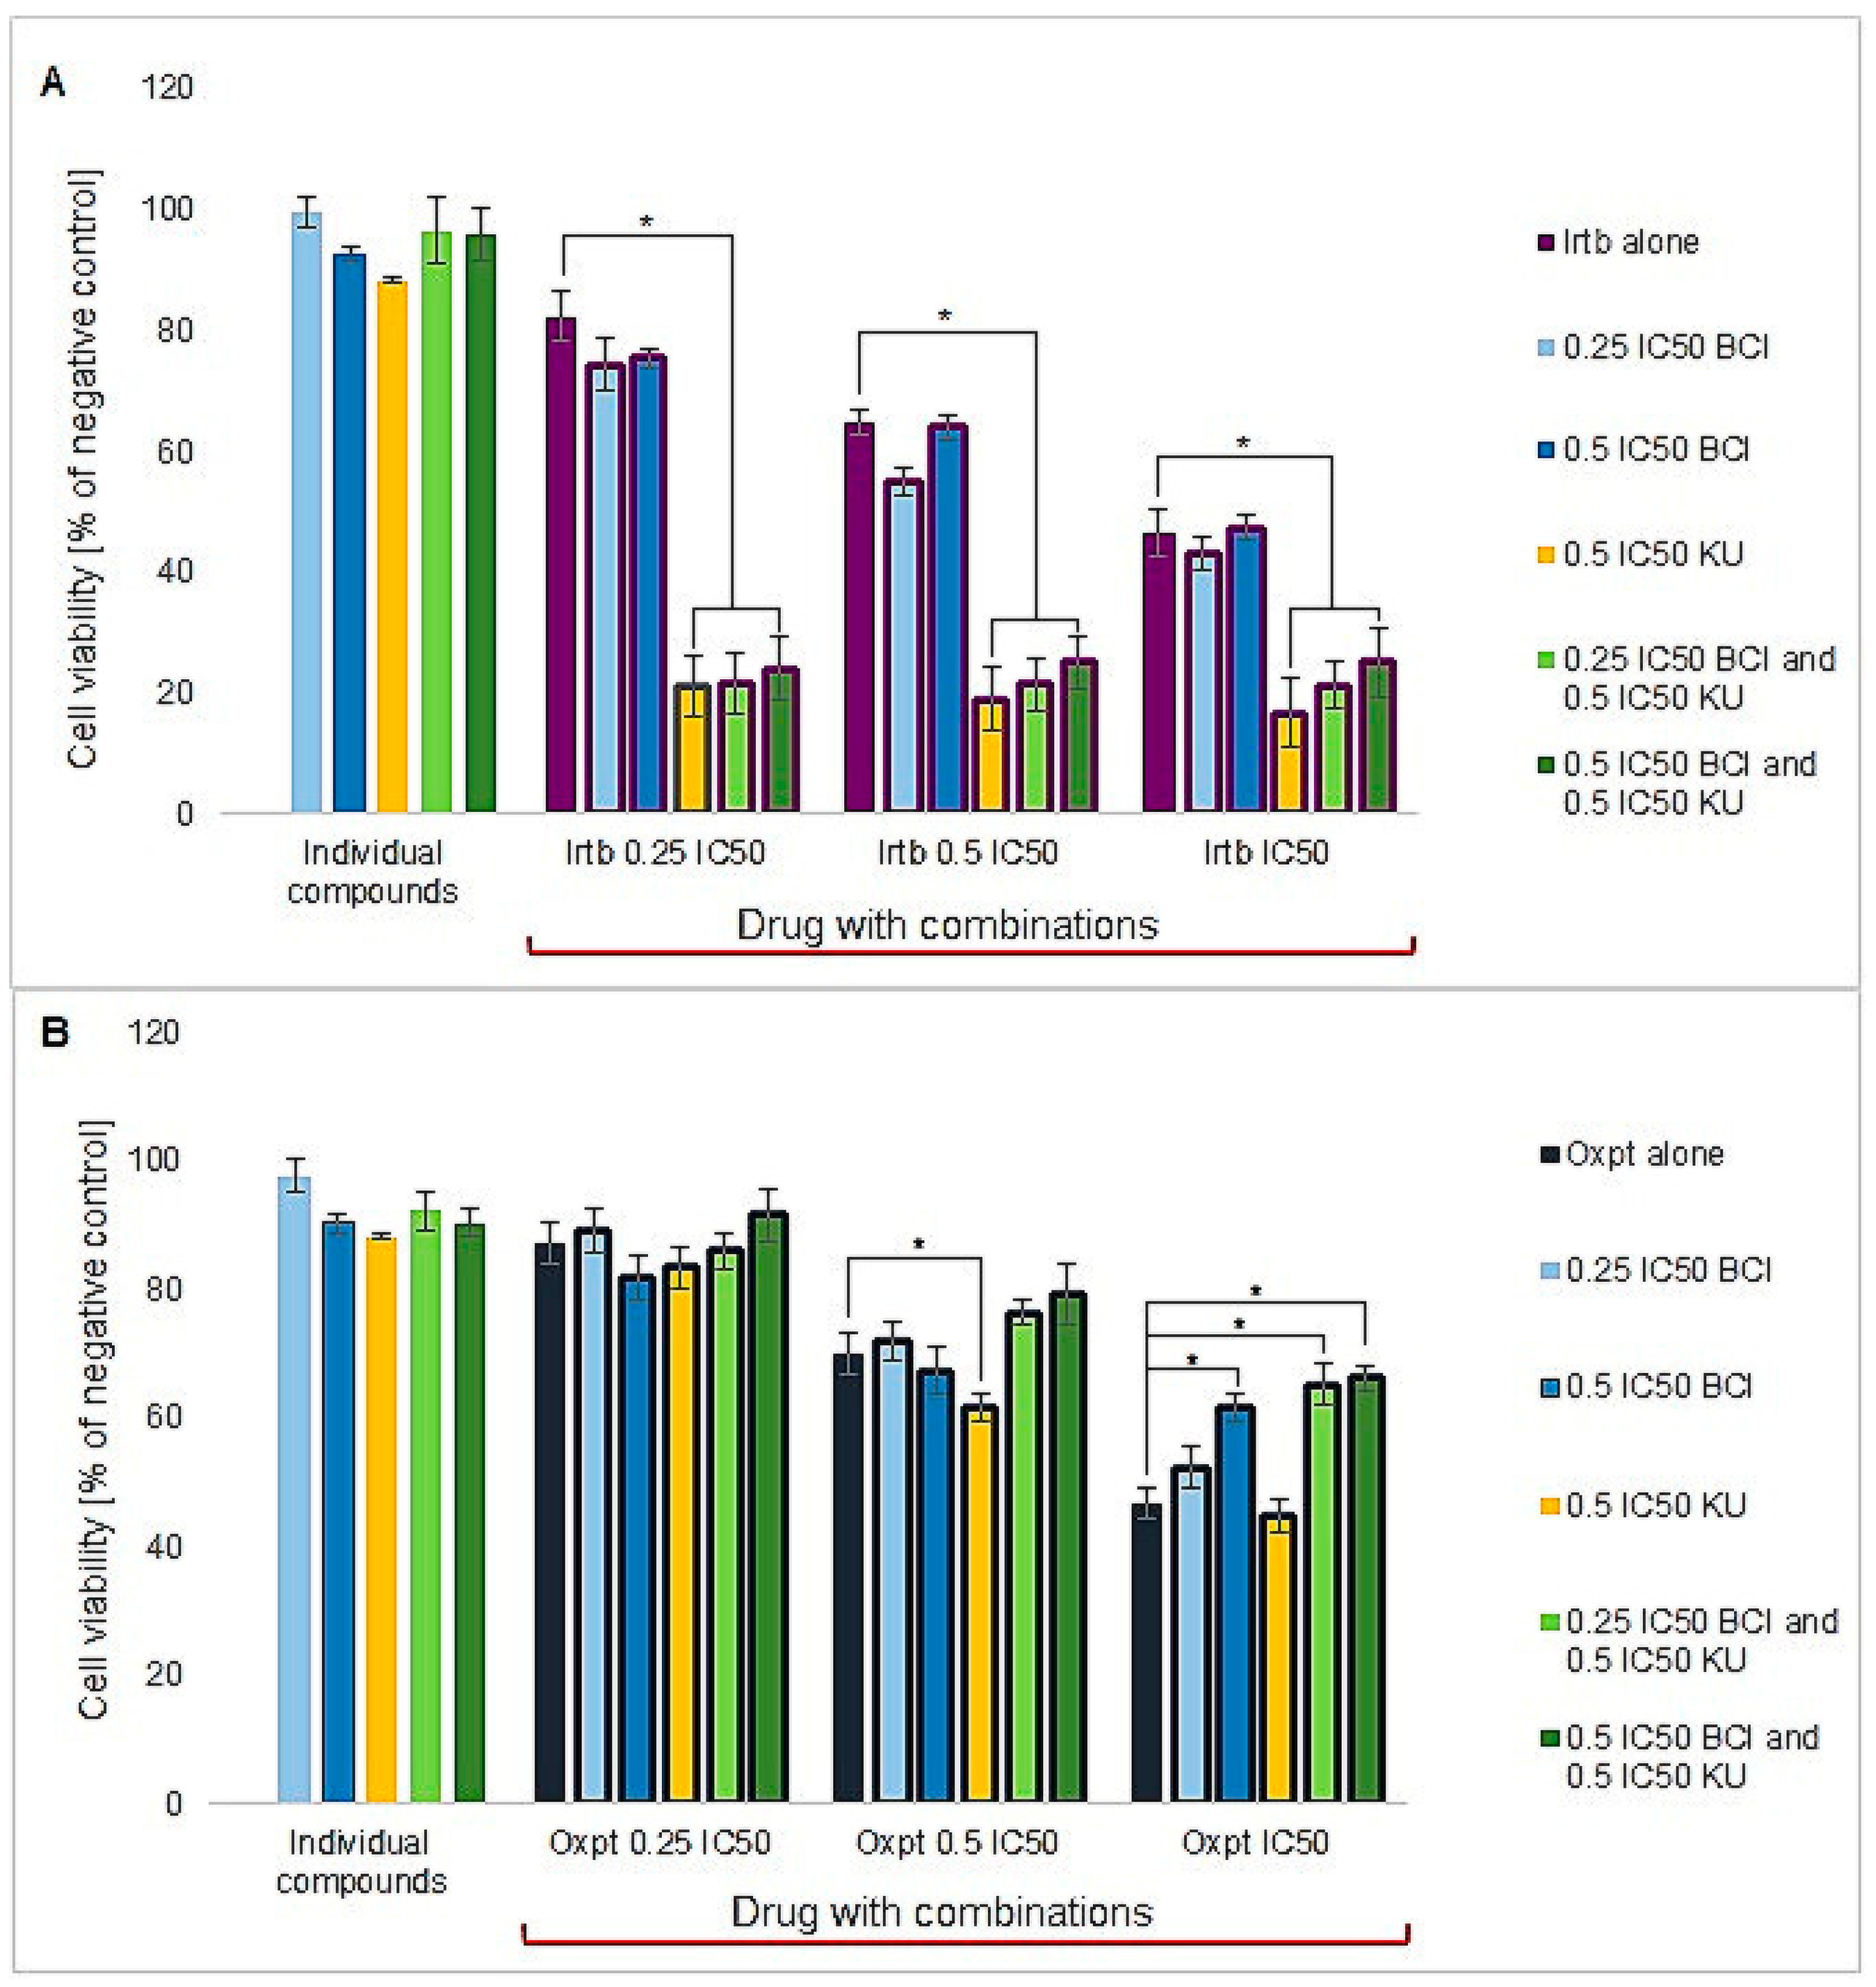
3.4.1. Cytotoxicity Study
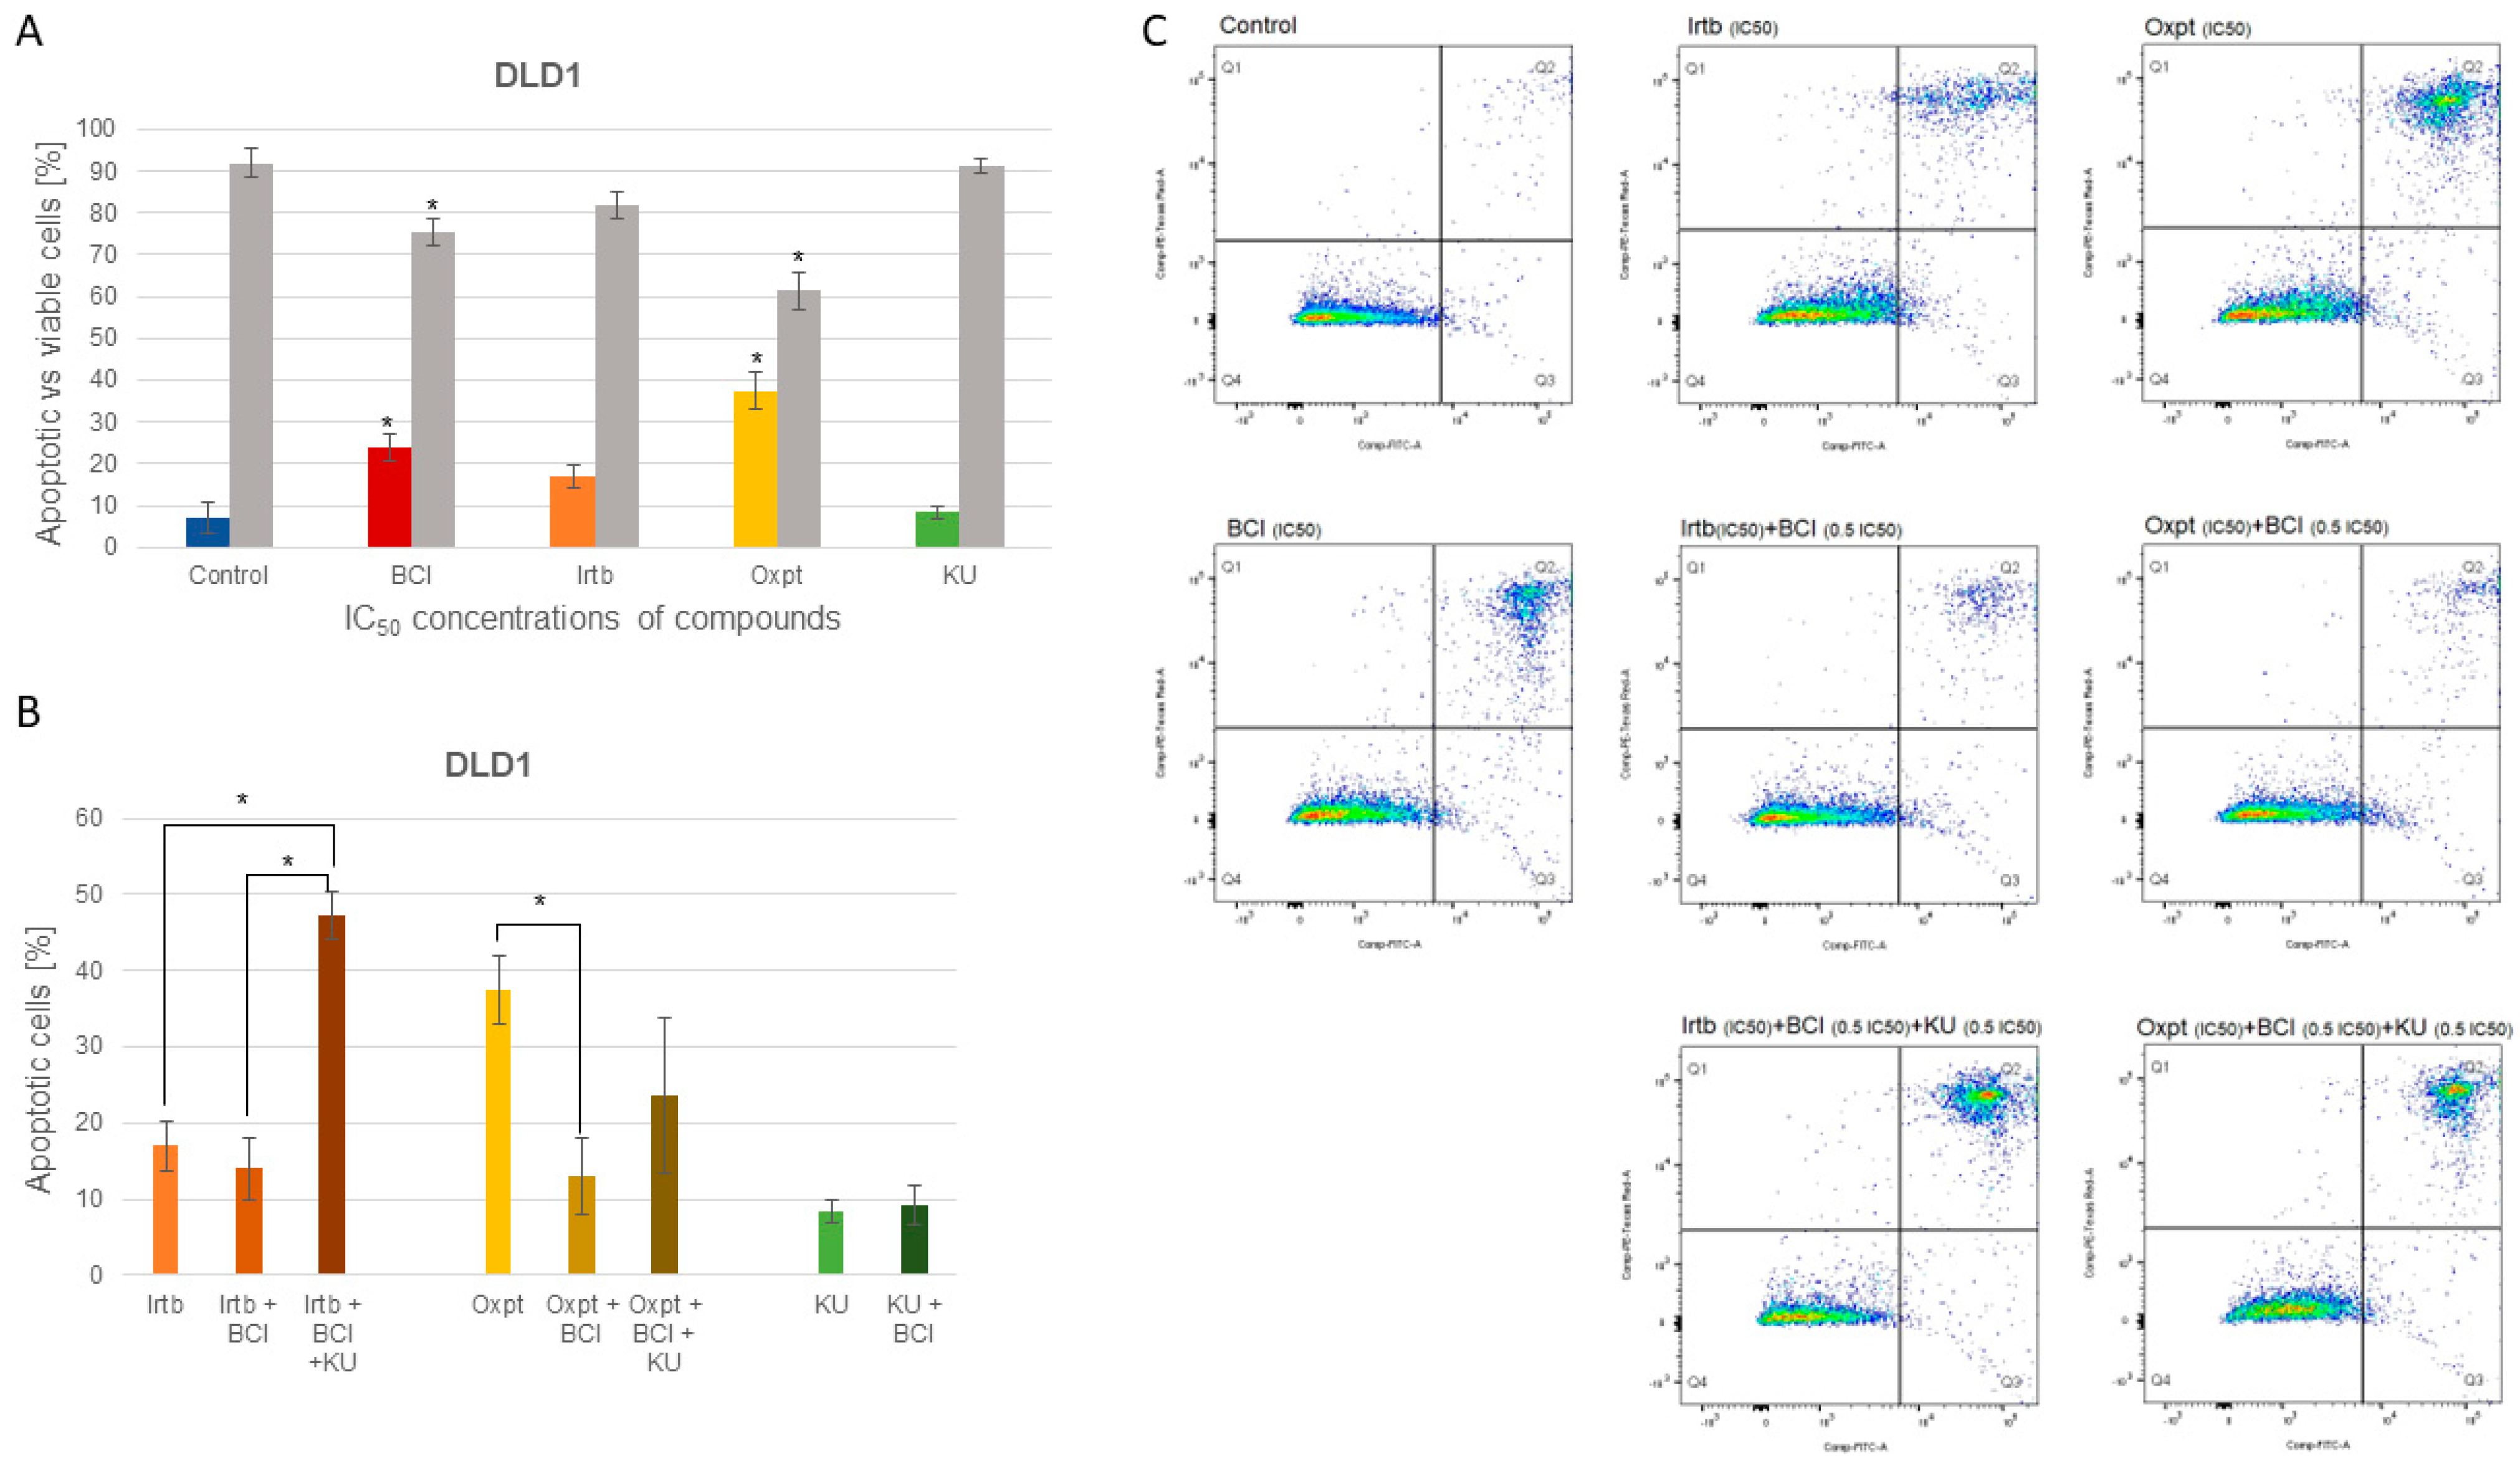
3.4.2. Apoptosis Detection
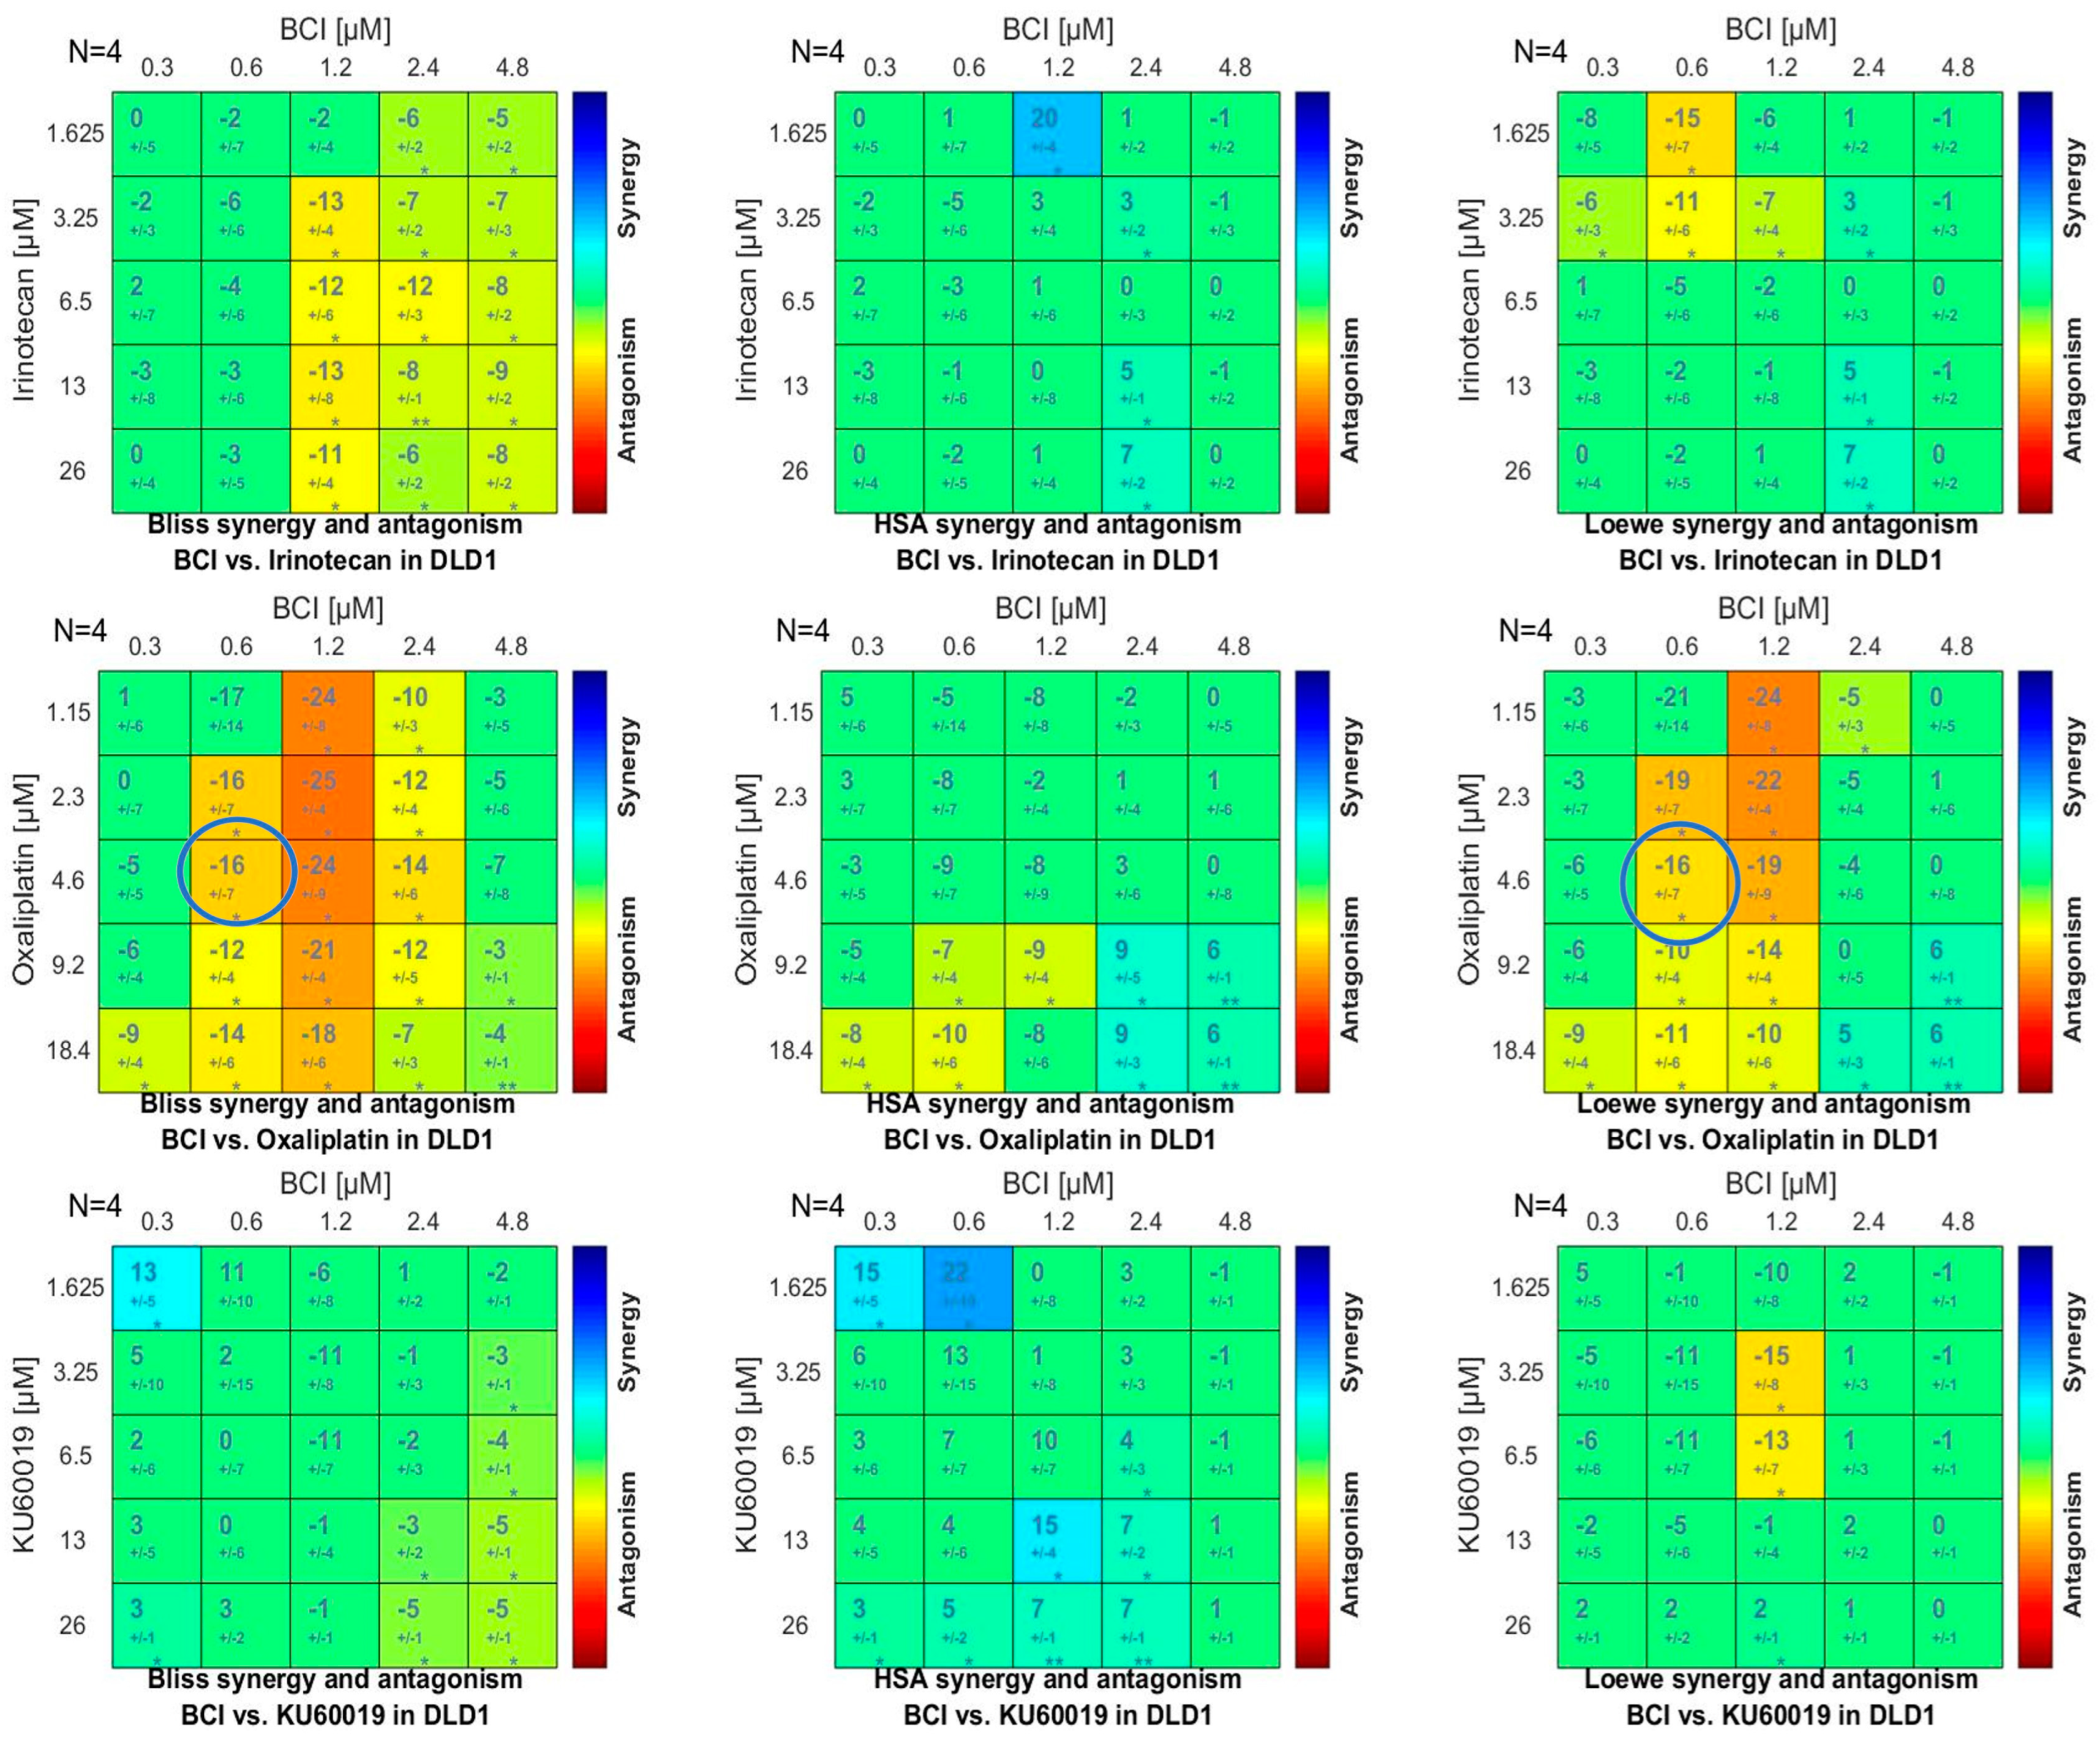
3.4.3. Synergy Studies
3.5. Computational Analysis
3.5.1. Drug Likeness and ADMET
3.5.2. Target Prediction
3.5.3. Molecular Docking
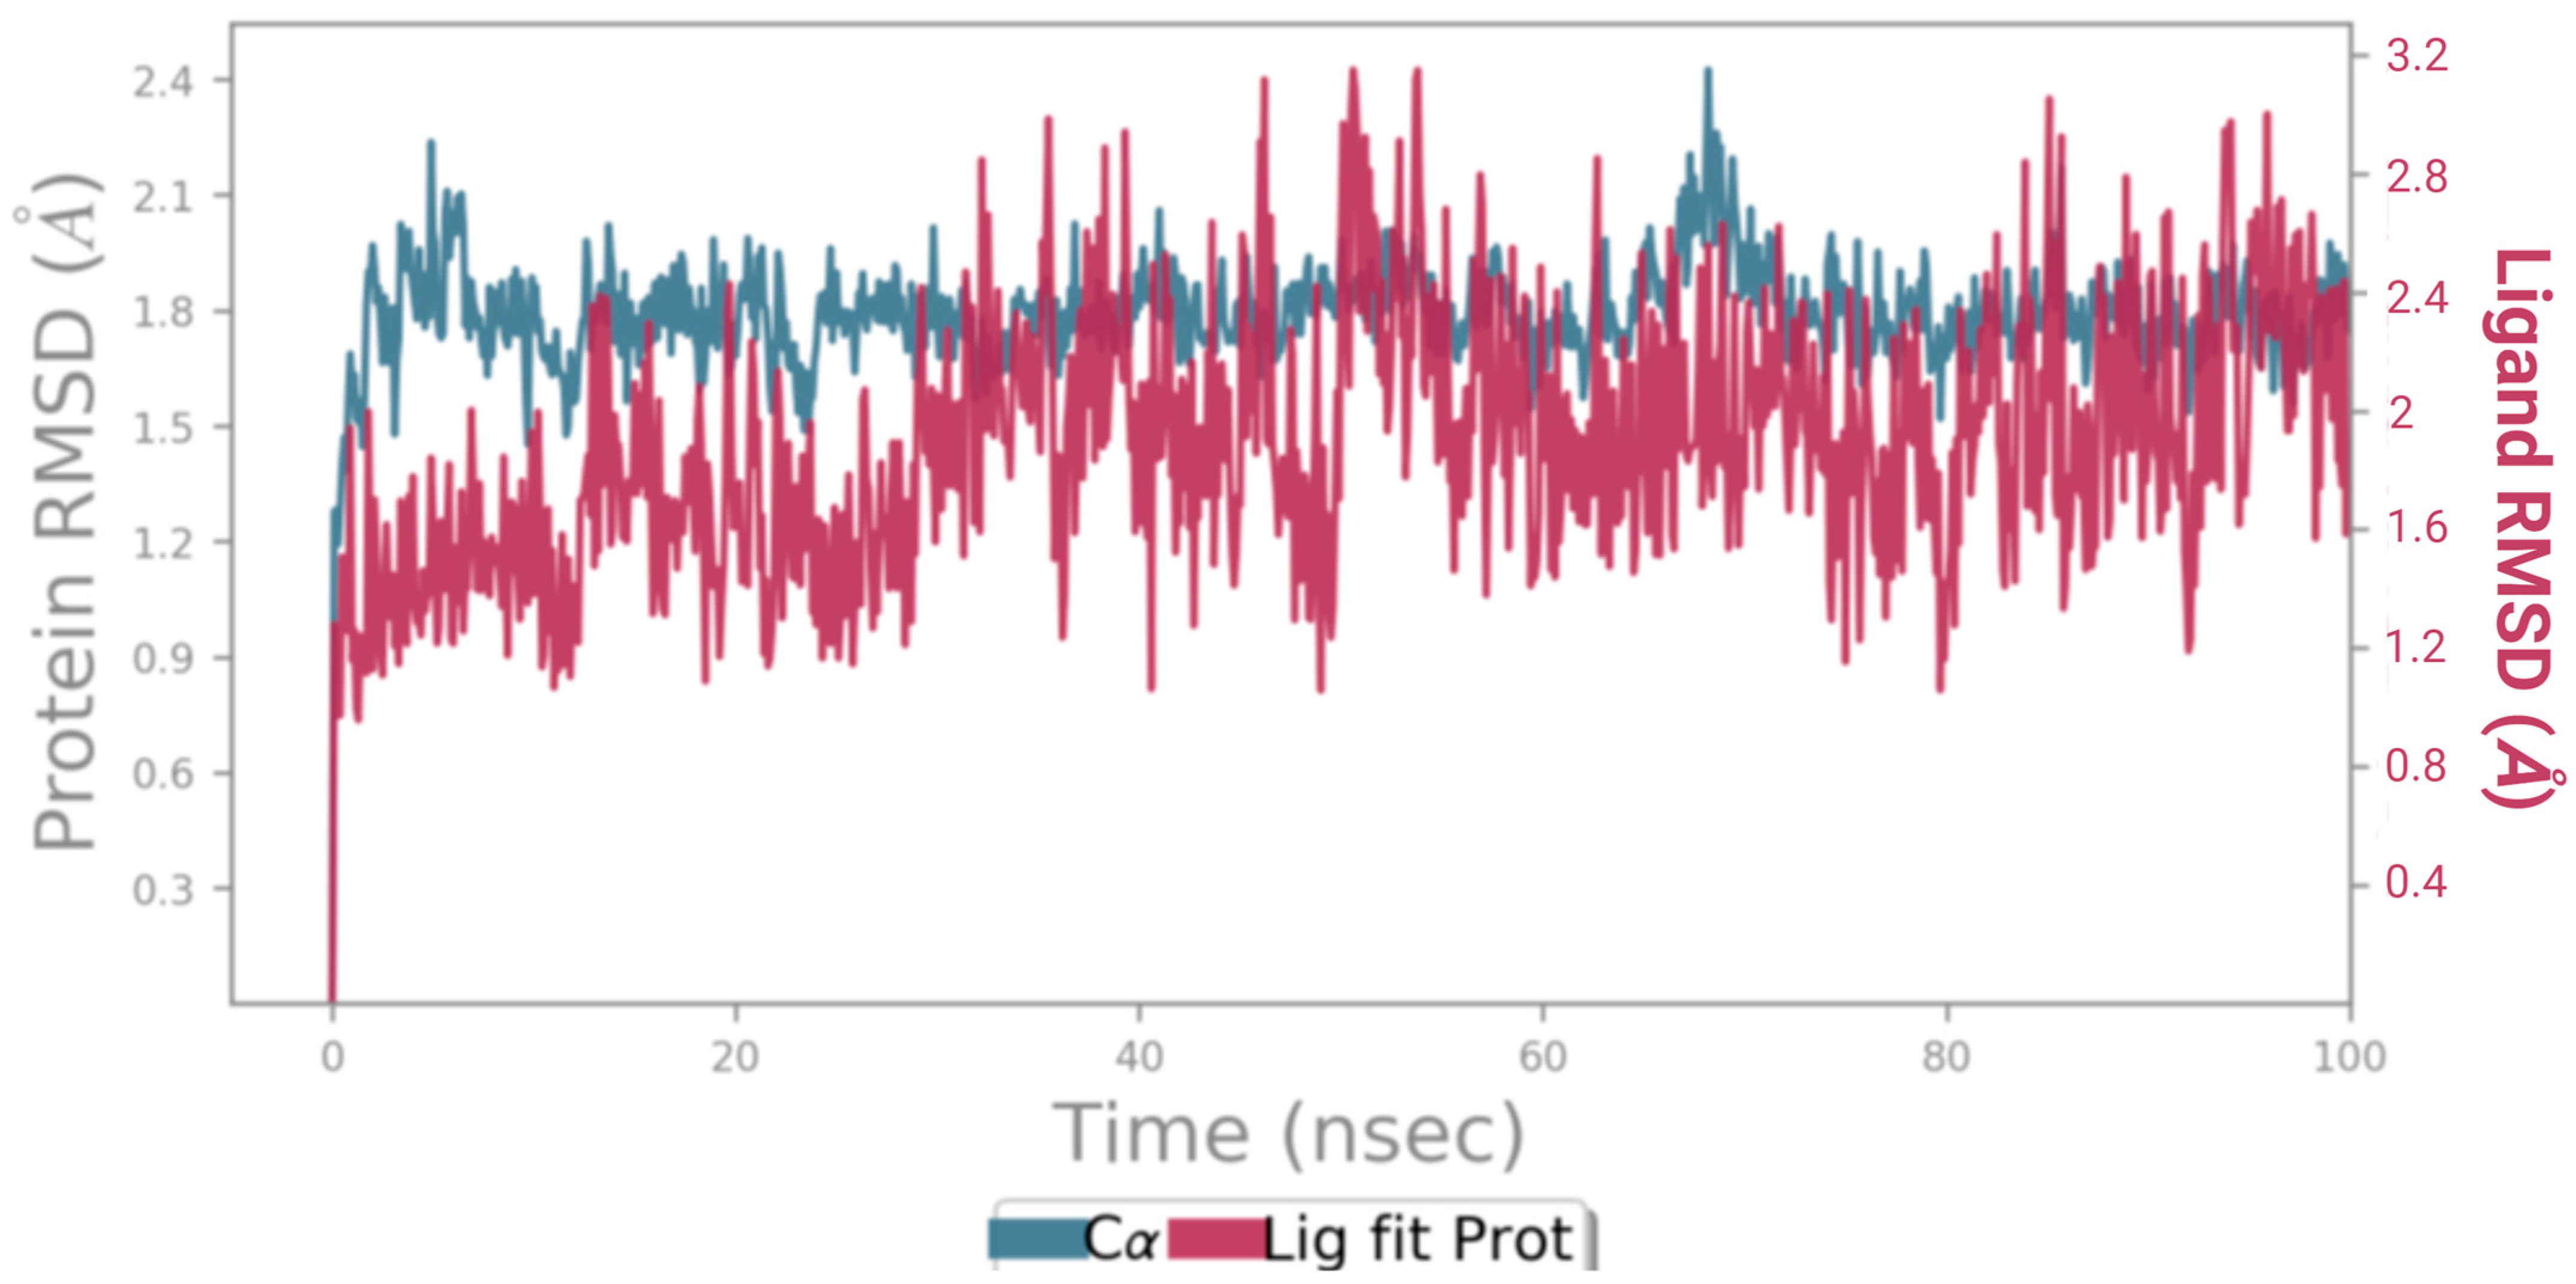
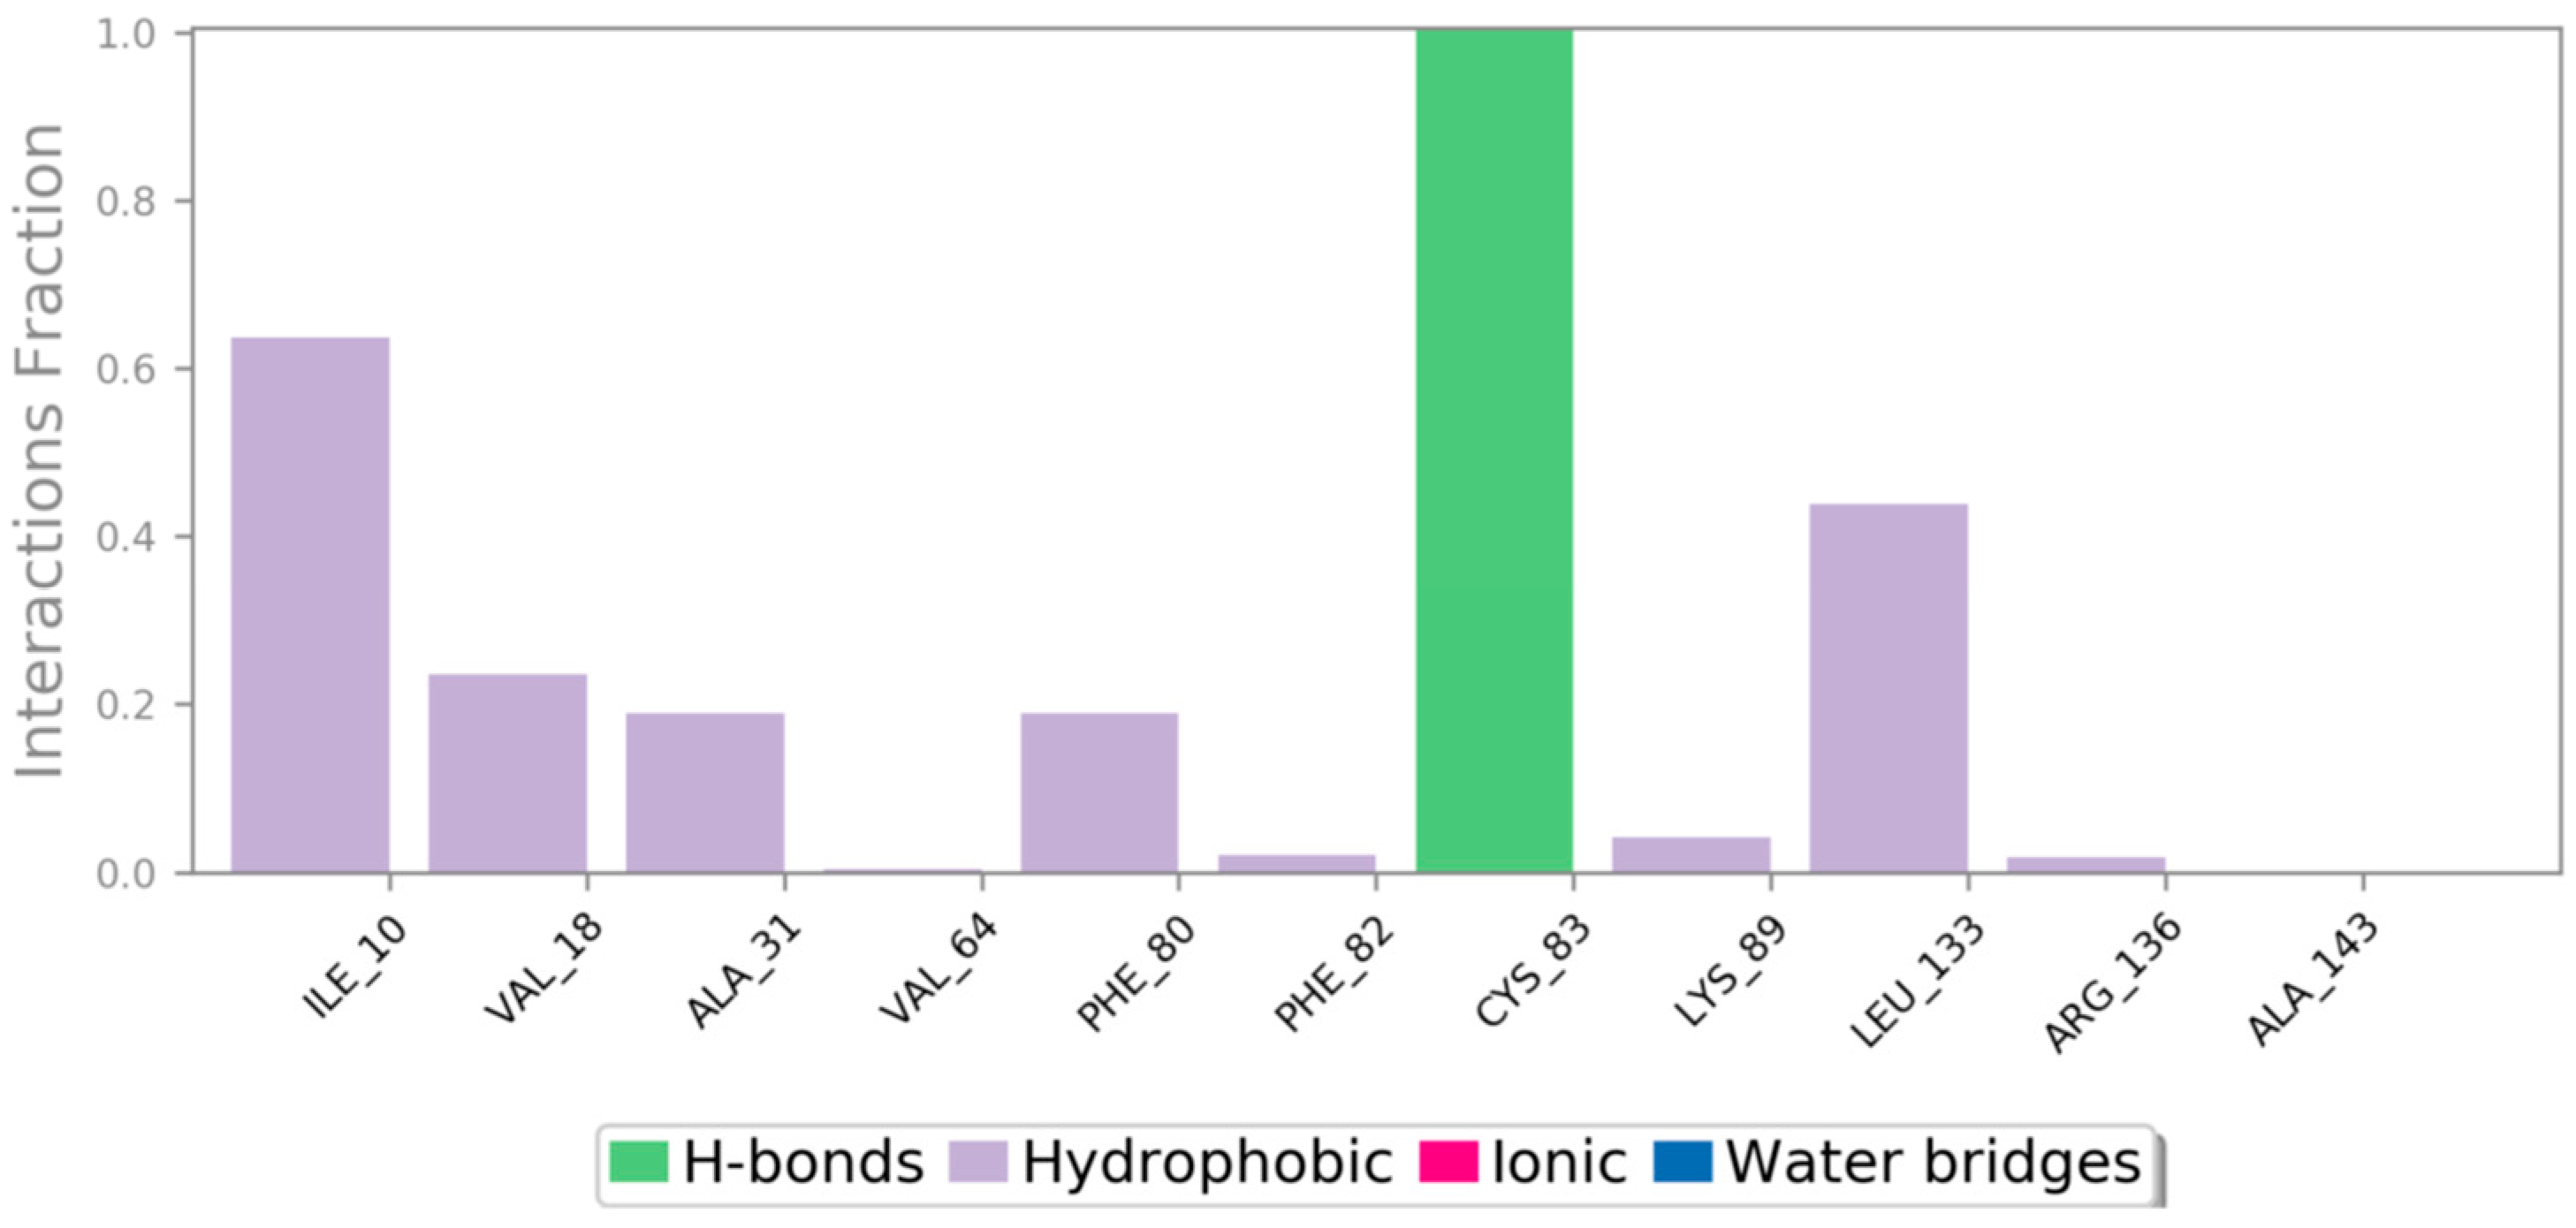
3.5.4. Molecular Dynamics (MD) Simulation
3.5.5. Prime MM-GBSA Analysis
4. Discussion
5. Conclusions
Supplementary Materials
Author Contributions
Funding
Institutional Review Board Statement
Informed Consent Statement
Data Availability Statement
Conflicts of Interest
Abbreviations
| 5-HT5a | Serotonin 5a Receptor |
| ABC | ATP-Binding Cassette |
| ADMET | Absorption, Distribution, Metabolism, Excretion, and Toxicity |
| ALL | Pre-B Acute Lymphoblastic Leukemia |
| APE1 | Apurinic/Apyrimidinic Endonuclease 1 |
| ATM | ATM Serine/Threonine Kinase |
| BBB | Blood–Brain Barrier |
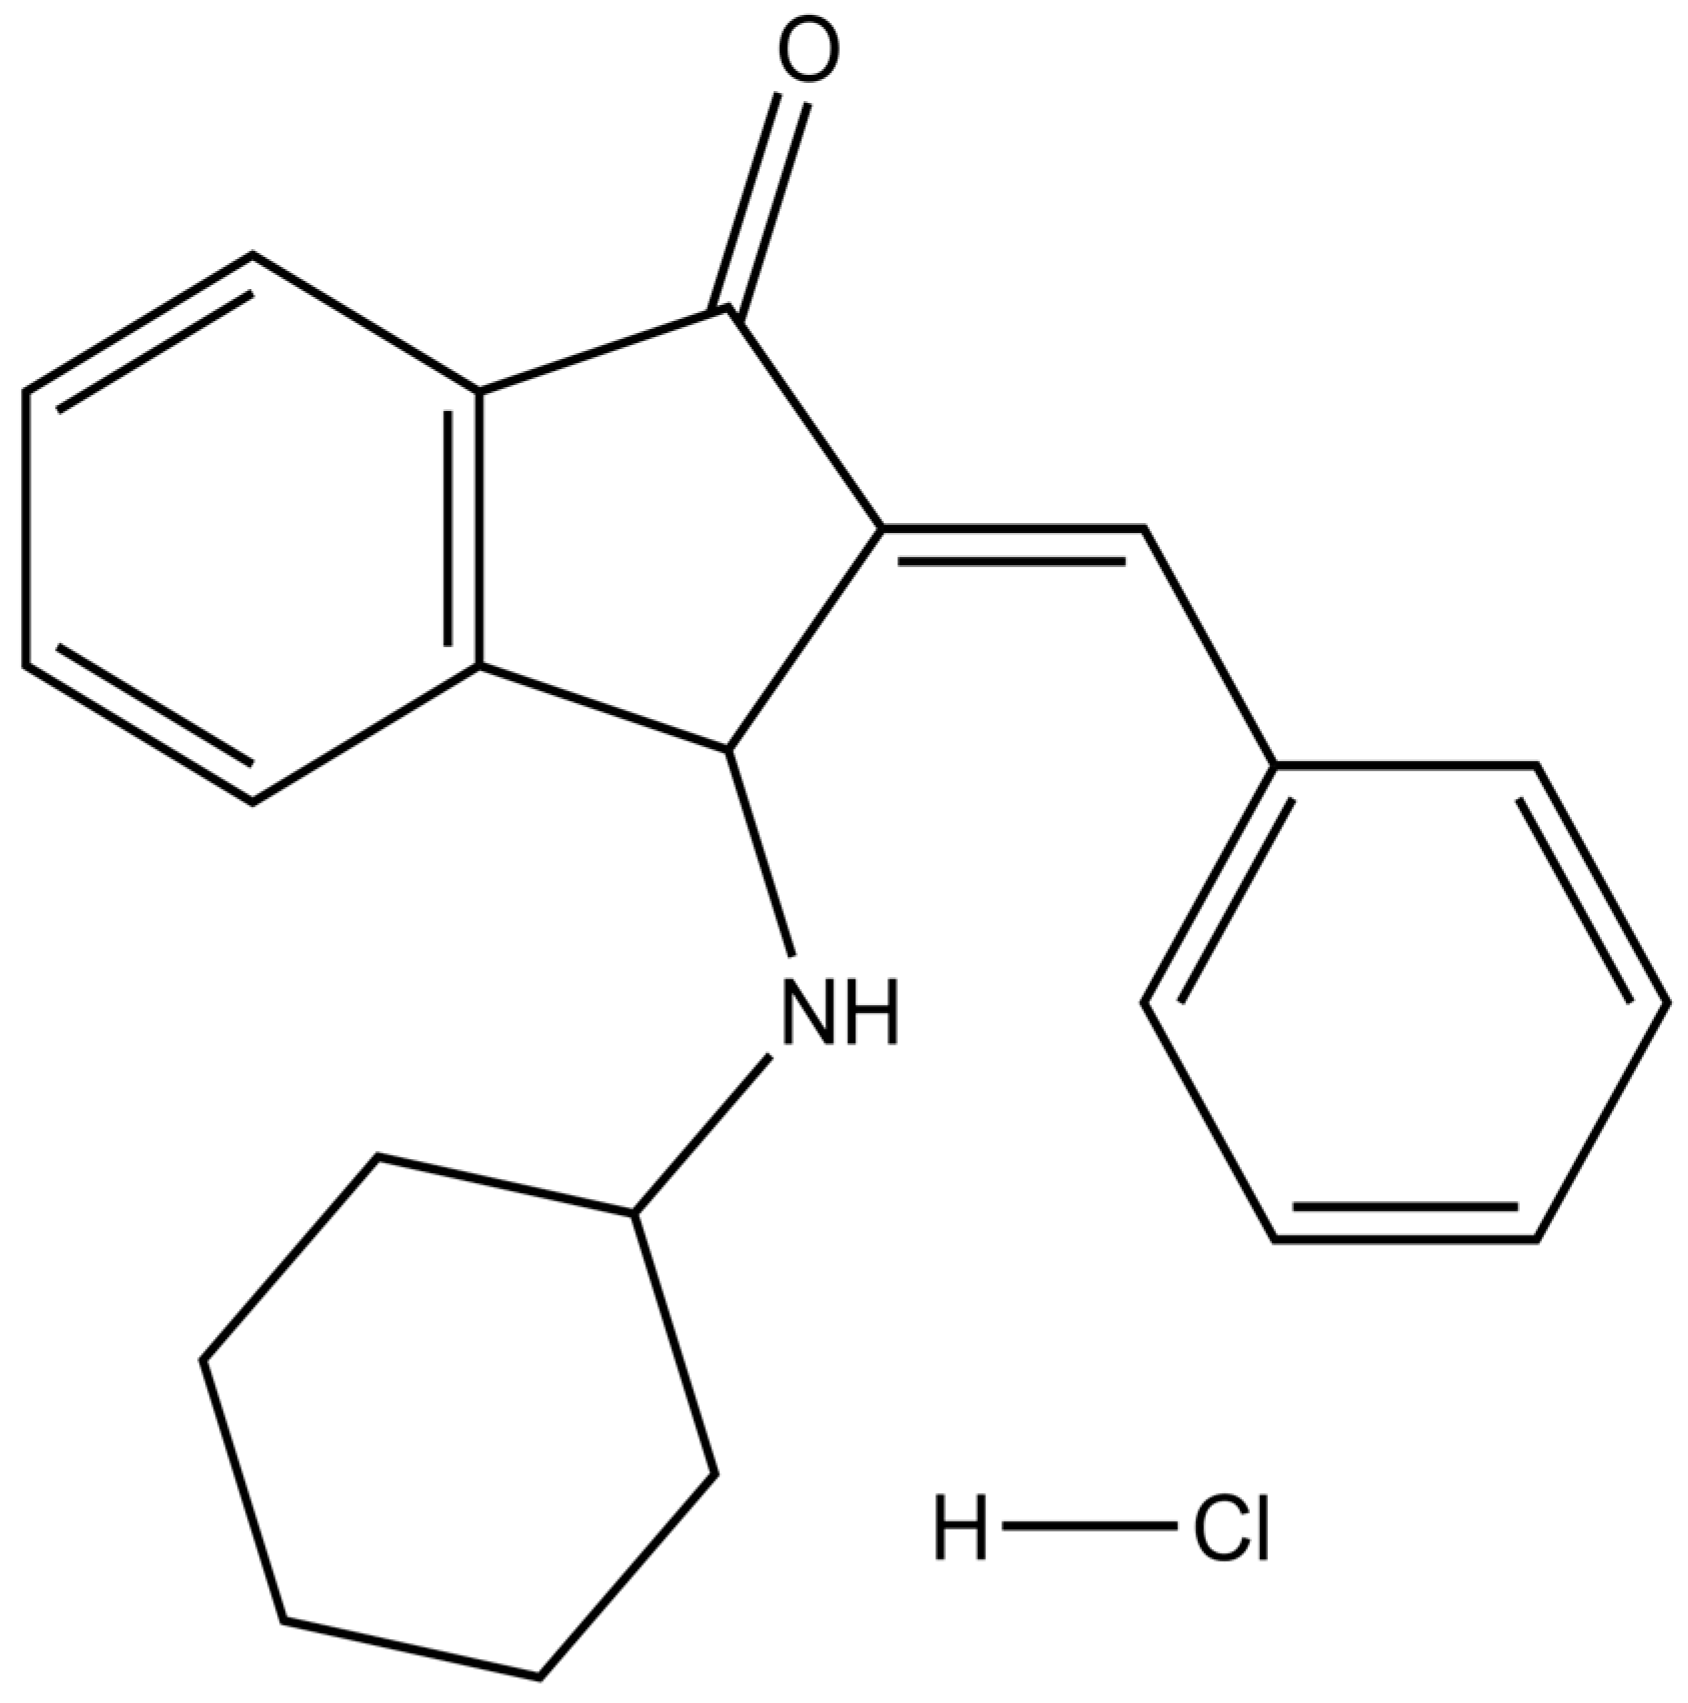
| BCI | (E)-2-benzylidene-3-(cyclohexylamino)-2,3-dihydro-1H-inden-1-one |
| CASR | Calcium Sensing Receptor |
| CDK1 | Cyclin-Dependent Kinase 1 |
| CDK5 | Cyclin-Dependent Kinase 5 |
| CHK1/2 | Checkpoint Kinases 1/2 |
| CK2A1 | Casein Kinase II Subunit Alpha |
| CNS | Central Nervous System |
| CPSD | Cathepsin D |
| CRC | Colorectal Cancer |
| CXCR3 | C-X-C Chemokine Receptor Type 3 |
| CYP | Cytochrome |
| DDR | DNA Damage Response |
| DPP4 | Dipeptidyl Peptidase IV |
| DRD1 | Dopamine D1 Receptor |
| DUSP | Dual Specificity Phosphatase |
| DUSP6 | Dual Specificity Phosphatase 6 |
| EGFR | EGFR: Epidermal Growth Factor Receptor |
| ERK | Extracellular Signal-Regulated Kinase |
| GI | Gastrointestinal |
| GLP-1R | Glucagon-like Peptide-1 Receptor |
| hERG | Human Ether-a-go-go-Related Gene |
| ICAM-1 | Intercellular Adhesion Molecule |
| IDO1 | Indoleamine 2,3-Dioxygenase-1 |
| IND | Investigational New Drug |
| IR | Ionizing Radiation |
| JAK1/2/3 | Tyrosine-Protein Kinase JAK1/2/3 |
| LQTS | Long QT Syndrome |
| MAPKs | Mitogen-Activated Protein Kinases |
| MKP | Mitogen-Activated Protein Kinases Phosphatases |
| MPNST | Malignant Peripheral Nerve Sheath Tumor |
| NC | Negative Control |
| OPRM1 | Mu Opioid Receptor |
| PAI-1 | Plasminogen Activator Inhibitor Type-1 |
| PRCP | Lysosomal Pro-X Carboxypeptidase |
| RMSD | Root-Mean-Square Deviation |
| RMSF | Root-Mean-Square Fluctuation |
| ROCK1/2 | Rho-Associated Protein Kinase-1/2 |
| ROS | Reactive Oxygen Species |
| SOD2 | Superoxide Dismutase 2 |
| SSE | Secondary Structure Analysis |
| SSTR3 | Somatostatin Receptor 3 |
| STAT3 | Signal Transducer and Activator of Transcription-3 |
| TNF-α | Tumor Necrosis Factor α |
| TOP2β | Topoisomerase-II Beta |
| TP53 | Cellular Tumor Antigen p53 |
| TRIM24 | Tripartite Motif-Containing 24 |
| TYK2 | Tyrosine-Protein Kinase TYK2 |
References
- Sung, H.; Ferlay, J.; Siegel, R.L.; Laversanne, M.; Soerjomataram, I.; Jemal, A.; Bray, F. Global Cancer Statistics 2020: GLOBOCAN Estimates of Incidence and Mortality Worldwide for 36 Cancers in 185 Countries. CA Cancer J. Clin. 2021, 71, 209–249. [Google Scholar] [CrossRef] [PubMed]
- Chan, D.K.H.; Buczacki, S.J.A. Tumour Heterogeneity and Evolutionary Dynamics in Colorectal Cancer. Oncogenesis 2021, 10, 53. [Google Scholar] [CrossRef] [PubMed]
- Siegel, R.L.; Wagle, N.S.; Cercek, A.; Smith, R.A.; Jemal, A. Colorectal Cancer Statistics, 2023. CA Cancer J. Clin. 2023, 73, 233–254. [Google Scholar] [CrossRef] [PubMed]
- Rocca, A.; Braga, L.; Volpe, M.C.; Maiocchi, S.; Generali, D. The Predictive and Prognostic Role of RAS–RAF–MEK–ERK Pathway Alterations in Breast Cancer: Revision of the Literature and Comparison with the Analysis of Cancer Genomic Datasets. Cancers 2022, 14, 5306. [Google Scholar] [CrossRef] [PubMed]
- Deschênes-Simard, X.; Gaumont-Leclerc, M.-F.; Bourdeau, V.; Lessard, F.; Moiseeva, O.; Forest, V.; Igelmann, S.; Mallette, F.A.; Saba-El-Leil, M.K.; Meloche, S.; et al. Tumor Suppressor Activity of the ERK/MAPK Pathway by Promoting Selective Protein Degradation. Genes Dev. 2013, 27, 900–915. [Google Scholar] [CrossRef]
- Buffet, C.; Hecale-Perlemoine, K.; Bricaire, L.; Dumont, F.; Baudry, C.; Tissier, F.; Bertherat, J.; Cochand-Priollet, B.; Raffin-Sanson, M.-L.; Cormier, F.; et al. DUSP5 and DUSP6, Two ERK Specific Phosphatases, Are Markers of a Higher MAPK Signaling Activation in BRAF Mutated Thyroid Cancers. PLoS ONE 2017, 12, e0184861. [Google Scholar] [CrossRef]
- Guo, Y.; Pan, W.; Liu, S.; Shen, Z.; Xu, Y.; Hu, L. ERK/MAPK Signalling Pathway and Tumorigenesis (Review). Exp. Ther. Med. 2020, 19, 1997–2007. [Google Scholar] [CrossRef]
- Low, H.B.; Zhang, Y. Regulatory Roles of MAPK Phosphatases in Cancer. Immune Netw. 2016, 16, 85. [Google Scholar] [CrossRef]
- Lu, Y.; Liu, B.; Liu, Y.; Yu, X.; Cheng, G. Dual Effects of Active ERK in Cancer: A Potential Target for Enhancing Radiosensitivity (Review). Oncol. Lett. 2020, 20, 993–1000. [Google Scholar] [CrossRef]
- Wu, Q.-N.; Liao, Y.-F.; Lu, Y.-X.; Wang, Y.; Lu, J.-H.; Zeng, Z.-L.; Huang, Q.-T.; Sheng, H.; Yun, J.-P.; Xie, D.; et al. Pharmacological Inhibition of DUSP6 Suppresses Gastric Cancer Growth and Metastasis and Overcomes Cisplatin Resistance. Cancer Lett. 2018, 412, 243–255. [Google Scholar] [CrossRef]
- Ramkissoon, A.; Chaney, K.E.; Milewski, D.; Williams, K.B.; Williams, R.L.; Choi, K.; Miller, A.; Kalin, T.V.; Pressey, J.G.; Szabo, S.; et al. Targeted Inhibition of the Dual Specificity Phosphatases DUSP1 and DUSP6 Suppress MPNST Growth via JNK. Clin. Cancer Res. 2019, 25, 4117–4127. [Google Scholar] [CrossRef] [PubMed]
- Shojaee, S.; Caeser, R.; Buchner, M.; Park, E.; Swaminathan, S.; Hurtz, C.; Geng, H.; Chan, L.N.; Klemm, L.; Hofmann, W.-K.; et al. Erk Negative Feedback Control Enables Pre-B Cell Transformation and Represents a Therapeutic Target in Acute Lymphoblastic Leukemia. Cancer Cell 2015, 28, 114–128. [Google Scholar] [CrossRef] [PubMed]
- Molina, G.; Vogt, A.; Bakan, A.; Dai, W.; De Oliveira, P.Q.; Znosko, W.; Smithgall, T.E.; Bahar, I.; Lazo, J.S.; Day, B.W.; et al. Zebrafish Chemical Screening Reveals an Inhibitor of Dusp6 That Expands Cardiac Cell Lineages. Nat. Chem. Biol. 2009, 5, 680–687. [Google Scholar] [CrossRef] [PubMed]
- Thompson, E.M.; Patel, V.; Rajeeve, V.; Cutillas, P.R.; Stoker, A.W. The Cytotoxic Action of BCI Is Not Dependent on Its Stated DUSP1 or DUSP6 Targets in Neuroblastoma Cells. FEBS Open Bio 2022, 12, 1388–1405. [Google Scholar] [CrossRef] [PubMed]
- van Engeland, M.; Nieland, L.J.W.; Ramaekers, F.C.S.; Schutte, B.; Reutelingsperger, C.P.M. Annexin V-Affinity Assay: A Review on an Apoptosis Detection System Based on Phosphatidylserine Exposure. Cytometry 1998, 31, 1–9. [Google Scholar] [CrossRef]
- Wlodkowic, D.; Skommer, J.; Darzynkiewicz, Z. Flow Cytometry-Based Apoptosis Detection. Methods Mol. Biol. 2009, 559, 19–32. [Google Scholar] [CrossRef]
- Di Veroli, G.Y.; Fornari, C.; Wang, D.; Mollard, S.; Bramhall, J.L.; Richards, F.M.; Jodrell, D.I. Combenefit: An Interactive Platform for the Analysis and Visualization of Drug Combinations. Bioinformatics 2016, 32, 2866–2868. [Google Scholar] [CrossRef]
- Pires, D.E.V.; Blundell, T.L.; Ascher, D.B. PkCSM: Predicting Small-Molecule Pharmacokinetic and Toxicity Properties Using Graph-Based Signatures. J. Med. Chem. 2015, 58, 4066–4072. [Google Scholar] [CrossRef]
- Daina, A.; Michielin, O.; Zoete, V. SwissADME: A Free Web Tool to Evaluate Pharmacokinetics, Drug-Likeness and Medicinal Chemistry Friendliness of Small Molecules. Sci. Rep. 2017, 7, 42717. [Google Scholar] [CrossRef]
- Zhang, F.; Tang, B.; Zhang, Z.; Xu, D.; Ma, G. DUSP6 Inhibitor (E/Z)-BCI Hydrochloride Attenuates Lipopolysaccharide-Induced Inflammatory Responses in Murine Macrophage Cells via Activating the Nrf2 Signaling Axis and Inhibiting the NF-ΚB Pathway. Inflammation 2019, 42, 672–681. [Google Scholar] [CrossRef]
- Ling, S.; Shi, P.; Liu, S.; Meng, X.; Zhou, Y.; Sun, W.; Chang, S.; Zhang, X.; Zhang, L.; Shi, C.; et al. Structural Mechanism of Cooperative Activation of the Human Calcium-Sensing Receptor by Ca2+ Ions and L-Tryptophan. Cell Res. 2021, 31, 383–394. [Google Scholar] [CrossRef] [PubMed]
- Boyles, J.S.; Beidler, C.B.; Strifler, B.A.; Girard, D.S.; Druzina, Z.; Durbin, J.D.; Swearingen, M.L.; Lee, L.N.; Kikly, K.; Chintharlapalli, S.; et al. Discovery and Characterization of a Neutralizing Pan-ELR+CXC Chemokine Monoclonal Antibody. MAbs 2020, 12, 1831880. [Google Scholar] [CrossRef] [PubMed]
- Mapelli, M.; Massimiliano, L.; Crovace, C.; Seeliger, M.A.; Tsai, L.-H.; Meijer, L.; Musacchio, A. Mechanism of CDK5/P25 Binding by CDK Inhibitors. J. Med. Chem. 2005, 48, 671–679. [Google Scholar] [CrossRef] [PubMed]
- Grädler, U.; Czodrowski, P.; Tsaklakidis, C.; Klein, M.; Werkmann, D.; Lindemann, S.; Maskos, K.; Leuthner, B. Structure-Based Optimization of Non-Peptidic Cathepsin D Inhibitors. Bioorg. Med. Chem. Lett. 2014, 24, 4141–4150. [Google Scholar] [CrossRef]
- Czapinska, H.; Winiewska-Szajewska, M.; Szymaniec-Rutkowska, A.; Piasecka, A.; Bochtler, M.; Poznański, J. Halogen Atoms in the Protein-Ligand System. Structural and Thermodynamic Studies of the Binding of Bromobenzotriazoles by the Catalytic Subunit of Human Protein Kinase CK2. J. Phys. Chem. B 2021, 125, 2491–2503. [Google Scholar] [CrossRef]
- Wood, D.J.; Korolchuk, S.; Tatum, N.J.; Wang, L.-Z.; Endicott, J.A.; Noble, M.E.M.; Martin, M.P. Differences in the Conformational Energy Landscape of CDK1 and CDK2 Suggest a Mechanism for Achieving Selective CDK Inhibition. Cell Chem. Biol. 2019, 26, 121–130.e5. [Google Scholar] [CrossRef]
- Xiao, P.; Yan, W.; Gou, L.; Zhong, Y.-N.; Kong, L.; Wu, C.; Wen, X.; Yuan, Y.; Cao, S.; Qu, C.; et al. Ligand Recognition and Allosteric Regulation of DRD1-Gs Signaling Complexes. Cell 2021, 184, 943–956.e18. [Google Scholar] [CrossRef]
- Wei, C.H.; Min, H.G.; Kim, M.; Kim, G.H.; Chun, H.-J.; Ryu, S.E. Two Intermediate States of the Conformational Switch in Dual Specificity Phosphatase 13a. Pharmacol. Res. 2018, 128, 211–219. [Google Scholar] [CrossRef]
- Lountos, G.T.; Tropea, J.E.; Cherry, S.; Waugh, D.S. Overproduction, Purification and Structure Determination of Human Dual-Specificity Phosphatase 14. Acta Crystallogr. D Biol. Crystallogr. 2009, 65, 1013–1020. [Google Scholar] [CrossRef]
- Jeong, D.G.; Cho, Y.H.; Yoon, T.S.; Kim, J.H.; Son, J.H.; Ryu, S.E.; Kim, S.J. Structure of Human DSP18, a Member of the Dual-Specificity Protein Tyrosine Phosphatase Family. Acta Crystallogr. D Biol. Crystallogr. 2006, 62, 582–588. [Google Scholar] [CrossRef]
- Farooq, A.; Plotnikova, O.; Chaturvedi, G.; Yan, S.; Zeng, L.; Zhang, Q.; Zhou, M.-M. Solution Structure of the MAPK Phosphatase PAC-1 Catalytic Domain. Insights into Substrate-Induced Enzymatic Activation of MKP. Structure 2003, 11, 155–164. [Google Scholar] [CrossRef] [PubMed]
- Ku, B.; Hong, W.; Keum, C.W.; Kim, M.; Ryu, H.; Jeon, D.; Shin, H.-C.; Kim, J.H.; Kim, S.J.; Ryu, S.E. Structural and Biochemical Analysis of Atypically Low Dephosphorylating Activity of Human Dual-Specificity Phosphatase 28. PLoS ONE 2017, 12, e0187701. [Google Scholar] [CrossRef] [PubMed]
- Jeong, D.G.; Cho, Y.H.; Yoon, T.-S.; Kim, J.H.; Ryu, S.E.; Kim, S.J. Crystal Structure of the Catalytic Domain of Human DUSP5, a Dual Specificity MAP Kinase Protein Phosphatase. Proteins 2007, 66, 253–258. [Google Scholar] [CrossRef] [PubMed]
- Farooq, A.; Chaturvedi, G.; Mujtaba, S.; Plotnikova, O.; Zeng, L.; Dhalluin, C.; Ashton, R.; Zhou, M.M. Solution Structure of ERK2 Binding Domain of MAPK Phosphatase MKP-3: Structural Insights into MKP-3 Activation by ERK2. Mol. Cell 2001, 7, 387–399. [Google Scholar] [CrossRef]
- Lountos, G.T.; Austin, B.P.; Tropea, J.E.; Waugh, D.S. Structure of Human Dual-Specificity Phosphatase 7, a Potential Cancer Drug Target. Acta Crystallogr. F Struct. Biol. Commun. 2015, 71, 650–656. [Google Scholar] [CrossRef]
- Jeong, D.G.; Wei, C.H.; Ku, B.; Jeon, T.J.; Chien, P.N.; Kim, J.K.; Park, S.Y.; Hwang, H.S.; Ryu, S.Y.; Park, H.; et al. The Family-Wide Structure and Function of Human Dual-Specificity Protein Phosphatases. Acta Crystallogr. D Biol. Crystallogr. 2014, 70, 421–435. [Google Scholar] [CrossRef]
- Xiao, P.-F.; Guo, R.; Huang, S.-Q.; Cui, H.-J.; Ye, S.; Zhang, Z. Discovery of Dipeptidyl Peptidase IV (DPP4) Inhibitors Based on a Novel Indole Scaffold. Chin. Chem. Lett. 2014, 25, 673–676. [Google Scholar] [CrossRef]
- Zhang, Y.; Sun, B.; Feng, D.; Hu, H.; Chu, M.; Qu, Q.; Tarrasch, J.T.; Li, S.; Sun Kobilka, T.; Kobilka, B.K.; et al. Cryo-EM Structure of the Activated GLP-1 Receptor in Complex with a G Protein. Nature 2017, 546, 248–253. [Google Scholar] [CrossRef]
- Fairlamb, M.S.; Whitaker, A.M.; Freudenthal, B.D. Apurinic/Apyrimidinic (AP) Endonuclease 1 Processing of AP Sites with 5’ Mismatches. Acta Crystallogr. D Struct. Biol. 2018, 74, 760–768. [Google Scholar] [CrossRef]
- Luo, S.; Xu, K.; Xiang, S.; Chen, J.; Chen, C.; Guo, C.; Tong, Y.; Tong, L. High-Resolution Structures of Inhibitor Complexes of Human Indoleamine 2,3-Dioxygenase 1 in a New Crystal Form. Acta Crystallogr. F Struct. Biol. Commun. 2018, 74, 717–724. [Google Scholar] [CrossRef]
- Wu, C.-C.; Li, T.-K.; Farh, L.; Lin, L.-Y.; Lin, T.-S.; Yu, Y.-J.; Yen, T.-J.; Chiang, C.-W.; Chan, N.-L. Structural Basis of Type II Topoisomerase Inhibition by the Anticancer Drug Etoposide. Science 2011, 333, 459–462. [Google Scholar] [CrossRef]
- Lennartz, F.; Adams, Y.; Bengtsson, A.; Olsen, R.W.; Turner, L.; Ndam, N.T.; Ecklu-Mensah, G.; Moussiliou, A.; Ofori, M.F.; Gamain, B.; et al. Structure-Guided Identification of a Family of Dual Receptor-Binding PfEMP1 That Is Associated with Cerebral Malaria. Cell Host Microbe 2017, 21, 403–414. [Google Scholar] [CrossRef]
- Soisson, S.M.; Patel, S.B.; Abeywickrema, P.D.; Byrne, N.J.; Diehl, R.E.; Hall, D.L.; Ford, R.E.; Reid, J.C.; Rickert, K.W.; Shipman, J.M.; et al. Structural Definition and Substrate Specificity of the S28 Protease Family: The Crystal Structure of Human Prolylcarboxypeptidase. BMC Struct. Biol. 2010, 10, 16. [Google Scholar] [CrossRef]
- Manglik, A.; Kruse, A.C.; Kobilka, T.S.; Thian, F.S.; Mathiesen, J.M.; Sunahara, R.K.; Pardo, L.; Weis, W.I.; Kobilka, B.K.; Granier, S. Crystal Structure of the Μ-Opioid Receptor Bound to a Morphinan Antagonist. Nature 2012, 485, 321–326. [Google Scholar] [CrossRef]
- Jensen, J.K.; Gettins, P.G.W. High-Resolution Structure of the Stable Plasminogen Activator Inhibitor Type-1 Variant 14-1B in Its Proteinase-Cleaved Form: A New Tool for Detailed Interaction Studies and Modeling. Protein Sci. 2008, 17, 1844–1849. [Google Scholar] [CrossRef] [PubMed]
- Li, R.; Martin, M.P.; Liu, Y.; Wang, B.; Patel, R.A.; Zhu, J.-Y.; Sun, N.; Pireddu, R.; Lawrence, N.J.; Li, J.; et al. Fragment-Based and Structure-Guided Discovery and Optimization of Rho Kinase Inhibitors. J. Med. Chem. 2012, 55, 2474–2478. [Google Scholar] [CrossRef] [PubMed]
- Hobson, A.D.; Judge, R.A.; Aguirre, A.L.; Brown, B.S.; Cui, Y.; Ding, P.; Dominguez, E.; DiGiammarino, E.; Egan, D.A.; Freiberg, G.M.; et al. Identification of Selective Dual ROCK1 and ROCK2 Inhibitors Using Structure-Based Drug Design. J. Med. Chem. 2018, 61, 11074–11100. [Google Scholar] [CrossRef]
- Tan, Y.; Xu, P.; Huang, S.; Yang, G.; Zhou, F.; He, X.; Ma, H.; Xu, H.E.; Jiang, Y. Structural Insights into the Ligand Binding and Gi Coupling of Serotonin Receptor 5-HT5A. Cell Discov. 2022, 8, 50. [Google Scholar] [CrossRef] [PubMed]
- Bai, L.; Zhou, H.; Xu, R.; Zhao, Y.; Chinnaswamy, K.; McEachern, D.; Chen, J.; Yang, C.-Y.; Liu, Z.; Wang, M.; et al. A Potent and Selective Small-Molecule Degrader of STAT3 Achieves Complete Tumor Regression In Vivo. Cancer Cell 2019, 36, 498–511.e17. [Google Scholar] [CrossRef]
- Zhao, W.; Han, S.; Qiu, N.; Feng, W.; Lu, M.; Zhang, W.; Wang, M.; Zhou, Q.; Chen, S.; Xu, W.; et al. Structural Insights into Ligand Recognition and Selectivity of Somatostatin Receptors. Cell Res. 2022, 32, 761–772. [Google Scholar] [CrossRef]
- Palmer, W.S.; Poncet-Montange, G.; Liu, G.; Petrocchi, A.; Reyna, N.; Subramanian, G.; Theroff, J.; Yau, A.; Kost-Alimova, M.; Bardenhagen, J.P.; et al. Structure-Guided Design of IACS-9571, a Selective High-Affinity Dual TRIM24-BRPF1 Bromodomain Inhibitor. J. Med. Chem. 2016, 59, 1440–1454. [Google Scholar] [CrossRef] [PubMed]
- Fensome, A.; Ambler, C.M.; Arnold, E.; Banker, M.E.; Brown, M.F.; Chrencik, J.; Clark, J.D.; Dowty, M.E.; Efremov, I.V.; Flick, A.; et al. Dual Inhibition of TYK2 and JAK1 for the Treatment of Autoimmune Diseases: Discovery of ((S)-2,2-Difluorocyclopropyl)((1 R,5 S)-3-(2-((1-Methyl-1 H-Pyrazol-4-Yl)Amino)Pyrimidin-4-Yl)-3,8-Diazabicyclo[3.2.1]Octan-8-Yl)Methanone (PF-06700841). J. Med. Chem. 2018, 61, 8597–8612. [Google Scholar] [CrossRef] [PubMed]
- Su, Q.; Ioannidis, S.; Chuaqui, C.; Almeida, L.; Alimzhanov, M.; Bebernitz, G.; Bell, K.; Block, M.; Howard, T.; Huang, S.; et al. Discovery of 1-Methyl-1H-Imidazole Derivatives as Potent Jak2 Inhibitors. J. Med. Chem. 2014, 57, 144–158. [Google Scholar] [CrossRef] [PubMed]
- Soth, M.; Hermann, J.C.; Yee, C.; Alam, M.; Barnett, J.W.; Berry, P.; Browner, M.F.; Frank, K.; Frauchiger, S.; Harris, S.; et al. 3-Amido Pyrrolopyrazine JAK Kinase Inhibitors: Development of a JAK3 vs JAK1 Selective Inhibitor and Evaluation in Cellular and in Vivo Models. J. Med. Chem. 2013, 56, 345–356. [Google Scholar] [CrossRef] [PubMed]
- Mujwar, S. Computational Repurposing of Tamibarotene against Triple Mutant Variant of SARS-CoV-2. Comput. Biol. Med. 2021, 136, 104748. [Google Scholar] [CrossRef]
- Mujwar, S.; Deshmukh, R.; Harwansh, R.K.; Gupta, J.K.; Gour, A. Drug Repurposing Approach for Developing Novel Therapy Against Mupirocin-Resistant Staphylococcus Aureus. Assay Drug Dev. Technol. 2019, 17, 298–309. [Google Scholar] [CrossRef]
- Gombar, V.K.; Silver, I.S.; Zhao, Z. Role of ADME Characteristics in Drug Discovery and Their in Silico Evaluation: In Silico Screening of Chemicals for Their Metabolic Stability. Curr. Top. Med. Chem. 2003, 3, 1205–1225. [Google Scholar] [CrossRef]
- Mukhtar, M.; Bilal, M.; Rahdar, A.; Barani, M.; Arshad, R.; Behl, T.; Brisc, C.; Banica, F.; Bungau, S. Nanomaterials for Diagnosis and Treatment of Brain Cancer: Recent Updates. Chemosensors 2020, 8, 117. [Google Scholar] [CrossRef]
- Lang, D.K.; Kaur, R.; Arora, R.; Saini, B.; Arora, S. Nitrogen-Containing Heterocycles as Anticancer Agents: An Overview. Anticancer Agents Med. Chem. 2020, 20, 2150–2168. [Google Scholar] [CrossRef]
- Giménez, B.G.; Santos, M.S.; Ferrarini, M.; Fernandes, J.P.S. Evaluation of Blockbuster Drugs under the Rule-of-Five. Pharmazie 2010, 65, 148–152. [Google Scholar]
- Zhao, M.; Ma, J.; Li, M.; Zhang, Y.; Jiang, B.; Zhao, X.; Huai, C.; Shen, L.; Zhang, N.; He, L.; et al. Cytochrome P450 Enzymes and Drug Metabolism in Humans. Int. J. Mol. Sci. 2021, 22, 12808. [Google Scholar] [CrossRef] [PubMed]
- Martin, Y.C. A Bioavailability Score. J. Med. Chem. 2005, 48, 3164–3170. [Google Scholar] [CrossRef]
- Bernacki, J.; Dobrowolska, A.; Nierwińska, K.; Małecki, A. Physiology and Pharmacological Role of the Blood-Brain Barrier. Pharmacol. Rep. 2008, 60, 600–622. [Google Scholar] [PubMed]
- Raub, T.J. P-Glycoprotein Recognition of Substrates and Circumvention through Rational Drug Design. Mol. Pharm. 2006, 3, 3–25. [Google Scholar] [CrossRef] [PubMed]
- Vijay, U.; Gupta, S.; Mathur, P.; Suravajhala, P.; Bhatnagar, P. Microbial Mutagenicity Assay: Ames Test. Bio-protocol 2018, 8, e2763. [Google Scholar] [CrossRef]
- Lee, H.-M.; Yu, M.-S.; Kazmi, S.R.; Oh, S.Y.; Rhee, K.-H.; Bae, M.-A.; Lee, B.H.; Shin, D.-S.; Oh, K.-S.; Ceong, H.; et al. Computational Determination of HERG-Related Cardiotoxicity of Drug Candidates. BMC Bioinform. 2019, 20, 250. [Google Scholar] [CrossRef]
- Ballet, F. Hepatotoxicity in Drug Development: Detection, Significance and Solutions. J. Hepatol. 1997, 26 (Suppl. 2), 26–36. [Google Scholar] [CrossRef]
- Agoni, C.; Olotu, F.A.; Ramharack, P.; Soliman, M.E. Druggability and Drug-Likeness Concepts in Drug Design: Are Biomodelling and Predictive Tools Having Their Say? J. Mol. Model. 2020, 26, 120. [Google Scholar] [CrossRef]
- Kaplowitz, N. Drug-Induced Liver Injury. Clin. Infect. Dis. 2004, 38 (Suppl. 2), S44–S48. [Google Scholar] [CrossRef]
- Ikiz, B.; Przedborski, S. A Sequel to the Tale of P25/Cdk5 in Neurodegeneration. Neuron 2008, 60, 731–732. [Google Scholar] [CrossRef]
- Tang, J.; Ip, J.P.K.; Ye, T.; Ng, Y.-P.; Yung, W.-H.; Wu, Z.; Fang, W.; Fu, A.K.Y.; Ip, N.Y. Cdk5-Dependent Mst3 Phosphorylation and Activity Regulate Neuronal Migration through RhoA Inhibition. J. Neurosci. 2014, 34, 7425–7436. [Google Scholar] [CrossRef] [PubMed]
- Do, P.A.; Lee, C.H. The Role of CDK5 in Tumours and Tumour Microenvironments. Cancers 2020, 13, 101. [Google Scholar] [CrossRef] [PubMed]
- Pozo, K.; Bibb, J.A. The Emerging Role of Cdk5 in Cancer. Trends Cancer 2016, 2, 606–618. [Google Scholar] [CrossRef]
- Liu, W.; Li, J.; Song, Y.-S.; Li, Y.; Jia, Y.-H.; Zhao, H.-D. Cdk5 Links with DNA Damage Response and Cancer. Mol. Cancer 2017, 16, 60. [Google Scholar] [CrossRef]
- James, N.E.; Beffa, L.; Oliver, M.T.; Borgstadt, A.D.; Emerson, J.B.; Chichester, C.O.; Yano, N.; Freiman, R.N.; DiSilvestro, P.A.; Ribeiro, J.R. Inhibition of DUSP6 Sensitizes Ovarian Cancer Cells to Chemotherapeutic Agents via Regulation of ERK Signaling Response Genes. Oncotarget 2019, 10, 3315–3327. [Google Scholar] [CrossRef] [PubMed]
- Shin, J.-W.; Kwon, S.-B.; Bak, Y.; Lee, S.-K.; Yoon, D.-Y. BCI Induces Apoptosis via Generation of Reactive Oxygen Species and Activation of Intrinsic Mitochondrial Pathway in H1299 Lung Cancer Cells. Sci. China Life Sci. 2018, 61, 1243–1253. [Google Scholar] [CrossRef]
- Bagnyukova, T.V.; Restifo, D.; Beeharry, N.; Gabitova, L.; Li, T.; Serebriiskii, I.G.; Golemis, E.A.; Astsaturov, I. DUSP6 Regulates Drug Sensitivity by Modulating DNA Damage Response. Br. J. Cancer 2013, 109, 1063–1071. [Google Scholar] [CrossRef]
- He, Y.; Su, J.; Lan, B.; Gao, Y.; Zhao, J. Targeting Off-Target Effects: Endoplasmic Reticulum Stress and Autophagy as Effective Strategies to Enhance Temozolomide Treatment. Onco Targets Ther. 2019, 12, 1857–1865. [Google Scholar] [CrossRef]
- Gao, Y.; Li, H.; Han, Q.; Li, Y.; Wang, T.; Huang, C.; Mao, Y.; Wang, X.; Zhang, Q.; Tian, J.; et al. Overexpression of DUSP6 Enhances Chemotherapy-Resistance of Ovarian Epithelial Cancer by Regulating the ERK Signaling Pathway. J. Cancer 2020, 11, 3151–3164. [Google Scholar] [CrossRef]
- Degl’Innocenti, D.; Romeo, P.; Tarantino, E.; Sensi, M.; Cassinelli, G.; Catalano, V.; Lanzi, C.; Perrone, F.; Pilotti, S.; Seregni, E.; et al. DUSP6/MKP3 Is Overexpressed in Papillary and Poorly Differentiated Thyroid Carcinoma and Contributes to Neoplastic Properties of Thyroid Cancer Cells. Endocr.-Relat. Cancer 2013, 20, 23–37. [Google Scholar] [CrossRef]
- Chen, H.-Y.; Yu, S.-L.; Chen, C.-H.; Chang, G.-C.; Chen, C.-Y.; Yuan, A.; Cheng, C.-L.; Wang, C.-H.; Terng, H.-J.; Kao, S.-F.; et al. A Five-Gene Signature and Clinical Outcome in Non–Small-Cell Lung Cancer. N. Engl. J. Med. 2007, 356, 11–20. [Google Scholar] [CrossRef] [PubMed]
- Messina, S.; Frati, L.; Leonetti, C.; Zuchegna, C.; Di Zazzo, E.; Calogero, A.; Porcellini, A. Dual-Specificity Phosphatase DUSP6 Has Tumor-Promoting Properties in Human Glioblastomas. Oncogene 2011, 30, 3813–3820. [Google Scholar] [CrossRef] [PubMed]


| Method | Time of Exposure | Cell Density per Well | ||
|---|---|---|---|---|
| DLD1 | HT-29 | Caco-2 | ||
| MTT test | 24 h | 10 × 103 | 10 × 103 | 15 × 103 |
| 72 h | 7 × 10³ | 8 × 10³ | 10 × 103 | |
| Caspase 3/7 activity assay | 6 h | 12 × 103 | 12 × 103 | 15 × 103 |
| 24 h | 10 × 103 | 10 × 103 | 12 × 103 | |
| Cell cycle analysis | 24 h | 4 × 10⁵ | 5 × 10⁵ | |
| Synergism/antagonism test | 72 h | 7 × 10³ | ||
| Flow cytometry analysis of apoptosis | 24 h | 4 × 10⁵ | ||
| Drug Target | PDB Code | x-D | y-D | z-D | Spacing (Ả) | x Center | y Center | z Center |
|---|---|---|---|---|---|---|---|---|
| SwissTargetPrediction | ||||||||
| CASR | 7dtt | 78 | 74 | 126 | 1.000 | 175.726 | 158.479 | 202.05 |
| CXCR3 | 6wzk | 60 | 50 | 54 | 0.686 | −22.132 | −30.934 | −32.037 |
| DPP4 | 4pv7 | 50 | 50 | 50 | 0.369 | −11.459 | 41.742 | 30.011 |
| DRD1 | 7ckx | 50 | 50 | 50 | 0.369 | 22.539 | 15.715 | 10.049 |
| HTR5A | 7x5h | 40 | 40 | 40 | 0.442 | 109.625 | 133.559 | 116.471 |
| ICAM1 | 5mza | 40 | 40 | 40 | 0.442 | 5.639 | 1.976 | −10.441 |
| JAK1 | 6dbn | 50 | 50 | 50 | 0.369 | 10.945 | 15.005 | −14.57 |
| JAK2 | 4c61 | 50 | 50 | 50 | 0.369 | 14.63 | 4.295 | 41.478 |
| JAK3 | 4hvd | 50 | 50 | 50 | 0.369 | 0.939 | −15.305 | −5.343 |
| OPRM1 | 4dkl | 50 | 50 | 50 | 0.369 | −28.235 | −13.287 | −10.858 |
| PRCP | 3n2z | 80 | 84 | 96 | 0.686 | 51.603 | 32.164 | 72.575 |
| ROCK1 | 3v8s | 50 | 50 | 50 | 0.369 | −45.387 | 2.145 | 30.618 |
| ROCK2 | 6ed6 | 50 | 50 | 50 | 0.369 | 27.148 | 47.046 | 53.015 |
| SSTR3 | 7xms | 108 | 100 | 96 | 1.000 | 119.725 | 146.465 | 111.596 |
| TYK2 | 6dbm | 50 | 50 | 50 | 0.369 | 6.261 | −7.855 | 15.059 |
| SuperPred | ||||||||
| APE1 | 6bow | 66 | 66 | 66 | 0.731 | 9.292 | −30.6630 | −0.237 |
| CDK1 | 6gu2 | 40 | 40 | 40 | 0.397 | 328.609 | 213.901 | 192.316 |
| CDK5 | 1unl | 44 | 44 | 44 | 0.408 | 59.89 | 28.364 | 27.584 |
| CK2A1 | 6tls | 44 | 44 | 44 | 0.403 | 77.273 | 7.948 | 21.258 |
| CPSD | 4od9 | 44 | 44 | 44 | 0.408 | −3.204 | 12.697 | −34.841 |
| GLP-1R | 5va1 | 100 | 82 | 108 | 1.000 | 93.575 | 57.237 | 60.469 |
| IDO1 | 6e43 | 44 | 44 | 44 | 0.408 | 73.757 | 21.18 | 45.094 |
| PAI-1 | 3cvm | 88 | 84 | 98 | 0.631 | 13.584 | 22.736 | 17.343 |
| STAT3 | 6nuq | 44 | 60 | 44 | 0.403 | 13.619 | 54.024 | −0.083 |
| TOP2β | 3qx3 | 40 | 40 | 40 | 0.553 | 32.884 | 95.413 | 50.785 |
| TRIM24 | 4ybm | 44 | 44 | 44 | 0.347 | 36.4360 | −18.263 | −32.015 |
| DUSP enzymes | ||||||||
| DUSP2 | 1m3g | 84 | 64 | 66 | 0.558 | 0.073 | −0.088 | −3.577 |
| DUSP5 | 2g6z | 76 | 78 | 68 | 0.558 | 27.828 | 100.283 | 28.026 |
| DUSP6 | 1hzm | 76 | 78 | 68 | 0.558 | −0.49 | 0.023 | 0.053 |
| DUSP7 | 4y2e | 68 | 78 | 58 | 0.558 | 4.361 | −1.089 | 3.86 |
| DUSP8 | 4jmk | 76 | 78 | 68 | 0.558 | 1.465 | −5.469 | 11.323 |
| DUSP13 | 5xjv | 68 | 68 | 84 | 0.558 | 6.74 | 0.204 | 2.883 |
| DUSP14 | 2wgp | 68 | 76 | 82 | 0.558 | −32.522 | −24.129 | 1.42 |
| DUSP18 | 2esb | 50 | 50 | 50 | 0.353 | 22.401 | 31.495 | 13.982 |
| DUSP28 | 5y15 | 68 | 78 | 68 | 0.558 | −36.53 | 22.242 | 0.797 |
| Cytotoxicity IC50 [µM] (±SD) | |||
|---|---|---|---|
| BCI | Irinotecan | Oxaliplatin | KU60019 |
| 1.21 (±0.07) | 6.52 (±1.38) | 4.6 (±0.68) | 6.53 (±1.2) |
| Compound | Molecular Weight | Hydrogen Bond Acceptors | Hydrogen Bond Donors | Consensus Log P Value | Druglikeness (Lipinski, Ghose, Veber, Egan Rules) |
|---|---|---|---|---|---|
| BCI | 353.89 g/mol | 2 | 1 | 4.25 | Yes, 0 violations |
| Compound/Property | Gastrointestinal (GI) Absorption (SwissADME/pkCSM) | CYP1A2 Inhibitor (SwissADME/pkCSM) | CYP2C19 Inhibitor (SwissADME/pkCSM) | CYP2C9 Inhibitor (SwissADME/pkCSM) | CYP2D6 Inhibitor (SwissADME/pkCSM) | CYP3A4 Inhibitor (SwissADME/pkCSM) | Blood Brain Barrier (BBB) Permeability (SwissADME) | P-Glycoprotein Substrate (SwissADME/pkCSM) | Ames Toxicity (pkCSM) | Cardiotoxicity (hERG Inhibition) (PreADMET) | Hepatotoxicity (pkCSM) |
|---|---|---|---|---|---|---|---|---|---|---|---|
| BCI | High (94.7% absorbed) | No/Yes | Yes/No | Yes/No | Yes/Yes | Yes/No | Yes | Yes/Yes | No | Medium risk | Yes |
| Target | PDB ID | Binding Energy Native | Binding Energy BCI |
|---|---|---|---|
| SwissTargetPrediction | |||
| CASR | 7dtt | - | −6.57 |
| CXCR3 | 6wzk | - | −6.43 |
| DPP4 | 4pv7 | −7.62 | −8.4 |
| DRD1 | 7ckx | −8.8 | −8.83 |
| HTR5A | 7x5h | −5.66 | −9.26 |
| ICAM1 | 5mza | −10.18 | −5.28 |
| JAK1 | 6dbn | −8.49 | −8.71 |
| JAK2 | 4c61 | −7.64 | −8.65 |
| JAK3 | 4hvd | −6.93 | −8.86 |
| OPRM1 | 4dkl | −7.8 | −8.72 |
| PRCP | 3n2z | - | −7.72 |
| ROCK1 | 3v8s | −8.22 | −9.08 |
| ROCK2 | 6ed6 | −10.74 | −8.85 |
| SSTR3 | 7xms | - | −7.55 |
| TYK2 | 6dbm | −8.94 | −8.62 |
| SuperPred | |||
| APE1 | 6bow | - | −5.98 |
| CDK1 | 6gu2 | −10.2 | −8.23 |
| CDK5 | 1unl | −7.19 | −9.17 |
| CK2A1 | 6tls | −6.28 | −9.26 |
| CPSD | 4od9 | −9.94 | −8.36 |
| GLP-1R | 5va1 | - | −5.01 |
| IDO1 | 6e43 | −14.25 | −9.15 |
| PAI-1 | 3cvm | - | −6.85 |
| STAT3 | 6nuq | −9.16 | −6.25 |
| TOP2β | 3qx3 | −9.98 | −6.82 |
| TRIM24 | 4ybm | −5.98 | −8.66 |
| DUSP enzymes | |||
| DUSP2 | 1m3g | −7.64 | |
| DUSP5 | 2g6z | −6.28 | |
| DUSP6 | 1hzm | −7.47 | |
| DUSP7 | 4y2e | −6.68 | |
| DUSP8 | 4jmk | −6.3 | |
| DUSP13 | 5xjv | −6.75 | |
| DUSP14 | 2wgp | −5.89 | |
| DUSP18 | 2esb | −6.46 | −6.03 |
| DUSP28 | 5y15 | −6.03 | |
| S. No. | Complex Details | ΔGcoulomb a | ΔGvdw b | ΔGcovalent c | ΔGsolv d | ΔGsolvlipo e | ΔGbind f |
|---|---|---|---|---|---|---|---|
| 1. | CDK5_BCI | −4.15 | −46.85 | 2.26 | 16.56 | −24.09 | −57.4 |
| 2. | TRIM24_BCI | −9.18 | −39.13 | 5.09 | 15.32 | −28.09 | −59.23 |
| 3. | CK2_BCI | 0.06 | −28.9 | 1.01 | 18.92 | −12.23 | −22.62 |
Disclaimer/Publisher’s Note: The statements, opinions and data contained in all publications are solely those of the individual author(s) and contributor(s) and not of MDPI and/or the editor(s). MDPI and/or the editor(s) disclaim responsibility for any injury to people or property resulting from any ideas, methods, instructions or products referred to in the content. |
© 2023 by the authors. Licensee MDPI, Basel, Switzerland. This article is an open access article distributed under the terms and conditions of the Creative Commons Attribution (CC BY) license (https://creativecommons.org/licenses/by/4.0/).
Share and Cite
Marciniak, B.; Kciuk, M.; Mujwar, S.; Sundaraj, R.; Bukowski, K.; Gruszka, R. In Vitro and In Silico Investigation of BCI Anticancer Properties and Its Potential for Chemotherapy-Combined Treatments. Cancers 2023, 15, 4442. https://doi.org/10.3390/cancers15184442
Marciniak B, Kciuk M, Mujwar S, Sundaraj R, Bukowski K, Gruszka R. In Vitro and In Silico Investigation of BCI Anticancer Properties and Its Potential for Chemotherapy-Combined Treatments. Cancers. 2023; 15(18):4442. https://doi.org/10.3390/cancers15184442
Chicago/Turabian StyleMarciniak, Beata, Mateusz Kciuk, Somdutt Mujwar, Rajamanikandan Sundaraj, Karol Bukowski, and Renata Gruszka. 2023. "In Vitro and In Silico Investigation of BCI Anticancer Properties and Its Potential for Chemotherapy-Combined Treatments" Cancers 15, no. 18: 4442. https://doi.org/10.3390/cancers15184442