
The Absolute Monocyte Count at Diagnosis Affects Prognosis in Myelodysplastic Syndromes Independently of the IPSS-R Risk Score
 , , , and
Abstract
:Simple Summary
Abstract
1. Introduction
2. Material and Methods
3. Results
3.1. Study Population
3.2. Absolute Monocyte Counts in the Study Population, Influence of Sex and Age
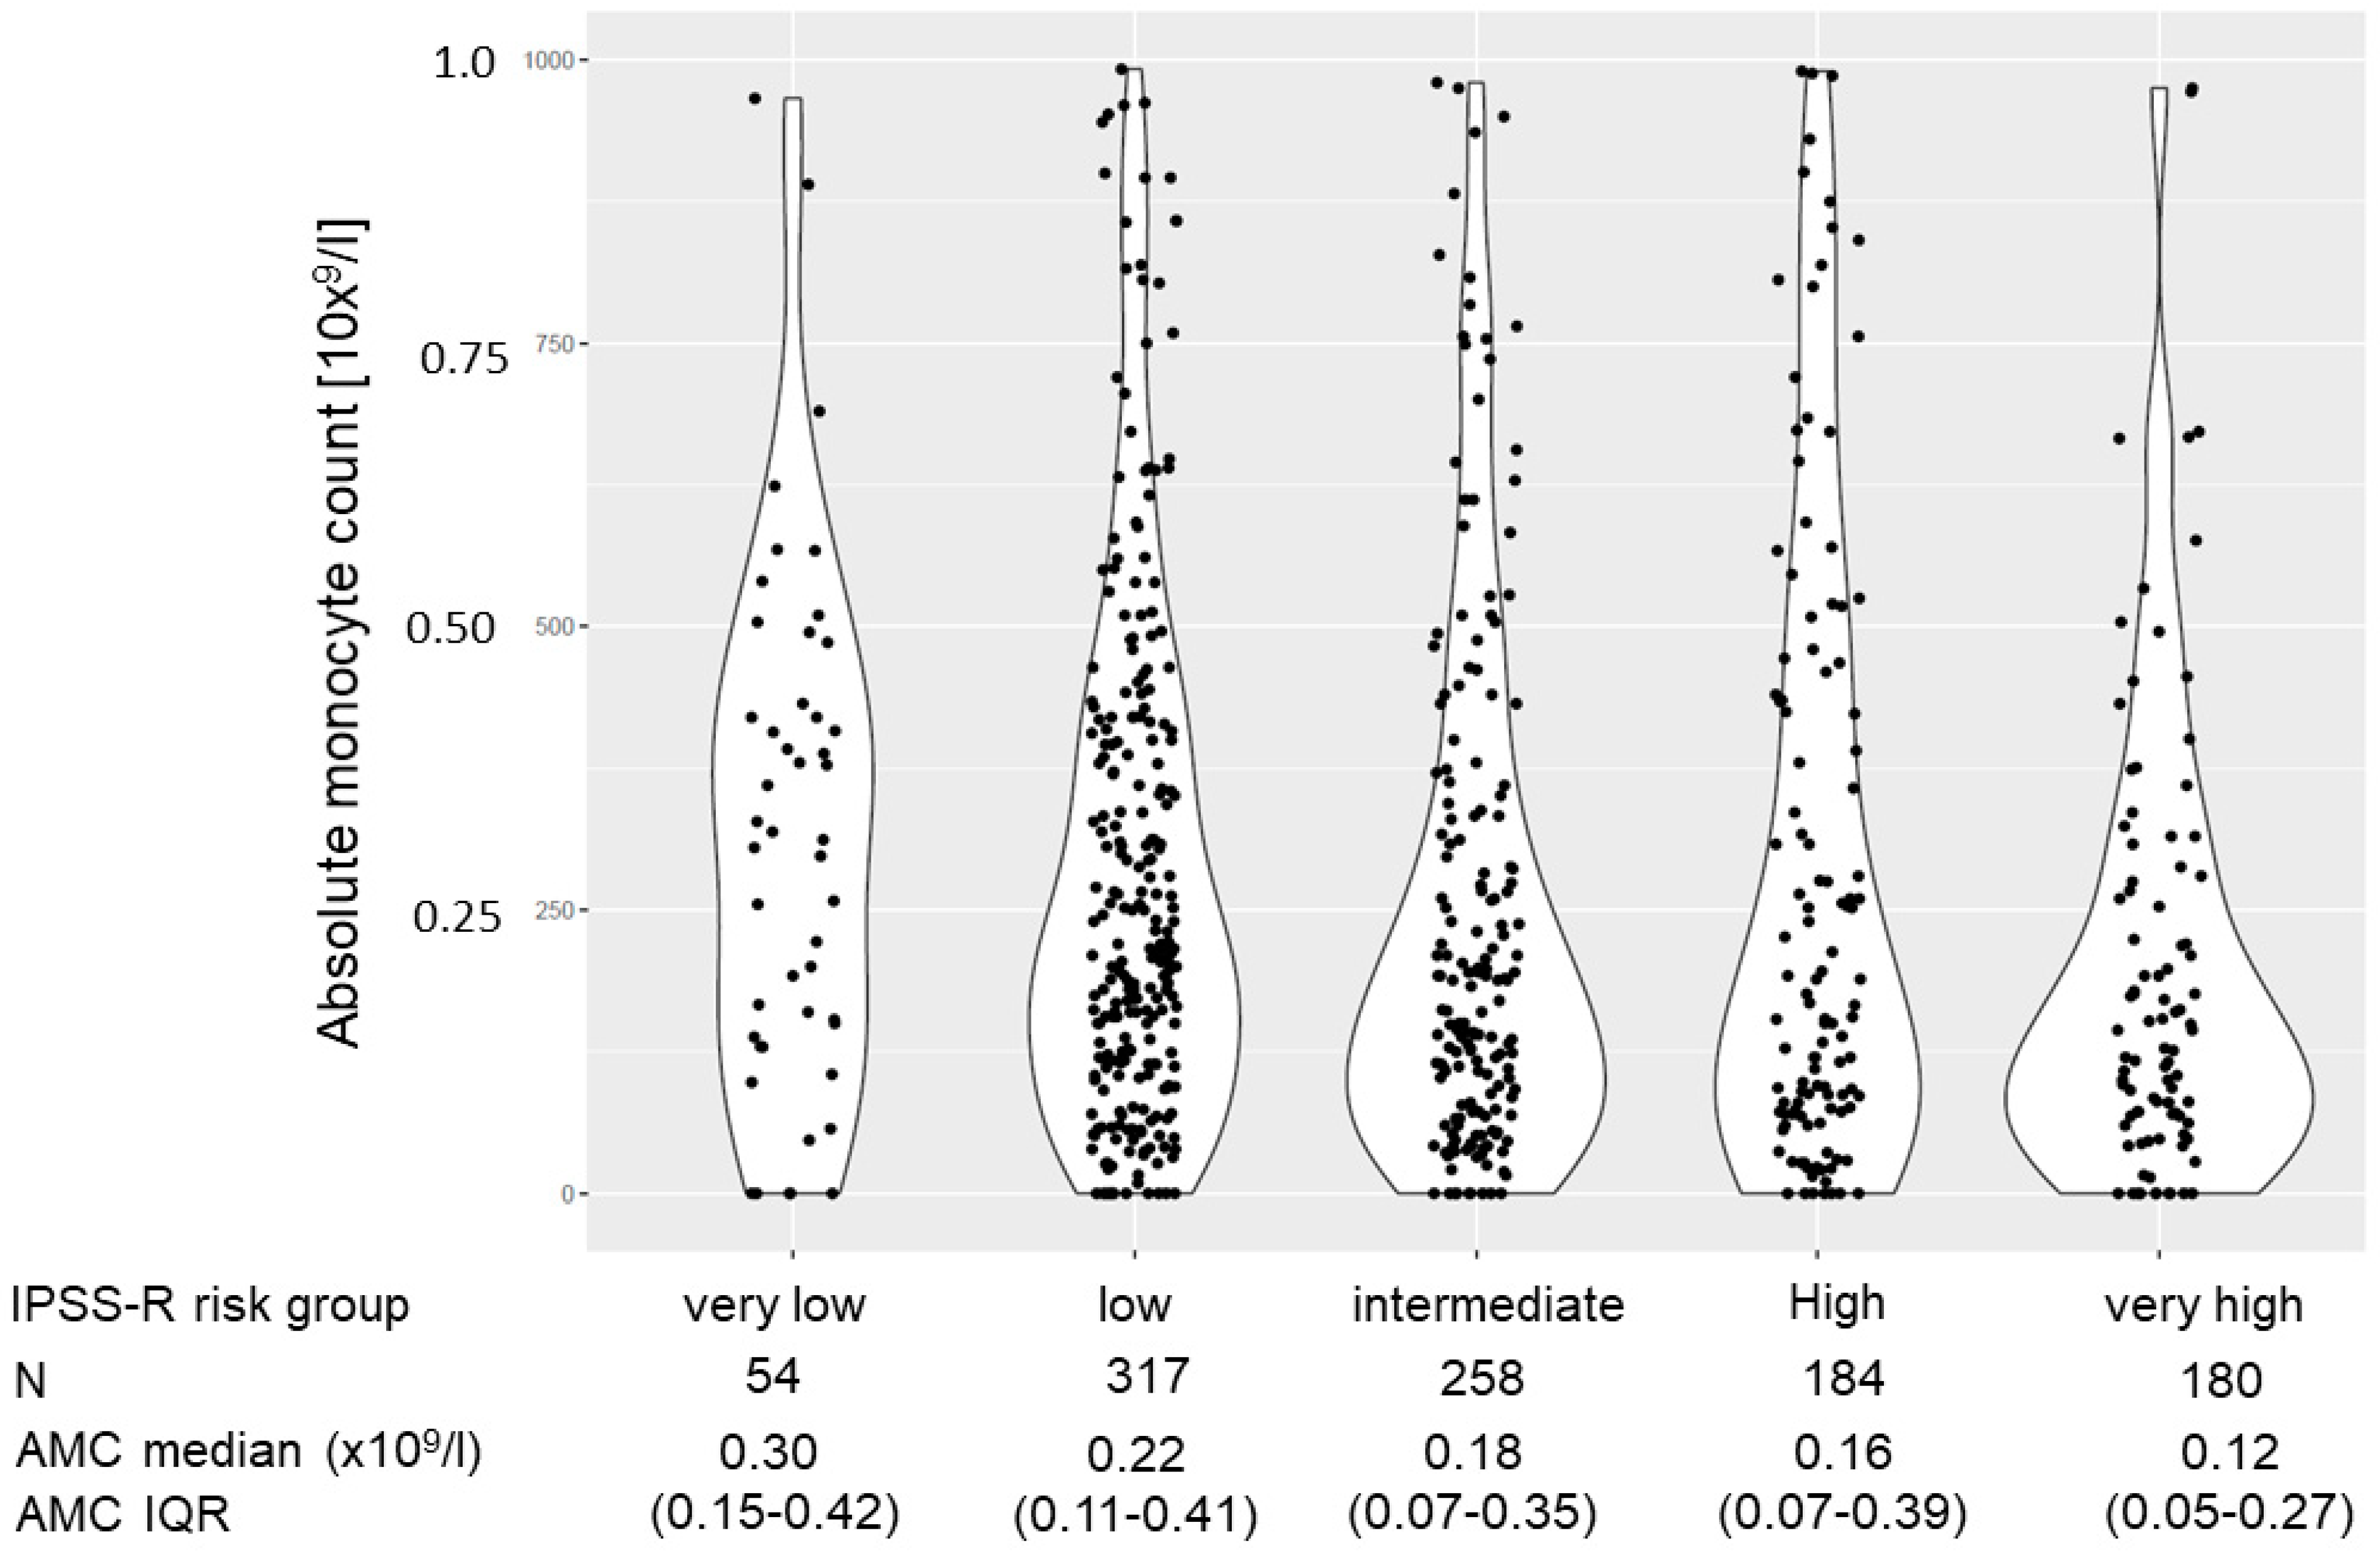
3.3. Monocyte Counts in Different MDS Subgroups
3.4. Association of the Absolute Monocyte Count with Peripheral Blood Values and Other Disease Characteristics
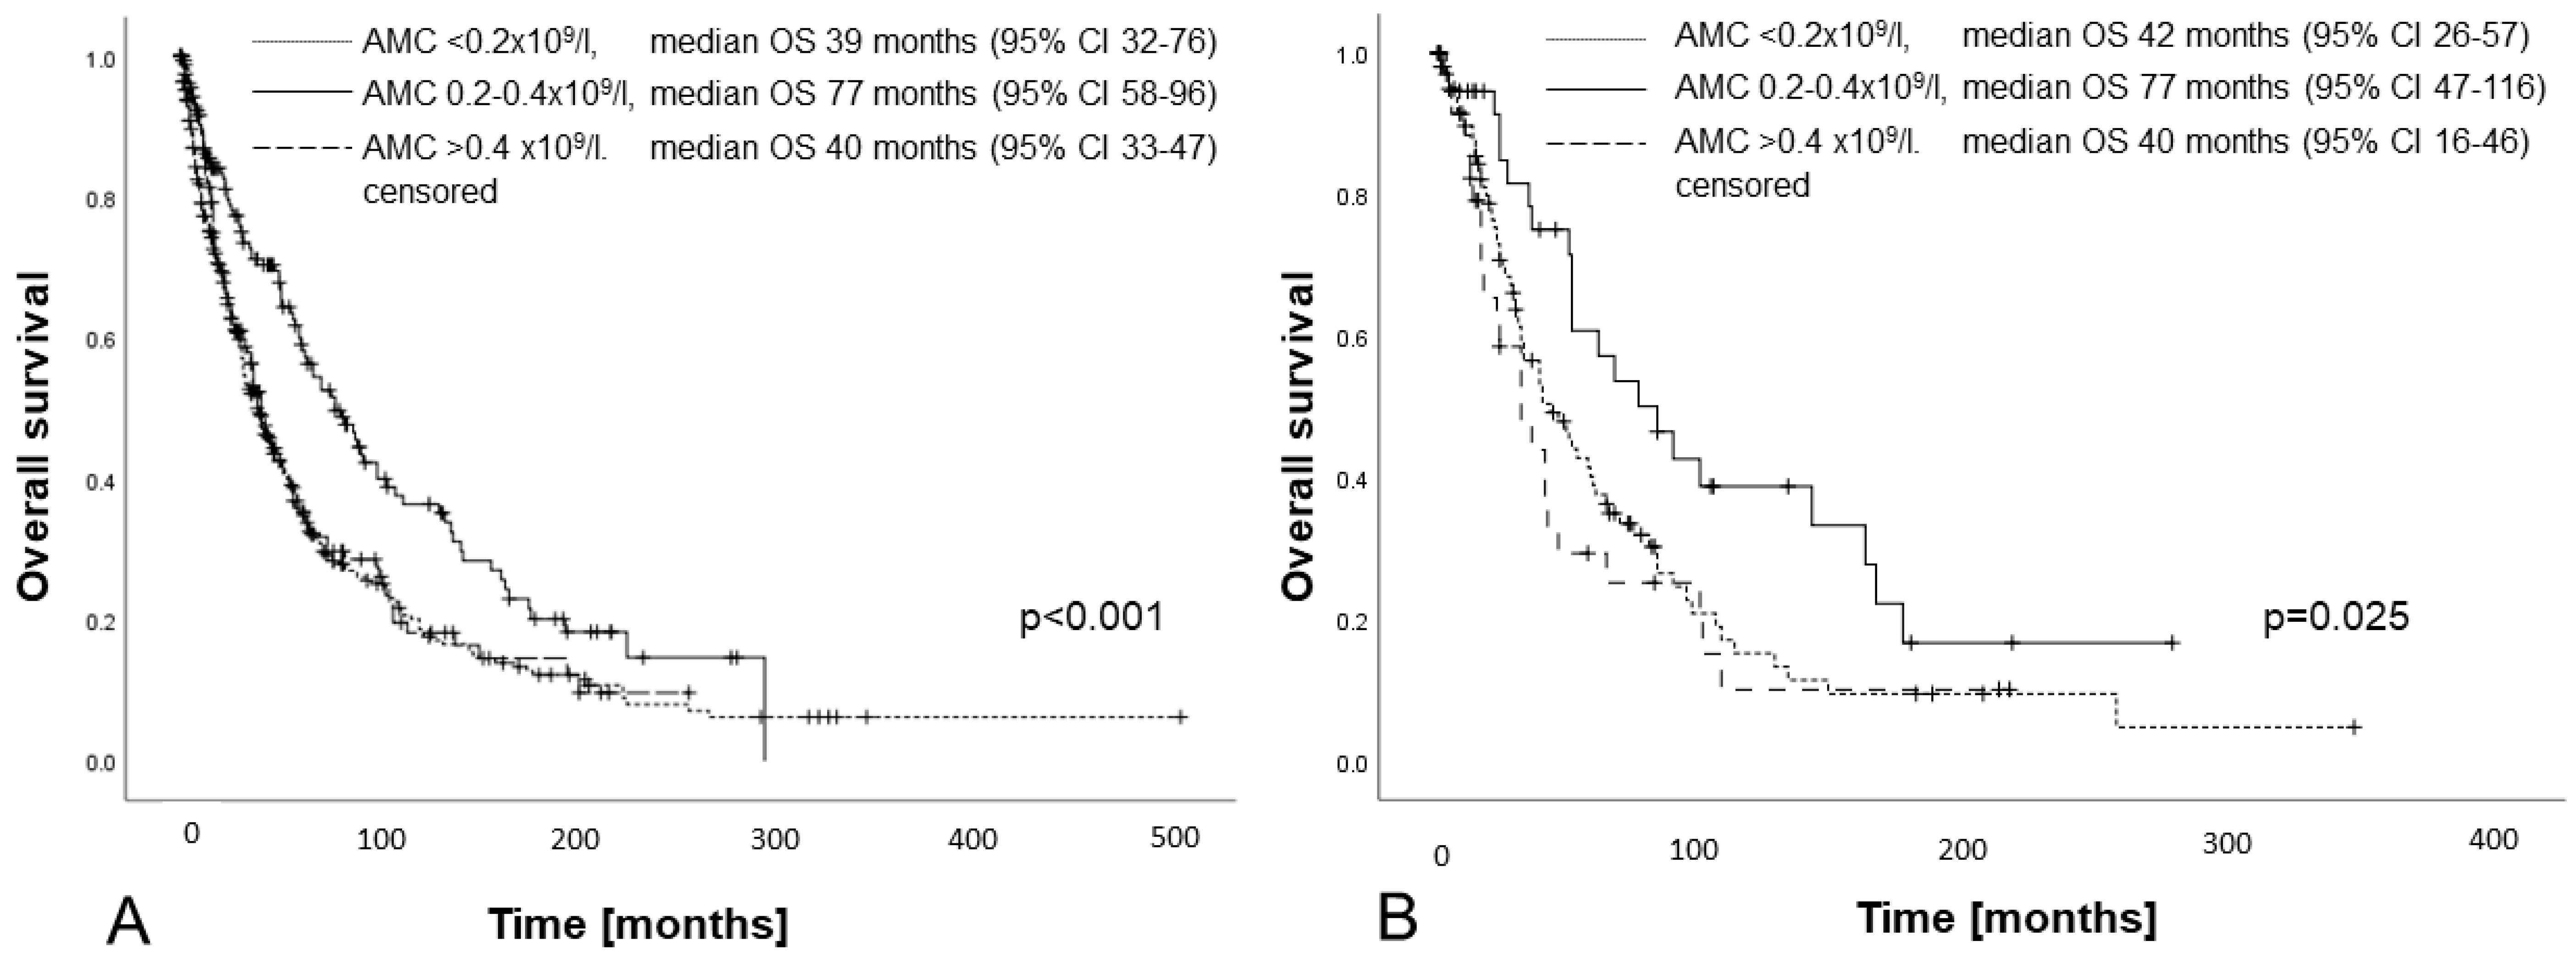
3.5. Impact of Monocyte Count on Overall Survival
3.5.1. Monocyte Count Divided According to Quartiles of the Population
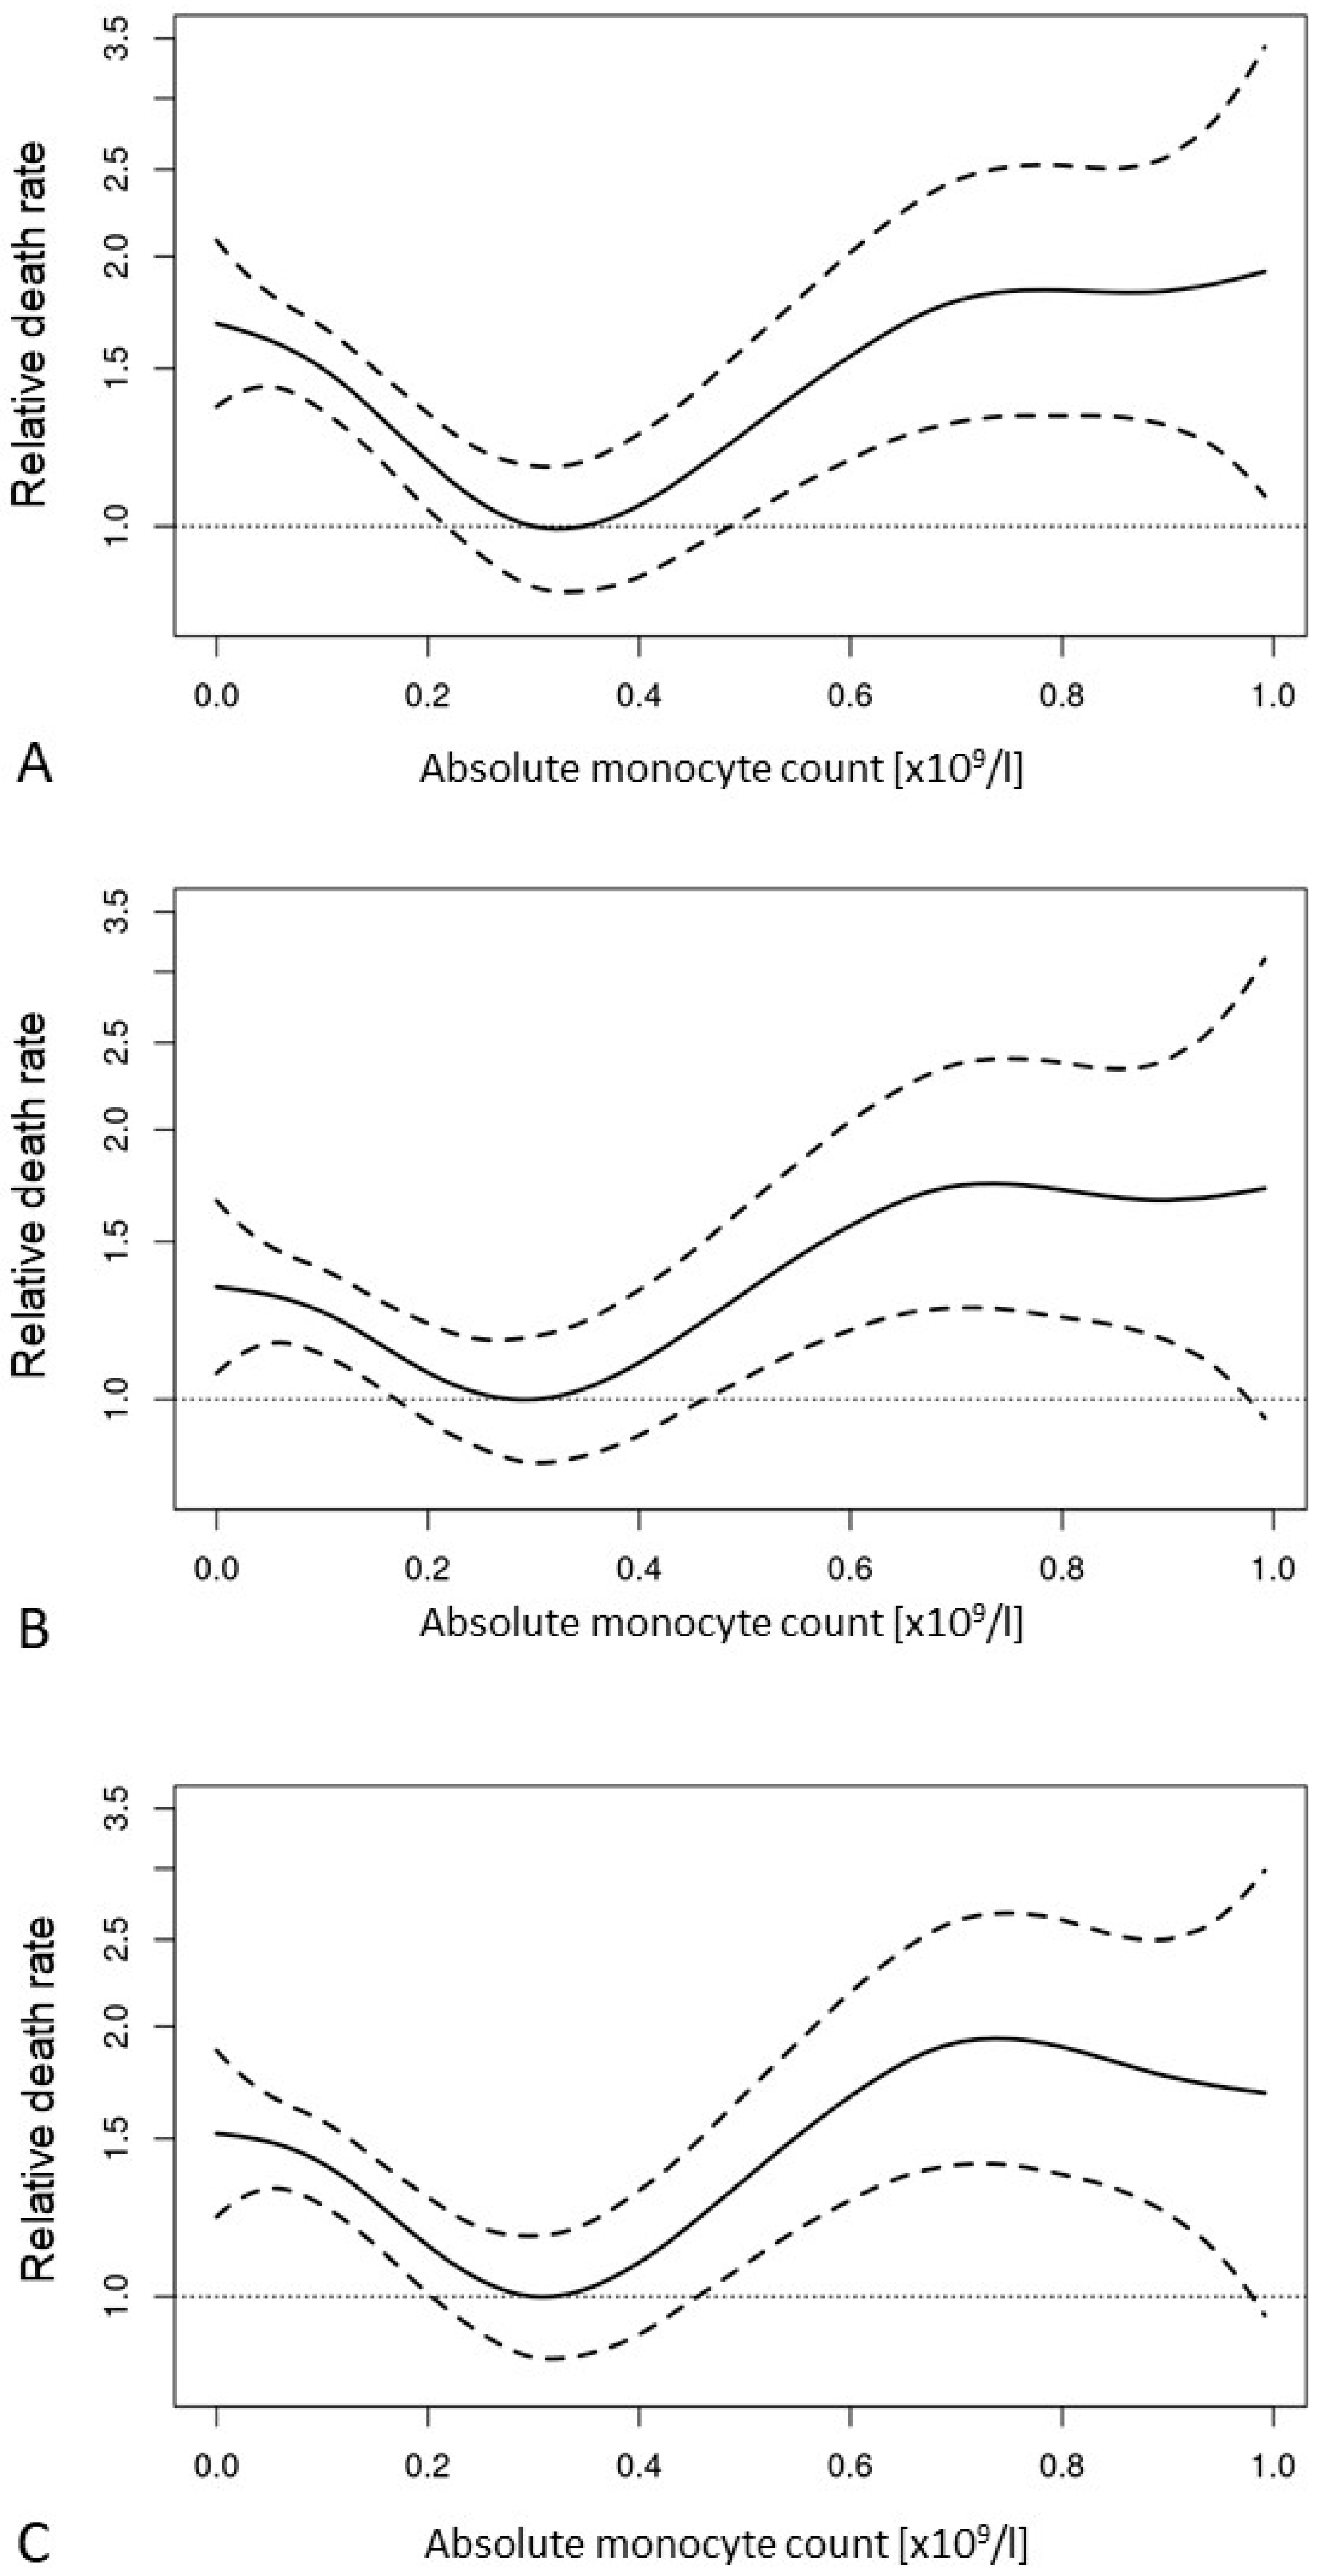
3.5.2. Monocyte Count as a Continuous Variable
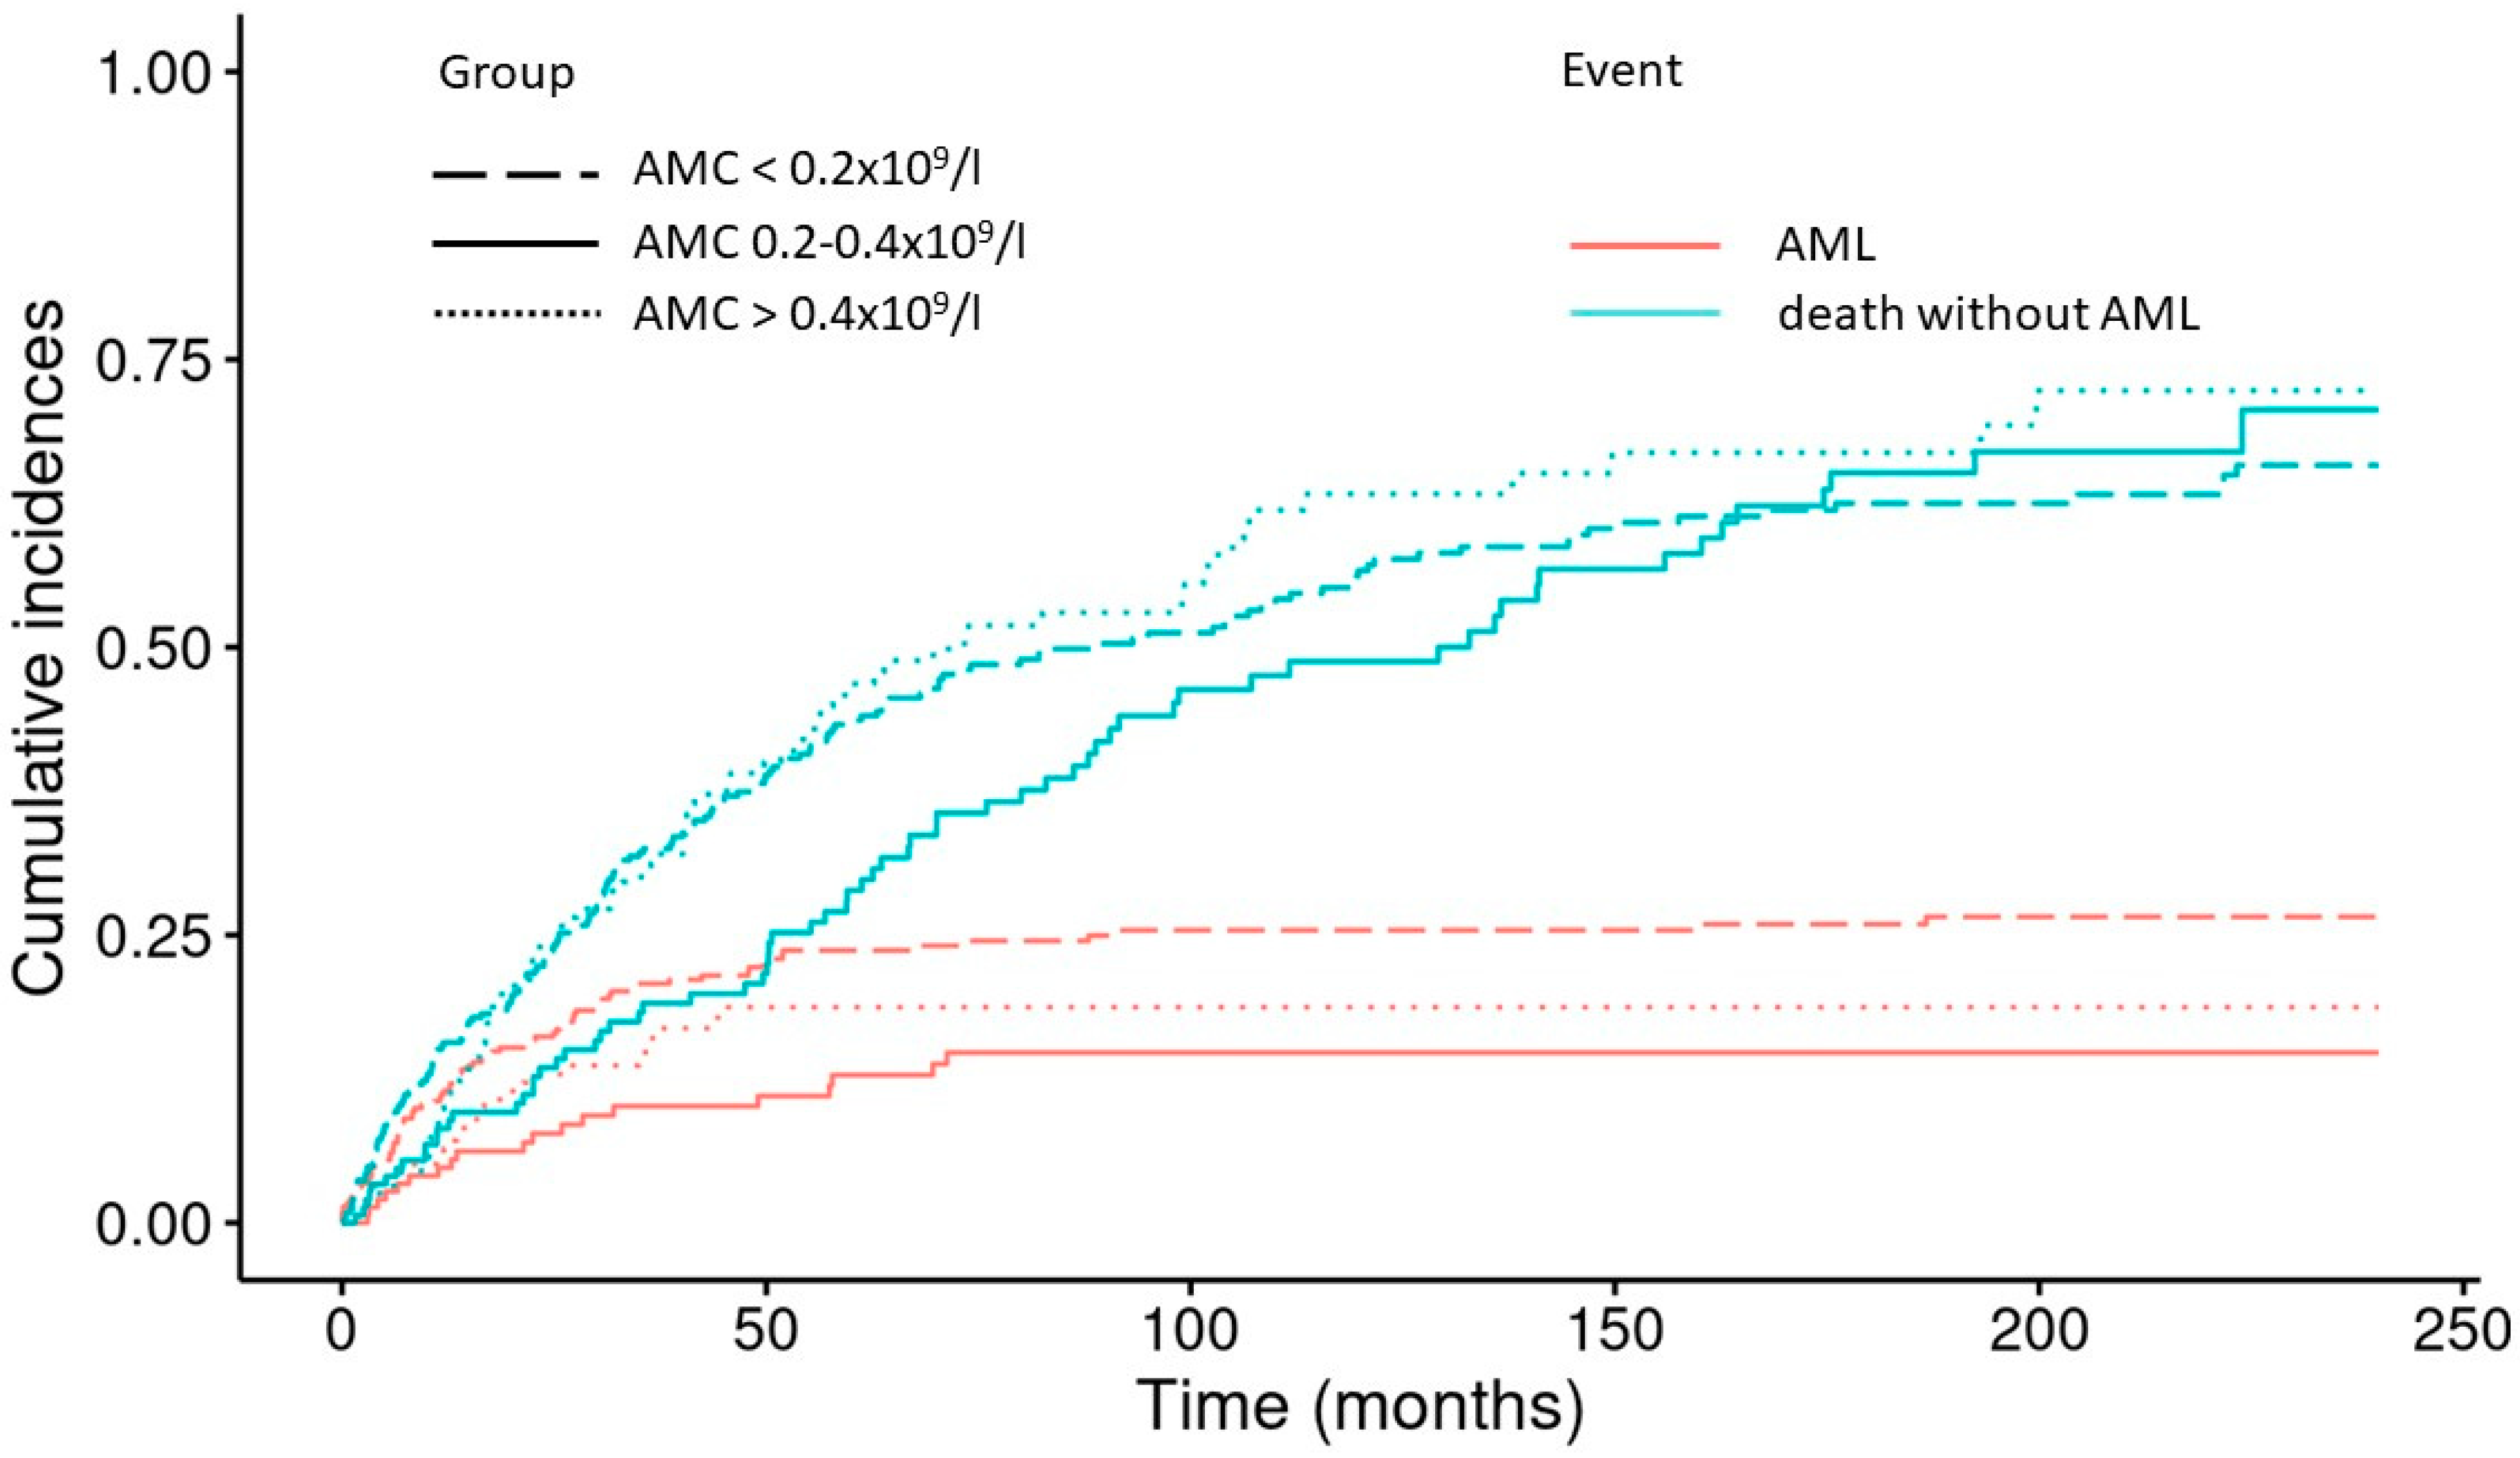
3.5.3. Absolute Monocyte Count and Risk of Transformation to AML
4. Discussion
Limitations
5. Conclusions
Author Contributions
Funding
Institutional Review Board Statement
Informed Consent Statement
Data Availability Statement
Conflicts of Interest
References
- Volpe, V.O.; Garcia-Manero, G.; Komrokji, R.S. SOHO State of the Art & Next Questions: Myelodysplastic Syndromes: A New Decade. Clin. Lymphoma Myeloma Leuk. 2021, 22, 1–16. [Google Scholar] [CrossRef] [PubMed]
- Hellström-Lindberg, E.; Tobiasson, M.; Greenberg, P. Myelodysplastic syndromes: Moving towards personalized management. Haematologica 2020, 105, 1765–1779. [Google Scholar] [CrossRef] [PubMed]
- Arber, D.A.; Orazi, A.; Hasserjian, R.; Thiele, J.; Borowitz, M.J.; Le Beau, M.M.; Bloomfield, C.D.; Cazzola, M.; Vardiman, J.W. The 2016 revision to the World Health Organization classification of myeloid neoplasms and acute leukemia. Blood 2016, 127, 2391–2405. [Google Scholar] [CrossRef] [PubMed]
- Khoury, J.D.; Solary, E.; Abla, O.; Akkari, Y.; Alaggio, R.; Apperley, J.F.; Bejar, R.; Berti, E.; Busque, L.; Chan, J.K.C.; et al. The 5th edition of the World Health Organization Classification of Haematolymphoid Tumours: Myeloid and Histiocytic/Dendritic Neoplasms. Leukemia 2022, 36, 1703–1719. [Google Scholar] [CrossRef] [PubMed]
- Arber, D.A.; Orazi, A.; Hasserjian, R.P.; Borowitz, M.J.; Calvo, K.R.; Kvasnicka, H.-M.; Wang, S.A.; Bagg, A.; Barbui, T.; Branford, S.; et al. International Consensus Classification of Myeloid Neoplasms and Acute Leukemias: Integrating morphologic, clinical, and genomic data. Blood 2022, 140, 1200–1228. [Google Scholar] [CrossRef]
- Kasprzak, A.; Nachtkamp, K.; Gattermann, N.; Germing, U. Assessing the Prognosis of Patients with Myelodysplastic Syndromes (MDS). Cancers 2022, 14, 1941. [Google Scholar] [CrossRef]
- Greenberg, P.; Cox, C.; Lebeau, M.M.; Fenaux, P.; Morel, P.; Sanz, G.; Sanz, M.; Vallespi, T.; Hamblin, T.; Oscier, D.; et al. International Scoring System for Evaluating Prognosis in Myelodysplastic Syndromes. Blood 1997, 89, 2079–2088. [Google Scholar] [CrossRef]
- Greenberg, P.L.; Tuechler, H.; Schanz, J.; Sanz, G.; Garcia-Manero, G.; Solé, F.; Bennett, J.M.; Bowen, D.; Fenaux, P.; Dreyfus, F.; et al. Revised International Prognostic Scoring System for Myelodysplastic Syndromes. Blood 2012, 120, 2454–2465. [Google Scholar] [CrossRef] [Green Version]
- Bernard, E.; Tuechler, H.; Greenberg, P.L.; Hasserjian, R.P.; Ossa, J.E.A.; Nannya, Y.; Devlin, S.M.; Creignou, M.; Pinel, P.; Monnier, L.; et al. Molecular International Prognostic Scoring System for Myelodysplastic Syndromes. NEJM Évid. 2022, 1, EVIDoa2200008. [Google Scholar] [CrossRef]
- Guilliams, M.; Mildner, A.; Yona, S. Developmental and Functional Heterogeneity of Monocytes. Immunity 2018, 49, 595–613. [Google Scholar] [CrossRef] [Green Version]
- Saeed, L.; Patnaik, M.M.; Begna, K.H.; Al-Kali, A.; Litzow, M.R.; Hanson, C.A.; Ketterling, R.P.; Porrata, L.F.; Pardanani, A.; Gangat, N.; et al. Prognostic relevance of lymphocytopenia, monocytopenia and lymphocyte-to-monocyte ratio in primary myelodysplastic syndromes: A single center experience in 889 patients. Blood Cancer J. 2017, 7, e550. [Google Scholar] [CrossRef] [PubMed] [Green Version]
- Diamantopoulos, P.T.; Charakopoulos, E.; Symeonidis, A.; Kotsianidis, I.; Viniou, N.-A.; Pappa, V.; Pontikoglou, C.; Tsokanas, D.; Drakos, G.; Kourakli, A.; et al. Real world data on the prognostic significance of monocytopenia in myelodysplastic syndrome. Sci. Rep. 2022, 12, 17914. [Google Scholar] [CrossRef] [PubMed]
- Barraco, D.; Cerquozzi, S.; Gangat, N.; Patnaik, M.M.; Lasho, T.; Finke, C.; Hanson, C.A.; Ketterling, R.P.; Pardanani, A.; Tefferi, A. Monocytosis in polycythemia vera: Clinical and molecular correlates. Am. J. Hematol. 2017, 92, 640–645. [Google Scholar] [CrossRef] [Green Version]
- Tefferi, A.; Shah, S.; Mudireddy, M.; Lasho, T.L.; Barraco, D.; Hanson, C.A.; Ketterling, R.P.; Elliott, M.A.; Patnaik, M.S.; Pardanani, A.; et al. Monocytosis is a powerful and independent predictor of inferior survival in primary myelofibrosis. Br. J. Haematol. 2017, 183, 835–838. [Google Scholar] [CrossRef] [PubMed] [Green Version]
- Germing, U.; Strupp, C.; Kuendgen, A.; Isa, S.; Knipp, S.; Hildebrandt, B.; Giagounidis, A.; Aul, C.; Gattermann, N.; Haas, R. Prospective validation of the WHO proposals for the classification of myelodysplastic syndromes. Haematologica 2006, 91, 1596–1604. [Google Scholar]
- Economopoulos, T.; Stathakis, N.; Maragoyannis, Z.; Gardikas, E.; Dervenoulas, J. Myelodysplastic Syndrome. Clinical and Prognostic Significance of Monocyte Count, Degree of Blastic Infiltration, and Ring Sideroblasts. Acta Haematol. 1981, 65, 97–102. [Google Scholar] [CrossRef]
- Bain, B.J. Ethnic and sex differences in the total and differential white cell count and platelet count. J. Clin. Pathol. 1996, 49, 664–666. [Google Scholar] [CrossRef]
- Zini, G. CHAPTER 16—Abnormalities in Leukocyte Morphology and Number. In Blood and Bone Marrow Pathology, 2nd ed.; Porwit, A., McCullough, J., Erber, W.N., Eds.; Churchill Livingstone: Edinburgh, UK, 2011; pp. 247–261. ISBN 978-0-7020-3147-2. [Google Scholar]
- Janssen, J.W.; Buschle, M.; Layton, M.; Drexler, H.G.; Lyons, J.; van den Berghe, H.; Heimpel, H.; Kubanek, B.; Kleihauer, E.; Mufti, G.J. Clonal Analysis of Myelodysplastic Syndromes: Evidence of Multipotent Stem Cell Origin. Blood 1989, 73, 248–254. [Google Scholar] [CrossRef] [Green Version]
- Tefferi, A.; Thibodeau, S.N.; Solberg, L.A. Clonal Studies in the Myelodysplastic Syndrome Using X-Linked Restriction Fragment Length Polymorphisms. Blood 1990, 75, 1770–1773. [Google Scholar] [CrossRef] [Green Version]
- Van Kamp, H.; Fibbe, W.E.; Jansen, R.P.; van der Keur, M.; de Graaff, E.; Willemze, R.; Landegent, J.E. Clonal Involvement of Granulocytes and Monocytes, but Not of T and B Lymphocytes and Natural Killer Cells in Patients with Myelodysplasia: Analysis by X-Linked Restriction Fragment Length Polymorphisms and Polymerase Chain Reaction of the Phosphoglycerate Kinase Gene. Blood 1992, 80, 1774–1780. [Google Scholar]
- Kere, J.; Ruutu, T.; de la Chapelle, A. Monosomy 7 in Granulocytes and Monocytes in Myelodysplastic Syndrome. N. Engl. J. Med. 1987, 316, 499–503. [Google Scholar] [CrossRef] [PubMed]
- Calvi, L.M.; Li, A.J.; Becker, M.W. What is the role of the microenvironment in MDS? Best Pract. Res. Clin. Haematol. 2019, 32, 101113. [Google Scholar] [CrossRef] [PubMed]
- Emoto, T.; Lu, J.; Sivasubramaniyam, T.; Maan, H.; Khan, A.B.; Abow, A.A.; Schroer, S.A.; Hyduk, S.J.; Althagafi, M.G.; McKee, T.D.; et al. Colony stimulating factor-1 producing endothelial cells and mesenchymal stromal cells maintain monocytes within a perivascular bone marrow niche. Immunity 2022, 55, 862–878.e8. [Google Scholar] [CrossRef] [PubMed]
- Mir, M.A.; Kochuparambil, S.T.; Abraham, R.S.; Rodriguez, V.; Howard, M.; Hsu, A.P.; Jackson, A.E.; Holland, S.M.; Patnaik, M.M. Spectrum of myeloid neoplasms and immune deficiency associated with germline GATA 2 mutations. Cancer Med. 2015, 4, 490–499. [Google Scholar] [CrossRef] [PubMed]
- Crispino, J.D.; Horwitz, M.S. GATA factor mutations in hematologic disease. Blood 2017, 129, 2103–2110. [Google Scholar] [CrossRef]
- Papaemmanuil, E.; Gerstung, M.; Malcovati, L.; Tauro, S.; Gundem, G.; Van Loo, P.; Yoon, C.J.; Ellis, P.; Wedge, D.C.; Pellagatti, A.; et al. Clinical and biological implications of driver mutations in myelodysplastic syndromes. Blood 2013, 122, 3616–3627. [Google Scholar] [CrossRef] [PubMed] [Green Version]
- Haferlach, T.; Nagata, Y.; Grossmann, V.; Okuno, Y.; Bacher, U.; Nagae, G.; Schnittger, S.; Sanada, M.; Kon, A.; Alpermann, T.; et al. Landscape of genetic lesions in 944 patients with myelodysplastic syndromes. Leukemia 2014, 28, 241–247. [Google Scholar] [CrossRef] [Green Version]
- Soehnlein, O.; Lindbom, L. Phagocyte partnership during the onset and resolution of inflammation. Nat. Rev. Immunol. 2010, 10, 427–439. [Google Scholar] [CrossRef]
- Schmidt, C.S.; Lopez, P.A.; Dopheide, J.F.; Schmidt, F.; Theobald, M.; Schild, H.; Lauinger-Lörsch, E.; Nolte, F.; Radsak, M.P. Phenotypic and functional characterization of neutrophils and monocytes from patients with myelodysplastic syndrome by flow cytometry. Cell. Immunol. 2016, 308, 19–26. [Google Scholar] [CrossRef]
- Pollyea, D.A.; Hedin, B.R.; O’Connor, B.P.; Alper, S. Monocyte function in patients with myelodysplastic syndrome. J. Leukoc. Biol. 2018, 104, 641–647. [Google Scholar] [CrossRef]
- Velegraki, M.; Papakonstantinou, N.; Kalaitzaki, L.; Ntoufa, S.; Laidou, S.; Tsagiopoulou, M.; Bizymi, N.; Damianaki, A.; Mavroudi, I.; Pontikoglou, C.; et al. Increased proportion and altered properties of intermediate monocytes in the peripheral blood of patients with lower risk Myelodysplastic Syndrome. Blood Cells Mol. Dis. 2020, 86, 102507. [Google Scholar] [CrossRef] [PubMed]
- Prodan, M.; Tulissi, P.; Perticarari, S.; Presani, G.; Franzin, F.; Pussini, E.; Pozzato, G. Flow cytometric assay for the evaluation of phagocytosis and oxidative burst of polymorphonuclear leukocytes and monocytes in myelodysplastic disorders. Haematologica 1995, 80, 212–218. [Google Scholar] [PubMed]
- Han, Y.; Wang, H.; Shao, Z. Monocyte-Derived Macrophages Are Impaired in Myelodysplastic Syndrome. J. Immunol. Res. 2016, 2016, 5479013. [Google Scholar] [CrossRef] [PubMed] [Green Version]
- Geyer, J.T.; Tam, W.; Liu, Y.-C.; Chen, Z.; A Wang, S.; Bueso-Ramos, C.; Oak, J.; Arber, D.A.; Hsi, E.; Rogers, H.J.; et al. Oligomonocytic chronic myelomonocytic leukemia (chronic myelomonocytic leukemia without absolute monocytosis) displays a similar clinicopathologic and mutational profile to classical chronic myelomonocytic leukemia. Mod. Pathol. 2017, 30, 1213–1222. [Google Scholar] [CrossRef] [PubMed] [Green Version]
- Schuler, E.; Frank, F.; Hildebrandt, B.; Betz, B.; Strupp, C.; Rudelius, M.; Aul, C.; Schroeder, T.; Gattermann, N.; Haas, R.; et al. Myelodysplastic syndromes without peripheral monocytosis but with evidence of marrow monocytosis share clinical and molecular characteristics with CMML. Leuk. Res. 2017, 65, 1–4. [Google Scholar] [CrossRef]
- Calvo, X.; Garcia-Gisbert, N.; Parraga, I.; Gibert, J.; Florensa, L.; Andrade-Campos, M.; Merchan, B.; Garcia-Avila, S.; Montesdeoca, S.; Fernández-Rodríguez, C.; et al. Oligomonocytic and overt chronic myelomonocytic leukemia show similar clinical, genomic, and immunophenotypic features. Blood Adv. 2020, 4, 5285–5296. [Google Scholar] [CrossRef]
- Patnaik, M.M.; Lasho, T.L. Genomics of myelodysplastic syndrome/myeloproliferative neoplasm overlap syndromes. Hematol. Am. Soc. Hematol. Educ. Program 2020, 2020, 450–459. [Google Scholar] [CrossRef]
- Fayad, Z.A.; Swirski, F.K.; Calcagno, C.; Robbins, C.S.; Mulder, W.; Kovacic, J.C. Monocyte and Macrophage Dynamics in the Cardiovascular System: JACC Macrophage in CVD Series (Part 3). J. Am. Coll. Cardiol. 2018, 72, 2198–2212. [Google Scholar] [CrossRef]
- Shahid, F.; Lip, G.Y.; Shantsila, E. Role of Monocytes in Heart Failure and Atrial Fibrillation. J. Am. Heart Assoc. 2018, 7, e007849. [Google Scholar] [CrossRef] [Green Version]
- Waterhouse, D.F.; Cahill, R.A.; Sheehan, F.; McCreery, C. Prediction of calculated future cardiovascular disease by monocyte count in an asymptomatic population. Vasc. Health Risk Manag. 2008, 4, 177–187. [Google Scholar] [CrossRef] [Green Version]
- Gupta, K.; Kalra, R.; Pate, M.; Nagalli, S.; Ather, S.; Rajapreyar, I.; Arora, P.; Gupta, A.; Zhou, W.; Estepar, R.S.J.; et al. Relative Predictive Value of Circulating Immune Markers in US Adults Without Cardiovascular Disease: Implications for Risk Reclassification. Mayo Clin. Proc. 2021, 96, 1812–1821. [Google Scholar] [CrossRef] [PubMed]
- Oh, E.S.; You, Z.; Nowak, K.L.; Jovanovich, A.J. Association of Monocyte Count and Monocyte/Lymphocyte Ratio with the Risk of Cardiovascular Outcomes in Patients with CKD. Kidney360 2022, 3, 657–665. [Google Scholar] [CrossRef] [PubMed]
- Bogorodskaya, M.; Lyass, A.; Mahoney, T.; Borowsky, L.; Sen, P.; Swirski, F.; Srinivasa, S.; Longenecker, C.; Massaro, J.; D’agostino, R.; et al. Utilization of absolute monocyte counts to predict cardiovascular events in people living with HIV. HIV Med. 2020, 22, 314–320. [Google Scholar] [CrossRef] [PubMed]
- Jaiswal, S.; Libby, P. Clonal haematopoiesis: Connecting ageing and inflammation in cardiovascular disease. Nat. Rev. Cardiol. 2019, 17, 137–144. [Google Scholar] [CrossRef] [PubMed]
- Germing, U.; Hildebrandt, B.; Pfeilstöcker, M.; Nösslinger, T.; Valent, P.; Fonatsch, C.; Lübbert, M.; Haase, D.; Steidl, C.; Krieger, O.; et al. Refinement of the international prognostic scoring system (IPSS) by including LDH as an additional prognostic variable to improve risk assessment in patients with primary myelodysplastic syndromes (MDS). Leukemia 2005, 19, 2223–2231. [Google Scholar] [CrossRef] [PubMed]
- Jain, A.G.; Zhang, L.; Bennett, J.M.; Komrokji, R. Myelodysplastic Syndromes with Bone Marrow Fibrosis: An Update. Ann. Lab. Med. 2022, 42, 299–305. [Google Scholar] [CrossRef]
- Benton, C.B.; Khan, M.; Sallman, D.; Nazha, A.; Nogueras González, G.M.; Piao, J.; Ning, J.; Aung, F.; Al Ali, N.; Jabbour, E.; et al. Prognosis of patients with intermediate risk IPSS-R myelodysplastic syndrome indicates variable outcomes and need for models beyond IPSS-R. Am. J. Hematol. 2018, 93, 1245–1253. [Google Scholar] [CrossRef] [Green Version]


| Group A | Group B | Group C | p | |||
|---|---|---|---|---|---|---|
| All | AMC <0.2 × 10⁹/L | AMC 0.2–0.4 × 10⁹/L | AMC > 0.4 × 10⁹/L | A vs. B | B vs. C | |
| WHO 2016, n (%) | 993 | 529 | 241 | 223 | ||
| MDS-SLD | 71 (7.2) | 38 (7.2) | 18 (7.5) | 15 (6.7) | ||
| MDS-MLD | 302 (30.4) | 157 (29.7) | 70 (29) | 75 (33.6) | ||
| MDS-RS-SLD | 46 (4.6) | 15 (2.8) | 17 (7.1) | 14 (6.3) | ||
| MDS-RS-MLD | 92 (9.3) | 37 (7) | 24 (10) | 31 (13.9) | ||
| MDS(del5q) | 115 (11.6) | 54 (10.2) | 46 (19.1) | 15 (6.7) | ||
| MDS-EB-1 | 162 (16.3) | 86 (16.3) | 34 (14.1) | 42 (18.8) | ||
| MDS-EB-2 | 194 (19.5) | 138 (26.1 | 29 (12) | 27 (12.1) | ||
| MDS-U | 11 (1.1) | 4 (0.8) | 3 (1.2) | 4 (1.8) | ||
| IPSS-R, n (%) | ||||||
| Very low | 54 (5.4) | 19 (3.6) | 18 (7.5) | 17 (7.6) | ||
| Low | 317 (31.9) | 141 (26.7) | 93 (38.6) | 83 (37.2) | ||
| Intermediate | 258 (26.0) | 146 (27.6) | 62 (25.7) | 50 (22.4) | ||
| High | 184 (18.5) | 104 (19.7) | 35 (14.5) | 45 (20.2) | ||
| Very high | 180 (18.1) | 119 (22.5) | 33 (13.7) | 28 (12.6) | ||
| Cytogenetic risk groups (IPSS-R) | ||||||
| Very good | 34 (3.4) | 14 (2.6) | 5 (2.1) | 15 (6.7) | ||
| Good | 609 (61.3) | 321 (60.7) | 153 (63.5) | 135 (60.5) | ||
| Intermediate | 165 (16.6) | 95 (18) | 42 (17.4) | 28 (12.6) | ||
| Poor | 72 (7.3) | 33 (6.2) | 17 (7.1) | 22 (9.9) | ||
| Very poor | 113 (11.4) | 66 (12.5) | 24 (10) | 23 (10.3) | ||
| Demographics | ||||||
| Age, median (years), IQR | 66 (58–73) | 66 (58–73) | 66 (58–73) | 67 (59–73) | 0.782 | 0.220 |
| Male, n (%) | 576 (58) | 285 (53.9) | 138 (57.3) | 153 (68.6) | 0.381 | 0.012 |
| Leukemic transformation, n (%) | 247 (24.9) | 145 (27.4) | 55 (22.8) | 47 (21.1) | ||
| Deaths, n (%) | 633 (63.7) | 359 (67.9) | 134 (55.6) | 140 (62.8) | ||
| Lost to follow-up, n (%) | 35 (3.5) | 20 (3.8) | 9 (3.7) | 6 (2.7) | ||
| Peripheral blood values | ||||||
| Haemoglobin, median (g/L), IQR | 95 (83–110) | 93 (82–109) | 99 (84–113) | 98 (85–112) | 0.018 | 0.79 |
| Neutrophil count, median (×109/L), IQR | 1.59 (0.82–2.66) | 1.12 (0.63–2.05) | 1.84 (1.20–2.66) | 2.54 (1.48–3.75) | <0.001 | <0.001 |
| Lymphocyte count, median (×109/L), IQR | 1.21 (0.79–1.68) | 1.1 (0.70–1.54) | 1.26 (0.83–1.73) | 1.47 (0.99–2.05) | 0.006 | <0.001 |
| Platelet count, median (×109/L), IQR | 115 (58–232) | 97 (53–190) | 151 (74–266) | 128 (65–263) | <0.001 | 0.227 |
| LDH | ||||||
| Data available, n (%) | 851 (85.7) | 461 (87.1) | 204 (84.6) | 186 (83.4) | ||
| LDH, median (U/L) | 199 (172–256) | 203 (170–257) | 198 (177–243) | 198 (172–268) | 0.798 | 0.917 |
| LDH > ULN (240 U/L), n (%) | 259 (26.1) | 149 (28.2) | 51 (16.2) | 59 (31.7) | 0.058 | 0.141 |
| Blasts | ||||||
| Blasts bone marrow, median (%), IQR | 3 (1–8) | 4 (2–10) | 2 (1–5) | 3 (1–7) | <0.001 | 0.394 |
| Blasts peripheral blood, median (%), IQR Range | 0 (0–0) (0–19) | 0 (0–0) (0–19) | 0 (0–0) (0–18) | 0 (0–0) (0–19) | 0.484 | 0.382 |
| Bone marrow fibrosis | ||||||
| Data available, n (%) | 539 (54.3) | 299 (56.5) | 117 (48.5) | 123(55.2) | ||
| With fibrosis, n (%) | 75 (12.6) | 39 (13.0) | 19 (16.2) | 17 (13.8) | 0.398 | 0.600 |
| Transfusion dependent | ||||||
| Data available, n (%) | 415 (41.8) | 229 (43.7) | 94 (39) | 92 (41.3) | ||
| Transfusion dependent, n (%) | 218 (51.8) | 129 (56.3) | 45 (47.9) | 44 (47.8) | 0.166 | 0.995 |
| n | AMC (×109) Median (IQR) | p | |
|---|---|---|---|
| Total | 993 | 0.19 (0.07–0.37) | |
| WHO 2016 | |||
| MDS-SLD | 71 | 0.19 (0.11–0.33) | <0.001 |
| MDS-MLD | 302 | 0.19 (0.09–0.40) | |
| MDS-RS-SLD | 46 | 0.31 (0.13–0.52) | |
| MDS-RS-MLD | 92 | 0.26 (0.15–0.50) | |
| MDS(del5q) | 115 | 0.21 (0.10–0.32) | |
| MDS-EB-1 | 162 | 0.16 (0.06–0.45) | |
| MDS-EB-2 | 194 | 0.10 (0.04–0.26) | |
| MDS-U | 11 | 0.32 (0.09–0.59) | |
| IPSS-R | |||
| Very low | 54 | 0.30 (0.15–0.42) | <0.001 |
| Low | 317 | 0.22 (0.11–0.41) | |
| Intermediate | 258 | 0.18 (0.07–0.35) | |
| High | 184 | 0.16 (0.07–0.39) | |
| Very high | 180 | 0.12 (0.05–0.27) | |
| MDS with excess blasts | 356 | 0.12 (0.05–0.32) | <0.001 |
| MDS without excess blasts | 637 | 0.21 (0.11–0.40) | |
| MDS del(5q) | 115 | 0.21 (0.09–0.32) | 0.910 |
| MDS non-del(q) | 878 | 0.18 (0.07–0.39) | |
| MDS-SLD/MLD | 373 | 0.19 (0.10–0.39) | 0.002 |
| MDS-RS-SLD/MLD | 138 | 0.27 (0.13–0.50) | |
| Lower-risk MDSs (IPSS-R very low/low) | 371 | 0.24 (0.11–042) | <0.001 |
| Higher-risk MDSs (IPSS-R intermediate/high/very high) | 622 | 0.15 (0.06–0.33) | |
| Therapy-related MDSs | 112 | 0.19 (0.09–0.39) | 0.608 |
| Primary MDSs | 881 | 0.19 (0.07–0.37) | |
| Transfusion dependent | 218 | 0.16 (0.06–0.33) | 0.05 |
| Transfusion independent | 197 | 0.20 (0.09–0.40) | |
| Without bone marrow fibrosis | 464 | 0.17 (0.07–0.38) | 0.351 |
| With bone marrow fibrosis | 75 | 0.20 (0.07.0.38) | |
| Univariate | Multivariate I | Multivariate II | Multivariate III | |||||||||
|---|---|---|---|---|---|---|---|---|---|---|---|---|
| HR | 95% CI | p | HR | 95% CI | p | |||||||
| Age > 65 | 2.37 | 1.92; 2.94 | <0.001 | 2.45 | 1.97; 3.04 | <0.001 | ||||||
| Male sex | 1.31 | 1.08; 1.58 | 0.006 | 1.10 | 0.91; 1.34 | 0.332 | ||||||
| Hb < 100 g/L | 1.48 | 1.23; 1.79 | <0.001 | 1.59 | 1.31; 1.94 | <0.001 | ||||||
| Neutrophils < 0.8 × 10⁹/L | 1.74 | 1.32; 2.30 | <0.001 | 0.92 | 0.69; 1.24 | 0.582 | ||||||
| Platelets < 100 × 109/L | 1.56 | 1.23; 1.99 | <0.001 | 1.59 | 1.30; 1.94 | <0.001 | ||||||
| Bone marrow blasts >5% | 2.81 | 2.29; 3.45 | <0.001 | 2.16 | 1.72.; 2.70 | <0.001 | ||||||
| IPSS-R cytogenetic risk category | ||||||||||||
| good vs. very good | 1.67 | 0.86; 3.25 | 0.130 | 2.13 | 1.09; 4.15 | 0.027 | ||||||
| intermediate vs. very good | 2.48 | 1.24; 4.96 | 0.010 | 2.80 | 1.40; 5.61 | 0.004 | ||||||
| poor vs. very good | 2.55 | 1.22; 5.32 | 0.014 | 2.61 | 1.25; 5.48 | 0.011 | ||||||
| very poor vs. very good | 8.15 | 4.01; 16.55 | <0.01 | 7.18 | 3.49; 14.78 | <0.001 | ||||||
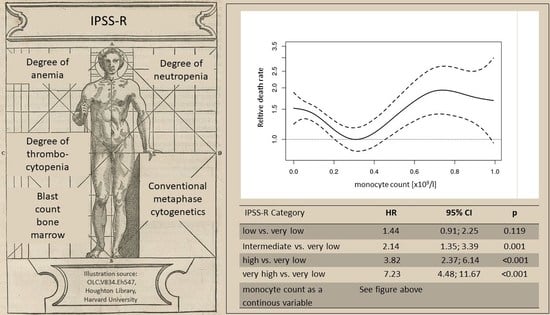
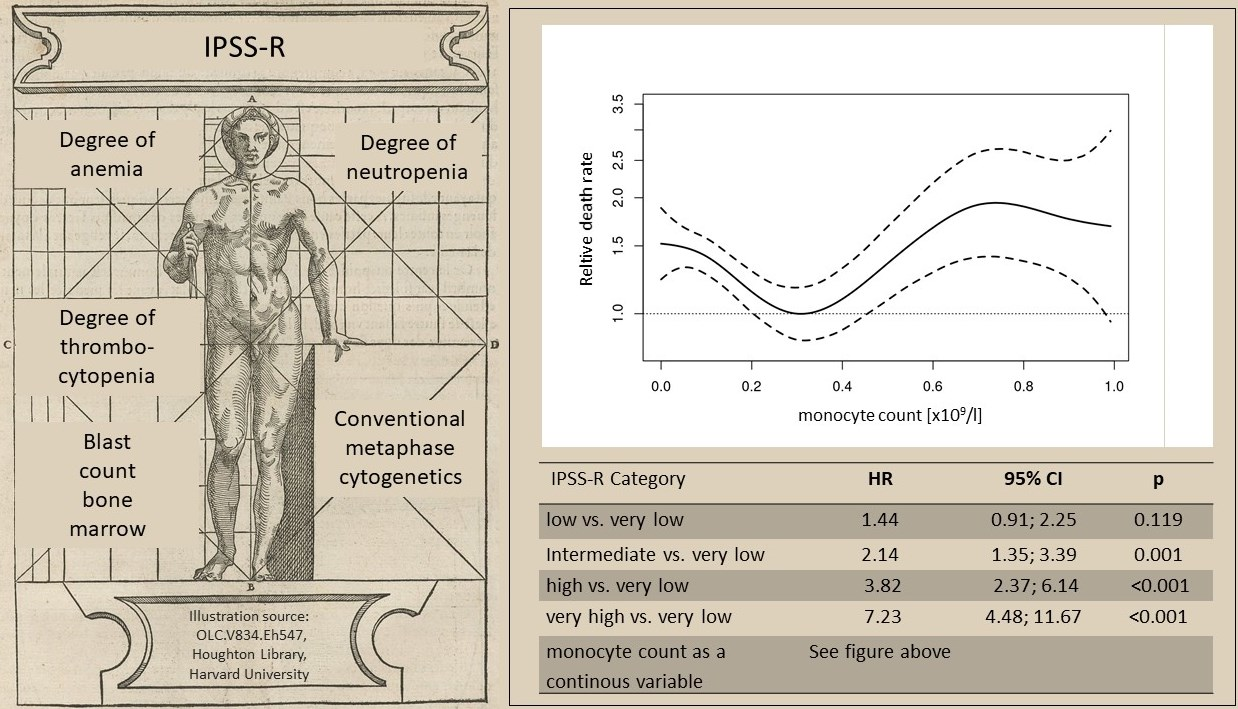
| IPSS-R category | ||||||||||||
| low vs. very low | 1.44 | 0.92; 2.25 | 0.113 | 1.43 | 0.91;2.24 | 0.119 | 1.57 | 1.00; 2.46 | 0.050 | |||
| intermediate vs. very low | 2.16 | 1.37; 3.41 | <0.001 | 2.13 | 1.35; 3.36 | 0.001 | 2.22 | 1.40; 3.50 | 0.001 | |||
| high vs. very low | 4.03 | 2.51; 6.46 | <0.001 | 3.90 | 2.43; 6.26 | <0.001 | 3.85 | 2.34; 6.19 | <0.001 | |||
| very high vs. very low | 7.10 | 4.41; 11.43 | <0.001 | 6.81 | 4.23; 10.97 | <0.001 | 7.35 | 4.56; 11.85 | <0.001 | |||
| Monocyte count <0.2 × 10⁹/L or >0.4 × 10⁹/L | 1.61 | 1.28–2.02 | <0.001 | 1.32 | 1.04–1.67 | 0.021 | 1.47 | 1.16; 1.85 | 0.001 | 1.63 | 1.29; 2.05 | <0.001 |
| Univariate | Multivariate I | Multivariate II | |||||||
|---|---|---|---|---|---|---|---|---|---|
| HR | 95% CI | p | HR | 95% CI | p | HR | 95% CI | p | |
| Hb < 10 g/dL | 1.48 | 1.23; 1.79 | <0.001 | 1.59 | 1.30; 1.94 | <0.001 | |||
| Neutrophil count < 0.5 × 10⁹/L | 1.74 | 1.32; 2.30 | <0.001 | 0.94 | 0.70; 1.26 | 0.684 | |||
| Platelet count < 100 × 109/L | 1.56 | 1.23; 1.99 | <0.001 | 1.67 | 1.36; 2.05 | <0.001 | |||
| Bone marrow blasts > 5% | 2.81 | 2.29; 3.45 | <0.001 | 2.09 | 1.66; 2.63 | <0.001 | |||
| IPSS-R cytogenetic risk category | |||||||||
| good vs. very good | 1.67 | 0.86; 3.25 | 0.130 | 2.13 | 1.09; 4.17 | 0.027 | |||
| intermediate vs. very good | 2.48 | 1.24; 4.96 | 0.010 | 2.81 | 1.40; 5.66 | <0.001 | |||
| poor vs. very good | 2.55 | 1.22; 5.32 | 0.014 | 2.68 | 1.28; 5.63 | <0.001 | |||
| very poor vs. very good | 8.15 | 4.01; 16.55 | <0.01 | 7.45 | 3.61; 15.37 | <0.001 | |||
| IPSS-R category | |||||||||
| low vs. very low | 1.44 | 0.92; 2.25 | 0.113 | 1.43 | 0.91; 2.25 | 0.119 | |||
| intermediate vs. very low | 2.16 | 1.37; 3.41 | <0.001 | 2.14 | 1.35; 3.39 | 0.001 | |||
| high vs. very low | 4.03 | 2.51; 6.46 | <0.001 | 3.82 | 2.37; 6.14 | <0.001 | |||
| very high vs. very low | 7.10 | 4.41; 11.43 | <0.001 | 7.23 | 4.48; 11.67 | <0.001 | |||
| Absolute monocyte count as a continous variable | See Figure 3A | See Figure 3B | See Figure 3C | ||||||
Disclaimer/Publisher’s Note: The statements, opinions and data contained in all publications are solely those of the individual author(s) and contributor(s) and not of MDPI and/or the editor(s). MDPI and/or the editor(s) disclaim responsibility for any injury to people or property resulting from any ideas, methods, instructions or products referred to in the content. |
© 2023 by the authors. Licensee MDPI, Basel, Switzerland. This article is an open access article distributed under the terms and conditions of the Creative Commons Attribution (CC BY) license (https://creativecommons.org/licenses/by/4.0/).
Share and Cite
Silzle, T.; Blum, S.; Kasprzak, A.; Nachtkamp, K.; Rudelius, M.; Hildebrandt, B.; Götze, K.S.; Gattermann, N.; Lauseker, M.; Germing, U. The Absolute Monocyte Count at Diagnosis Affects Prognosis in Myelodysplastic Syndromes Independently of the IPSS-R Risk Score. Cancers 2023, 15, 3572. https://doi.org/10.3390/cancers15143572
Silzle T, Blum S, Kasprzak A, Nachtkamp K, Rudelius M, Hildebrandt B, Götze KS, Gattermann N, Lauseker M, Germing U. The Absolute Monocyte Count at Diagnosis Affects Prognosis in Myelodysplastic Syndromes Independently of the IPSS-R Risk Score. Cancers. 2023; 15(14):3572. https://doi.org/10.3390/cancers15143572
Chicago/Turabian StyleSilzle, Tobias, Sabine Blum, Annika Kasprzak, Kathrin Nachtkamp, Martina Rudelius, Barbara Hildebrandt, Katharina S. Götze, Norbert Gattermann, Michael Lauseker, and Ulrich Germing. 2023. "The Absolute Monocyte Count at Diagnosis Affects Prognosis in Myelodysplastic Syndromes Independently of the IPSS-R Risk Score" Cancers 15, no. 14: 3572. https://doi.org/10.3390/cancers15143572