Article

ERBB2 Amplification as a Predictive and Prognostic Biomarker in Upper Tract Urothelial Carcinoma

1
Institute of Pathology, University Medical Center Rostock, 18057 Rostock, Germany
2
Institute for Biostatistics and Informatics in Medicine and Ageing Research, University Medical Center Rostock, 18057 Rostock, Germany
3
Clinical Cancer Registry, University of Rostock, 18055 Rostock, Germany
4
Department of Urology, University Medical Center Rostock, 18057 Rostock, Germany
5
Department of Urology, HELIOS Hanseklinikum, 18435 Stralsund, Germany
*
Author to whom correspondence should be addressed.
Cancers 2023, 15(9), 2414; https://doi.org/10.3390/cancers15092414
Submission received: 29 March 2023 / Accepted: 19 April 2023 / Published: 22 April 2023

Abstract

:

Simple Summary

Upper tract urothelial carcinomas (UTUCs) occur in about 5–10% of all urothelial carcinomas and are frequently discovered in high-stage disease. We aimed to evaluate human epidermal growth factor receptor 2 (ERBB2) protein expression and ERBB2 amplification in UTUCs according to the American Society of Clinical Oncology/College of American Pathologists guidelines for gastric carcinoma, revealing an obvious higher rate of ERBB2 overexpression (41.8%) in contrast to the relatively low frequency of ERBB2 amplification (10.5%) in UTUCs. Correlation and survival analyses show that ERBB2 overexpression and amplification were linked with high-grade and high-stage tumors and with tumor progression. The results suggest that ERBB2 is a biomarker for progression in UTUCs. As previously shown, ERBB2 amplification is infrequent. However, the small number of patients diagnosed with ERBB2-amplified UTUC might benefit from ERBB2-targeted therapy. For the reliable detection of rare ERBB2-amplified UTUC, simultaneous immunohistochemical and cytogenetic ERBB2 analysis is recommended.

Abstract

Upper tract urothelial carcinomas (UTUCs) occur in about 5–10% of all urothelial carcinomas and are frequently discovered in high-stage disease. We aimed to evaluate human epidermal growth factor receptor 2 (ERBB2) protein expression immunohistochemically and ERBB2 amplification in UTUCs by fluorescence in situ hybridization, applying a tissue microarray technique. ERBB2 overexpression and ERBB2 amplification were defined according to the recommendations of the American Society of Clinical Oncology/College of American Pathologists (ASCO/CAP) for breast cancer and gastric carcinoma (GC), revealing scores of 2+ and 3+ in 10.2% and 41.8% of UTUCs, respectively. The performance parameters showed obviously higher sensitivity of ERBB2 immunoscoring according to the ASCO/CAP criteria for GC. ERBB2 amplification was detected in 10.5% of UTUCs. ERBB2 overexpression was more likely to be found in high-grade tumors and was associated with tumor progression. Univariable Cox regression analysis revealed a significantly lower progression-free survival (PFS) in cases with ERBB2 immunoscores of 2+ or 3+ according to the ASCO/CAP guidelines for GC. UTUCs with ERBB2 amplification showed a significantly shorter PFS in the multivariable Cox regression analysis. Irrespective of their ERBB2 status, patients with UTUC treated with platin showed a significantly lower PFS than UTUC patients who had not received any platin-based therapy. In addition, UTUC patients with a normal ERBB2 gene status who had not received platin-based therapy showed significantly longer overall survival. The results suggest that ERBB2 is a biomarker for progression in UTUCs and may define a distinct subgroup of UTUCs. As previously shown, ERBB2 amplification is infrequent. However, the small number of patients diagnosed with ERBB2-amplified UTUC might benefit from ERBB2-targeted cancer therapy. In clinical–pathological routine diagnostics, the determination of ERBB2 amplification is an established method in some defined entities and also successful in small samples. Still, the simultaneous use of ERBB2 immunohistochemistry and ERBB2 in situ hybridization would be important in order to record the low rate of amplified UTUC cases as completely as possible.

1. Introduction

Primary upper tract (UT) urothelial carcinomas (UC) are, unlike urinary bladder carcinomas (UBCs), a rare subtype of UCs, accounting for only 5–10% of all UCs [1,2]. Upper tract urothelial carcinomas (UTUCs) are frequently discovered in high-stage disease, and more than 40% of diagnosed tumors are T2 or higher at nephroureterectomy [3,4,5]. Altogether, 60% of UTUCs are invasive at diagnosis compared to 15–25% of UBCs [3,5,6]. UTUC is often associated with poor clinical outcome, with a 5-year cancer-specific survival of <50% for T2 or T3 and <10% for T4 tumors [7,8]. The standard approach for localized disease in high-risk patients consists of open radical nephroureterectomy with bladder cuff excision [6,7]. There is a lack of standard treatment options in the adjuvant and neoadjuvant settings [1]. In advanced UTUCs, adjuvant platinum-based chemotherapy is the standard of care after the advent of the POUT study, but due to chemotherapy-related toxicity, particularly nephrotoxicity of platin derivatives, and the risk of an impaired postoperative renal function, not all patients are eligible for platin-based chemotherapy [1,3,9].
The genes of the human epidermal growth factor receptor family (EGFR or ERBB family) encode receptor tyrosine kinases, including EGFR (ERBB1), ERBB2 (also HER2), ERBB3, and ERBB4. ERBB2 is located on chromosome 17q21 and acts as a type I transmembrane growth factor receptor, which plays a crucial role in cell proliferation and tumorigenesis [10]. ERBB2 amplification leads to increased levels of ERBB2 at the cell membrane, consecutive homodimerization or heterodimerization with other members of the ERBB family, and results in constitutive self-activation and activation of the phosphoinositide 3-kinase (PI3K)/AKT/mammalian target of rapamycin (mTOR) signaling cascade [11]. The oncogenic potential of ERBB2 has been well-established in the preclinical and clinical settings. ERBB2 amplification and protein overexpression play variable roles in diverse cancers such as breast cancer (BC), esophagogastric and gastric cancer (GC), ovarian cancer, UBC, extrahepatic cholangiocarcinoma, lung cancer, and colon cancer [11,12,13]. While current treatment options for advanced UTUCs are limited, the detection of ERBB2 amplification might provide a rational therapeutic option in these patients, comparable to BC and GC [14,15]. In comparison to UBCs, UTUCs seem to harbor ERBB2 alterations less frequently, i.e., 8% in UTUCs versus 19% in UBCs [16]. Previously published data have shown different ERBB2 overexpression and ERBB2 amplification rates in UTUCs, ranging from 8.3% to 74% and from 8% to 18.1%, respectively [17,18,19,20,21,22,23,24,25,26,27]. Elucidating the role of anti-ERBB2 therapy in UBC, Marin et al. stated that the ERBB2 overexpression or ERBB2 amplification rates vary considerably, in part due to the variability in immunohistochemistry (IHC) assays, cut-off values, antibodies, kits, or protocols applied [28]. Therefore, our working hypothesis is that a standardized evaluation procedure can isolate the patients who are eligible for a ERBB2-specific therapy.
The main research objective was to analyze ERBB2 protein expression comparatively according to the recommendations of the American Society of Clinical Oncology/College of American Pathologists (ASCO/CAP) for ERBB2/HER2 testing in BC [29] and gastroesophageal adenocarcinoma [30] followed by fluorescence in situ hybridization (FISH) for ERBB2 gain or amplification in UTUCs. The peripheral aim was to investigate the impact of ERBB2 overexpression and ERBB2 amplification on patient survival.

2. Materials and Methods

2.1. Study Population and Clinicopathological Data Assessment

This retrospective study included formalin-fixed, paraffin-embedded (FFPE) tissues of a total of 157 patients with 160 primary UT tumors, consisting of 128 infiltrating UCs, 17 non-invasive low-grade papillary UCs, 14 non-invasive high-grade papillary UCs, and one urothelial carcinoma in situ. FFPE samples were retrieved from the archives of the Institute of Pathology at the University Medical Center of Rostock, diagnosed between January 2000 and December 2015. One female patient was diagnosed with a contralateral metachronous tumor of the renal pelvis. In two male patients, separate tumors of the ipsilateral renal pelvis and ureter had been resected. All except three patients had undergone surgery for tumors of the renal pelvis or ureter (nephroureterectomy with or without bladder cuff or ureterectomy) at the Department of Urology at the University Medical Center Rostock between 2000 and 2015. All cases were reclassified according to the updated WHO classification [31,32]. All cases were histologically reviewed according to the growth pattern, grading, TNM classification, lymphovascular invasion, perineural invasion, and the presence of inflammation and necrosis (A.Z.).
Clinical data were collected by reviewing the charts of the Clinical Cancer Registry and the Department of Urology. These data were anonymized and included sex, age at diagnosis, type of surgical intervention, grade, stage, applied chemotherapy regimens and/or radiotherapy, and information concerning progression-free survival (PFS) and overall survival (OS). The patient and tumor characteristics are given in Table 1. In some cases, not all data were available.
The study was performed in accordance with the declaration of Helsinki and German laws concerning data safety, approved by the Ethics Committee of the University of Rostock (reference number: A2016-0015), and with written consent from all patients prior to surgery. Patient data were anonymized according to German laws regulating patient data protection.

2.2. Construction of Tissue Microarrays (TMAs)

For TMA construction, a hematoxylin and eosin (H&E)-stained slide from each sample block was used to define representative tumor regions and areas with normal urothelial mucosa. Using a precision instrument (Beecher Instruments, Silver Spring, MD, USA), tissue cylinders (cores) with a diameter of 0.6 or 1.0 mm were punched from the tumor areas of each block and brought into a recipient paraffin block as described previously [33]. Eight different TMA blocks were constructed. To increase the tumor yield and overcome biomarker heterogeneity, each case was punched at least three times, and the corresponding normal urothelium for internal biomarker validation was added [34].

2.3. IHC

For evaluation, 1 µm sections of formalin-fixed and paraffin-embedded (FFPE) patient tumors were transferred to microscope slides (DAKO, Hamburg, Germany). Deparaffinization, rehydration, and epitope retrieval were performed at pH = 9 and 95 °C for 20 min according to the manufacturer’s protocol using EnVision™ FLEX (DAKO) in a semi-automated autostainer Link 48 (DAKO). Polyclonal rabbit anti-human primary antibody (DAKO) against c-erbB-2 oncoprotein was diluted 1:6000 in EnVision™ FLEX Antibody Diluent (DAKO). For antigen detection, EnVision™ FLEX+ Rabbit (DAKO) was used.
ERBB2 expression was scored according to the guidelines for ERBB2/HER2 testing in GC and adenocarcinoma of the esophagogastric junction given by the CAP, the American Society for Clinical Pathology (ASCP), and the ASCO, and additionally according to the recently published guidelines for ERBB2/HER2-testing in BC [29,30].
According to the ASCO/CAP 2018 guidelines for ERBB2/HER2 testing in BC, complete negative ERBB2 staining or a faint or barely perceptible incomplete membrane stain in less than 10% of tumor cells was referred to as negative (score 0). An incomplete and faint membrane staining in >10% of tumor cells was scored as 1+. Weak to moderate complete membrane staining in >10% of tumor cells was scored as 2+, and intense complete circumferential membrane staining was categorized as 3+ [29].
In accordance with the ASCO/CAP 2017 guidelines for ERBB2/HER2 testing in GC, no reactivity or membranous reactivity in <10% of tumor cells was referred to as negative (score 0). Faint or barely perceptible membranous reactivity in ≥10% of tumor cells or cells showing a weak reactivity in only a part of their membrane was scored as 1+. Weakly positive to moderate continuous expression through the entire tumor cell membrane or lateral/basolateral membranous reactivity in ≥10% of tumor cells was scored as 2+. Regardless of whether an ERBB2 amplification or gain might underline the ERBB2 expression or not, a strong continuous ERBB2 expression through the entire cell membrane or lateral/basolateral membranous reactivity in ≥10% of tumor cells was rated as 3+ [30].

2.4. FISH

FISH for the detection of ERBB2 gains or amplifications was conducted on 5 µm-thick histological sections as previously described in detail [35]. The TMA sections were directly labeled with ZytoLight SPEC ERBB2/CEN17 dual-color probes (Zytomed Systems, Berlin, Germany). After probing and hybridization, the nuclei were counterstained with DAPI DuraTect Solution (Zytomed Systems). The FISH slides were analyzed and scored by fluorescence microscopy using an Olympus BX53 microscope (Olympus, Hamburg, Germany) equipped with a DP-72 camera (Olympus). Hybridization signals of a minimum of 20 non-overlapping nuclei were manually counted on a single-cell basis (A.Z., M.Mo., B.S.). The ratio was calculated using the total number of ERBB2 signals divided by the total number of centromere 17 (CEN17) signals. According to the ASCO/CAP 2018 guidelines for ERBB2 testing in BC [29], ERBB2 amplification was defined by an ERBB2/CEN17 ratio 2.0 with an average ERBB2 copy number < or >4.0 signals per cell or an ERBB2/CEN17 ratio <2.0 with ≥6.0 signals per cell. The ERBB2 result was classified as a gain or equivocal if the ERBB2/CEN17 ratio was <2.0 and the ERBB2 copy number was between ≥4.0 and <6.0 signals per cell [29]. The H&E-stained TMA sections were used for reference histology.

2.5. Statistical Analysis

Statistical analysis was performed using SPSS 28.0.0.0 software (IBM, Ehningen, Germany). Descriptive statistics were computed for continuous and categorical variables. The statistics computed included the mean and standard deviation (SD) values for the continuous variables, and the frequencies and relative frequencies for the categorical factors. OS and PFS were analyzed using the Kaplan–Meier method. Different groups were compared using the log-rank test. Cox proportional hazards regression (Cox regression) analysis was performed to analyze the covariates with a potential influence on OS and PFS of UTUCs with ERBB2 overexpression (score 2+ or 3+), ERBB2 amplification, and platin therapy. Multivariable regression models were fitted using complete cases, and imputation procedures for missing values were not carried out. Considering the number of events, backward selection was performed with a maximum of 10 predictors in the final model. To compare differences between the ERBB2 protein expression or ERBB2 gain or amplification and several clinicopathological variables, Fisher’s exact test or Pearson’s chi-square test was applied. All p-values were obtained using two-sided statistical tests, and a p-value <0.05 was considered to indicate statistical significance. Determinations of sensitivity, specificity, and positive and negative predictive value were made according to Lenhard and Lenhard [36].

3. Results

3.1. Tumor and Patients Characteristics

The demographic and clinicopathological data of the 157 patients with UTUC are shown in Table 1. The mean age at diagnosis was 70.14 yrs (range = 34.99–94.19 yrs). Twenty-seven out of one hundred and fifty-seven patients were aged 60 or younger. Survival data (OS and PFS) were available in 138 cases (mean OS = 5.17 yrs, range = 0.005–18.86 yrs) and 123 cases (mean PFS = 5.18 yrs, range = 0.25–18.86 yrs), respectively. Ninety-nine/138 patients died and 30/123 patients experienced disease progression during the observation period. Adjuvant platin-based chemotherapy was started in 24 patients, gemcitabine was administered in 27 patients, and targeted therapy with nivolumab or atezolizumab was started in 2 patients with progressive tumors after platin-based chemotherapy.
Of the 160 tumors included in this study, the following tumor diagnoses were given: 128 (80%) infiltrating UTUCs, 17 (10.6%) non-invasive papillary low-grade UCs, 14 (8.75%) non-invasive high-grade papillary UCs, and 1 (0.6%) urothelial carcinoma in situ. Tumor localization, grading, and TNM staging of the tumors are listed in Table 1. Lymphatic, vascular, and perineural invasion were found in 54, 50, and 19 cases, respectively. Based on previous analyses, the cohort contained 30 highly microsatellite instable (MSI-H) UTUC cases, including 9 MSI-H UTUCs with documented Lynch-associated carcinoma in family history [33].

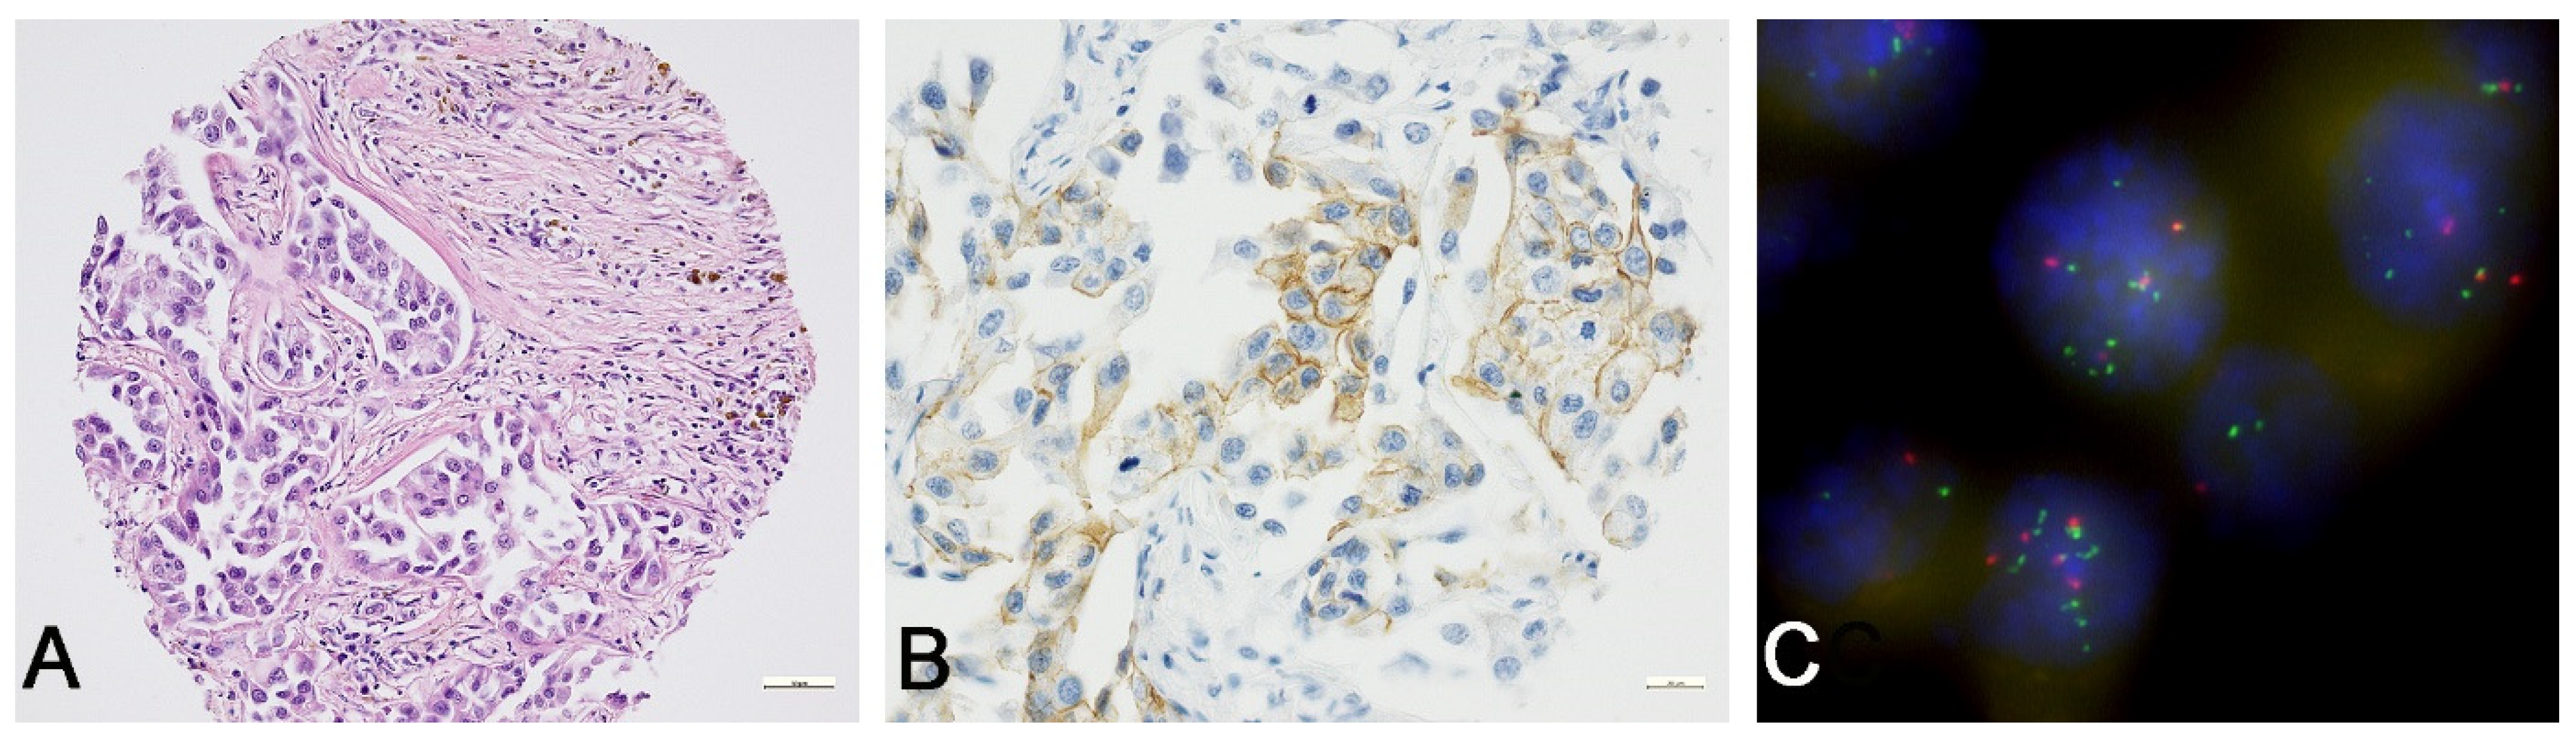
3.2. Morphological Evaluation (H&E Stains)

A total of 155 out of 160 UTUC cases on the TMAs were evaluable and contained >10% tumor tissue. Prior to TMA production, full tissue sections of each UC case were reevaluated with respect to the tumor growth pattern: 49 cases showed an (exophytic) papillary growth, 28 cases a solid tumor growth, 25 cases an inverted papillary or solid-papillary growth pattern, and 52 cases displayed a mixed tumor morphology, mostly with papillary and solid components. Two cases showed micropapillary and three cases sarcomatoid morphology. Tumor necrosis was observed in 63 cases. Major tumor-associated lymphofollicular inflammation was seen in 19 UTUCs.

3.3. Determination of ERBB2 Status

3.3.1. ERBB2 Immunoscoring

According to the recommendations of ERBB2 testing in GC, the scores of 1+, 2+, and 3+ were noted in 17.8%, 29.5%, and 12.3% of UTUCs, respectively (Table 2), mostly with incomplete basolateral membranous ERBB2 staining (Figure 1). Consequently, when compared to the results according to the guidelines of BC (Table 2), 49.3%, 3.4%, and 6.8% of cases displayed scores of 1+, 2+, and 3+, respectively.

3.3.2. ERBB2 FISH Analysis

In 17/160 UTUCs, no signals were detected, and therefore, these cases were not evaluable. In 15/143 cases (10.5%), an ERBB2 amplification was detected (Table 2), and another 23/143 (16.1%) UTUCs displayed an increase in the ERBB2 copy numbers. According to the more sensitive ERBB2 immunoscoring scheme for GC, four, five, seven, and six tumors with ERBB2 gain had ERBB2 scores of 0, 1+, 2+, or 3+, respectively, and zero, one, six, and seven tumors with ERBB2 amplification displayed ERBB2 scores of 0, 1+, 2+, or 3+, respectively (Figure 1).

3.3.3. Quality Parameters and Correlation Analyses

A comparison of the evaluation schemes with the ERBB2 amplification status determined by FISH as the gold standard resulted in the following quality features: ERBB2 immunoscoring according to the ASCO/CAP 2018 guidelines for ERBB2/HER2-testing in BC detected 4 true-positive, 111 true-negative, 9 false-positive, and 10 false-negative UTUCs (sensitivity = 30.8%, specificity = 91.7%, positive predictive value = 28.6%, negative predictive value = 92.5%). ERBB2 immunoscoring according to the ASCO/CAP 2017 guidelines for ERBB2/HER2 testing in GC detected 13 true-positive, 77 true-negative, 43 false-positive, and 1 false-negative UTUCs (sensitivity = 92.9%, specificity = 64.2%, positive predictive value = 23.2%, negative predictive value = 98.7%).
ERBB2 overexpression (scores of 2+ and 3+) according to the ASCO/CAP 2018 guidelines in BC was seen in zero, two, and thirteen UTUCs, with WHO grades of 1, 2, or 3, respectively. ERBB2 overexpression was only detected in 15 invasive UTUCs and not in any pTa tumors. An association between positive (score 2+ or 3+) ERBB2 expression according to the ASCO/CAP guidelines in BC and high grade (p = 0.012), and between ERBB2 positivity and the presence of an ERBB2 amplification or gain (p < 0.001), but not for growth pattern, necrosis, stage, and other clinicopathological parameters (p > 0.05) was noted (Table 3).
ERBB2 overexpression (scores of 2 + and 3+) according to the ASCO/CAP 2017 guidelines in GC was seen in 3, 22, and 36 UTUCs, with WHO grades of 1, 2, or 3, respectively. This difference did not reach the level of significance in Pearson’s chi-square test (p = 0.077). Similar to the correlation of expression and tumor grading, ERBB2 overexpression was detected in 39/61 advanced UTUCs staged 2–4, but only in 9 tumors staged 0 and in 13 tumors staged 1 (p > 0.359). Further correlation analyses demonstrated significant associations between ERBB2 positivity and tumor progression (p = 0.028), and the presence of an ERBB2 amplification (p < 0.001), but not for age, sex, growth pattern, necrosis, or other clinicopathological parameters, such as tumor stage, lymph node metastasis, distant metastasis, and lymphovascular or perineural invasion (p > 0.05) (Table 3).
Fisher’s test and Pearson’s chi-square test demonstrated associations between UTUCs with ERBB2 gain or amplification and grade (p < 0.001), invasion (pT1-4 versus pTa, p = 0.003), advanced stage (p = 0.0014), positive lymph node status (p = 0.005), lymphatic invasion (p = 0.005), perineural invasion (p = 0.005), positive resection margins (residual status; p = 0.006), necrosis (p = 0.048), and positive ERBB2 immunoreaction, according to both evaluation schemes (both p < 0.001). A positive but not significant relationship may have been indicated between UTUCs with ERBB2 gain or amplification and tumor morphology (p = 0.057) and distant metastasis (p = 0. 064). UTUCs with ERBB2 gains or amplification showed a papillary, solid-papillary, solid, or mixed-growth pattern, and only one of two ERBB2-amplified cases exhibited a micropapillary pattern. Further statistical analysis, including age, sex, and additional tumor properties revealed no significant differences (p > 0.05) (Table 3).

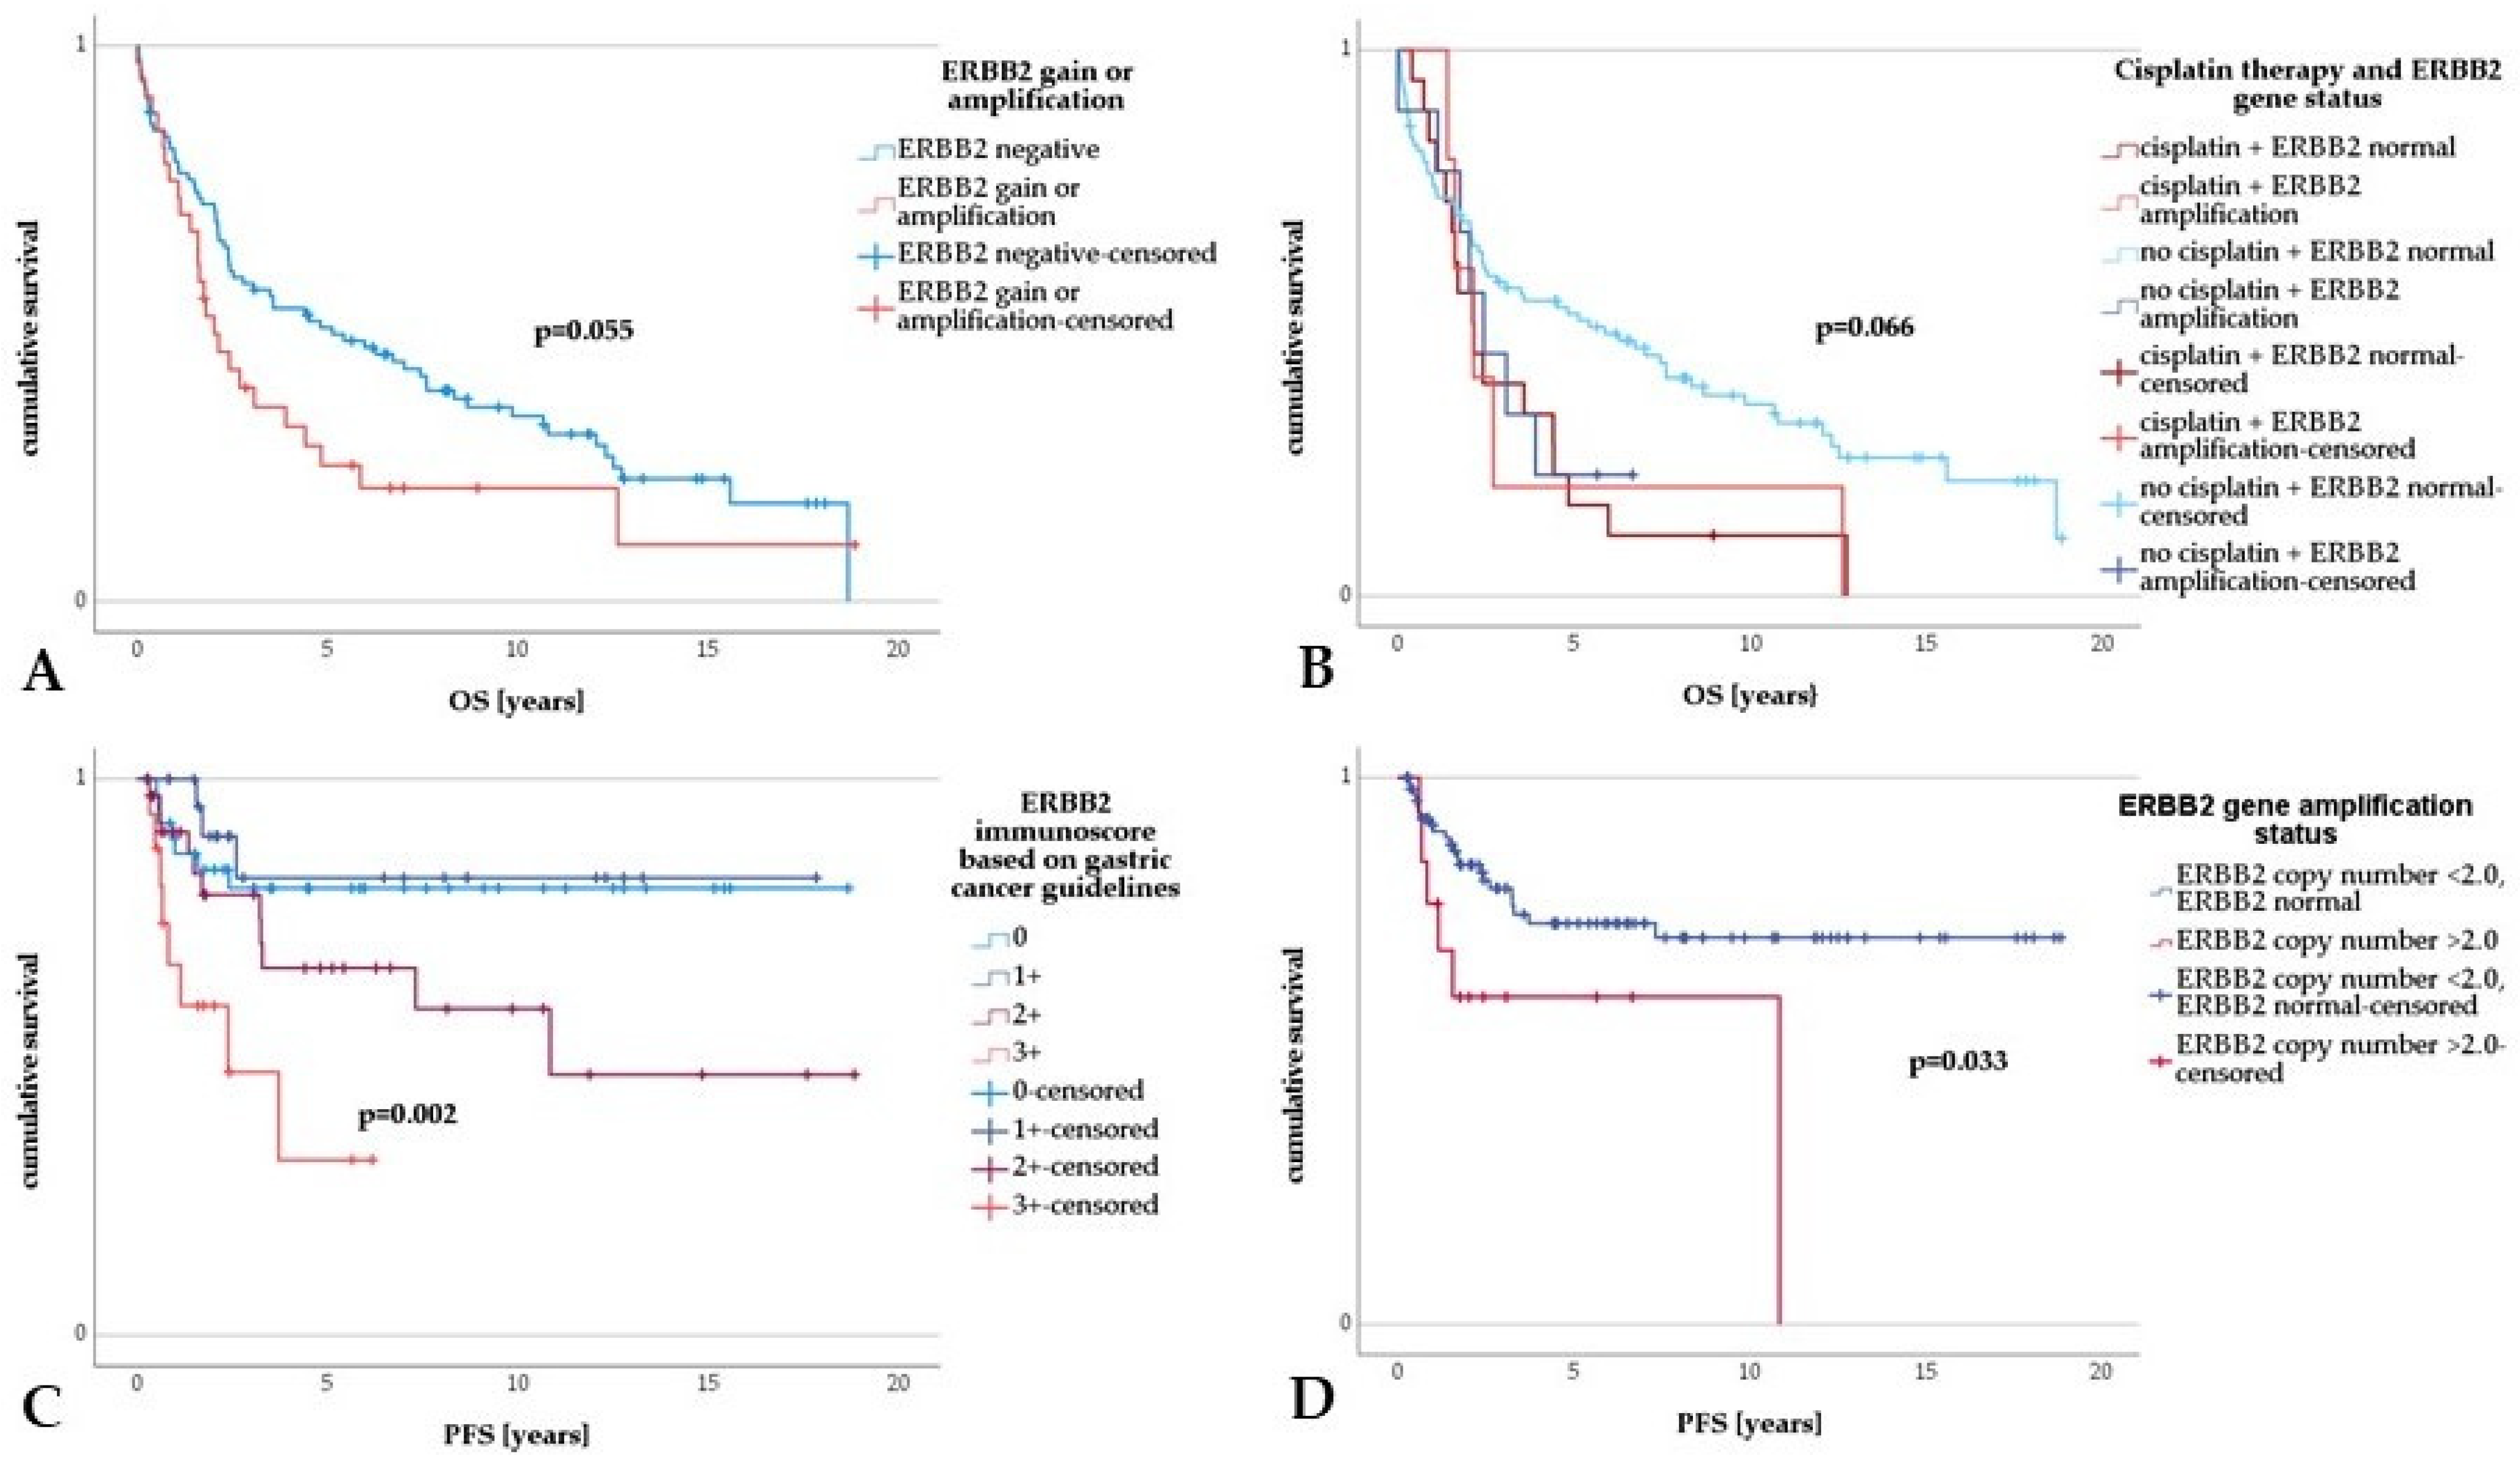
3.4. Survival Analysis

Cox regression analysis illustrated no statistical differences in the OS in cases of ERBB2 protein expression (scores of 2+ or 3+) versus negative ERBB2 protein expression (p > 0.05). An overt trend towards shorter OS in UTUCs with ERBB2 amplification or gain (p = 0.057) was seen (Table 4, univariable Cox regression; Figure 2A). A significantly higher OS was noted in UTUC patients with ERBB2-normal UTUCs who had not received chemotherapy (p = 0.006; Table 4, univariable Cox regression, Figure 2B). Overall, UTUC patients who received platinum-based chemotherapy showed significantly poorer OS, which persisted in multivariable analysis (p = 0.005; Table 4 multivariable Cox regression). As for the clinicopathological parameters, G3 tumors showed a lower OS than G1 tumors (p = 0.001; Table 4, univariable analysis). In comparison to pTa UTUCs, in high-stage UTUCs (pT3 or pT4), a significantly lower OS was seen (p < 0.001; Table 4, univariable analysis). There was also an inferior OS in patients with progressive disease, positive nodal status, distant metastasis, lymphatic or venous invasion, perineural invasion, positive resection margins, necrosis, and sarcomatous growth pattern (p = 0.008, p < 0.001, p < 0.001, p < 0.001, p < 0.001, p < 0.001, p < 0.001, p = 0.004, p < 0.001, respectively; Table 4, univariable analysis).
Concerning PFS, univariable Cox regression analysis revealed a significantly lower PFS in cases with an ERBB2 immunoscore of 2+ or 3+ (p = 0.003; Table 5, univariable Cox regression, Figure 2C), a result which did not persist in the multiple regression approach (Table 5, right panel). UTUCs with ERBB2 amplification showed a significantly shorter PFS (p = 0.040; Table 5, univariable Cox regression), a result that was also implied in the multivariable analysis. Irrespective of their ERBB2 status, patients with UTUC treated with platin showed a significantly lower PFS than patients with UTUC who had not received any platin-based therapy (p < 0.001, 95% CI = 3.865–16.851, HR = 8.192; Table 5, univariable Cox regression, Figure 2D), a result which persisted in the multiple regression approach (Table 5, right panel). We re-examined this unexpected result in the number and average age homogenized comparison collectives with similar results. As for the clinicopathological parameters, a lower PFS was seen in tumors with a sarcomatoid growth pattern (p = 0.004; Table 5, left panel), in patients with high-stage UTUC (pT4 versus pTa, p = 0.006; Table 5, univariable analysis), in patients with lymph node metastasis (p = 0.015; Table 5, left panel) or distant metastasis (p = 0.001; Table 5, left panel), and in cases with positive resection margins (R1 or R2, p = 0.018; Table 5, univariable analysis).

4. Discussion

Identifying prognostic and predictive biomarkers in UTUC is crucial for prognostication and therapy decisions for many advanced UTUCs. As an effectual example for urologists, the detection of ERBB2 overexpression and amplification in BC patients is closely related to a poor prognosis, but numerous patients with ERBB2-positive BC in metastatic and adjuvant settings have benefitted from ERBB2-targeted therapy [37,38]. However, unlike in BCs, the prognostic and predictive value of ERBB2 overexpression and ERBB2 amplification in UTUCs remains uncertain.
In the present study, according to the screening guidelines for GC, a relatively high number of ERBB2-overexpressing UTUCs, with 29.5% scoring 2+ and 12.3% scoring 3+, were detected, in contrast to the relatively low rate of 10.5% of ERBB2-amplified UTUCs in the cohort. In particular, these findings agree with the results reported by Aumayer et al., Langner et al., Verhasselt-Crinquette et al., and Yorozu et al., showing ERBB2 overexpression in 16.9–33.3% of UTUCs and ERBB2 amplification in 8–13.5% of cases [17,22,26,27]. Only the study of Sasaki et al. shows equal frequencies of ERBB2-positive and ERBB2-amplified cases of 18.1% each [23]. Established and validated evaluation schemes were used in all of the studies mentioned. Some other studies have been based solely on immunohistochemical data; the frequencies of ERBB2 overexpression have ranged from 8.4–74% [18,19,20,21,24,25]. Except for in the work of Soria et al., specially designed evaluation systems for ERBB2 immunoscoring have been used [18,19,20,21,24,25].
The comparison of the data illustrates the following problems. First, the frequency of ERBB2 overexpression varies widely and reflects the fact that, among other things, different methods, antibodies, and evaluation schemes were used [28]. As for Ménard et al., the literature shows large variation in the ERBB2 levels within one tumor entity, most probably due to the lack of standardized methods for assessing the ERBB2 expression status [11]. Second, according to the guidelines for BC, ERBB2 immunoscoring provides lower frequencies for scores of 2+ and 3+ than the validated scoring system for adenocarcinomas of the stomach or gastroesophageal junction [21]. Similar to the work of Kim et al., the present study illustrates that, as per the recommendations of ERBB2-testing in GC, the frequencies of the scores of 2+ and 3+ are above the ERBB2 values according to the guidelines of BC [21]. The current data show that comparatively few ERBB2 cases scoring 2+ and 3+ (3.4% and 6.8%, respectively) were detected when applying the guidelines for BC. By FISH analysis, 15 (10.5%) UTUCs, with an ERBB2 copy number of ≥2 were found, which, with the exception of one case, had been detected by the ERBB2 immunoscoring method for GC. ERBB2 immunoscoring according to the guidelines for BC failed to detect 10/15 UTUCs with ERBB2 amplification. Likewise, Sasaki et al. reported that 38.7% of the ERBB2-amplified cases displayed only an ERBB2 immunoscore of 0 or 1+ [23]. Third, evidence of ERBB2 amplification, which is decisive for a possible therapy option, has only been demonstrated in a small number of UTUCs within a range of 8–18.1% [17,22,26,27]. Thus, it becomes clear that the immunohistochemical overexpression of ERBB2 has reasons additional to the sole amplification of the gene. Furthermore, in other tumor types, the frequency of ERBB2 overexpression has differed in the literature and has often been higher than the gene amplification rate, suggesting that ERBB2 overexpression is due to gene deregulation rather than amplification [11]. This also means that the sole use of immunohistochemistry, even when carrying out validated immunohistochemical tests and evaluation schemes, does not allow for the reliable detection of ERBB2-amplified UTUCs for which targeted therapy would be a potential option. In order to identify ERBB2-amplified cases as reliably as possible, we propose a simultaneous immunohistochemical and cytogenetic approach: the use of the ASCO/ACP evaluation mode for ERBB2 immunoscoring in GC, since the 2+ UTUC cases in particular often only show incomplete basolateral staining, combined with ERBB2 FISH or CISH analysis.
ERBB2/HER2 testing guidelines for BC were developed in 2007 by the ASCO/CAP in an attempt to reduce interlaboratory test variability [39]. An algorithm defining positive, equivocal, and negative values for both ERBB2 protein expression and ERBB2 gene amplification was recommended. A validated surrogate marker for the presence of an ERBB2 amplification was the strong complete membrane staining of the ERBB2 protein in ≥30% of invasive BC cells. Using an in situ method, the presence of ERBB2 amplification was defined by an ERBB2/CEN17 ratio of >2.2 [39]. Equivocal results in immunohistochemistry (score 2+) as well as in the FISH analysis required additional testing [39]. The ASCO/CAP-recommended ERBB2/HER2 testing criteria for BC was updated, and a threshold of 10% and an ERBB2/CEN17 ratio of ≥2.0 were introduced in 2013 to ensure that the appropriate patients received the ERBB2-targeted drug [40]. Additionally, in 2008, ERBB2 testing guidelines in advanced esophago-gastric junction and gastric adenocarcinomas were established to identify suitable patients for trastuzumab therapy [15]. However, validated methods and scoring systems for the determination of ERBB2 amplification status remain widely unavailable for UTUC. However, despite using an established test system, as for BC or GC, interobserver variability can also contribute to the variability in the ERBB2 status interpretation. This is an important point that must be considered regarding the limitations of our study. The reasons for the variations in ERBB2 overexpression rates are multifactorial. In addition, tumor heterogeneity may play a role as a cause for imprecise ERBB2 analysis. Several factors could lead to the discrepancy of ERBB2 overexpression rates in UTUCs, including technical limitations in immunohistochemistry, the use of subjective scoring systems, and uncertain cut-off-values. Especially in retrospective studies with FFPE material, the problem of tissue preservation with gradual protein degradation is added [41]. Another limitation is the low number of ERBB2-amplified UTUCs in this cohort. Despite the limitations of our study, it is obvious that tumors with ERBB2 amplification or gain represent a subgroup of UTUCs that could probably benefit from ERBB2-targeted therapy. Prospective studies considering this question should follow this research.
According to the EAU Guidelines for UTUC, the tumor stage and grade are the primary recognized prognostic factors [1]. Lymph node metastasis, lymphovascular invasion, extensive necrosis (>10% of the tumor area), and the occurrence of a sessile growth pattern are independent predictors of worse outcomes [1]. In addition, different molecular biomarkers, such as microsatellite instability, E-cadherin, and a high neutrophil-to-lymphocyte ratio have been tested in the past and have shown prognostic impact, but none of these markers have yet met the criteria to support their introduction in daily clinical decision-making [1,42].
A comparison of the two evaluation methods according to the ASCO/CAP guidelines for BC and GC showed that the evaluation scheme according to the guidelines for the GC was significantly more sensitive in the detection of the ERBB2-amplified UTUCs. When using the guidelines for BC, 10/14 amplified cases were not recognized. There was no ERBB2 overexpression in non-invasive UCs and a significant relationship to high-grade UTUCs when evaluated according to BC guidelines. Similarly, using the guidelines for GC, ERBB2 overexpression was more likely to be found in high-grade tumors. In particular, in the more sensitive test procedure for GC, the correlation analyses showed associations between ERBB2 overexpression, tumor progression, high tumor grade, and the occurrence of an ERBB2 amplification or gain. Moreover, in UTUCs with ERBB2 amplification or gain, significant associations with higher tumor grade, invasion, advanced stage, distant metastasis, positive lymph node status, and positive ERBB2 immunoreaction according to both evaluation schemes were demonstrated. Furthermore, significant relationships were found between UTUCs with ERBB2 gain or amplification and the presence of lymphovascular invasion, perineural invasion, positive resection margins, and necrosis. With regard to the results of the survival analyses, it should be emphasized in particular that Cox regression analysis revealed a significantly lower PFS in cases with ERBB2 immunoscores of 2+ or 3+ according to the ASCO/CAP guidelines for GC. UTUCs with ERBB2 amplification showed a significantly shorter PFS in the multivariable Cox regression analysis. Irrespective of their ERBB2 status, patients with UTUC treated with platin showed a significantly lower PFS than UTUC patients who had not received any platin-based therapy, a result that persisted in the multiple regression approach. Additionally, UTUC patients with a normal ERBB2 gene status who had not received platin-based therapy showed a significantly longer OS. Compared to recent results, it is indeed unusual that patients treated with platin displayed a significantly shorter PFS than patients with UTUC who had not received any platin-based therapy because the data of the POUT trial clearly showed that disease-free survival was significantly longer in the therapy group [9]. Perhaps there was selection bias in the present retrospective observational study because, possibly, the individuals who received (needed) this therapy had a worse prognosis per se. Additionally, in total, only 24 patients with metastatic tumor disease were shown to have received platinum-containing therapy in the cohort of 160 patients studied. Thus, this is a very small cohort of this monocentric retrospective study that received platinum therapy. This cohort had a lower mean age (66 years versus 70 years) compared to the untreated cohort, so for this reason alone, the two collectives are not homogeneous in comparison. In addition, it is not known whether there were other previous oncologic therapies or recurrences that might have caused a poorer response to the platinum therapy that was given. However, further survival analysis after the homogenization of both collectives showed that the platinum-treated cohort had a highly significant shorter PFS compared to the untreated group, so the data appear valid despite the small case number. This result would definitely need to be validated in a larger multicenter and prospective study. In the literature, several studies have shown that ERBB2 overexpression and ERBB2 amplification are significantly associated with features of biologically aggressive tumors and poor prognoses. Similarly to the present study, Soria et al. demonstrated that ERBB2 overexpression was associated with pathologic characteristics, such as a more advanced T stage, high-grade tumors, and the presence of lymph node metastasis, lymphovascular invasion, and tumor necrosis [24]. Furthermore, it was shown that ERBB2 overexpression is a marker for the increased risk of disease progression [24]. In addition, compared to the results presented, patients with ERBB2 overexpression had an increased risk of death, particularly of cancer-specific death [24]. Aumayr et al. were able to show in a similar way that ERBB2 overexpression in UTUC was associated with higher-grade tumors, non-organ-confined carcinomas, and ERBB2 amplification [17]. The occurrence of ERBB2 amplification was also associated with a higher tumor grade and lymph node metastasis [17]. According to the data presented, Galanakis et al. and Imai et al. have also shown that ERBB2 overexpression is associated with a significantly shorter time interval to recurrence [19,20]. Tsai et al. showed that the incidence of subsequent tumor recurrence in the urinary bladder correlated significantly with ureteral tumor involvement and ERBB2 expression [25]. In addition, Sasaki et al. reported that ERBB2 amplification in UTUC was significantly associated with shorter recurrence time in the urinary bladder after nephroureterectomy [23]. Verhasselt-Crinquette et al. reported a significant association only with the nodal stage but not with outcomes [26]. Further studies have also shown that both ERBB2 overexpression and the occurrence of ERBB2 amplification were linked to UTUCs with adverse biological characteristics and an adverse outcome [18,21,22,27]. These results imply that ERBB2-overexpressing or ERBB2-amplified UTUCs represent a distinct molecular subset. Previous attempts have been made to establish a molecular classification of UCs, and a consensus classification for muscle-invasive UBC has recently been published [43]. The majority of ERBB2-amplified cases are found in the group of so-called “luminal unstable” UCs. For UTUCs, there are still few data available.
Based on the POUT trial, adjuvant platin therapy within 90 days after nephroureterectomy was recently included in the guidelines for the treatment of UTUC in Germany [9]. Further, due to the lack of relevant therapy studies, targeted therapy has not yet been considered in the standard of care guidelines for UTUC patients [1]. However, only a few patients are eligible for platin after radical nephroureterectomy, mainly due to decreased renal function [44]. For these reasons, new, effective, and less-toxic therapies are needed. Targeted therapies against ERBB2 are currently used in the treatments of BC and GC and could also represent a new and effective option for UTUCs. Previous therapy studies with the ERBB2-specific antibody trastuzumab (Herceptin®) in the UC of the bladder did not provide satisfactory results, probably because of insufficient patient selection and the low frequency of UC carrying an ERBB2 amplification [45]. Similar to bladder UC, the frequency of ERBB2 amplifications in UTUCs is low, and further prospective therapy studies need to address this issue. This also means careful patient selection and the use of simultaneous ERBB2 testing according to validated guidelines using both immunoscoring and in situ hybridization.

5. Conclusions

The present study shows relatively high levels of ERBB2 expression, consistent with the literature, but only a minority of UTUCs harbor ERBB2 amplification. However, these cases are usually aggressive tumors that are unlikely to benefit from standard adjuvant chemotherapy. The discrepancy between immunohistochemical and cytogenetic findings must be taken into account by a simultaneous procedure using a structured evaluation mode of immunohistochemistry combined with FISH or CISH analysis. With this procedure, smaller biopsies from the upper tract can also be examined so that the basis for a possible individual adjuvant therapy decision could be laid and a possible targeted therapy option could be offered to patients with advanced tumors.

Author Contributions

Conceptualization, A.Z. and B.S.; methodology, A.Z., S.K., M.M. (Melanie Mosig) and B.S.; validation, S.K. and H.R; formal analysis, A.Z., M.M. (Melanie Mosig) and H.R.; investigation, A.Z., M.M. (Melanie Mosig) and B.S.; resources, H.Z., A.E., O.W.H. and M.M. (Matthias Maruschke); data curation, A.Z.; writing—original draft preparation, A.Z., S.K. and B.S.; writing—review and editing, A.Z., S.K., M.M. (Melanie Mosig), H.Z., O.W.H., M.M. (Matthias Maruschke), A.E. and B.S.; visualization, A.Z. and S.K.; supervision, A.Z.; project administration, A.Z. and B.S. All authors have read and agreed to the published version of the manuscript.

Funding

The authors did not receive any specific grants from funding agencies in the public, commercial, or non-profit sectors.

Institutional Review Board Statement

The study was performed in accordance with the declaration of Helsinki and German laws concerning data safety and approved by the Ethics Committee of the University of Rostock (Reference number: A2016-0015; date of approval: 27 January 2016).

Informed Consent Statement

Written consent was obtained from all patients prior to surgery.

Data Availability Statement

The original data will be provided upon request.

Conflicts of Interest

The authors declare that they have no conflict of interest.

References

  1. Rouprêt, M.; Babjuk, M.; Burger, M.; Capoun, O.; Cohen, D.; Compérat, E.M.; Cowan, N.C.; Dominguez-Escrig, J.L.; Gontero, P.; Hugh Mostafid, A.; et al. European Association of Urology Guidelines on Upper Urinary Tract Urothelial Carcinoma: 2020 Update. Eur. Urol. 2020, 79, 62–79. [Google Scholar] [CrossRef]
  2. Siegel, R.L.; Miller, K.D.; Jemal, A. Cancer statistics, 2019. CA Cancer J. Clin. 2019, 69, 7–34. [Google Scholar] [CrossRef]
  3. Rouprêt, M.; Babjuk, M.; Compérat, E.; Zigeuner, R.; Sylvester, R.J.; Burger, M.; Cowan, N.C.; Böhle, A.; van Rhijn, B.W.G.; Kaasinen, E.; et al. European Association of Urology Guidelines on Upper Urinary Tract Urothelial Cell Carcinoma: 2015 Update. Eur. Urol. 2015, 68, 868–879. [Google Scholar] [CrossRef] [PubMed]
  4. Olgac, S.; Mazumdar, M.; Dalbagni, G.; Reuter, V.E. Urothelial carcinoma of the renal pelvis: A clinicopathologic study of 130 cases. Am. J. Surg. Pathol. 2004, 28, 1545–1552. [Google Scholar] [CrossRef]
  5. Maruschke, M.; Kram, W.; Zimpfer, A.; Kundt, G.; Hakenberg, O.W. Upper Urinary Tract Tumors: Which Diagnostic Methods Are Needed? Urol. Int. 2017, 98, 304–311. [Google Scholar] [CrossRef]
  6. Margulis, V.; Shariat, S.F.; Matin, S.F.; Kamat, A.M.; Zigeuner, R.; Kikuchi, E.; Lotan, Y.; Weizer, A.; Raman, J.D.; Wood, C.G. Outcomes of Radical Nephroureterectomy: A Series from the Upper Tract Urothelial Carcinoma Collaboration. Cancer 2009, 115, 1224–1233. [Google Scholar] [CrossRef]
  7. Abouassaly, R.; Alibhai, S.M.H.; Shah, N.; Timilshina, N.; Fleshner, N.; Finelli, A. Troubling outcomes from population-level analysis of surgery for upper tract urothelial carcinoma. Urology 2010, 76, 895–901. [Google Scholar] [CrossRef] [PubMed]
  8. Jeldres, C.; Sun, M.; Isbarn, H.; Lughezzani, G.; Budäus, L.; Alasker, A.; Shariat, S.F.; Lattouf, J.-B.; Widmer, H.; Pharand, D.; et al. A population-based assessment of perioperative mortality after nephroureterectomy for upper-tract urothelial carcinoma. Urology 2010, 75, 315–320. [Google Scholar] [CrossRef]
  9. Birtle, A.; Johnson, M.; Chester, J.; Jones, R.; Dolling, D.; Bryan, R.T.; Harris, C.; Winterbottom, A.; Blacker, A.; Catto, J.W.F.; et al. Adjuvant chemotherapy in upper tract urothelial carcinoma (the POUT trial): A phase 3, open-label, randomised controlled trial. Lancet 2020, 395, 1268–1277. [Google Scholar] [CrossRef]
  10. Moasser, M.M. The oncogene HER2: Its signaling and transforming functions and its role in human cancer pathogenesis. Oncogene 2007, 26, 6469–6487. [Google Scholar] [CrossRef] [PubMed]
  11. Ménard, S.; Pupa, S.M.; Campiglio, M.; Tagliabue, E. Biologic and therapeutic role of HER2 in cancer. Oncogene 2003, 22, 6570–6578. [Google Scholar] [CrossRef]
  12. Torres-Jiménez, J.; Esteban-Villarrubia, J.; Ferreiro-Monteagudo, R. Precision Medicine in Metastatic Colorectal Cancer: Targeting ERBB2 (HER-2) Oncogene. Cancers 2022, 14, 3718. [Google Scholar] [CrossRef] [PubMed]
  13. Yan, M.; Schwaederle, M.; Arguello, D.; Millis, S.Z.; Gatalica, Z.; Kurzrock, R. HER2 expression status in diverse cancers: Review of results from 37,992 patients. Cancer Metastasis Rev. 2015, 34, 157–164. [Google Scholar] [CrossRef]
  14. Ursini-Siegel, J.; Schade, B.; Cardiff, R.D.; Muller, W.J. Insights from transgenic mouse models of ERBB2-induced breast cancer. Nat. Rev. Cancer 2007, 7, 389–397. [Google Scholar] [CrossRef] [PubMed]
  15. Bang, Y.-J.; van Cutsem, E.; Feyereislova, A.; Chung, H.C.; Shen, L.; Sawaki, A.; Lordick, F.; Ohtsu, A.; Omuro, Y.; Satoh, T.; et al. Trastuzumab in combination with chemotherapy versus chemotherapy alone for treatment of HER2-positive advanced gastric or gastro-oesophageal junction cancer (ToGA): A phase 3, open-label, randomised controlled trial. Lancet 2010, 376, 687–697. [Google Scholar] [CrossRef]
  16. Audenet, F.; Isharwal, S.; Cha, E.K.; Donoghue, M.T.A.; Drill, E.N.; Ostrovnaya, I.; Pietzak, E.J.; Sfakianos, J.P.; Bagrodia, A.; Murugan, P.; et al. Clonal Relatedness and Mutational Differences between Upper Tract and Bladder Urothelial Carcinoma. Clin. Cancer Res. 2019, 25, 967–976. [Google Scholar] [CrossRef]
  17. Aumayr, K.; Klatte, T.; Neudert, B.; Birner, P.; Shariat, S.; Schmidinger, M.; Susani, M.; Haitel, A. HER2 and TOP2A Gene Amplification and Protein Expression in Upper Tract Urothelial Carcinomas. Pathol. Oncol. Res. 2018, 24, 575–581. [Google Scholar] [CrossRef]
  18. Ehsani, L.; Osunkoya, A.O. Human epidermal growth factor receptor 2 expression in urothelial carcinoma of the renal pelvis: Correlation with clinicopathologic parameters. Int. J. Clin. Exp. Pathol. 2014, 7, 2544–2550. [Google Scholar] [PubMed]
  19. Galanakis, I.; Spyropoulos, E.; Gkialas, I.; Nomikos, A.; Souka, E.; Mitropoulos, D. ErbB2, ErbB3 and ErbB4 expression in urothelial tumors of the upper urinary tract and their prognostic significance. J. BUON 2013, 18, 653–659. [Google Scholar] [PubMed]
  20. Imai, T.; Kimura, M.; Takeda, M.; Tomita, Y. Significance of epidermal growth factor receptor and c-erbB-2 protein expression in transitional cell cancer of the upper urinary tract for tumour recurrence at the urinary bladder. Br. J. Cancer 1995, 71, 69–72. [Google Scholar] [CrossRef]
  21. Kim, G.; Chung, Y.R.; Kim, B.; Song, B.; Moon, K.C. Comparison of the FDA and ASCO/CAP Criteria for HER2 Immunohistochemistry in Upper Urinary Tract Urothelial Carcinoma. J. Pathol. Transl. Med. 2016, 50, 436–441. [Google Scholar] [CrossRef]
  22. Langner, C.; Gross, C.; Rehak, P.; Ratschek, M.; Rüschoff, J.; Zigeuner, R. HER2 protein overexpression and gene amplification in upper urinary tract transitional cell carcinoma: Systematic analysis applying tissue microarray technique. Urology 2005, 65, 176–180. [Google Scholar] [CrossRef]
  23. Sasaki, Y.; Sasaki, T.; Kawai, T.; Morikawa, T.; Matsusaka, K.; Kunita, A.; Kume, H.; Aoki, I.; Homma, Y.; Fukayama, M. HER2 protein overexpression and gene amplification in upper urinary tract urothelial carcinoma-an analysis of 171 patients. Int. J. Clin. Exp. Pathol. 2014, 7, 699–708. [Google Scholar]
  24. Soria, F.; Moschini, M.; Haitel, A.; Wirth, G.J.; Karam, J.A.; Wood, C.G.; Rouprêt, M.; Margulis, V.; Karakiewicz, P.I.; Briganti, A.; et al. HER2 overexpression is associated with worse outcomes in patients with upper tract urothelial carcinoma (UTUC). World J. Urol. 2017, 35, 251–259. [Google Scholar] [CrossRef] [PubMed]
  25. Tsai, Y.-S.; Tzai, T.-S.; Chow, N.-H.; Wu, C.-L. Frequency and clinicopathologic correlates of ErbB1, ErbB2, and ErbB3 immunoreactivity in urothelial tumors of upper urinary tract. Urology 2005, 66, 1197–1202. [Google Scholar] [CrossRef] [PubMed]
  26. Vershasselt-Crinquette, M.; Colin, P.; Ouzzane, A.; Gnemmi, V.; Robin, Y.-M.; Aubert, S.; Villers, A.; Leroy, X. Assessment of human epidermal growth factor receptor 2 status in urothelial carcinoma of the upper urinary tract: A study using dual-color in situ hybridization and immunohistochemistry. Appl. Immunohistochem. Mol. Morphol. 2012, 20, 363–366. [Google Scholar] [CrossRef] [PubMed]
  27. Yorozu, T.; Sato, S.; Kimura, T.; Iwatani, K.; Onuma, H.; Yanagisawa, T.; Miki, J.; Egawa, S.; Ikegami, M.; Takahashi, H. HER2 Status in Molecular Subtypes of Urothelial Carcinoma of the Renal Pelvis and Ureter. Clin. Genitourin. Cancer 2020, 18, e443–e449. [Google Scholar] [CrossRef]
  28. Marín, A.P.; Arranz, E.E.; Sánchez, A.R.; Auñón, P.Z.; Barón, M.G. Role of anti-Her-2 therapy in bladder carcinoma. J. Cancer Res. Clin. Oncol. 2010, 136, 1915–1920. [Google Scholar] [CrossRef]
  29. Wolff, A.C.; Hammond, M.E.H.; Allison, K.H.; Harvey, B.E.; Mangu, P.B.; Bartlett, J.M.S.; Bilous, M.; Ellis, I.O.; Fitzgibbons, P.; Hanna, W.; et al. Human Epidermal Growth Factor Receptor 2 Testing in Breast Cancer: American Society of Clinical Oncology/College of American Pathologists Clinical Practice Guideline Focused Update. Arch. Pathol. Lab. Med. 2018, 142, 1364–1382. [Google Scholar] [CrossRef]
  30. Bartley, A.N.; Washington, M.K.; Colasacco, C.; Ventura, C.B.; Ismaila, N.; Benson, A.B.; Carrato, A.; Gulley, M.L.; Jain, D.; Kakar, S.; et al. HER2 Testing and Clinical Decision Making in Gastroesophageal Adenocarcinoma: Guideline From the College of American Pathologists, American Society for Clinical Pathology, and the American Society of Clinical Oncology. J. Clin. Oncol. 2017, 35, 446–464. [Google Scholar] [CrossRef]
  31. WHO Classification of Tumours, 5th ed.; Amin, M.B. (Ed.) International Agency for Research on Cancer: Lyon, France, 2022; ISBN 9789283245124. [Google Scholar]
  32. Brierley, J.D.; Gospodarowicz, M.K.; Wittekind, C. TNM Classification of Malignant Tumours, 8th ed.; John Wiley & Sons, Inc.: Chichester, UK; West Sussex, UK; Hoboken, NJ, USA, 2017; ISBN 9781119263579. [Google Scholar]
  33. Kononen, J.; Bubendorf, L.; Kallioniemi, A.; Bärlund, M.; Schraml, P.; Leighton, S.; Torhorst, J.; Mihatsch, M.J.; Sauter, G.; Kallioniemi, O.P. Tissue microarrays for high-throughput molecular profiling of tumor specimens. Nat. Med. 1998, 4, 844–847. [Google Scholar] [CrossRef]
  34. Schneider, B.; Glass, Ä.; Jagdmann, S.; Hühns, M.; Claus, J.; Zettl, H.; Dräger, D.-L.; Maruschke, M.; Hakenberg, O.W.; Erbersdobler, A.; et al. Loss of Mismatch-repair Protein Expression and Microsatellite Instability in Upper Tract Urothelial Carcinoma and Clinicopathologic Implications. Clin. Genitourin. Cancer 2020, 18, E563–E572. [Google Scholar] [CrossRef]
  35. Sassen, A.; Rochon, J.; Wild, P.; Hartmann, A.; Hofstaedter, F.; Schwarz, S.; Brockhoff, G. Cytogenetic analysis of HER1/EGFR, HER2, HER3 and HER4 in 278 breast cancer patients. Breast Cancer Res. 2008, 10, R2. [Google Scholar] [CrossRef] [PubMed]
  36. Lenhard, W.; Lenhard, A. Berechnung von Testgütekriterien für Screeningverfahren. Available online: http://www.psychometrica.de/testkennwerte.html (accessed on 23 August 2022).
  37. Choi, Y.H.; Ahn, J.H.; Kim, S.-B.; Jung, K.-H.; Gong, G.-Y.; Kim, M.-J.; Son, B.-H.; Ahn, S.-H.; Kim, W.K. Tissue microarray-based study of patients with lymph node-negative breast cancer shows that HER2/neu overexpression is an important predictive marker of poor prognosis. Ann. Oncol. 2009, 20, 1337–1343. [Google Scholar] [CrossRef]
  38. O’Sullivan, C.C.; Swain, S.M. Pertuzumab: Evolving therapeutic strategies in the management of HER2-overexpressing breast cancer. Expert Opin. Biol. Ther. 2013, 13, 779–790. [Google Scholar] [CrossRef]
  39. Wolff, A.C.; Hammond, M.E.H.; Schwartz, J.N.; Hagerty, K.L.; Allred, D.C.; Cote, R.J.; Dowsett, M.; Fitzgibbons, P.L.; Hanna, W.M.; Langer, A.; et al. American Society of Clinical Oncology/College of American Pathologists guideline recommendations for human epidermal growth factor receptor 2 testing in breast cancer. J. Clin. Oncol. 2007, 25, 118–145. [Google Scholar] [CrossRef]
  40. Wolff, A.C.; Hammond, M.E.H.; Hicks, D.G.; Dowsett, M.; McShane, L.M.; Allison, K.H.; Allred, D.C.; Bartlett, J.M.S.; Bilous, M.; Fitzgibbons, P.; et al. Recommendations for human epidermal growth factor receptor 2 testing in breast cancer: American Society of Clinical Oncology/College of American Pathologists clinical practice guideline update. J. Clin. Oncol. 2013, 31, 3997–4013. [Google Scholar] [CrossRef]
  41. Zhao, J.; Xu, W.; Zhang, Z.; Song, R.; Zeng, S.; Sun, Y.; Xu, C. Prognostic role of HER2 expression in bladder cancer: A systematic review and meta-analysis. Int. Urol. Nephrol. 2015, 47, 87–94. [Google Scholar] [CrossRef] [PubMed]
  42. Marchioni, M.; Cindolo, L.; Autorino, R.; Primiceri, G.; Arcaniolo, D.; Sio, M.D.; Schips, L. High Neutrophil-to-lymphocyte Ratio as Prognostic Factor in Patients Affected by Upper Tract Urothelial Cancer: A Systematic Review and Meta-analysis. Clin. Genitourin. Cancer 2017, 15, 343–349. [Google Scholar] [CrossRef]
  43. Kamoun, A.; Reyniès, A.D.; Allory, Y.; Sjödahl, G.; Robertson, A.G.; Seiler, R.; Hoadley, K.A.; Groeneveld, C.S.; Al-Ahmadie, H.; Choi, W.; et al. A Consensus Molecular Classification of Muscle-invasive Bladder Cancer. Eur. Urol. 2020, 77, 420–433. [Google Scholar] [CrossRef] [PubMed]
  44. Xylinas, E.; Rink, M.; Margulis, V.; Clozel, T.; Lee, R.K.; Comploj, E.; Novara, G.; Raman, J.D.; Lotan, Y.; Weizer, A.; et al. Impact of renal function on eligibility for chemotherapy and survival in patients who have undergone radical nephro-ureterectomy. BJU Int. 2013, 112, 453–461. [Google Scholar] [CrossRef] [PubMed]
  45. Oudard, S.; Culine, S.; Vano, Y.; Goldwasser, F.; Théodore, C.; Nguyen, T.; Voog, E.; Banu, E.; Vieillefond, A.; Priou, F.; et al. Multicentre randomised phase II trial of gemcitabine+platinum, with or without trastuzumab, in advanced or metastatic urothelial carcinoma overexpressing Her2. Eur. J. Cancer 2015, 51, 45–54. [Google Scholar] [CrossRef] [PubMed]
Figure 1. ERBB2 protein expression and ERBB2 amplification in upper tract urothelial carcinoma. (A) Detail of solid and papillary high-grade (G3) UTUC (20×, hematoxylin and eosin). (B) In the same case, weak to moderate incomplete ERBB2 staining in >10% of tumor cells was seen (ERBB2/HER2 immunoscore of 2+ in accordance with ASCO/CAP 2017 guidelines for ERBB2/HER2 testing in GC). The heterogeneity of ERBB2 staining is illustrated (ERBB2 immunohistochemistry/DAKO, 40×). (C) FISH analysis revealed a low ERBB2 amplification rate with an ERBB2/CEN17 ratio of 2.55 and an average ERBB2 copy number of 6.45 (100×).
Cancers 15 02414 g001
Figure 2. Survival analysis in upper tract urothelial carcinoma. (A) Upper tract urothelial carcinoma with ERBB2 amplification or gain displayed a trend toward shorter OS compared to UTUC without ERBB2 amplification or gain. (B) Comparing different groups, UTUC patients diagnosed with normal ERBB2 gene status and without adjuvant platin-based treatment showed a significantly longer OS. (C) There was a highly significant shorter PFS in UTUCs with ERBB2 immunoscores of 2+ and 3+ in contrast to UTUC with an ERBB2 immunoscore of 0 or 1+. (D) A significantly shorter PFS in UTUC with ERBB2 amplification compared to UTUC with normal ERBB2 gene status was revealed.
Cancers 15 02414 g002
Table 1. Patient and tumor characteristics.
Number of Patients 157
Age and gender n (%) Mean 70.14 yrs, range 34.99–94.19 yrs
99 (63.1) males, 58 females (36.9)
Localization n (%)
Total n = 160
Renal pelvis
Ureter
Renal pelvis and ureter
99 (62.7)
34 (21.5)
25 (15.8)
WHO grading n (%)
Total n = 160
G1
G2
G3
17 (10.6)
60 (37.5)
83 (51.9)
Tumor size (mm)Mean ± SD
Range
44.23 ± 32.93
1–230
pT n (%)
Total n = 160
a
1
2
3
4
is
31 (19.4)
36 (22.5)
17 (10.6)
50 (31.3)
25 (15.6)
1 (0.6)
pN n (%)
Total n = 114
0
1
2
82 (71.9)
6 (5.3)
26 (22.8)
cM n (%)
Total n = 106
0
1
91 (85.8)
15 (14.2)
L n (%)
Total n = 141
0
1
87 (61.7)
54 (38.3)
V n (%)
Total n = 142
0
1
2
92 (64.8)
48 (33.8)
2 (1.4)
Pn n (%)
Total n = 69
0
1
50 (72.5)
19 (27.5)
Residual status n (%)
Total n = 152
0
1
2
119 (78.3)
23 (15.1)
10 (6.6) *
Growth pattern n (%)
Total n = 160
Papillary
Papillary-solid/inverted
Solid
Mixed pattern
Micropapillary
Sarcomatoid
Cis
49 (30.6)
25 (15.6)
28 (17.5)
52 (32.5)
2 (1.3)
3 (1.9)
1 (0.6)
Necrosis n (%)
Total n = 128
Absent
Present (>10%)
65 (50.8)
63 (49.2)
Chronic lymphofollicular inflammation n (%)
Total n = 128
Absent
Present
115 (85.8)
19 (14.2)
Abbreviations: Cis—carcinoma in situ, SD—standard deviation, yrs—years. * Note: R2 status included cases with complete tumor resection but presence of distant metastasis at time of diagnosis.
Table 2. Immunoscoring of ERBB2 and ERBB2 gain or amplification in upper tract urothelial carcinoma.
ERBB2 ImmunoscoreImmunoscoring
(According to ASCO/CAP 2018 Guidelines for ERBB2/HER2 Testing in BC)
Immunoscoring
(According to ASCO/CAP 2017 Guidelines for ERBB2/HER2 Testing in GC)
Number of Amplified ERBB2 Cases
n (%)n (%)n (%)
059 (36.9)59 (36.9)0
1+72 (45.0)26 (16.3)1 (6.7)
2+5 (3.1)43 (26.9)6 (40.0)
3+10 (6.3)18 (11.3)7 (46.7)
n.a.14 (8.8)14 (8.8)1 (6.7)
Total n160 (100)160 (100)15 (100)
Table 3. Associations between ERBB2 expression, ERBB2 gene status, and different clinicopathologcal parameters.
Patients and Tumor PropertiesERBB2-Immunoscoring According to Guidelines for Breast CancerERBB2-Immunoscoring According to Guidelines for Gastric AdenocarcinomaERBB2 Amplification or Gain
p-Valuep-Valuep-Value
Gender (male, female)0.9940.5370.557
Age ≤ 60 yrs, >60 yrs0.0410.8201.000
Survival0.9390.9060.939
Progression0.1950.0280.549
Morphology (papillary, papillary-solid/inverted, solid, mixed pattern, micropapillary, sarcomatoid, cis)0.9450.8050.057
Necrosis0.2040.1460.048
Lymphofollicular inflammation0.5780.6800.356
WHO grading (G1, G2, G3)0.0120.077<0.001
Invasion, pTa or T1–40.2570.3590.003
Stage0.7010.2260.014
pN0.1800.1450.005
cM0.5470.8780.064
L0.4960.6760.005
V0.8930.3890.065
Pn0.7730.8620.005
Residual status0.6820.8830.006
ERBB2 amplification or gain<0.001<0.001-
Statistical tests applied: Pearson chi-square test, Fisher’s exact test.
Table 4. Univariable and multivariable Cox regression analysis: overall survival in upper urinary tract urothelial carcinoma.
Overall SurvivalUnivariable AnalysesMultivariable Analysis
Parameterp-Value95% CIHRp-Value95% CIAdj HR
Age > 60 yrs vs. * ≤ 60 yrs0.0810.940–2.9251.658---
Sex m vs. * f0.6150.736–1.6781.112---
Progression vs. * no progression0.0081.178–3.0011.8800.4510.324–12.6742.025
Pelvic localization vs. ureter vs. * both0.7110.818–1.3441.048---
Growth patterns:
* Papillary vs. papillary-inverted/solid
* Papillary vs. solid
* Papillary vs. mixed type
* Papillary vs. micropapillary
* Papillary vs. sarcomatoid
0.007
0.961
0.010
0.160
0.077
<0.001

0.504–1.919
1.214–4.066
0.864–2.432
0.868–15.725
2.899–35.123

0.983
2.222
1.449
3.694
10.09
0.002
0.049
0.763
0.209
0.579
<0.001

0.032–0.990
0.175–10.757
0.556–14.580
0.078–109.66
7.614–1364.9

0.178
1.373
2.846
2.826
101.942
Necrosis vs. * no necrosis0.0041.230–3.0461.9360.1490.752–6.5052.212
Chronic lymphofollicular inflammation vs. * no inflammation0.9830.558–1.7710.994---
ERBB2 score ** 0 vs. 1+ vs. 2+ vs. * 3+0.1930.937–1.3801.137---
ERBB2 amplification vs. * ERBB2 <2.00.1760.827–2.8221.528--
ERBB2 gain or amplification vs. * no ERBB2 gain or amplification0.0570.986–2.4851.5650.1140.623–83.7667.222
Platin vs. * no platin-based therapy0.0051.243–3.3162.0310.0430.003–0.9140.049
ERBB2 status and CT0.006 0.020
ERBB2 negative and CT vs. * ERBB2 negative and no CT0.0091.227–4.2232.2760.0030.009–0.3770.059
ERBB2 positive and CT vs. * ERBB2 negative and no CT0.6200.504–3.1601.2620.0210.003–0.6240.046
ERBB2 positive and no CT vs. * ERBB2 negative and no CT0.0031.341–4.0282.3240.0860.003–1.4580.071
Grading<0.001 0.071
G2 vs. * G10.1250.828–4.7091.9740.7380.169–3.5220.772
G3 vs. * G10.0011.692–9.1853.9420.0270.001–0.6630.026
pT<0.001 0.004
pT1 vs. * pTa0.0600.970–4.3102.0450.0032.409–68.30512.827
pT2 vs. * pTa0.0401.044–5.8592.4740.0191.711–415-79226.674
T3 vs. * pTa<0.0011.673–6.4103.2740.0122.346–1021.9448.959
pT4 vs. * pTa<0.0015.006–23.27910.795<0.00111.761–8238.9311.28
pN1 or pN2 vs. * pN0<0.0011.921–5.1253.1380.6781.189–4.6772.358
cM10 vs. * cM0<0.0012.910–10.9935.6560.3840.346–15.8302.340
Lymphatic invasion (L1 vs. * L0)<0.0011.525–3.6022.344<0.0014.130–71.60317.196
Venous invasion (V1 or V2 vs. * V0)<0.0011.483–3.4652.2670.0900.095–1.1870.335
Perineural invasion (Pn1 vs. * Pn0)<0.0011.105–12.1983.67180.4420.229–1.9030.660
Residual status (R1 or R2 vs. * R0)<0.0012.917–7.2804.608<0.0014.116–76.91417.793
Abbreviations: Adj—adjusted, CI—confidence interval, CT—platin-based polychemotherapy, HR—hazard ratio, OS—overall survival, vs.—versus; Notes: * reference category, ** ERBB2 immunoscoring scheme for gastric adenocarcinoma [30]. To select OS influencing factors for the multiple regression approach, the cut-off was set as p = 0.060.
Table 5. Univariable and multivariable Cox regression analysis: progression-free survival in upper urinary tract urothelial carcinoma.
Progression-Free SurvivalUnivariable AnalysesMultivariable Analysis
Parameterp-Value95% CIHRp-Value95% CIAdj HR
Age > 60 yrs vs. ≤ * 60 yrs0.9090.430–2.5791.054---
sex m vs. * f 0.6090.384–1.7540.820---
Pelvic localization vs. ureter vs. * both0.1810.872–2.0671.342---
Growth patterns:
* Papillary vs. papillary-inverted/solid
* Papillary vs. solid
* Papillary vs. mixed type
* Papillary vs. micropapillary
* Papillary vs. sarcomatoid
0.019
0.333
0.944
0.070
0.983
0.004

0.099–2.193
0.277–3.963
0.938–5.135
0.000
2.799–246.9

0.465
1.048
2.195
0.000
26.29
0.8690.583–1.5770.959
Necrosis vs. * no necrosis0.1270.852–3.6201.756---
Chronic lymphofollicular inflammation vs. * no inflammation0.6630.275–2.2740.791---
ERBB2 score ** 1+ vs. 2+ vs. * 3+ vs. * 00.0031.2132.5171.7480.1760.839–2.6131.480
ERBB2 amplification vs. * no amplification 0.0401.042–6.4452.5920.0321.112–11.0893.511
Platin vs. * no platin-based therapy<0.0013.865–16.8518.192<0.0014.596–45.81114.510
ERBB2 status and CT<0.001 0.2960.419–1.3030.739
ERBB2 negative and CT vs. * ERBB2 negative and no CT0.8590.271–2.9680.898
ERBB2 positive and CT vs. * ERBB2 negative and no CT0.0140.052–0.7170.194
ERBB2 positive and no CT vs. * ERBB2 negative and no CT<0.0010.056–0.3380.137
Grading0.154 ---
G2 vs. * G10.4500.396–8.0831.789
G3 vs. * G10.1250.727–13.783.166
pT 0.037 0.7910.546–1.5870.930
pT1 vs. * pTa0.6650.359–4.9881.337
pT2 vs. * pTa0.4910.378–7.6111.696
pT3 vs. * pTa0.0590.958–9.0962.951
pT4 vs. * pTa0.0061.690–24.6576.456
pN1 or pN2 vs. * pN00.0151.234–7.2472.9910.0700.082–1.1010.300
cM10 vs. * cM00.0012.274–28.1378.0000.1470.629–22.304 3.745
Lymphatic invasion (L1 vs. * L0)0.1210.852–3.9751.840--
Venous invasion (V1 or V2 vs. * V0)0.1720.790–3.7381.718---
Perineural invasion (Pn1 vs. * Pn0)0.2880.538–8.0832.085---
Residual status (R1 or R2 vs. * R0)0.0181.201–6.8332.8650.5810.139–3.023 0.648
Abbreviations: Adj—adjusted, CI—confidence interval, CT—platin-based polychemotherapy, HR—hazard ratio, OS—overall survival, vs.—versus; Notes: * reference category, ** ERBB2 immunoscoring scheme for gastric adenocarcinoma [30]. To select OS influencing factors for the multiple regression approach, the cut-off was set as p = 0.050.
Disclaimer/Publisher’s Note: The statements, opinions and data contained in all publications are solely those of the individual author(s) and contributor(s) and not of MDPI and/or the editor(s). MDPI and/or the editor(s) disclaim responsibility for any injury to people or property resulting from any ideas, methods, instructions or products referred to in the content.

