

Sodium Propionate Contributes to Tumor Cell Growth Inhibition through PPAR-γ Signaling
 , , , , and
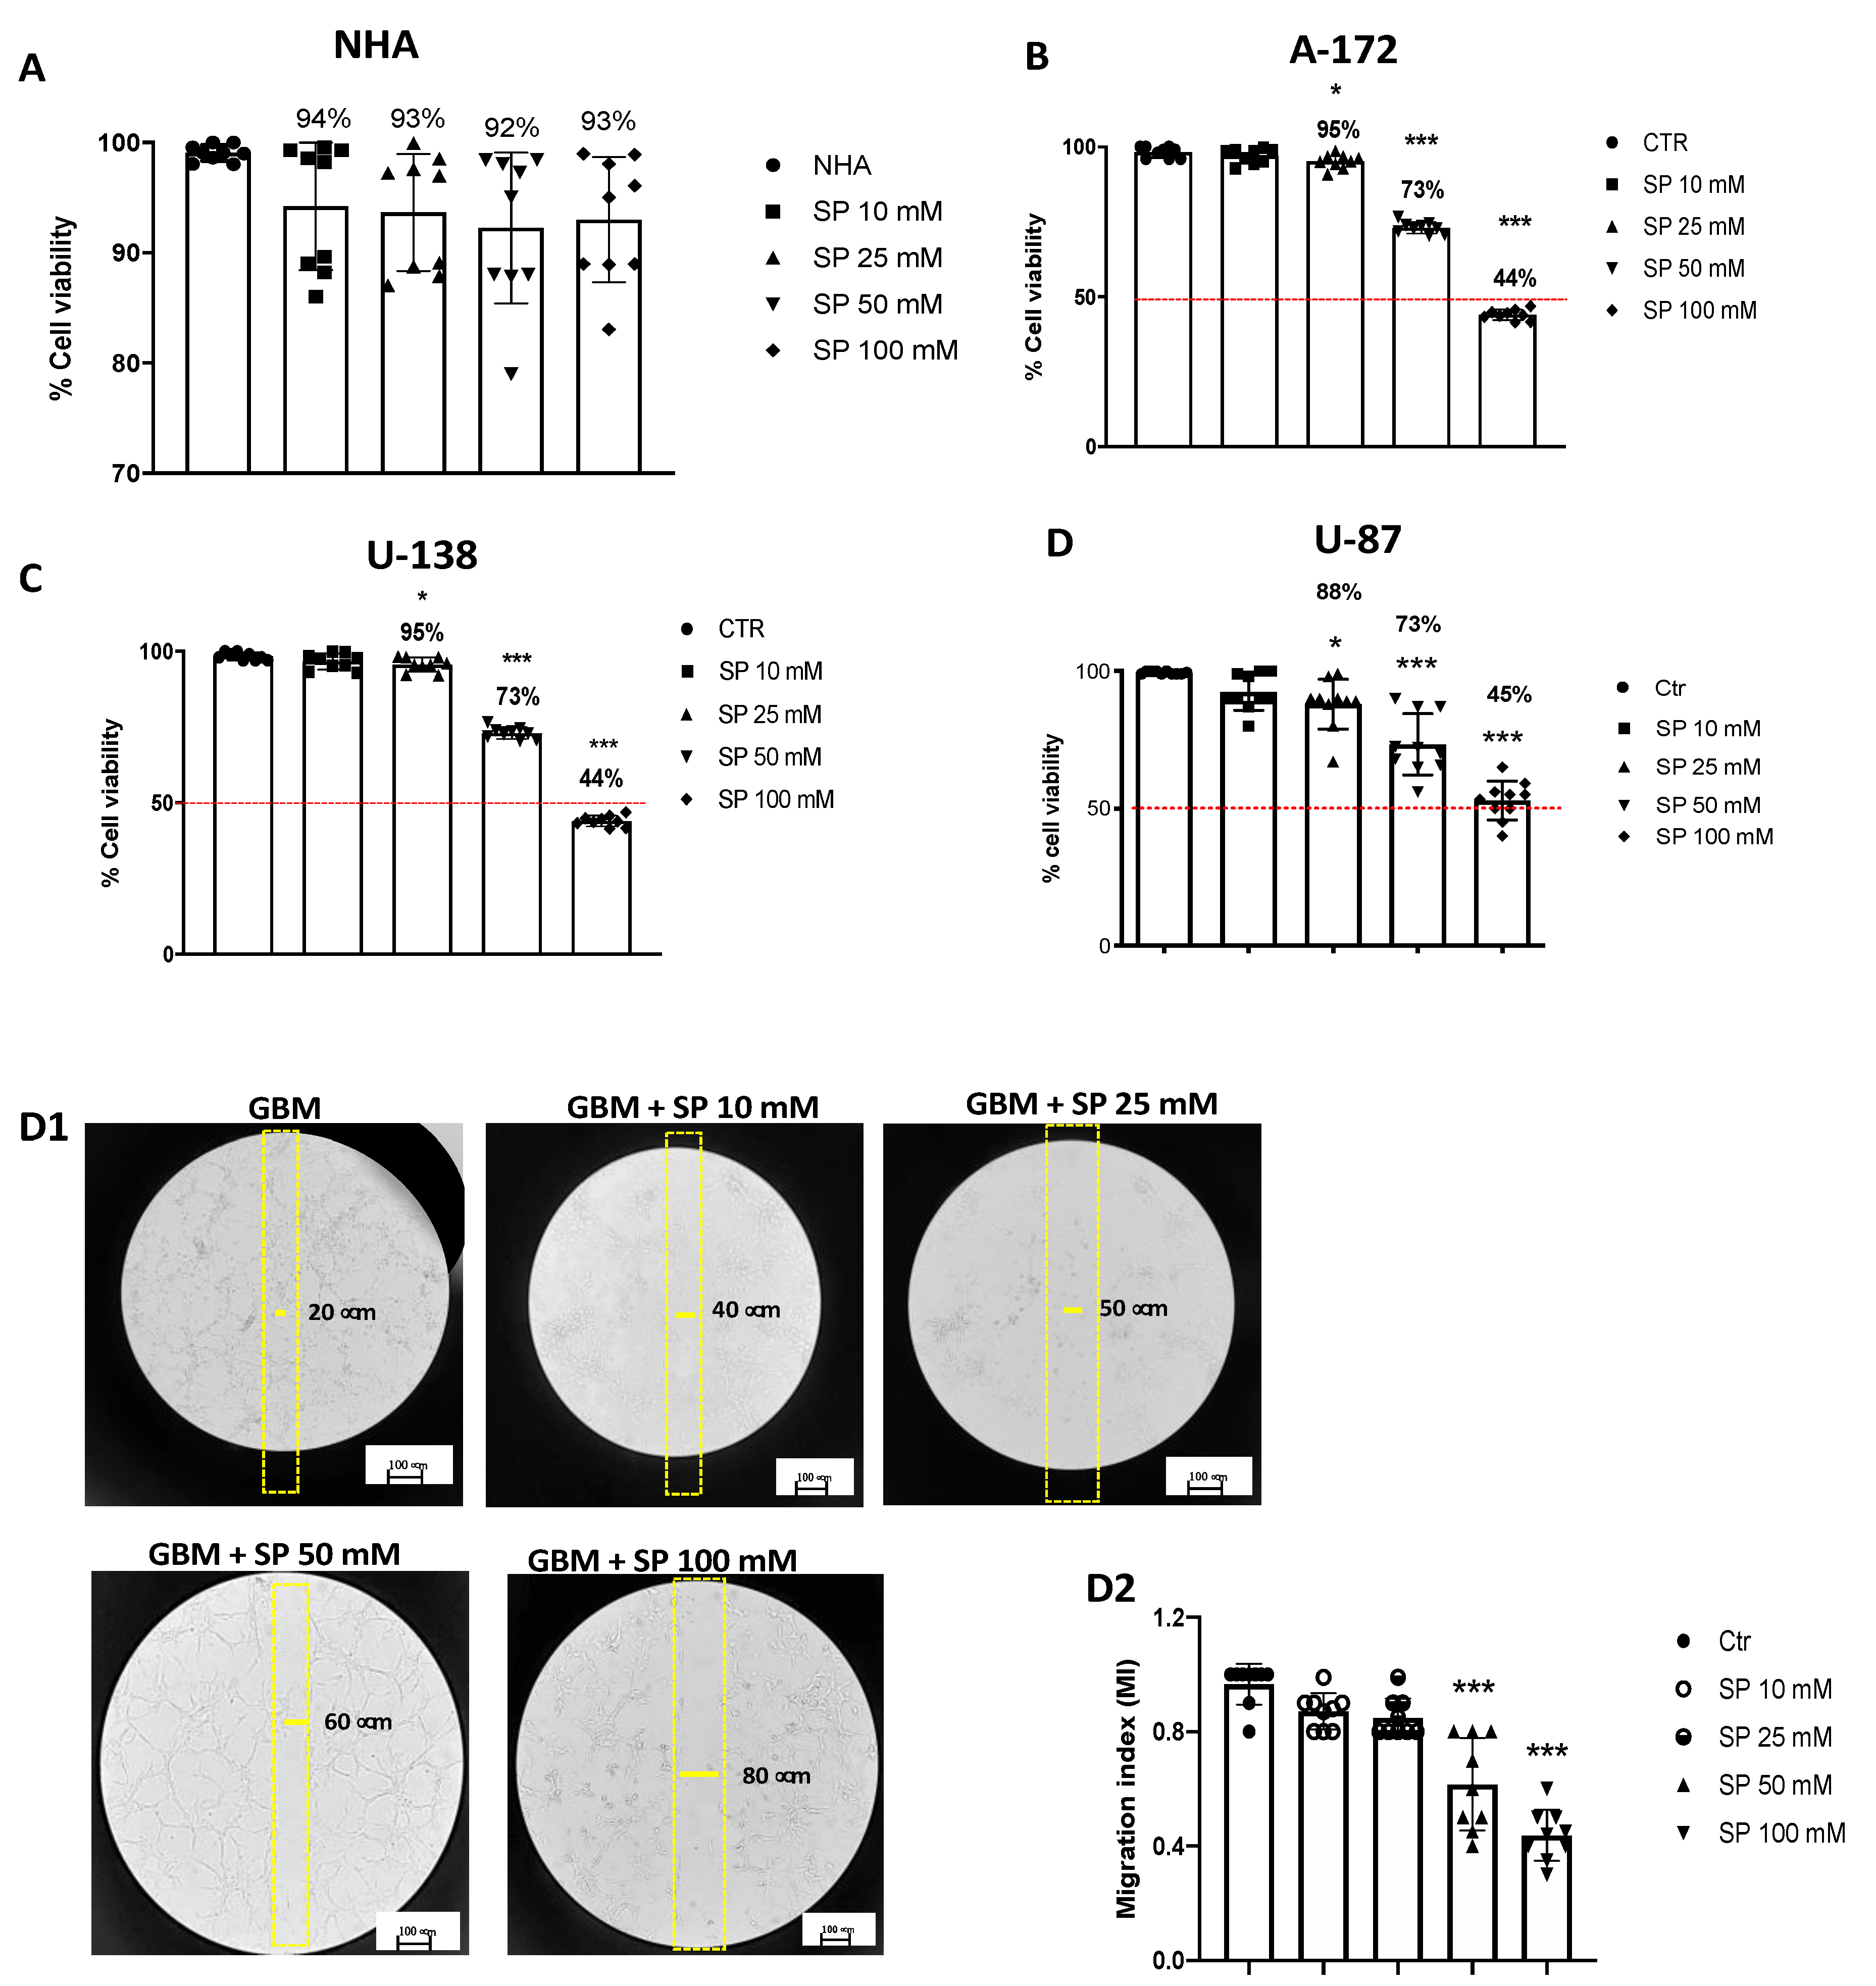
Abstract
:Simple Summary
Abstract
1. Introduction
2. Materials and Methods
2.1. Materials
2.2. In Vitro Study
2.2.1. Cell Culture
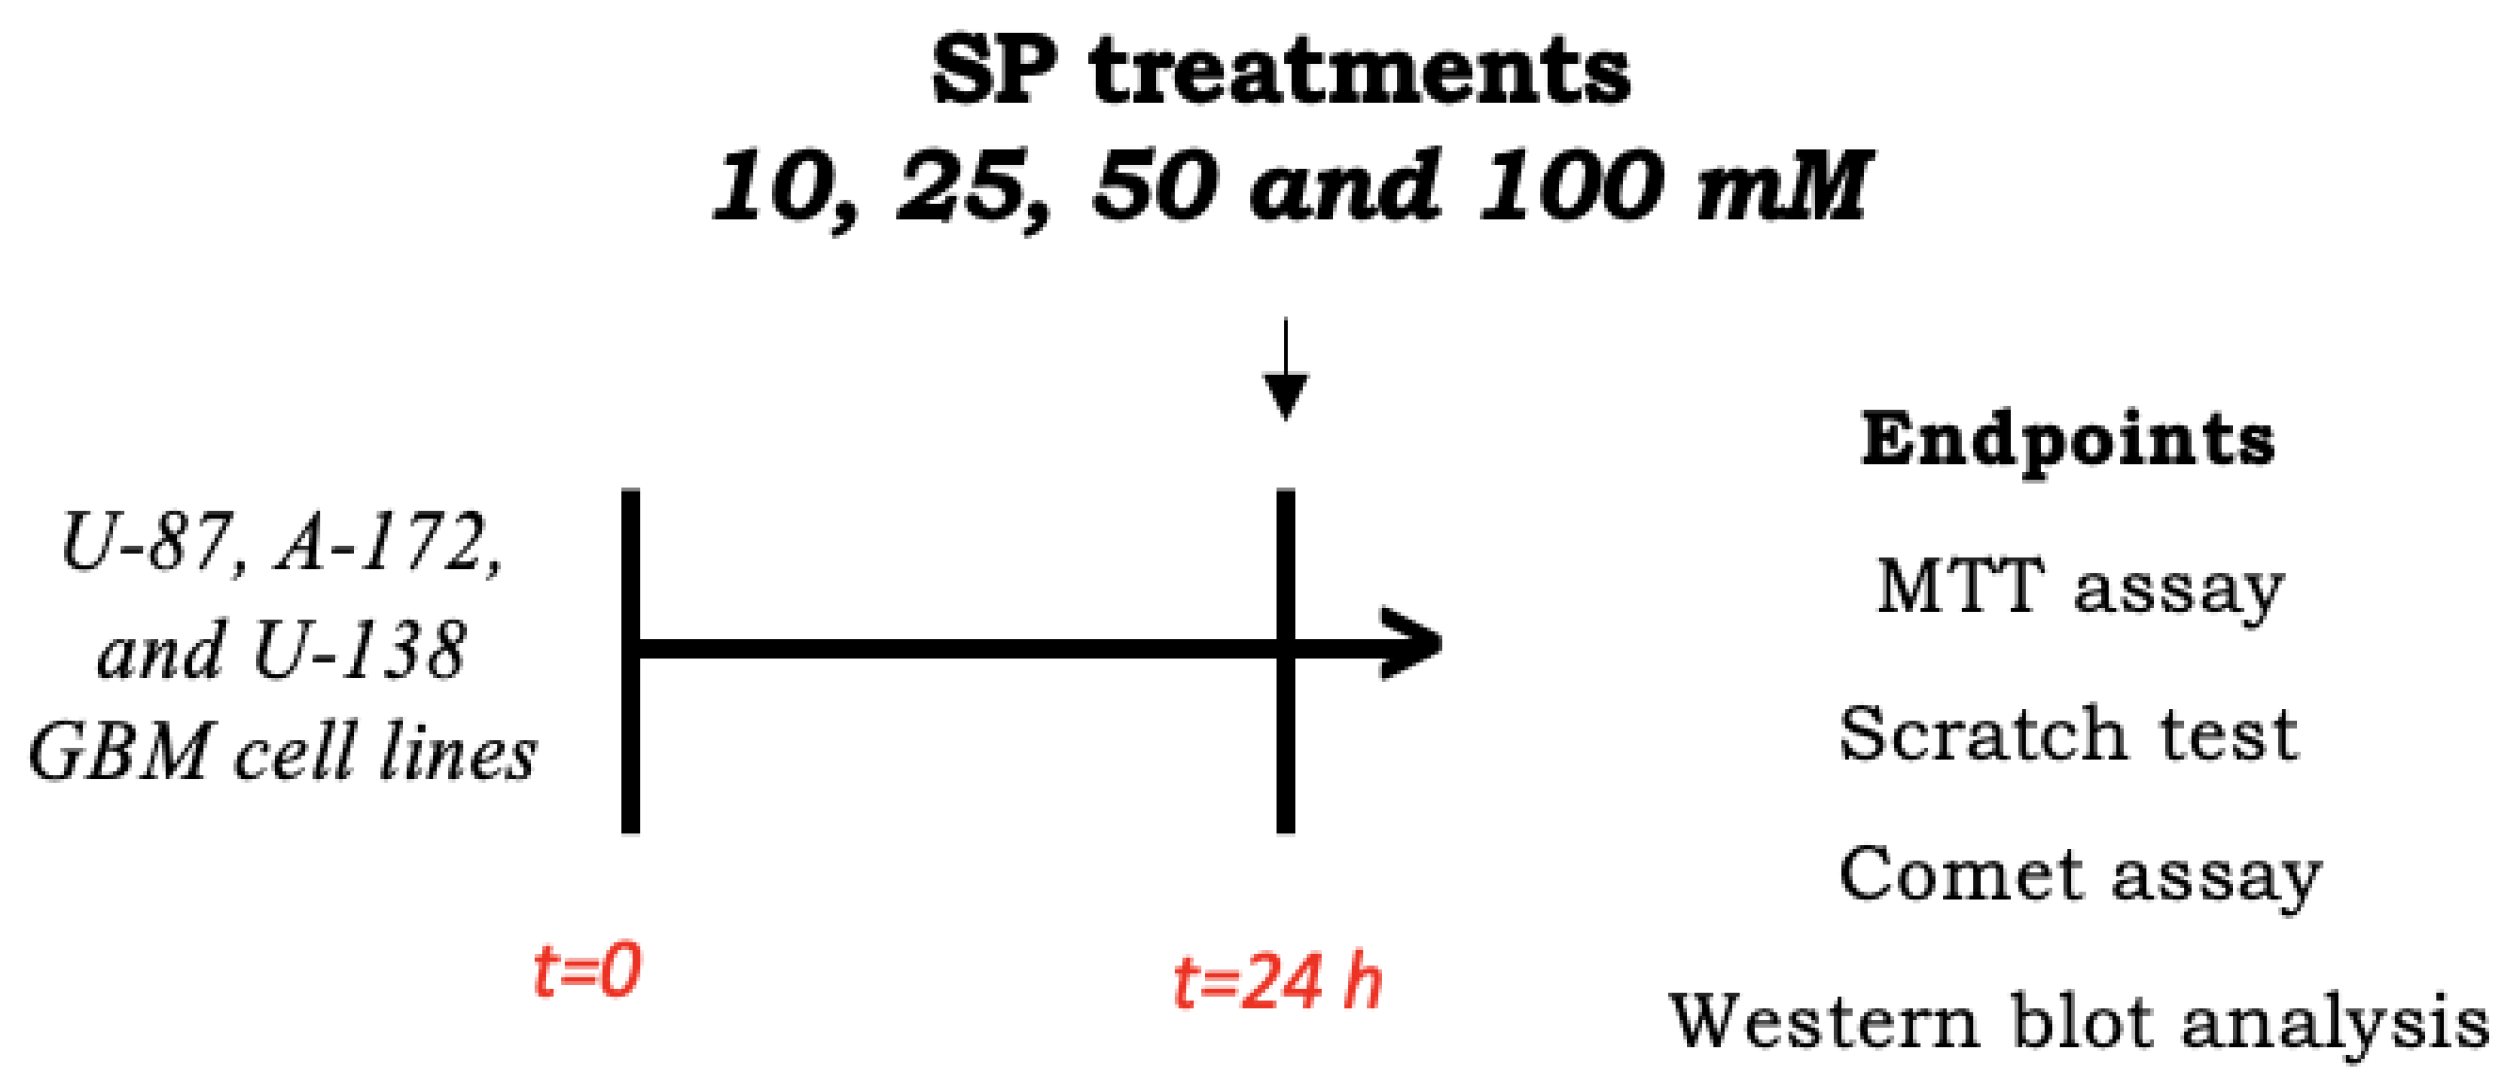
2.2.2. Cell Treatments
2.2.3. Cell Viability Assay (MTT Assay)
2.2.4. Wound Healing Assay (Scratch Test)
2.2.5. Alkaline (pH > 13) Comet Assay
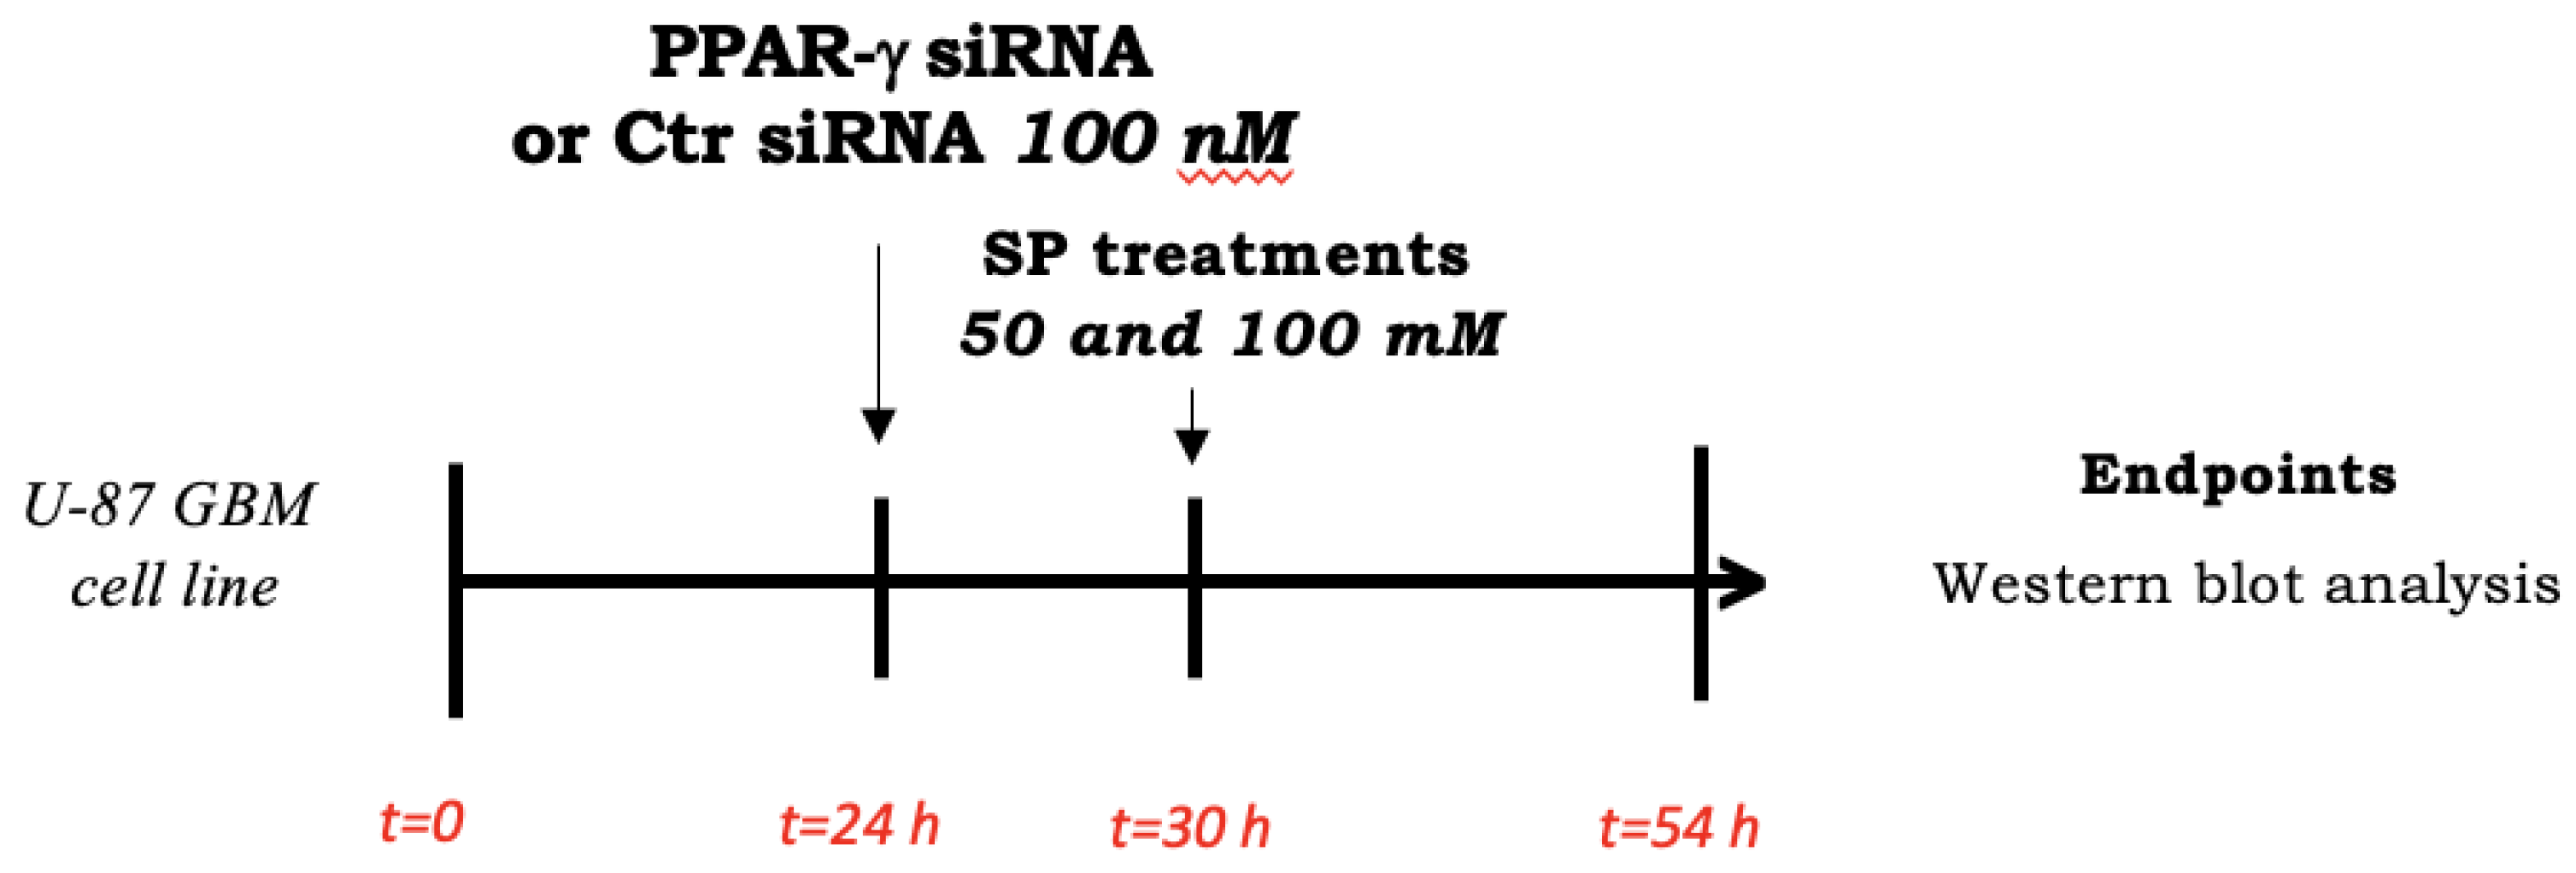
2.2.6. Cell Transfection
2.2.7. Western Blot Analysis
2.3. In Vivo Study
2.3.1. Animals
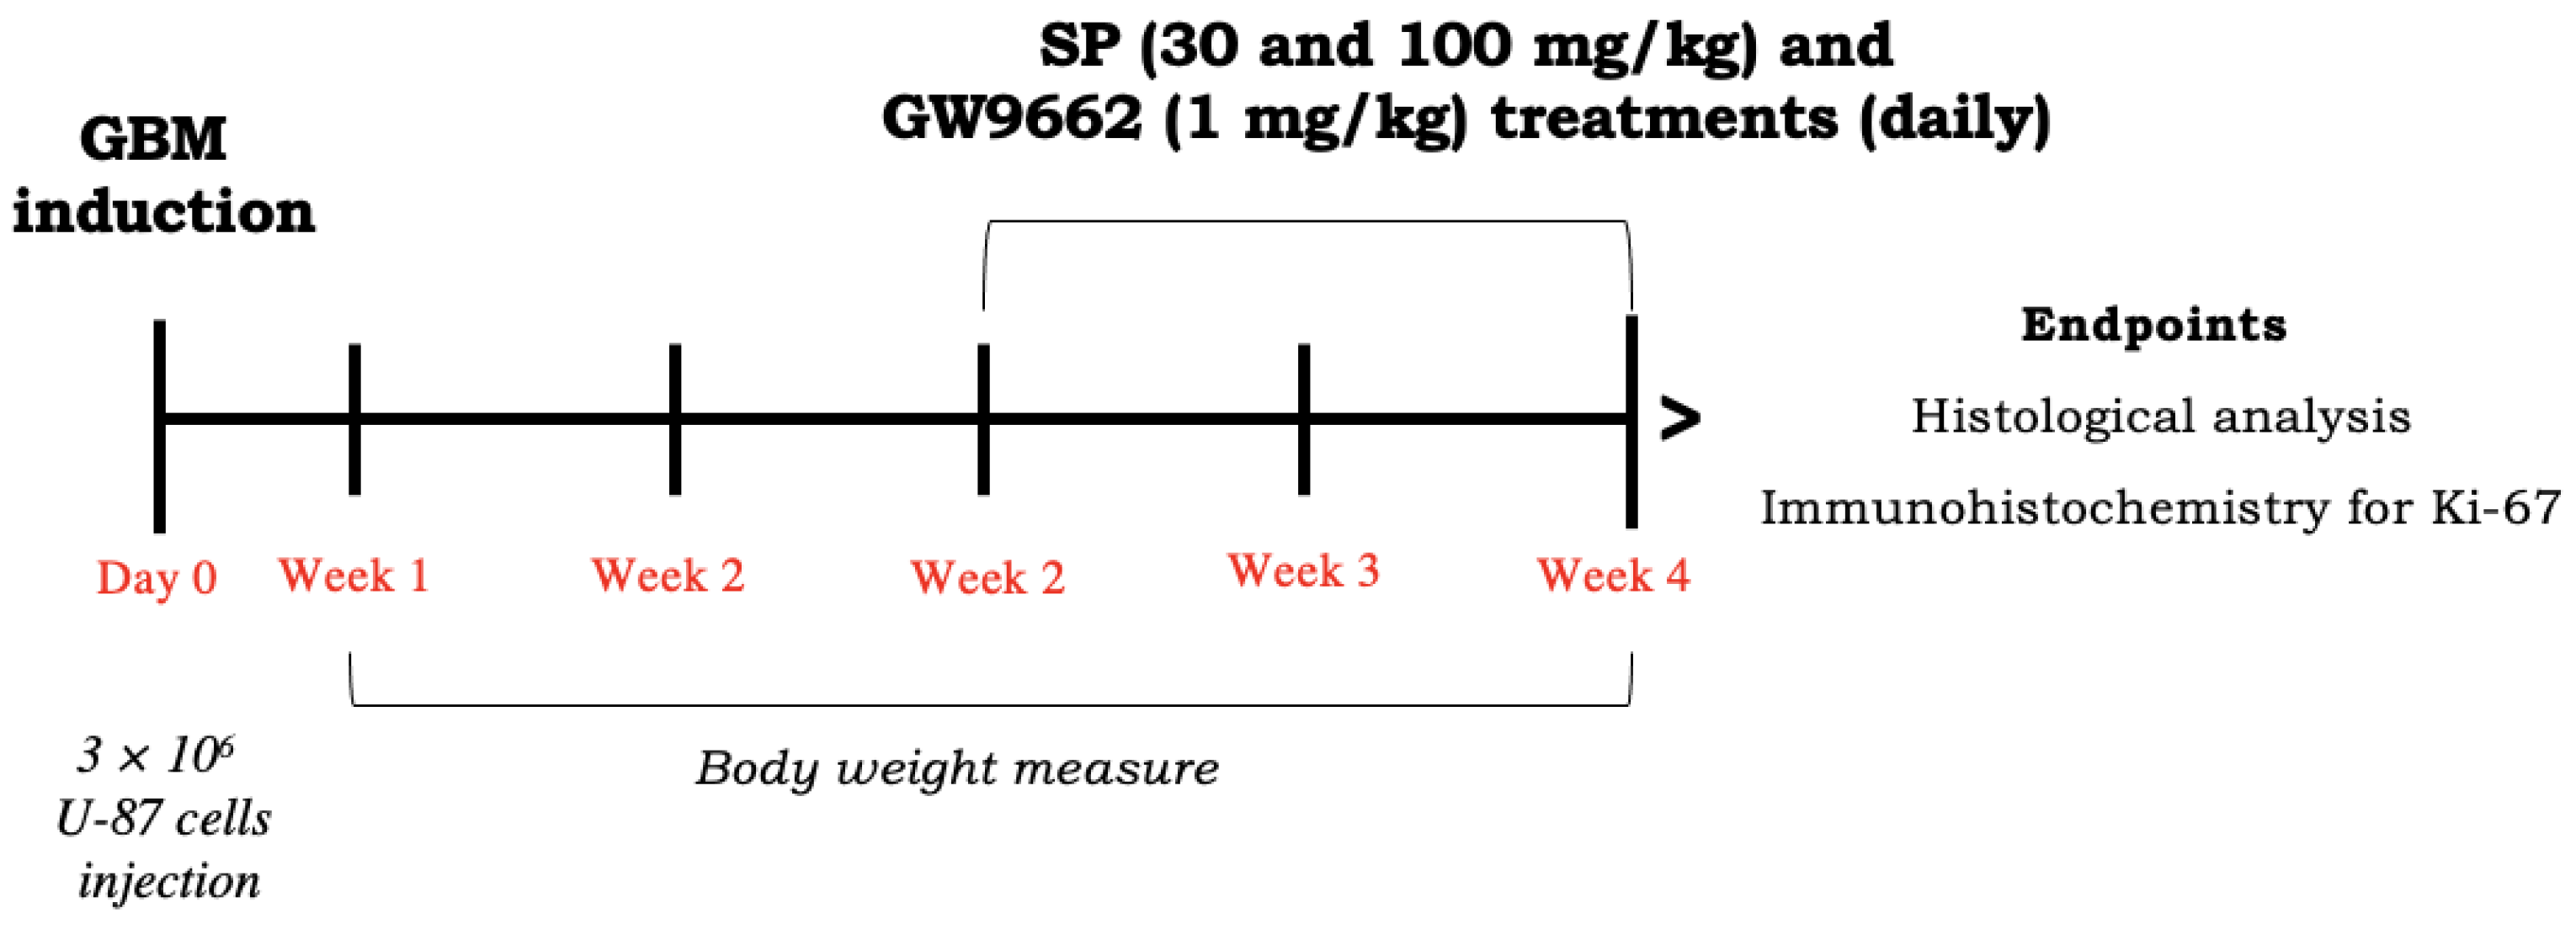
2.3.2. Xenograft Model of GBM
- Control group (GBM): oral administration of saline;
- GBM + SP 10 mg/kg: after cell inoculation, SP at a dose of 10 mg/kg was orally administered for two weeks (n = 10);
- GBM + SP 30 mg/kg: after cell inoculation, SP at a dose of 30 mg/kg was orally administered for two weeks (n = 10);
- GBM + SP 100 mg/kg: after cell inoculation, SP at a dose of 100 mg/kg was orally administered for two weeks (n = 10);
- GBM + SP 10 mg/kg + GW9662 1 mg/kg: after cell inoculation, SP (10 mg/kg) was orally administered and GW9662 (1 mg/kg) was administered intraperitoneally for two weeks (n = 10);
- GBM + SP 30 mg/kg + GW9662 1 mg/kg: after cell inoculation, SP (30 mg/kg) was orally administered and GW9662 (1 mg/kg) was administered intraperitoneally for two weeks (n = 10);
- GBM + SP 100 mg/kg + GW9662 1 mg/kg: after cell inoculation, SP (100 mg/kg) was orally administered and GW9662 (1 mg/kg) was administered intraperitoneally for two weeks (n = 10).
2.3.3. Histological Evaluation
2.3.4. Enzyme-Linked Immunosorbent Assay (ELISA) Kits
2.4. Statistical Analysis
3. Results
3.1. In Vitro Study
3.1.1. SP Treatments Reduced GBM Cell Viability in a Concentration-Dependent Manner
3.1.2. SP Treatments Inhibited GBM Cell Migration
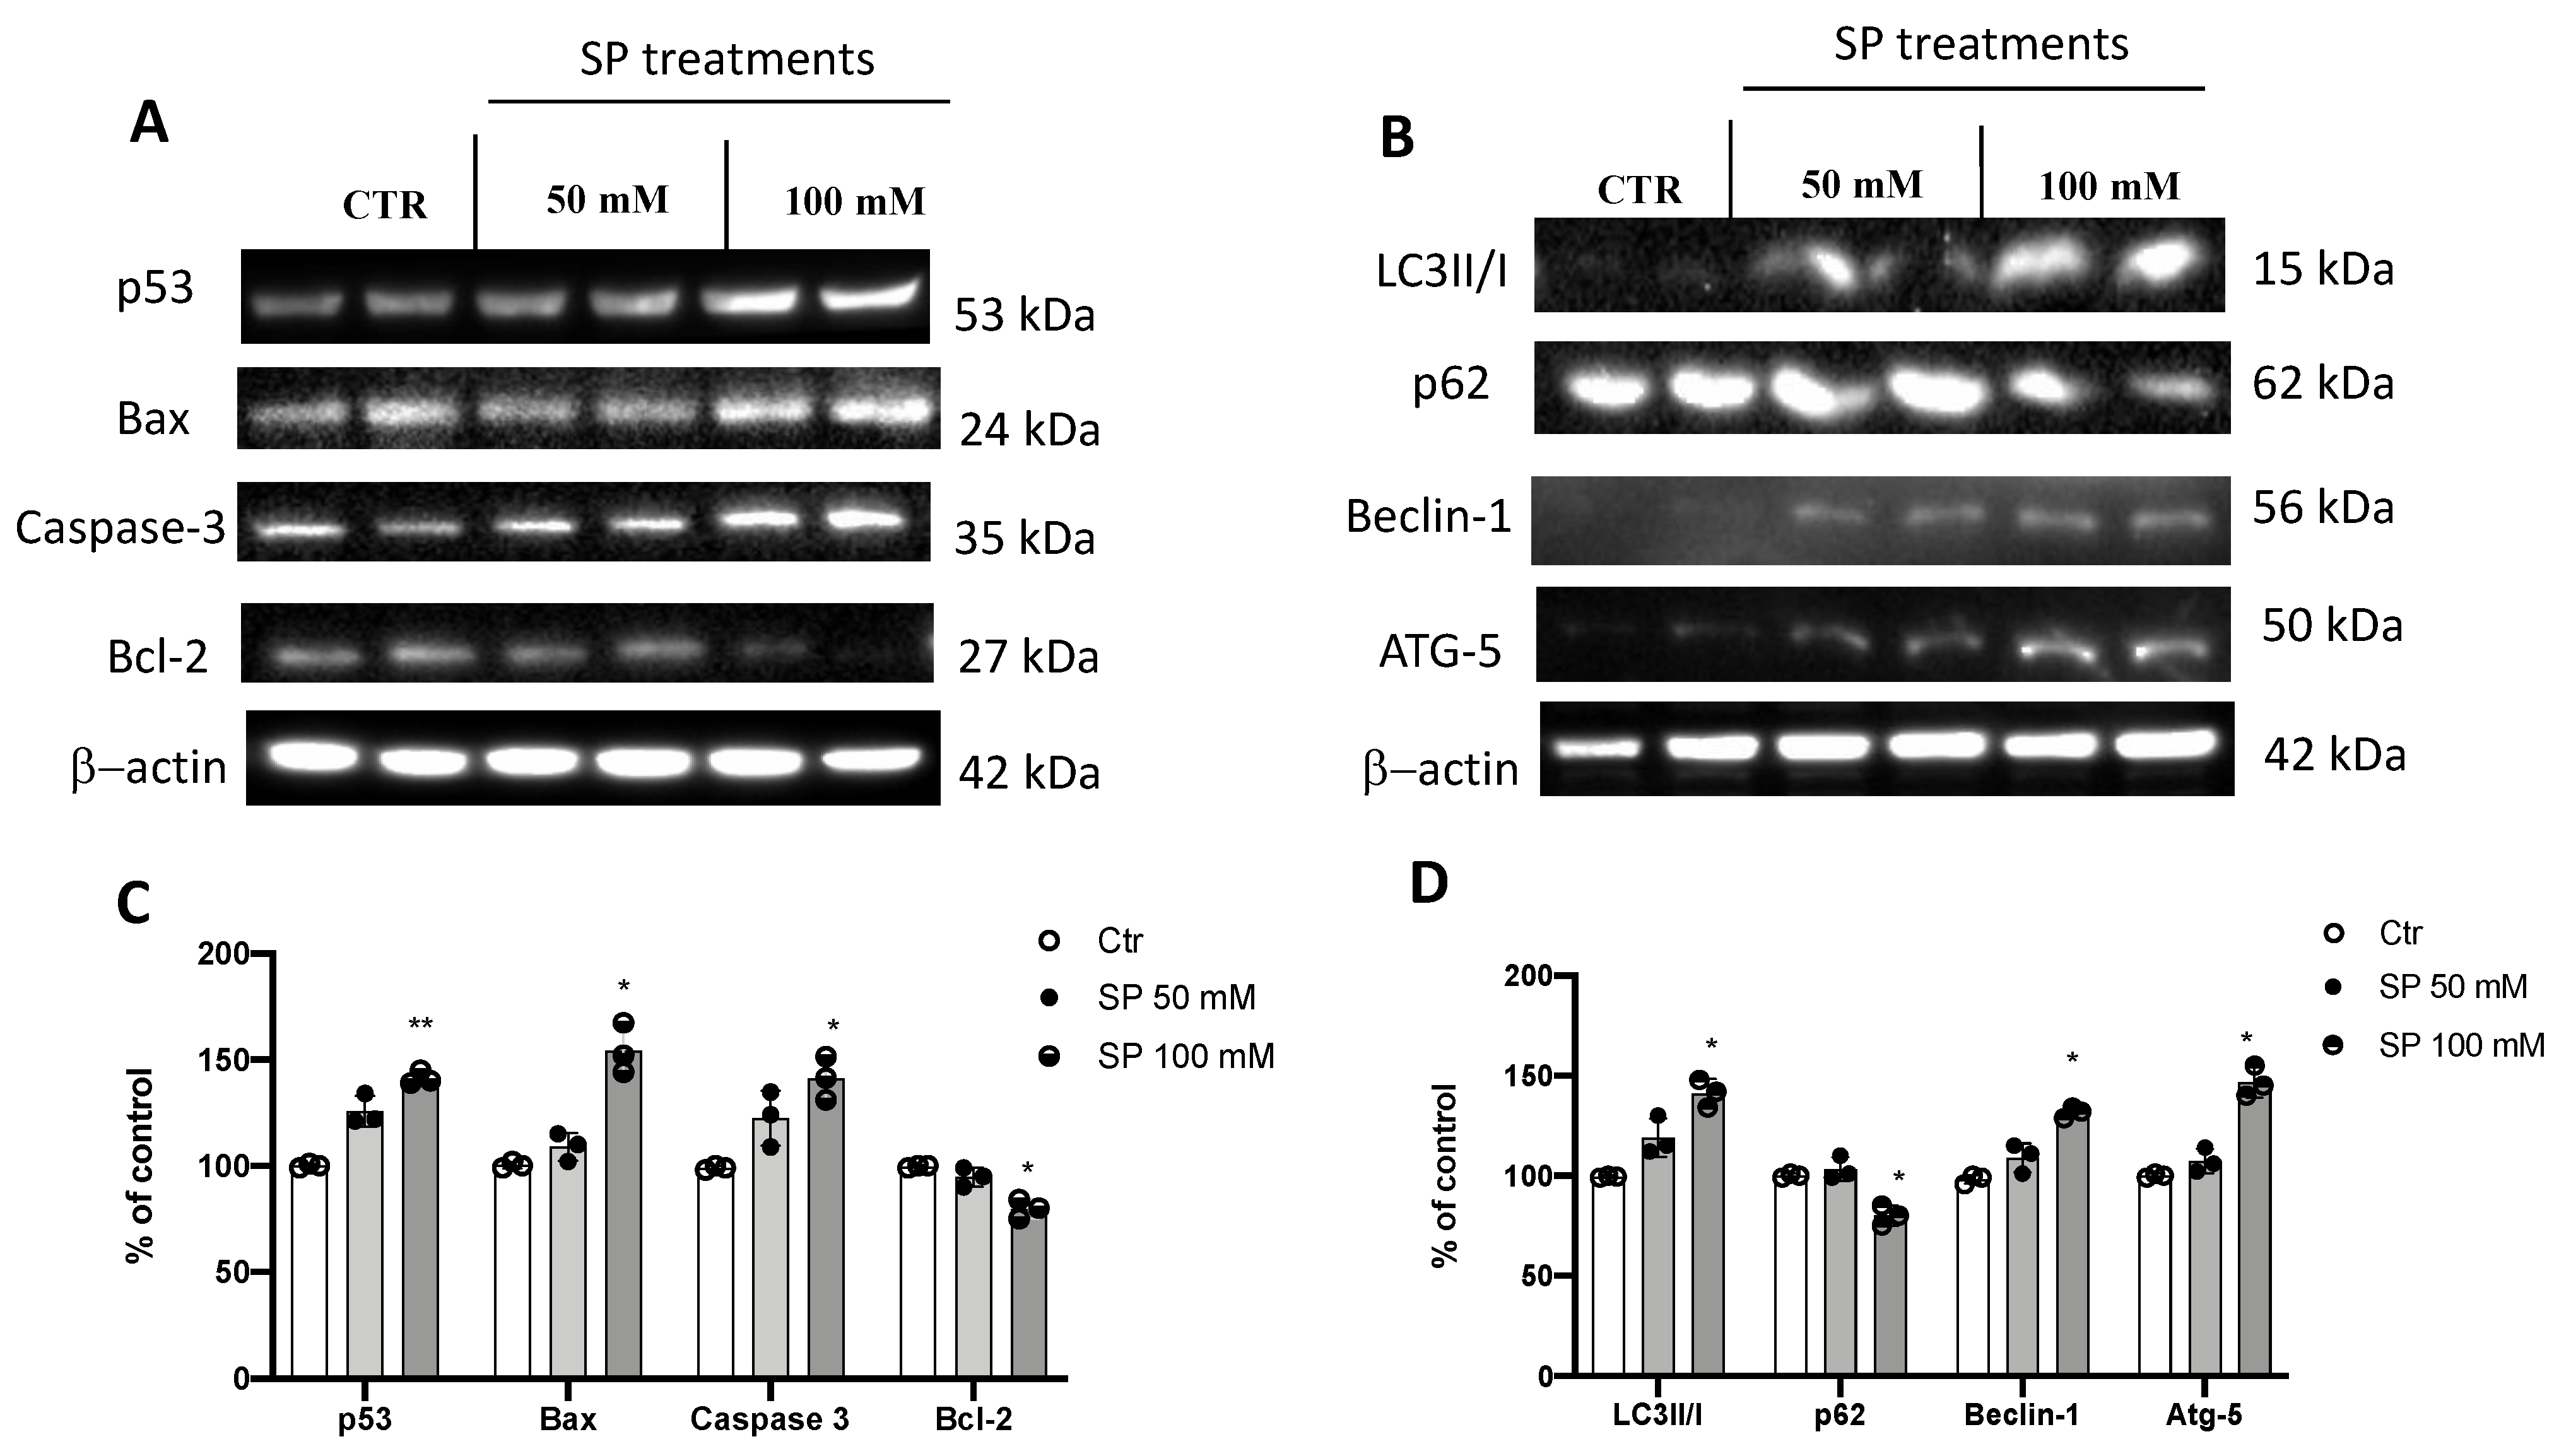
3.1.3. Apoptosis and Autophagy Pathways Are Induced by SP Treatments
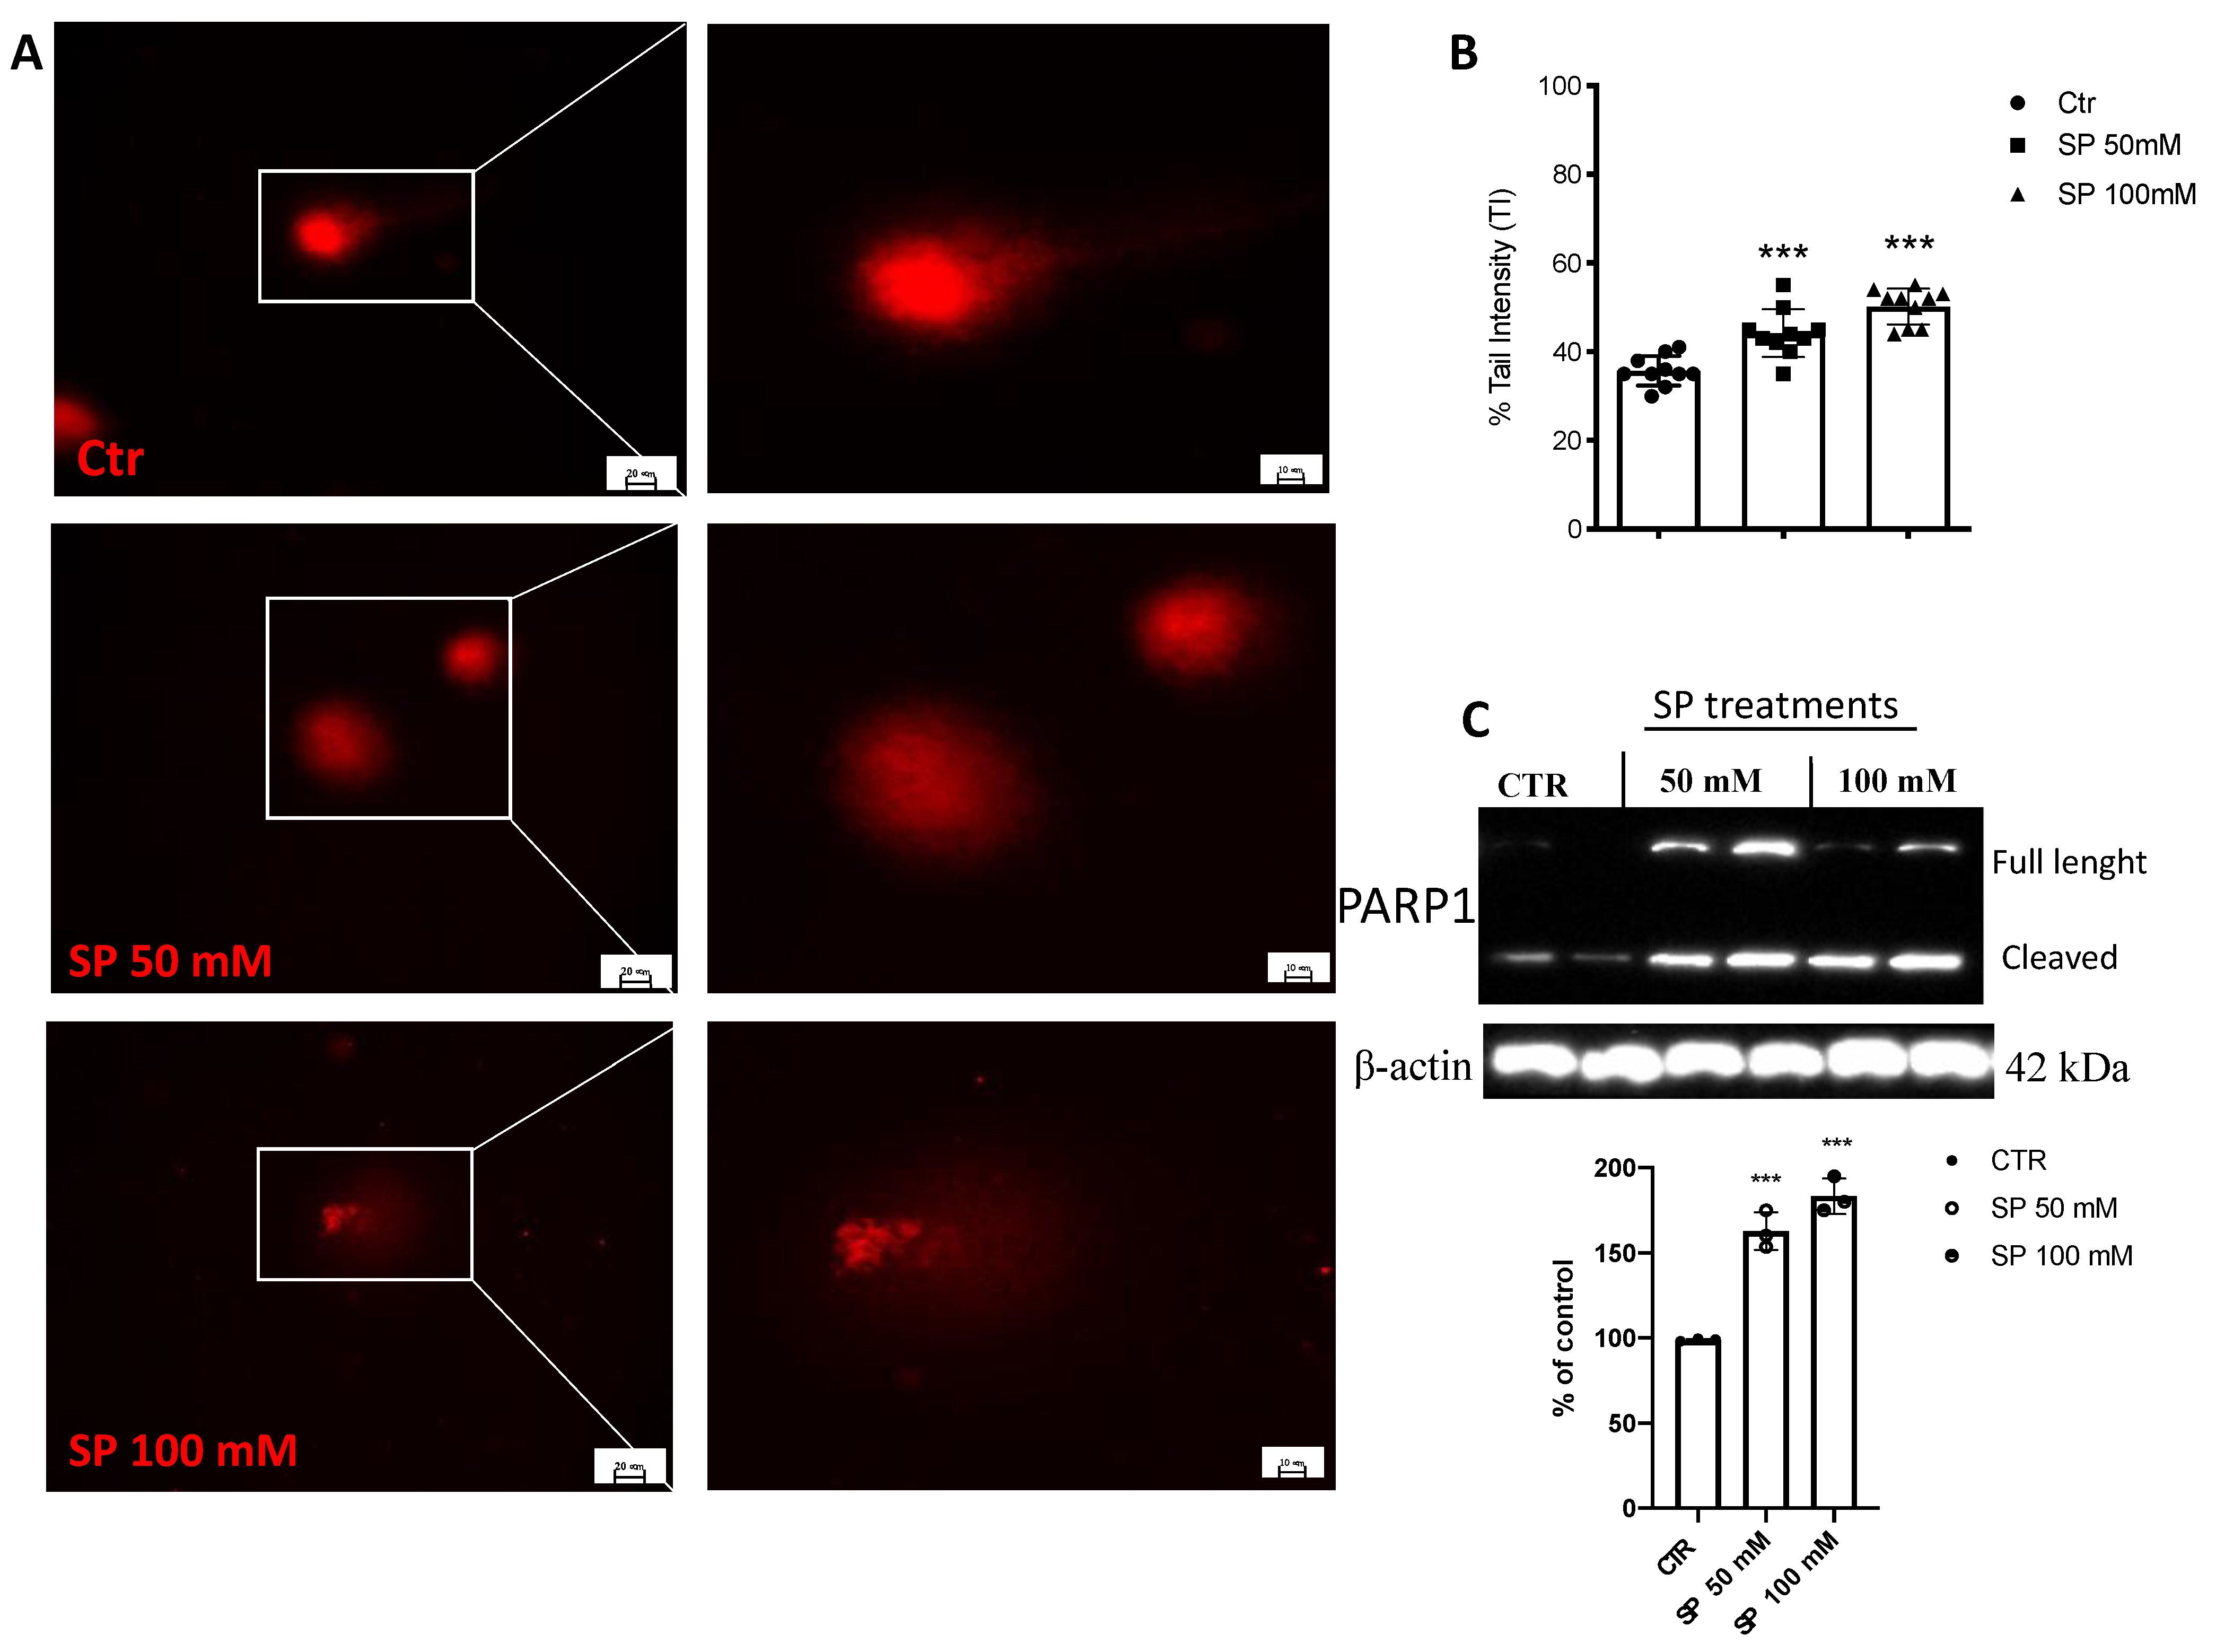
3.1.4. SP Triggered DNA Strand Breaks in GBM Cells
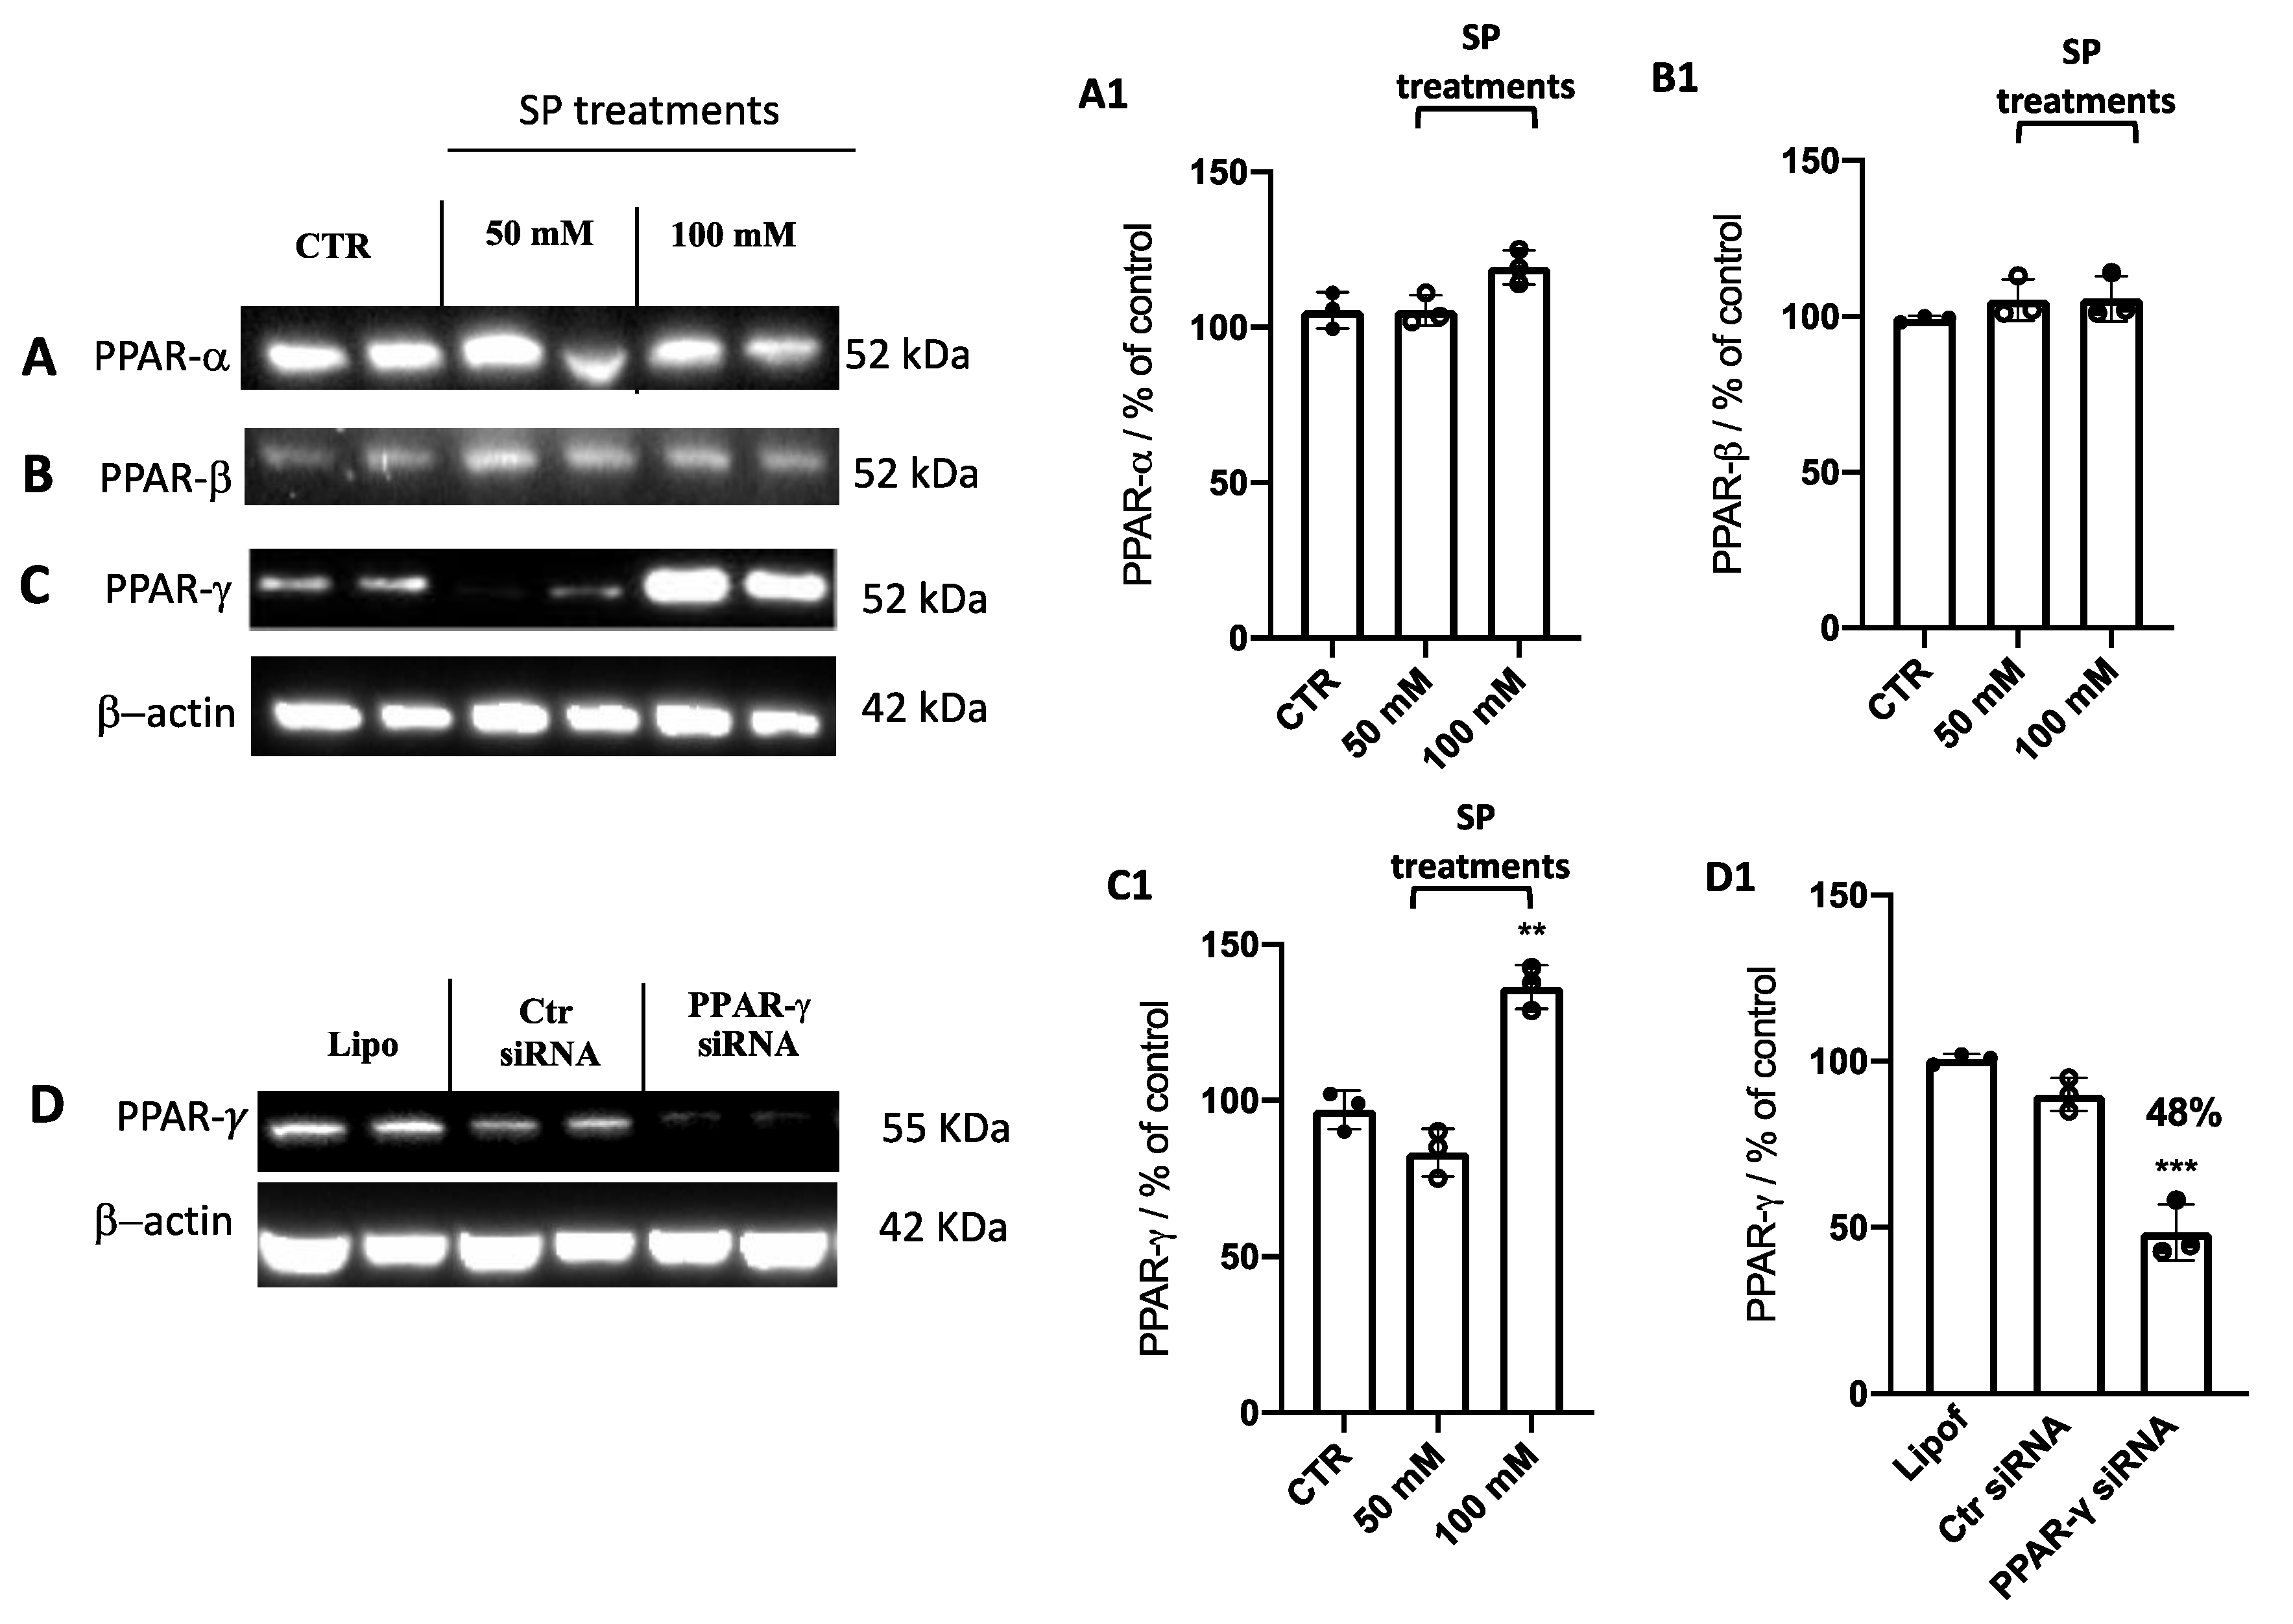
3.1.5. Effect of SP on Peroxisome Proliferator-Activated Receptors (PPARs): PPAR-α, PPAR-β, and PPAR-γ Expression
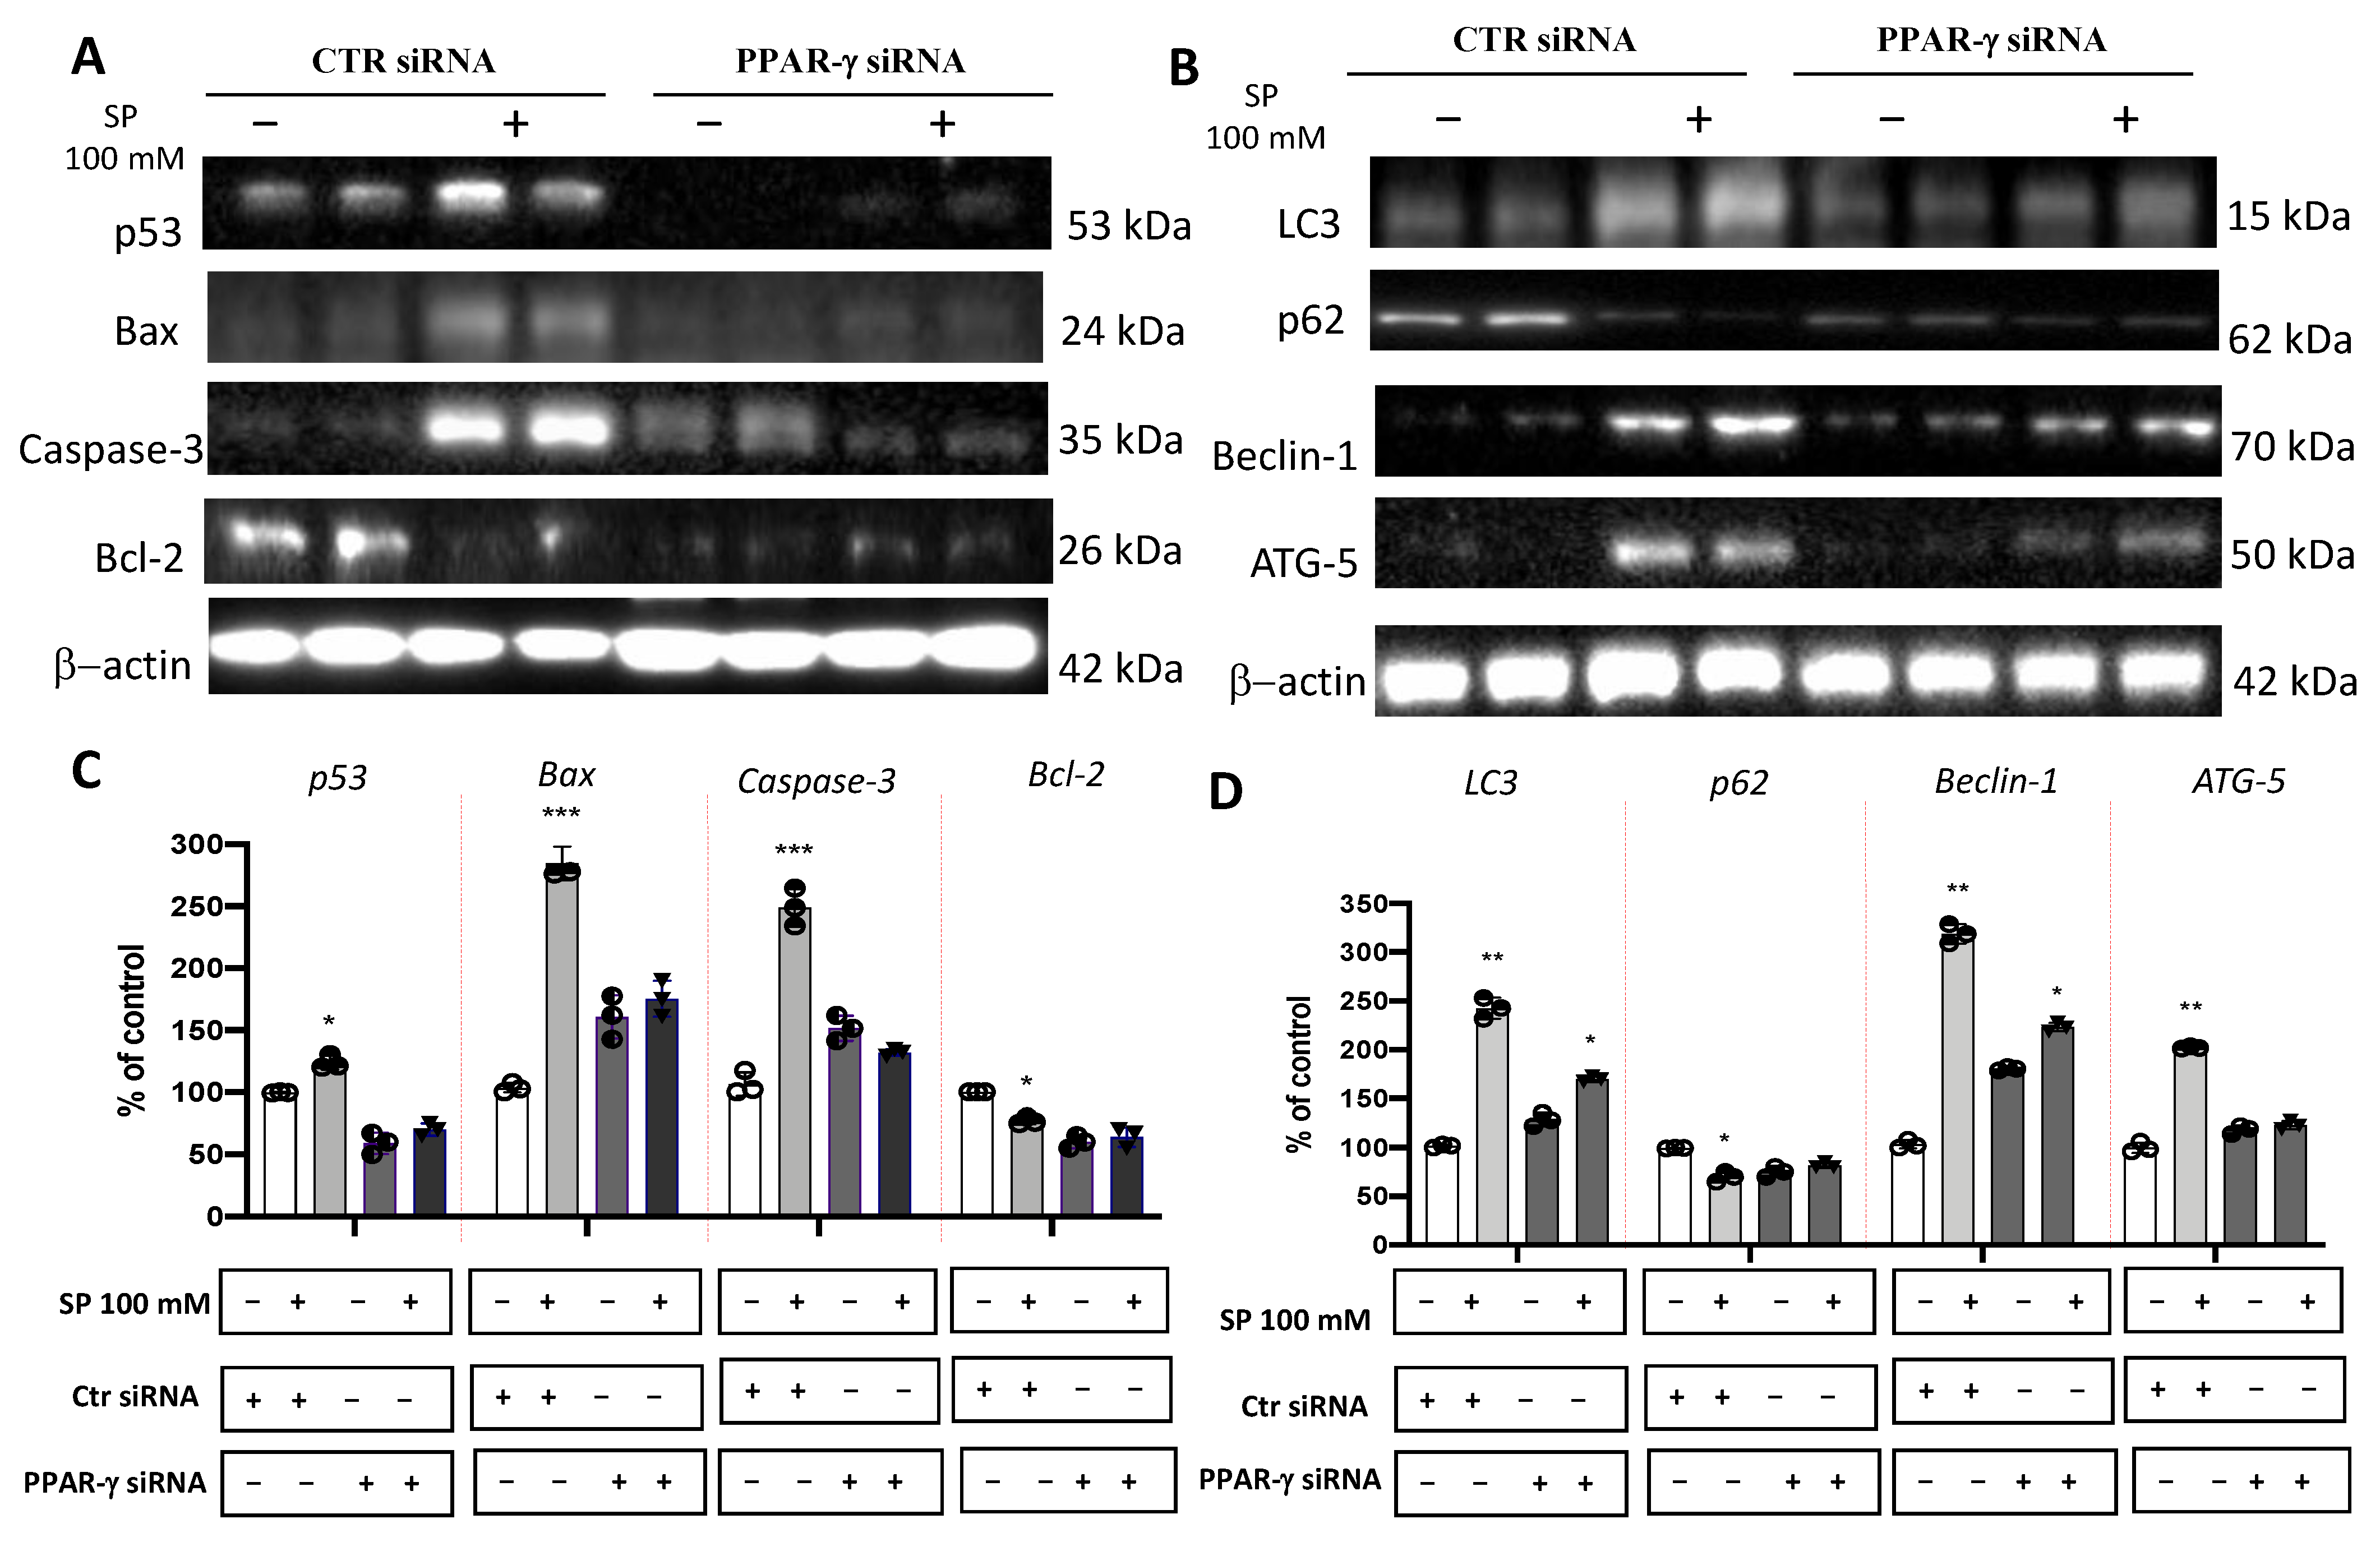
3.1.6. SP Stimulated Apoptosis and Autophagy Pathways in GBM through PPAR-γ Signaling
3.2. In Vivo Study
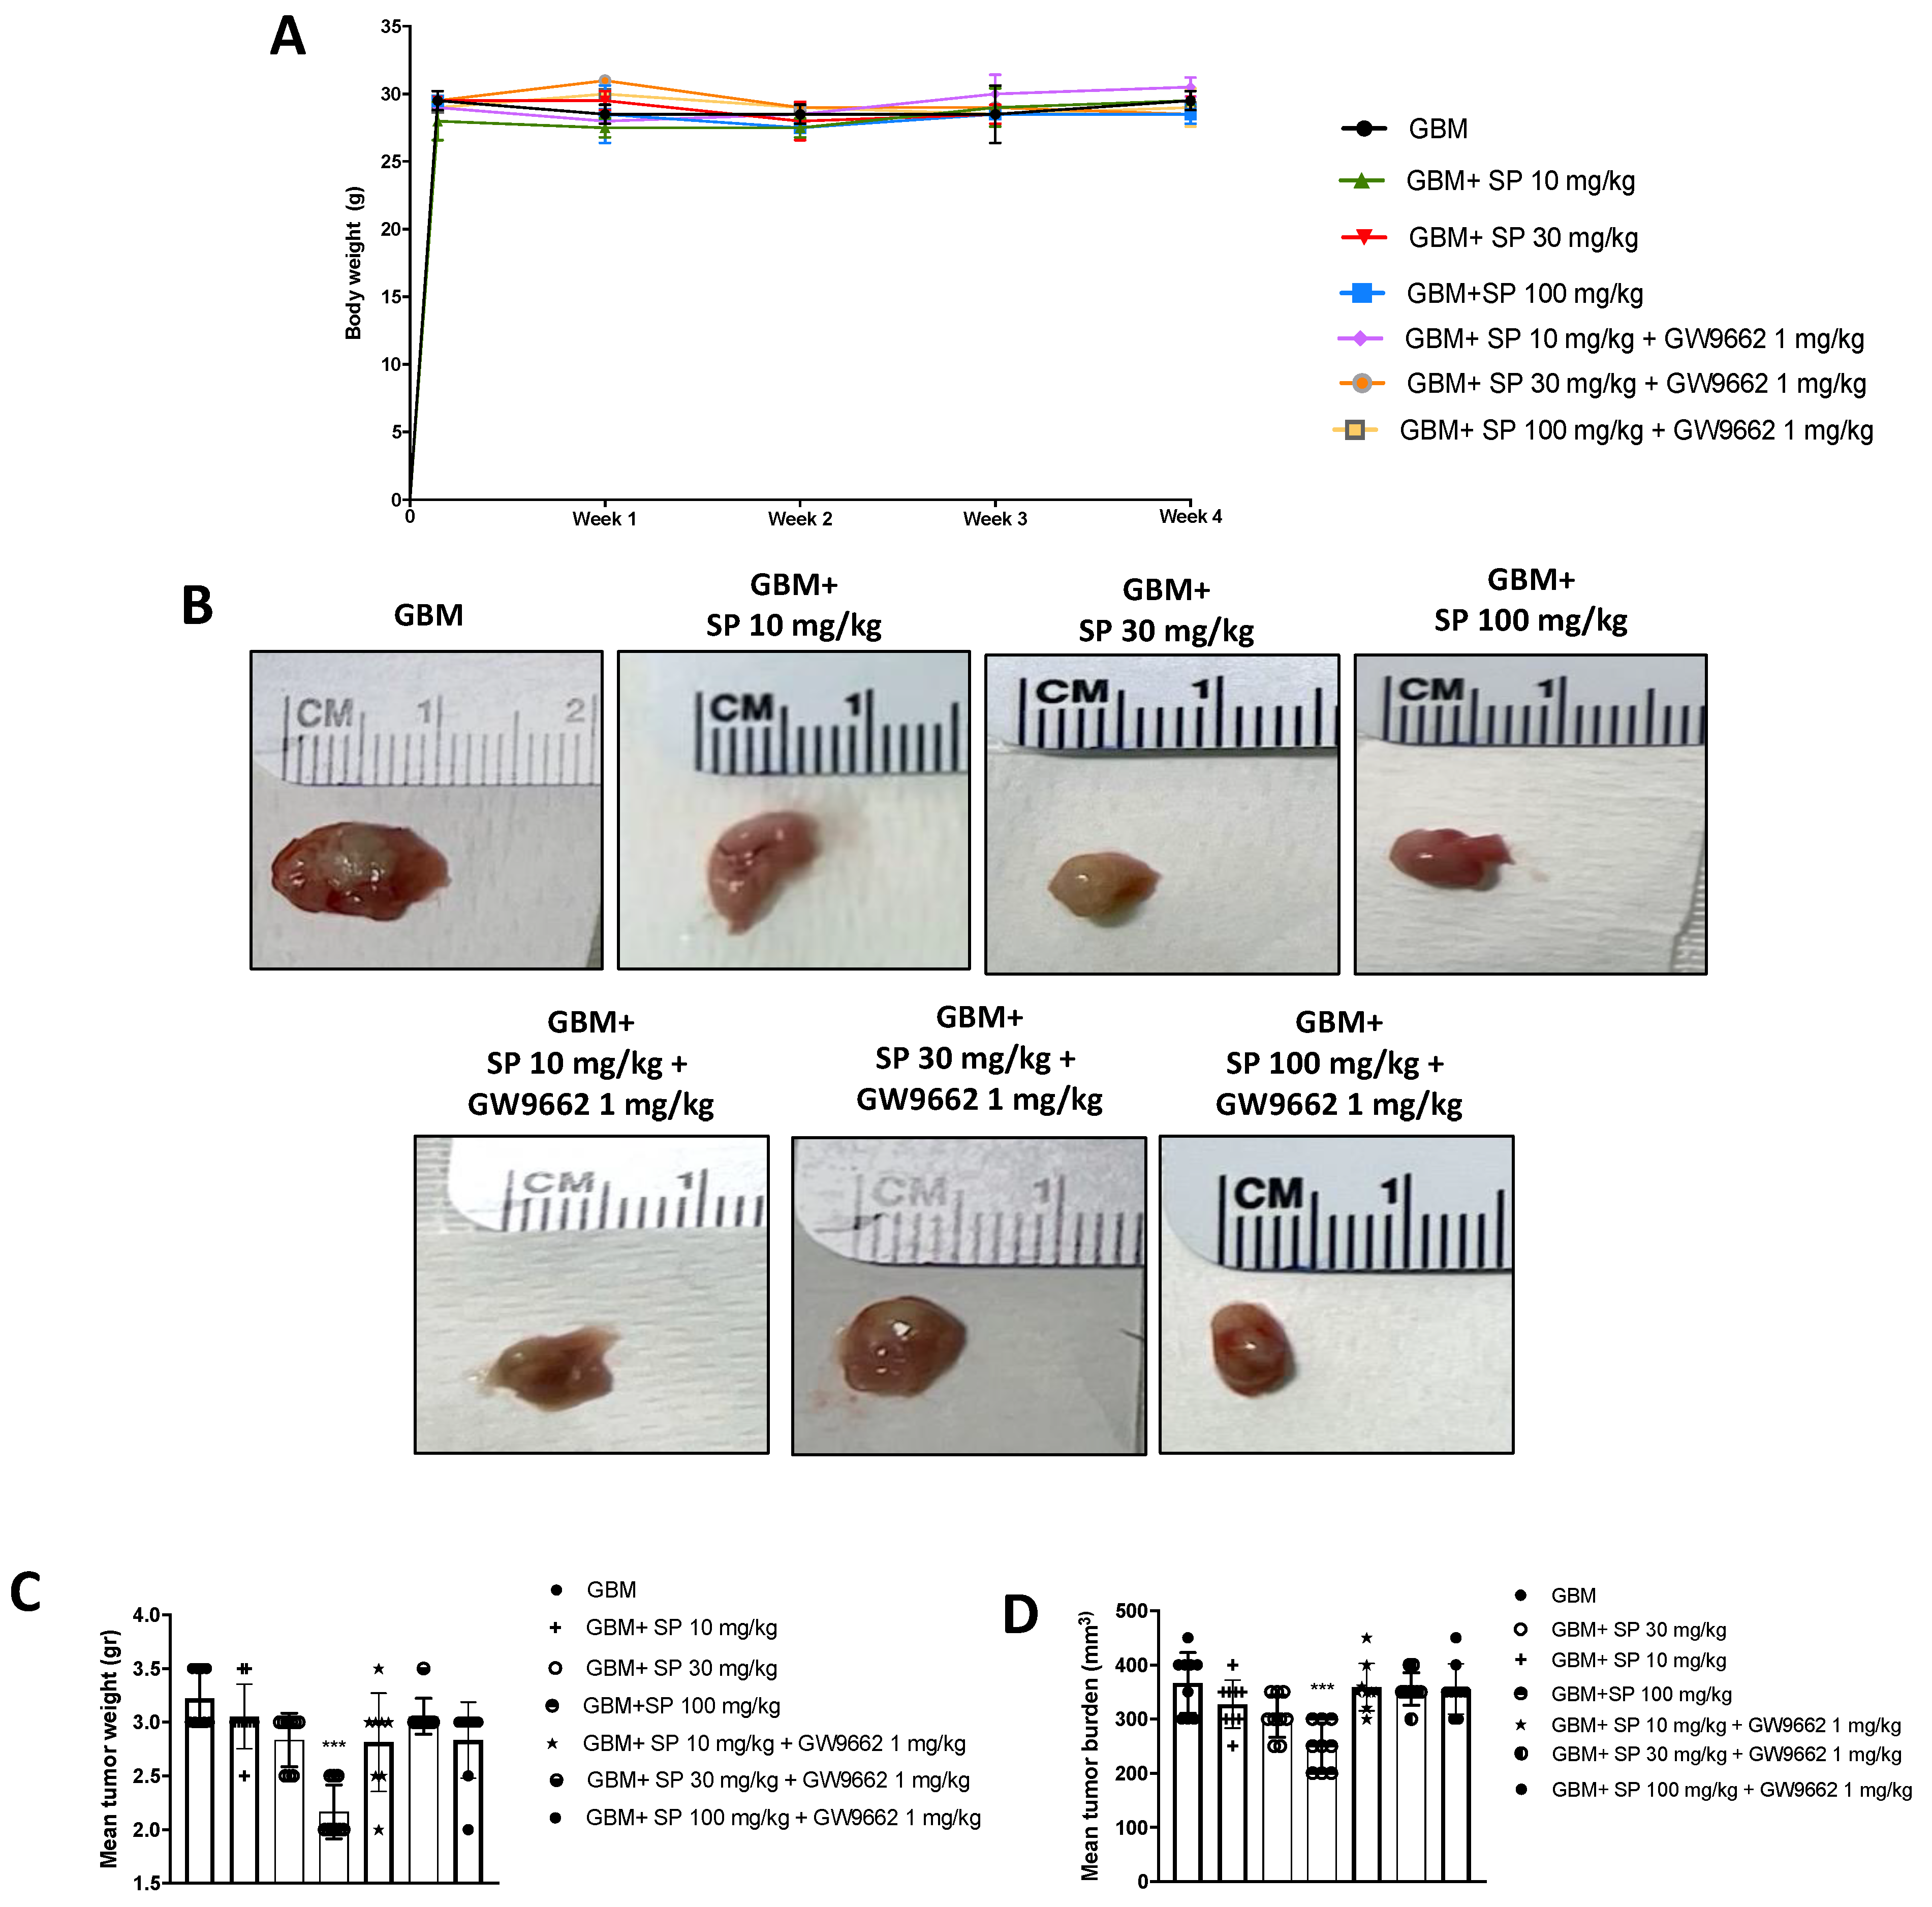
3.2.1. SP Arrested GBM Tumor Growth via PPAR-γ Signaling
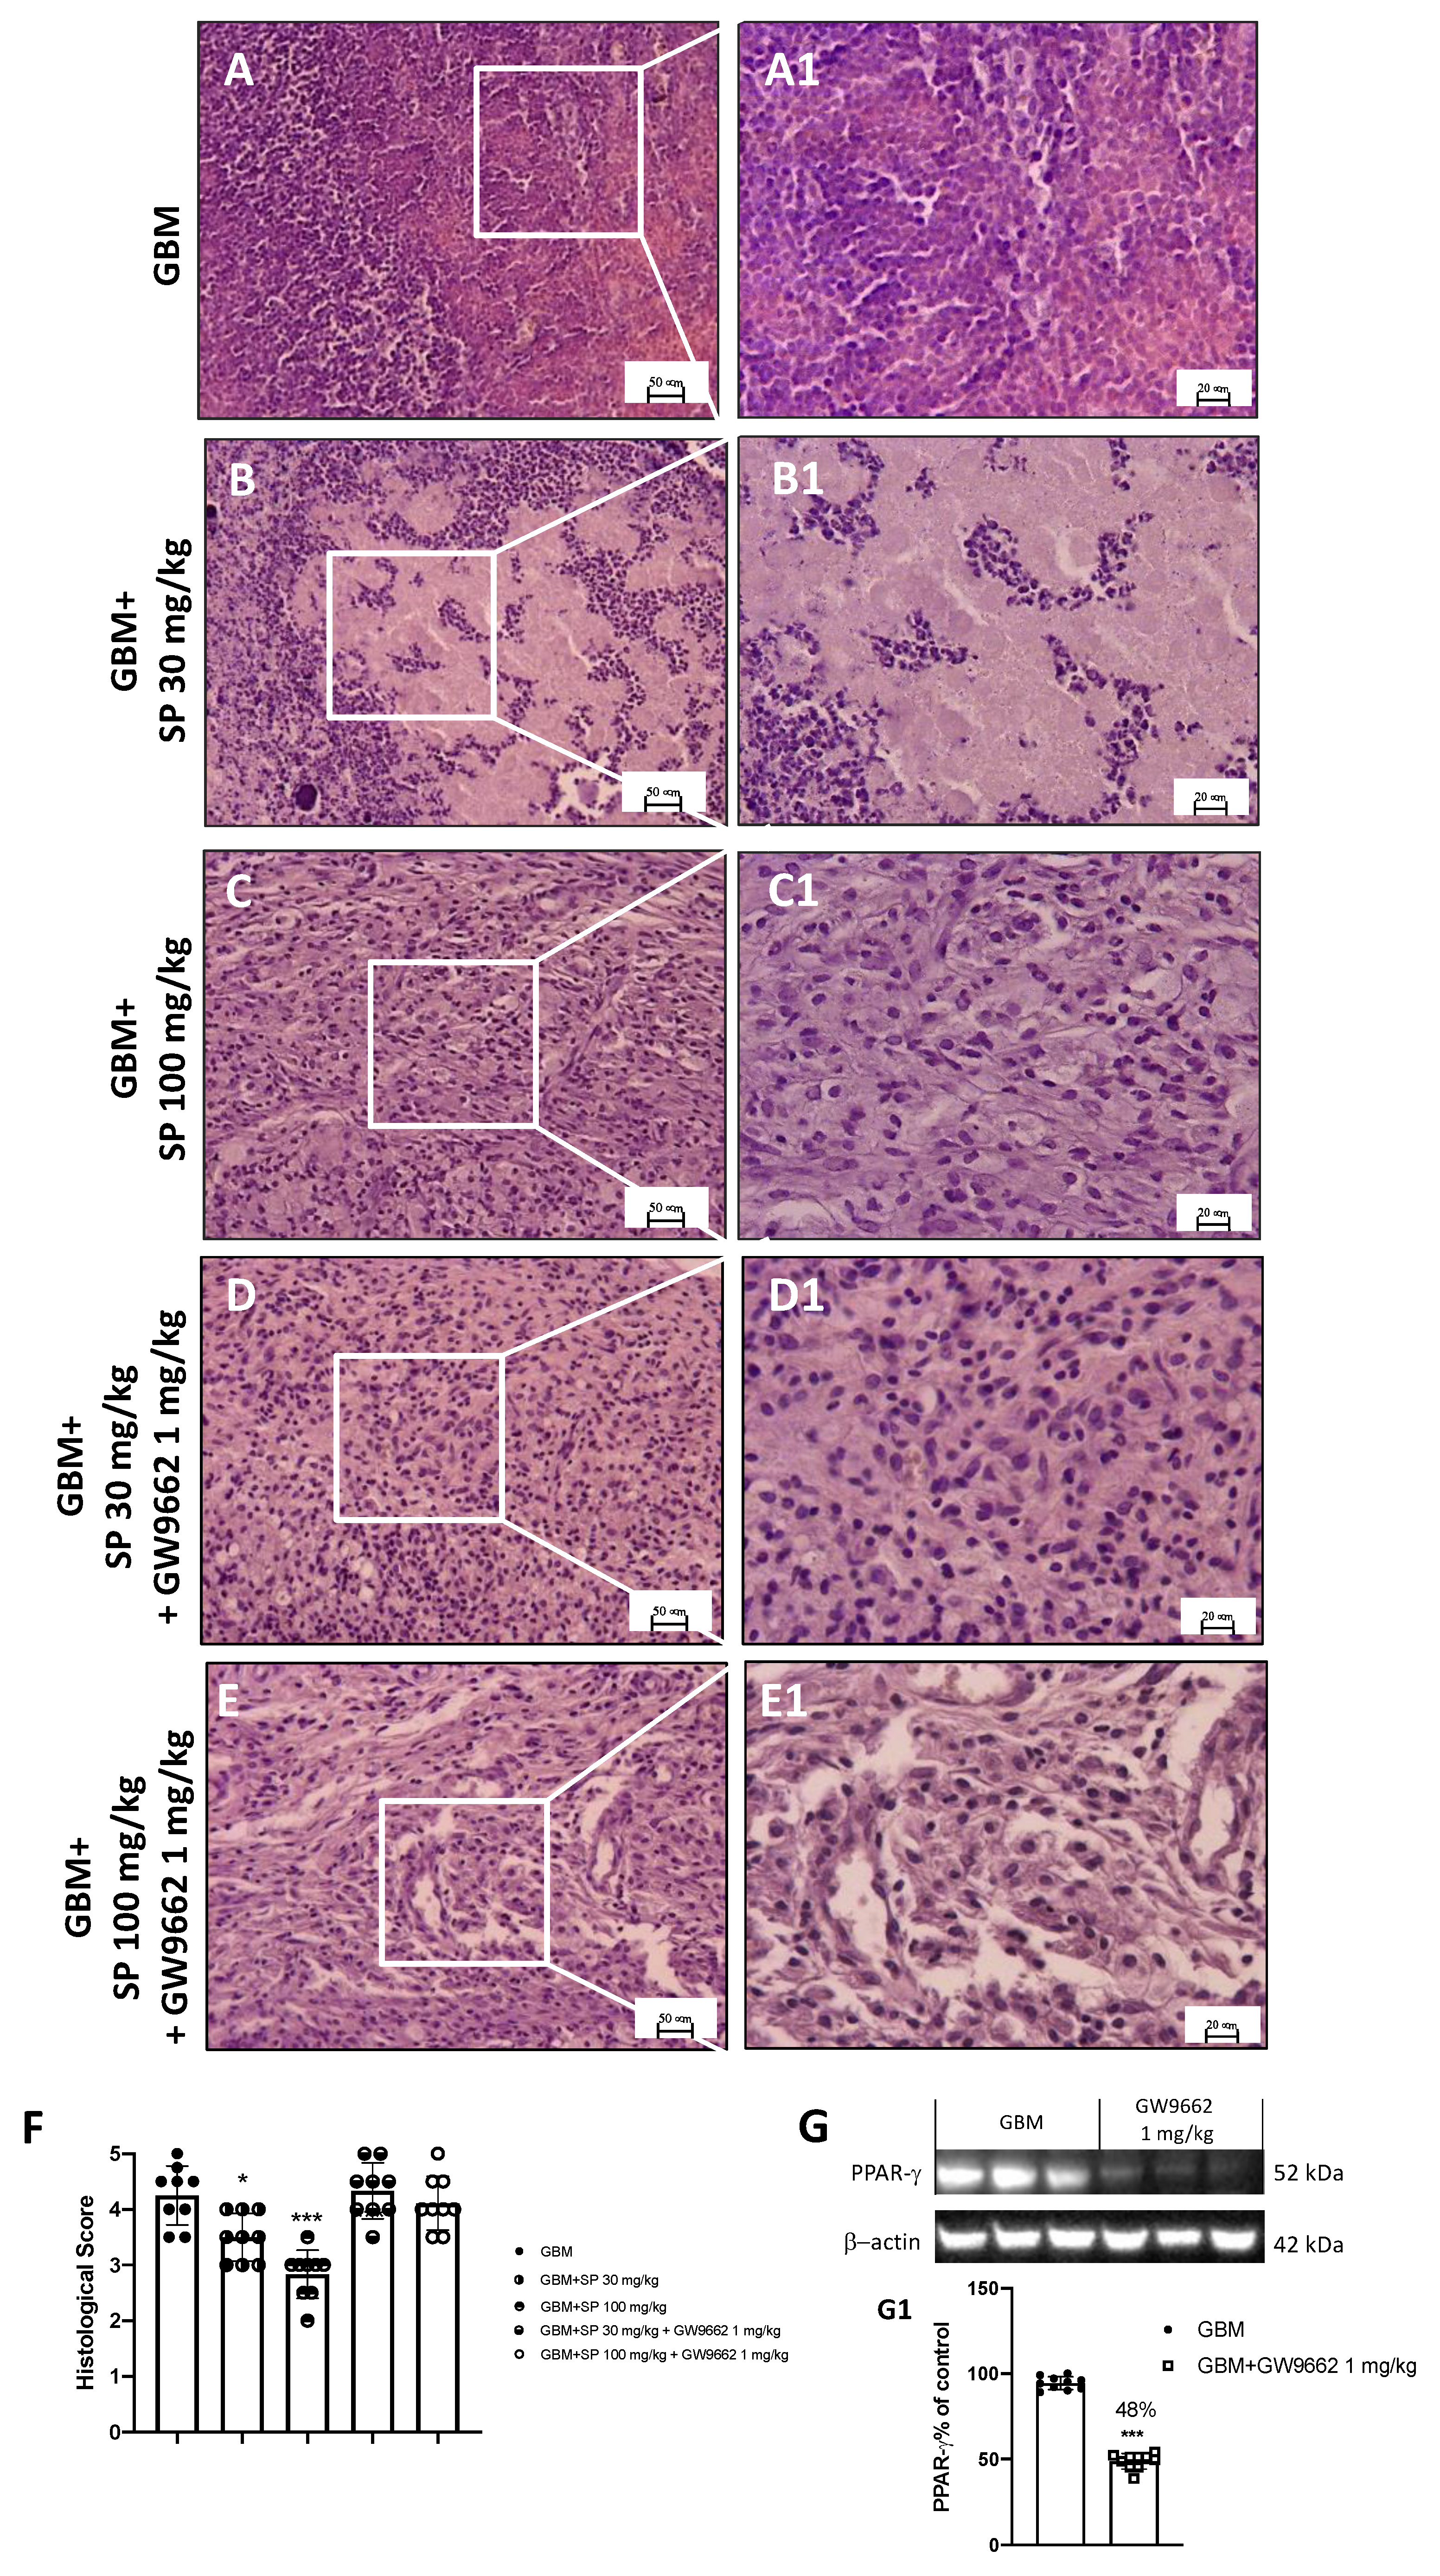
3.2.2. SP Treatment Resolved GBM Subcutaneous Tumor Mass Features
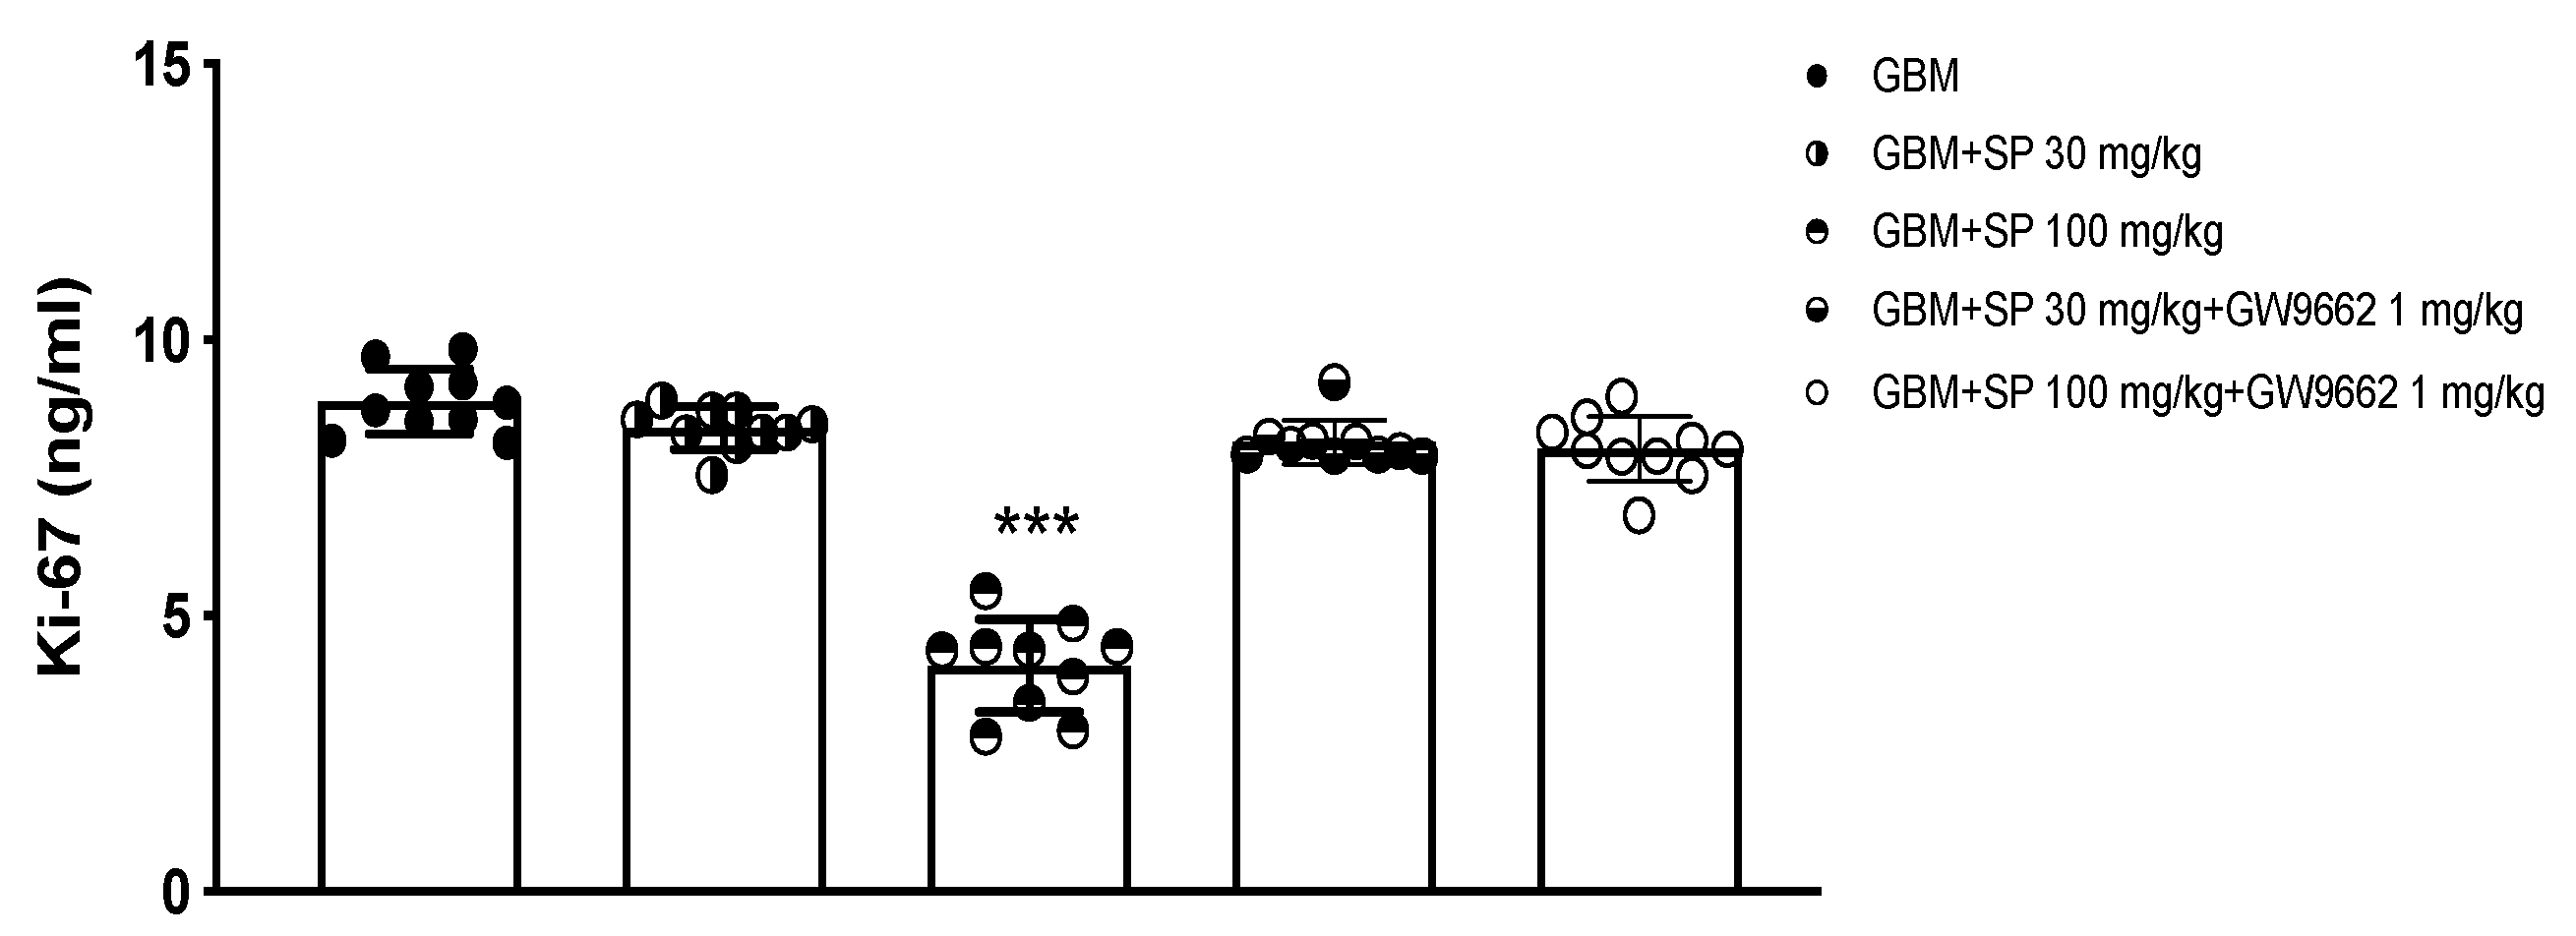
3.2.3. Proliferation Marker Ki-67 Expression Is Reduced by SP Treatment
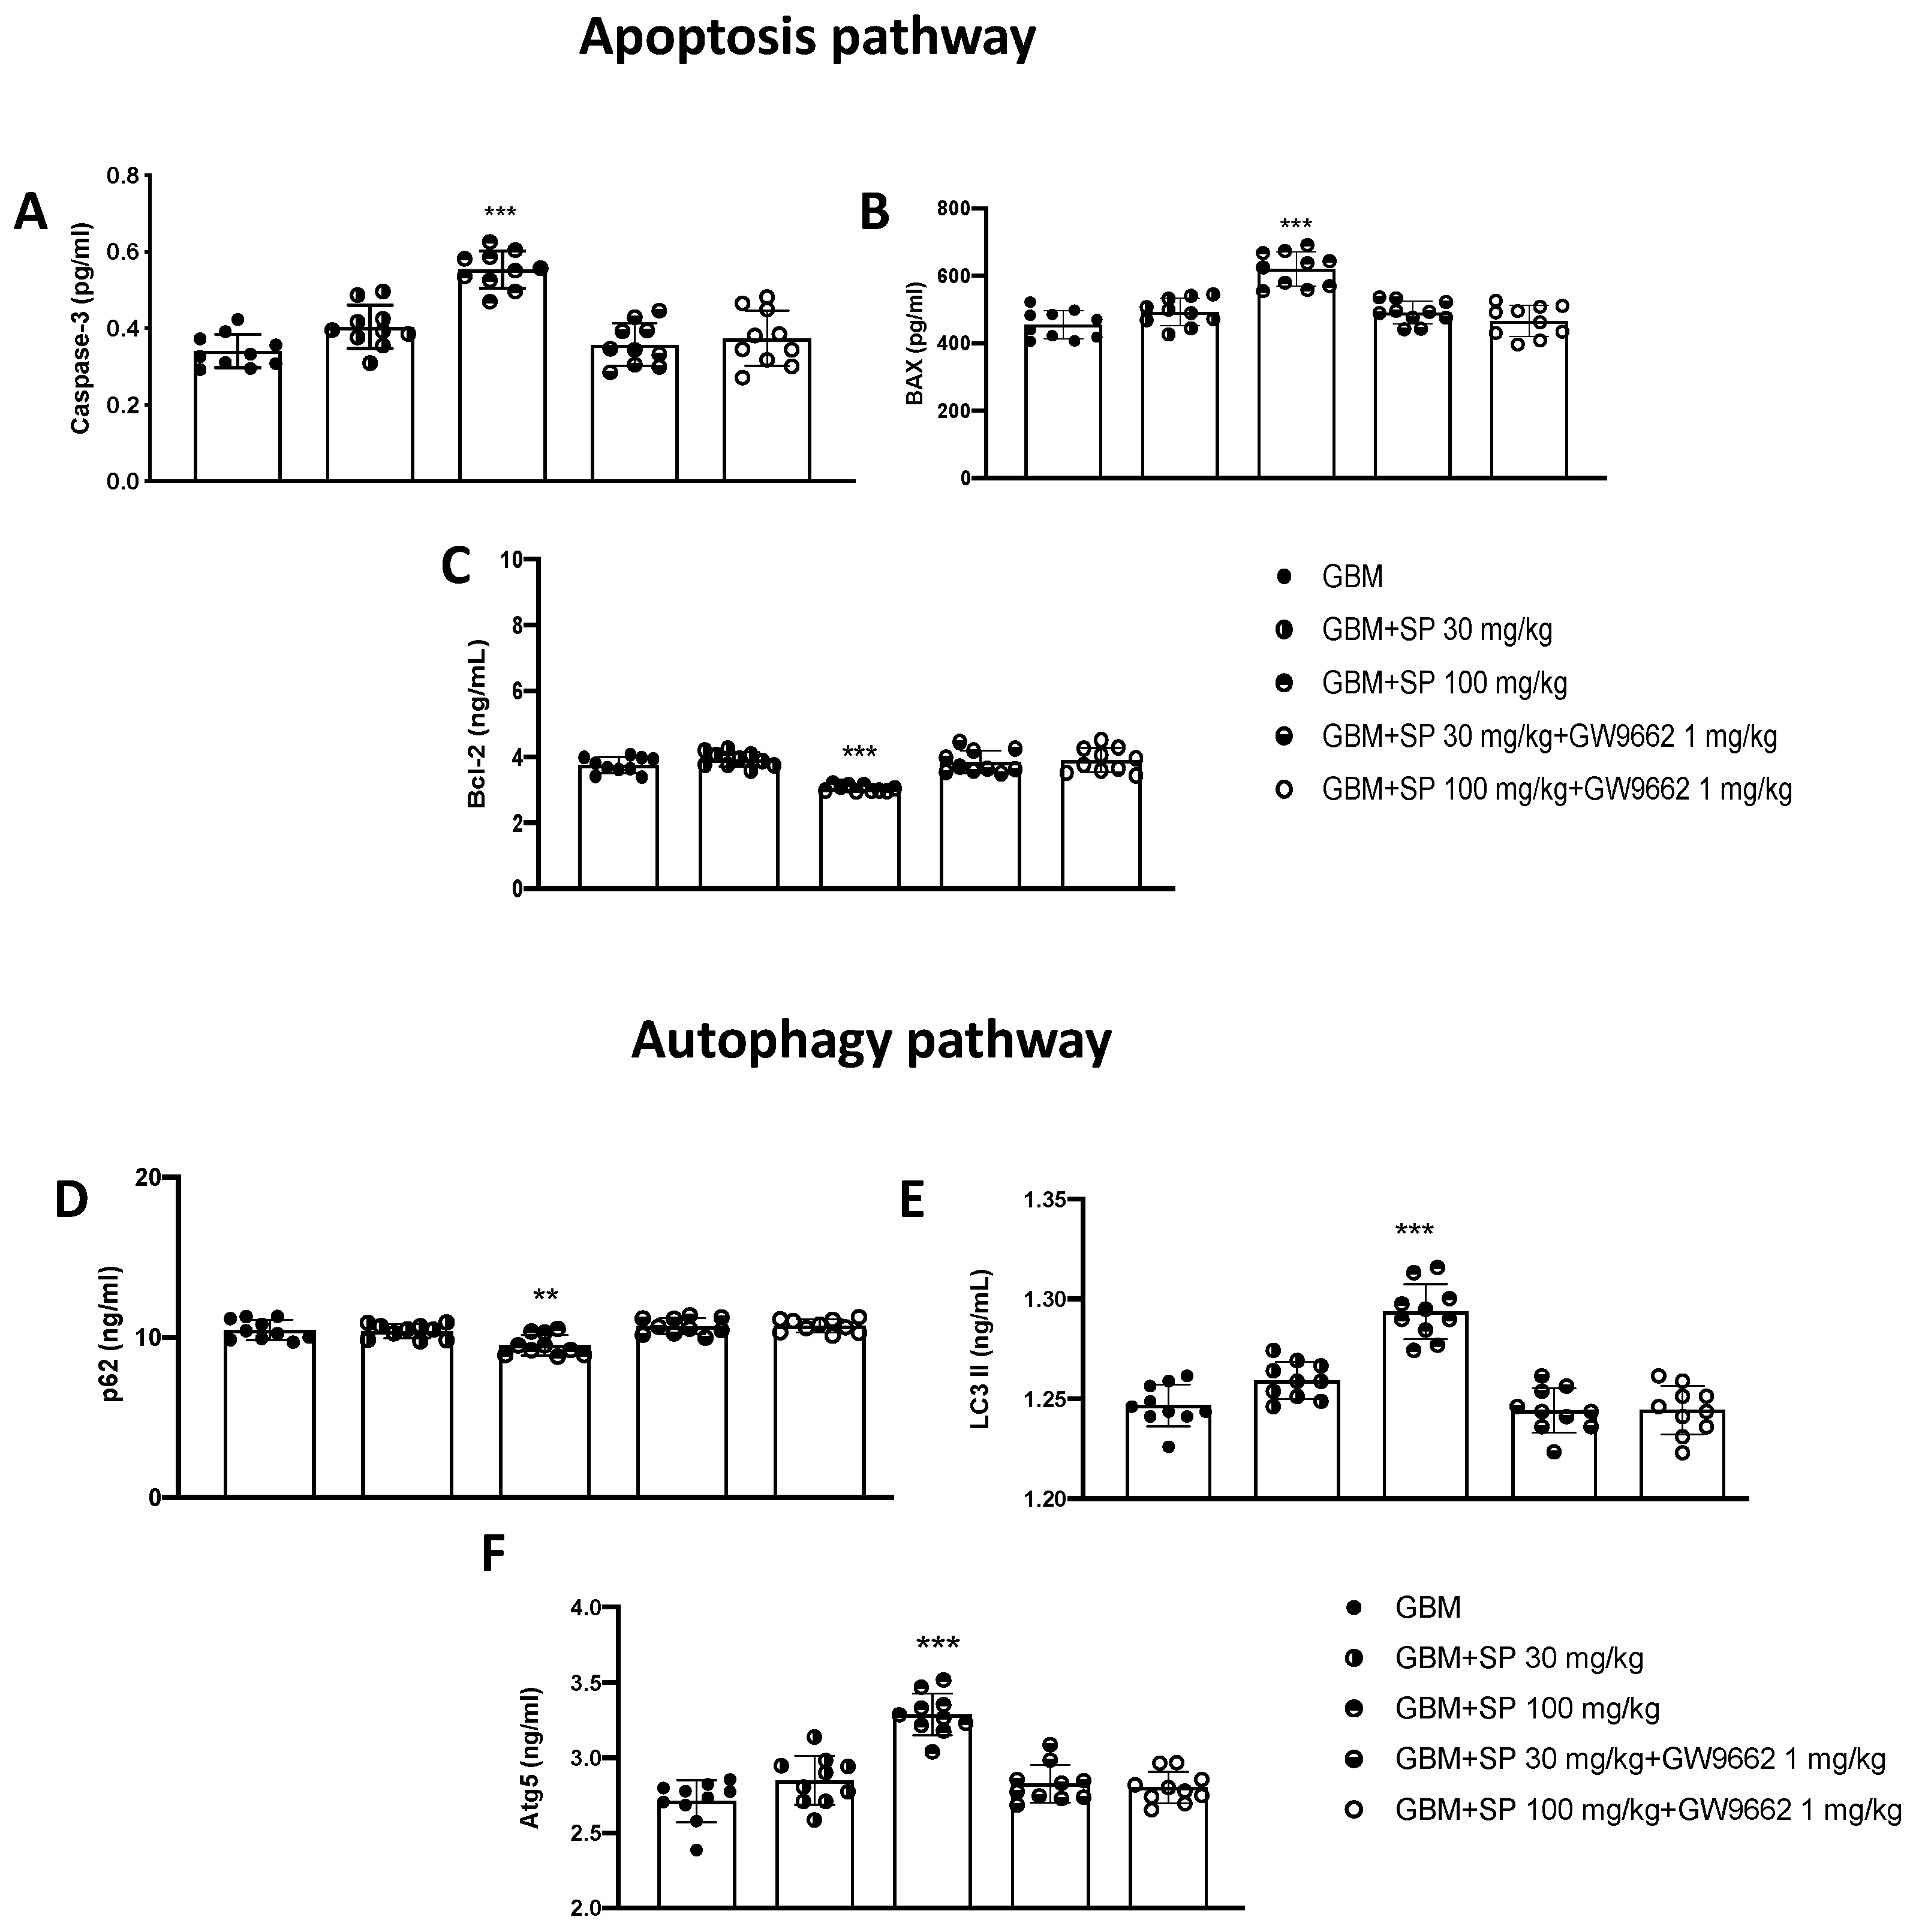
3.2.4. SP Treatment Promoted the Apoptosis and Autophagy Pathways in the GBM Tumor Mass through PPAR-γ Signaling
4. Discussion
5. Conclusions
Author Contributions
Funding
Institutional Review Board Statement
Informed Consent Statement
Data Availability Statement
Conflicts of Interest
References
- Wu, W.; Klockow, J.L.; Zhang, M.; Lafortune, F.; Chang, E.; Jin, L.; Wu, Y.; Daldrup-Link, H.E. Glioblastoma multiforme (GBM): An overview of current therapies and mechanisms of resistance. Pharmacol. Res. 2021, 171, 105780. [Google Scholar] [CrossRef]
- Esemen, Y.; Awan, M.; Parwez, R.; Baig, A.; Rahman, S.; Masala, I.; Franchini, S.; Giakoumettis, D. Molecular Pathogenesis of Glioblastoma in Adults and Future Perspectives: A Systematic Review. Int. J. Mol. Sci. 2022, 23, 2607. [Google Scholar] [CrossRef]
- Ghaemi, S.; Fekrirad, Z.; Zamani, N.; Rahmani, R.; Arefian, E. Non-coding RNAs enhance the apoptosis efficacy of therapeutic agents used for the treatment of glioblastoma multiform. J. Drug Target. 2022, 30, 589–602. [Google Scholar] [CrossRef]
- Harris, S.L.; Levine, A.J. The p53 pathway: Positive and negative feedback loops. Oncogene 2005, 24, 2899–2908. [Google Scholar] [CrossRef] [Green Version]
- Filippone, A.; Li, J.G.; Pratico, D. VPS35 Downregulation Alters Degradation Pathways in Neuronal Cells. J. Alzheimers Dis. 2021, 84, 1079–1089. [Google Scholar] [CrossRef]
- Filippone, A.; Smith, T.; Pratico, D. Dysregulation of the Retromer Complex in Brain Endothelial Cells Results in Accumulation of Phosphorylated Tau. J. Inflamm. Res. 2021, 14, 7455–7465. [Google Scholar] [CrossRef]
- Filippone, A.; Esposito, E.; Mannino, D.; Lyssenko, N.; Pratico, D. The contribution of altered neuronal autophagy to neurodegeneration. Pharmacol. Ther. 2022, 238, 108178. [Google Scholar] [CrossRef]
- Yang, K.; Luan, L.; Li, X.; Sun, X.; Yin, J. ERK inhibition in glioblastoma is associated with autophagy activation and tumorigenesis suppression. J. Neurooncol. 2022, 156, 123–137. [Google Scholar] [CrossRef]
- Wang, J.; Sun, C.; Li, J.; Jiang, H.; Qiu, Y.; Gong, M. Knockdown of ETV4 promotes autophagy-dependent apoptosis in GBM cells by reducing the transcriptional activation of EMP1. Oncol. Lett. 2022, 23, 41. [Google Scholar] [CrossRef]
- Xu, S.; Yan, X.; Tang, L.; Dai, G.; Luo, C. A Nanoparticle-Conjugated Anti-TBK1 siRNA Induces Autophagy-Related Apoptosis and Enhances cGAS-STING Pathway in GBM Cells. Evid. Based Complement. Alternat Med. 2021, 2021, 6521953. [Google Scholar] [CrossRef]
- Lanza, M.; Filippone, A.; Ardizzone, A.; Casili, G.; Paterniti, I.; Esposito, E.; Campolo, M. SCFA Treatment Alleviates Pathological Signs of Migraine and Related Intestinal Alterations in a Mouse Model of NTG-Induced Migraine. Cells 2021, 10, 2756. [Google Scholar] [CrossRef]
- Filippone, A.; Lanza, M.; Campolo, M.; Casili, G.; Paterniti, I.; Cuzzocrea, S.; Esposito, E. The Anti-Inflammatory and Antioxidant Effects of Sodium Propionate. Int. J. Mol. Sci. 2020, 21, 3026. [Google Scholar] [CrossRef]
- Lanza, M.; Campolo, M.; Casili, G.; Filippone, A.; Paterniti, I.; Cuzzocrea, S.; Esposito, E. Sodium Butyrate Exerts Neuroprotective Effects in Spinal Cord Injury. Mol. Neurobiol. 2019, 56, 3937–3947. [Google Scholar] [CrossRef]
- Lefebvre, A.M.; Chen, I.; Desreumaux, P.; Najib, J.; Fruchart, J.C.; Geboes, K.; Briggs, M.; Heyman, R.; Auwerx, J. Activation of the peroxisome proliferator-activated receptor gamma promotes the development of colon tumors in C57BL/6J-APCMin/+ mice. Nat. Med. 1998, 4, 1053–1057. [Google Scholar] [CrossRef]
- Xie, Q.S.; Zhang, J.X.; Liu, M.; Liu, P.H.; Wang, Z.J.; Zhu, L.; Jiang, L.; Jin, M.M.; Liu, X.N.; Liu, L.; et al. Short-chain fatty acids exert opposite effects on the expression and function of p-glycoprotein and breast cancer resistance protein in rat intestine. Acta Pharmacol. Sin. 2021, 42, 470–481. [Google Scholar] [CrossRef]
- Schwab, M.; Reynders, V.; Ulrich, S.; Zahn, N.; Stein, J.; Schroder, O. PPARgamma is a key target of butyrate-induced caspase-3 activation in the colorectal cancer cell line Caco-2. Apoptosis 2006, 11, 1801–1811. [Google Scholar] [CrossRef]
- Sanjay, S.; Sharma, A.; Lee, H.J. Role of Phytoconstituents as PPAR Agonists: Implications for Neurodegenerative Disorders. Biomedicines 2021, 9, 1914. [Google Scholar] [CrossRef]
- Liang, C.C.; Park, A.Y.; Guan, J.L. In vitro scratch assay: A convenient and inexpensive method for analysis of cell migration in vitro. Nat. Protoc. 2007, 2, 329–333. [Google Scholar] [CrossRef] [Green Version]
- Paterniti, I.; Cordaro, M.; Campolo, M.; Siracusa, R.; Cornelius, C.; Navarra, M.; Cuzzocrea, S.; Esposito, E. Neuroprotection by association of palmitoylethanolamide with luteolin in experimental Alzheimer’s disease models: The control of neuroinflammation. CNS Neurol. Disord. Drug Targets 2014, 13, 1530–1541. [Google Scholar] [CrossRef]
- Filippone, A.; Casili, G.; Ardizzone, A.; Lanza, M.; Mannino, D.; Paterniti, I.; Esposito, E.; Campolo, M. Inhibition of Prolyl Oligopeptidase Prevents Consequences of Reperfusion following Intestinal Ischemia. Biomedicines 2021, 9, 1354. [Google Scholar] [CrossRef]
- Lopez-Valero, I.; Saiz-Ladera, C.; Torres, S.; Hernandez-Tiedra, S.; Garcia-Taboada, E.; Rodriguez-Fornes, F.; Barba, M.; Davila, D.; Salvador-Tormo, N.; Guzman, M.; et al. Targeting Glioma Initiating Cells with A combined therapy of cannabinoids and temozolomide. Biochem. Pharmacol. 2018, 157, 266–274. [Google Scholar] [CrossRef] [PubMed]
- Filippone, A.; Lanza, M.; Campolo, M.; Casili, G.; Paterniti, I.; Cuzzocrea, S.; Esposito, E. Protective effect of sodium propionate in Abeta(1-42) -induced neurotoxicity and spinal cord trauma. Neuropharmacology 2020, 166, 107977. [Google Scholar] [CrossRef] [PubMed]
- Paterniti, I.; Impellizzeri, D.; Crupi, R.; Morabito, R.; Campolo, M.; Esposito, E.; Cuzzocrea, S. Molecular evidence for the involvement of PPAR-delta and PPAR-gamma in anti-inflammatory and neuroprotective activities of palmitoylethanolamide after spinal cord trauma. J. Neuroinflammation 2013, 10, 20. [Google Scholar] [CrossRef] [PubMed] [Green Version]
- Scuderi, S.A.; Casili, G.; Ardizzone, A.; Forte, S.; Colarossi, L.; Sava, S.; Paterniti, I.; Esposito, E.; Cuzzocrea, S.; Campolo, M. KYP-2047, an Inhibitor of Prolyl-Oligopeptidase, Reduces GlioBlastoma Proliferation through Angiogenesis and Apoptosis Modulation. Cancers 2021, 13, 3444. [Google Scholar] [CrossRef] [PubMed]
- Casili, G.; Caffo, M.; Campolo, M.; Barresi, V.; Caruso, G.; Cardali, S.M.; Lanza, M.; Mallamace, R.; Filippone, A.; Conti, A.; et al. TLR-4/Wnt modulation as new therapeutic strategy in the treatment of glioblastomas. Oncotarget 2018, 9, 37564–37580. [Google Scholar] [CrossRef] [Green Version]
- Cuperlovic-Culf, M.; Khieu, N.H.; Surendra, A.; Hewitt, M.; Charlebois, C.; Sandhu, J.K. Analysis and Simulation of Glioblastoma Cell Lines-Derived Extracellular Vesicles Metabolome. Metabolites 2020, 10, 88. [Google Scholar] [CrossRef] [PubMed]
- Maszczyk, M.; Banach, K.; Karkoszka, M.; Rzepka, Z.; Rok, J.; Beberok, A.; Wrzesniok, D. Chemosensitization of U-87 MG Glioblastoma Cells by Neobavaisoflavone towards Doxorubicin and Etoposide. Int. J. Mol. Sci. 2022, 23, 5621. [Google Scholar] [CrossRef] [PubMed]
- Yu, S.C.; Ping, Y.F.; Yi, L.; Zhou, Z.H.; Chen, J.H.; Yao, X.H.; Gao, L.; Wang, J.M.; Bian, X.W. Isolation and characterization of cancer stem cells from a human glioblastoma cell line U87. Cancer Lett. 2008, 265, 124–134. [Google Scholar] [CrossRef]
- Lenting, K.; Verhaak, R.; Ter Laan, M.; Wesseling, P.; Leenders, W. Glioma: Experimental models and reality. Acta Neuropathol. 2017, 133, 263–282. [Google Scholar] [CrossRef] [Green Version]
- Kashani, A.S.; Packirisamy, M. Cancer cells optimize elasticity for efficient migration. R. Soc. Open Sci. 2020, 7, 200747. [Google Scholar] [CrossRef]
- Gousias, K.; Theocharous, T.; Simon, M. Mechanisms of Cell Cycle Arrest and Apoptosis in Glioblastoma. Biomedicines 2022, 10, 564. [Google Scholar] [CrossRef]
- Petrosyan, E.; Fares, J.; Cordero, A.; Rashidi, A.; Arrieta, V.A.; Kanojia, D.; Lesniak, M.S. Repurposing autophagy regulators in brain tumors. Int. J. Cancer 2022, 151, 167–180. [Google Scholar] [CrossRef] [PubMed]
- Runwal, G.; Stamatakou, E.; Siddiqi, F.H.; Puri, C.; Zhu, Y.; Rubinsztein, D.C. LC3-positive structures are prominent in autophagy-deficient cells. Sci. Rep. 2019, 9, 10147. [Google Scholar] [CrossRef] [PubMed] [Green Version]
- Galluzzi, L.; Baehrecke, E.H.; Ballabio, A.; Boya, P.; Bravo-San Pedro, J.M.; Cecconi, F.; Choi, A.M.; Chu, C.T.; Codogno, P.; Colombo, M.I.; et al. Molecular definitions of autophagy and related processes. EMBO J. 2017, 36, 1811–1836. [Google Scholar] [CrossRef]
- Tanida, I.; Ueno, T.; Kominami, E. LC3 and Autophagy. Methods Mol. Biol. 2008, 445, 77–88. [Google Scholar] [CrossRef] [PubMed]
- Annovazzi, L.; Mellai, M.; Schiffer, D. Chemotherapeutic Drugs: DNA Damage and Repair in Glioblastoma. Cancers 2017, 9, 57. [Google Scholar] [CrossRef] [Green Version]
- Basilotta, R.; Lanza, M.; Casili, G.; Chisari, G.; Munao, S.; Colarossi, L.; Cucinotta, L.; Campolo, M.; Esposito, E.; Paterniti, I. Potential Therapeutic Effects of PPAR Ligands in Glioblastoma. Cells 2022, 11, 621. [Google Scholar] [CrossRef]
- Cheng, H.S.; Yip, Y.S.; Lim, E.K.Y.; Wahli, W.; Tan, N.S. PPARs and Tumor Microenvironment: The Emerging Roles of the Metabolic Master Regulators in Tumor Stromal-Epithelial Crosstalk and Carcinogenesis. Cancers 2021, 13, 2153. [Google Scholar] [CrossRef]
- Elix, C.; Pal, S.K.; Jones, J.O. The role of peroxisome proliferator-activated receptor gamma in prostate cancer. Asian J. Androl. 2018, 20, 238–243. [Google Scholar] [CrossRef]
- Ferrari, S.M.; Materazzi, G.; Baldini, E.; Ulisse, S.; Miccoli, P.; Antonelli, A.; Fallahi, P. Antineoplastic Effects of PPARgamma Agonists, with a Special Focus on Thyroid Cancer. Curr. Med. Chem. 2016, 23, 636–649. [Google Scholar] [CrossRef]
- Ravi Kiran Ammu, V.V.V.; Garikapati, K.K.; Krishnamurthy, P.T.; Chintamaneni, P.K.; Pindiprolu, S. Possible role of PPAR-gamma and COX-2 receptor modulators in the treatment of Non-Small Cell lung carcinoma. Med. Hypotheses 2019, 124, 98–100. [Google Scholar] [CrossRef] [PubMed]
- den Besten, G.; Bleeker, A.; Gerding, A.; van Eunen, K.; Havinga, R.; van Dijk, T.H.; Oosterveer, M.H.; Jonker, J.W.; Groen, A.K.; Reijngoud, D.J.; et al. Short-Chain Fatty Acids Protect Against High-Fat Diet-Induced Obesity via a PPARgamma-Dependent Switch From Lipogenesis to Fat Oxidation. Diabetes 2015, 64, 2398–2408. [Google Scholar] [CrossRef] [PubMed] [Green Version]
- Alex, S.; Lange, K.; Amolo, T.; Grinstead, J.S.; Haakonsson, A.K.; Szalowska, E.; Koppen, A.; Mudde, K.; Haenen, D.; Al-Lahham, S.; et al. Short-chain fatty acids stimulate angiopoietin-like 4 synthesis in human colon adenocarcinoma cells by activating peroxisome proliferator-activated receptor gamma. Mol. Cell. Biol. 2013, 33, 1303–1316. [Google Scholar] [CrossRef] [Green Version]
- Samid, D.; Wells, M.; Greene, M.E.; Shen, W.; Palmer, C.N.; Thibault, A. Peroxisome proliferator-activated receptor gamma as a novel target in cancer therapy: Binding and activation by an aromatic fatty acid with clinical antitumor activity. Clin. Cancer Res. 2000, 6, 933–941. [Google Scholar] [PubMed]
- Rautiola, J.; Lampinen, A.; Mirtti, T.; Ristimaki, A.; Joensuu, H.; Bono, P.; Saharinen, P. Association of Angiopoietin-2 and Ki-67 Expression with Vascular Density and Sunitinib Response in Metastatic Renal Cell Carcinoma. PLoS ONE 2016, 11, e0153745. [Google Scholar] [CrossRef] [PubMed] [Green Version]
- Zhang, J.; Cai, H.; Sun, L.; Zhan, P.; Chen, M.; Zhang, F.; Ran, Y.; Wan, J. LGR5, a novel functional glioma stem cell marker, promotes EMT by activating the Wnt/beta-catenin pathway and predicts poor survival of glioma patients. J. Exp. Clin. Cancer Res. 2018, 37, 225. [Google Scholar] [CrossRef]
- Liu, C.A.; Chang, C.Y.; Hsueh, K.W.; Su, H.L.; Chiou, T.W.; Lin, S.Z.; Harn, H.J. Migration/Invasion of Malignant Gliomas and Implications for Therapeutic Treatment. Int. J. Mol. Sci. 2018, 19, 1115. [Google Scholar] [CrossRef] [Green Version]
- Pattayil, L.; Balakrishnan-Saraswathi, H.T. In Vitro Evaluation of Apoptotic Induction of Butyric Acid Derivatives in Colorectal Carcinoma Cells. Anticancer Res 2019, 39, 3795–3801. [Google Scholar] [CrossRef]
- Lee, H.S.; Park, B.S.; Kang, H.M.; Kim, J.H.; Shin, S.H.; Kim, I.R. Role of Luteolin-Induced Apoptosis and Autophagy in Human Glioblastoma Cell Lines. Medicina 2021, 57, 879. [Google Scholar] [CrossRef]
- Huang, X.; Bai, H.M.; Chen, L.; Li, B.; Lu, Y.C. Reduced expression of LC3B-II and Beclin 1 in glioblastoma multiforme indicates a down-regulated autophagic capacity that relates to the progression of astrocytic tumors. J. Clin. Neurosci. 2010, 17, 1515–1519. [Google Scholar] [CrossRef]
- Feng, Y.; Wang, Y.; Wang, P.; Huang, Y.; Wang, F. Short-Chain Fatty Acids Manifest Stimulative and Protective Effects on Intestinal Barrier Function Through the Inhibition of NLRP3 Inflammasome and Autophagy. Cell. Physiol. Biochem. 2018, 49, 190–205. [Google Scholar] [CrossRef] [PubMed]
- Svyrydova, K.; Vasylieva, V.; Kropyvko, S.; Afanasieva, K.; Sivolob, A. Comparative characteristics of DNA loop domains rearrangement in glioblastoma multiforme T98G and glioblastoma astrocytoma U373 cell lines under different culture conditions. Exp. Oncol. 2021, 43, 306–311. [Google Scholar] [CrossRef] [PubMed]
- Gupta, G.; Singhvi, G.; Chellappan, D.K.; Sharma, S.; Mishra, A.; Dahiya, R.; de Jesus Andreoli Pinto, T.; Dua, K. Peroxisome proliferator-activated receptor gamma: Promising target in glioblastoma. Panminerva Med. 2018, 60, 109–116. [Google Scholar] [CrossRef] [PubMed]
- Strakova, N.; Ehrmann, J.; Dzubak, P.; Bouchal, J.; Kolar, Z. The synthetic ligand of peroxisome proliferator-activated receptor-gamma ciglitazone affects human glioblastoma cell lines. J. Pharmacol. Exp. Ther. 2004, 309, 1239–1247. [Google Scholar] [CrossRef] [PubMed] [Green Version]
- Bort, A.; Sanchez, B.G.; Mateos-Gomez, P.A.; Diaz-Laviada, I.; Rodriguez-Henche, N. Capsaicin Targets Lipogenesis in HepG2 Cells Through AMPK Activation, AKT Inhibition and PPARs Regulation. Int. J. Mol. Sci. 2019, 20, 1660. [Google Scholar] [CrossRef] [PubMed] [Green Version]
- Rovito, D.; Giordano, C.; Vizza, D.; Plastina, P.; Barone, I.; Casaburi, I.; Lanzino, M.; De Amicis, F.; Sisci, D.; Mauro, L.; et al. Omega-3 PUFA ethanolamides DHEA and EPEA induce autophagy through PPARgamma activation in MCF-7 breast cancer cells. J. Cell. Physiol. 2013, 228, 1314–1322. [Google Scholar] [CrossRef] [PubMed]
- Yamaguchi, A.; Teratani, T.; Chu, P.S.; Suzuki, T.; Taniki, N.; Mikami, Y.; Shiba, S.; Morikawa, R.; Amiya, T.; Aoki, R.; et al. Hepatic Adenosine Triphosphate Reduction Through the Short-Chain Fatty Acids-Peroxisome Proliferator-Activated Receptor gamma-Uncoupling Protein 2 Axis Alleviates Immune-Mediated Acute Hepatitis in Inulin-Supplemented Mice. Hepatol. Commun. 2021, 5, 1555–1570. [Google Scholar] [CrossRef]
- Wang, X.; Zhu, M.; Loor, J.J.; Jiang, Q.; Zhu, Y.; Li, W.; Du, X.; Song, Y.; Gao, W.; Lei, L.; et al. Propionate alleviates fatty acid-induced mitochondrial dysfunction, oxidative stress, and apoptosis by upregulating PPARG coactivator 1 alpha in hepatocytes. J. Dairy Sci. 2022, 105, 4581–4592. [Google Scholar] [CrossRef]
- Zou, Y.; Watters, A.; Cheng, N.; Perry, C.E.; Xu, K.; Alicea, G.M.; Parris, J.L.D.; Baraban, E.; Ray, P.; Nayak, A.; et al. Polyunsaturated Fatty Acids from Astrocytes Activate PPARgamma Signaling in Cancer Cells to Promote Brain Metastasis. Cancer Discov. 2019, 9, 1720–1735. [Google Scholar] [CrossRef] [Green Version]
- Zhang, J.; Cheng, P.; Dai, W.; Ji, J.; Wu, L.; Feng, J.; Wu, J.; Yu, Q.; Li, J.; Guo, C. Fenofibrate Ameliorates Hepatic Ischemia/Reperfusion Injury in Mice: Involvements of Apoptosis, Autophagy, and PPAR-alpha Activation. PPAR Res. 2021, 2021, 6658944. [Google Scholar] [CrossRef]
- Winkler, F.; Kozin, S.V.; Tong, R.T.; Chae, S.S.; Booth, M.F.; Garkavtsev, I.; Xu, L.; Hicklin, D.J.; Fukumura, D.; di Tomaso, E.; et al. Kinetics of vascular normalization by VEGFR2 blockade governs brain tumor response to radiation: Role of oxygenation, angiopoietin-1, and matrix metalloproteinases. Cancer Cell 2004, 6, 553–563. [Google Scholar] [CrossRef] [PubMed] [Green Version]
- D’Alessio, A.; Proietti, G.; Sica, G.; Scicchitano, B.M. Pathological and Molecular Features of Glioblastoma and Its Peritumoral Tissue. Cancers 2019, 11, 469. [Google Scholar] [CrossRef] [PubMed] [Green Version]
- Wojtowicz, A.K.; Szychowski, K.A.; Kajta, M. PPAR-gamma agonist GW1929 but not antagonist GW9662 reduces TBBPA-induced neurotoxicity in primary neocortical cells. Neurotox. Res. 2014, 25, 311–322. [Google Scholar] [CrossRef] [PubMed] [Green Version]
- Berge, K.; Tronstad, K.J.; Flindt, E.N.; Rasmussen, T.H.; Madsen, L.; Kristiansen, K.; Berge, R.K. Tetradecylthioacetic acid inhibits growth of rat glioma cells ex vivo and in vivo via PPAR-dependent and PPAR-independent pathways. Carcinogenesis 2001, 22, 1747–1755. [Google Scholar] [CrossRef] [Green Version]
- Grommes, C.; Karlo, J.C.; Caprariello, A.; Blankenship, D.; Dechant, A.; Landreth, G.E. The PPARgamma agonist pioglitazone crosses the blood-brain barrier and reduces tumor growth in a human xenograft model. Cancer Chemother. Pharmacol. 2013, 71, 929–936. [Google Scholar] [CrossRef]
- Parkins, C.S.; Darling, J.L.; Gill, S.S.; Revesz, T.; Thomas, D.G. Cell proliferation in serial biopsies through human malignant brain tumours: Measurement using Ki67 antibody labelling. Br. J. Neurosurg. 1991, 5, 289–298. [Google Scholar] [CrossRef]


Disclaimer/Publisher’s Note: The statements, opinions and data contained in all publications are solely those of the individual author(s) and contributor(s) and not of MDPI and/or the editor(s). MDPI and/or the editor(s) disclaim responsibility for any injury to people or property resulting from any ideas, methods, instructions or products referred to in the content. |
© 2022 by the authors. Licensee MDPI, Basel, Switzerland. This article is an open access article distributed under the terms and conditions of the Creative Commons Attribution (CC BY) license (https://creativecommons.org/licenses/by/4.0/).
Share and Cite
Filippone, A.; Casili, G.; Scuderi, S.A.; Mannino, D.; Lanza, M.; Campolo, M.; Paterniti, I.; Capra, A.P.; Colarossi, C.; Bonasera, A.; et al. Sodium Propionate Contributes to Tumor Cell Growth Inhibition through PPAR-γ Signaling. Cancers 2023, 15, 217. https://doi.org/10.3390/cancers15010217
Filippone A, Casili G, Scuderi SA, Mannino D, Lanza M, Campolo M, Paterniti I, Capra AP, Colarossi C, Bonasera A, et al. Sodium Propionate Contributes to Tumor Cell Growth Inhibition through PPAR-γ Signaling. Cancers. 2023; 15(1):217. https://doi.org/10.3390/cancers15010217
Chicago/Turabian StyleFilippone, Alessia, Giovanna Casili, Sarah Adriana Scuderi, Deborah Mannino, Marika Lanza, Michela Campolo, Irene Paterniti, Anna Paola Capra, Cristina Colarossi, Annalisa Bonasera, and et al. 2023. "Sodium Propionate Contributes to Tumor Cell Growth Inhibition through PPAR-γ Signaling" Cancers 15, no. 1: 217. https://doi.org/10.3390/cancers15010217