
Impact of Pre-Analytical and Analytical Variables Associated with Sample Preparation on Flow Cytometric Stainings Obtained with EuroFlow Panels

 , , , , , , , , , , and
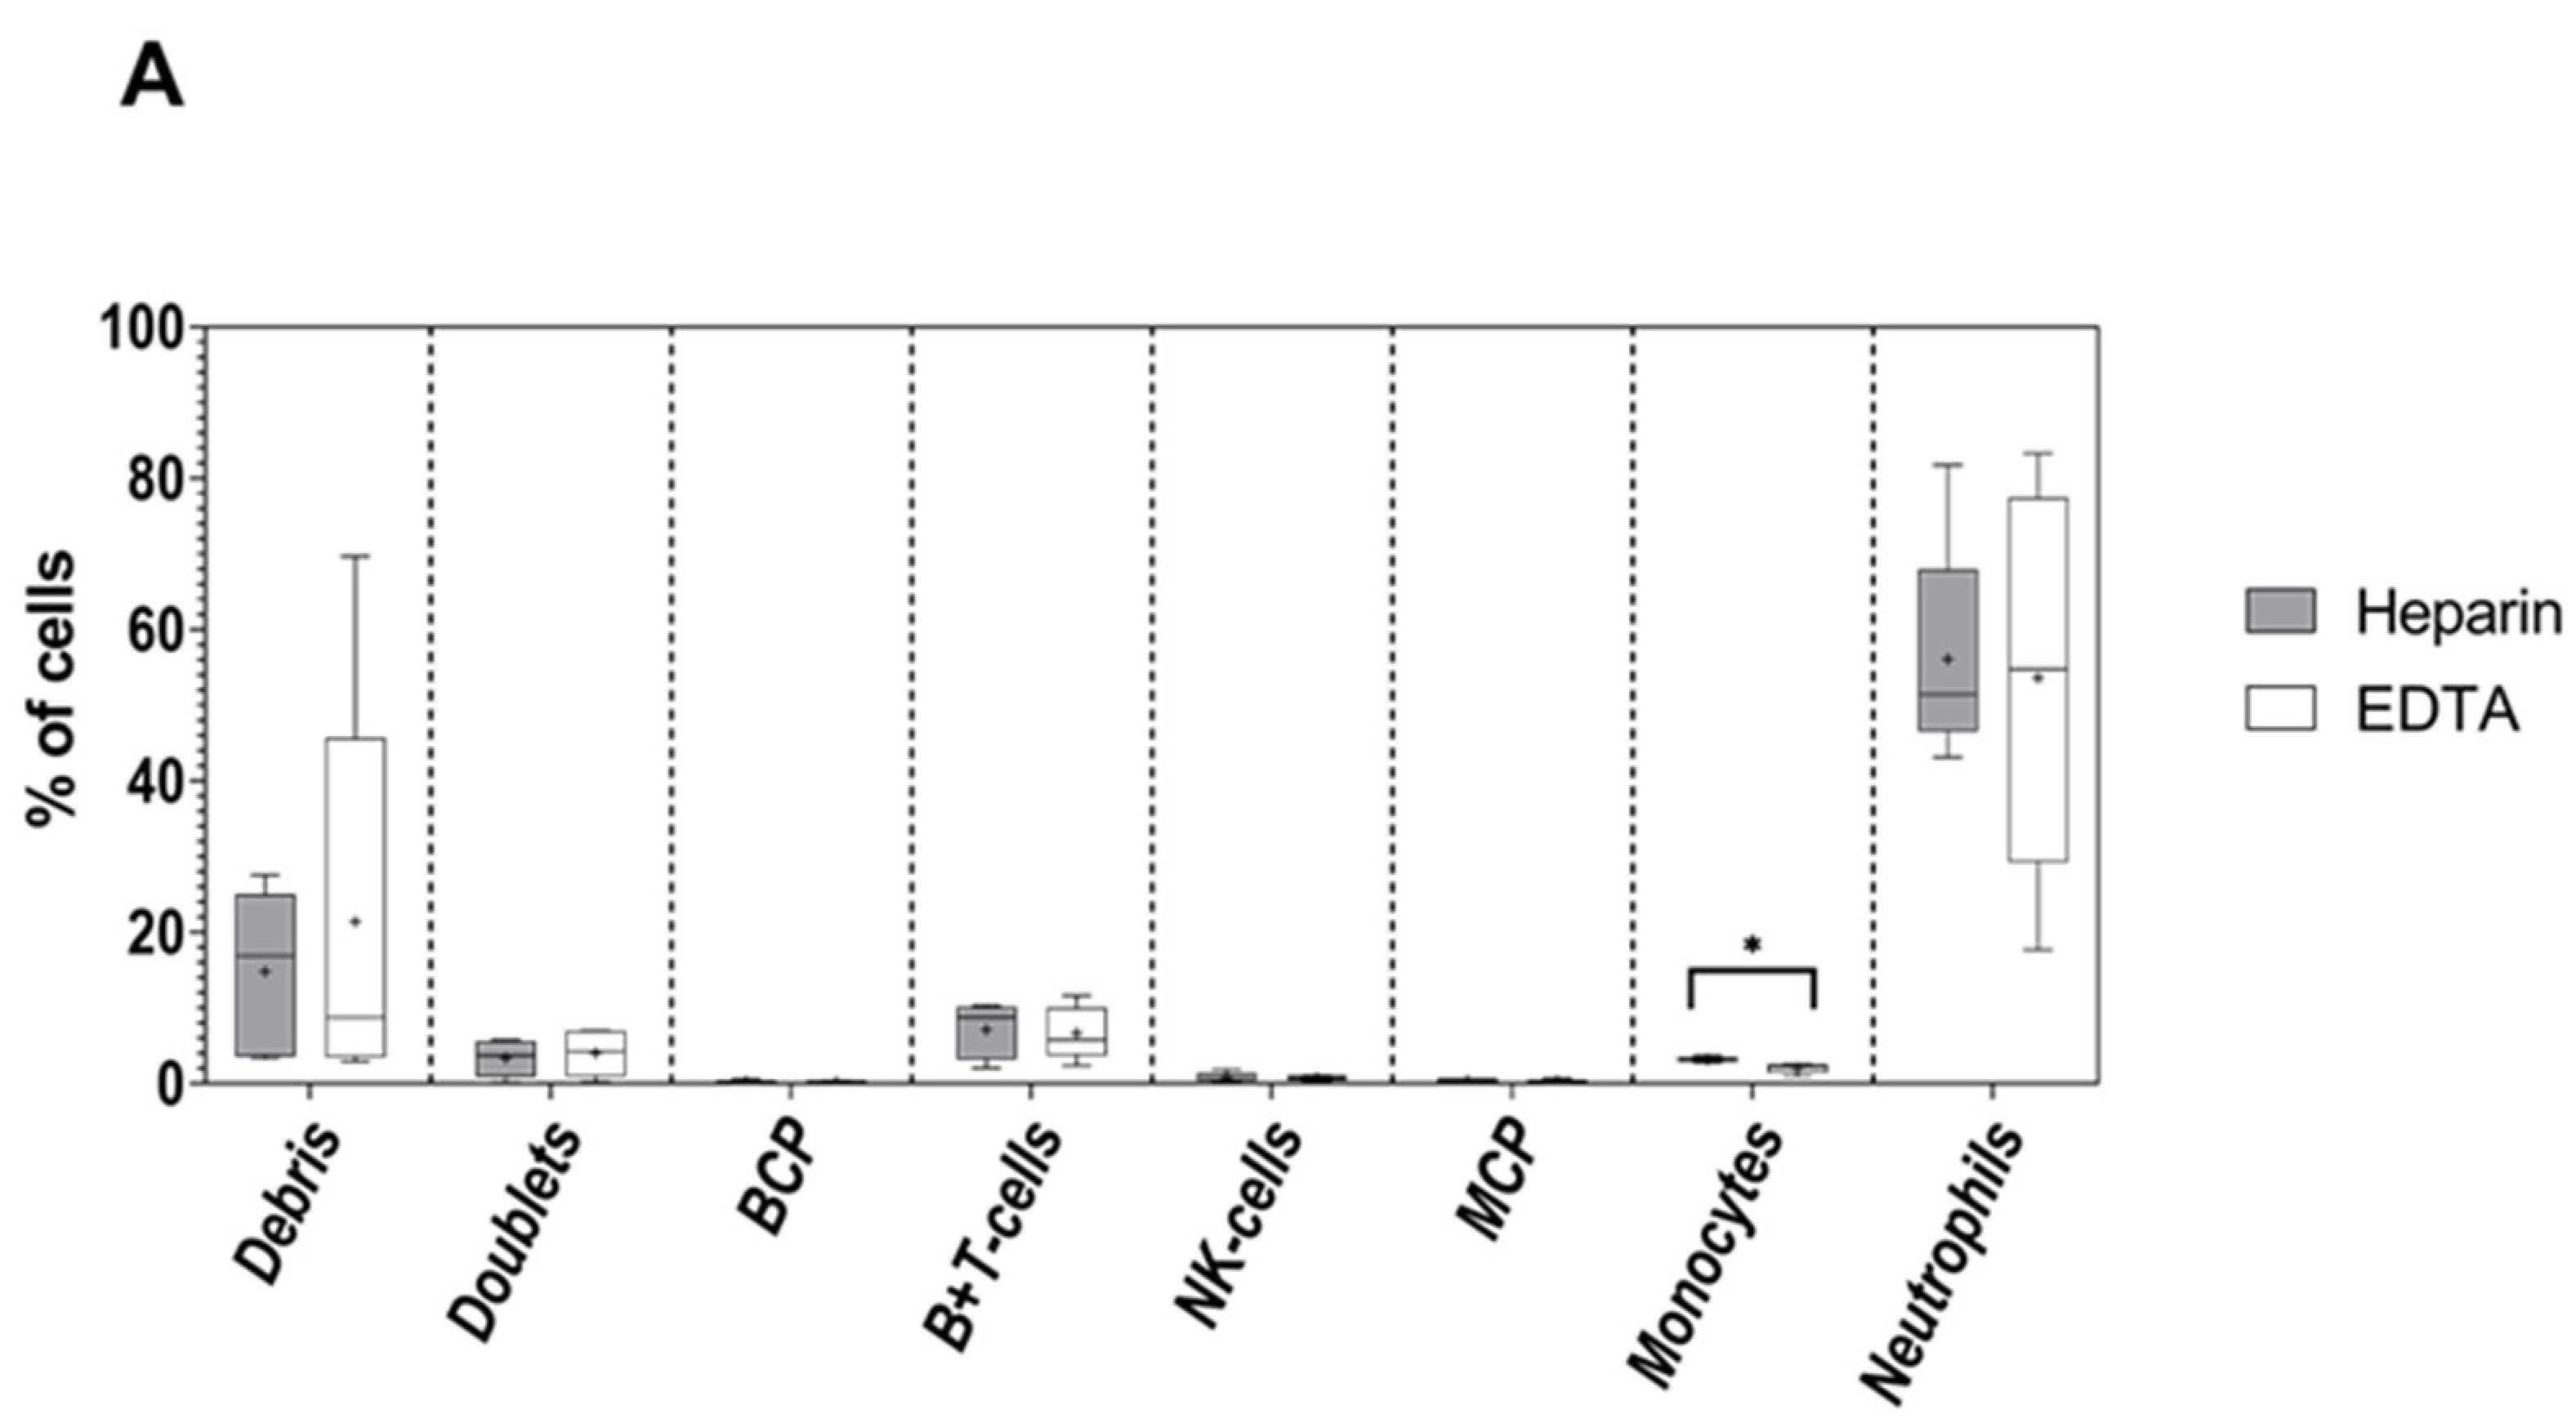
Abstract
:Simple Summary
Abstract
1. Introduction
2. Materials and Methods
2.1. General Immunophenotypic Procedures
2.2. Patient and Normal Samples and Staining Antibody Combinations per Set of Experiments
2.3. Statistical Methods
3. Results
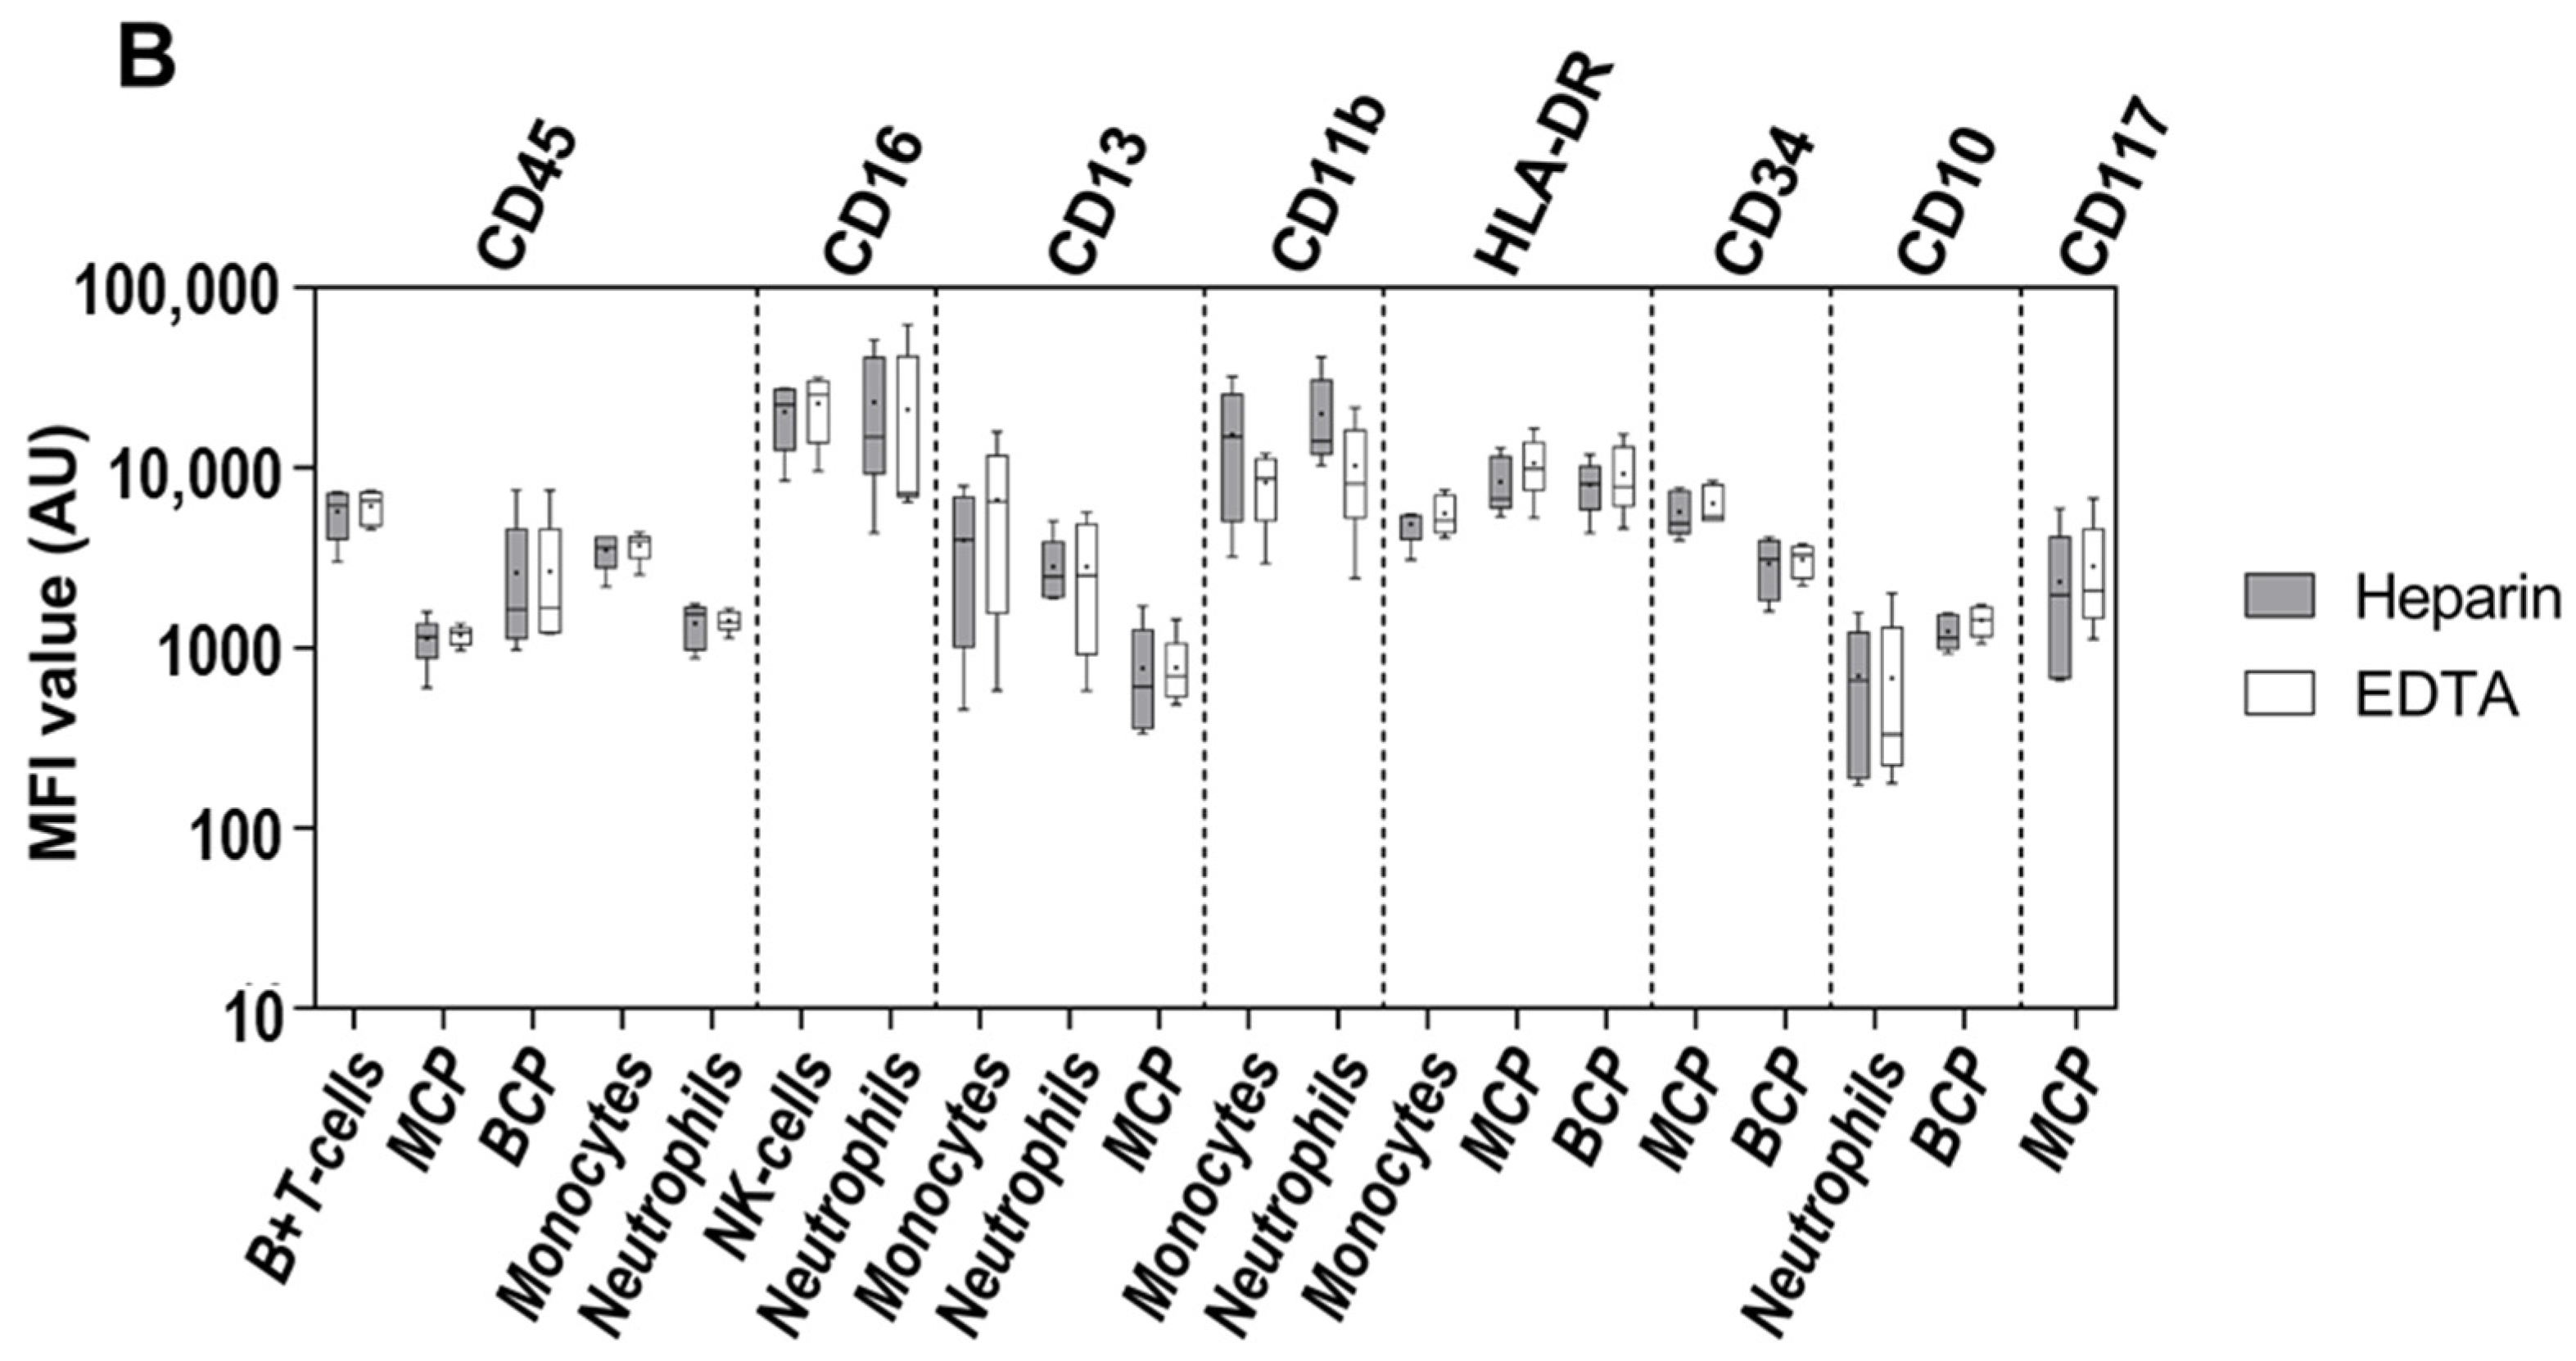
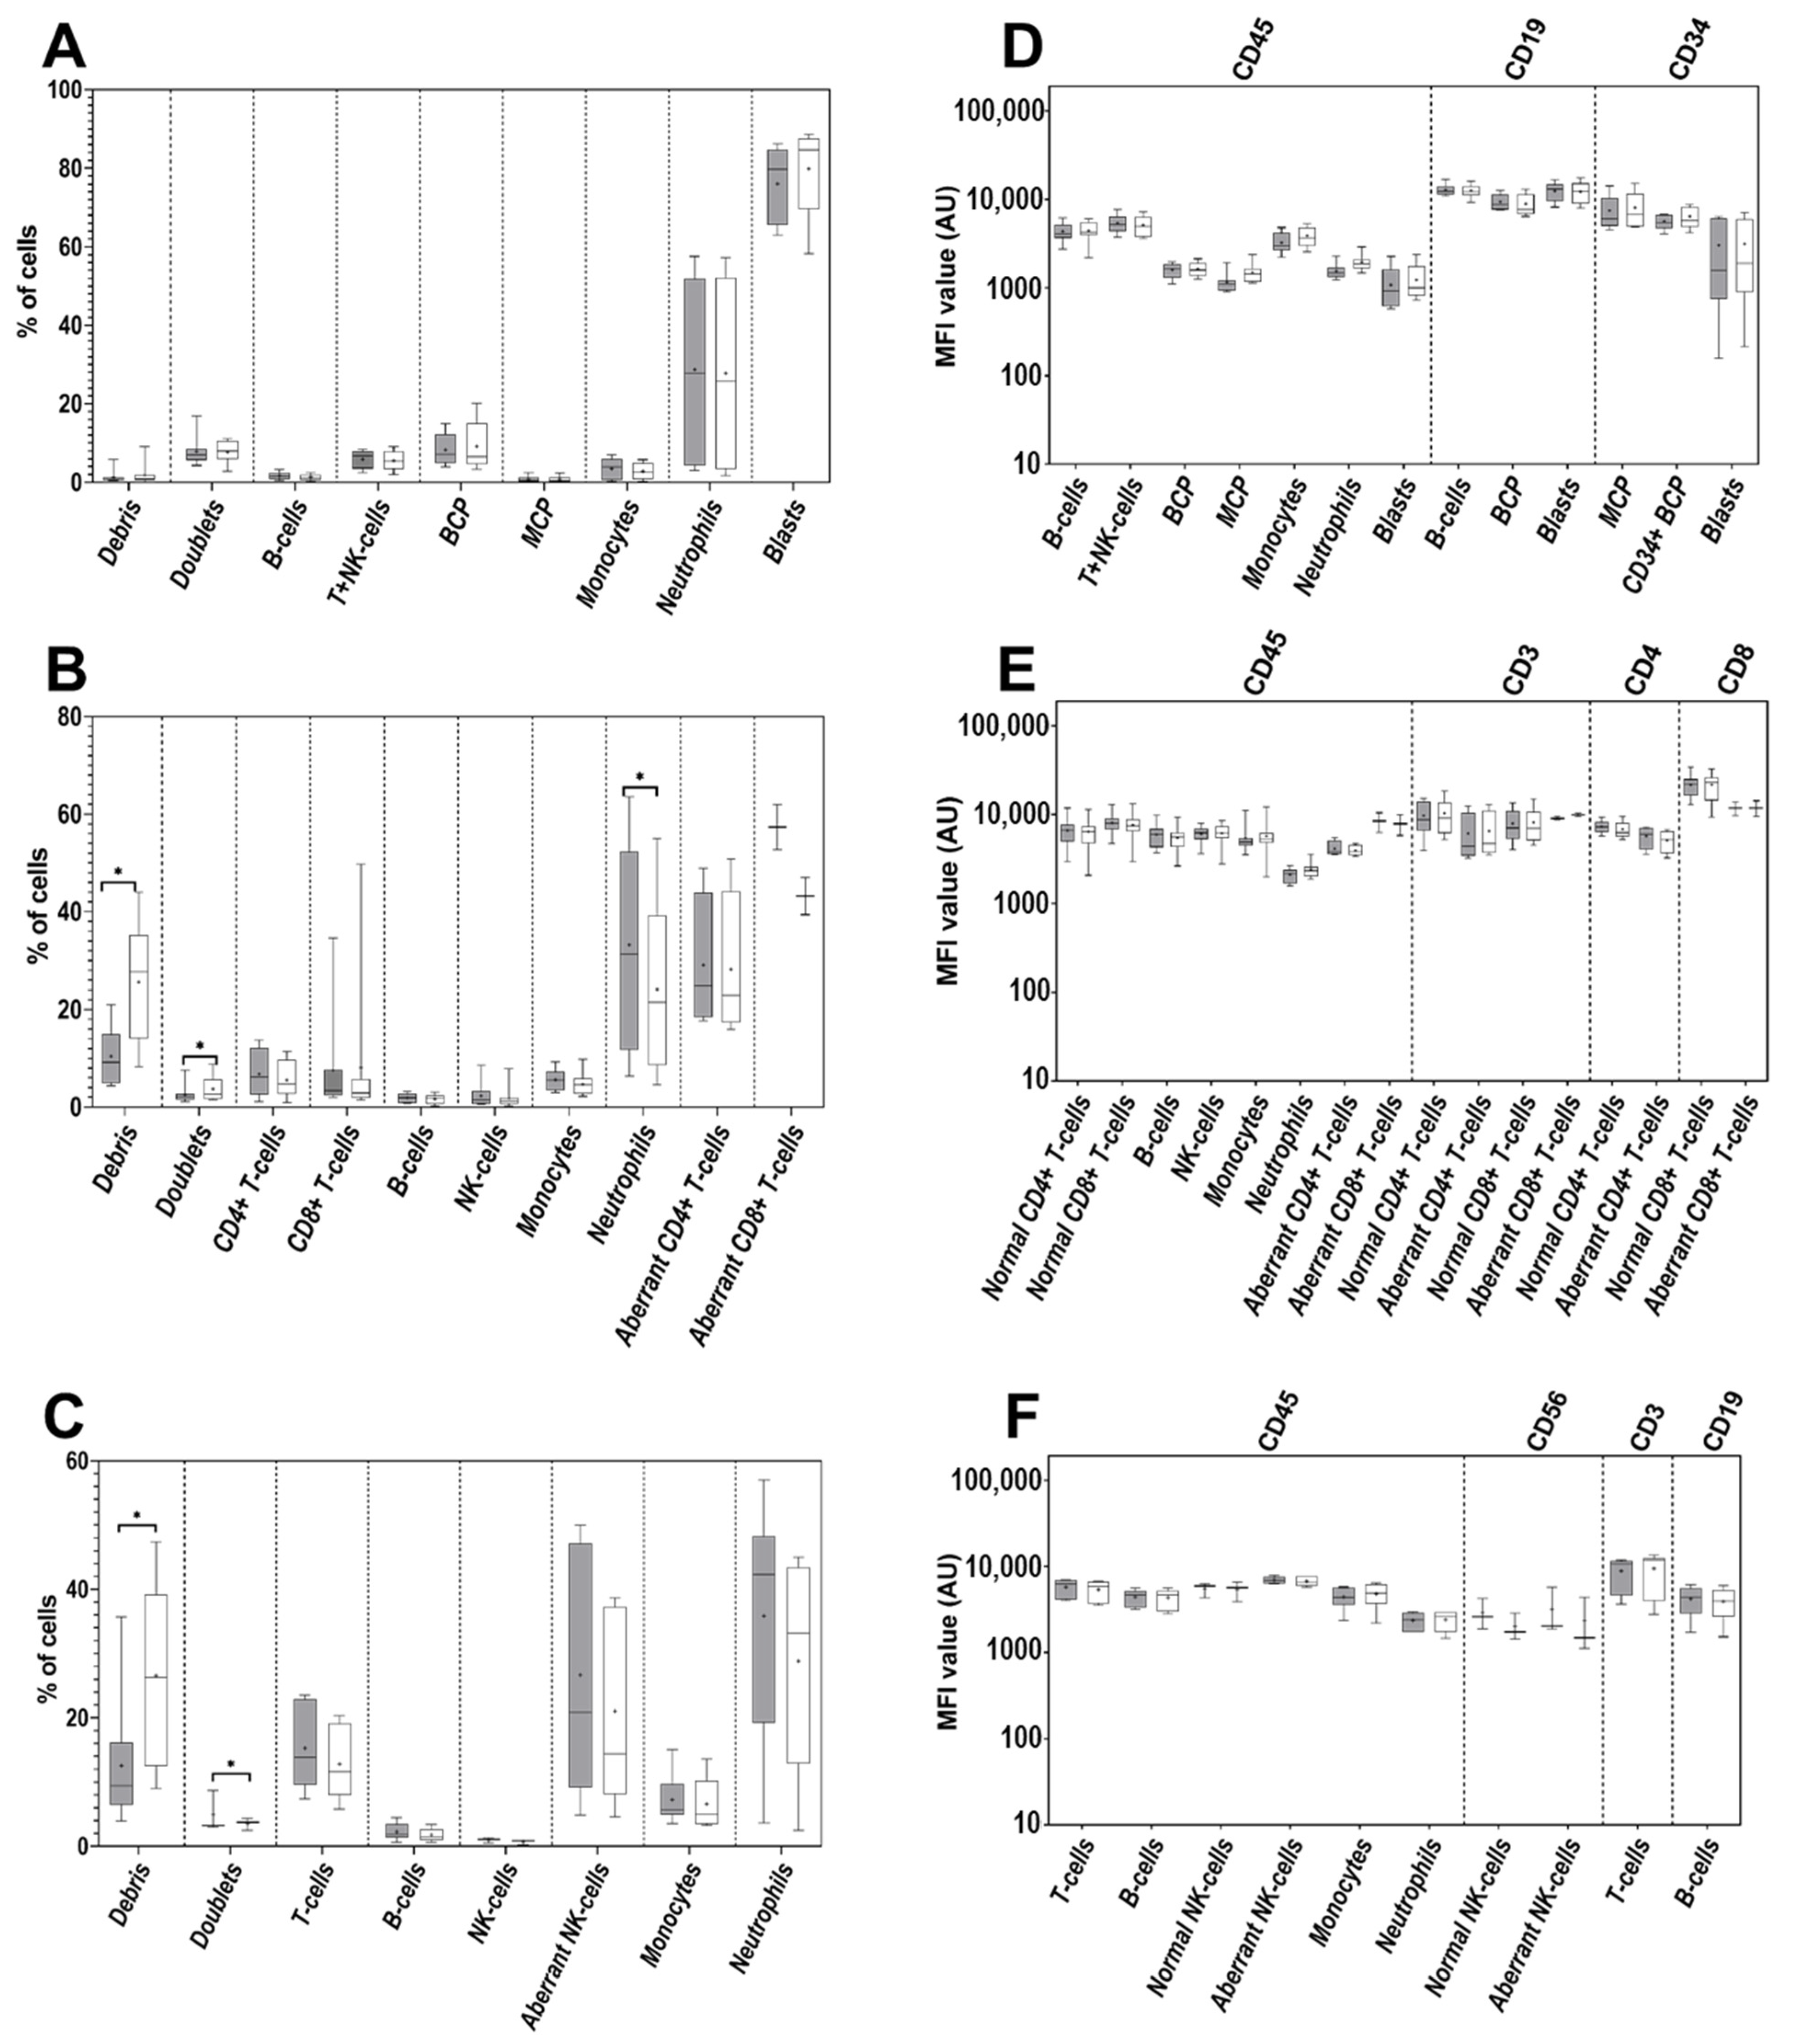
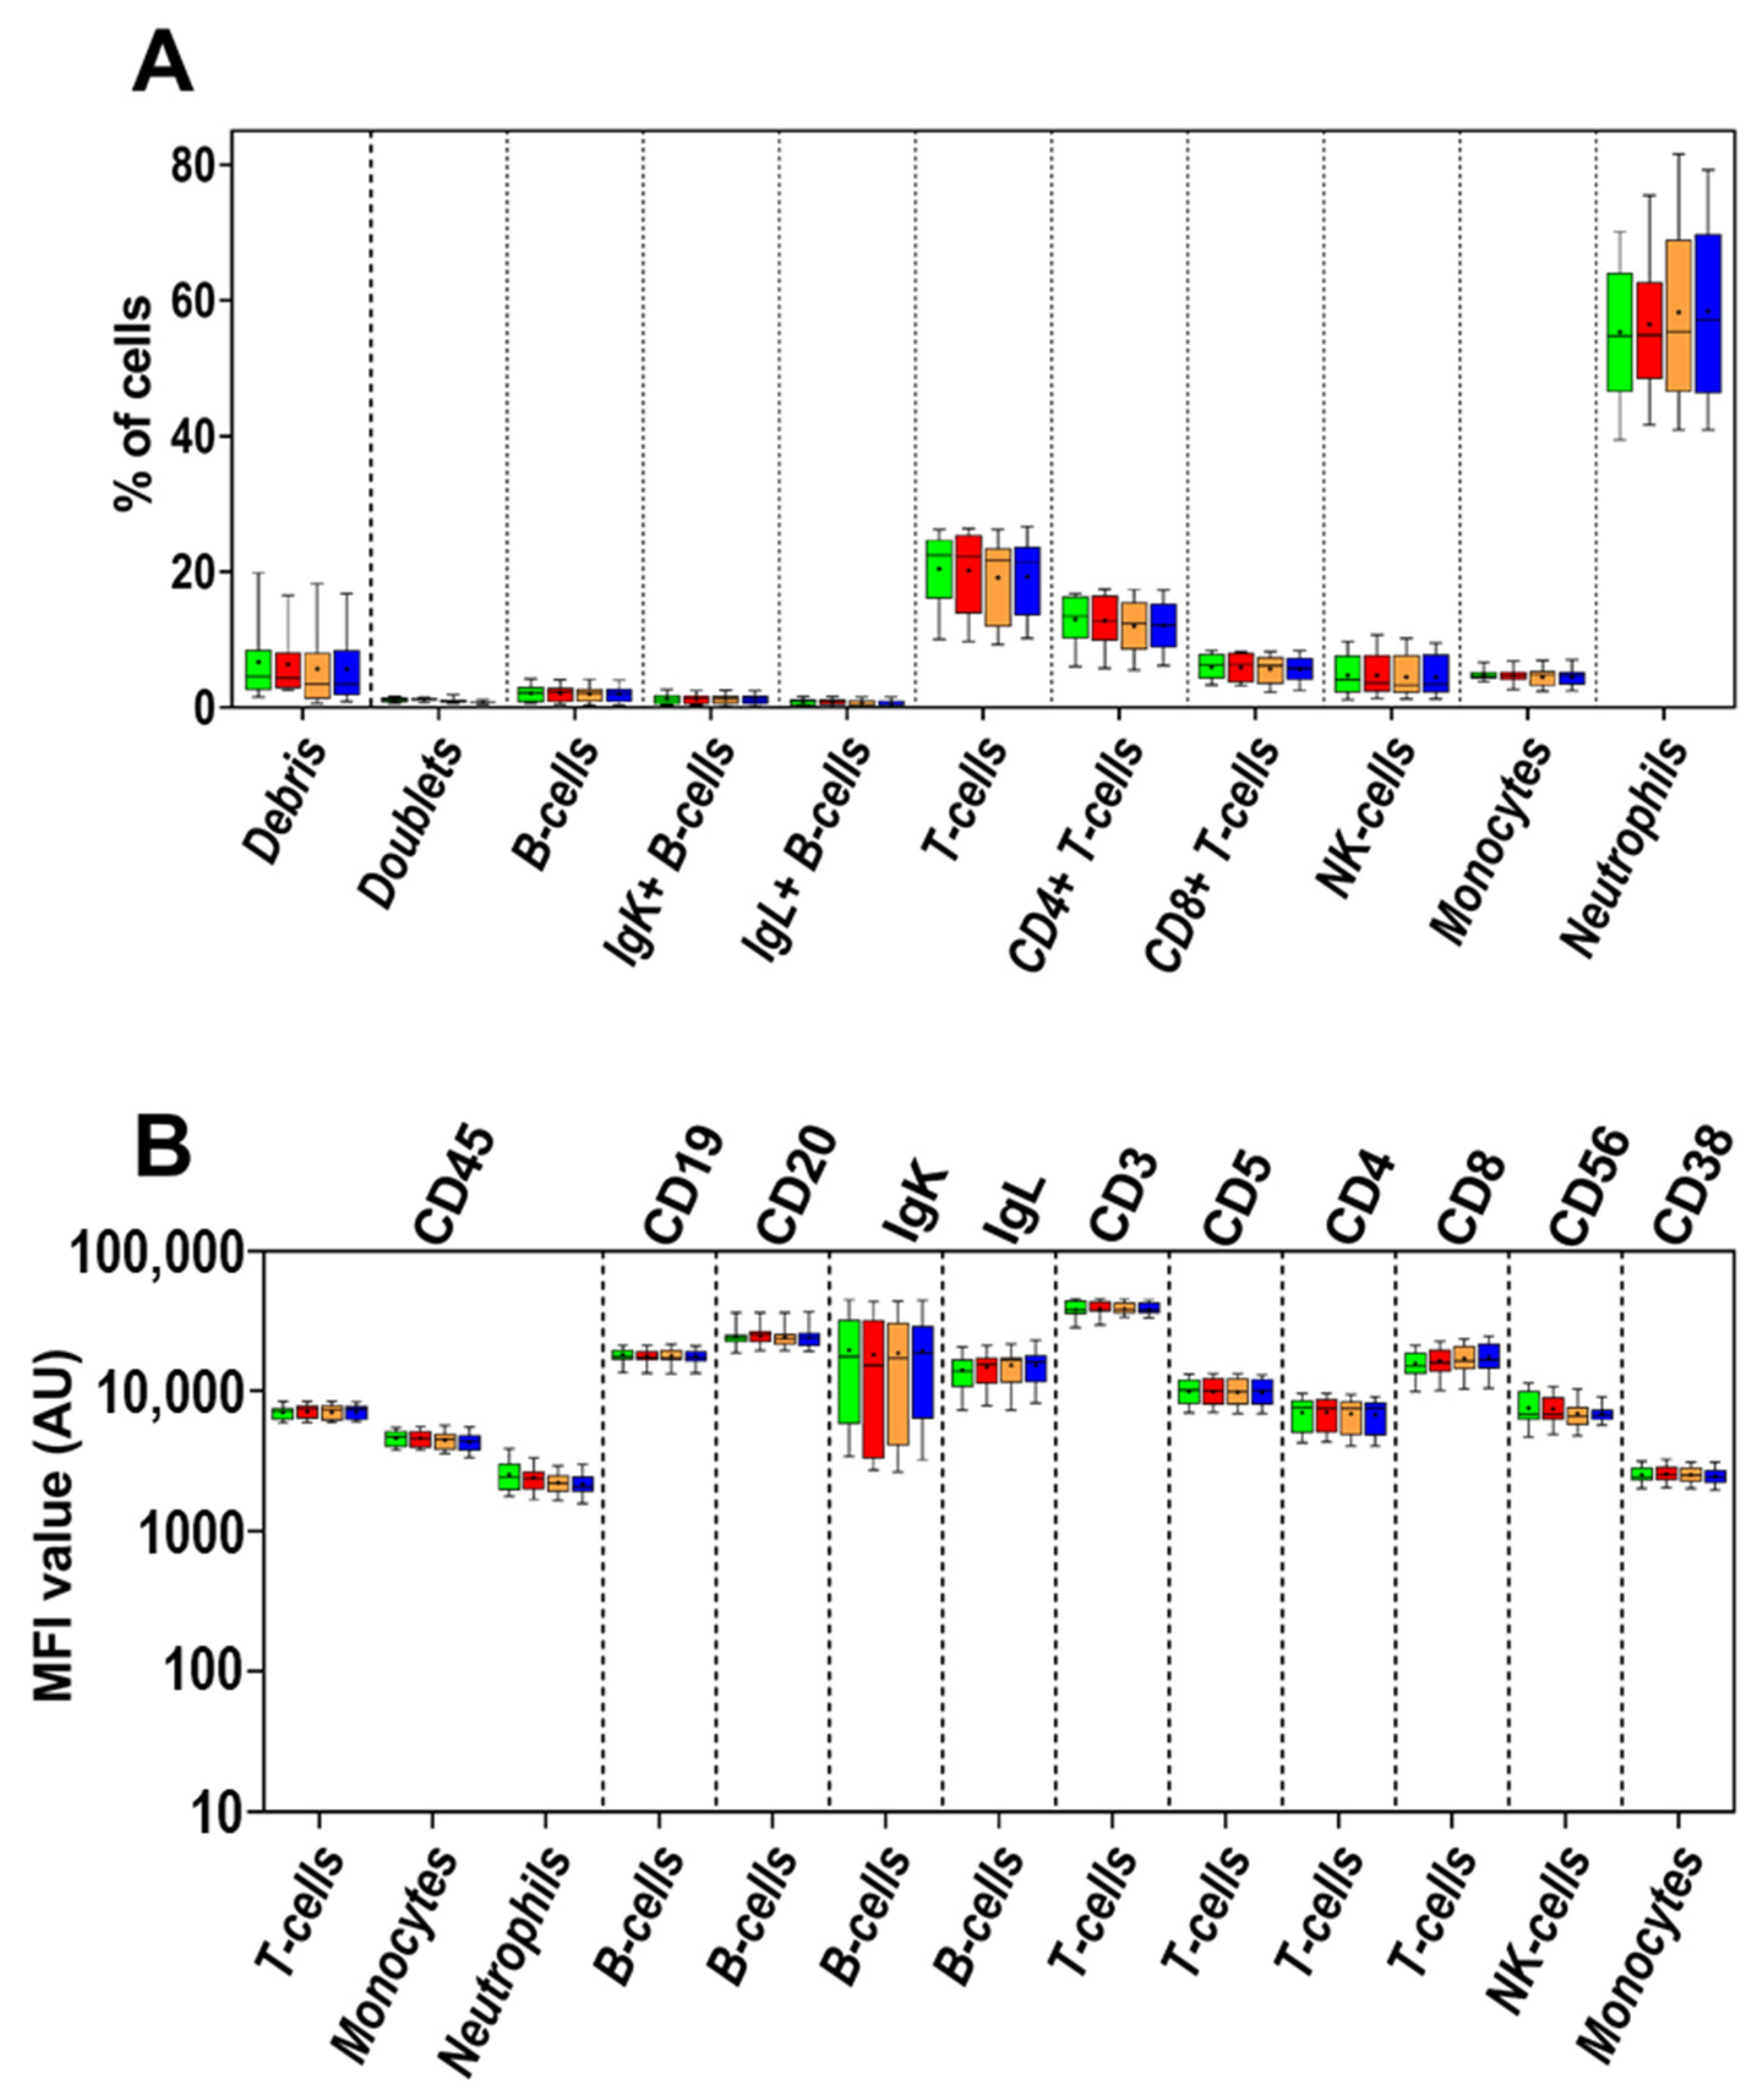
3.1. Impact of the Anticoagulant on Cell Distribution and Staining Profiles
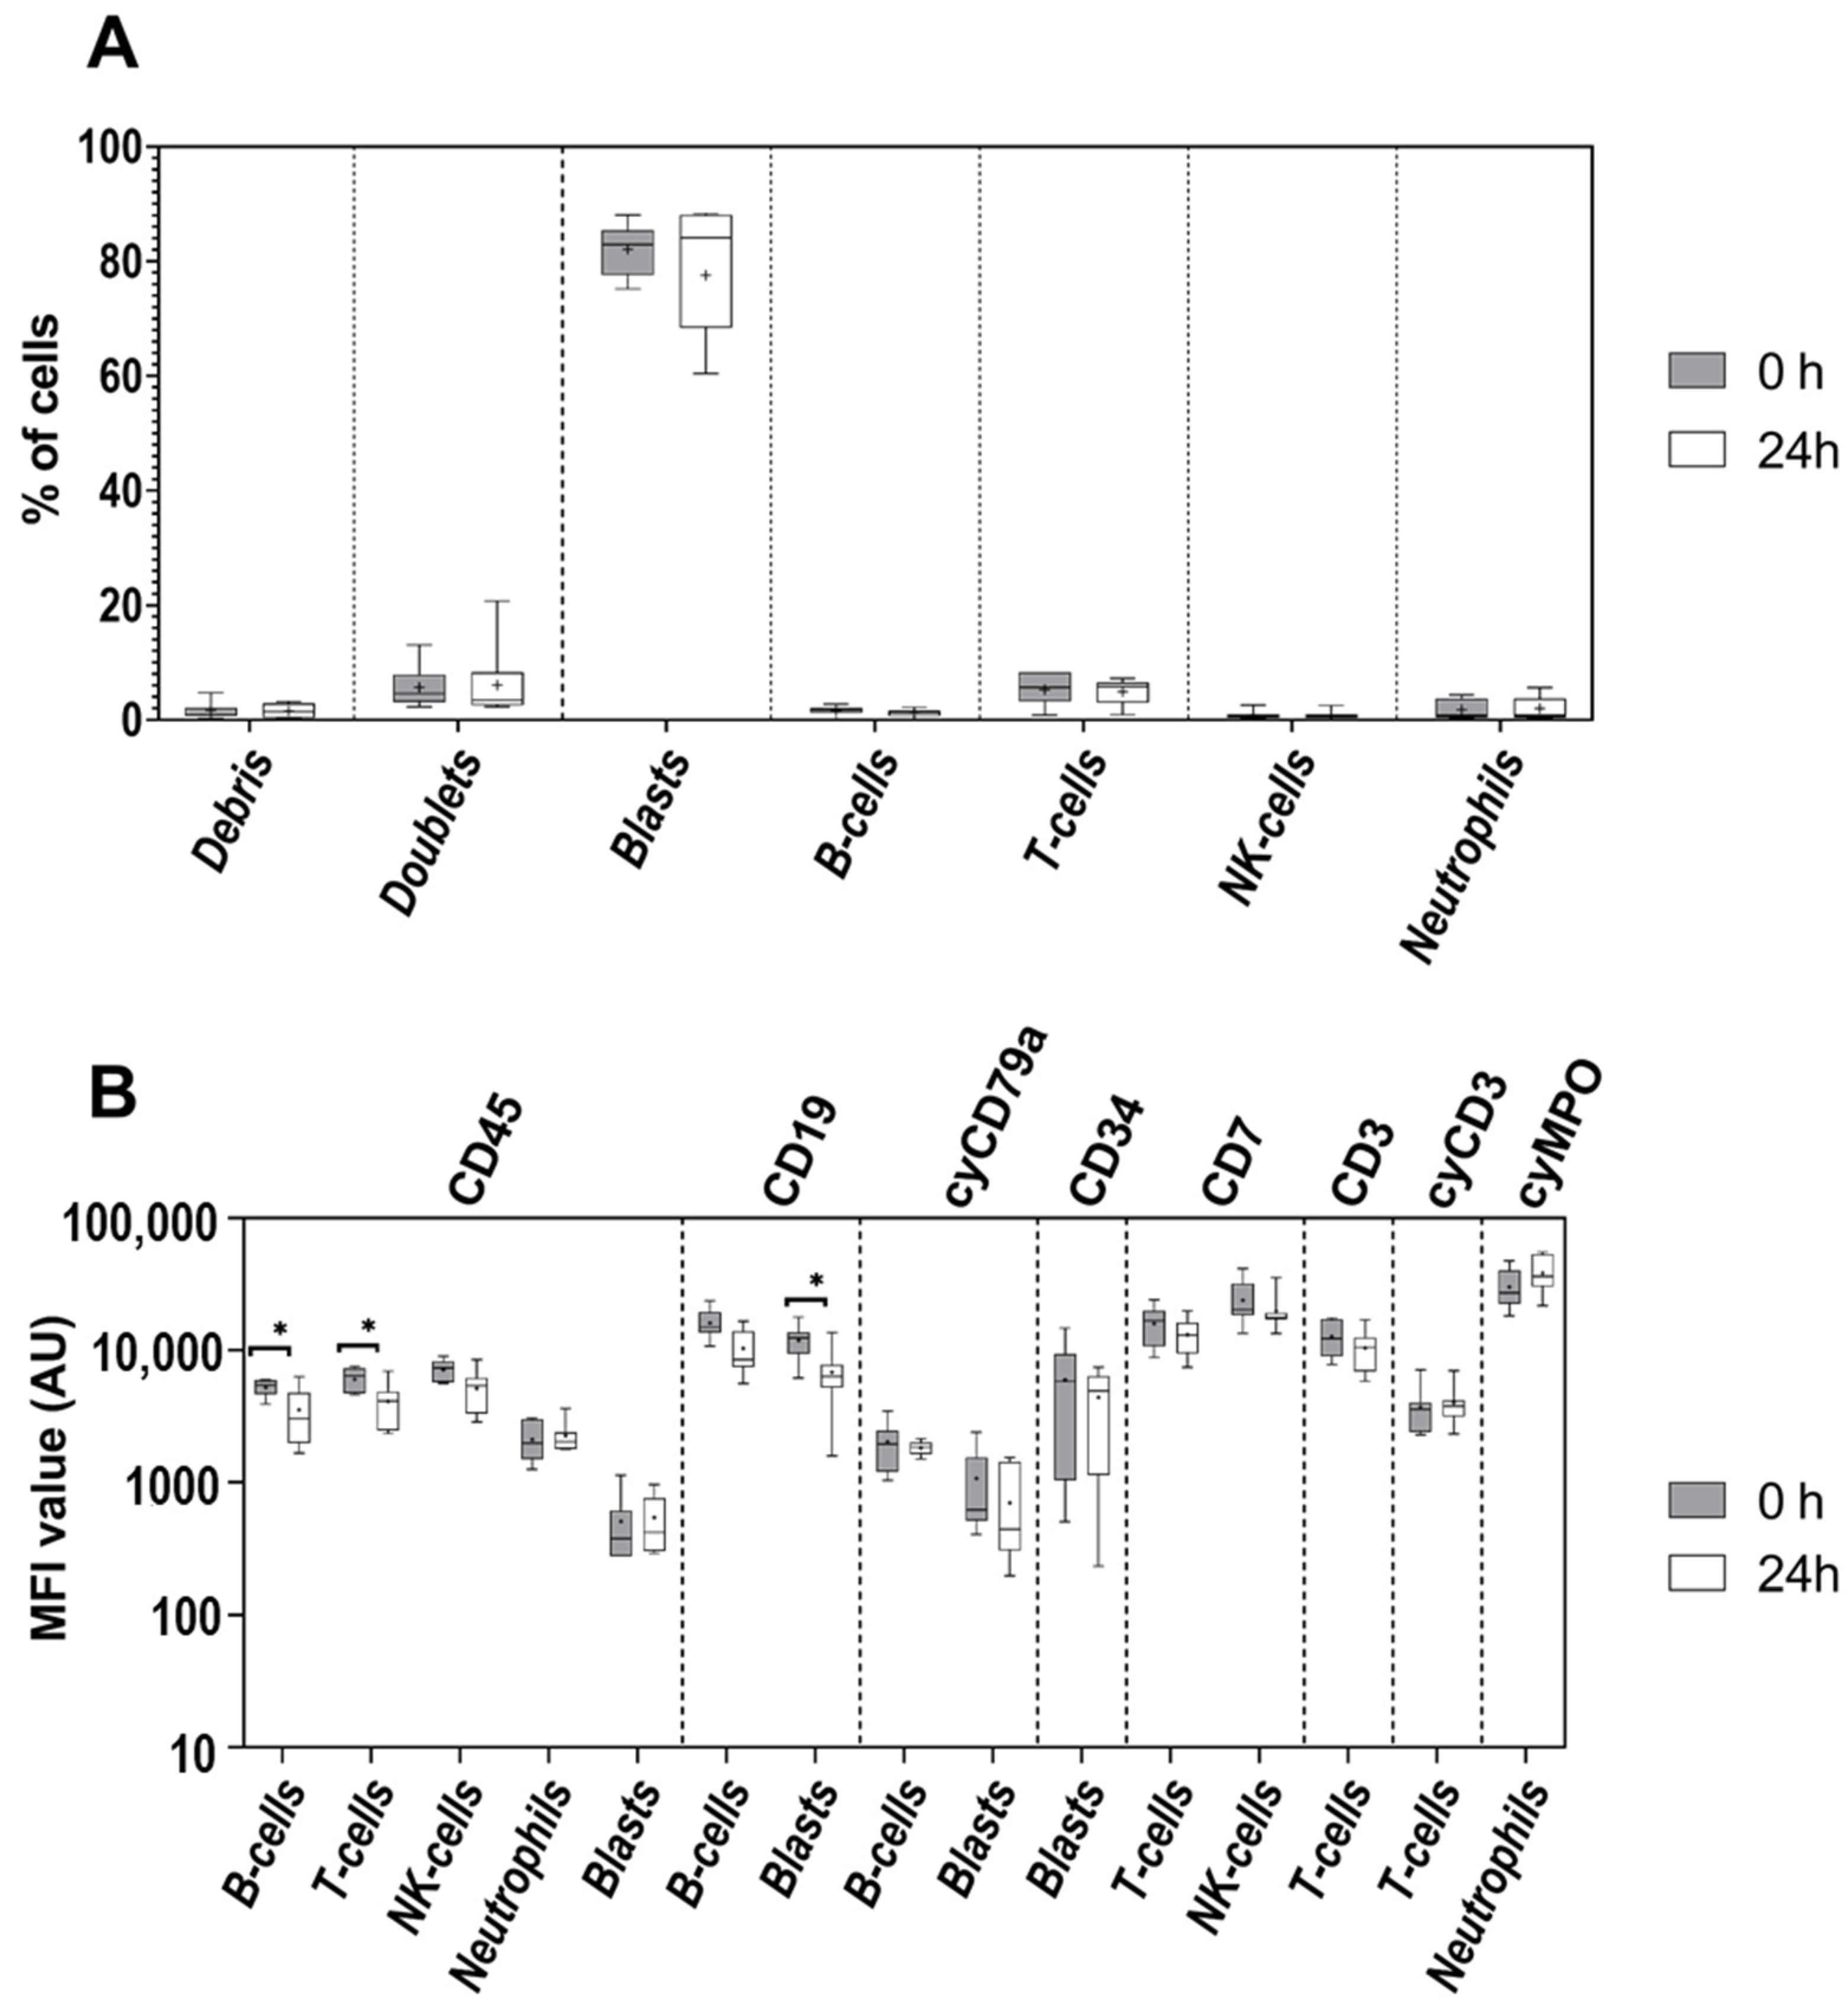
3.2. Age of Sample
3.3. Age of Staining
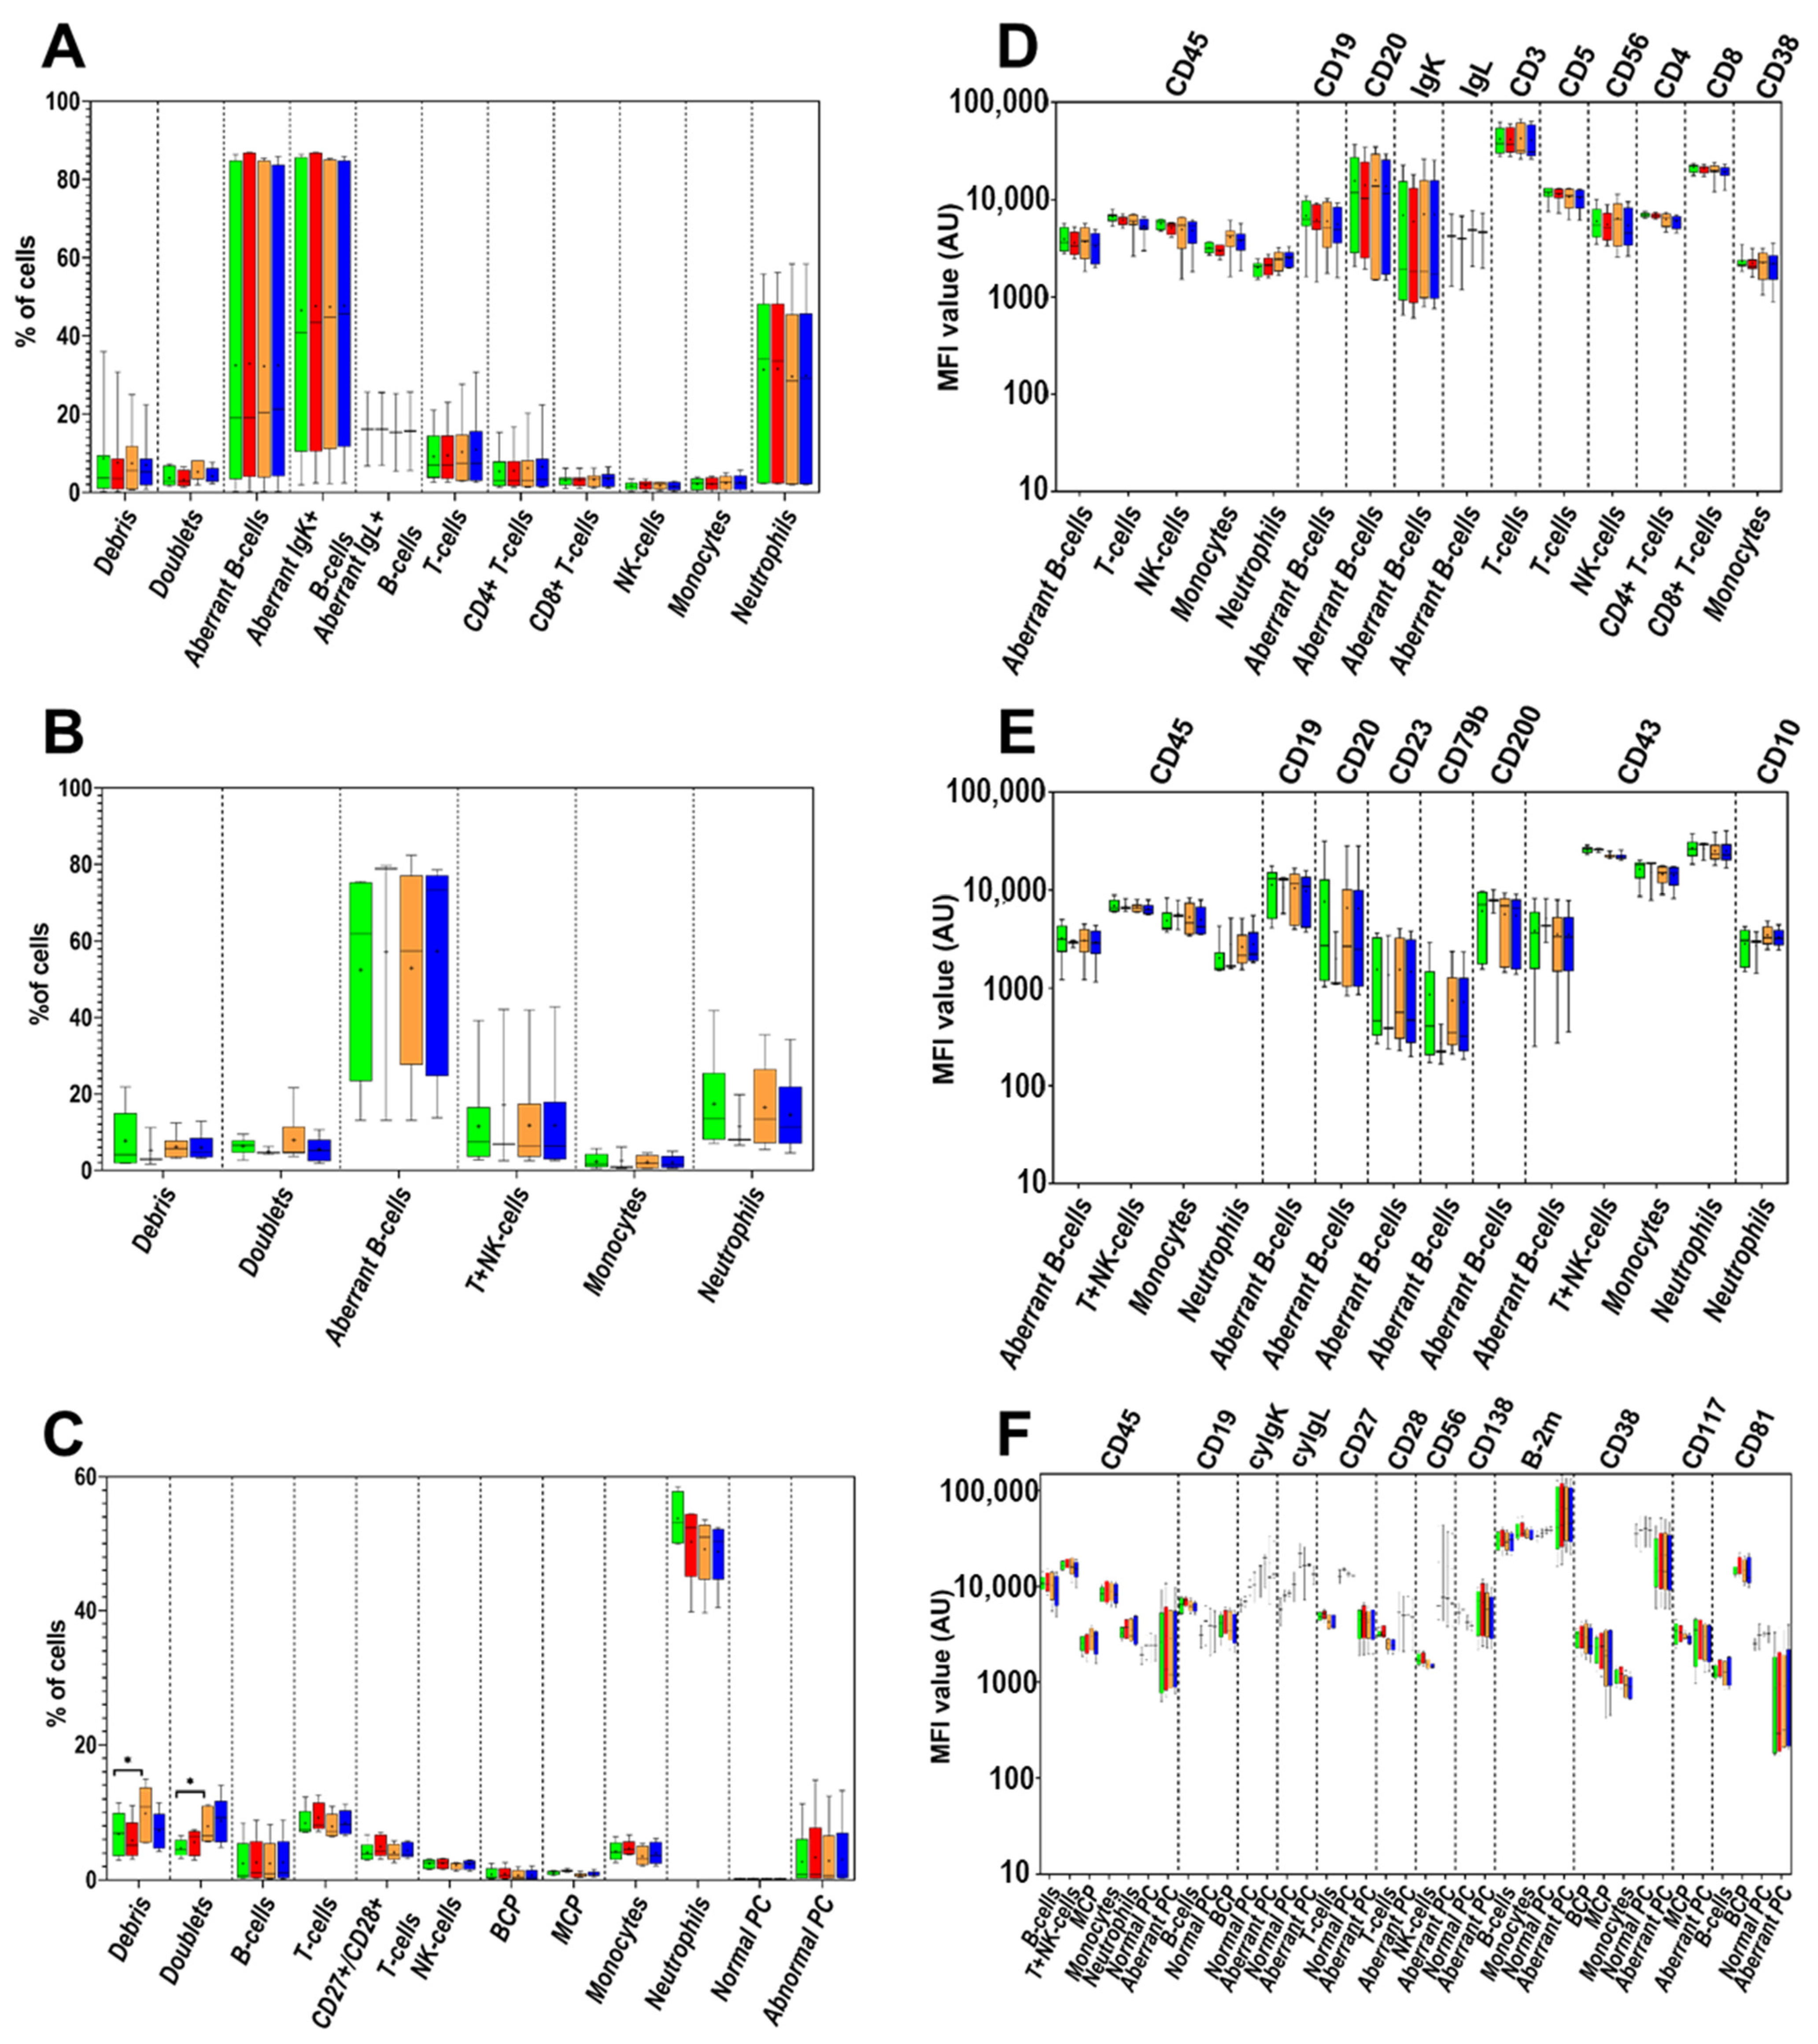
3.4. Cell Surface-Only (SM) vs. Cell Surface plus Intracytoplasmic (SM+CY) Staining Procedures
3.5. Washing Buffer (PBS) pH and Protein Contents
4. Discussion
5. Conclusions
Supplementary Materials
Author Contributions
Funding
Institutional Review Board Statement
Informed Consent Statement
Data Availability Statement
Acknowledgments
Conflicts of Interest
References
- Van Dongen, J.J.M.; Lhermitte, L.; Böttcher, S.; Almeida, J.; Van Der Velden, V.H.J.; Flores-Montero, J.; Rawstron, A.; Asnafi, V.; Lécrevisse, Q.; Lucio, P.; et al. EuroFlow antibody panels for standardized n-dimensional flow cytometric immunophenotyping of normal, reactive and malignant leukocytes. Leukemia 2012, 26, 1908–1975. [Google Scholar] [CrossRef] [PubMed] [Green Version]
- Kalina, T.; Flores-Montero, J.; Van Der Velden, V.H.J.; Martin-Ayuso, M.; Böttcher, S.; Ritgen, M.; Almeida, J.; Lhermitte, L.; Asnafi, V.; Mendonça, A.; et al. EuroFlow standardization of flow cytometer instrument settings and immunophenotyping protocols. Leukemia 2012, 26, 1986–2010. [Google Scholar] [CrossRef] [PubMed] [Green Version]
- Kalina, T. Reproducibility of Flow Cytometry Through Standardization: Opportunities and Challenges. Cytom. Part A 2020, 97, 137–147. [Google Scholar] [CrossRef] [PubMed]
- van Dongen, J.J.M.; O’Gorman, M.R.G.; Orfao, A. EuroFlow and its activities: Introduction to the special EuroFlow issue of The Journal of Immunological Methods. J. Immunol. Methods 2019, 475. [Google Scholar] [CrossRef] [PubMed]
- Böttcher, S.; van der Velden, V.H.J.; Villamor, N.; Ritgen, M.; Flores-Montero, J.; Escobar, H.M.; Kalina, T.; Brüggemann, M.; Grigore, G.; Martin-Ayuso, M.; et al. Lot-to-lot stability of antibody reagents for flow cytometry. J. Immunol. Methods 2019, 475, 112294. [Google Scholar] [CrossRef] [PubMed]
- Flores-Montero, J.; Kalina, T.; Corral-Mateos, A.; Sanoja-Flores, L.; Pérez-Andrés, M.; Martin-Ayuso, M.; Sedek, L.; Rejlova, K.; Mayado, A.; Fernández, P.; et al. Fluorochrome choices for multi-color flow cytometry. J. Immunol. Methods 2019, 475, 112618. [Google Scholar] [CrossRef] [PubMed]
- van der Velden, V.H.J.; Flores-Montero, J.; Perez-Andres, M.; Martin-Ayuso, M.; Crespo, O.; Blanco, E.; Kalina, T.; Philippé, J.; Bonroy, C.; de Bie, M.; et al. Optimization and testing of dried antibody tube: The EuroFlow LST and PIDOT tubes as examples. J. Immunol. Methods 2019, 475, 112287. [Google Scholar] [CrossRef]
- Nováková, M.; Glier, H.; Brdičková, N.; Vlková, M.; Santos, A.H.; Lima, M.; Roussel, M.; Flores-Montero, J.; Szczepanski, T.; Böttcher, S.; et al. How to make usage of the standardized EuroFlow 8-color protocols possible for instruments of different manufacturers. J. Immunol. Methods 2019, 475, 112388. [Google Scholar] [CrossRef]
- Glier, H.; Heijnen, I.; Hauwel, M.; Dirks, J.; Quarroz, S.; Lehmann, T.; Rovo, A.; Arn, K.; Matthes, T.; Hogan, C.; et al. Standardization of 8-color flow cytometry across different flow cytometer instruments: A feasibility study in clinical laboratories in Switzerland. J. Immunol. Methods 2019, 475, 112348. [Google Scholar] [CrossRef]
- Glier, H.; Novakova, M.; te Marvelde, J.; Bijkerk, A.; Morf, D.; Thurner, D.; Rejlova, K.; Lange, S.; Finke, J.; van der Sluijs-Gelling, A.; et al. Comments on EuroFlow standard operating procedures for instrument setup and compensation for BD FACS Canto II, Navios and BD FACS Lyric instruments. J. Immunol. Methods 2019, 475, 112680. [Google Scholar] [CrossRef]
- Kalina, T.; Brdickova, N.; Glier, H.; Fernandez, P.; Bitter, M.; Flores-Montero, J.; van Dongen, J.J.M.; Orfao, A. Frequent issues and lessons learned from EuroFlow QA. J. Immunol. Methods 2019, 475, 112520. [Google Scholar] [CrossRef]
- Stelzer, G.T.; Marti, G.; Hurley, A.; McCoy, P.J.; Lovett, E.J.; Schwartz, A.U.S. Canadian consensus recommendations on the immunophenotypic analysis of hematologic neoplasia by flow cytometry: Standardization and validation of laboratory procedures. Commun. Clin. Cytom. 1997, 30, 214–230. [Google Scholar] [CrossRef]
- Johansson, U.; Bloxham, D.; Couzens, S.; Jesson, J.; Morilla, R.; Erber, W.; Macey, M. Guidelines on the use of multicolour flow cytometry in the diagnosis of haematological neoplasms. Br. J. Haematol. 2014, 165, 455–488. [Google Scholar] [CrossRef] [PubMed]
- Banfi, G.; Salvagno, G.L.; Lippi, G. The role of ethylenediamine tetraacetic acid (EDTA) as in vitro anticoagulant for diagnostic purposes. Clin. Chem. Lab. Med. 2007, 45, 565–576. [Google Scholar] [CrossRef] [PubMed]
- Olson, S.T.; Björk, I. Regulation of thrombin activity by antithrombin and heparin. Semin. Thromb. Hemost. 1994, 20, 373–409. [Google Scholar] [CrossRef] [PubMed]
- Gratama, J.W.; Kraan, J.; Keeney, M.; Mandy, F.; Sutherland, D.R.; Wood, B.L. Enumeration of Immunologically Defined Cell Populations by Flow Cytometry; Approved Guideline—Second Edition, H42-A2; Clinical and Laboratory Standards Institute: Wayne, PA, USA, 2007; ISBN 1562386409. [Google Scholar]
- McCarthy, D.A.; Macey, M.G. Novel anticoagulants for flow cytometric analysis of live leucocytes in whole blood. Cytometry 1996, 23, 196–204. [Google Scholar] [CrossRef]
- Elghetany, M.T.; Davis, B.H. Impact of preanalytical variables on granulocytic surface antigen expression: A review. Cytom. Part. B-Clin. Cytom. 2005, 65, 1–5. [Google Scholar] [CrossRef] [PubMed]
- Van De Loosdrecht, A.A.; Alhan, C.; Béné, M.C.; Della Porta, M.G.; Dräger, A.M.; Feuillard, J.; Font, P.; Germing, U.; Haase, D.; Homburg, C.H.; et al. Standardization of flow cytometry in myelodysplastic syndromes: Report from the first European LeukemiaNet working conference on flow cytometry in myelodysplastic syndromes. Haematologica 2009, 94, 1124–1134. [Google Scholar] [CrossRef] [Green Version]
- McCarthy, D.A.; Macey, M.G.; Allen, P.D. A simple, novel, procedure for monitoring membrane scrambling and permeability in microparticles, platelets, and leukocytes in whole blood samples. Exp. Hematol. 2008, 36, 909–921. [Google Scholar] [CrossRef]
- Schumacher, M.J.; Burkhead, T. Stability of fresh and preserved fetal and adult lymphocyte cell surface markers. J. Clin. Lab. Anal. 2000, 14, 320–326. [Google Scholar] [CrossRef]
- Leino, L.; Sorvajärvi, K. CD11b is a calcium-dependent epitope in human neutrophils. Biochem. Biophys. Res. Commun. 1992, 187, 195–200. [Google Scholar] [CrossRef]
- Diaz, D.; Prieto, A.; Barcenilla, H.; Monserrat, J.; Sánchez, M.A.; Reyes, E.; Hernandez-Fuentes, M.P.; de la Hera, A.; Orfao, A.; Alvarez-Mon, M. Accurate apoptosis measurement requires quantification of loss of expression of surface antigens and cell fragmentation. Cytom. Part A 2006, 69A, 240–248. [Google Scholar] [CrossRef] [PubMed]
- Tanqri, S.; Vall, H.; Kaplan, D.; Hoffman, B.; Purvis, N.; Porwit, A.; Hunsberger, B.; Shankey, T.V. Validation of cell-based fluorescence assays: Practice guidelines from the ICSH and ICCS-Part III-Analytical issues. Cytom. Part B-Clin. Cytom. 2013, 84, 291–308. [Google Scholar] [CrossRef] [PubMed]
- Diks, A.M.; Bonroy, C.; Teodosio, C.; Groenland, R.J.; de Mooij, B.; de Maertelaere, E.; Neirynck, J.; Philippé, J.; Orfao, A.; van Dongen, J.J.M.; et al. Impact of blood storage and sample handling on quality of high dimensional flow cytometric data in multicenter clinical research. J. Immunol. Methods 2019, 475, 112616. [Google Scholar] [CrossRef] [PubMed]
- Sędek, Ł.; Kulis, J.; Słota, Ł.; Twardoch, M.; Pierzyna-Świtała, M.; Perkowski, B.; Szczepański, T. The influence of fixation of biological samples on cell count and marker expression stability in flow cytometric analyses. Cent. Eur. J. Immunol. 2020, 45, 206–213. [Google Scholar] [CrossRef] [PubMed]
- Stetler-Stevenson, M.; Ahmad, E.; Barnett, D.; Braylan, R.C.; DiGiuseppe, J.A.; Marti, G.; Menozzi, D.; Oldaker, T.A.; Orfao, A.; Rabellino, E.; et al. Clinical Flow Cytometric Analysis of Neoplastic Hematolymphoid Cells; Approved Guideline-Second Edition, H43-A2; Clinical and Laboratory Standards Institute: Wayne, PA, USA, 2007; ISBN 1562386352. [Google Scholar]
- van der Velden, V.H.J.; Preijers, F.; Johansson, U.; Westers, T.M.; Dunlop, A.; Porwit, A.; Béné, M.C.; Valent, P.; te Marvelde, J.; Wagner-Ballon, O.; et al. Flow cytometric analysis of myelodysplasia: Pre-analytical and technical issues—Recommendations from the European LeukemiaNet. Cytom. Part B-Clin. Cytom. 2021. [Google Scholar] [CrossRef]
- Repo, H.; Jansson, S.-E.; Leirisalo-Repo, M. Anticoagulant selection influences flow cytometric determination of CD11b upregulation in vivo and ex vivo. J. Immunol. Methods 1995, 185, 65–79. [Google Scholar] [CrossRef]
- Flores-Montero, J.; de Tute, R.; Paiva, B.; Perez, J.J.; Böttcher, S.; Wind, H.; Sanoja, L.; Puig, N.; Lecrevisse, Q.; Vidriales, M.B.; et al. Immunophenotype of normal vs. myeloma plasma cells: Toward antibody panel specifications for MRD detection in multiple myeloma. Cytom. Part B-Clin. Cytom. 2016, 90, 61–72. [Google Scholar] [CrossRef]
- Kárai, B.; Miltényi, Z.; Gergely, L.; Száraz-Széles, M.; Kappelmayer, J.; Hevessy, Z. The impact of delayed sample handling and type of anticoagulant on the interpretation of dysplastic signs detected by flow cytometry. Biochem. Medica 2018, 28, 130–144. [Google Scholar] [CrossRef] [Green Version]
- Shalekoff, S.; Page-Shipp, L. Effects of Anticoagulants and Temperature on Expression of Activation Markers CD11b and HLA-DR on Human Leukocytes. Clin. Diagn. Lab. Immunol. 1998, 5, 695–702. [Google Scholar] [CrossRef] [Green Version]
- Ng, A.A.P.; Lee, B.T.K.; Teo, T.S.Y.; Poidinger, M.; Connolly, J.E. Optimal cellular preservation for high dimensional flow cytometric analysis of multicentre trials. J. Immunol. Methods 2012, 385, 79–89. [Google Scholar] [CrossRef] [PubMed]
- Davis, B.H.; Dasgupta, A.; Kussick, S.; Han, J. Validation of Cell-based Fluorescence Assays: Practice Guidelines from the ICSH and ICCS–Part II–Preanalytical Issues. Cytom. Part B-Clin. Cytom. 2013, 290, 286–290. [Google Scholar] [CrossRef]
- Theunissen, P.; Mejstrikova, E.; Sedek, L.; Van Der Sluijs-Gelling, A.J.; Gaipa, G.; Bartels, M.; Sobral da Costa, E.; Kotrová, M.; Novakova, M.; Sonneveld, E.; et al. Standardized flow cytometry for highly sensitive MRD measurements in B-cell acute lymphoblastic leukemia. Blood 2017, 129, 347–357. [Google Scholar] [CrossRef] [PubMed]
- Flores-Montero, J.; Sanoja-Flores, L.; Paiva, B.; Puig, N.; García-Sánchez, O.; Böttcher, S.; Van Der Velden, V.H.J.; Pérez-Morán, J.J.; Vidriales, M.B.; García-Sanz, R.; et al. Next Generation Flow for highly sensitive and standardized detection of minimal residual disease in multiple myeloma. Leukemia 2017, 31, 2094–2103. [Google Scholar] [CrossRef] [Green Version]
- Soh, K.T.; Tario, J.D.; Hahn, T.; Hillengass, J.; McCarthy, P.L.; Wallace, P.K. CD319 (SLAMF7) an alternative marker for detecting plasma cells in the presence of daratumumab or elotuzumab. Cytom. Part B-Clin. Cytom. 2021, 100, 497–508. [Google Scholar] [CrossRef] [PubMed]
- Wood, B.; Jevremovic, D.; Béné, M.C.; Yan, M.; Jacobs, P.; Litwin, V. Validation of cell-based fluorescence assays: Practice guidelines from the ICSH and ICCS-part V-assay performance criteria. Cytom. Part B-Clin. Cytom. 2013, 84, 315–323. [Google Scholar] [CrossRef]


Publisher’s Note: MDPI stays neutral with regard to jurisdictional claims in published maps and institutional affiliations. |
© 2022 by the authors. Licensee MDPI, Basel, Switzerland. This article is an open access article distributed under the terms and conditions of the Creative Commons Attribution (CC BY) license (https://creativecommons.org/licenses/by/4.0/).
Share and Cite
Sędek, Ł.; Flores-Montero, J.; van der Sluijs, A.; Kulis, J.; te Marvelde, J.; Philippé, J.; Böttcher, S.; Bitter, M.; Caetano, J.; van der Velden, V.H.J.; et al. Impact of Pre-Analytical and Analytical Variables Associated with Sample Preparation on Flow Cytometric Stainings Obtained with EuroFlow Panels. Cancers 2022, 14, 473. https://doi.org/10.3390/cancers14030473
Sędek Ł, Flores-Montero J, van der Sluijs A, Kulis J, te Marvelde J, Philippé J, Böttcher S, Bitter M, Caetano J, van der Velden VHJ, et al. Impact of Pre-Analytical and Analytical Variables Associated with Sample Preparation on Flow Cytometric Stainings Obtained with EuroFlow Panels. Cancers. 2022; 14(3):473. https://doi.org/10.3390/cancers14030473
Chicago/Turabian StyleSędek, Łukasz, Juan Flores-Montero, Alita van der Sluijs, Jan Kulis, Jeroen te Marvelde, Jan Philippé, Sebastian Böttcher, Marieke Bitter, Joana Caetano, Vincent H. J. van der Velden, and et al. 2022. "Impact of Pre-Analytical and Analytical Variables Associated with Sample Preparation on Flow Cytometric Stainings Obtained with EuroFlow Panels" Cancers 14, no. 3: 473. https://doi.org/10.3390/cancers14030473