
Non-Canonical Role of PDK1 as a Negative Regulator of Apoptosis through Macromolecular Complexes Assembly at the ER–Mitochondria Interface in Oncogene-Driven NSCLC

 , , , and
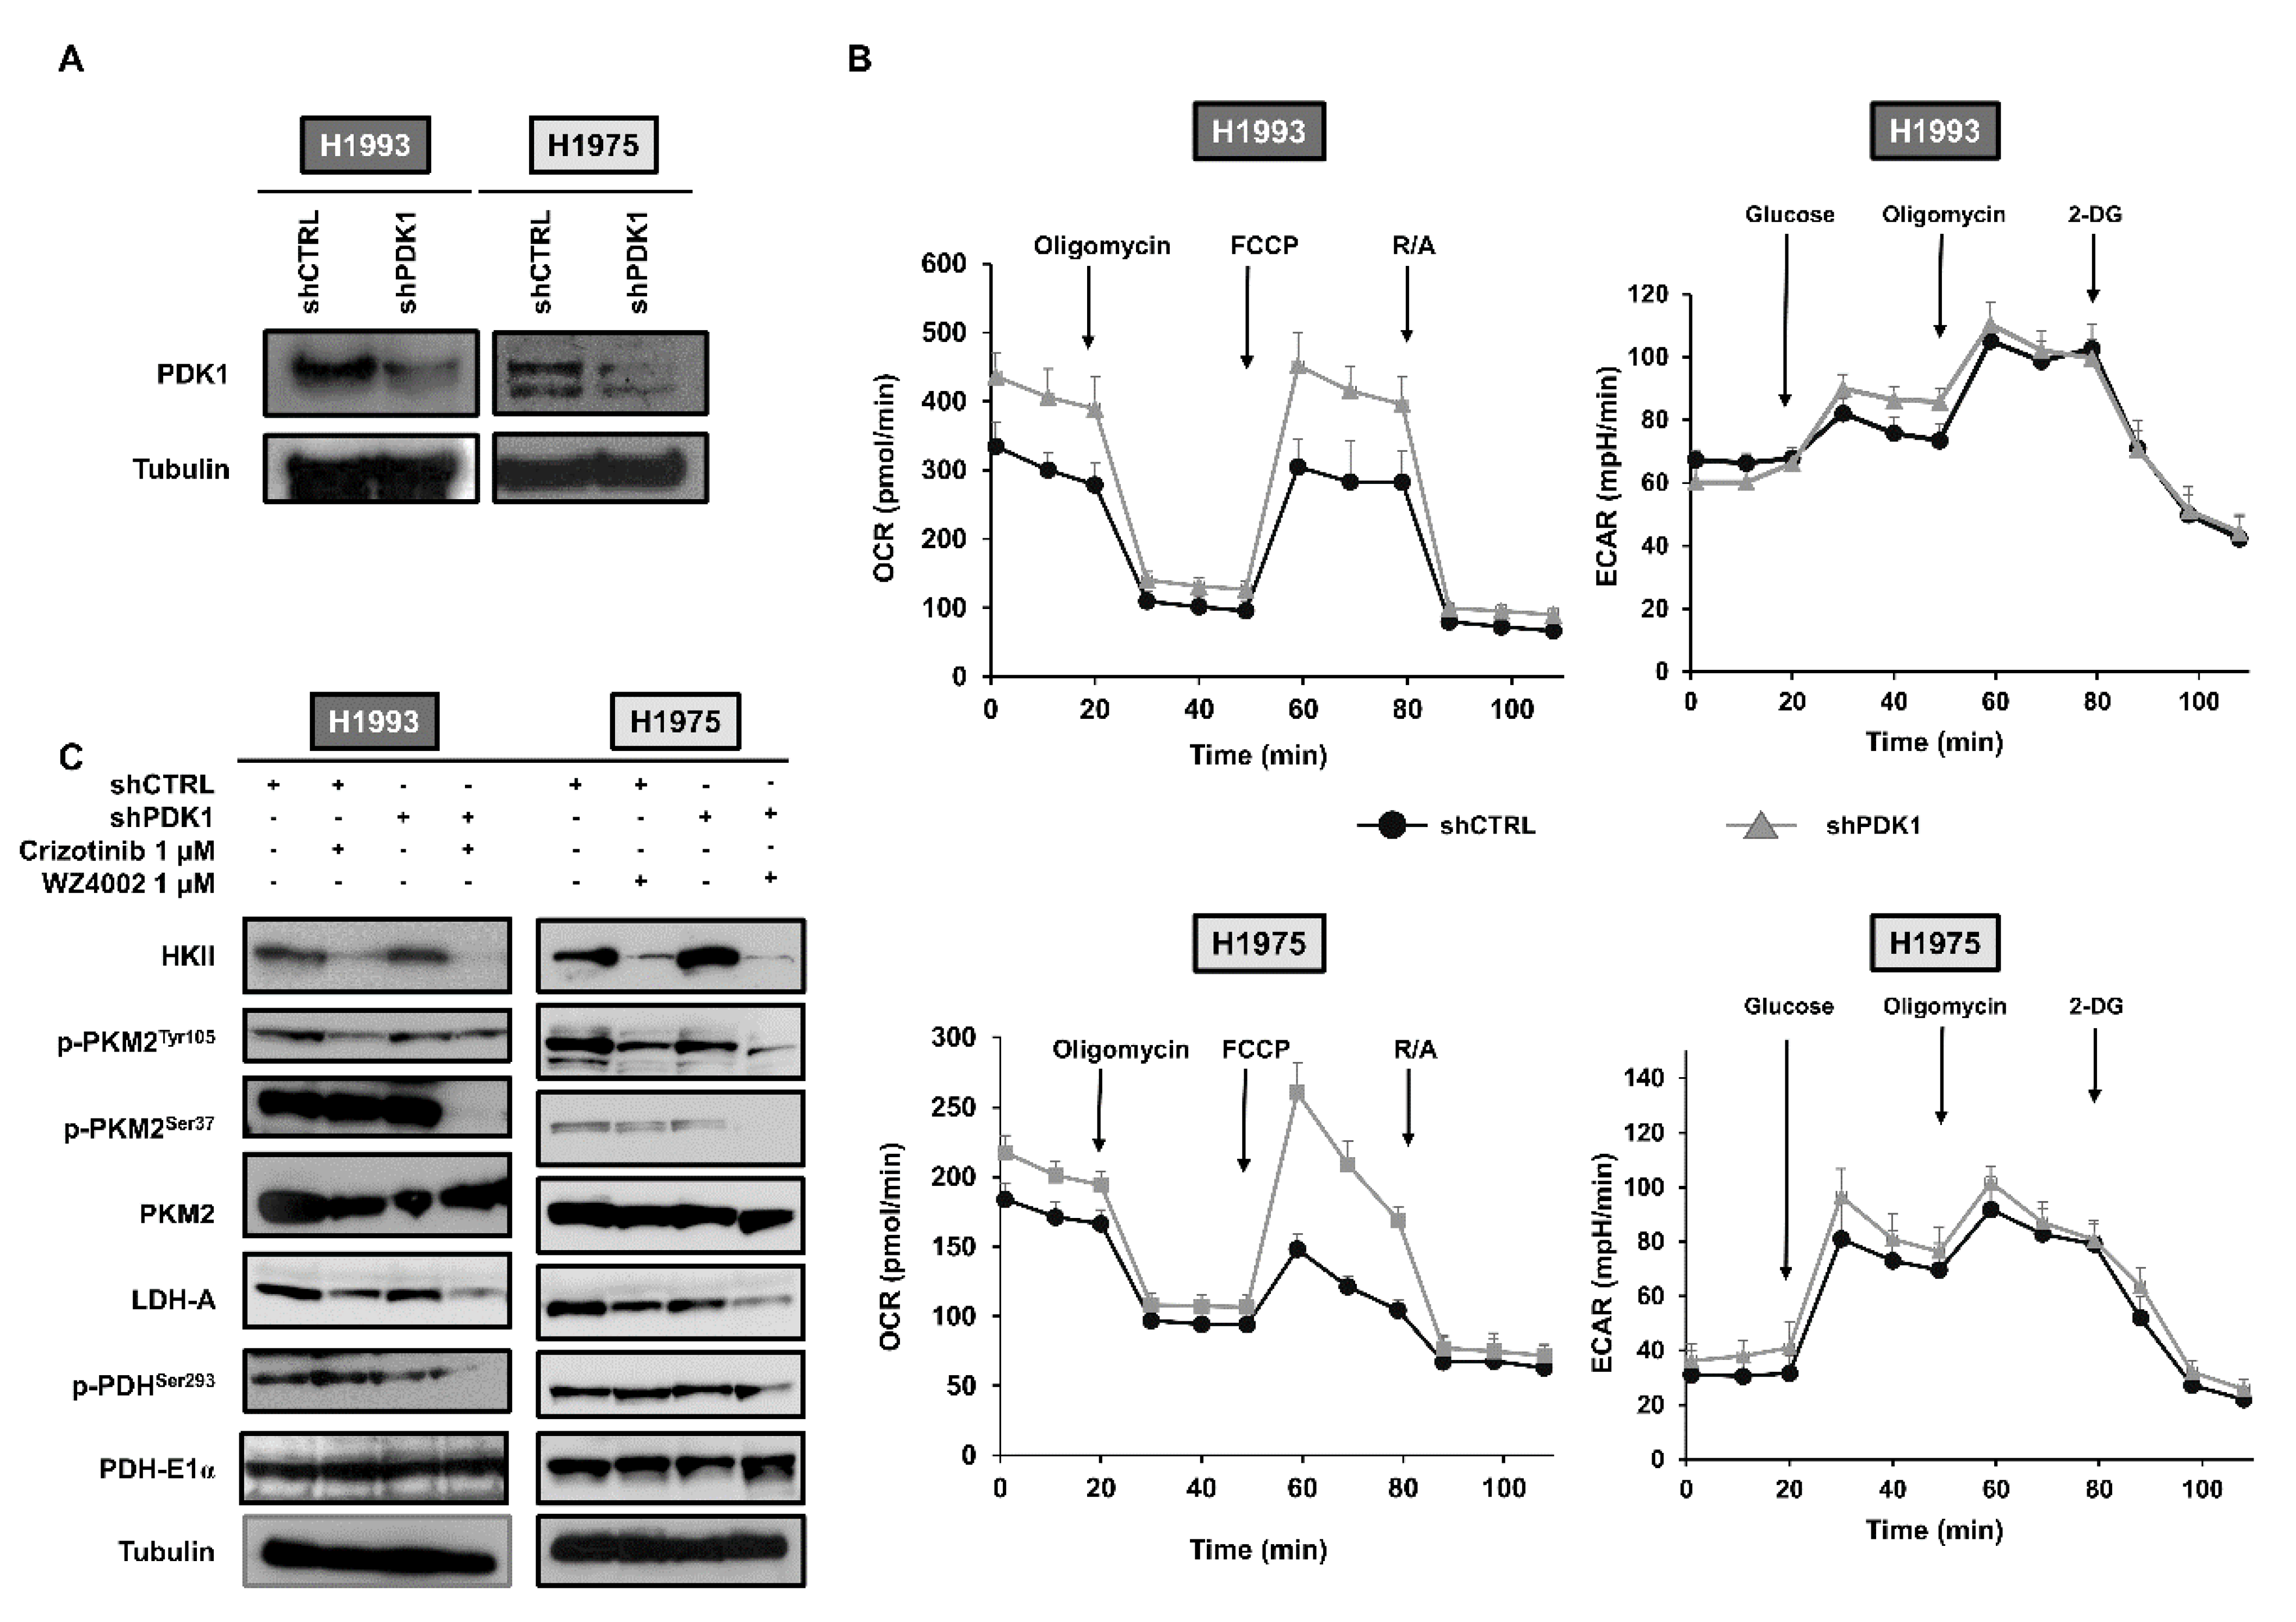
Abstract
:Simple Summary
Abstract
1. Introduction
2. Results
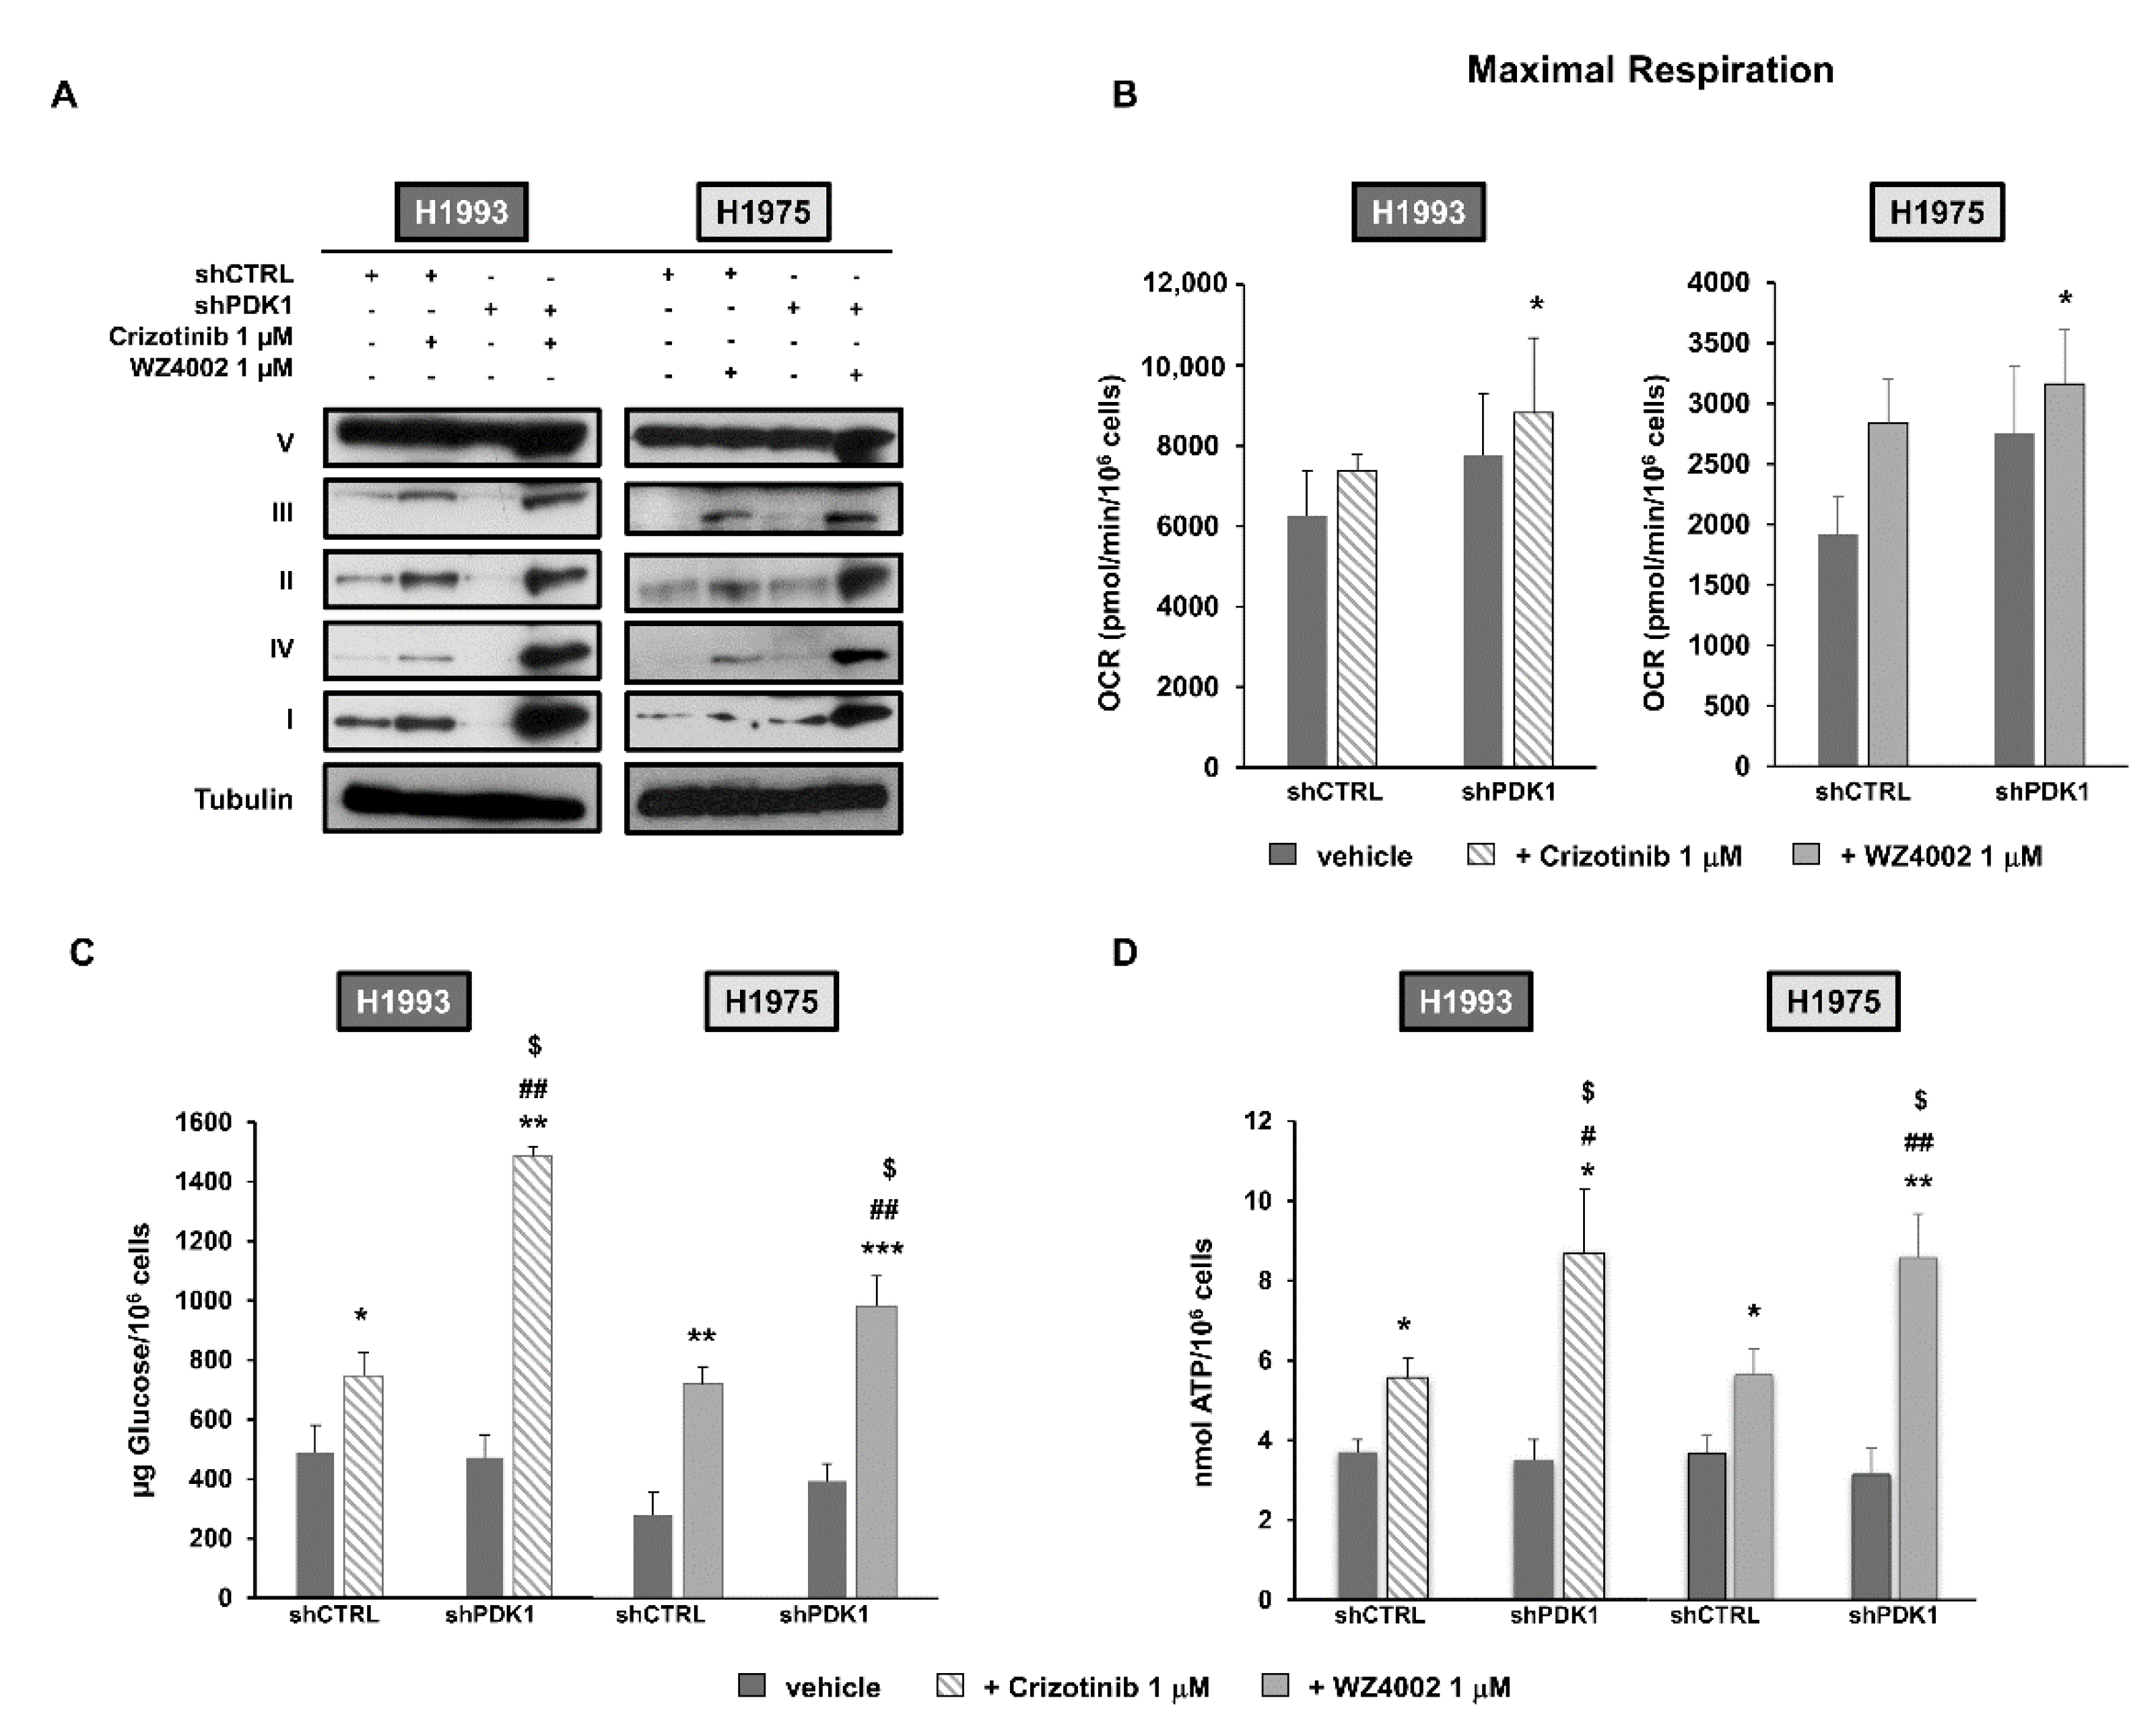
2.1. Silencing of PDK1 by Targeted shRNA and Effects on Glucose Metabolism
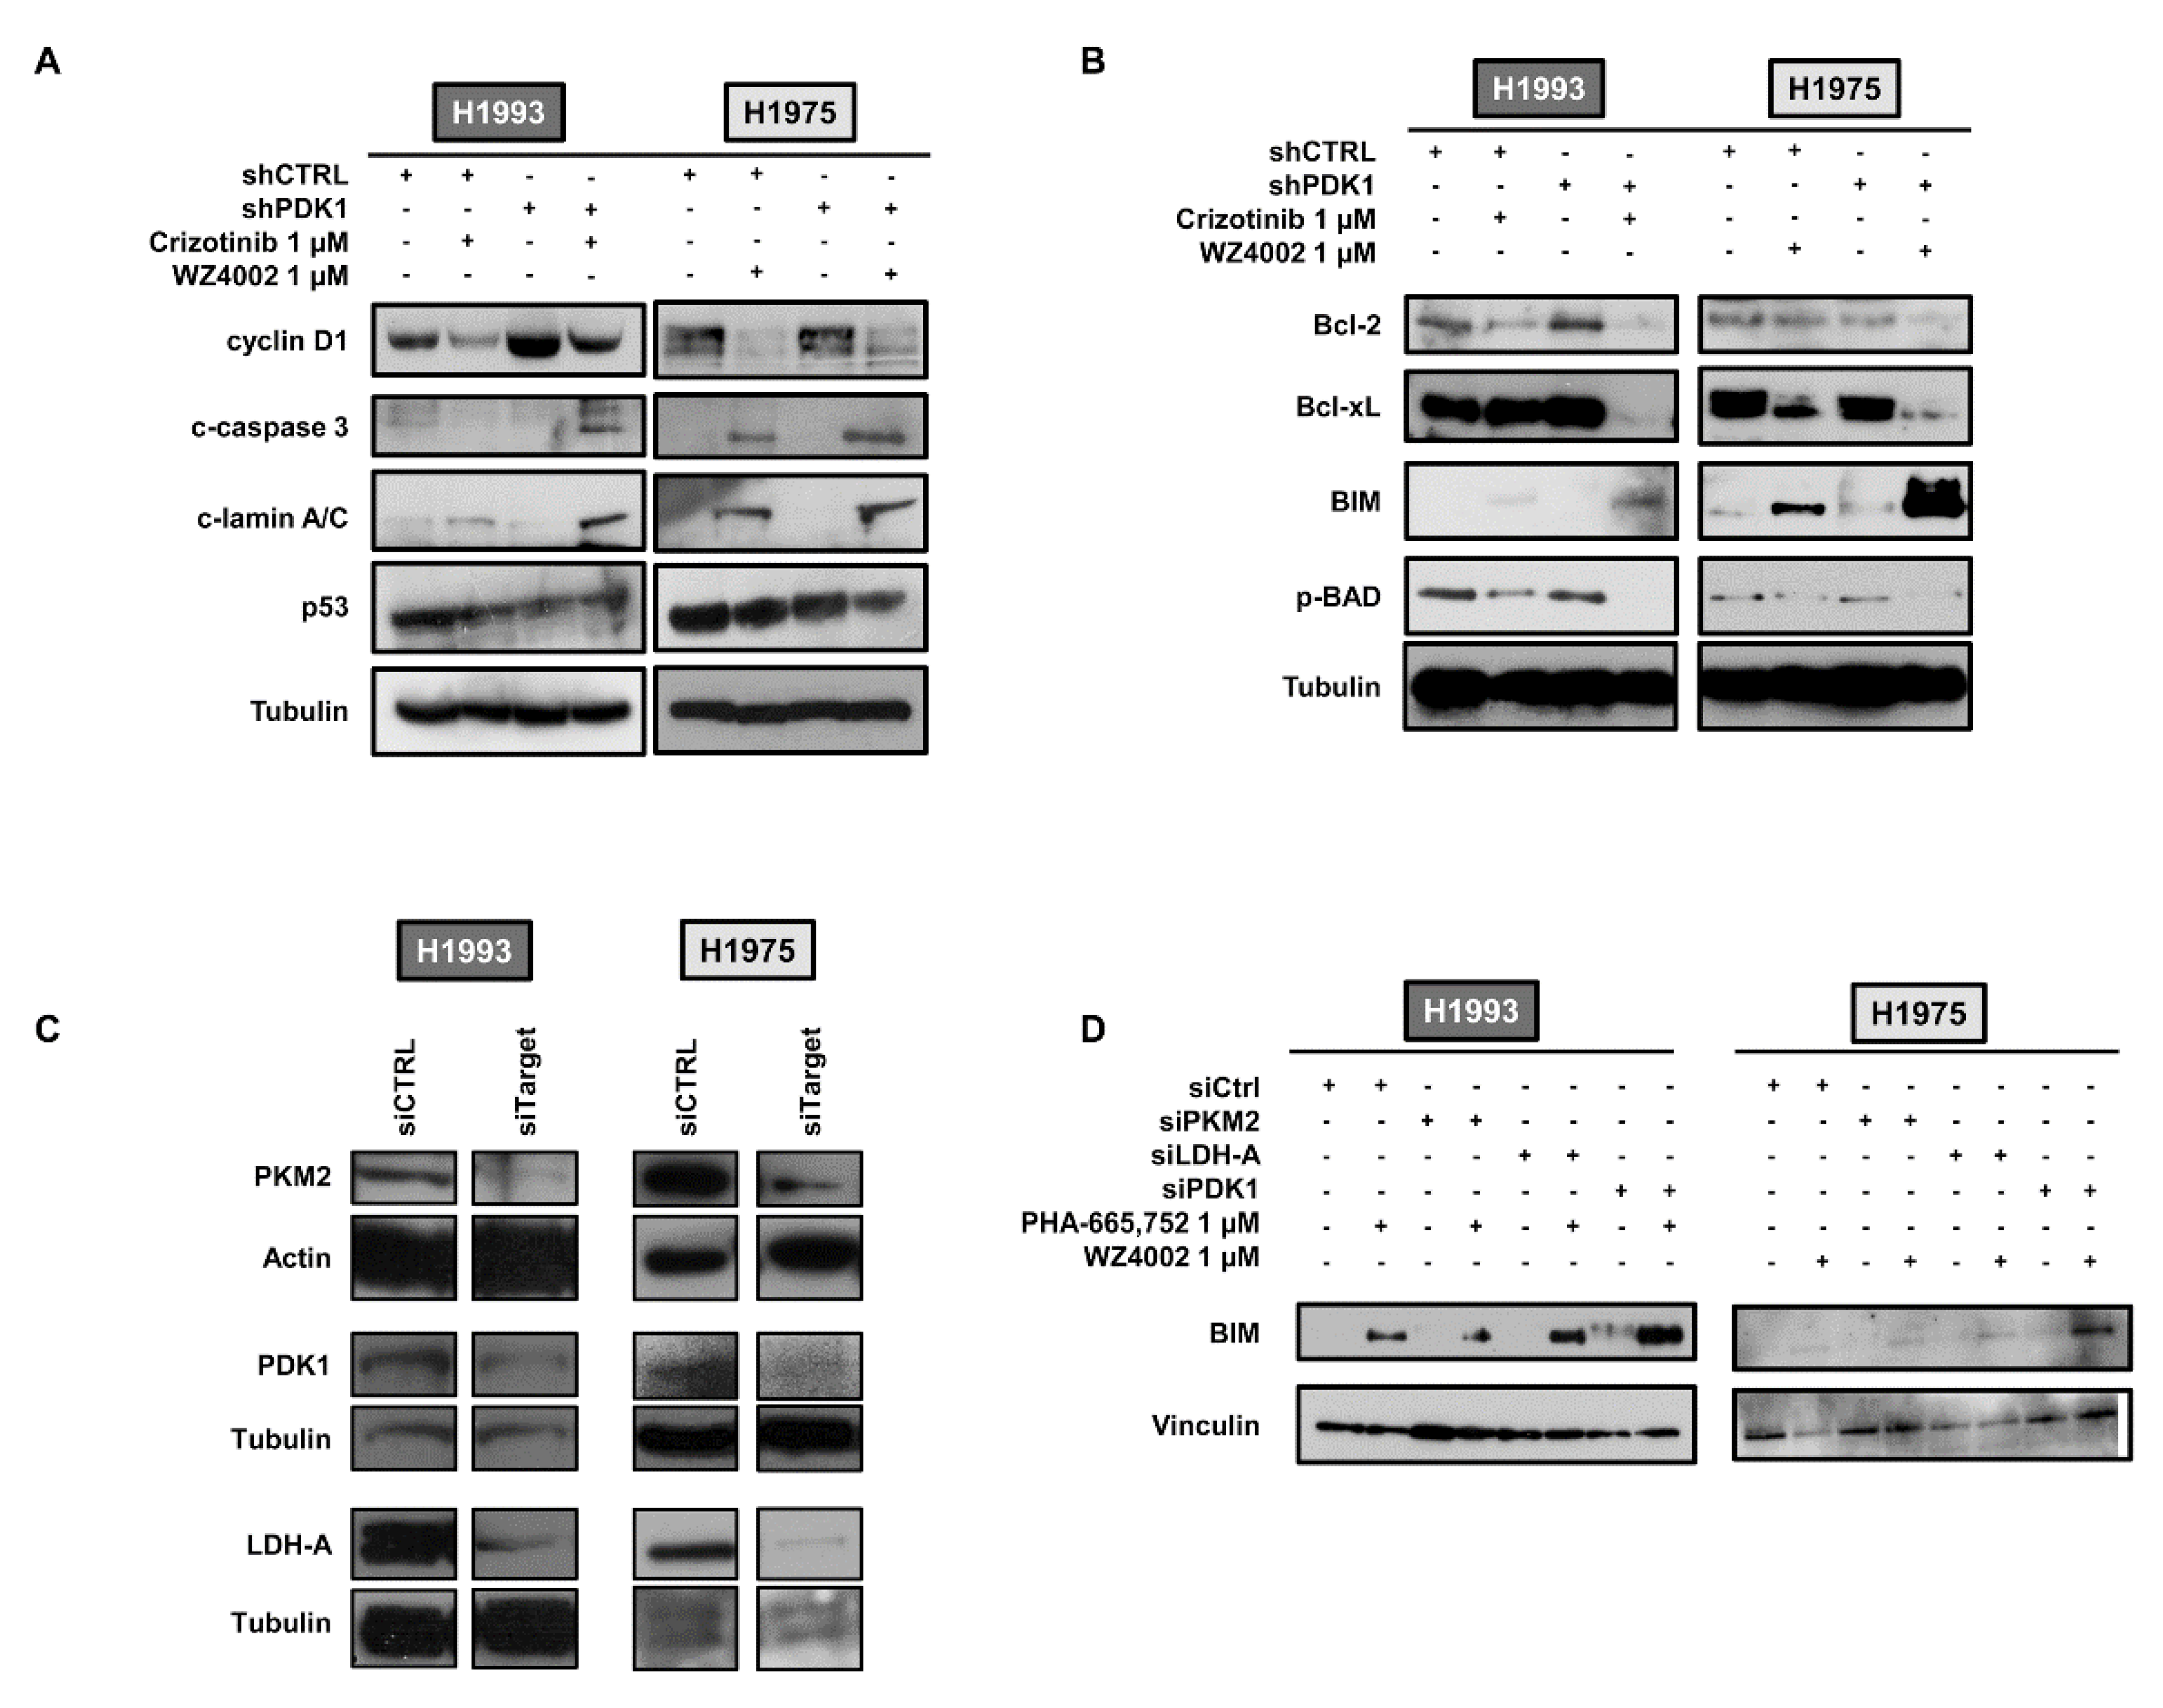
2.2. Effects of PDK1 Knockdown on Apoptotic Response to TKI Treatment
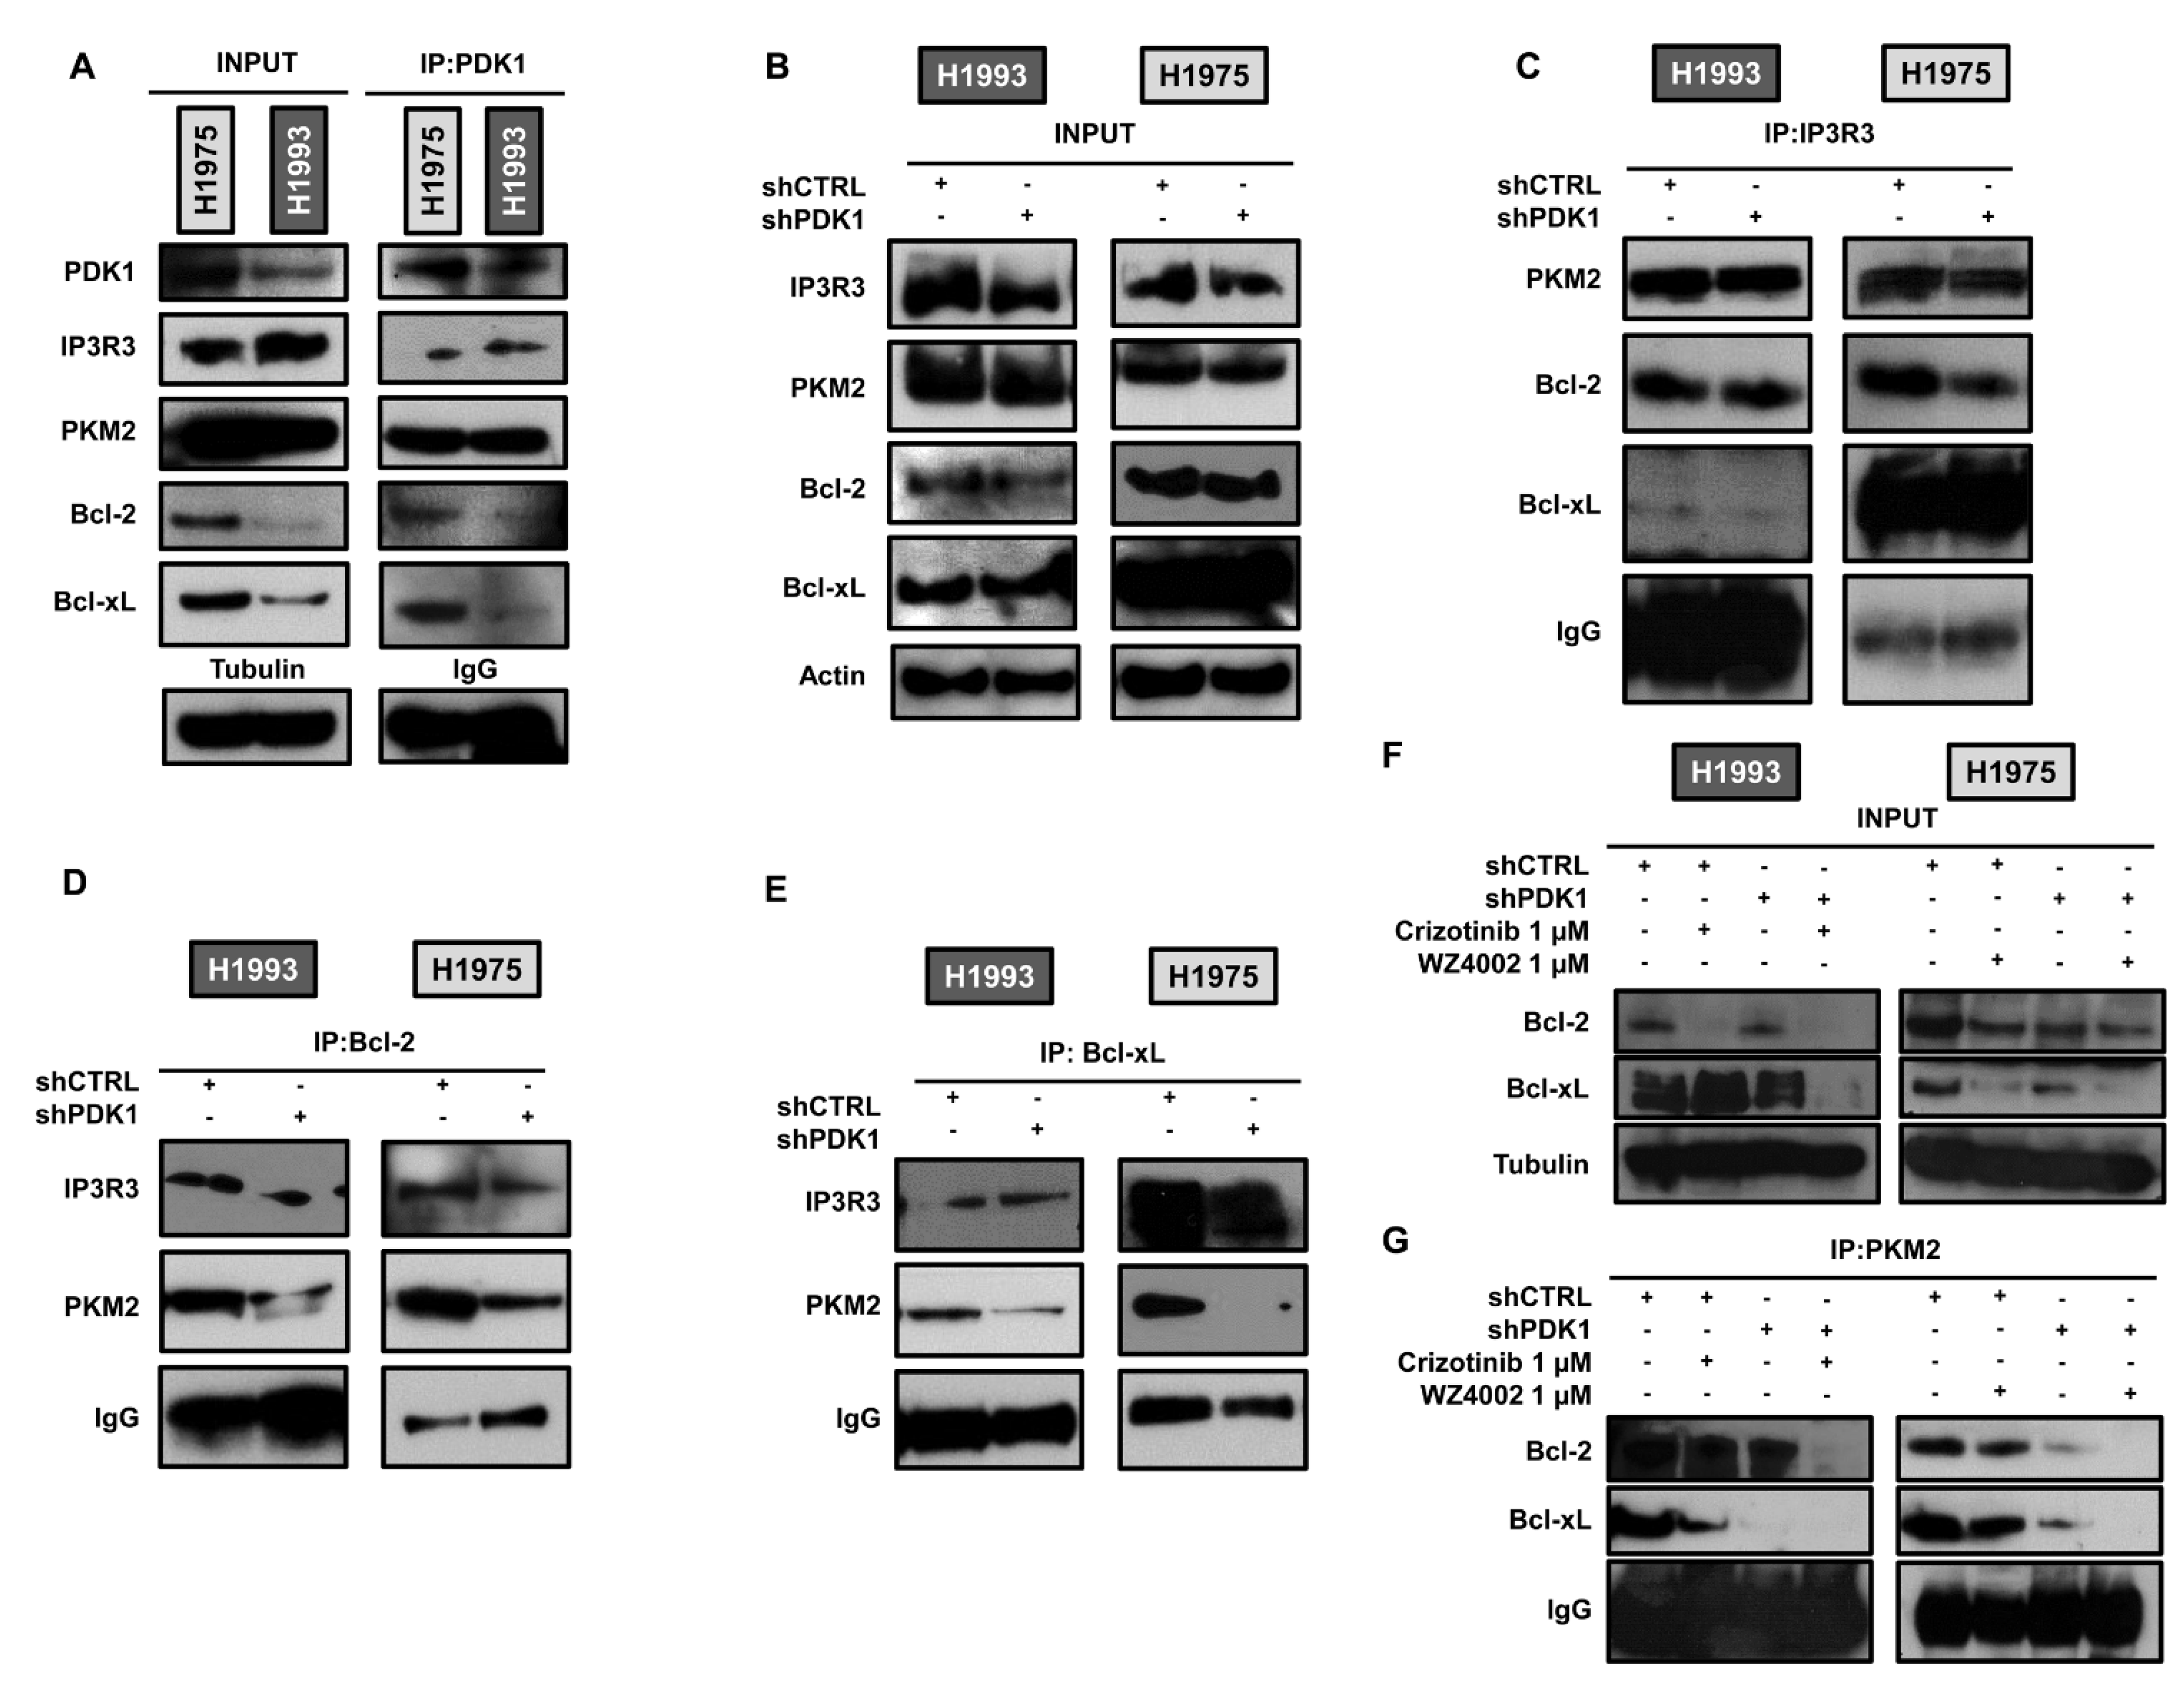
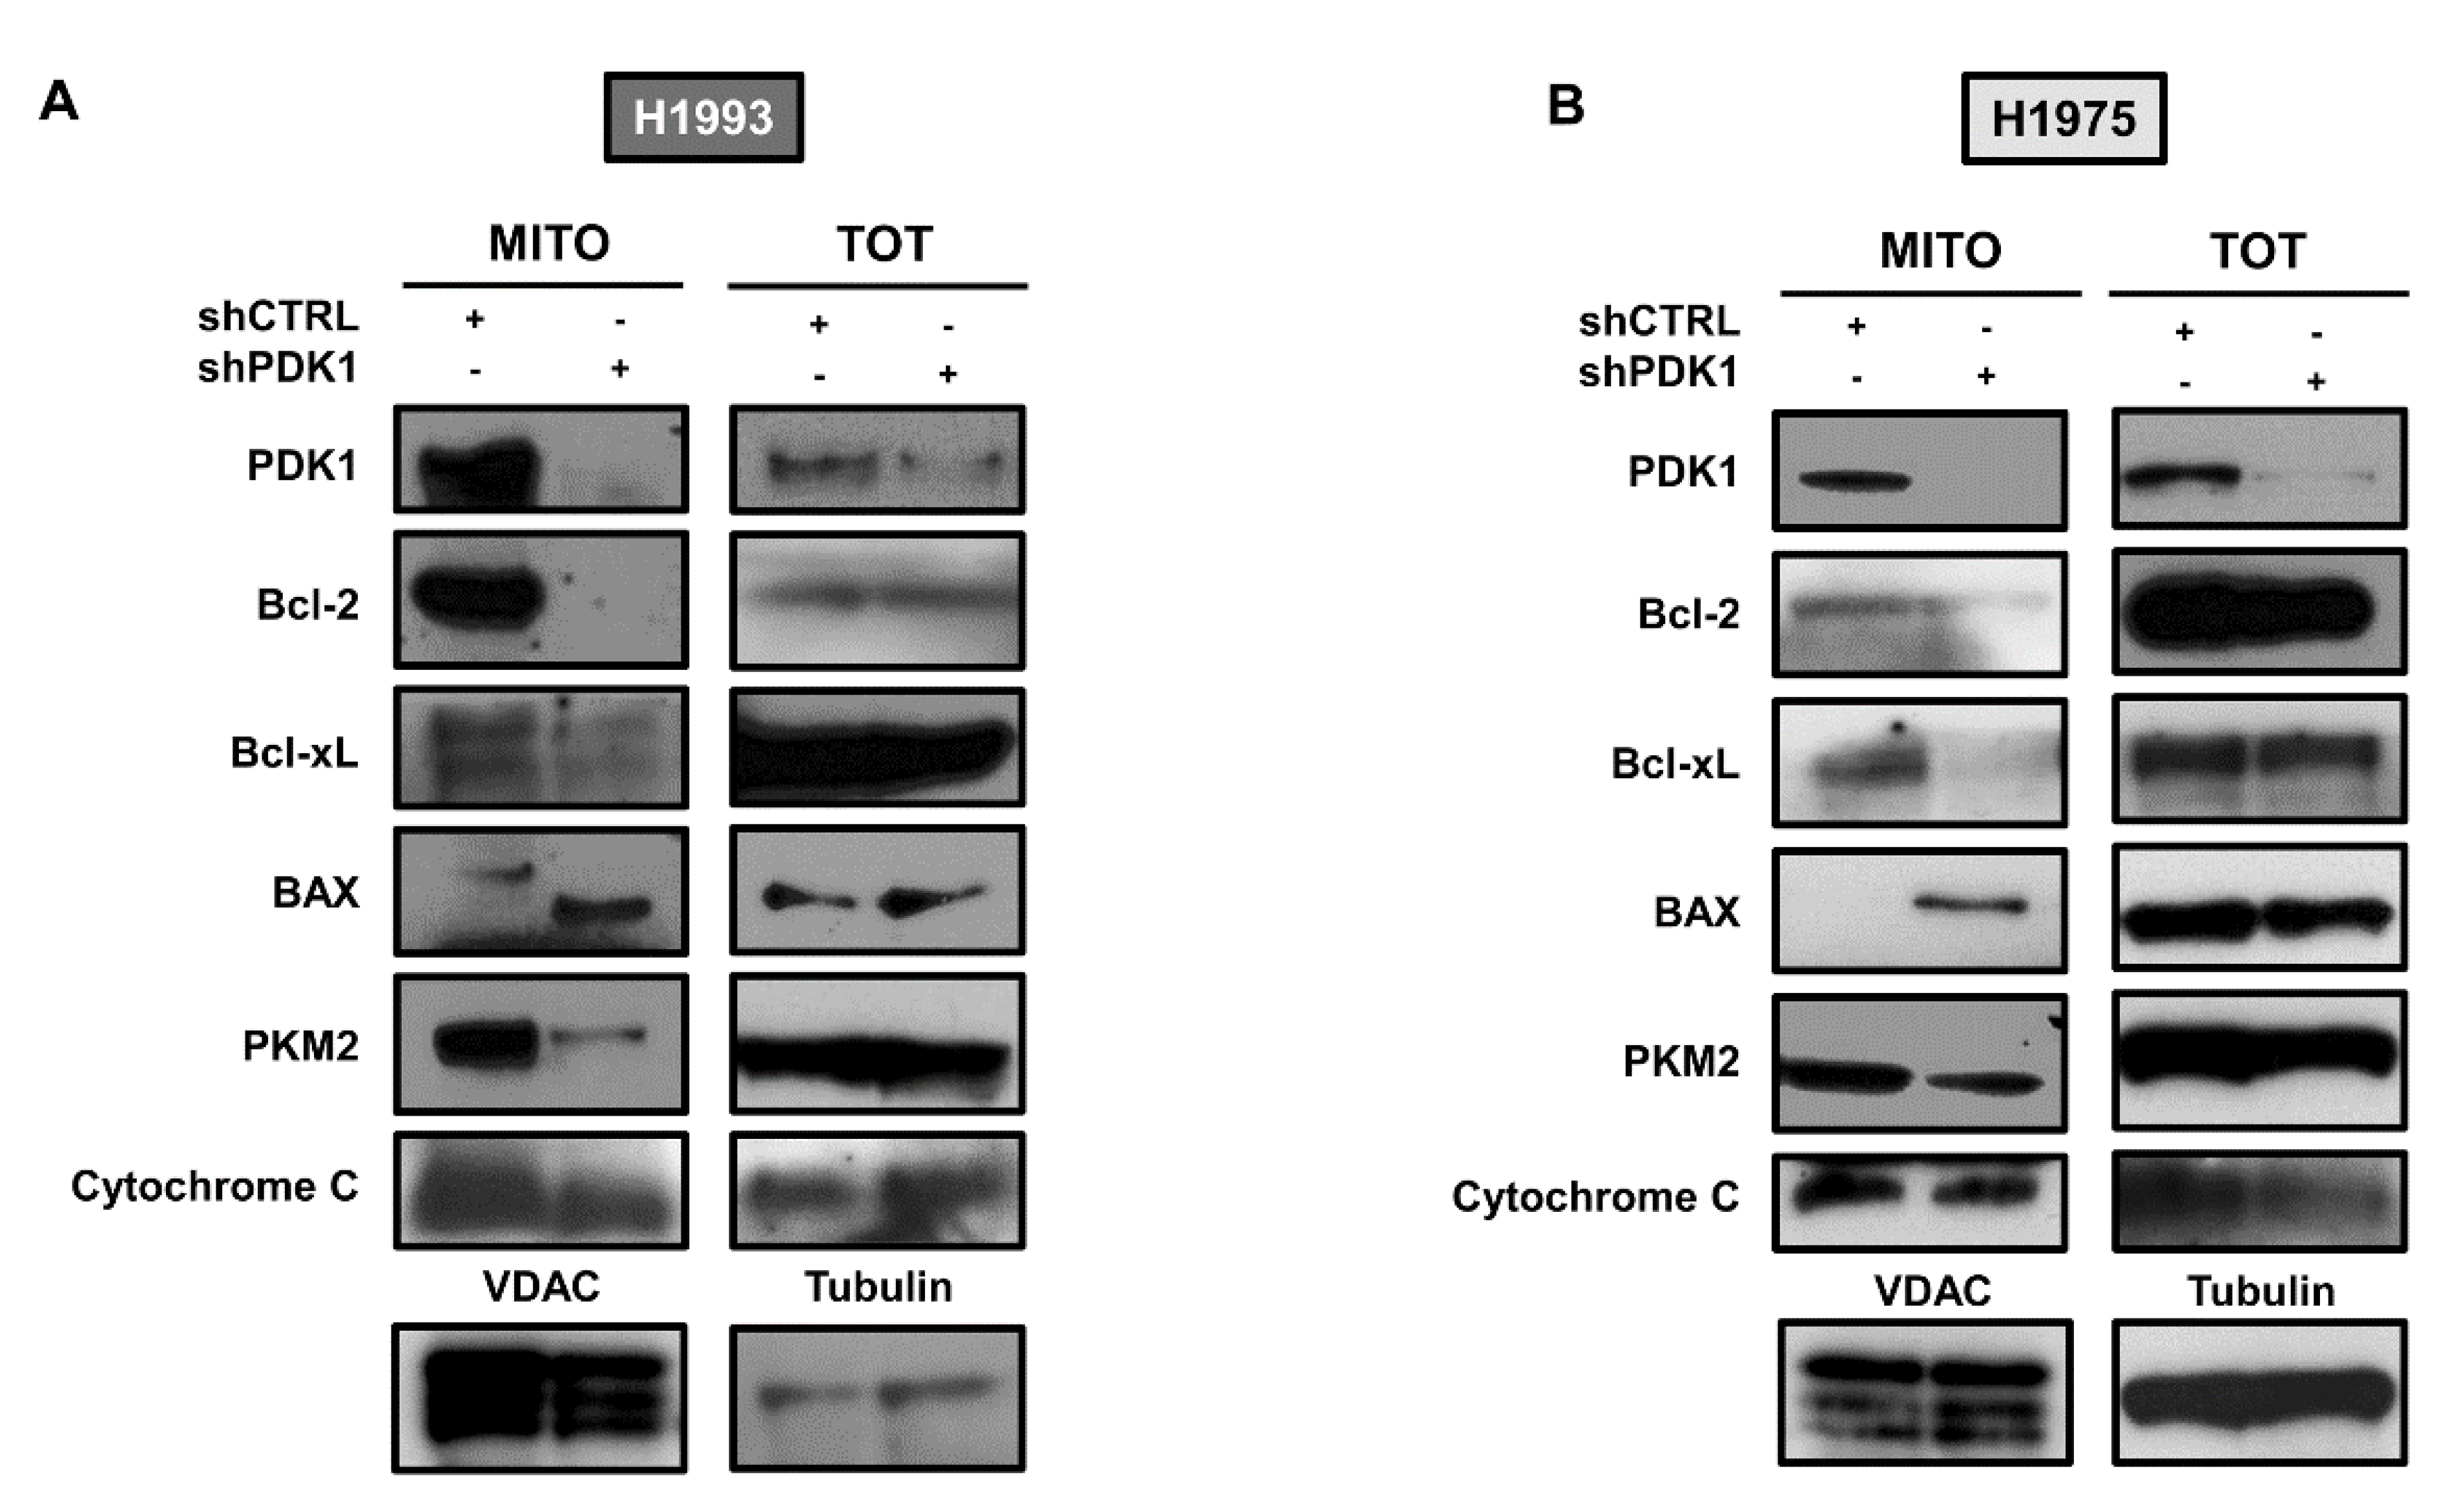
2.3. PDK1-Dependent Protein–Protein Interactions at ER–Mitochondria Interface
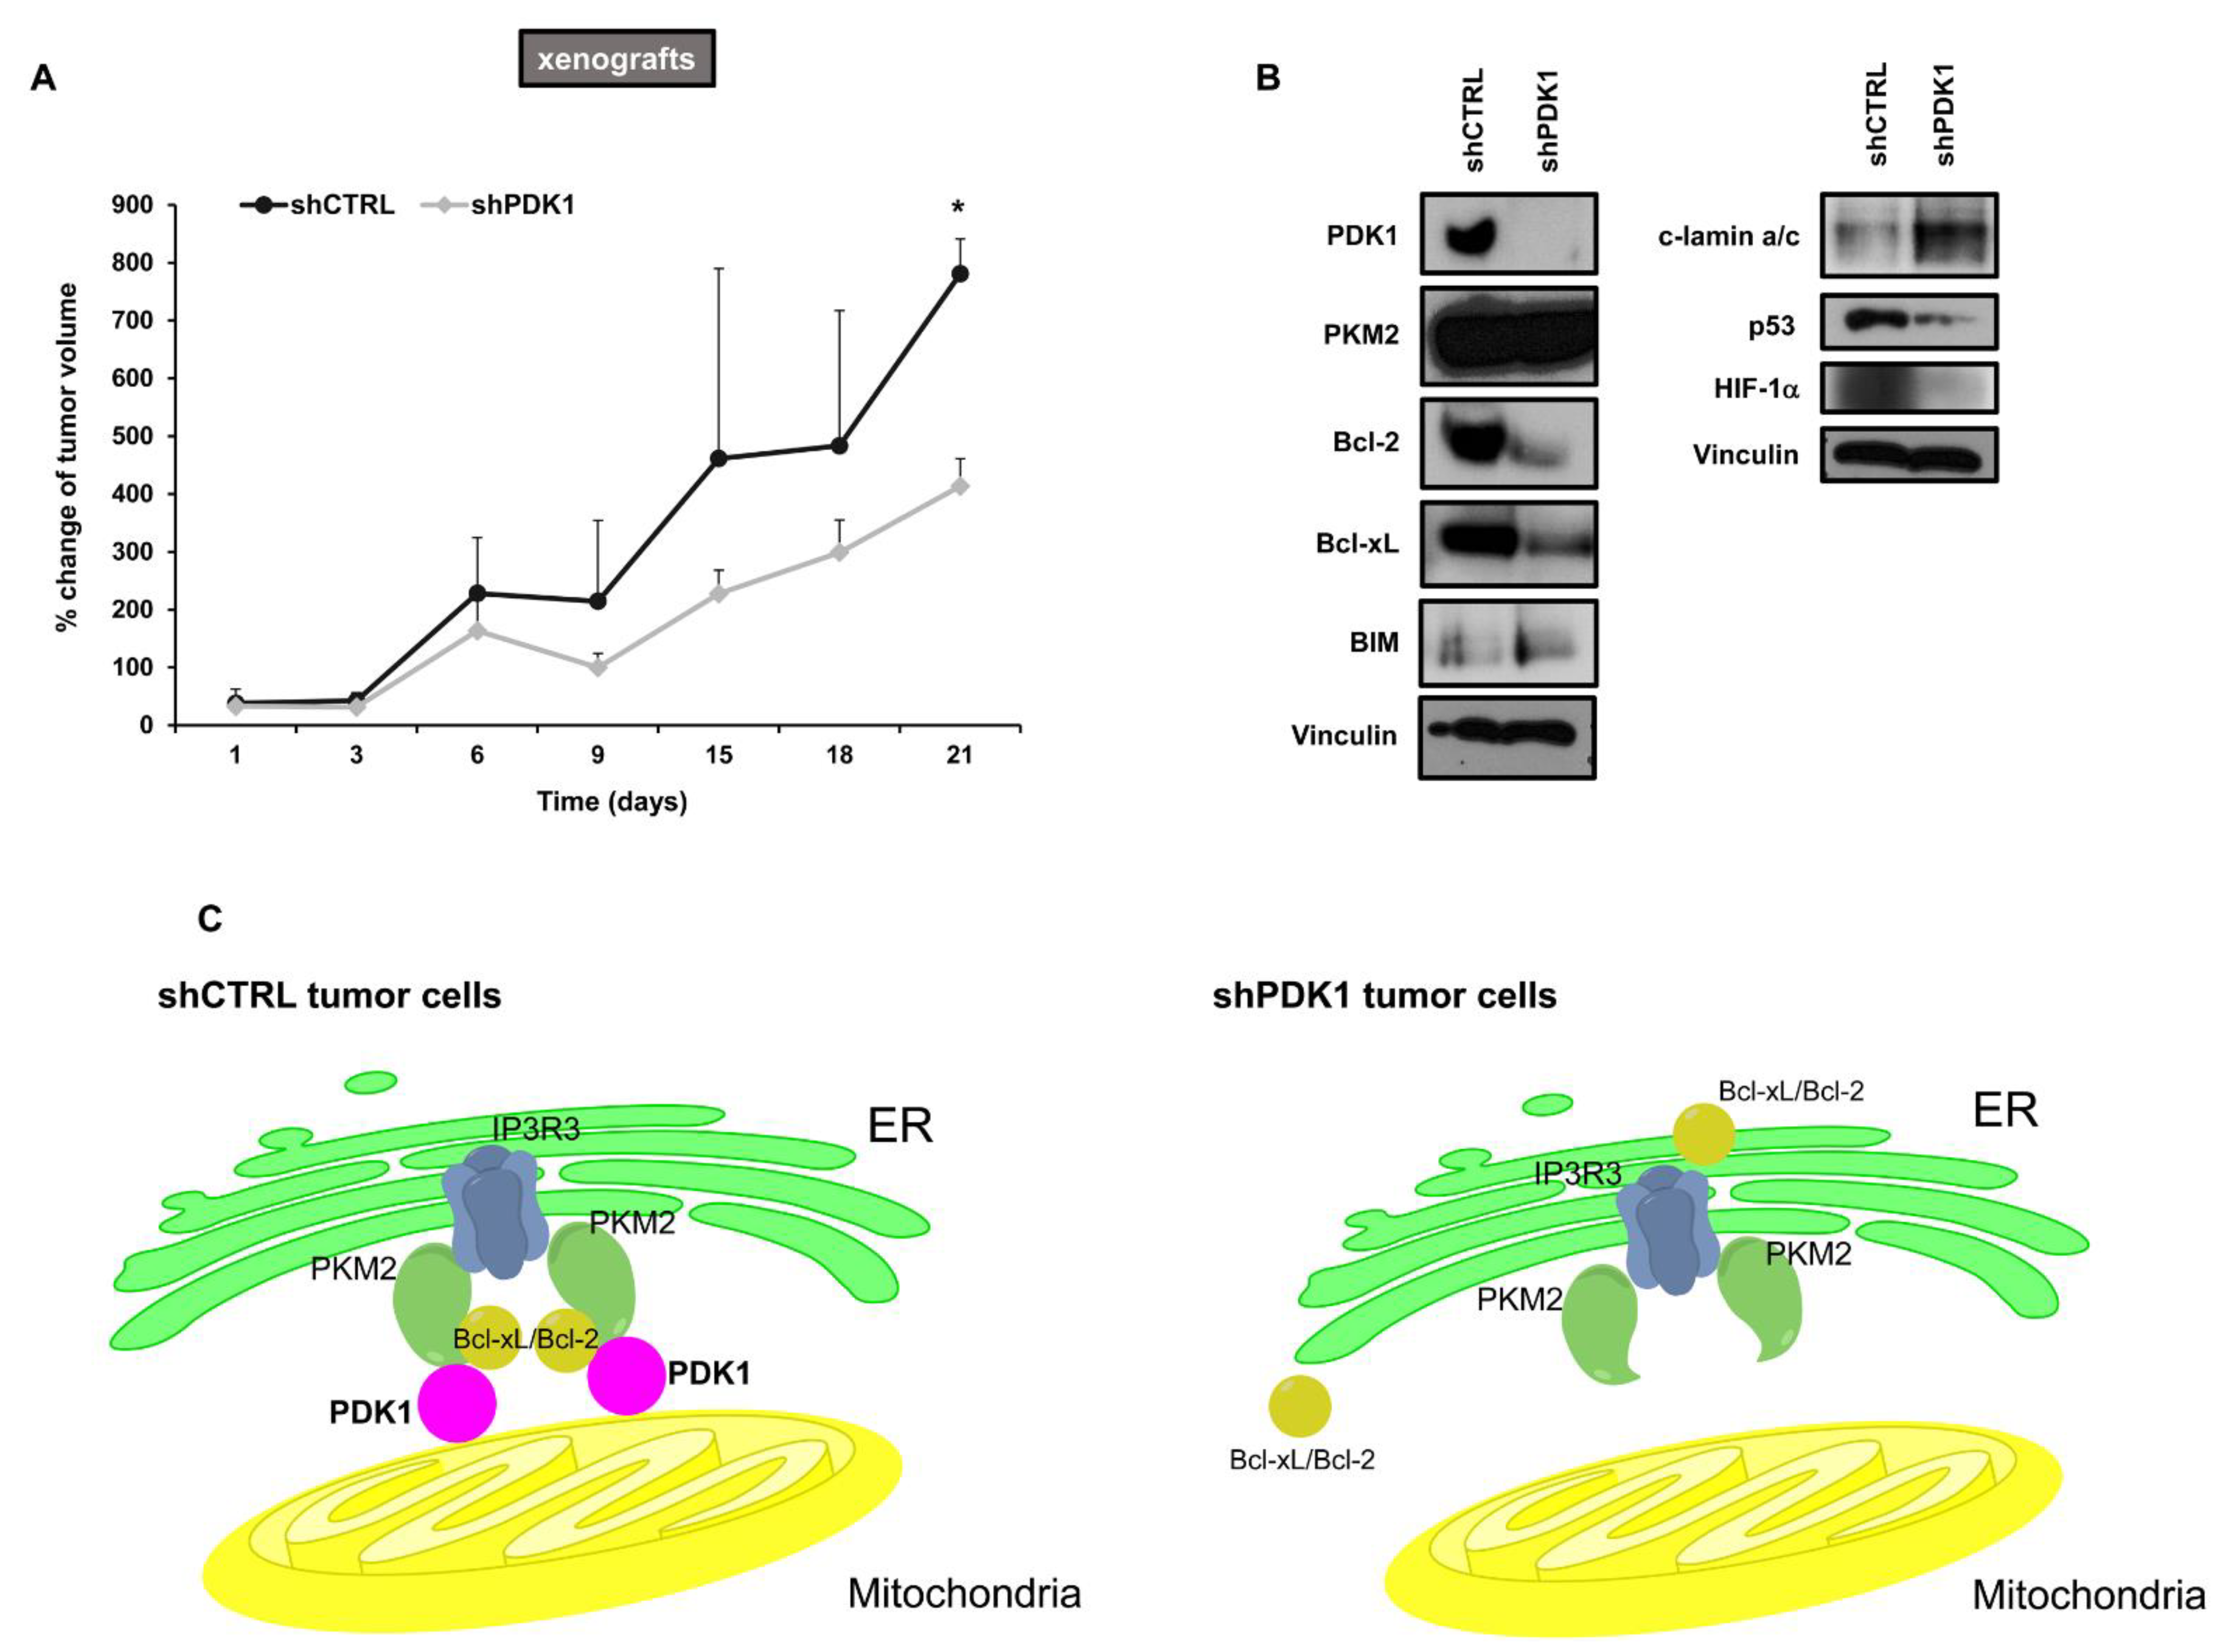
2.4. Effects of PDK1 Knockdown on Tumor Growth in Animal Models
3. Discussion
4. Materials and Methods
4.1. Cell Lines and Treatment
4.2. shRNA and siRNA Interference
4.3. Immunoblotting Analysis and Immunoprecipitation
4.4. Glucose Consumption, Intracellular ATP and Citrate Levels in Cultured Tumor Cells
4.5. Oxygen Consumption and Extracellular Acidification Rates
4.6. PDK1 Knockdown and Tumor Growth in Animal Models
4.7. Statistical Analysis
5. Conclusions
Supplementary Materials
Author Contributions
Funding
Institutional Review Board Statement
Informed Consent Statement
Data Availability Statement
Conflicts of Interest
References
- Vander Heiden, M.G.; DeBerardinis, R.J. Understanding the Intersections between Metabolism and Cancer Biology. Cell 2017, 168, 657–669. [Google Scholar] [CrossRef] [PubMed] [Green Version]
- Levine, A.J.; Puzio-Kuter, A.M. The control of the metabolic switch in cancers by oncogenes and tumor suppressor genes. Science 2010, 330, 1340–1344. [Google Scholar] [CrossRef] [PubMed] [Green Version]
- Cairns, R.A.; Harris, I.S.; Mak, T.W. Regulation of cancer cell metabolism. Nat. Rev. Cancer 2011, 11, 85–95. [Google Scholar] [CrossRef] [PubMed] [Green Version]
- DeBerardinis, R.J.; Chandel, N.S. Fundamentals of cancer metabolism. Sci. Adv. 2016, 2, e1600200. [Google Scholar] [CrossRef] [PubMed] [Green Version]
- Elstrom, R.L.; Bauer, D.E.; Buzzai, M.; Karnauskas, R.; Harris, M.H.; Plas, D.R.; Zhuang, H.; Cinalli, R.M.; Alavi, A.; Rudin, C.M.; et al. Akt stimulates aerobic glycolysis in cancer cells. Cancer Res. 2004, 64, 3892–3899. [Google Scholar] [CrossRef] [PubMed] [Green Version]
- Christofk, H.R.; Vander Heiden, M.G.; Wu, N.; Asara, J.M.; Cantley, L.C. Pyruvate kinase M2 is a phosphotyrosine-binding protein. Nature 2008, 452, 181–186. [Google Scholar] [CrossRef]
- Hitosugi, T.; Kang, S.; Vander Heiden, M.G.; Chung, T.W.; Elf, S.; Lythgoe, K.; Dong, S.; Lonial, S.; Wang, X.; Chen, G.Z.; et al. Tyrosine phosphorylation inhibits PKM2 to promote the Warburg effect and tumor growth. Sci. Signal. 2009, 2, ra73. [Google Scholar] [CrossRef] [PubMed] [Green Version]
- Stacpoole, P.W. Therapeutic Targeting of the Pyruvate Dehydrogenase Complex/Pyruvate Dehydrogenase Kinase (PDC/PDK) Axis in Cancer. J. Natl. Cancer Inst. 2017, 109, djx071. [Google Scholar] [CrossRef] [Green Version]
- Woolbright, B.L.; Rajendran, G.; Harris, R.A.; Taylor, J.A., 3rd. Metabolic Flexibility in Cancer: Targeting the Pyruvate Dehydrogenase Kinase: Pyruvate Dehydrogenase Axis. Mol. Cancer Ther. 2019, 18, 1673–1681. [Google Scholar] [CrossRef] [Green Version]
- Golias, T.; Kery, M.; Radenkovic, S.; Papandreou, I. Microenvironmental control of glucose metabolism in tumors by regulation of pyruvate dehydrogenase. Int. J. Cancer 2019, 144, 674–686. [Google Scholar] [CrossRef] [Green Version]
- Kim, J.W.; Tchernyshyov, I.; Semenza, G.L.; Dang, C.V. HIF-1-mediated expression of pyruvate dehydrogenase kinase: A metabolic switch required for cellular adaptation to hypoxia. Cell Metab. 2006, 3, 177–185. [Google Scholar] [CrossRef] [Green Version]
- Semenza, G.L. HIF-1 mediates metabolic responses to intratumoral hypoxia and oncogenic mutations. J. Clin. Investig. 2013, 123, 3664–3671. [Google Scholar] [CrossRef] [Green Version]
- McFate, T.; Mohyeldin, A.; Lu, H.; Thakar, J.; Henriques, J.; Halim, N.D.; Wu, H.; Schell, M.J.; Tsang, T.M.; Teahan, O.; et al. Pyruvate dehydrogenase complex activity controls metabolic and malignant phenotype in cancer cells. J. Biol. Chem. 2008, 283, 22700–22708. [Google Scholar] [CrossRef] [PubMed] [Green Version]
- Bonnet, S.; Archer, S.L.; Allalunis-Turner, J.; Haromy, A.; Beaulieu, C.; Thompson, R.; Lee, C.T.; Lopaschuk, G.D.; Puttagunta, L.; Bonnet, S.; et al. A mitochondria-K+ channel axis is suppressed in cancer and its normalization promotes apoptosis and inhibits cancer growth. Cancer Cell 2007, 11, 37–51. [Google Scholar] [CrossRef] [PubMed] [Green Version]
- Woolbright, B.L.; Choudhary, D.; Mikhalyuk, A.; Trammel, C.; Shanmugam, S.; Abbott, E.; Pilbeam, C.C.; Taylor, J.A., 3rd. The Role of Pyruvate Dehydrogenase Kinase-4 (PDK4) in Bladder Cancer and Chemoresistance. Mol. Cancer Ther. 2018, 17, 2004–2012. [Google Scholar] [CrossRef] [PubMed] [Green Version]
- Roh, J.L.; Park, J.Y.; Kim, E.H.; Jang, H.J.; Kwon, M. Activation of mitochondrial oxidation by PDK2 inhibition reverses cisplatin resistance in head and neck cancer. Cancer Lett. 2016, 371, 20–29. [Google Scholar] [CrossRef]
- Moore, J.D.; Staniszewska, A.; Shaw, T.; D’Alessandro, J.; Davis, B.; Surgenor, A.; Baker, L.; Matassova, N.; Murray, J.; Macias, A.; et al. VER-246608, a novel pan-isoform ATP competitive inhibitor of pyruvate dehydrogenase kinase, disrupts Warburg metabolism and induces context-dependent cytostasis in cancer cells. Oncotarget 2014, 5, 12862–12876. [Google Scholar] [CrossRef] [Green Version]
- Yang, Z.; Tam, K.Y. Anti-cancer synergy of dichloroacetate and EGFR tyrosine kinase inhibitors in NSCLC cell lines. Eur. J. Pharmacol. 2016, 789, 458–467. [Google Scholar] [CrossRef]
- Yang, Z.; Zhang, S.L.; Hu, X.; Tam, K.Y. Inhibition of pyruvate dehydrogenase kinase 1 enhances the anti-cancer effect of EGFR tyrosine kinase inhibitors in non-small cell lung cancer. Eur. J. Pharmacol. 2018, 838, 41–52. [Google Scholar] [CrossRef]
- De Rosa, V.; Iommelli, F.; Monti, M.; Fonti, R.; Votta, G.; Stoppelli, M.P.; Del Vecchio, S. Reversal of Warburg Effect and Reactivation of Oxidative Phosphorylation by Differential Inhibition of EGFR Signaling Pathways in Non-Small Cell Lung Cancer. Clin. Cancer Res. 2015, 21, 5110–5120. [Google Scholar] [CrossRef] [Green Version]
- De Rosa, V.; Iommelli, F.; Monti, M.; Mainolfi, C.G.; Fonti, R.; Del Vecchio, S. Early (18)F-FDG uptake as a reliable imaging biomarker of T790M-mediated resistance but not MET amplification in non-small cell lung cancer treated with EGFR tyrosine kinase inhibitors. EJNMMI Res. 2016, 6, 74. [Google Scholar] [CrossRef] [Green Version]
- De Rosa, V.; Monti, M.; Terlizzi, C.; Fonti, R.; Del Vecchio, S.; Iommelli, F. Coordinate Modulation of Glycolytic Enzymes and OXPHOS by Imatinib in BCR-ABL Driven Chronic Myelogenous Leukemia Cells. Int. J. Mol. Sci. 2019, 20, 3134. [Google Scholar] [CrossRef] [Green Version]
- Kinnaird, A.; Dromparis, P.; Saleme, B.; Gurtu, V.; Watson, K.; Paulin, R.; Zervopoulos, S.; Stenson, T.; Sutendra, G.; Pink, D.B.; et al. Metabolic Modulation of Clear-cell Renal Cell Carcinoma with Dichloroacetate, an Inhibitor of Pyruvate Dehydrogenase Kinase. Eur. Urol. 2016, 69, 734–744. [Google Scholar] [CrossRef]
- Peng, F.; Wang, J.H.; Fan, W.J.; Meng, Y.T.; Li, M.M.; Li, T.T.; Cui, B.; Wang, H.F.; Zhao, Y.; An, F.; et al. Glycolysis gatekeeper PDK1 reprograms breast cancer stem cells under hypoxia. Oncogene 2018, 37, 1062–1074. [Google Scholar] [CrossRef] [Green Version]
- Kankotia, S.; Stacpoole, P.W. Dichloroacetate and cancer: New home for an orphan drug? Biochim. Biophys. Acta 2014, 1846, 617–629. [Google Scholar] [CrossRef]
- Ma, L.; Zong, X. Metabolic Symbiosis in Chemoresistance: Refocusing the Role of Aerobic Glycolysis. Front. Oncol. 2020, 10, 5. [Google Scholar] [CrossRef] [PubMed] [Green Version]
- Tang, L.; Wei, F.; Wu, Y.; He, Y.; Shi, L.; Xiong, F.; Gong, Z.; Guo, C.; Li, X.; Deng, H.; et al. Role of metabolism in cancer cell radioresistance and radiosensitization methods. J. Exp. Clin. Cancer Res. 2018, 37, 87. [Google Scholar] [CrossRef] [PubMed]
- Hitosugi, T.; Fan, J.; Chung, T.W.; Lythgoe, K.; Wang, X.; Xie, J.; Ge, Q.; Gu, T.L.; Polakiewicz, R.D.; Roesel, J.L.; et al. Tyrosine phosphorylation of mitochondrial pyruvate dehydrogenase kinase 1 is important for cancer metabolism. Mol. Cell 2011, 44, 864–877. [Google Scholar] [CrossRef] [PubMed] [Green Version]
- Liang, J.; Cao, R.; Wang, X.; Zhang, Y.; Wang, P.; Gao, H.; Li, C.; Yang, F.; Zeng, R.; Wei, P.; et al. Mitochondrial PKM2 regulates oxidative stress-induced apoptosis by stabilizing Bcl2. Cell Res. 2017, 27, 329–351. [Google Scholar] [CrossRef] [Green Version]
- Zhao, X.; Weir, B.A.; LaFramboise, T.; Lin, M.; Beroukhim, R.; Garraway, L.; Beheshti, J.; Lee, J.C.; Naoki, K.; Richards, W.G.; et al. Homozygous deletions and chromosome amplifications in human lung carcinomas revealed by single nucleotide polymorphism array analysis. Cancer Res. 2005, 65, 5561–5570. [Google Scholar] [CrossRef] [Green Version]
- Iommelli, F.; De Rosa, V.; Gargiulo, S.; Panico, M.; Monti, M.; Greco, A.; Gramanzini, M.; Ortosecco, G.; Fonti, R.; Brunetti, A.; et al. Monitoring reversal of MET-mediated resistance to EGFR tyrosine kinase inhibitors in non-small cell lung cancer using 3′-deoxy-3′-[18F]-fluorothymidine positron emission tomography. Clin. Cancer Res. 2014, 20, 4806–4815. [Google Scholar] [CrossRef] [PubMed] [Green Version]
- Engelman, J.A.; Zejnullahu, K.; Mitsudomi, T.; Song, Y.; Hyland, C.; Park, J.O.; Lindeman, N.; Gale, C.M.; Zhao, X.; Christensen, J.; et al. MET amplification leads to gefitinib resistance in lung cancer by activating ERBB3 signaling. Science 2007, 316, 1039–1043. [Google Scholar] [CrossRef]
- Pao, W.; Miller, V.A.; Politi, K.A.; Riely, G.J.; Somwar, R.; Zakowski, M.F.; Kris, M.G.; Varmus, H. Acquired resistance of lung adenocarcinomas to gefitinib or erlotinib is associated with a second mutation in the EGFR kinase domain. PLoS Med. 2005, 2, e73. [Google Scholar] [CrossRef] [PubMed] [Green Version]
- Kobayashi, S.; Boggon, T.J.; Dayaram, T.; Janne, P.A.; Kocher, O.; Meyerson, M.; Johnson, B.E.; Eck, M.J.; Tenen, D.G.; Halmos, B. EGFR mutation and resistance of non-small-cell lung cancer to gefitinib. N. Engl. J. Med. 2005, 352, 786–792. [Google Scholar] [CrossRef] [PubMed]
- Zannetti, A.; Iommelli, F.; Speranza, A.; Salvatore, M.; Del Vecchio, S. 3′-deoxy-3′-18F-fluorothymidine PET/CT to guide therapy with epidermal growth factor receptor antagonists and Bcl-xL inhibitors in non-small cell lung cancer. J. Nucl. Med. 2012, 53, 443–450. [Google Scholar] [CrossRef] [Green Version]
- Wieckowski, M.R.; Giorgi, C.; Lebiedzinska, M.; Duszynski, J.; Pinton, P. Isolation of mitochondria-associated membranes and mitochondria from animal tissues and cells. Nat. Protoc. 2009, 4, 1582–1590. [Google Scholar] [CrossRef] [PubMed]
- Iommelli, F.; De Rosa, V.; Terlizzi, C.; Monti, M.; Panico, M.; Fonti, R.; Del Vecchio, S. Inositol Trisphosphate Receptor Type 3-mediated Enhancement of EGFR and MET Cotargeting Efficacy in Non-Small Cell Lung Cancer Detected by (18)F-fluorothymidine. Clin. Cancer Res. 2018, 24, 3126–3136. [Google Scholar] [CrossRef] [Green Version]


Publisher’s Note: MDPI stays neutral with regard to jurisdictional claims in published maps and institutional affiliations. |
© 2021 by the authors. Licensee MDPI, Basel, Switzerland. This article is an open access article distributed under the terms and conditions of the Creative Commons Attribution (CC BY) license (https://creativecommons.org/licenses/by/4.0/).
Share and Cite
De Rosa, V.; Iommelli, F.; Terlizzi, C.; Leggiero, E.; Camerlingo, R.; Altobelli, G.G.; Fonti, R.; Pastore, L.; Del Vecchio, S. Non-Canonical Role of PDK1 as a Negative Regulator of Apoptosis through Macromolecular Complexes Assembly at the ER–Mitochondria Interface in Oncogene-Driven NSCLC. Cancers 2021, 13, 4133. https://doi.org/10.3390/cancers13164133
De Rosa V, Iommelli F, Terlizzi C, Leggiero E, Camerlingo R, Altobelli GG, Fonti R, Pastore L, Del Vecchio S. Non-Canonical Role of PDK1 as a Negative Regulator of Apoptosis through Macromolecular Complexes Assembly at the ER–Mitochondria Interface in Oncogene-Driven NSCLC. Cancers. 2021; 13(16):4133. https://doi.org/10.3390/cancers13164133
Chicago/Turabian StyleDe Rosa, Viviana, Francesca Iommelli, Cristina Terlizzi, Eleonora Leggiero, Rosa Camerlingo, Giovanna G. Altobelli, Rosa Fonti, Lucio Pastore, and Silvana Del Vecchio. 2021. "Non-Canonical Role of PDK1 as a Negative Regulator of Apoptosis through Macromolecular Complexes Assembly at the ER–Mitochondria Interface in Oncogene-Driven NSCLC" Cancers 13, no. 16: 4133. https://doi.org/10.3390/cancers13164133