
Cancer Cells’ Metabolism Dynamics in Renal Cell Carcinoma Patients’ Outcome: Influence of GLUT-1-Related hsa-miR-144 and hsa-miR-186

 , , , , and
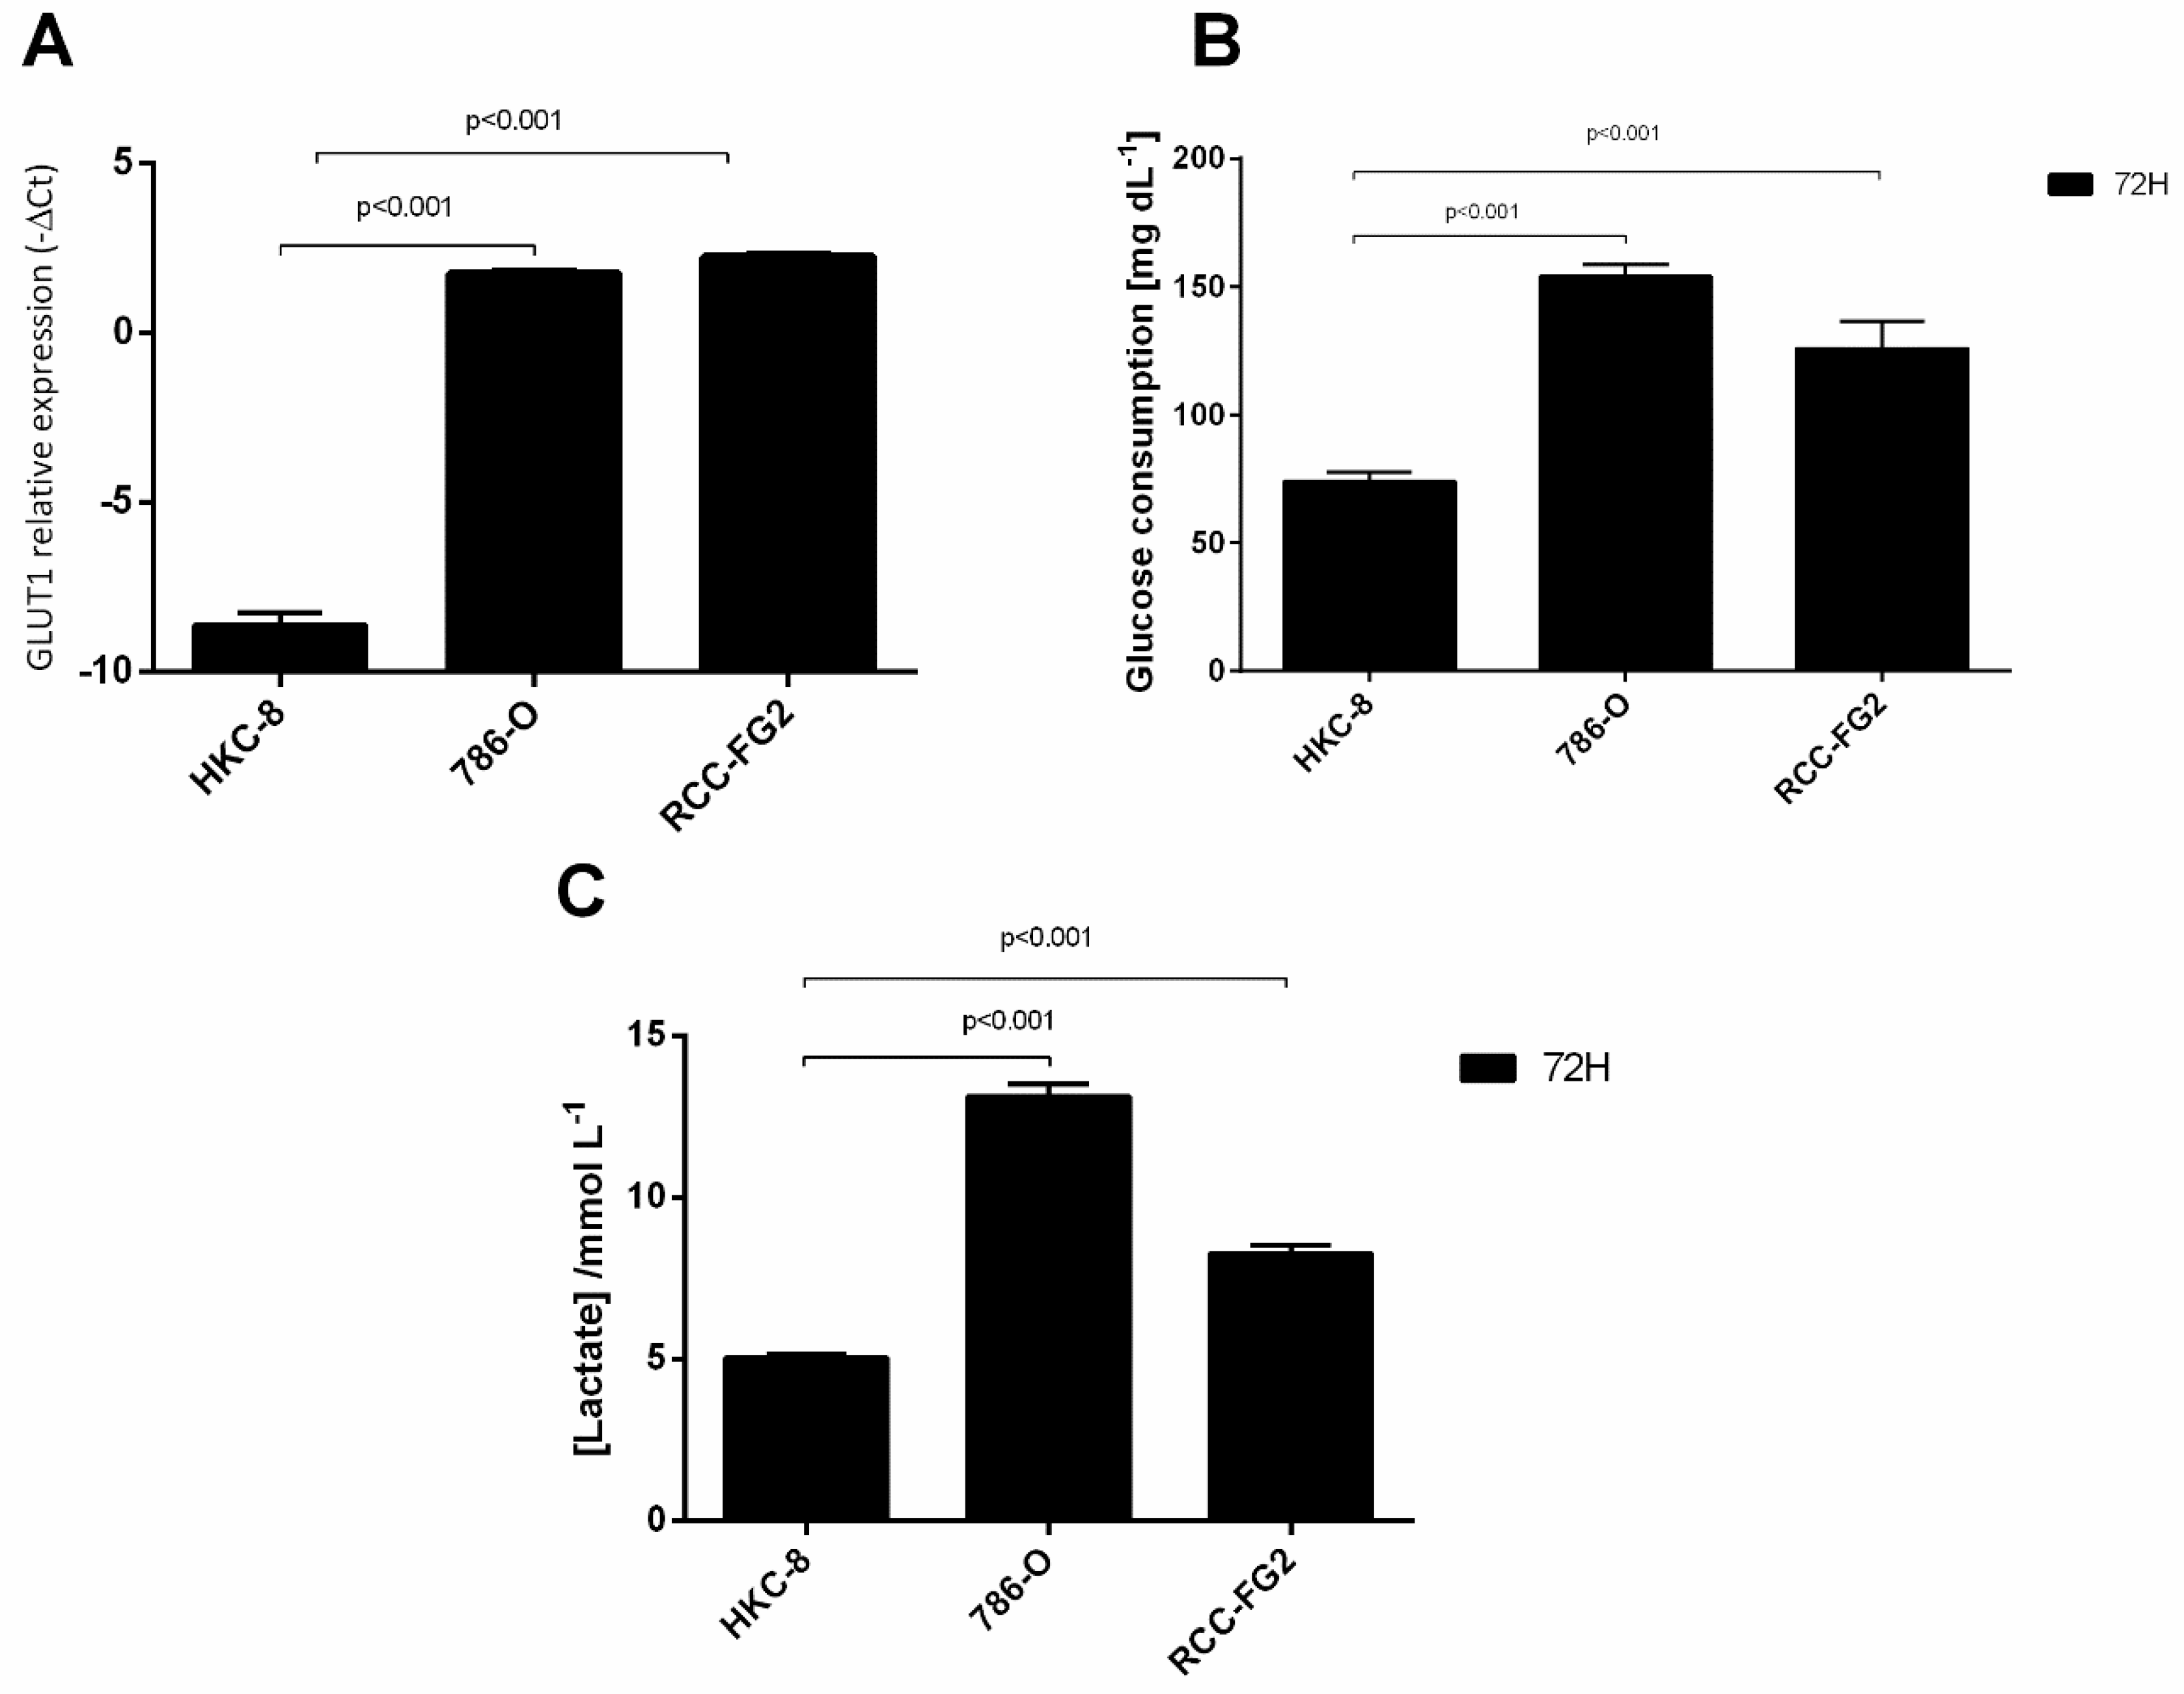
Abstract
:Simple Summary
Abstract
1. Introduction
2. Results
2.1. Overexpression of GLUT-1 in ccRCC and Its Association with an Aerobic Glycolysis Shift
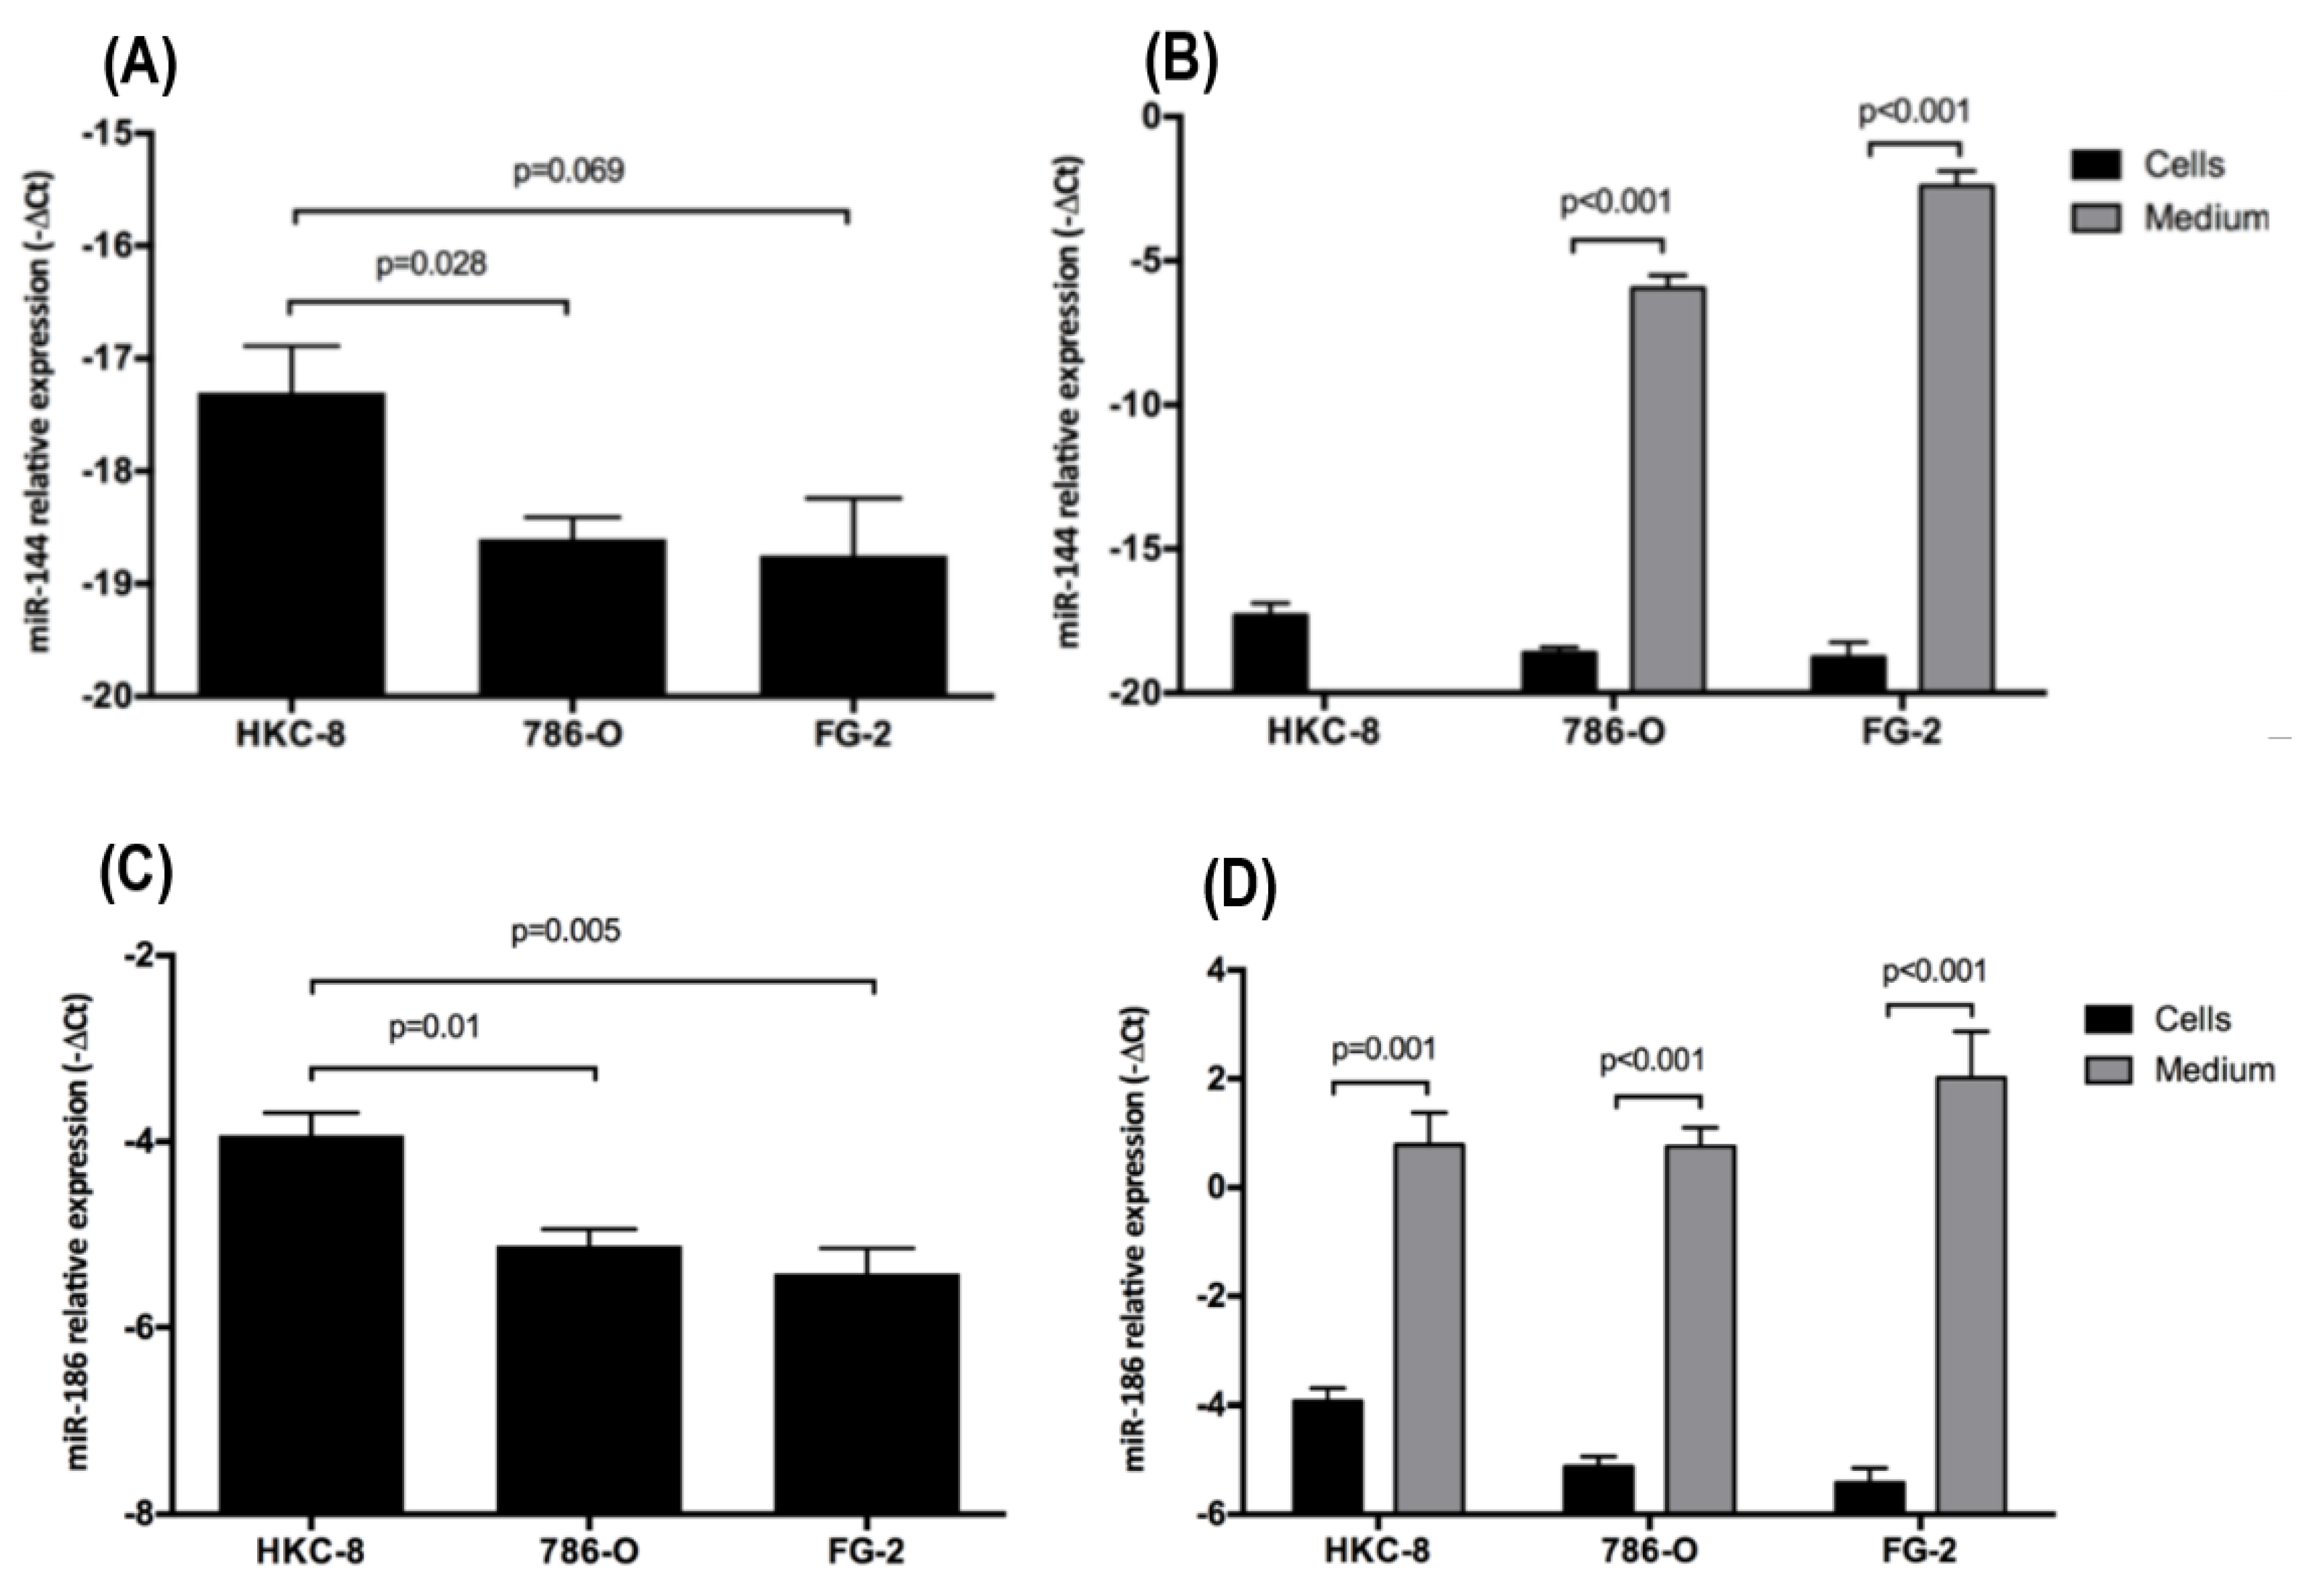
2.2. Intra- and Extracellular Levels of hsa-miR-144-5p and hsa-miR-186-3p Deregulation in ccRCC Cell Lines
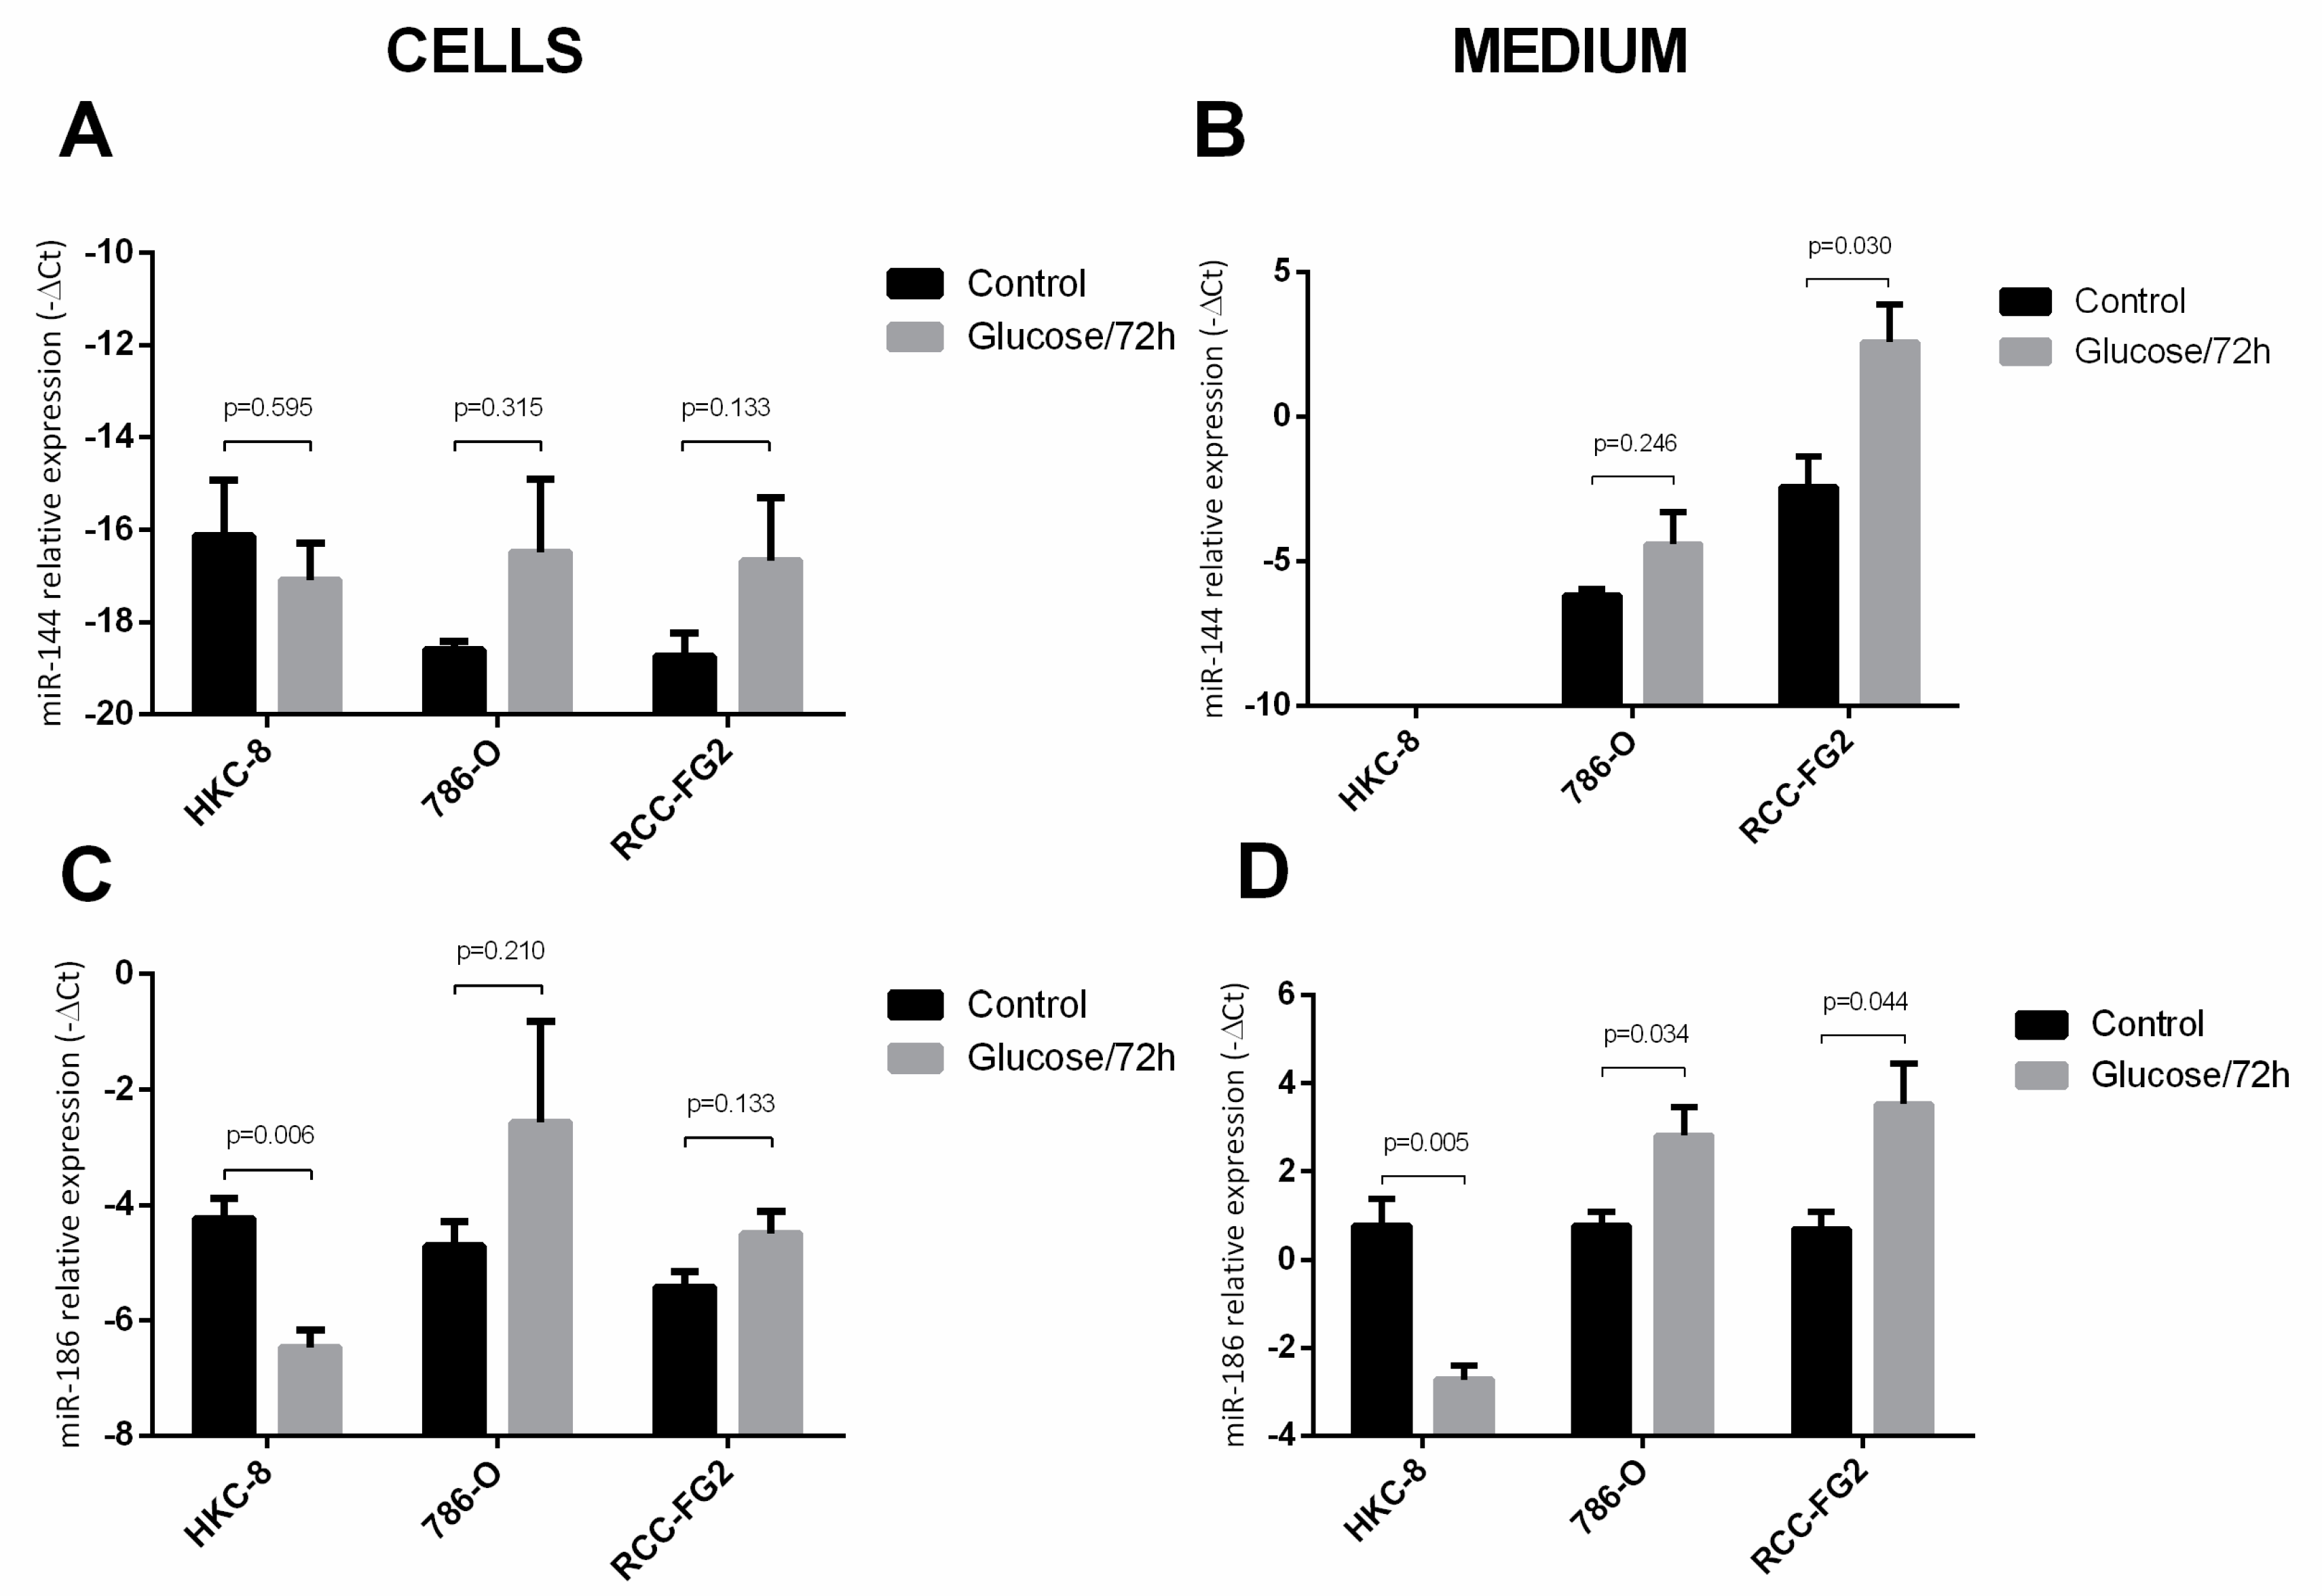
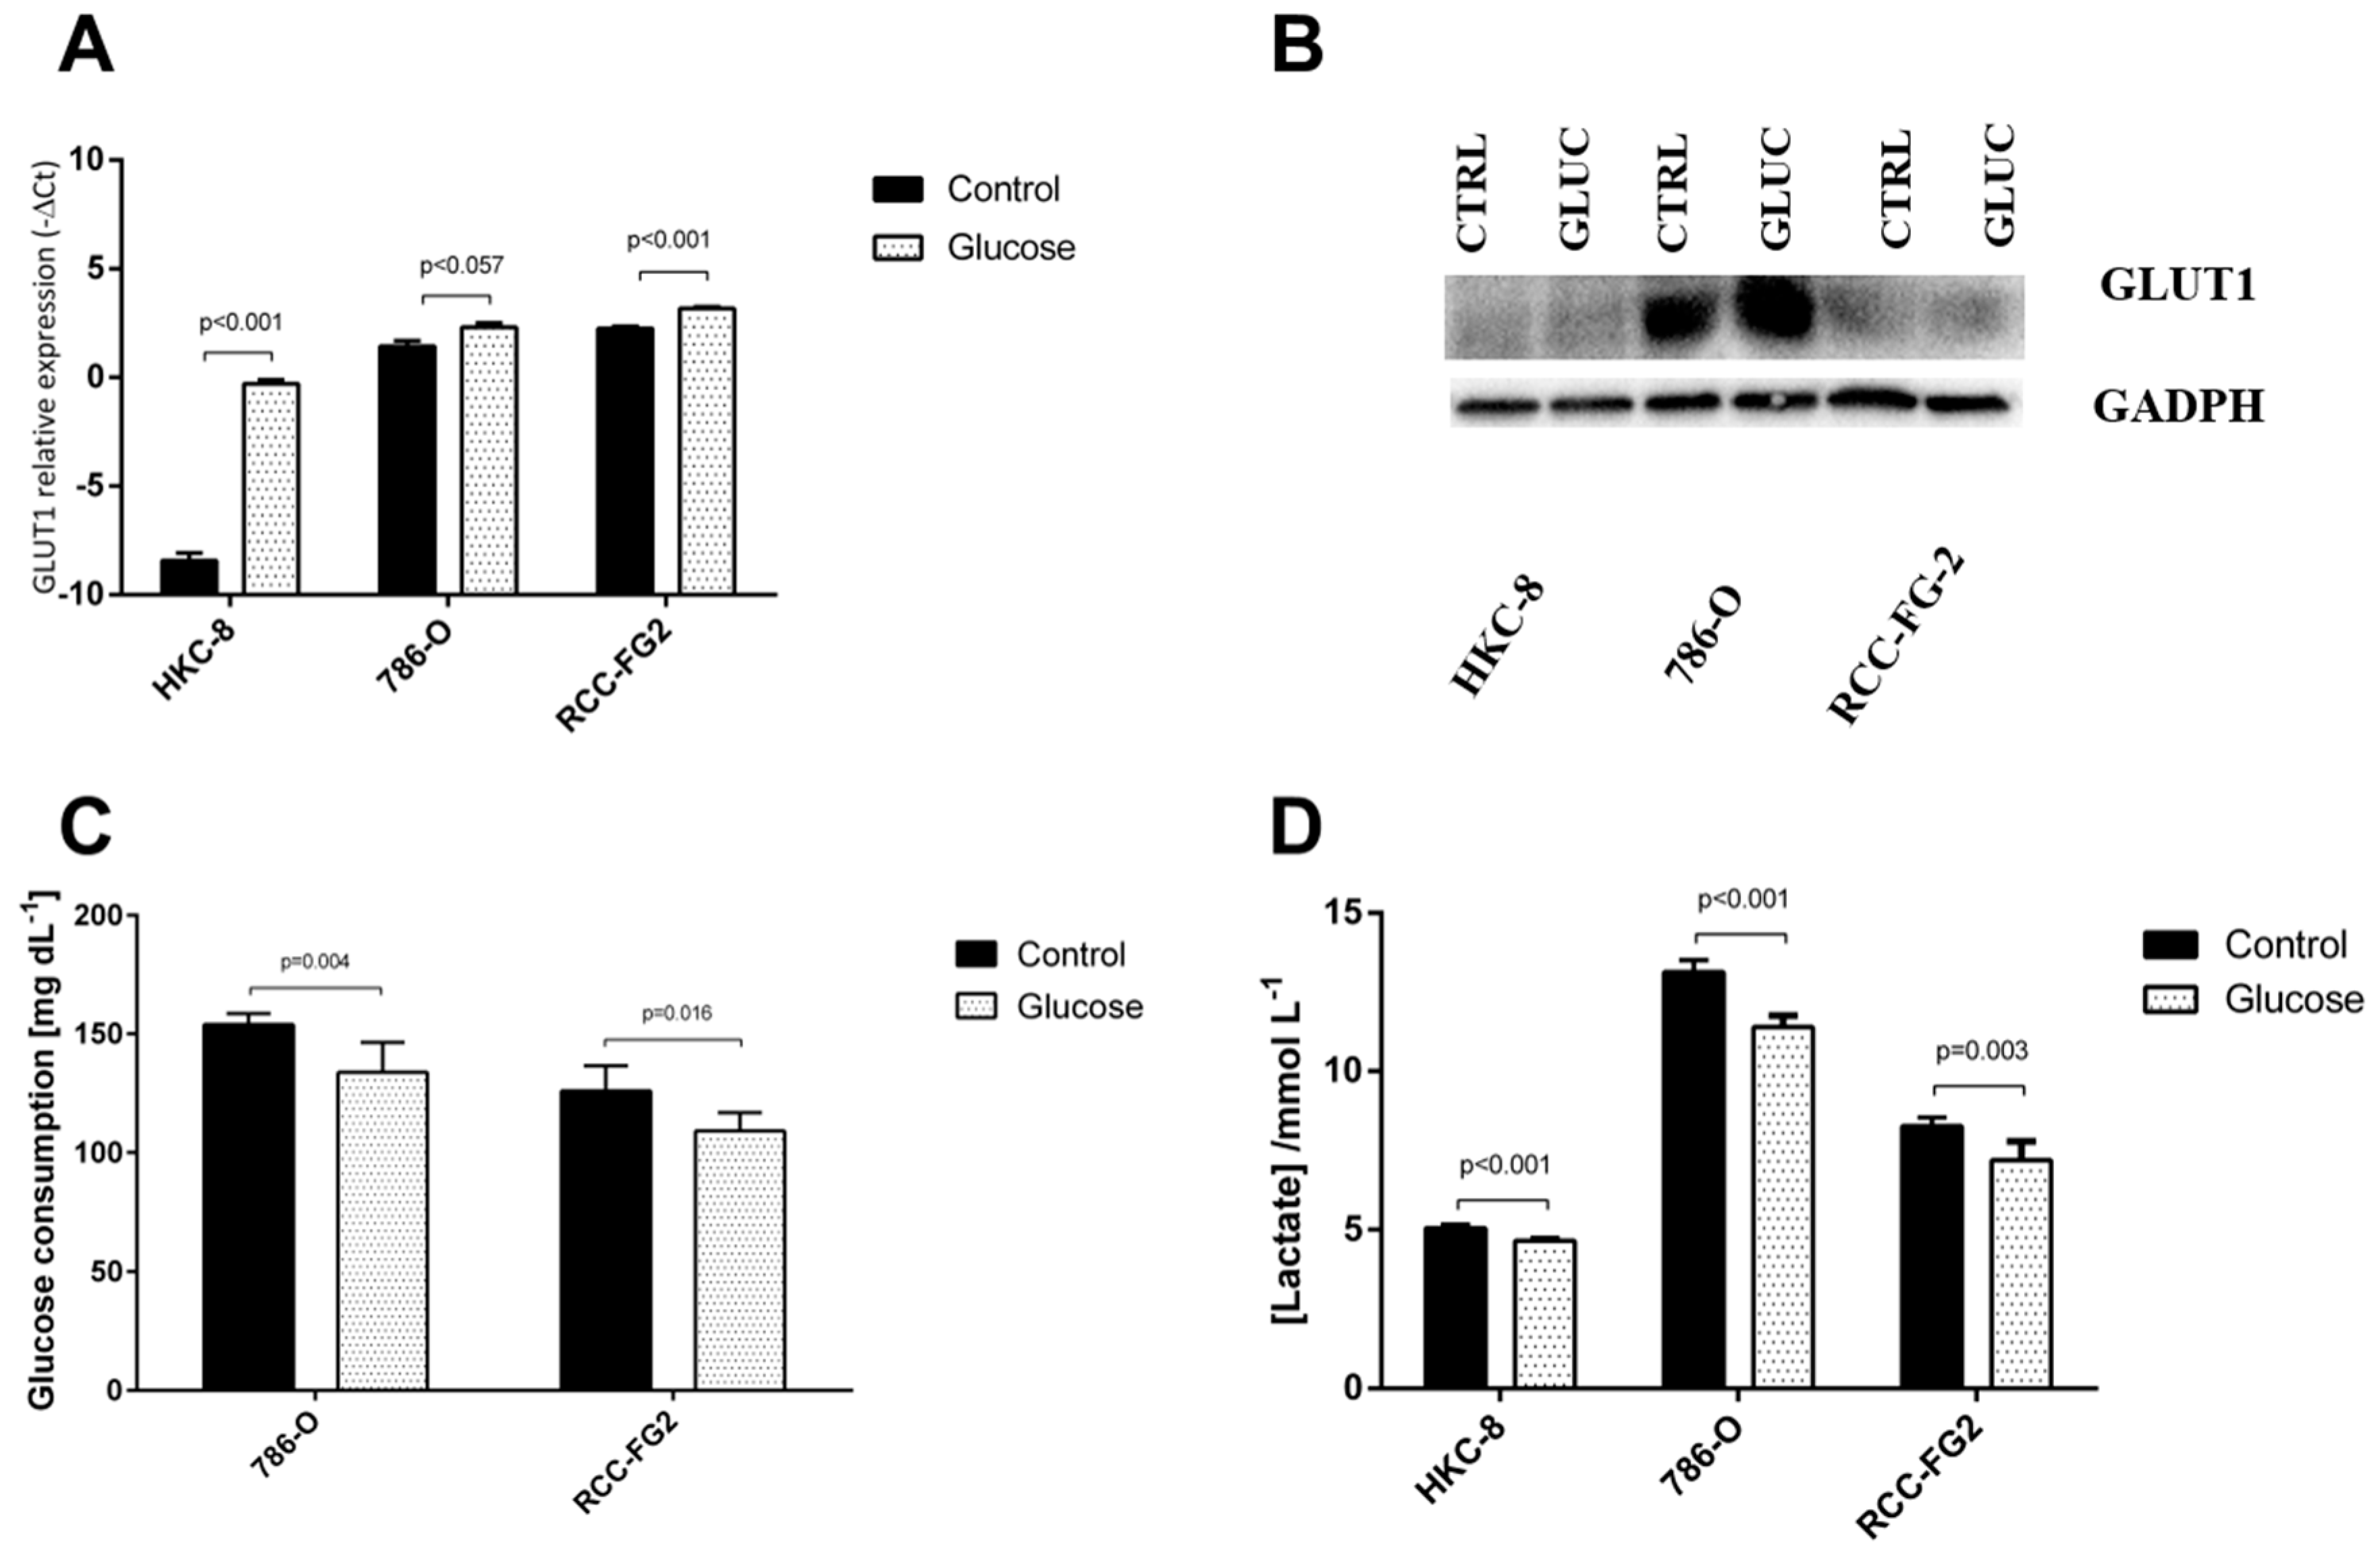
2.3. Glucose Interference in hsa-miR-144-5p, hsa-miR-186-3p, GLUT-1 mRNA and Protein Expression Patterns
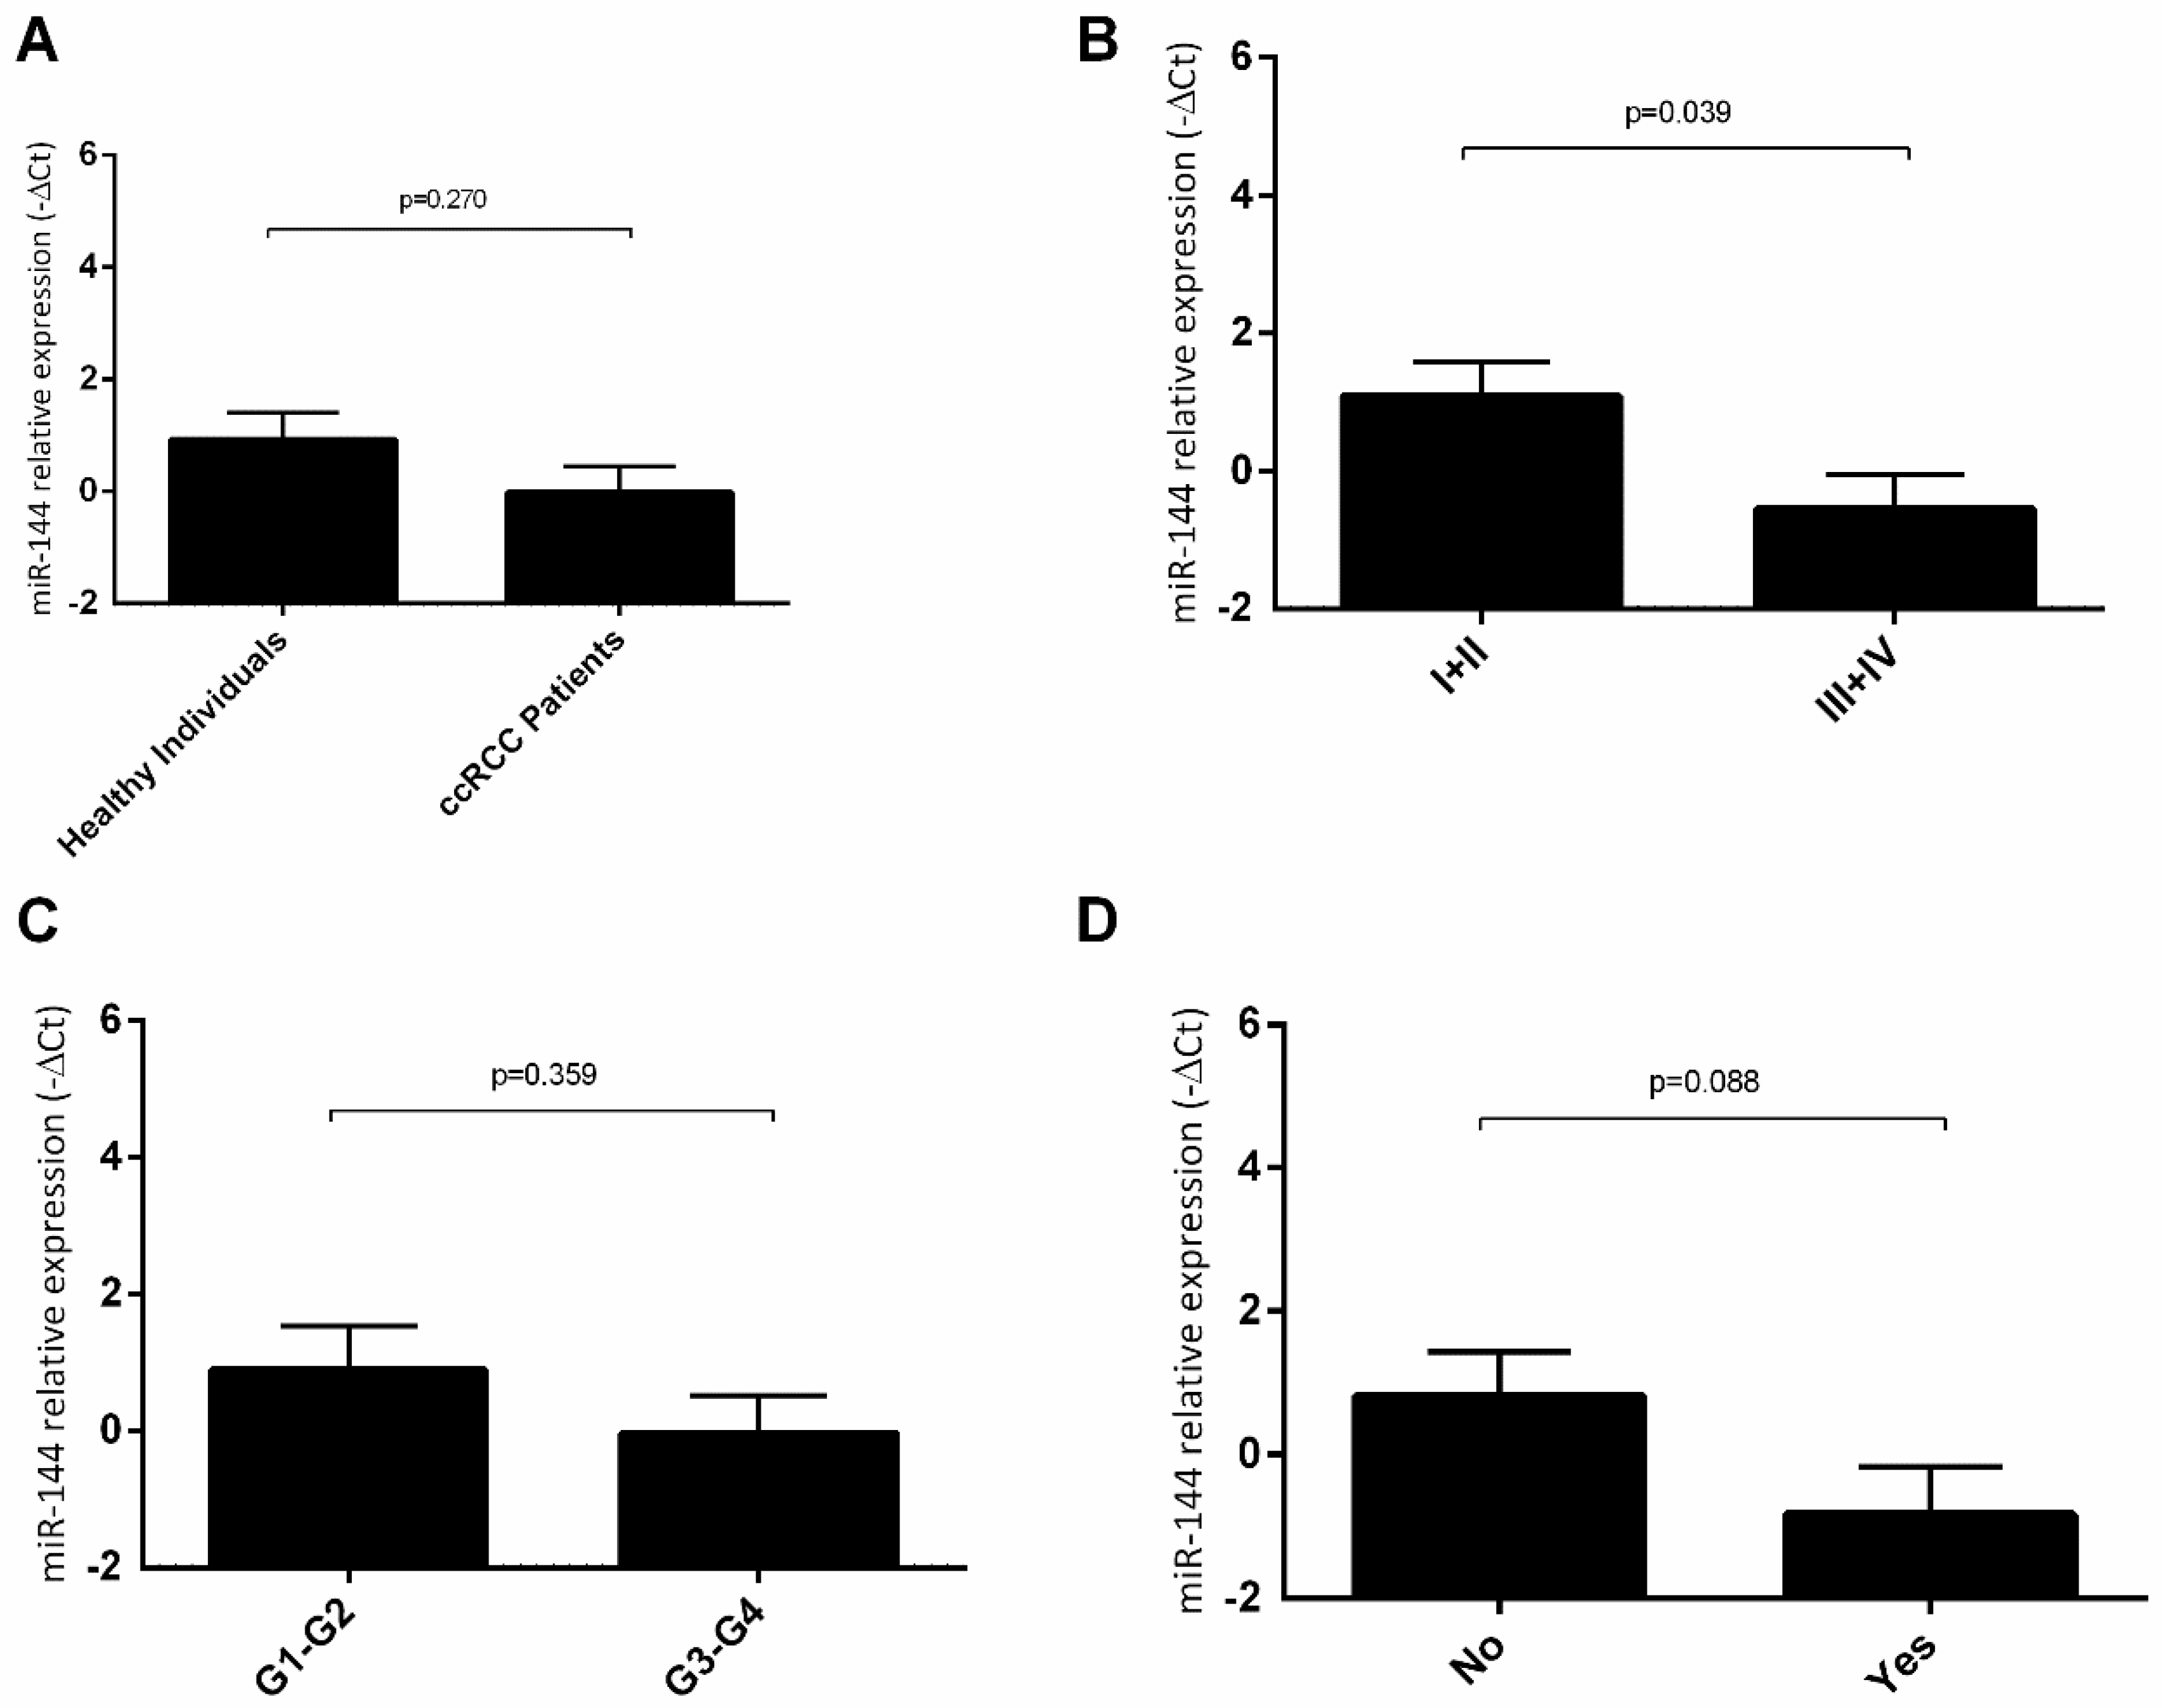
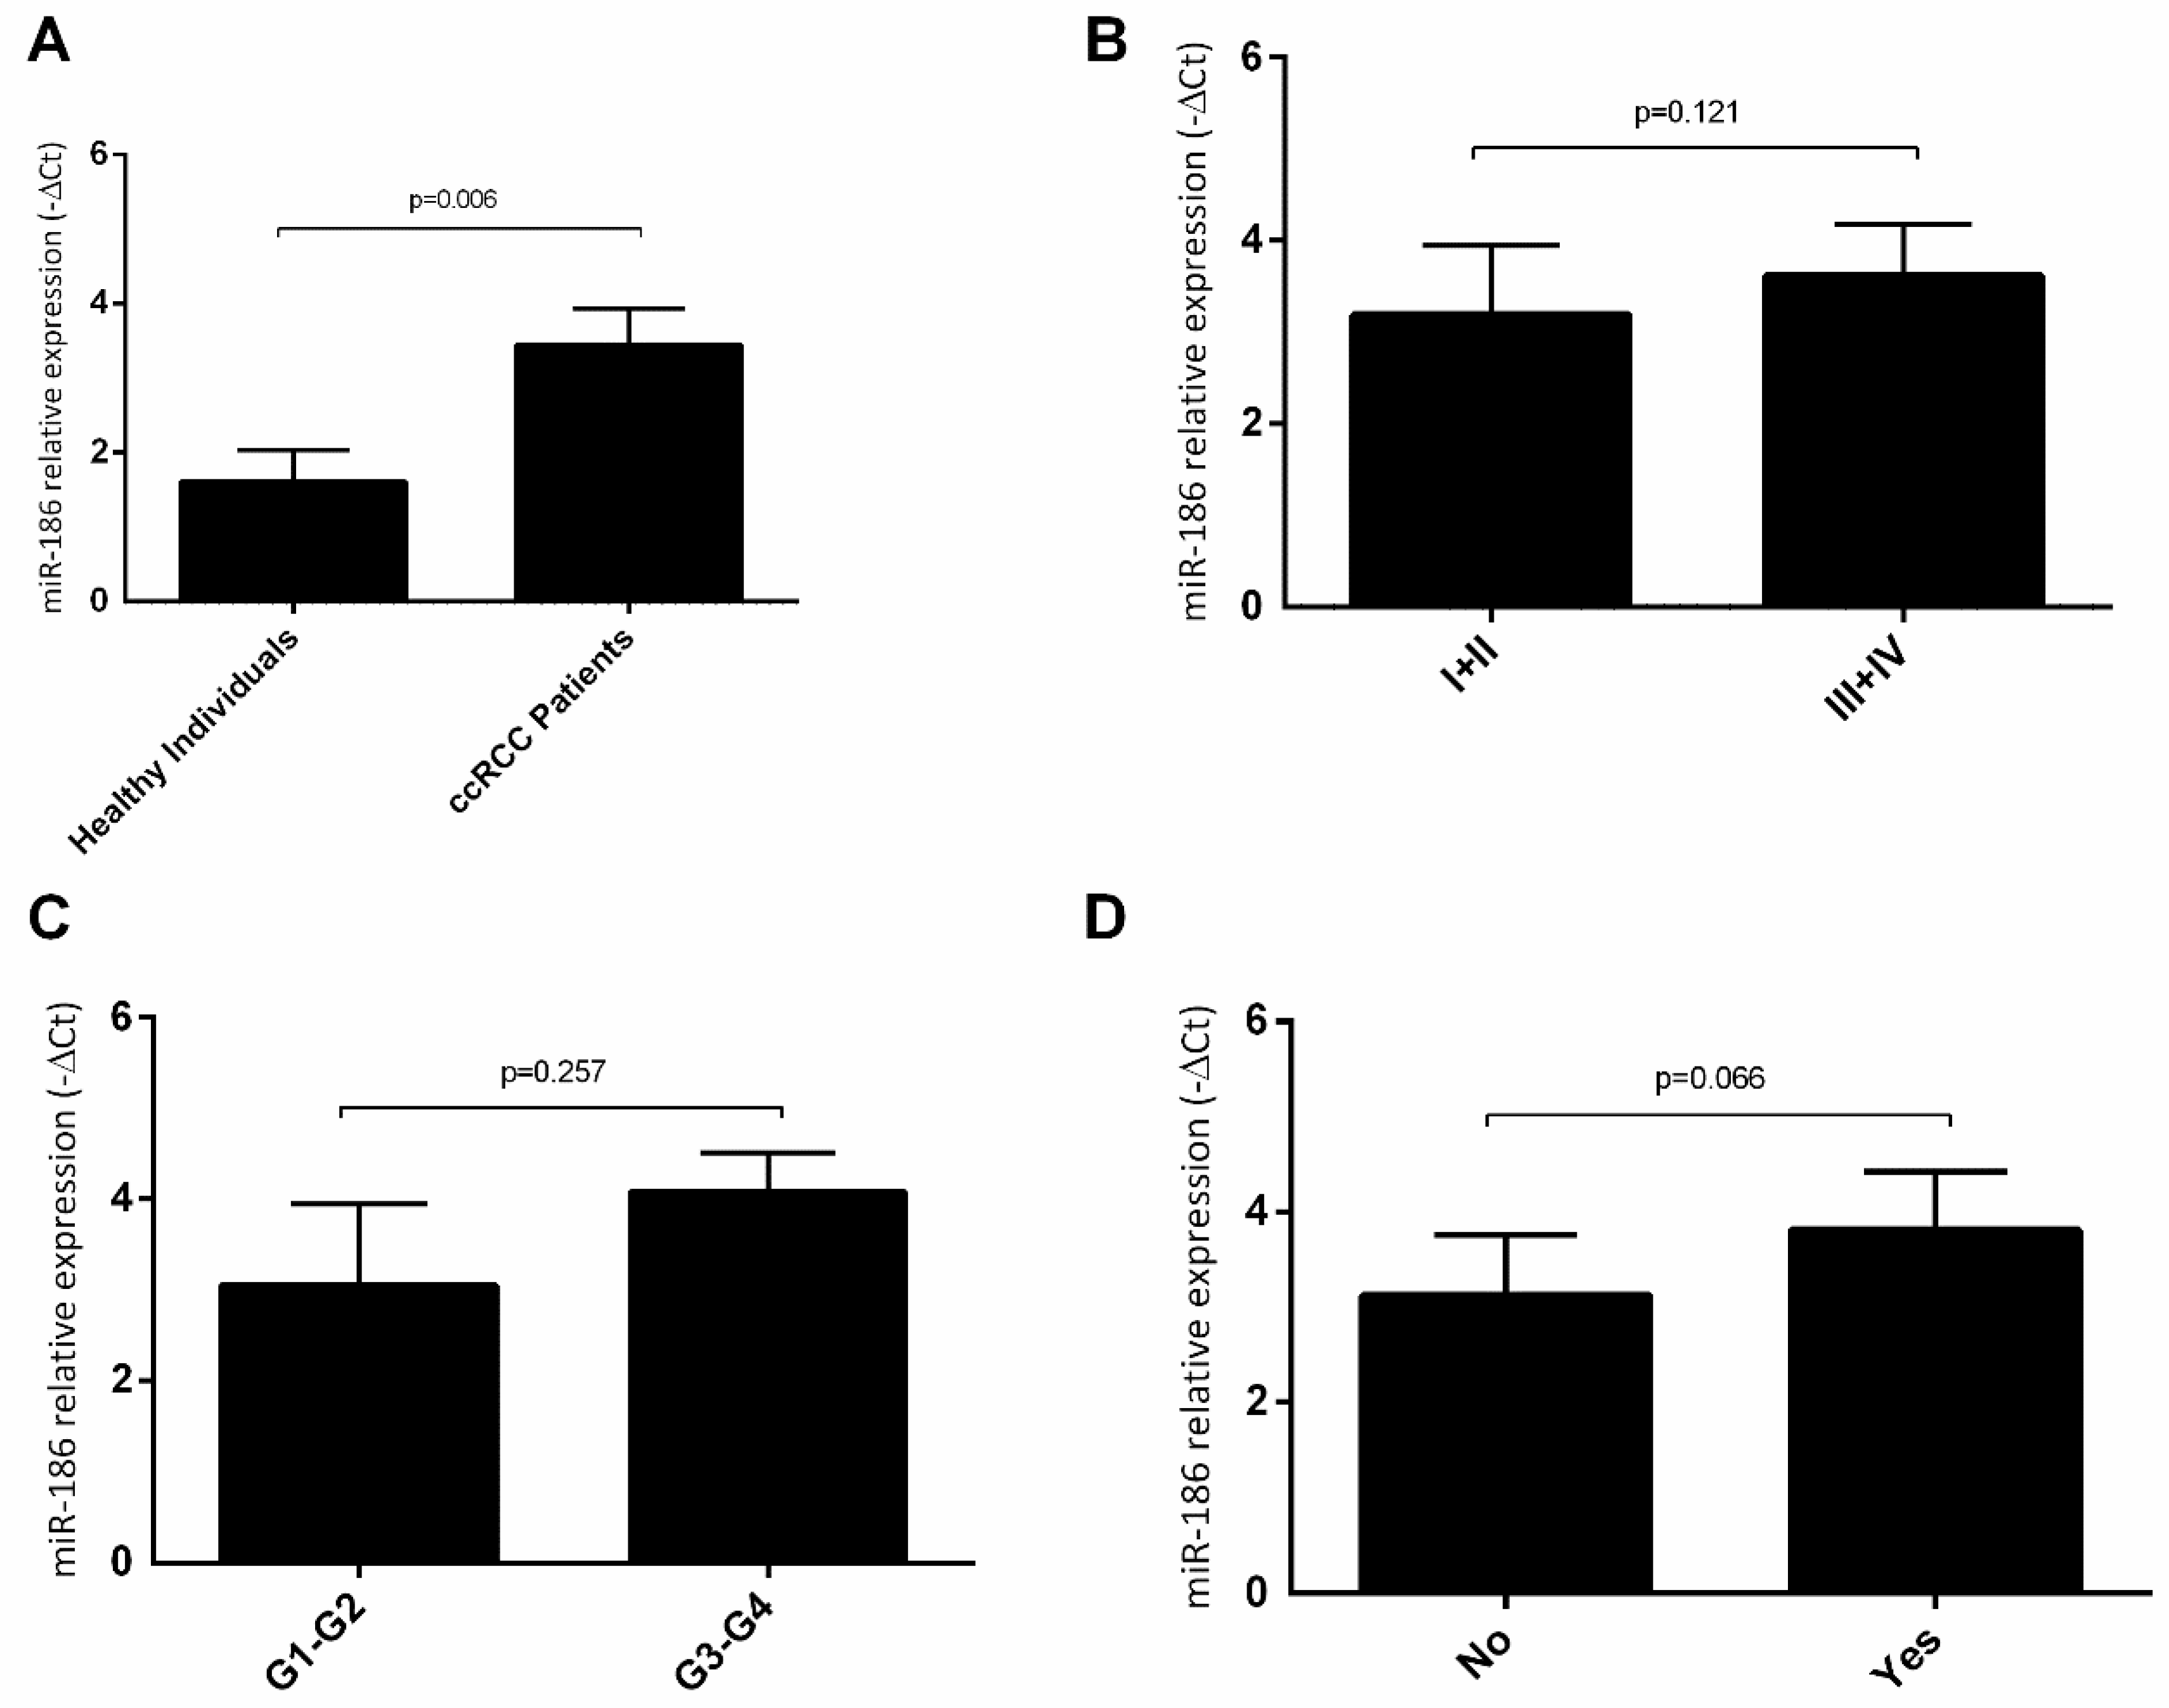
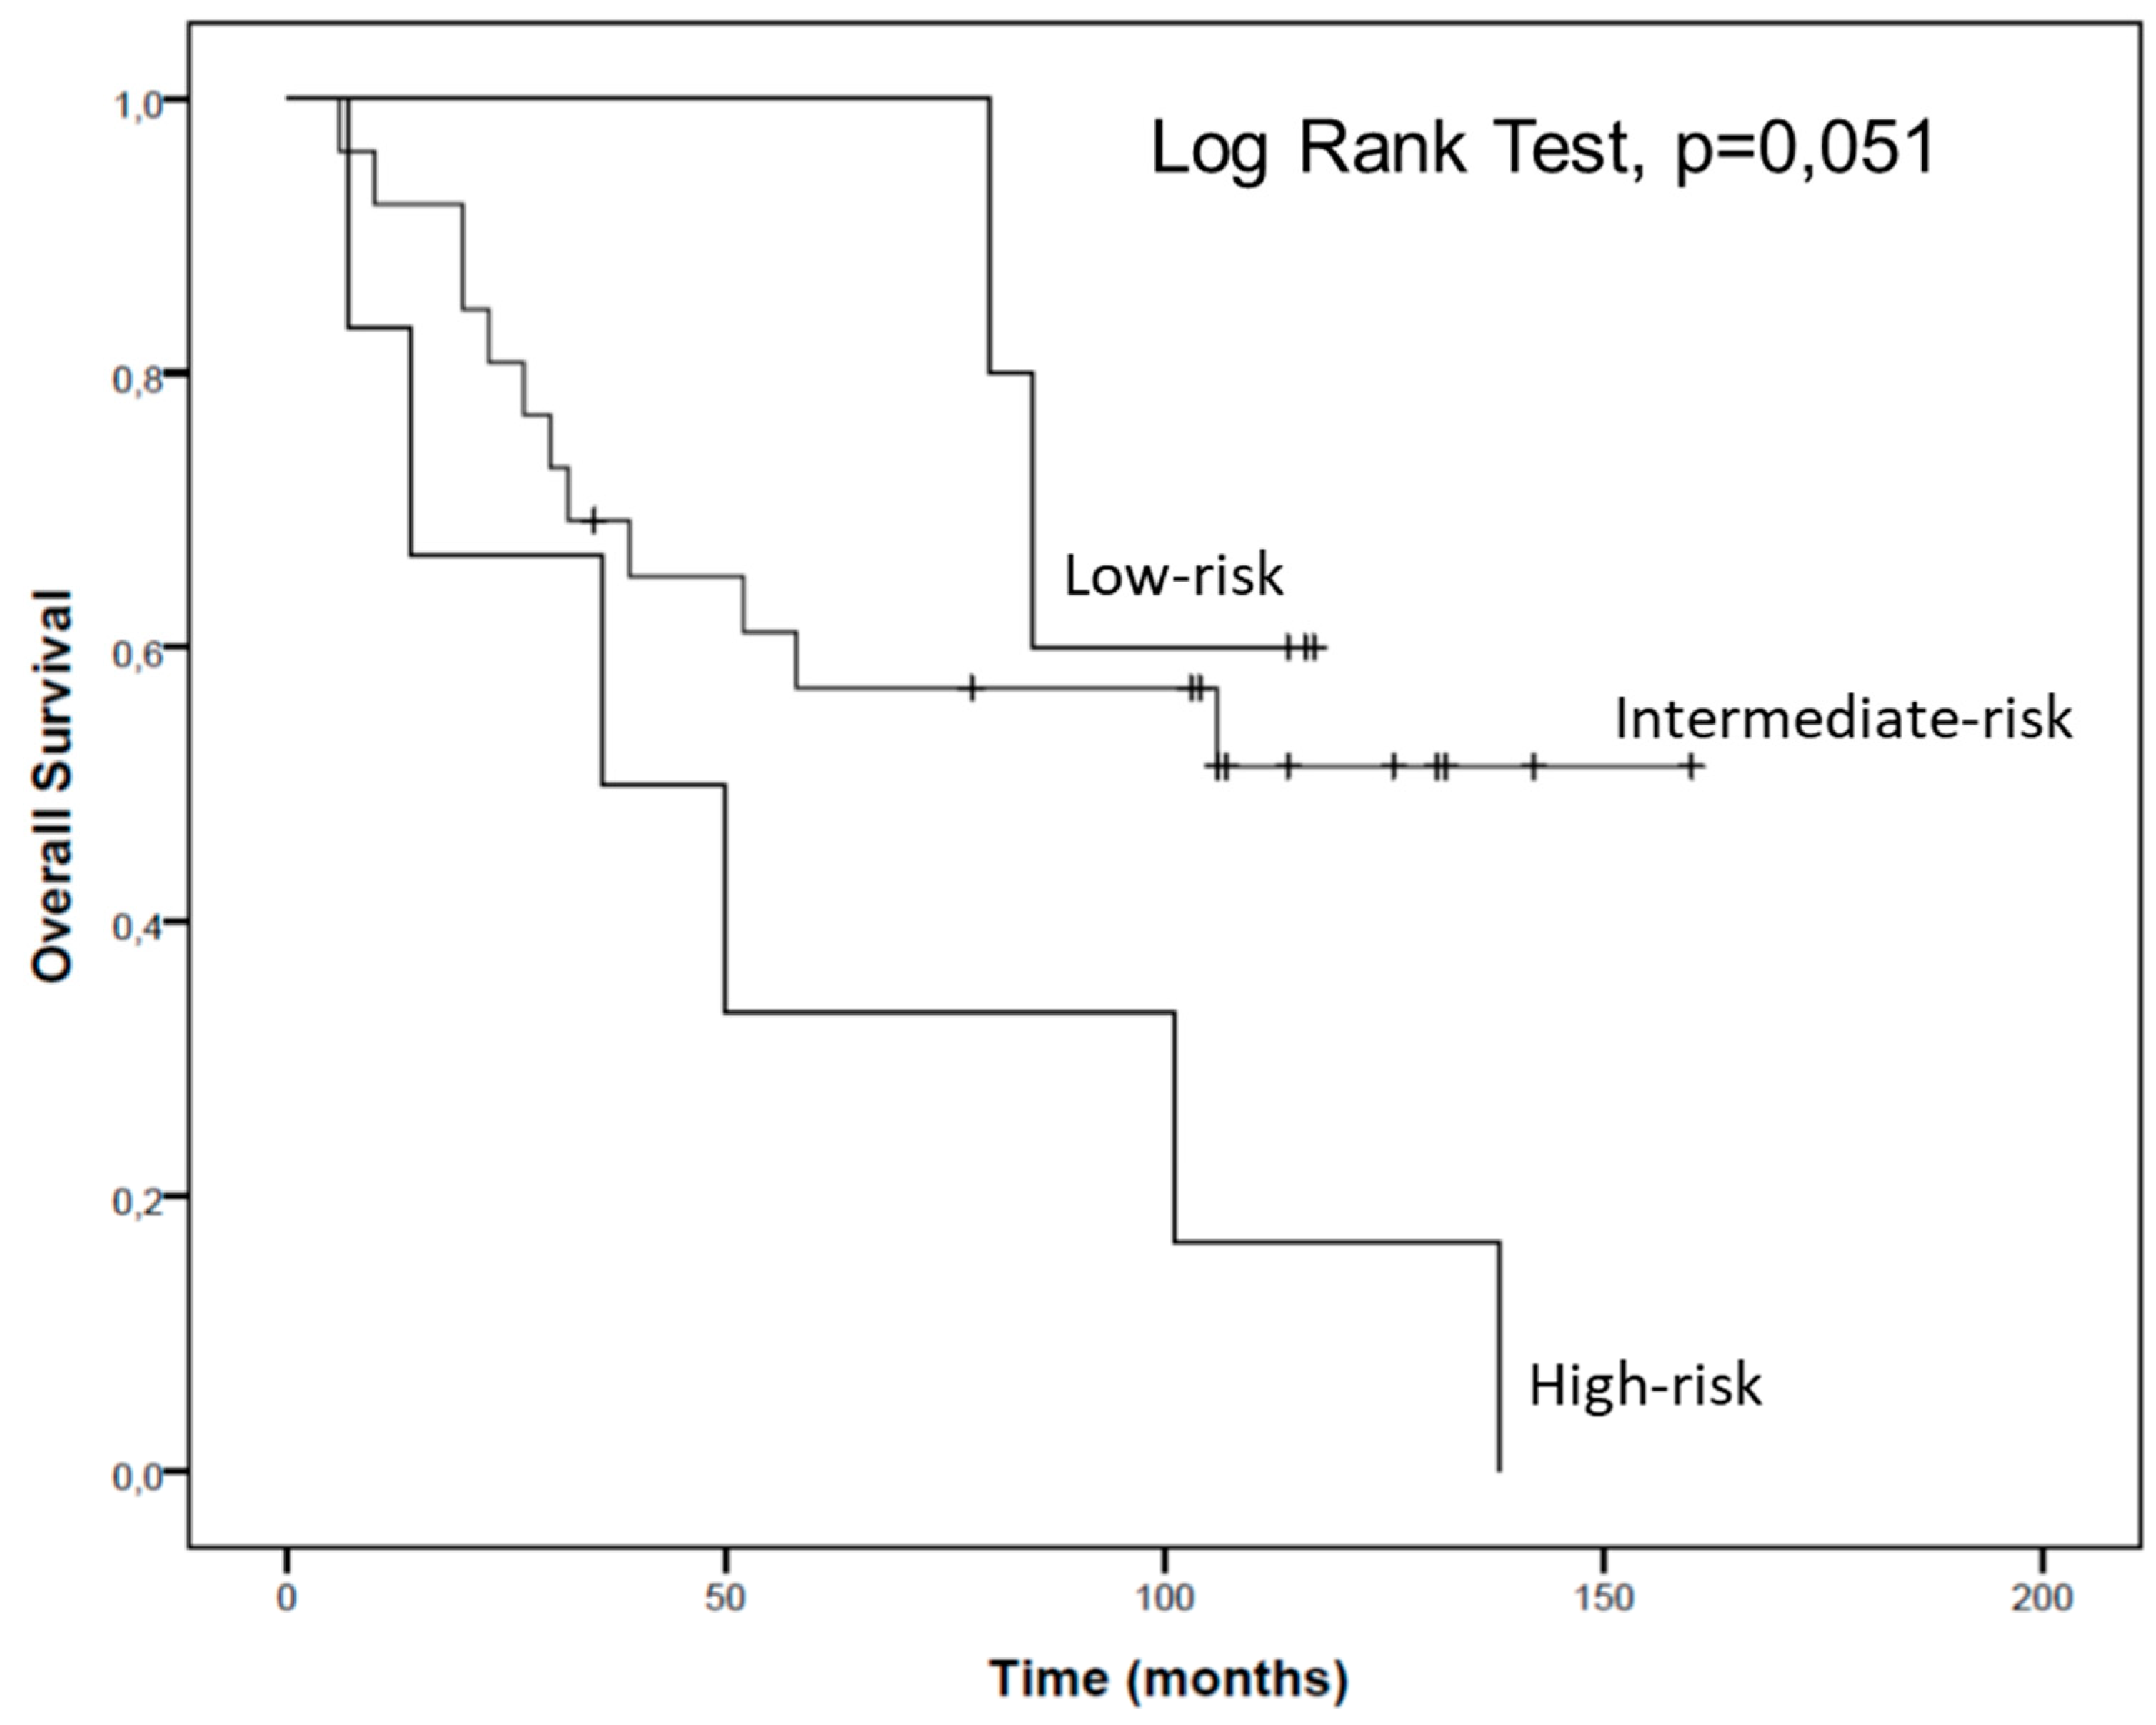
2.4. hsa-miR-144-5p and hsa-miR-186-3p Plasma Levels in RCC Patients and Their Association with Clinicopathological Characteristics
3. Discussion
4. Materials and Methods
4.1. Cell Lines and Cell Culture
4.2. Study Population and Sample Collection
4.3. MiRNA and mRNA Isolation
4.4. cDNA Synthesis
4.5. Relative Quantification by Real-Time PCR
4.6. Lactate Production and Glucose Consumption Measurement
4.7. Western Blotting
4.8. Statistical Analysis
5. Conclusions
Author Contributions
Funding
Institutional Review Board Statement
Informed Consent Statement
Data Availability Statement
Acknowledgments
Conflicts of Interest
References
- Escudier, B.; Porta, C.; Schmidinger, M.; Rioux-Leclercq, N.; Bex, A.; Khoo, V.; Grünwald, V.; Gillessen, S.; Horwich, A. Renal cell carcinoma: ESMO Clinical Practice Guidelines for diagnosis, treatment and follow-up. Ann. Oncol. 2019, 30, 706–720. [Google Scholar] [CrossRef] [Green Version]
- Moch, H.; Cubilla, A.L.; Humphrey, P.A.; Reuter, V.E.; Ulbright, T.M. The 2016 WHO Classification of Tumours of the Urinary System and Male Genital Organs—Part A: Renal, Penile, and Testicular Tumours. Eur. Urol. 2016, 70, 93–105. [Google Scholar] [CrossRef] [PubMed]
- Hsieh, J.J.; Purdue, M.P.; Signoretti, S.; Swanton, C.; Albiges, L.; Schmidinger, M.; Heng, D.Y.; Larkin, J.; Ficarra, V. Renal cell carcinoma. Nat. Rev. Dis. Prim. 2017, 3, 17009. [Google Scholar] [CrossRef]
- Mitchell, T.J.; Turajlic, S.; Rowan, A.; Nicol, D.; Farmery, J.H.; O’Brien, T.; Martincorena, I.; Tarpey, P.; Angelopoulos, N.; Yates, L.R.; et al. Timing the Landmark Events in the Evolution of Clear Cell Renal Cell Cancer: TRACERx Renal. Cell 2018, 173, 611.e17–623.e17. [Google Scholar] [CrossRef] [PubMed] [Green Version]
- Ljungberg, B.; Albiges, L.; Abu-Ghanem, Y.; Bensalah, K.; Dabestani, S.; Fernández-Pello, S.; Giles, R.H.; Hofmann, F.; Hora, M.; Kuczyk, M.A.; et al. European Association of Urology Guidelines on Renal Cell Carcinoma: The 2019 Update. Eur. Urol. 2019, 75, 799–810. [Google Scholar] [CrossRef] [PubMed]
- Filipów, S.; Łaczmański, Ł. Blood Circulating miRNAs as Cancer Biomarkers for Diagnosis and Surgical Treatment Response. Front. Genet. 2019, 10, 169. [Google Scholar] [CrossRef]
- Cho, W.C. MicroRNAs: Potential biomarkers for cancer diagnosis, prognosis and targets for therapy. Int. J. Biochem. Cell Biol. 2010, 42, 1273–1281. [Google Scholar] [CrossRef]
- Dias, F.; Teixeira, A.L.; Ferreira, M.; Adem, B.; Bastos, N.; Vieira, J.; Fernandes, M.; Sequeira, M.I.; Maurício, J.; Lobo, F.; et al. Plasmatic miR-210, miR-221 and miR-1233 profile: Potential liquid biopsies candidates for renal cell carcinoma. Oncotarget 2017, 8, 103315. [Google Scholar] [CrossRef]
- Teixeira, A.L.; Ferreira, M.; Silva, J.; Gomes, M.; Dias, F.; Santos, J.I.; Maurício, J.; Lobo, F.; Medeiros, R. Higher circulating expression levels of miR-221 associated with poor overall survival in renal cell carcinoma patients. Tumor Biol. 2014, 35, 4057–4066. [Google Scholar] [CrossRef]
- Teixeira, A.L.; Dias, F.; Ferreira, M.; Gomes, M.; Santos, J.I.; Lobo, F.; Mauricio, J.; Machado, J.C.; Medeiros, R. Combined Influence of EGF+61G > A and TGFB+869T > C Functional Polymorphisms in Renal Cell Carcinoma Progression and Overall Survival: The Link to Plasma Circulating MiR-7 and MiR-221/222 Expression. PLoS ONE 2014, 10, e0103258. [Google Scholar] [CrossRef]
- Nogueira, I.; Dias, F.; Morais, M.; Teixeira, A.L.; Medeiros, R. Everolimus resistance in clear cell renal cell carcinoma: miRNA-101 and HIF-2α as molecular triggers? Futur. Oncol. 2019, 15, 2361–2370. [Google Scholar] [CrossRef]
- Dias, F.; Teixeira, A.L.; Nogueira, I.; Morais, M.; Maia, J.; Bodo, C.; Ferreira, M.; Silva, A.; Vilhena, M.; Lobo, J.; et al. Extracellular Vesicles Enriched in hsa-miR-301a-3p and hsa-miR-1293 Dynamics in Clear Cell Renal Cell Carcinoma Patients: Potential Biomarkers of Metastatic Disease. Cancers 2020, 12, 1450. [Google Scholar] [CrossRef]
- Schödel, J.; Grampp, S.; Maher, E.R.; Moch, H.; Ratcliffe, P.J.; Russo, P.; Mole, D.R. Hypoxia, Hypoxia-inducible Transcription Factors, and Renal Cancer. Eur. Urol. 2016, 69, 646–657. [Google Scholar] [CrossRef] [Green Version]
- Li, Z.; Zhang, H. Reprogramming of glucose, fatty acid and amino acid metabolism for cancer progression. Cell. Mol. Life Sci. 2016, 73, 377–392. [Google Scholar] [CrossRef]
- Koppenol, W.H.; Bounds, P.L.; Dang, C.V. Otto Warburg’s contributions to current concepts of cancer metabolism. Nat. Rev. Cancer 2011, 11, 325–337. [Google Scholar] [CrossRef]
- Morais, M.; Dias, F.; Teixeira, A.L.; Medeiros, R. MicroRNAs and altered metabolism of clear cell renal cell carcinoma: Potential role as aerobic glycolysis biomarkers. Biochim. Biophys. Acta Gen. Subj. 2017, 1861, 2175–2185. [Google Scholar] [CrossRef]
- Hanahan, D.; Weinberg, R.A. Hallmarks of cancer: The next generation. Cell 2011, 144, 646–674. [Google Scholar] [CrossRef] [Green Version]
- Liu, M.; Gao, J.; Huang, Q.; Jin, Y.; Wei, Z. Downregulating microRNA-144 mediates a metabolic shift in lung cancer cells by regulating GLUT1 expression. Oncol. Lett. 2016, 11, 3772–3776. [Google Scholar] [CrossRef] [Green Version]
- Sun, P.; Hu, J.-W.; Xiong, W.-J.; Mi, J. miR-186 Regulates Glycolysis through Glut1 During the Formation of Cancer-associated Fibroblasts. Asian Pac. J. Cancer Prev. 2014, 15, 4245–4250. [Google Scholar] [CrossRef] [Green Version]
- Xiao, W.; Lou, N.; Ruan, H.; Bao, L.; Xiong, Z.; Yuan, C.; Tong, J.; Xu, G.; Zhou, Y.; Qu, Y.; et al. Mir-144-3p Promotes Cell Proliferation, Metastasis, Sunitinib Resistance in Clear Cell Renal Cell Carcinoma by Downregulating ARID1A. Cell. Physiol. Biochem. 2017, 43, 2420–2433. [Google Scholar] [CrossRef]
- Cai, J.; Wu, J.; Zhang, H.; Fang, L.; Huang, Y.; Yang, Y.; Zhu, X.; Li, R.; Li, M. miR-186 Downregulation Correlates with Poor Survival in Lung Adenocarcinoma, Where It Interferes with Cell-Cycle Regulation. Cancer Res. 2013, 73, 756–766. [Google Scholar] [CrossRef] [Green Version]
- Cairns, R.A. Drivers of the Warburg Phenotype. Cancer J. 2015, 21, 56–61. [Google Scholar] [CrossRef]
- Rathmell, W.K.; Rathmell, J.C.; Linehan, W.M. Metabolic Pathways in Kidney Cancer: Current Therapies and Future Directions. J. Clin. Oncol. 2018, 36, 3540–3546. [Google Scholar] [CrossRef]
- Weiss, R.H. Metabolomics and Metabolic Reprogramming in Kidney Cancer. Semin. Nephrol. 2018, 38, 175–182. [Google Scholar] [CrossRef]
- Liu, L.; Wang, Y.; Bai, R.; Yang, K.; Tian, Z. MiR-186 inhibited aerobic glycolysis in gastric cancer via HIF-1α regulation. Oncogenesis 2016, 5, e224. [Google Scholar] [CrossRef] [Green Version]
- Liu, F.; Chen, N.; Xiao, R.; Wang, W.; Pan, Z. miR-144-3p serves as a tumor suppressor for renal cell carcinoma and inhibits its invasion and metastasis by targeting MAP3K8. Biochem. Biophys. Res. Commun. 2016, 480, 87–93. [Google Scholar] [CrossRef]
- Xiang, C.; Cui, S.-P.; Ke, Y. MiR-144 inhibits cell proliferation of renal cell carcinoma by targeting MTOR. Acta Acad. Med. Wuhan 2016, 36, 186–192. [Google Scholar] [CrossRef] [PubMed]
- Jiao, D.; Wu, M.; Ji, L.; Liu, F.; Liu, Y. MicroRNA-186 Suppresses Cell Proliferation and Metastasis Through Targeting Sentrin-Specific Protease 1 in Renal Cell Carcinoma. Oncol. Res. Featur. Preclin. Clin. Cancer Ther. 2018, 26, 249–259. [Google Scholar] [CrossRef]
- Turchinovich, A.; Weiz, L.; Burwinkel, B. Extracellular miRNAs: The mystery of their origin and function. Trends Biochem. Sci. 2012, 37, 460–465. [Google Scholar] [CrossRef] [PubMed]
- Collares, C.V.A.; Evangelista, A.F.; Xavier, D.J.; Rassi, D.M.; Arns, T.; Foss-Freitas, M.C.; Foss, M.C.; Puthier, D.; Sakamoto-Hojo, E.T.; A Passos, G.; et al. Identifying common and specific microRNAs expressed in peripheral blood mononuclear cell of type 1, type 2, and gestational diabetes mellitus patients. BMC Res. Notes 2013, 6, 491. [Google Scholar] [CrossRef] [Green Version]
- Yang, S.; Zhao, J.; Chen, Y.; Lei, M. Biomarkers Associated with Ischemic Stroke in Diabetes Mellitus Patients. Cardiovasc. Toxicol. 2015, 16, 213–222. [Google Scholar] [CrossRef]
- Akbar, N.; Azzimato, V.; Choudhury, R.P.; Aouadi, M. Extracellular vesicles in metabolic disease. Diabetologia 2019, 62, 2179–2187. [Google Scholar] [CrossRef] [Green Version]
- Pardo, F.; Villalobos-Labra, R.; Sobrevia, B.; Toledo, F.; Sobrevia, L. Extracellular vesicles in obesity and diabetes mellitus. Mol. Asp. Med. 2018, 60, 81–91. [Google Scholar] [CrossRef] [PubMed]
- Yamada, Y.; Arai, T.; Kojima, S.; Sugawara, S.; Kato, M.; Okato, A.; Yamazaki, K.; Naya, Y.; Ichikawa, T.; Seki, N. Regulation of antitumor miR-144-5p targets oncogenes: Direct regulation of syndecan-3 and its clinical significance. Cancer Sci. 2018, 109, 2919–2936. [Google Scholar] [CrossRef] [PubMed] [Green Version]
- Huang, H.Y.; Lin, Y.C.D.; Li, J.; Huang, K.Y.; Shrestha, S.; Hong, H.C.; Tang, Y.; Chen, Y.G.; Jin, C.N.; Yu, Y.; et al. miRTarBase 2020: Updates to the experimentally validated microRNA–target interaction database. Nucleic Acids Res. 2019, 48, D148–D154. [Google Scholar] [CrossRef] [PubMed] [Green Version]
- Wang, Z.; Sha, H.-H.; Li, H.-J. Functions and mechanisms of miR-186 in human cancer. Biomed. Pharmacother. 2019, 119, 109428. [Google Scholar] [CrossRef]
- Brodaczewska, K.K.; Szczylik, C.; Fiedorowicz, M.; Porta, C.; Czarnecka, A.M. Choosing the right cell line for renal cell cancer research. Mol. Cancer 2016, 15, 1–15. [Google Scholar] [CrossRef] [PubMed] [Green Version]
- Jones, S.G.; Ito, T.; Phillips, A.O. Regulation of proximal tubular epithelial cell CD44-mediated binding and internalisation of hyaluronan. Int. J. Biochem. Cell Biol. 2003, 35, 1361–1377. [Google Scholar] [CrossRef]
- Livak, J.K.; Schmittgen, T.D. Analysis of relative gene expression data using real-time quantitative PCR and the 2(-Delta Delta C(T)) Method. Methods 2001, 25, 402–408. [Google Scholar] [CrossRef]


Publisher’s Note: MDPI stays neutral with regard to jurisdictional claims in published maps and institutional affiliations. |
© 2021 by the authors. Licensee MDPI, Basel, Switzerland. This article is an open access article distributed under the terms and conditions of the Creative Commons Attribution (CC BY) license (https://creativecommons.org/licenses/by/4.0/).
Share and Cite
Morais, M.; Dias, F.; Nogueira, I.; Leão, A.; Gonçalves, N.; Araújo, L.; Granja, S.; Baltazar, F.; Teixeira, A.L.; Medeiros, R. Cancer Cells’ Metabolism Dynamics in Renal Cell Carcinoma Patients’ Outcome: Influence of GLUT-1-Related hsa-miR-144 and hsa-miR-186. Cancers 2021, 13, 1733. https://doi.org/10.3390/cancers13071733
Morais M, Dias F, Nogueira I, Leão A, Gonçalves N, Araújo L, Granja S, Baltazar F, Teixeira AL, Medeiros R. Cancer Cells’ Metabolism Dynamics in Renal Cell Carcinoma Patients’ Outcome: Influence of GLUT-1-Related hsa-miR-144 and hsa-miR-186. Cancers. 2021; 13(7):1733. https://doi.org/10.3390/cancers13071733
Chicago/Turabian StyleMorais, Mariana, Francisca Dias, Inês Nogueira, Anabela Leão, Nuno Gonçalves, Luís Araújo, Sara Granja, Fátima Baltazar, Ana L Teixeira, and Rui Medeiros. 2021. "Cancer Cells’ Metabolism Dynamics in Renal Cell Carcinoma Patients’ Outcome: Influence of GLUT-1-Related hsa-miR-144 and hsa-miR-186" Cancers 13, no. 7: 1733. https://doi.org/10.3390/cancers13071733