

Manufacturing Carbon Fiber Using Alberta Oilsands Asphaltene with Microwave Plasma Assistance


Department of Mechanical and Manufacturing Engineering, University of Calgary, Calgary, AB T2N 1N4, Canada
*
Author to whom correspondence should be addressed.
C 2024, 10(1), 1; https://doi.org/10.3390/c10010001
Submission received: 18 November 2023
/
Revised: 14 December 2023
/
Accepted: 20 December 2023
/
Published: 22 December 2023
(This article belongs to the Special Issue High-Performance Carbon Materials and Their Composites)
Abstract
:The considerable expenses associated with carbon fiber (CF) production have imposed limitations on its widespread application across diverse industries, primarily due to the costs of precursor materials and energy−intensive post−treatment procedures. This research explores the potential utilization of Alberta oilsands asphaltenes (AOAs), a carbon−rich by−product derived from oilsands extraction, as a more cost−effective precursor for CF production. Polystyrene and poly(styrene–butadiene–styrene) were also used as polymer additives. In addition to conventional thermal post−treatment, microwave plasma was employed for the carbonization process. The CFs generated through this approach were subjected to a comprehensive analysis involving SEM, FTIR, TGA, XRD, and Raman spectroscopy. The best tensile strength and Young’s modulus of the AOA carbon fibers when using conventional thermal post−treatment were 600 MPa and 70 GPa, respectively. The microwave plasma process indicates the higher temperature and promise of eliminating heteroatoms of AOA carbon fibers. The temperature for microwave plasma modelling was set using COMSOLTM, with the modelling temperature and detection temperature being established at 1600 K and 1568 K, respectively.
1. Introduction
Carbon fibers (CFs) are highly regarded for their exceptional properties, such as their high specific strength, good corrosion resistance, and remarkable design flexibility. These qualities have made CFs valuable materials widely used in structural applications across industries like the aerospace, military, sports equipment, automotive, and energy sectors [1,2]. In fact, CFs play a vital role in an expanding manufacturing and research field due to the increasing demand from industry and the growing number of publications. Various precursor materials like polyacrylonitrile (PAN), pitch, and cellulose [3] have been utilized in CF production, with them accounting for over 50% of production costs [4]. Significantly, PAN predominates these precursors, constituting approximately 90% of the materials used in carbon fiber production [5].
In an effort to reduce the high costs associated with precursor materials, Alberta oilsands asphaltenes (AOAs) emerge as a cost−effective and environmentally sustainable alternative for CF production. AOAs, which constitute the densest fraction in Alberta oilsands bitumen, contain a carbon content of approximately 78–80% and are characterized by their high aromatic structure. Moreover, the abundant reserves in the Alberta region make it a promising candidate for large−scale CF manufacturing [6]. Recent studies have successfully used AOAs as precursors for CF manufacturing, primarily through melt−spinning techniques [7,8].
The inherent brittleness of asphaltene restricts its spinnability, a crucial aspect in CF manufacturing. The incorporation of polymer blocks results in the forming of a crosslinked network that enhances rigidity, potentially surpassing the stiffness of asphaltene in the ordered structure within the glassy region [9]. To improve the processability and viscosity of asphaltenes for CF production, the introduction of additives such as styrene−ethylene–butylene–styrene (SEBS) [10], polystyrene (PS) [9], and styrene–butadiene–styrene (SBS) [11] has been successful, leading to enhanced thermal and mechanical properties.
CF manufacturing typically involves a series of key processes, namely spinning, oxidation, carbonization, and graphitization [8]. Melt spinning arises as a cost−effective method with several advantages, including high−speed production, the absence of solvents, and reduced purification complexities [12,13]. Following the spinning process, spun fibers undergo a series of post−treatment procedures, encompassing stabilization, carbonization, and graphitization, as depicted in Figure 1. Within the stabilization phase, thermoplastic spun fibers undergo a transformation and, through oxidation, convert into thermoset stabilized fibers. This transformation occurs through heat treatment conducted within the temperature range of 200 to 400 °C under oxidant gas atmospheres [14], including cyclization, dehydrogenation, aromatization, oxidation, and cross−linking, collectively contributing to the formation of ladder structures within the fibers [15].
The carbonization process is then carried out under controlled conditions in an inert environment at temperatures ranging from 1000 to 1500 °C, which facilitates the elimination of volatile gases and non−carbon components [16,17], and the formation of a graphite−like structure through dehydrogenation and the coalescence of cyclized sections via cross−linking mechanisms [18]. Post−treatment processes are vital for producing high−performance CFs and normally associated with the highest energy consumption, time investments and Greenhouse Gas (GHG) emissions in the CF manufacturing process [19,20,21]. Graphitization follows the carbonization process, involving the elevation of temperatures to 1500–3000 °C under inert conditions. This step enhances the crystallite size and the graphitic quality of fibers but is costly and raises additional environmental concerns. Alternative post−treatment methods such as microwave−plasma treatment [22,23] and laser treatment [24,25] have been interesting due to their advantages, including their short processing time, which makes them promising approaches to shorten the manufacturing process and significantly reduce the cost of CFs. The utilization of microwave plasma technology has proven effective in synthesizing carbon nanostructures [26], treating PAN−based CFs [27], and the surface modification of CFs [28,29,30,31].
In this work, we initiated the study by subjecting AOAs to preliminary treatment, which was subsequently followed by the fabrication of AOA−based CFs using a twin−screw extruder. In order to improve the melt processibility of the AOAs, we introduced a blending process that combined polymers with asphaltenes, and we carried out a thorough evaluation of the results. We also employed conventional post−treatment techniques to produce CFs. The carbonization step in the post−treatment phase was executed using microwave plasma technology as well. By incorporating electromagnetic approaches during the post−treatment stage of CF production, we envisage the potential for significant reductions in total preparation time, energy consumption, greenhouse gas emissions, and overall production costs associated with CF manufacturing. Furthermore, the microwave plasma method displayed promising capabilities in terms of eliminating heteroatoms from the final AOA carbon fiber products.
2. Experimental Section
2.1. Materials
The AOA S−1 sample was obtained from Alberta Innovates, Edmonton, AB, Canada, while polystyrene (PS), styrene–ethylene–butylene–styrene (SEBS), and poly(styrene–butadiene–styrene) (SBS) were procured from Sigma−Aldrich, Oakville, ON, Canada. Additionally, pentane, toluene, and grade 4 filter papers were purchased from VWR International, Mississauga, ON, Canada, without further treatment.
2.2. Measurement
Scanning electron microscopy (SEM) imaging was carried out through the utilization of a Phenom XPro Benchtop Scanning Electron Microscope operating at 15 kV (Thermo Fisher Scientific, Hillsboro, OR, USA). The Fourier transformation infrared (FT−IR) spectra were scrutinized using a Thermo−Nicolet Nexus 470 spectrometer (Thermo Fisher Scientific, Hillsboro, OR, USA). The scanning range covered 500 cm−1 to 4000 cm−1, with an average of 64 scans conducted. X−ray diffraction (XRD) patterns were acquired through a Bruker D8AA25 X−ray diffractometer (Bruker LTD., Milton, ON, Canada), employing a scanning speed of approximately 1.2°/min, while the instrument operated at a voltage of 40 kV and a current of 25 mA. Tensile testing was conducted on individual fibers using a MARK−10 ESM test stand, equipped with an M5−05 digital force gauge (Mark−10 Corporation, Copiague, NY, USA). Fiber diameter measurements were performed using KLA Zeta−20 profilometer equipment (KLA, Milpitas, CA, USA). The analysis of CHNS composition was executed through the utilization of an Elementar Unicube Elemental Analyser instrument (Elementar Americas Inc., New York, NY, USA). Raman spectra were recorded with the assistance of a Teledyne Princeton Instruments IsoPlane 81 Raman Spectrometer (Teledyne Princeton Instruments, Trenton, NJ, USA) through the utilization of a PSU−H−LED 532 nm laser source. ID/IG was calculated based on the intensities of the G and D peaks of the carbon. NMR MADLI characterization was accomplished through use of a Bruker Autoflex III Smartbeam MALDI−TOF instrument (Na:YAG laser, 355 nm, Bruker LTD., Milton, ON, Canada) operating in positive reflective mode for spectrum acquisition. Rheology tests were carried out by employing a stress−controlled rheometer, specifically the Anton Paar 702 model (Anton Paar Inc., Montreal, QC, Canada), which was equipped with a convection temperature device (CTD) to precisely regulate the sample’s temperature. A parallel plate geometry with a 25 mm diameter was used as the measuring system.
2.3. Fabrication of AOA−Based CFs
The manufacturing process for AOA−based CFs involves a series of steps, which will be detailed in this section. To extract asphaltene from Alberta oilsands bitumen, standard separation methods outlined in ASTM D6560−17 were followed. The AOA is extracted using a pre−treatment process wherein 50 g of feedstock is placed in a Soxhlet extraction setup and treated with pentane (C5) at 80 °C (hot plate temperature). The treatment with pentane can be considered complete when the color of the pentane in the siphon tube transitions to a light−yellow hue. The resulting powder is then dissolved in toluene (1 g to 10 mL) and stirred at 90 °C for an hour. After centrifugation at 5000 rpm for 15 min, grade 4 filter paper is used to remove any residual coke from the filtered supernatant. The solvent (toluene) is then evaporated through a rotary evaporator at 50 °C and a pressure of 50 torr. The recycled toluene can be reused for further asphaltene pre−treatment. Finally, the pretreated asphaltene product is obtained by baking it overnight in a vacuum oven at 110 °C.
The pretreated asphaltene samples were introduced into a twin−screw extrusion system equipped with a melt pump, spinneret, and godet. The feeding system, twin screw, melt pump, and godet operated at 5, 15, 25, and 200 rpm, respectively. The temperature settings for the three heating zones in the twin−screw extruder were maintained at 170 °C, 210 °C, and 240 °C. The melt pump and spinneret temperatures also remained constant at 240 °C. Fibers formed from pure asphaltene material, with diameters less than 30 µm, were obtained using a spinneret with a hole diameter of 0.5 mm. These fibers were stretched and collected on the godet system. To improve the spinnability and stretchability of these fibers, various polymers were selected based on their decomposition temperature being greater than 350 °C as well as possessing some degree of aromaticity. Polymers such as PS and SBS were blended with asphaltene. These blends along with fibers were generated using the same twin−screw extrusion setup. The spun fibers and blended melts were stored in a vacuum chamber for further processing and analysis.
In a standard post−treatment process, the fibers were heated in an air environment using a tube furnace (Carbolite TZF 12/65/550). The temperatures ranged from 220–280 °C with a heating rate of 1 °C/min and dwell times ranging from 6–8 h. To maintain stability and prevent shrinkage or deformation, the fibers were secured to a ceramic plate on both ends, creating tension. During carbonization, these stabilized fibers underwent initial heating to 600 °C for 30 min followed by gradual heat treatment up to 1150 °C for another 30 min at a rate of 5 °C/min. The resulting fibers were obtained as a reference for comparison and labeled as ACF−C.
The proposed microwave plasma approach employed a custom−designed quartz tube setup within a conventional microwave oven (2.45 GHz—Panasonic). The conventionally stabilized fibers were placed in a quartz crucible, which was then positioned inside the quartz tube in the microwave oven. Argon was introduced into the system at a flow rate of 300 mL/min. The microwave was operated at a maximum power setting of 1000 W for time durations ranging from 5 to 9 min, which generated plasma within the quartz tube setup. A fiber optic pyrometer (Optris 2MH1CFV) was installed at the top of the microwave oven setup, precisely pointed towards the fibers in order to accurately monitor and record temperature variations. These treated fibers were collected and named as MPT−5, 7, and 9 based on their treatment durations.
To assess the mechanical properties of the fibers, a Mark−10 ESM 303 Motorized Force Tester equipped with an M5−05 force gauge was used according to ASTM D3822/D3822M−14 guidelines. The fiber diameter was determined using a Zeta 20 Optical Profiling Microscope. For single fiber measurements, a paper framework was utilized where the fiber was attached from top to bottom [32]. The length of the fiber within the framework is standardized at 20 mm. The stretching speed for testing was set at 2 mm/min, equivalent to 10% of the fiber’s length.
2.4. Modelling of Microwave Plasma
A schematic of the microwave plasma setup used in this study is shown in Figure 2, utilizing 2.45 GHz electromagnetic waves produced by a magnetron within a conventional microwave oven (Figure 2a). The quartz tube, measuring 200 mm in length, is strategically positioned to maximize exposure to the microwaves. To minimize gas ingress and facilitate penetration through the oven walls, smaller diameters are present at both ends of the tube. The chamber is designed for argon gas to enter from the left side and exit from the top. The pressure inside the quartz tube is maintained at 1 bar, while the initial gas temperature is set at 293.15 K. A simplified two−dimensional version of this geometry was created in COMSOL™ Multiphysics for further analysis, as shown in Figure 2b.
The integration of plasma physics and electromagnetic waves was utilized to predict plasma generation and motion within a defined quartz tube. The simulation in this study employed fluid approximation for efficient solution of the partial differential equation, modelling complex plasma chemistry and electron dynamics in electromagnetic fields. The governing equations used for electromagnetic wave propagation, plasma physics, fluid dynamics, and heat transfer are presented in Table 1.
In the electromagnetic wave equations, E denotes the electric field strength vector, i is the imaginary unit, ω represents the angular wave frequency, εo is the permittivity of the vacuum, εr denotes the relative electric permittivity of the vacuum, σ represents the electronic conductivity, k is the wavenumber in a vacuum given by k = ω/c, where c = εo/µo, and μo represents the permeability of the vacuum. The symbols ne, me, and e represent the electron density, electron mass, and fundamental charge, respectively. The plasma frequency is denoted as ωp.
In the plasma governing equations, Γε, nε, με, u, Dε, and Rε respectively represent the electron flux, electron energy density, electron energy mobility, vector velocity of the fluid, energy diffusivity, and energy gain or loss due to inelastic collisions.
In the fluid equation, pressure, mass density, dynamic viscosity, temperature, and unit tensor are represented as p, ρ, μ, T, and I respectively. The Lorentz force, which describes the combined effect of electric and magnetic forces on charged particles moving through the electromagnetic field, is denoted by F [32].
In the heat transfer equation, Cp, σk, Qel, and Qw represent the specific heat capacity, the thermal conductivity, the gain of energy balance due to elastic collisions between heavy particles and electrons, and the heat release because of non−elastic collisions, respectively.
3. Results and Discussion
3.1. Characterization of AOA and Modification of AOA by Polymers
The AOA S−1 feedstock was pretreated and characterized using FT−IR, Raman spectrometry, TGA, and element analysis. The pre−treatment process involved removing volatile light hydrogen carbon and coke from the AOA feedstock. Pentane (C5) was utilized for pretreating the asphaltene in order to remove light hydrogen carbon present in AOA, which may cause defects in the final products, and toluene was used for removing the coke (toluene insoluble fraction), which may block the nozzle during the spinning process.
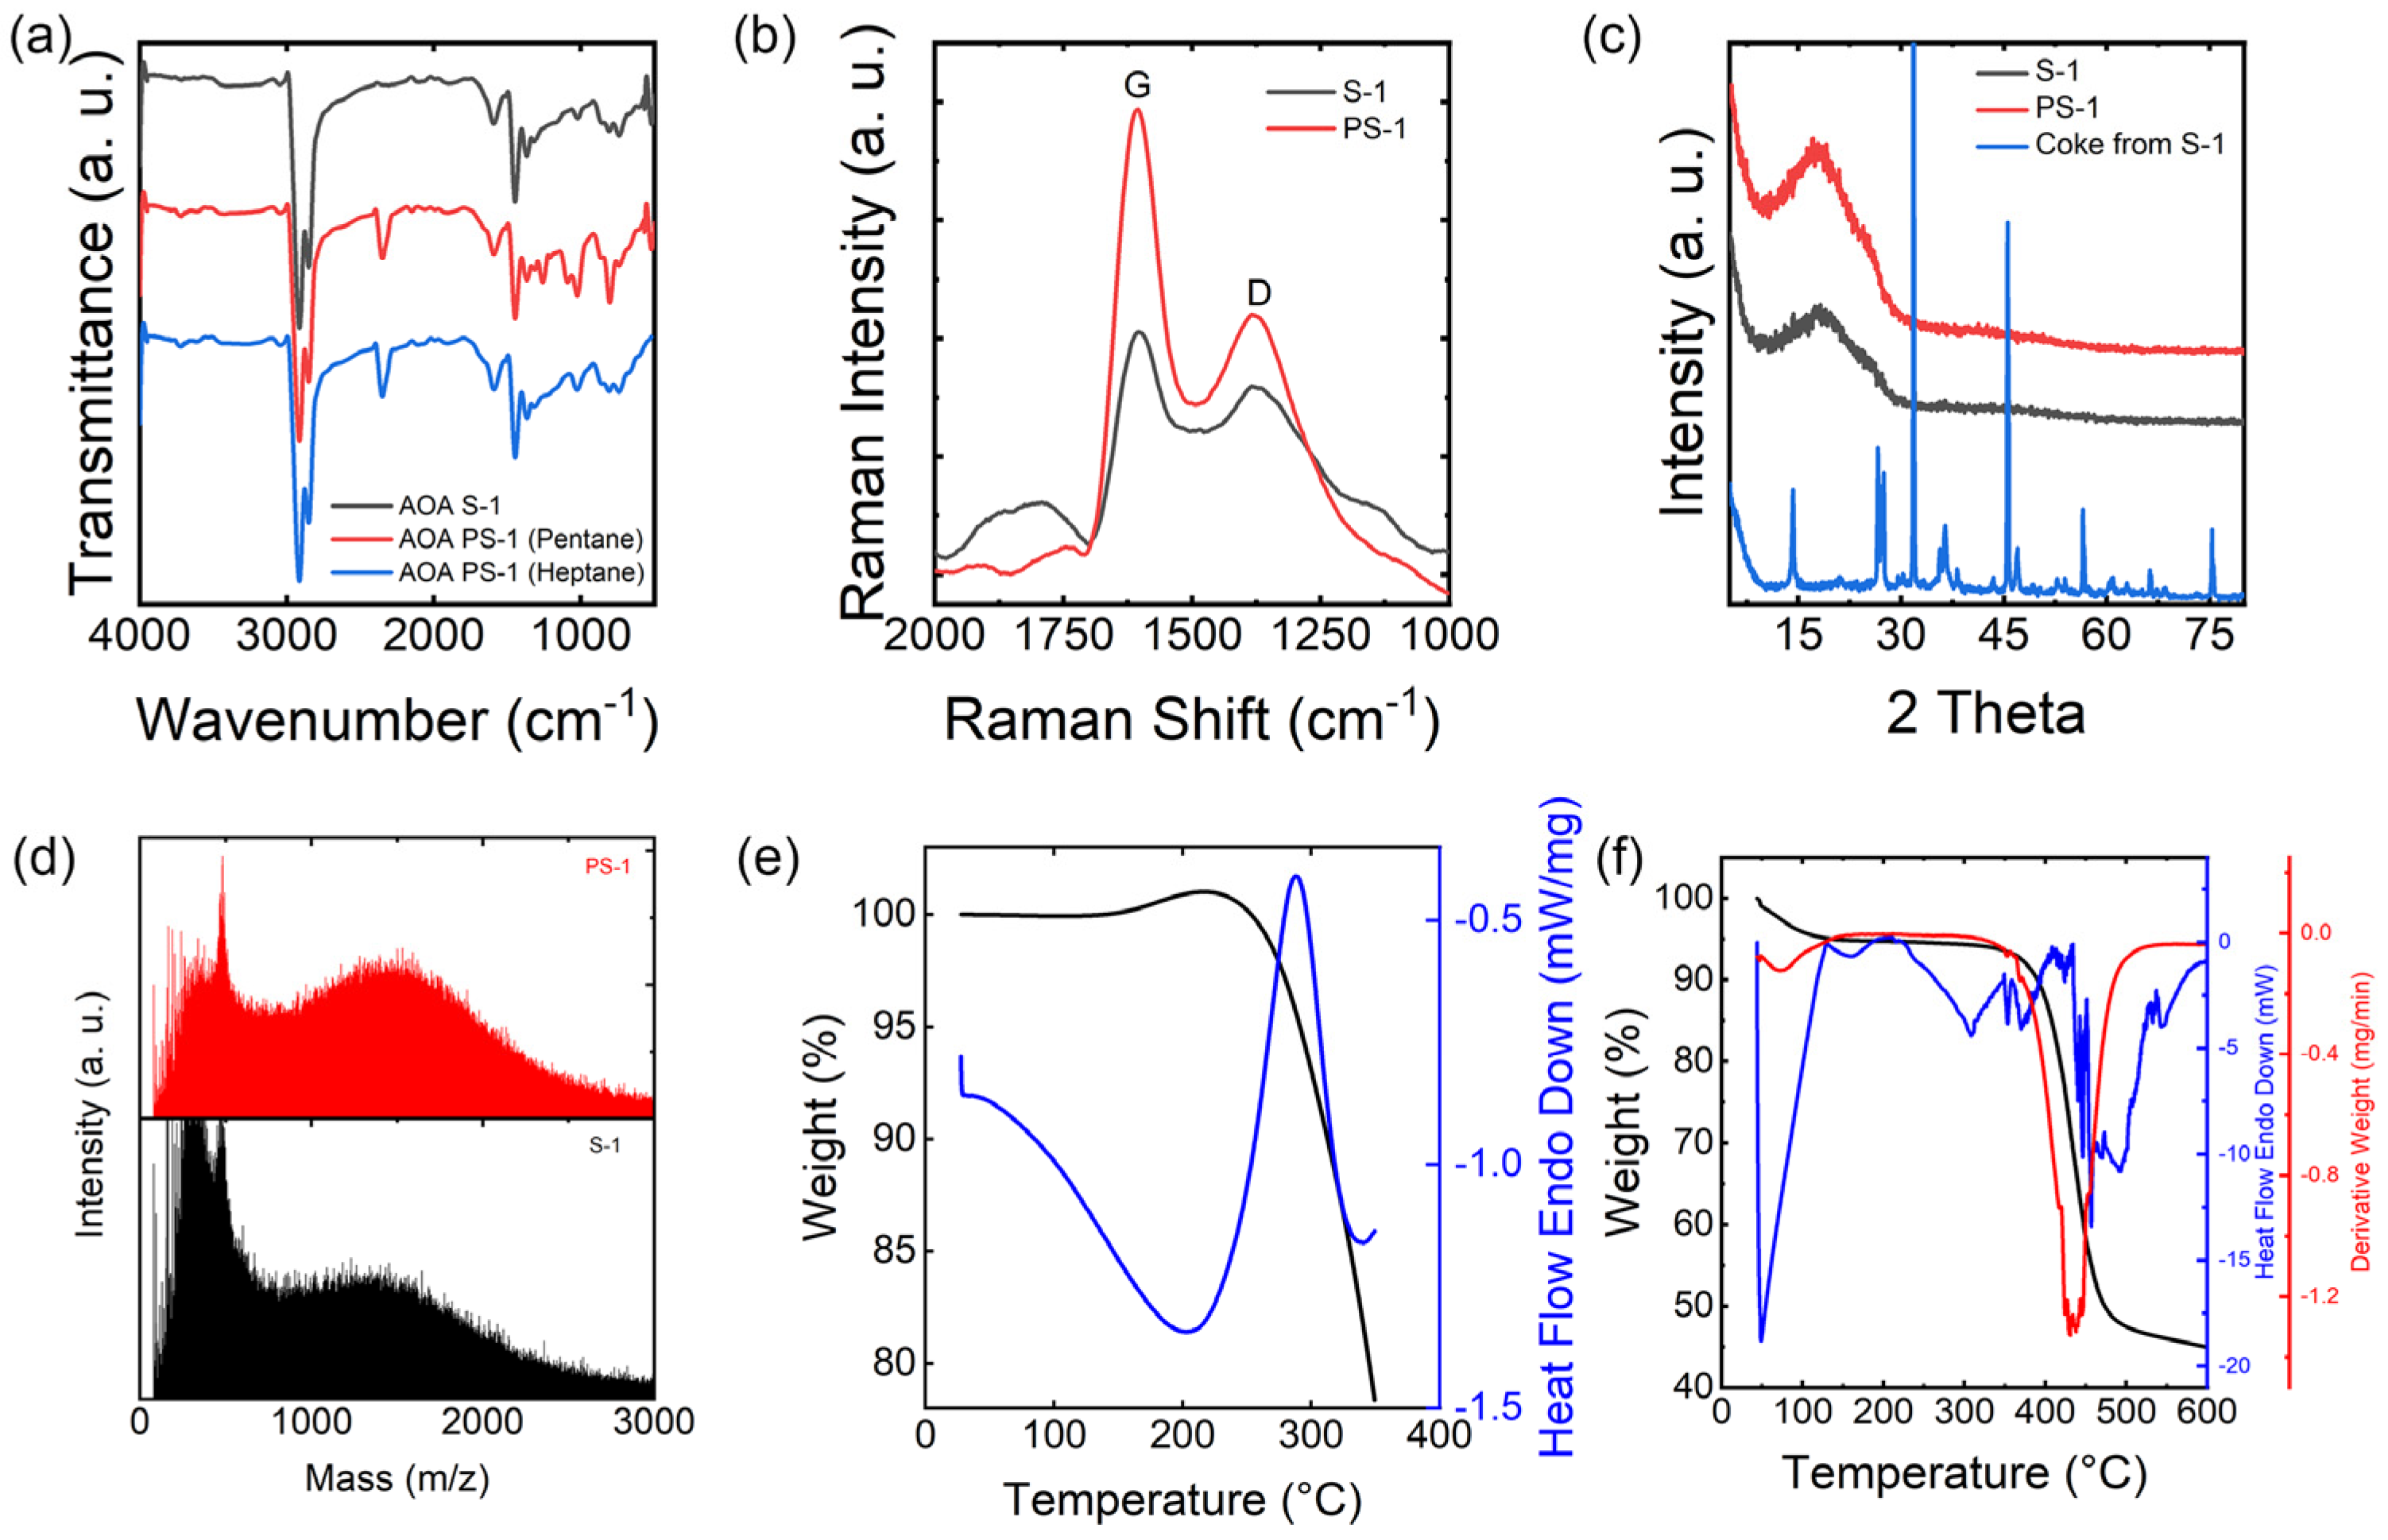
FT−IR was utilized to examine the functional groups within the molecular structure of asphaltene, which primarily appears in the frequency range of 400–4000 cm−1. FT−IR spectra of the AOA S−1 before and after solvent pretreatment are shown in Figure 3a. Feedstock and pretreated AOA are rather similar. All the spectra of pretreated AOA show peaks around 3050 and 1600 cm−1 which correspond to aromatic stretching of the C−H bond and ring, respectively, and the broad peaks from 920 to 850 cm−1 correspond to an out−of−plane aromatic structure. Various peaks from 3000 to 2800 cm−1 are assigned to asymmetric and symmetric stretching, and the peak at 1460 cm−1 is assigned to asymmetric bending of the aliphatic structure. The bands at 3450 cm−1 correspond to the stretching vibration of O−H. Heptane (C7) was also used for pretreating the raw materials. The heptane pretreated asphaltene shows a similar FT−IR pattern to that treated by pentane, indicating that the similar volatile (low molecule fraction) was removed. Similar results can be found in element analysis as shown in the Table 2. For convenience, the pentane−pretreated samples were used for the whole experiment.
Typically, Raman spectrometry is used for carbonaceous materials like asphaltene; the G band at 1605 cm−1 and the D band at 1380 cm−1 are of particular interest. The G band corresponds to the stretching vibrations of sp2 carbon atoms found within both the aromatic hexagonal sheet and the carbon chain. Conversely, the D band reflects the presence of disordered or less structured sp3 carbon atoms. In Figure 3b, AOA S−1 and PS−1 were characterized by Raman spectrometry. It is noted that the G peaks in both S−1 and PS−1 exhibit sharper features compared to the broader D peaks. This sharpness suggests a higher degree of short−range order within the aromatic structure of asphaltene. The ID/IG ratio serves as an indicator of the proportion of sp2 carbon atoms in the samples, which play a pivotal role in the stabilization and carbonization processes and are also key to the final mechanical properties. Notably, the ID/IG ratios for S−1 and PS−1 are 0.78 and 0.56, respectively. These values suggest a difference in the content of sp2 carbon atoms, providing insight into the nature of the stabilization and carbonization processes.
XRD is a valuable technique for providing in−depth insights into the level of crystallinity in asphaltene. In conjunction with Raman spectra, this method has been employed to gauge the interlayer spacing within petroleum asphaltene. Figure 3c displays the XRD patterns of AOA, both before and after pre−treatment. Following pre−treatment, the PS−1 pattern closely resembles that of S−1. Both S−1 and PS−1 exhibit broad peaks at approximately 20°, indicative of the γ−band and signifying the spacing between alkyl chains or saturated rings. The XRD pattern of the coke produced during the pre−treatment of S−1 displays multiple sharp peaks, which points to the presence of contaminating salts and metals in the raw materials, which were eliminated during the solvent pretreatment process.
As depicted in Figure 3d, it is evident that the average molecular weight of S−1 is marginally greater than that of PS−1, which corroborates the findings from the FT−IR and CHNS analyses. This underscores the effectiveness of Soxhlet extraction with C5 or C7 in eliminating low molecular weight compounds. Nevertheless, the difference in molecular weight is not particularly substantial, owing to the asphaltene’s inherent tendency to form robust clusters. The molecular weight of both PS−1 and S−1 falls within the range of 500 to 1000 amu, indicating the presence of monomeric asphaltenes with 1–3 ring aromatic chromophores. Meanwhile, the removal of the low molecular weight fraction, often referred to as the volatile fraction, had a notable impact on enhancing the spinning, stabilization, and carbonization processes. This elimination of volatile compounds addressed potential issues related to gas release during spinning and reduced defects during the stabilization and carbonization phases.
The oxygen stabilization process is the most time and energy−intensive step in carbon fiber production. The temperature at which oxygen is absorbed plays a crucial role in achieving a higher degree of stabilization, a fact that can be confirmed through TGA conducted in an ambient air environment. In Figure 3e, the TGA profiles illustrate the oxygen absorption of AOA during the oxidation stabilization process. The heating rate is set at 2 °C/min, and the experiments are conducted under airflow conditions. For PS−1, there is a continuous decrease in weight as the temperature increases, with distinct stages or increments observed at 220 °C. The stabilization process for PS−1 involves typical reactions such as oxidation, dehydration, condensation, oxidation cross−linking, the elimination of volatile components, and oxidative decomposition. In most cases, the weight of the fibers tends to increase during the stabilization process due to oxygen uptake. The weight of PS−1 started to decrease at around 300 °C, indicating that the decomposition temperature of PS−1 is around 300 °C in air conditions.
A TGA/DSC analysis was carried out in a nitrogen environment to assess the melt spinnability of an asphaltene sample and to determine the appropriate melt−spinning conditions. By examining the TGA/DSC data represented in Figure 3f for the neat PS−1, it is possible to estimate the operational temperatures for melt spinning. These temperatures fall within the range between the melting point and the temperature at which the sample undergoes degradation. An endotherm peak can be found starting from 220 °C without obvious weight loss, which indicates the melting of PS−1, with degradation commencing around 350 °C. This affords a suitable temperature range for conducting further rheological tests and the melt−spinning process, as it allows operations to occur between the melting range and the degradation temperature without causing sample degradation during the spinning and stabilization processes. It is important to highlight that there exists a temperature differential of approximately 50 °C between the decomposition temperature of PS−1 in air and nitrogen atmospheres. This observation implies that the upper limit for the processing temperature of PS−1 during the spinning process should not exceed 300 °C. Simultaneously, it is imperative to underscore that a preliminary stabilization step, conducted at temperatures below 300 °C, is a prerequisite for the stabilization process.
The elemental analysis results can be found in Table 2. To determine the composition, solid samples were subjected to combustion at 1800 °C, and the resulting carbon, hydrogen, nitrogen, and sulfur oxides were identified and quantified as weight percentages within the sample. Notably, nitrogen and sulfur are predominantly found within the asphaltene structure rather than in the maltenes. Conversely, the decrease in oxygen content is ascribed to the removal of maltenes. The carbon−to−hydrogen ratio for S−1, PS−1 using pentane, and PS−1 using heptane are 9.91, 10.21, and 9.83, respectively. This observation indicates that PS−1 possesses a higher level of aromaticity compared to S−1, which is necessary for better post−treatment of PS−1 fibers.
Rheology is used to understand the properties of asphaltene melts and to predict the properties of the melt−spinning fiber. Because of the brittleness of the asphaltene, different polymers are considered to serve as additives for modification of the processability of asphaltene. The viscosity of pure PS−1 at various temperatures was determined and is depicted in Figure 4a. The viscosity of the undiluted PS−1 sample remains approximately constant at around 103 Pa·s across all of the temperatures analyzed under typical shear rates for operation. However, when the shear rate is raised to approximately 10 s−1, a substantial ten−fold reduction in viscosity is observed. In addition, the rheological characteristics of mixtures comprising both PS (Figure 4b,c) and SBS (Figure 4d,e) at concentrations of 5% and 10% were determined with PS−1. This indicates that the viscosity of all mixed samples falls within a similar range (approximately 103 Pa·s) to that of the pure PS−1 sample, at the specified shear rate (approximately 10 s−1). It is noteworthy that the PS−based blend compositions exhibit a distinct shear−thinning behavior at higher shear rates compared to the SBS−based blends. This observation highlights the potential to operate at lower viscosities while working at higher shear rates. The first normal stress difference of the blended specimens was compared with the pristine, pre−treated sample in Figure 4f. The first normal stress difference serves as an indicator of the elastic properties within the samples. It is evident that the amalgamation of PS−1 with polymers (PS and SBS) resulted in elevation of the first normal stress difference, signifying an augmented elastic component within the samples. This heightened elasticity in the blended specimens has the potential to enhance the stiffness of the spun fibers.
3.2. Preparation of AOA−CFs through the Use of the Conventional Method
A comprehensive analysis of the morphological characteristics of spun fibers, stabilized fibers, and carbonized fibers, following various thermal post−treatments, was carried out in this study. Spun fibers were obtained using a godet system (Figure 5a). To avert oxidation, these spun fibers, known for their inherent brittleness, were carefully preserved in a vacuum chamber. The SEM image of spun fibers is shown in Figure 5b, most of the spun fibers exhibited a diameter of approximately 30 μm, with lengths reaching up to around 1 m. Notably, the spun fibers retained a “groove” structure, a remnant of imperfections stemming from the nozzle during the spinning process. The stabilization of spun PS−1 fibers, a critical step in the production of carbon fibers, typically involves subjecting them to temperatures ranging from 200 to 500 °C in an air or oxygen atmosphere. The TGA in Figure 3e reveals a broad peak at approximately 220 °C, signifying the onset of oxygen absorption by PS−1. Beyond 300 °C, a sharp reduction in weight is observed, indicating the decomposition of PS−1 in an air environment. For the stabilization of spun PS−1 fibers, conventional methods were employed as part of the control experiment. In the conventional process, the spun PS−1 fibers underwent heat treatment at 220 °C for 4 h, followed by 280 °C for 4 h, with a heating rate of 1 °C/min, while being exposed to a 500 mL/min airflow. Figure 5c showcases the resulting morphology of the PS−1 fibers after undergoing conventional stabilization. In contrast to the spun fibers, the surface of the stabilized fibers exhibited a smoother and denser texture, attributed to oxygen substitution and cyclization reactions that transpire during the stabilization process [34]. It is noteworthy that the successful stabilization of PS−1 fibers necessitates the application of tension, as failure to do so may result in their melting and fusion. Following the stabilization process, the stabilized fibers were subsequently subjected to conventional carbonization using a tube furnace. This carbonization process was executed in two steps: firstly at 600 °C for 30 min and then at 1100 °C for an additional 30 min by employing a heating rate of 5 °C/min in an argon gas atmosphere, which was adopted as the control method. Figure 5d presents the SEM image of the carbonized fibers produced using the conventional approach. Notably, these carbonized fibers exhibited a smoother surface, attributed to the formation of cross−linking carbon–carbon bonds.
Figure 6a displays the XRD patterns for both stabilized PS−1 and carbonized PS−1 fibers. Following the carbonization process, a noticeable enhancement in the intensity of peaks in the XRD pattern of the carbonized fibers was obtained. The XRD pattern of the carbonized fibers revealed the presence of two distinct broad peaks at 26° and 43°, corresponding to the (002) and (100) crystallographic planes, respectively. The (002) plane signifies an increase in the spacing between the aromatic layers, indicative of a higher degree of crystallinity when compared to the stabilized fibers. On the other hand, the (100) plane suggests the presence of graphite layers within the fibers [35].
Figure 6b presents the Raman spectra for PS−1, stabilized fibers, and carbonized fibers, with specific attention given to the G band at 1605 cm−1 and the D band at 1380 cm−1. The G band is associated with the stretching vibrations of sp2 carbon atoms found within the aromatic hexagonal sheet and the carbon chain, while the D band signifies the presence of disordered or less structured sp3 carbon atoms. It is noteworthy that the G peaks in PS−1, stabilized fibers, and carbonized fibers exhibit sharper features compared to the broader D peaks. This sharpness indicates a higher degree of short−range order within the asphaltene’s aromatic structure. The ID/IG ratio, serving as an indicator of the proportion of sp2 carbon atoms in the samples, plays a crucial role in understanding the processes of stabilization and carbonization. Notably, the ID/IG ratio for PS−1 is 0.56, suggesting variations in the content of sp2 carbon atoms and offering insights into the nature of the stabilization and carbonization procedures. The ID/IG ratio for stabilized fibers is 0.63, while it increases to 0.69 for the carbonized PS−1 fibers. This rise in the ratio indicates an augmentation in the proportion of sp2 carbon atoms after stabilization and subsequent carbonization, consistent with the findings from the XRD and elemental analyses. These results emphasize the importance of strict temperature to enhance the sp2 ratio in carbon fibers.
The crystallite parameters of graphite crystals of carbon fibers were calculated by using Bragg’s law and the Debye–Scherrer equation, as presented in Table 3 [36]. The interlayer spacing (d(002)), the apparent crystallite thickness (Lc), and the apparent layer−plane length parallel to the fiber axis (La) are calculated based on the following equations from β:
where d(002) is the interlayer spacing, θ is the Bragg angle of the peaks, λ is the wavelength of the X−ray used (0.154 nm), and β is the full width at half maximum (FWHM). The form factor K is 0.89 for Lc and 1.84 for La, respectively. As presented in Table 3, the interlayer spacing (d(002)) of AOA carbon fibers indicates a similar ordered structure compared with conventional carbon fibers.
Furthermore, as depicted in Table 4, the carbon content exhibited an increase from 74.10% to 87.58% for stabilization and carbonized fibers, respectively, while the H/C ratio decreased from 0.081103 to 0.003540. This serves as further evidence of the formation of carbon basal planes during the carbonization process [37]. The reduction in the levels of H, N, and S suggests the elimination of heteroatoms during carbonization. Notably, even after carbonization, the sulfur content still stands at 5.56%, potentially introducing defects into the fibers. The method for effectively removing sulfur from the conventional carbonization process remains unclear.
3.3. Preparation of AOA−CFs by Microwave Plasma
Figure 7 presents the SEM images depicting a comparison between conventionally stabilized fibers before and after microwave plasma treatment. After subjecting the fibers to 5 min microwave plasma treatment at 1000 W, evident surface damage and the presence of pores were observed, as illustrated in Figure 7b. This surface degradation can be attributed to the physical and chemical interactions, as well as collisions, between the charged particles within the plasma and the surface of the stabilized fibers [23]. The observed defects resulting from the microwave plasma treatment indicate the necessity for more robust and stable fibers when undergoing such treatment.
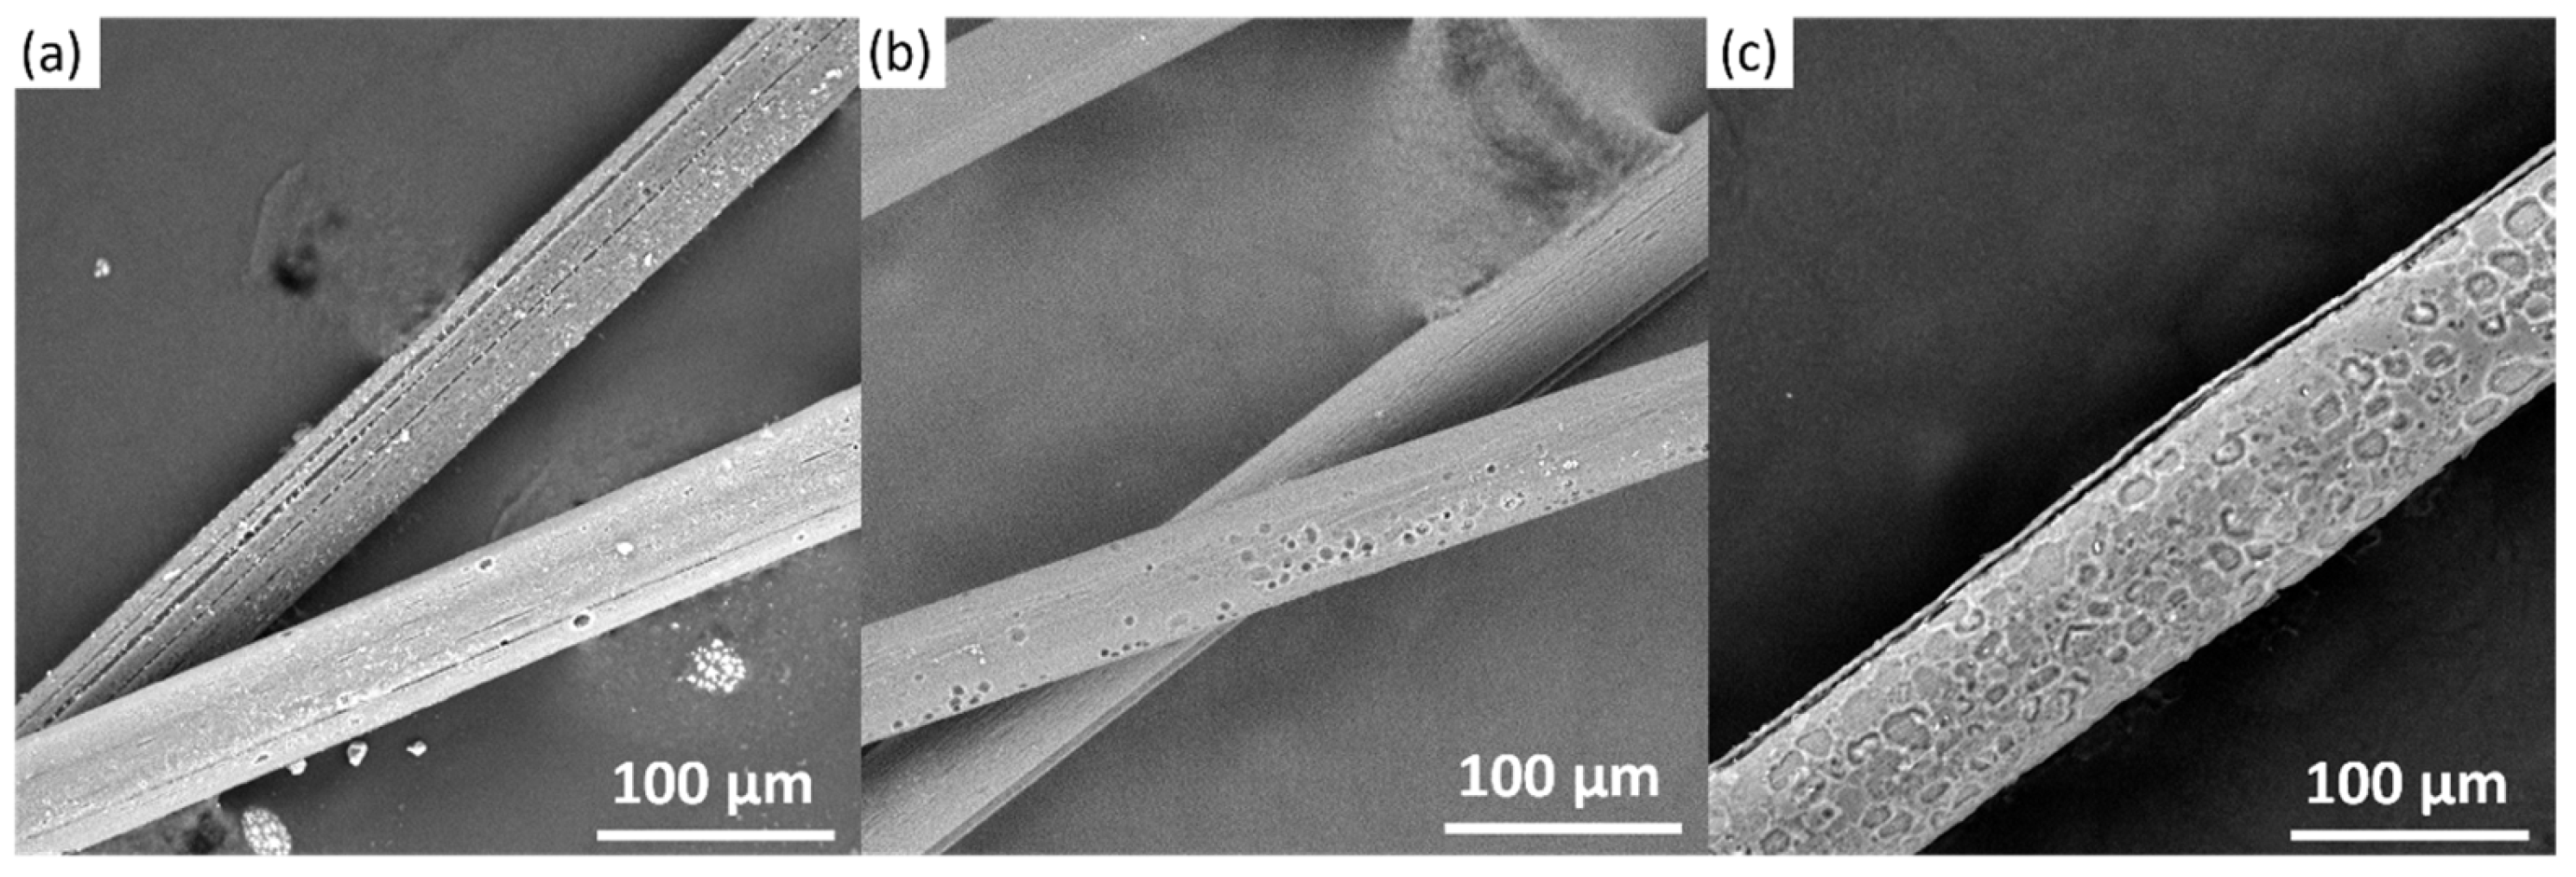
For the assessment of microwave plasma treatment, carbonized fibers, characterized by their enhanced robustness and stability, were selected as the subject of investigation. Figure 8 presents the morphological analysis of conventionally carbonized fibers following treatment with microwave plasma at varying time intervals. Comparing the level of damage observed in the microwave plasma treatment between stabilized fibers (Figure 7b) and conventionally carbonized fibers, it is noted that the damage to the carbonized fibers was relatively less pronounced. As the treatment time extended from 5 to 7 and then to 9 min, a noticeable increase in surface imperfections, such as dents, was observed, as depicted in Figure 8a–c. This escalation in the number of defects may be attributed to the ongoing attack by argon ions on the fiber [38]. In particular, fibers treated with microwave plasma for 9 min (Figure 8c) exhibited more substantial surface damage, which could potentially impact the mechanical properties of the final carbon fiber products.
Figure 9 illustrates the XRD pattern and Raman spectra of carbonized fibers subjected to microwave plasma treatment for durations of 5, 7, and 9 min. In Figure 9a, it is evident that the peak around 26°, corresponding to the (002) plane, exhibited increased sharpness following microwave plasma treatments. This sharpening of the peak indicates an augmentation in the spacing between the aromatic layers, indicative of a higher degree of crystallinity compared to conventionally carbonized fibers. Key crystalline parameters for conventional carbonized fibers before and after microwave plasma treatment are detailed in Table 3. The interlayer spacing (d) decreased to 0.360 nm, while the crystallite parameters of graphite thickness Lc and La increased with longer plasma treatment durations. These findings suggest that microwave plasma treatment fosters the transition from a turbostratic graphite−like structure to a more ordered graphite structure [39]. In Figure 9b, the Raman spectra of carbonized fibers subjected to microwave plasma treatment for 5, 7, and 9 min are presented. With increasing treatment duration, there was a noticeable change in the intensity of both the G and D peaks, with the G peak becoming relatively more pronounced. The ID/IG ratios of 5, 7, and 9 min treatment are 0.73, 0.68, and 0.64, respectively, as the treatment time increased, signifying a higher proportion of ordered graphitic carbon with sp2 hybridization [34]. Notably, despite an extended treatment duration of up to 9 min, as displayed in Figure 9b, the presence of the D peak suggests the persistence of defects and disordered graphite structures within the carbon fiber [39]. More strict conditions, such as a higher temperature, are needed to increase the ID/IG ratio to further improve the mechanical performance of the final product.
Table 5 presents the element analysis before and after microwave plasma treatment. A comparison with conventionally carbonized fibers reveals that prolonged microwave plasma treatment, especially over a 9 min duration, led to an increase in the carbon content from 87.58% to 91.84%. This heightened carbon content signifies a reduction in heteroatoms and an improvement in the carbon–carbon structure, directly correlating to enhanced mechanical performance. The content of all heteroatoms, including hydrogen, nitrogen, sulfur, and oxygen, experienced a decrease subsequent to microwave plasma treatment. This reduction indicates the effectiveness of microwave plasma in eliminating heteroatoms. Particularly challenging is the reduction in sulfur content, given its inheritance from the original oilsands. Microwave plasma demonstrates promise in achieving higher temperatures in shorter durations and in effectively eliminating heteroatoms during the fabrication of asphaltene−based carbon fibers.
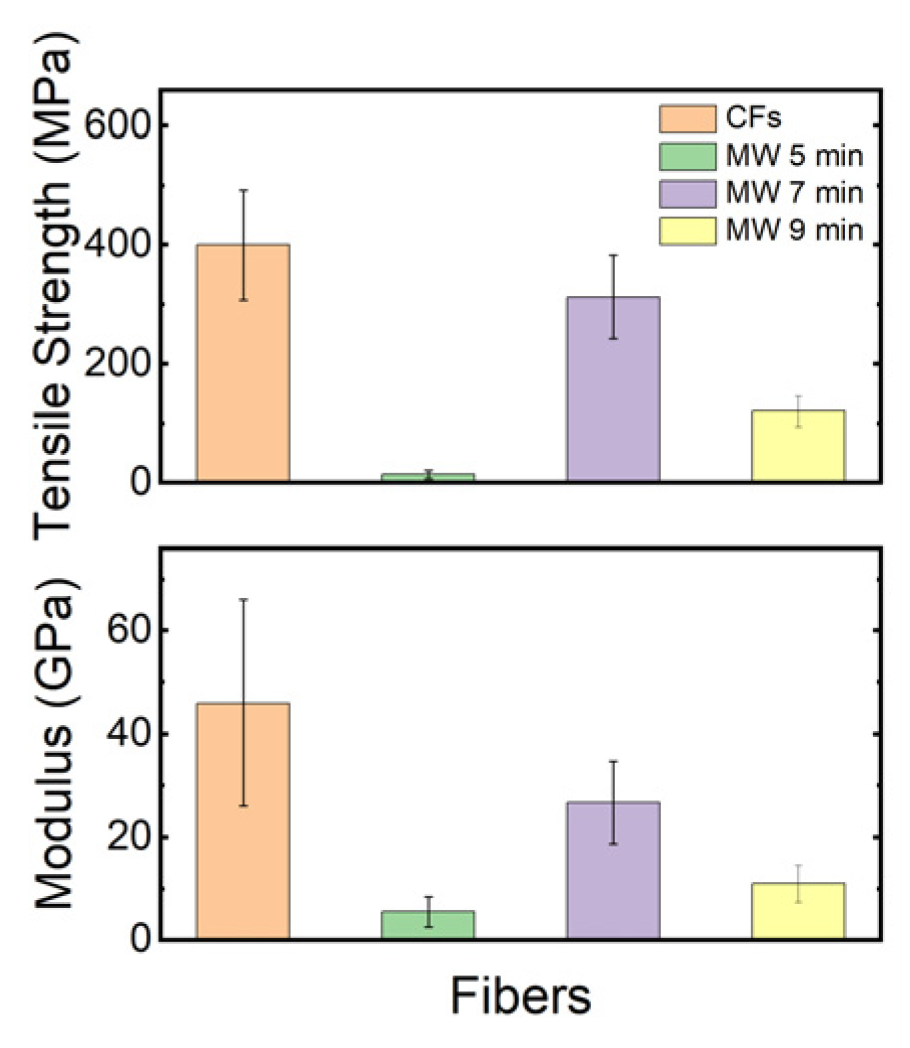
The tensile strength and modulus of conventionally carbonized fibers and microwave plasma−treated fibers were measured and are shown in Figure 10. The results indicate that after carbonization using microwave plasma, the average tensile strength and modulus values have been reduced, which can be backed up by the surface damage on the fibers, as seen in Figure 7, and the rapid heating rate induced by the microwave plasma. The presence of voids in the fiber morphology is undesirable as it renders these fibers unsuitable for structural applications [38]. These values are lower than those reported in the previous literature, suggesting potential areas for process optimization such as melt−spinning, stabilization, or carbonization to improve mechanical properties further.
3.4. Modelling of MW Plasma
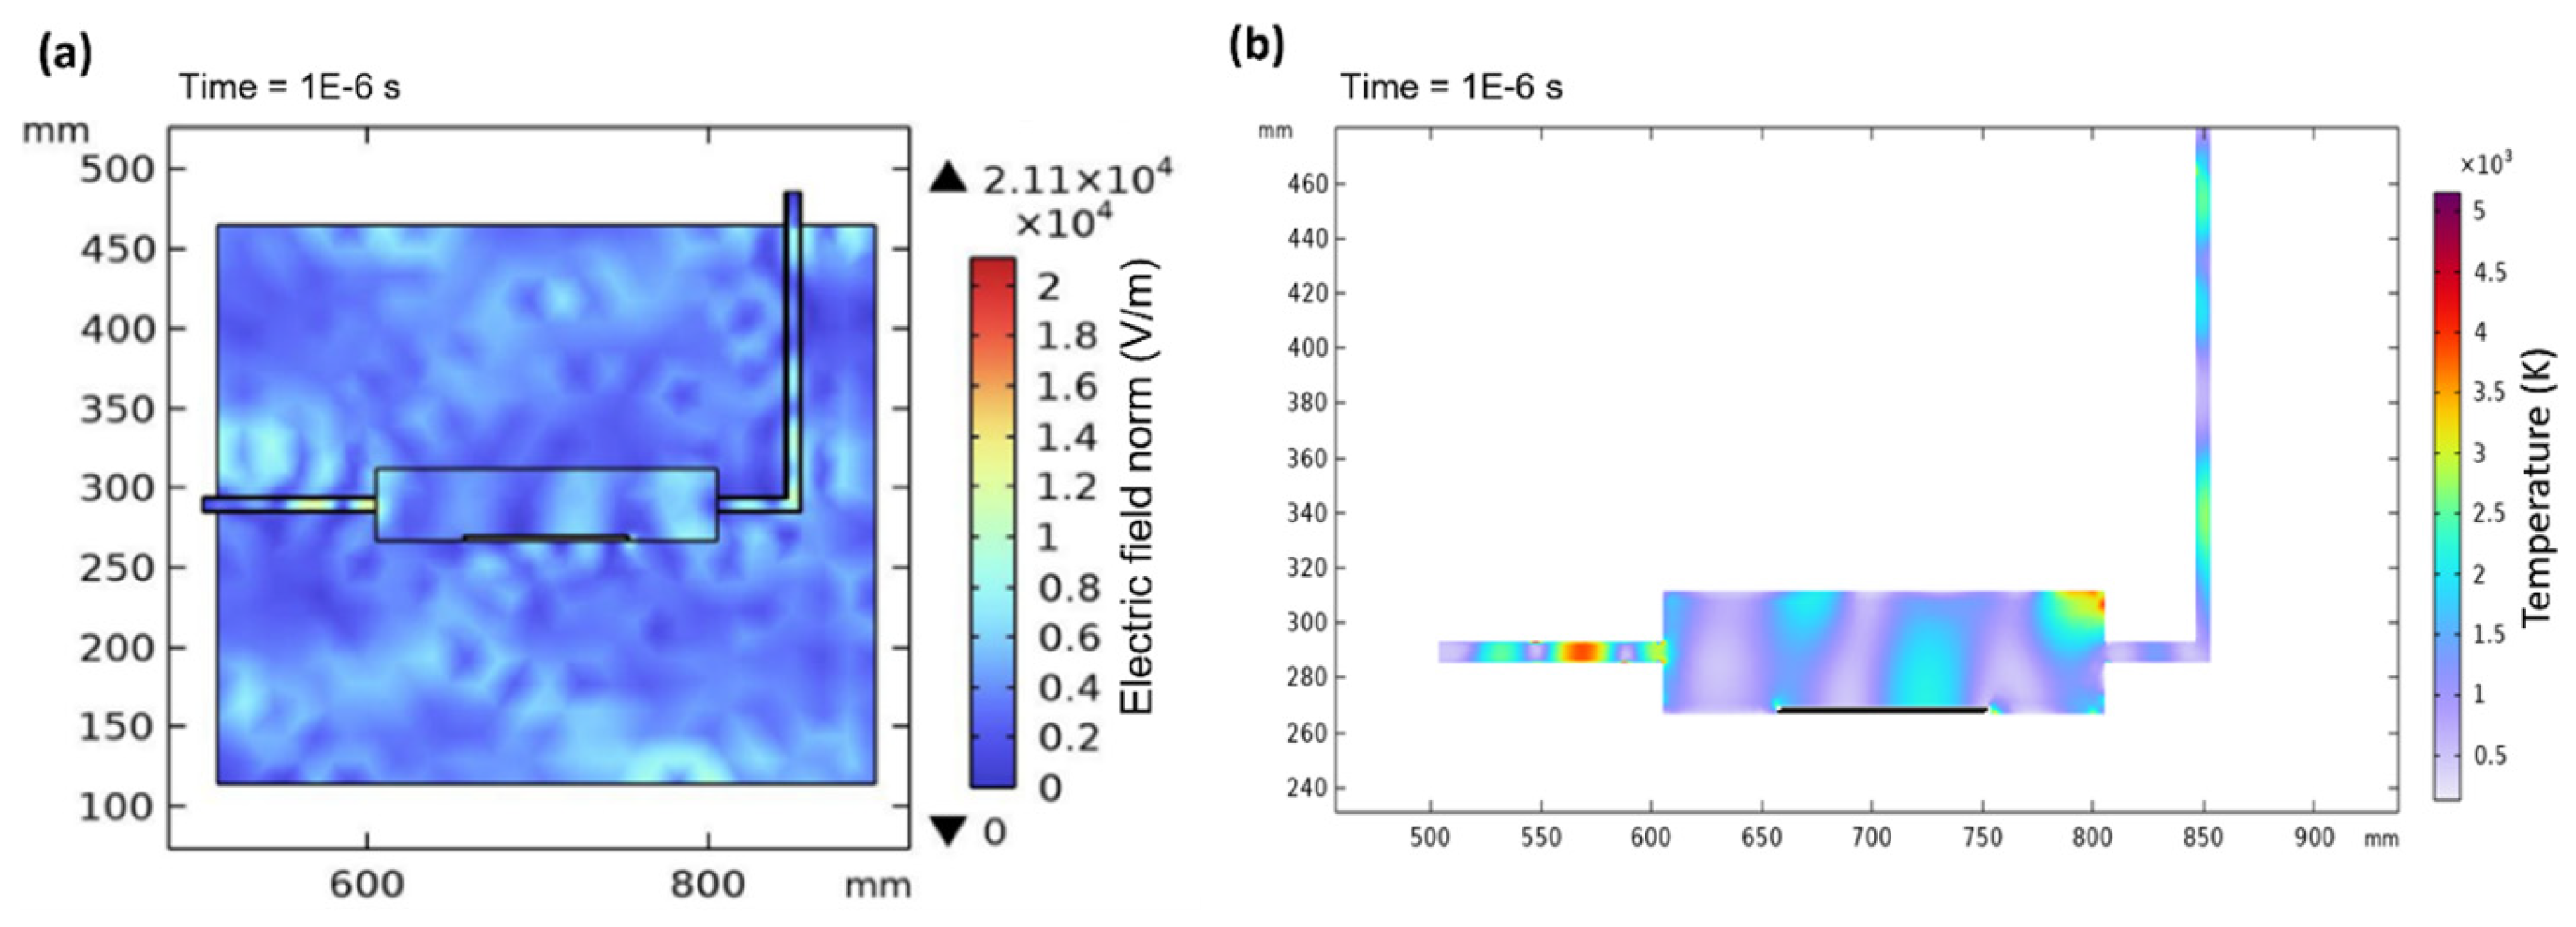
Figure 11a shows the electric field norm in the microwave cavity, while Figure 11b displays the contour temperature plot of the plasma temperature in the quartz tube at 1E−6 s. When a microwave power of 1000 W is applied, there is instability in the electric field distribution due to interference with surroundings in the cavity. However, once the electric field stabilizes and becomes continuous at 10−6 s, electromagnetic waves propagate and excite argon gas to generate plasma. This leads to stable and consistent plasma generation inside the quartz tube which immediately elevates the temperature, as shown in Figure 11b. The inconsistency in temperature within the quartz tube can be attributed to factors such as random particle collisions, variations in plasma density, and interactions between wave modes and argon gas [38].
Successful extraction of the high molecular weight fraction from Alberta oilsands was achieved through solvent−based techniques, resulting in the successful fabrication of carbon fibers. Notably, the asphaltene component exhibited brittle characteristics and high viscosity during the spinning process, posing significant challenges for processing. However, the addition of polymer additives effectively altered the viscosity of the raw asphaltene, enhancing its processability. These polymer additives interacted with asphaltene molecules, leading to modification of viscosity and enabling precise control of melt spinnability. The subsequent post−treatment of asphaltene fibers bore similarities to the procedures applied to pitch carbon fibers. The stabilization process involved oxygen absorption and the conversion of gaseous emissions, transforming the fibers from a thermoplastic state to a thermoset state. During the carbonization process, the removal of heteroatoms occurred, with higher temperatures contributing to greater carbon content and a reduced presence of heteroatoms. Nonetheless, certain heteroatoms, including sulfur and nitrogen, remained within the final carbonized fibers, firmly embedded in the molecular bonds and originating from the oilsands source. This marked a distinction from mesophase pitch carbon fibers, which are derived from naphthalene. Furthermore, the potential of microwave plasma technology showed promise in further reducing heteroatoms within asphaltene carbon fibers, although further investigation and confirmation are necessary for future research endeavors.
The processing of oilsands asphaltene remains challenging due to variations in source and location. These differences result in distinct physical and chemical properties, particularly in terms of viscosity, which hinders consistent manufacturing. Moreover, the presence of heteroatoms such as sulfur and nitrogen in asphaltene proves difficult to eliminate, thus impeding the production of asphaltene carbon fibers and affecting the mechanical properties of the final carbon fiber product. The brittleness of asphaltene further complicates continuous fiber manufacturing. The quest for cost−effective and efficient polymer additives to enhance the melt spinnability of asphaltene is an ongoing investigation. Given the intricate structure of asphaltene, the mechanism for modifying its properties is still the subject of ongoing research. Comparatively, the mechanical properties of the final asphaltene carbon fibers fall short when measured against commercial carbon fibers derived from PAN and mesophase pitch. Addressing this disparity remains a pertinent challenge in this field.
4. Conclusions
This study involved the fabrication of CFs from an AOA precursor via a twin−screw extruder, followed by post−treatment using both conventional and microwave plasma methods. Notably, the results revealed that the pure asphaltene fibers, produced with the assistance of microwave plasma during the carbonization process, exhibited a better carbonization degree comparable to that of conventionally treated fibers. Moreover, the incorporation of polymers with asphaltenes exerted a significant influence on the rheological properties of the resulting fibers. The as−prepared carbon fibers demonstrated impressive mechanical properties, a best tensile strength of 600 MPa, and Young’s modulus of 70 GPa. The successful temperature modelling of microwave plasma using COMSOL™, validated through experimental studies, highlighted the potential for further refining the production process to yield CFs with enhanced properties. Future research endeavors aim to optimize the manufacturing procedure with the goal of achieving superior CFs. Additionally, there is a focus on developing a streamlined and scalable manufacturing approach to facilitate the mass production of CFs.
Author Contributions
Data acquisition and analyses, L.G., S.C. and T.Z.; funding acquisition, S.S.P.; investigation, L.G.; supervision, S.S.P.; validation, L.G.; writing, L.G. and S.C. All authors have read and agreed to the published version of the manuscript.
Funding
Alberta Innovates and the Clean Resource Innovation Network (CRIN) Carbon Fiber Chanllenge II (202103058).
Data Availability Statement
All data are contained within the article.
Acknowledgments
Financial support from Alberta Innovates, Clean Resource Innovation Network (CRIN), and University of Calgary are gratefully acknowledged.
Conflicts of Interest
The authors declare no conflict of interest.
References
- Culebras, M.; Beaucamp, A.; Wang, Y.; Clauss, M.; Frank, E.; Collins, M.N. Biobased Structurally Compatible Polymer Blends Based on Lignin and Thermoplastic Elastomer Polyurethane as Carbon Fiber Precursors. ACS Sustain. Chem. Eng. 2018, 6, 8816–8825. [Google Scholar] [CrossRef]
- Yao, X.; Gao, X.; Jiang, J.; Xu, C.; Deng, C.; Wang, J. Comparison of carbon nanotubes and graphene oxide coated carbon fiber for improving the interfacial properties of carbon fiber/epoxy composites. Compos. Part B Eng. 2018, 132, 170–177. [Google Scholar] [CrossRef]
- Frank, E.; Hermanutz, F.; Buchmeiser, M.R. Carbon fibers: Precursors, manufacturing, and properties. Macromol. Mater. Eng. 2021, 297, 493–501. [Google Scholar] [CrossRef]
- Warren, A.D. Low−Cost Carbon Fiber Overview; Oak Ridge National Laboratory: Oak Ridge, TN, USA, 2011. [Google Scholar]
- Morris, E.A.; Weisenberger, M.C.; Abdallah, M.G.; Vautard, F.; Grappe, H.; Ozcan, S.; Paulauskas, F.L.; Eberle, C.; Jackson, D.; Mecham, S.J.; et al. High performance carbon fibers from very high molecular weight polyacrylonitrile precursors. Carbon 2016, 101, 245–252. [Google Scholar] [CrossRef]
- Alberta Innovates. Carbon Fiber Grand Challenge Phase III Webinar. 2023. Available online: https://albertainnovates.ca/wp-content/uploads/2023/06/CFGC-Phase-III-Webinar-Slide-Deck.pdf (accessed on 17 November 2023).
- Chen, W. Fabrication of Carbon Fibers with High Mechanical Properties. UK Patent No. WO/2021/072559, 22 April 2021. [Google Scholar]
- Zuo, P.; Leistenschneider, D.; Kim, Y.; Ivey, D.G.; Chen, W. The effect of thermal pretreatment temperature on the diameters and mechanical properties of asphaltene−derived carbon fibers. J. Mater. Sci. 2021, 56, 14964–14977. [Google Scholar] [CrossRef]
- Zhu, J.; Birgisson, B.; Kringos, N. Polymer modification of bitumen: Advances and challenges. Eur. Polym. J. 2014, 54, 18–38. [Google Scholar] [CrossRef]
- Ni, G.; Jiang, W.; Shen, W. Chemical modification of asphaltene with SEBS as precursor for isotropic pitch−based carbon fiber. ChemistrySelect 2019, 4, 3690–3696. [Google Scholar] [CrossRef]
- Wu, H.; Thakur, V.K.; Kessler, M.R. Novel low−cost hybrid composites from asphaltene/SBS tri−block copolymer with improved thermal and mechanical properties. J. Mater. Sci. 2016, 51, 2394–2403. [Google Scholar] [CrossRef]
- Sobuj, S.R. Melt spinning, dry spinning and wet spinning method. Text. Study Cent. 2015. [Google Scholar]
- Brown, K.R.; Harrell, T.M.; Skrzypczak, L.; Scherschel, A.; Wu, H.F.; Li, X. Carbon fibers derived from commodity polymers: A review. Carbon 2022, 196, 422–439. [Google Scholar] [CrossRef]
- Edie, D.D.; Dunham, M.G. Melt spinning pitch−based carbon fibers. Carbon 1989, 27, 647–655. [Google Scholar] [CrossRef]
- Bashir, Z. A critical review of the stabilization of polyacrylonitrile. Carbon 1991, 29, 1081–1090. [Google Scholar] [CrossRef]
- Rahaman, M.S.A.; Ismail, A.F.; Mustafa, A. A review of heat treatment on polyacrylonitrile fiber. Polym. Degrad. Stab. 2007, 92, 1421–1432. [Google Scholar] [CrossRef]
- Zhu, D.; Xu, C.; Nakura, N.; Matsuo, M. Study of carbon films from PAN/VGCF composites by gelation/crystallization from solution. Carbon 2002, 40, 363–373. [Google Scholar] [CrossRef]
- Chung, D. Carbon Fiber Composites, 3rd ed.; Butterworth-Heineman: Reading, MA, USA, 2012; pp. 17–64. [Google Scholar]
- Ghosh, T.; Kim, H.C.; De Kleine, R.; Wallington, T.J.; Bakshi, B.R. Life cycle energy and greenhouse gas emissions implications of using carbon fiber reinforced polymers in automotive components: Front subframe case study. Sustain. Mater. Technol. 2021, 28, e00263. [Google Scholar] [CrossRef]
- Mainka, H.; Täger, O.; Körner, E.; Hilfert, L.; Busse, S.; Edelmann, F.T.; Herrmann, A.S. Lignin—An alternative precursor for sustainable and cost−effective automotive carbon fiber. J. Mater. Res. Technol. 2015, 4, 283–296. [Google Scholar] [CrossRef]
- Kawajiri, K.; Sakamoto, K. Environmental impact of carbon fibers fabricated by an innovative manufacturing process on life cycle greenhouse gas emissions. Sustain. Mater. Technol. 2022, 31, e00365. [Google Scholar] [CrossRef]
- Park, S.; Kil, H.S.; Choi, D.; Song, S.K.; Lee, S. Rapid stabilization of polyacrylonitrile fibers achieved by plasma−assisted thermal treatment on electron−beam irradiated fibers. J. Ind. Eng. Chem. 2019, 69, 449–454. [Google Scholar] [CrossRef]
- Kim, S.Y.; Kim, S.Y.; Lee, S.; Jo, S.; Im, Y.H.; Lee, H.S. Microwave plasma carbonization for the fabrication of polyacrylonitrile−based carbon fiber. Polymer 2015, 56, 590–595. [Google Scholar] [CrossRef]
- Sha, Y.; Yang, W.; Li, S.; Yao, L.; Li, H.; Cheng, L.; Yan, H.; Cao, W.; Tan, J. Laser induced graphitization of PAN−based carbon fibers. R. Soc. Chem. 2018, 8, 11543–11550. [Google Scholar] [CrossRef]
- Liou, Y.; Chau, K.; Hui, C.; He, J.; Lam, Y.; Kan, C. An Analysis of Effect of CO2 Laser Treatment on Carbon Fiber Fabric. Coatings 2018, 8, 178. [Google Scholar] [CrossRef]
- Bundaleska, N.; Tsyganov, D.; Dias, A.; Felizardo, E.; Henriques, J.; Dias, F.M.; Abrashev, M.; Kissovski, J.; Tatarova, E. Microwave plasma enabled synthesis of free standing carbon nanostructures at atmospheric pressure conditions. Phys. Chem. Chem. Phys. 2018, 20, 13810–13824. [Google Scholar] [CrossRef] [PubMed]
- Kim, S.Y.; Kim, S.Y.; Choi, J.; Lee, S.; Jo, S.M.; Joo, J.; Lee, H.S. Two step microwave plasma carbonization including low plasma power pre−carbonization for polyacrylonitrile based carbon fiber. Polymer 2015, 69, 123–128. [Google Scholar] [CrossRef]
- Silva, L.L.G.; Santo, A.L.; Nascente, P.A.P.; Kostov, K.G. Atmospheric Plasma Treatment of Carbon Fibers for Enhancement of Their Adhesion Properties. J. Phys. 2014, 511, 012082. [Google Scholar] [CrossRef]
- Käppler, I.; Hund, R.D.; Cherif, C. Surface modification of carbon fibers using plasma technique. Autex Res. J. 2014, 14, 34–38. [Google Scholar] [CrossRef]
- Lin, J.; Peng, Z.; Liu, Y.; Ruiz−Zepeda, F.; Ye, R.; Samuel, E.L.G.; Yacaman, M.J.; Yakobson, B.I.; Tour, J.M. Laser−induced porous graphene films from commercial polymers. Nat. Commun. 2014, 5, 5714. [Google Scholar] [CrossRef] [PubMed]
- Zhang, Z.; Ramakrishna, S.; Cheng, L.; Cao, W.; Sain, M.; Tan, J.; Wang, A.; Jia, H. Carbon Fibers with High Electrical Conductivity: Laser Irradiation of Mesophase Pitch Filaments Obtains High Graphitization Degree. ACS Sustain. Chem. Eng. 2020, 8, 17629–17638. [Google Scholar] [CrossRef]
- Wang, F.; Shao, J. Modified Weibull distribution for analyzing the tensile strength of bamboo fibers. Polymers 2014, 6, 3005–3018. [Google Scholar] [CrossRef]
- Liu, Y.; Chae, H.G.; Kumar, S. Gel−spun carbon nanotubes/polyacrylonitrile composite fibers. Part II: Stabilization reaction kinetics and effect of gas environment. Carbon 2011, 49, 4477–4486. [Google Scholar] [CrossRef]
- Shokrani Havigh, R.; Mahmoudi Chenari, H. A comprehensive study on the effect of carbonization temperature on the physical and chemical properties of carbon fibers. Sci. Rep. 2022, 12, 10704. [Google Scholar] [CrossRef]
- He, H.; Yang, F.; Ge, Y.; Ran, L.; Peng, K.; Yi, M. Effect of crystallinity of PAN−based carbon fiber surfaces on the formation characteristics of silicon carbide coating. Mater. Res. Express 2019, 6, 085603. [Google Scholar] [CrossRef]
- Karacan, I.; Erzurumluoğlu, L. The effect of carbonization temperature on the structure and properties of carbon fibers prepared from poly(m−phenylene isophthalamide) precursor. Fibers Polym. 2015, 16, 1629–1645. [Google Scholar] [CrossRef]
- Shen, Q.; Huang, R.; Xu, Z.; Hua, W. Numerical 3D Modeling: Microwave Plasma Torch at Intermediate Pressure. Appl. Sci. 2020, 10, 5393. [Google Scholar] [CrossRef]
- Wei, X.; Zhang, W.; Chen, L.; Xia, X.; Meng, Y.; Liu, C.; Lin, Q.; Jiang, Y.; Gao, S. Evaluation of graphitization and tensile property in microwave plasma treated carbon fiber. Diam. Relat. Mater. 2022, 126, 109094. [Google Scholar] [CrossRef]
- Okuda, H.; Young, R.J.; Wolverson, D.; Tanaka, F.; Yamamoto, G.; Okabe, T. Investigating nanostructures in carbon fibers using Raman spectroscopy. Carbon 2018, 130, 178–184. [Google Scholar] [CrossRef]
Figure 1.
Schematic diagram of post−treatment processes.

Figure 2.
Schematic diagram of the microwave plasma setup (a) and two−dimensional geometry of the setup in COMSOL™ Multiphysics (b).
Figure 2.
Schematic diagram of the microwave plasma setup (a) and two−dimensional geometry of the setup in COMSOL™ Multiphysics (b).

Figure 3.
FT−IR spectra of AOA S−1, PS−1 (pentane), and PS−1 (heptane) (a), Raman spectra of S−1 and PS−1 (b), X−ray powder diffraction patterns of S−1, PS−1, and coke from S−1 (c), MALDI spectra of S−1 (lower) and PS−1 (upper) (d), TGA plot of PS−1 in air (e), and TGA/DSC/DTG curves of PS−1 in nitrogen (f).

Figure 4.
The viscosity of PS−1 (a), PS−1 with 5% PS (b), 10% PS (c), 5% SBS (d), and 10% SBS (e) at different temperatures, and the viscosity versus temperature data as a function of shear rates (f).
Figure 4.
The viscosity of PS−1 (a), PS−1 with 5% PS (b), 10% PS (c), 5% SBS (d), and 10% SBS (e) at different temperatures, and the viscosity versus temperature data as a function of shear rates (f).

Figure 5.
Picture of the spun fibers, (a) and SEM image of the as−spun fibers (b), conventionally stabilized fibers (c), and conventionally carbonized fibers (d).
Figure 5.
Picture of the spun fibers, (a) and SEM image of the as−spun fibers (b), conventionally stabilized fibers (c), and conventionally carbonized fibers (d).

Figure 6.
XRD patterns (a) and Raman spectra (b) of the as−spun fibers, conventionally stabilized fibers, and carbonized fibers.
Figure 6.
XRD patterns (a) and Raman spectra (b) of the as−spun fibers, conventionally stabilized fibers, and carbonized fibers.

Figure 7.
SEM images of conventionally stabilized fibers (a) and microwave plasma−treated fibers (b).
Figure 7.
SEM images of conventionally stabilized fibers (a) and microwave plasma−treated fibers (b).

Figure 8.
SEM images of the microwave plasma−treated carbonized fiber for 5 min (a), 7 min (b), and 9 min (c).
Figure 8.
SEM images of the microwave plasma−treated carbonized fiber for 5 min (a), 7 min (b), and 9 min (c).

Figure 9.
XRD pattern (a) and Raman spectra (b) of carbon fibers before and after microwave plasma treatment for various durations.
Figure 9.
XRD pattern (a) and Raman spectra (b) of carbon fibers before and after microwave plasma treatment for various durations.

Figure 10.
Mechanical properties of AOA carbon fibers through the use of conventional methods and microwave plasma.
Figure 10.
Mechanical properties of AOA carbon fibers through the use of conventional methods and microwave plasma.

Figure 11.
Electric field norm in the cavity at 10−6 s (a) and the contour temperature plot of the plasma temperature in the quartz tube at 10−6 s (b).
Figure 11.
Electric field norm in the cavity at 10−6 s (a) and the contour temperature plot of the plasma temperature in the quartz tube at 10−6 s (b).


Table 1.
Governing equations used in the microwave plasma simulation [33].
Table 1.
Governing equations used in the microwave plasma simulation [33].
| Component | Equation |
|---|---|
| Electromagnetic Wave | , |
| Plasma Physics | |
| Fluid Equation | |
| Heat Transfer equation |
Table 2.
Element analysis of AOA before and after pre−treatment.
| Sample | Weight (mg) | H/C | C (wt%) | H (wt%) | N (wt%) | S (wt%) | O (wt%) |
|---|---|---|---|---|---|---|---|
| S−1 | 1.53 | 0.100908 | 79.00 | 7.97 | 1.11 | 7.75 | 4.16 |
| PS−1 (Pentane) | 1.50 | 0.097943 | 80.73 | 7.90 | 1.20 | 7.94 | 2.20 |
| PS−1 (Heptane) | 2.57 | 0.101729 | 80.15 | 8.15 | 1.11 | 7.53 | 3.06 |
Table 3.
Crystalline parameters of the carbon fibers prepared from different post treatments.
| Sample | d (nm) | Lc (nm) | La (nm) |
|---|---|---|---|
| ACF−C | 0.369 | 2.510 | 5.189 |
| MPT−5 | 0.369 | 3.720 | 7.691 |
| MPT−7 | 0.363 | 4.692 | 9.700 |
| MPT−9 | 0.360 | 5.124 | 10.593 |
Table 4.
Element analysis of AOAs before and after post−treatment.
| Sample | Weight (mg) | H/C | C (wt%) | H (wt%) | N (wt%) | S (wt%) | O (wt%) |
|---|---|---|---|---|---|---|---|
| PS−1 (pentane) | 1.50 | 0.097943 | 80.73 | 7.90 | 1.20 | 7.94 | 2.20 |
| Stabilized Fibers | 2.21 | 0.081103 | 74.10 | 6.01 | 1.11 | 7.02 | 11.77 |
| ACF | 1.88 | 0.003540 | 87.58 | 0.31 | 0.38 | 5.56 | 5.88 |
| MPT | 1.82 | 0.000442 | 90.44 | 0.04 | 0.56 | 4.95 | 4.06 |
Table 5.
Element analysis of AOA before and after microwave plasma treatment.
| Sample | Weight (mg) | H/C | C (wt%) | H (wt%) | N (wt%) | S (wt%) | O (wt%) |
|---|---|---|---|---|---|---|---|
| ACF | 1.88 | 0.003540 | 87.58 | 0.31 | 0.38 | 5.56 | 5.88 |
| MPT−5 | 1.76 | 0.000555 | 90.14 | 0.05 | 0.55 | 5.24 | 4.02 |
| MPT−7 | 1.95 | 0.000441 | 90.77 | 0.04 | 0.53 | 5.11 | 3.55 |
| MPT−9 | 2.02 | 0.000436 | 91.84 | 0.04 | 0.38 | 4.82 | 2.92 |
Disclaimer/Publisher’s Note: The statements, opinions and data contained in all publications are solely those of the individual author(s) and contributor(s) and not of MDPI and/or the editor(s). MDPI and/or the editor(s) disclaim responsibility for any injury to people or property resulting from any ideas, methods, instructions or products referred to in the content. |
© 2023 by the authors. Licensee MDPI, Basel, Switzerland. This article is an open access article distributed under the terms and conditions of the Creative Commons Attribution (CC BY) license (https://creativecommons.org/licenses/by/4.0/).
Share and Cite
MDPI and ACS Style
Ge, L.; Chandra, S.; Zafar, T.; Park, S.S. Manufacturing Carbon Fiber Using Alberta Oilsands Asphaltene with Microwave Plasma Assistance. C 2024, 10, 1. https://doi.org/10.3390/c10010001
AMA Style
Ge L, Chandra S, Zafar T, Park SS. Manufacturing Carbon Fiber Using Alberta Oilsands Asphaltene with Microwave Plasma Assistance. C. 2024; 10(1):1. https://doi.org/10.3390/c10010001
Chicago/Turabian StyleGe, Lin, Sharath Chandra, Talha Zafar, and Simon S. Park. 2024. "Manufacturing Carbon Fiber Using Alberta Oilsands Asphaltene with Microwave Plasma Assistance" C 10, no. 1: 1. https://doi.org/10.3390/c10010001
Note that from the first issue of 2016, this journal uses article numbers instead of page numbers. See further details here.