
Parameter Optimization of Friction Pendulum Bearings Based on the Adaptive Genetic Algorithm Considering the Overall Evolutionary Status
China Construction 8th Engineering Bureau, Shanghai 200120, China
*
Author to whom correspondence should be addressed.
Buildings 2024, 14(2), 435; https://doi.org/10.3390/buildings14020435
Submission received: 25 December 2023
/
Revised: 30 January 2024
/
Accepted: 4 February 2024
/
Published: 5 February 2024
(This article belongs to the Special Issue Achieving Resilience and Other Challenges in Earthquake Engineering)
Abstract
:Improper design of friction pendulum bearings can lead to poor seismic reduction performance and may result in the failure of local vulnerable components. And the parameter design of friction pendulum bearings mainly relies on experience and verification calculations at present. This paper proposes an adaptive genetic algorithm considering the overall evolution state of the population, adjusting crossover and mutation probabilities adaptively based on individual fitness and population diversity. Compared to traditional algorithms, it exhibits better global search capabilities and convergence efficiency. Combining the improved genetic algorithm with finite element models, a parameter optimization method is proposed. The parameters of friction pendulum bearings are optimized. In response to the situation in this paper, the optimal friction coefficient of the friction pendulum bearing is determined to be 0.01 and the optimal equivalent radius is 3.3 m. This can provide a reference for the design of seismic isolation devices.
1. Introduction
After the COVID-19 pandemic, the growth of the global urban population is returning to a positive trajectory, with an estimated addition of 2.2 billion urban residents by 2050. Mega-cities such as Tokyo, Shanghai, and Mexico City, with populations exceeding ten million, are facing challenges like land resource constraints and traffic congestion [1,2]. Global urban development experiences indicate that scientific development and utilization of urban underground space are essential pathways to improve living spaces in cities and transform urban development patterns [3,4]. However, in some countries, the development and utilization of underground space face the threat of seismic disasters. Taking China as an example, it is located between the Pacific seismic zone and the Eurasian seismic zone, making it the world’s largest region with intense seismic activity originating from shallow sources. The frequency, intensity, and widespread distribution of seismic activity in this region are high. In recent years, the concept of seismic reduction has gradually been applied in underground structures. By reducing the seismic response of underground structures, their seismic resistance can be effectively improved. The common method for seismic reduction in underground structures is to install seismic isolation devices at vulnerable components in the structure. These seismic isolation devices can reduce the seismic damage of the critical components. Therefore, the main structures can avoid overall instability and failure.
Commonly used seismic isolation devices for underground structures include shear panel dampers [5], lead core rubber bearings [6], friction pendulum bearings [7], and column end sliding bearings [8].
When enhancing the seismic resistance of underground structures using seismic isolation devices, improper design of these devices may reduce the seismic reduction effectiveness and could potentially lead to the damage of local vulnerable components [9]. At present, the parameter design of these seismic isolation devices mainly relies on experience and verification calculations. In the optimization design of seismic isolation devices, qualitative analysis methods are predominantly employed, resulting in low optimization precision [10]. With the development of computer technology, various intelligent algorithms to optimize complex nonlinear problems have been introduced. Researchers have gradually applied these algorithms in the field of engineering. Di Trapani et al. implemented the calculation of section forces for a three-dimensional reinforced concrete frame structure within OpenSees. They utilized a genetic algorithm to optimize the location and quantity of steel jacketing, effectively enhancing the seismic resistance and deformability of reinforced concrete structures under earthquake effects [11]. Bekdas et al. proposed a method utilizing the bat algorithm to optimize parameters of tuned mass dampers. This approach was applied to optimize design variables such as the mass, period, and damping ratio of tuned mass dampers [12].
Genetic algorithms treat each feasible solution as an individual in the population. By simulating the biological evolution process in nature, genetic operations such as crossover, recombination, and mutation are applied to individuals. This process retains superior individuals while eliminating inferior ones, gradually guiding the population toward the global optimum, ultimately obtaining the global optimal solution [13]. The genetic algorithm exhibits weak correlation with the initial population settings. It possesses strong robustness, and can find the global optimal solution for optimization problems. This paper proposes an improvement to the traditional genetic algorithm and combines the enhanced algorithm with the finite element calculation method to introduce a parameter optimization method. Taking the friction pendulum bearing as an example, the paper optimizes the parameters of seismic isolation devices.
2. Influence of Cross Probability and Mutation Probability on Genetic Algorithm
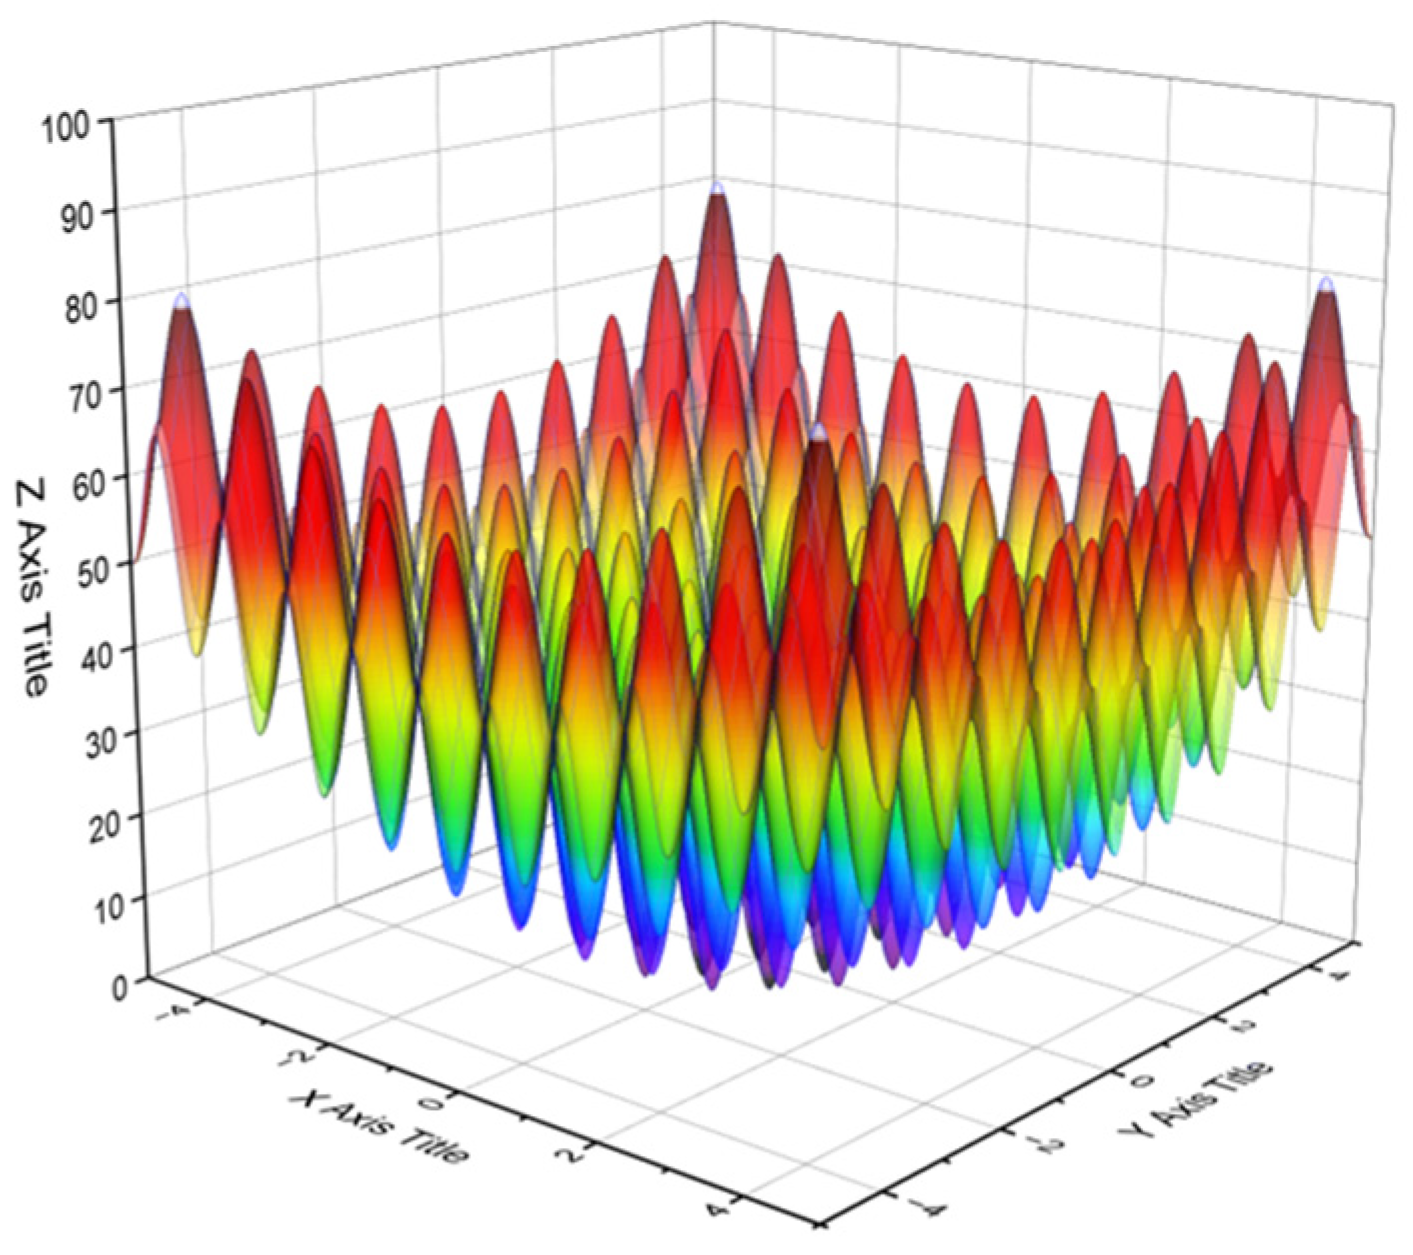
Genetic algorithms require repeated crossover and mutation operations on individual genes during the optimization process. The algorithm controls these operations through the crossover probability (Pc) and mutation probability (Pm). Pc and Pm are key parameters in genetic algorithms. In traditional genetic algorithms, the values of Pc and Pm are fixed. To investigate the specific impact of Pc and Pm on the optimization process of genetic algorithms, the Rastrigin function was chosen to test the optimization efficiency and global search capability under different parameter settings. The Rastrigin function is a highly multimodal function [14], and its expression is as follows:
The diagram of the Rastrigin function is shown in Figure 1. The function has a minimum value of 0 when x = 0 and y = 0. As seen in the figure, the function has numerous local optima to challenge the global optimization capability of the algorithm.
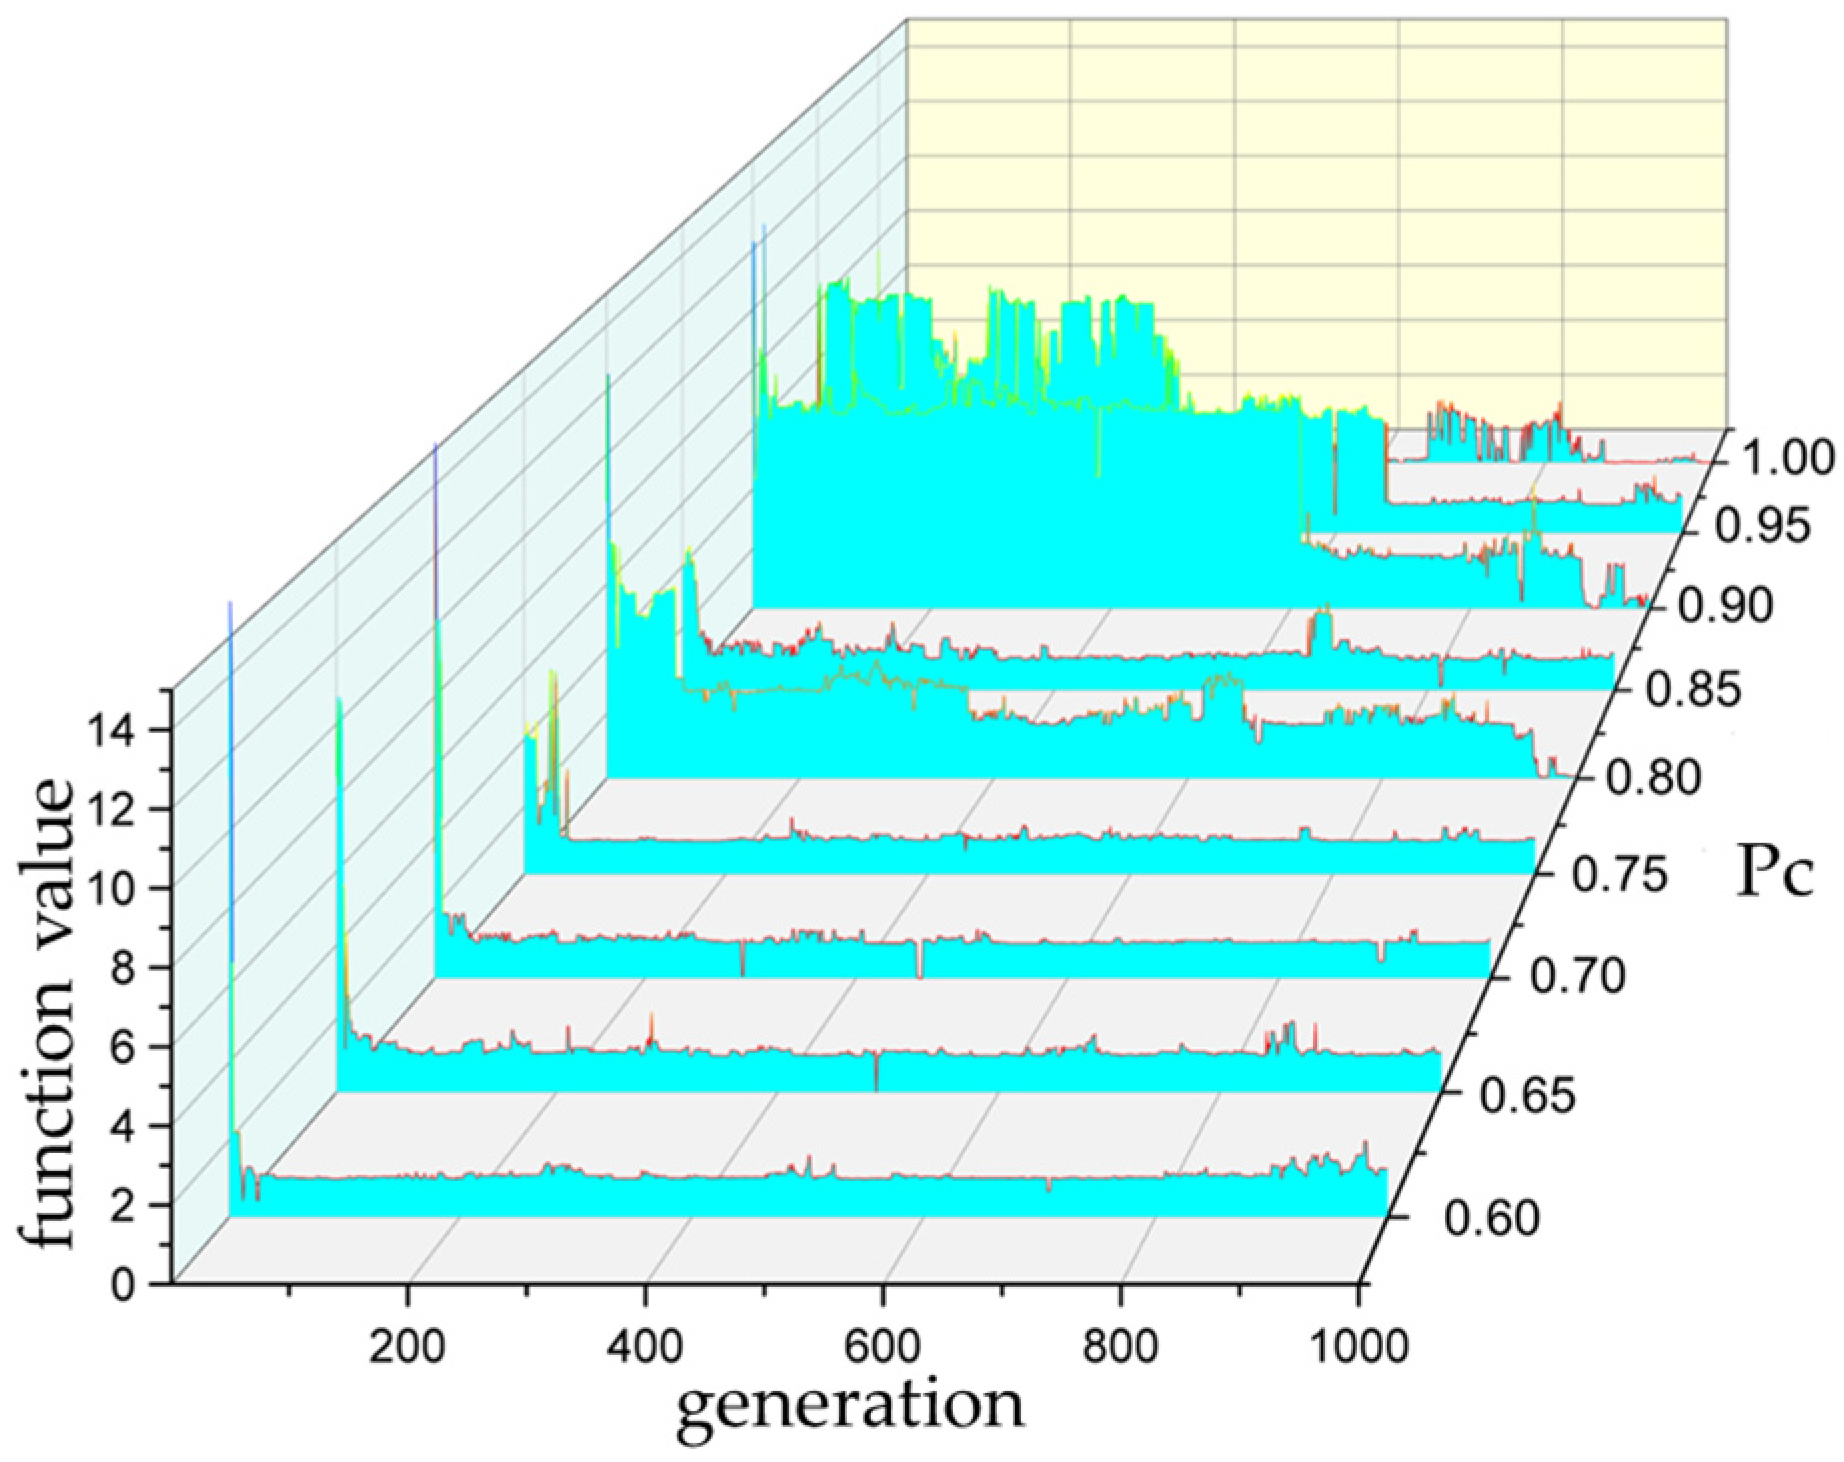
The initial population size for the genetic algorithm is set to 50, the chromosome length is 24, the number of generations is 1000, the Pc varies from 0.6 to 1.0, and the Pm ranges from 0 to 0.4. When the Pm is 0.2, the optimization process of the genetic algorithm with different Pcs is illustrated in Figure 2.
It can be observed from the figure that when the Pc is low, the genetic algorithm converges quickly, and the search process is stable, but it is prone to a local optimum, known as premature convergence. However, when the Pc is high, the stability of the genetic algorithm decreases, leading to a reduction in search efficiency.
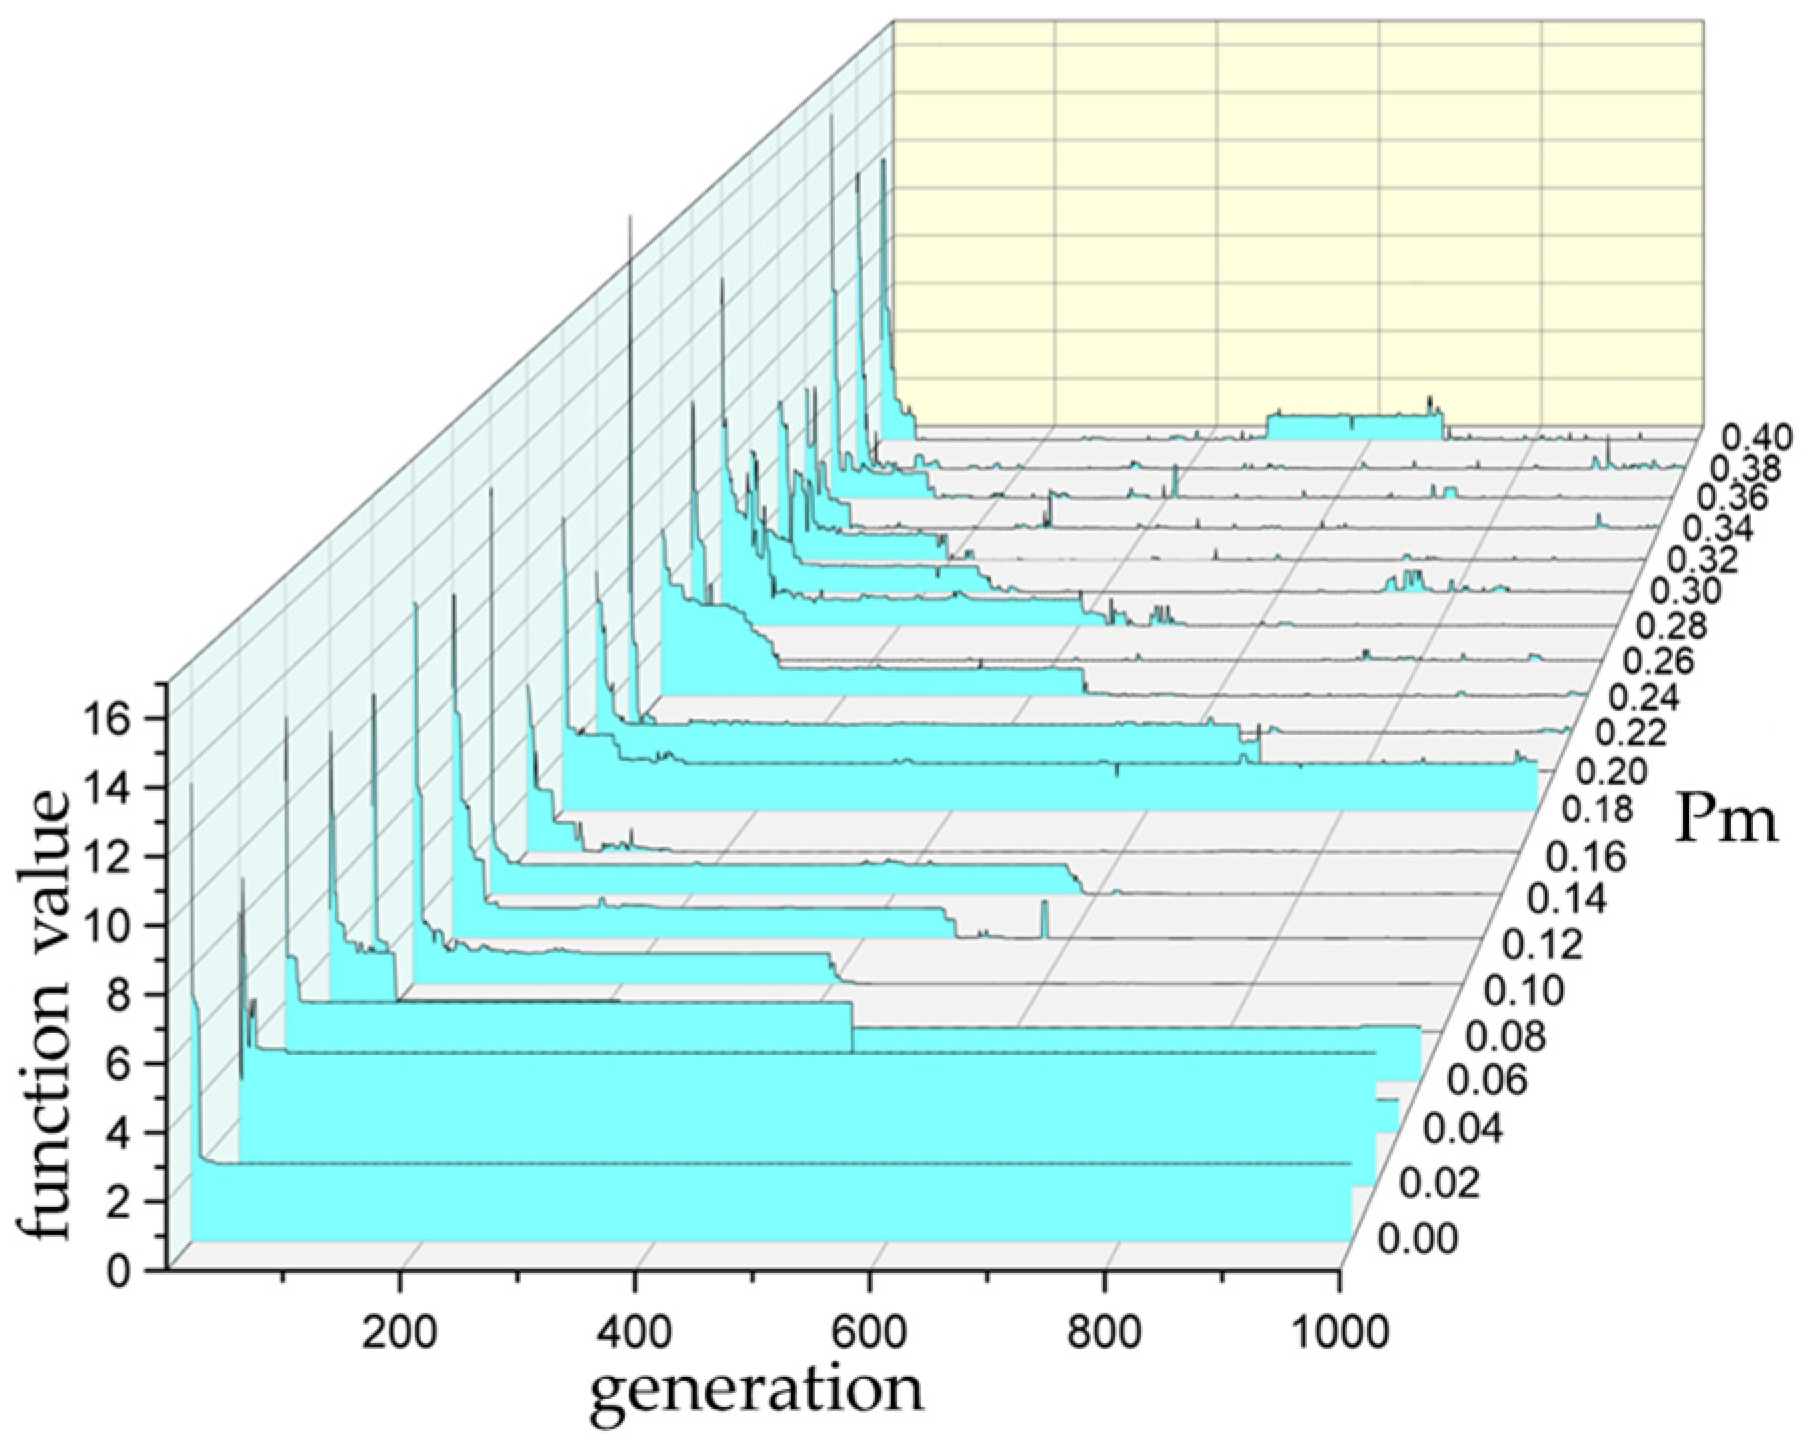
When the Pc is 0.8, the optimization process of the genetic algorithm with different Pms is illustrated in Figure 3.
It can be observed from the figure that as the Pm increases, the global search capability of the genetic algorithm enhances, making it easier to escape the local optimum traps of the Rastrigin function. However, with the increase in the Pm, the search becomes unstable, evolving toward deteriorating individuals from the global optimum.
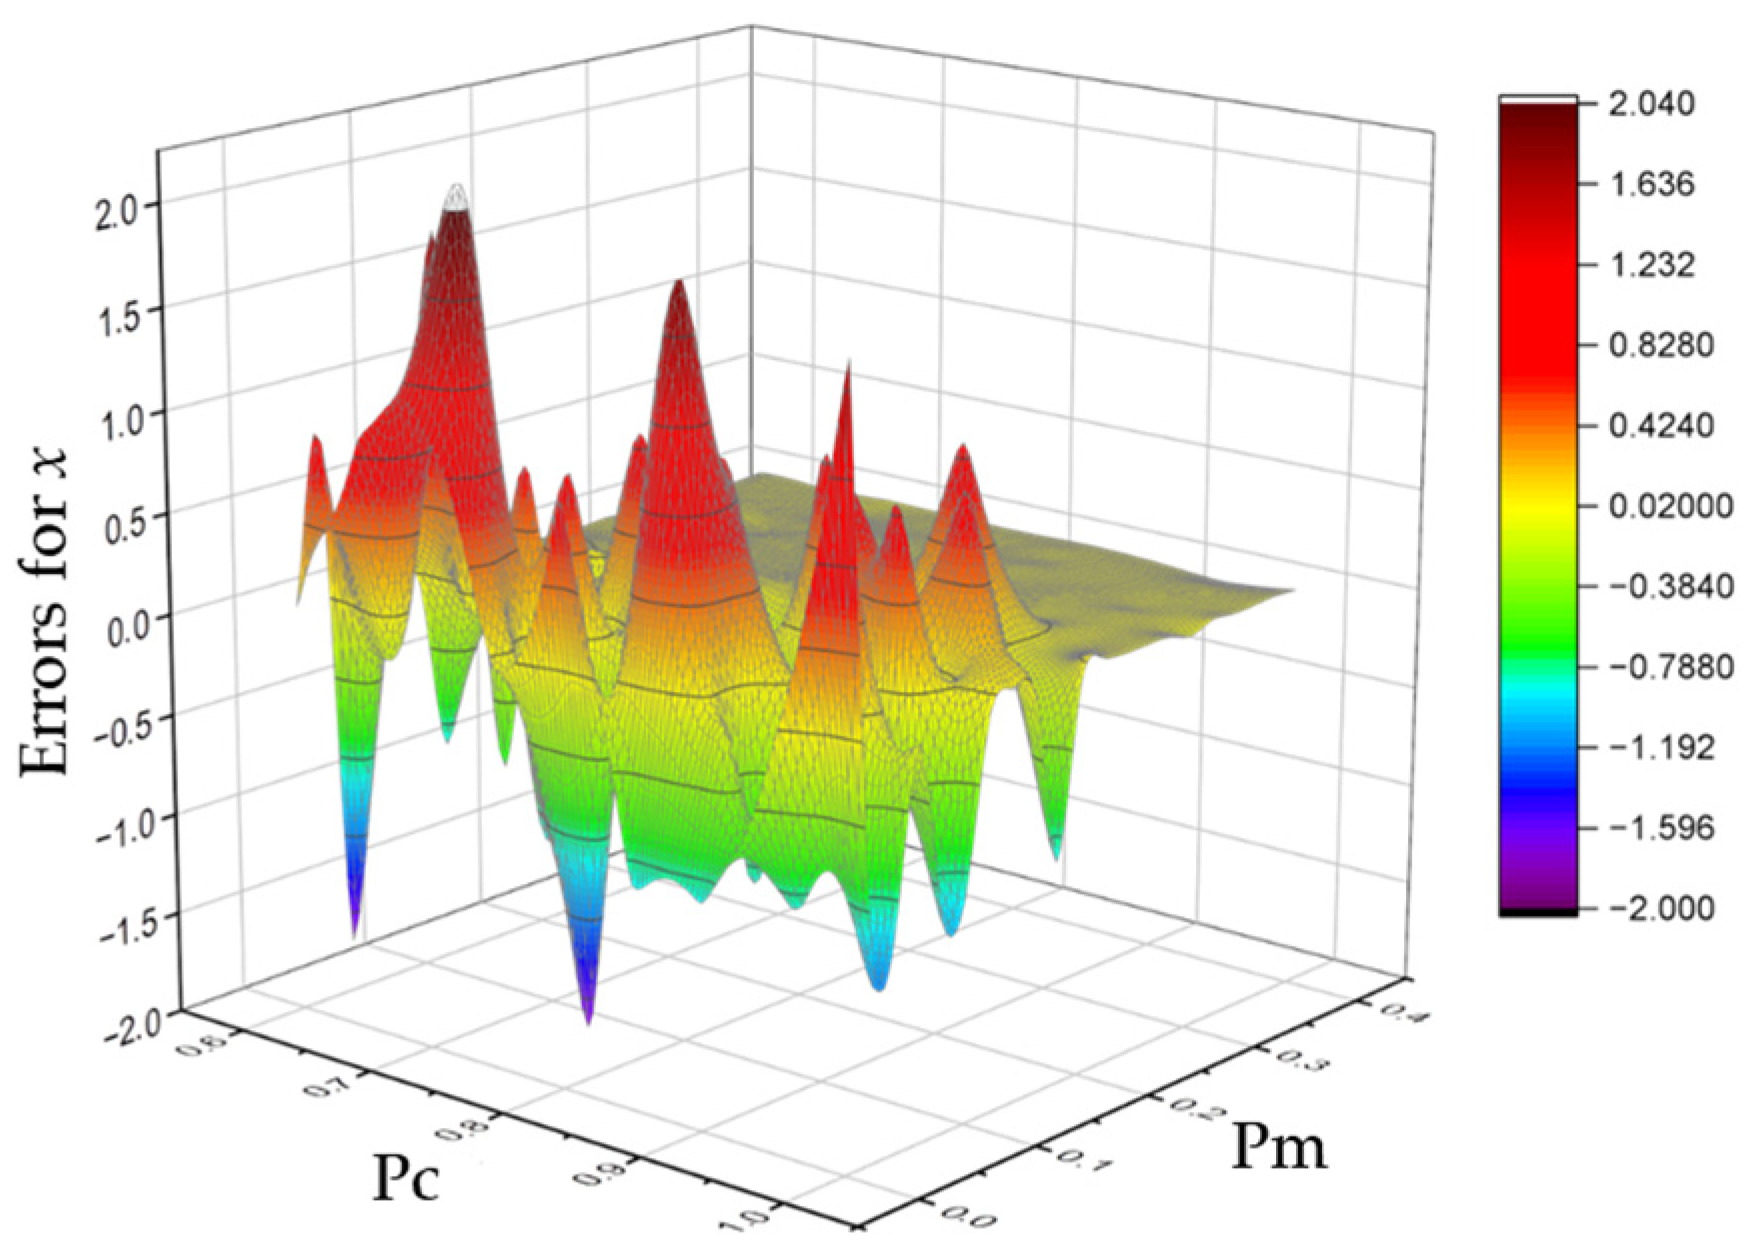
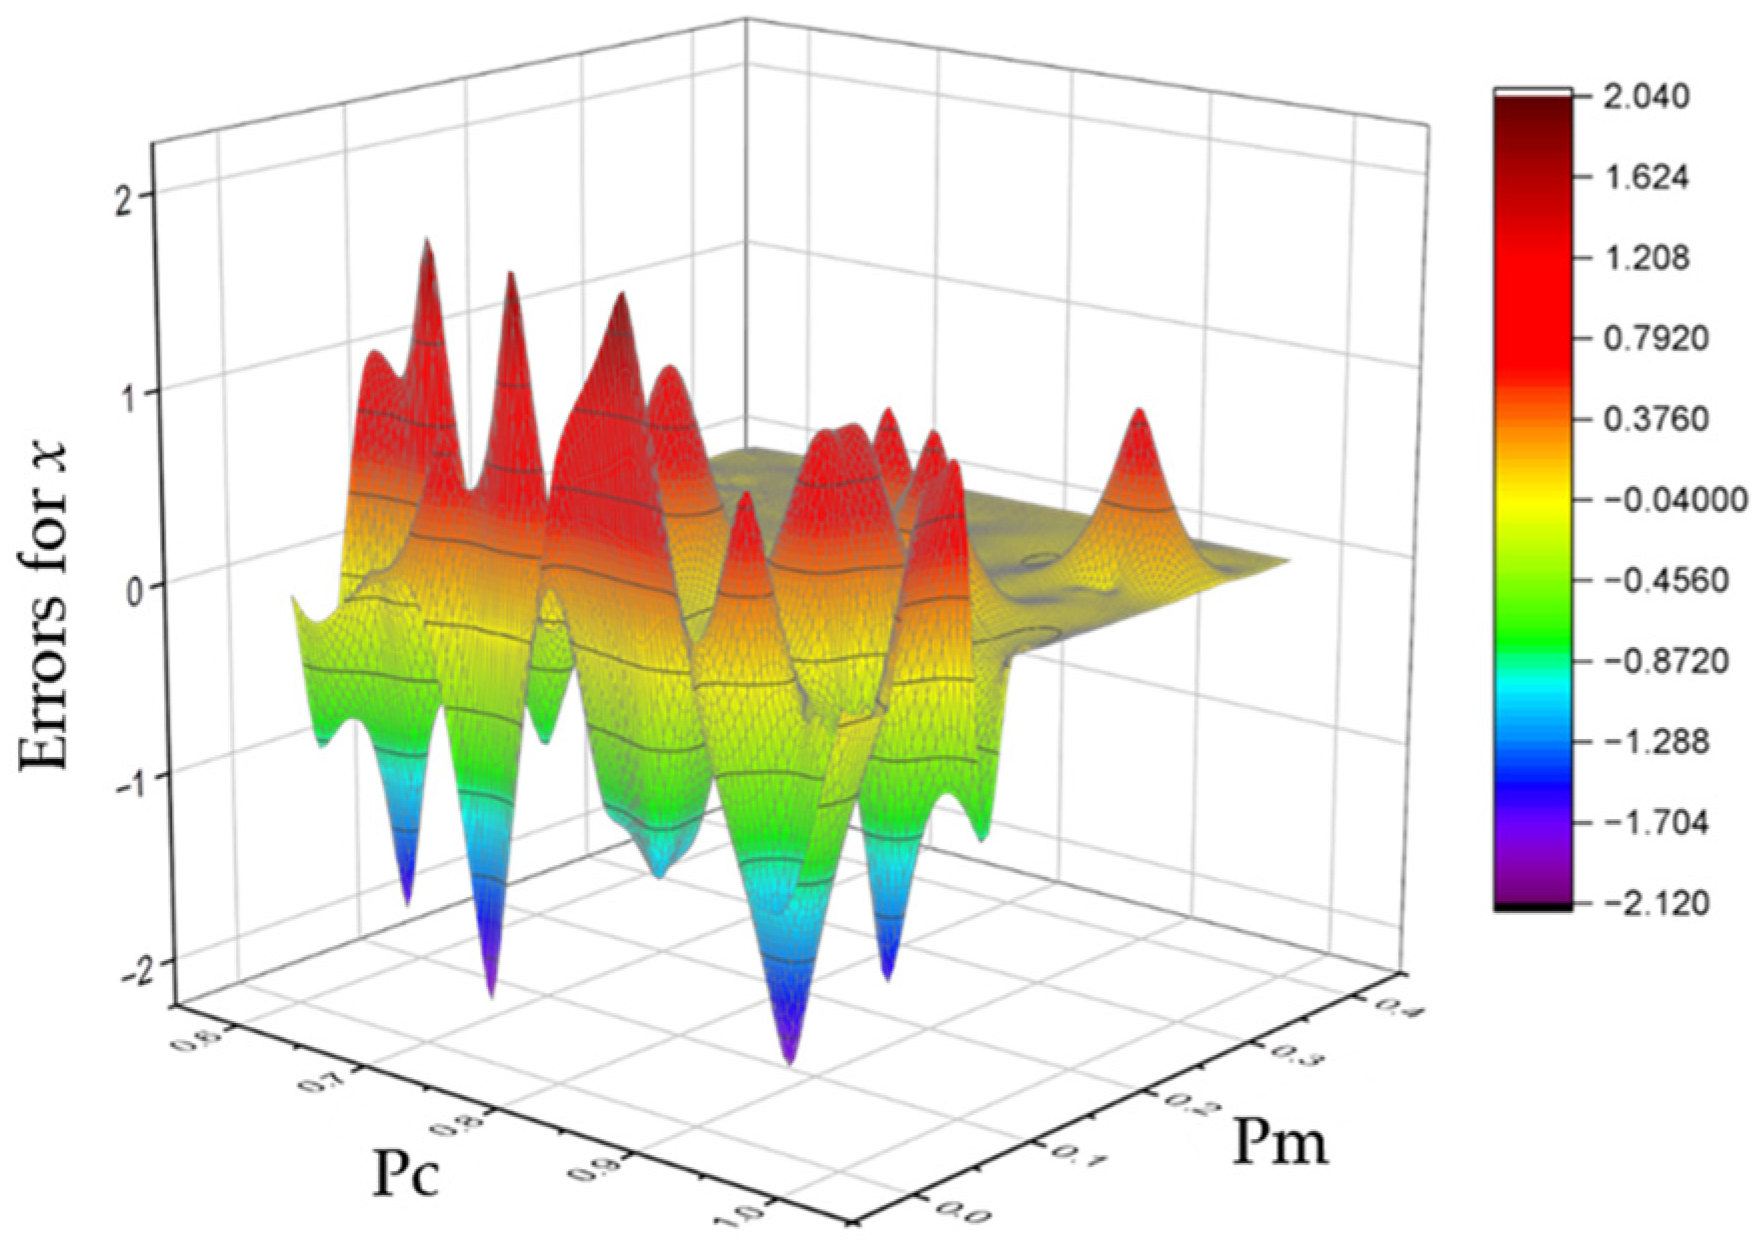
The orthogonal analysis of the Pc and Pm of the genetic algorithm was conducted. The errors in the optimal values for x and y after optimization are illustrated in Figure 4 and Figure 5, respectively.
According to the optimization results of the genetic algorithm, it can be observed that when the Pc and Pm are too small, the optimization tends to converge to a local optimum. However, when the Pc and Pm are too large, the population may evolve in a direction far from the optimal solution, making it difficult to converge. The values of the Pc and Pm are crucial for the optimization process of the genetic algorithm.
3. Adaptive Genetic Algorithm Considering the Overall Evolutionary Status
3.1. Adaptive Genetic Algorithm
In traditional genetic algorithms, the values of crossover probability and mutation probability are fixed. Recognizing that fixed Pc and Pm values may not meet the requirements of complex optimization problems, Srinivas et al. introduced an adaptive genetic algorithm wherein the Pc and Pm are dynamically adjusted during the algorithm execution. The Pc and Pm of the algorithm are automatically adjusted based on the fitness of the population’s individuals [15]. This method is recorded as AGA-1. When an individual has good fitness, the adaptive genetic algorithm lowers the individual’s Pc and Pm to prevent disruption of excellent genes. Conversely, for individuals with poor fitness, larger Pcs and Pms are used to enhance the global search capabilities of the algorithm. Building upon this concept, various adaptive genetic algorithms have been developed [16,17,18,19]. Yan et al. proposed a bilinear adjustment model for crossover and mutation probabilities [18]. This method is recorded as AGA-2. Wang introduced a nonlinear adaptive model [19]. This method is recorded as AGA-3. These adaptive genetic algorithms primarily use individual fitness as the basis for adjusting Pc and Pm, overlooking the impact of population evolutionary status on algorithm efficiency.
3.2. Genetic Algorithm Considering Population Diversity
Population diversity refers to the distribution state of individuals in the feasible space. When the population diversity is high, individuals are dispersed in space. When the population diversity is low, individuals in the population are similar, and the search is concentrated in a small area. As genetic optimization progresses, the number of similar individuals increases. Population diversity gradually decreases, and global search capability weakens accordingly. Population diversity can reflect the evolutionary status of a genetic algorithm. Increasing the Pc and Pm when diversity decreases can effectively enhance the global search capability of the algorithm.
Population diversity has been assessed using various metrics. Currently, commonly used indicators include population fitness standard deviation, individual Hamming distance, and population entropy. Hamming distance is typically applicable only to genes encoded in binary, limiting its use. Population entropy requires clustering analysis and may not accurately represent population diversity in a timely manner. Population fitness standard deviation has become a widely adopted and effective evaluation metric. A larger fitness standard deviation indicates higher dispersion of the population in the feasible space, reflecting greater population diversity.
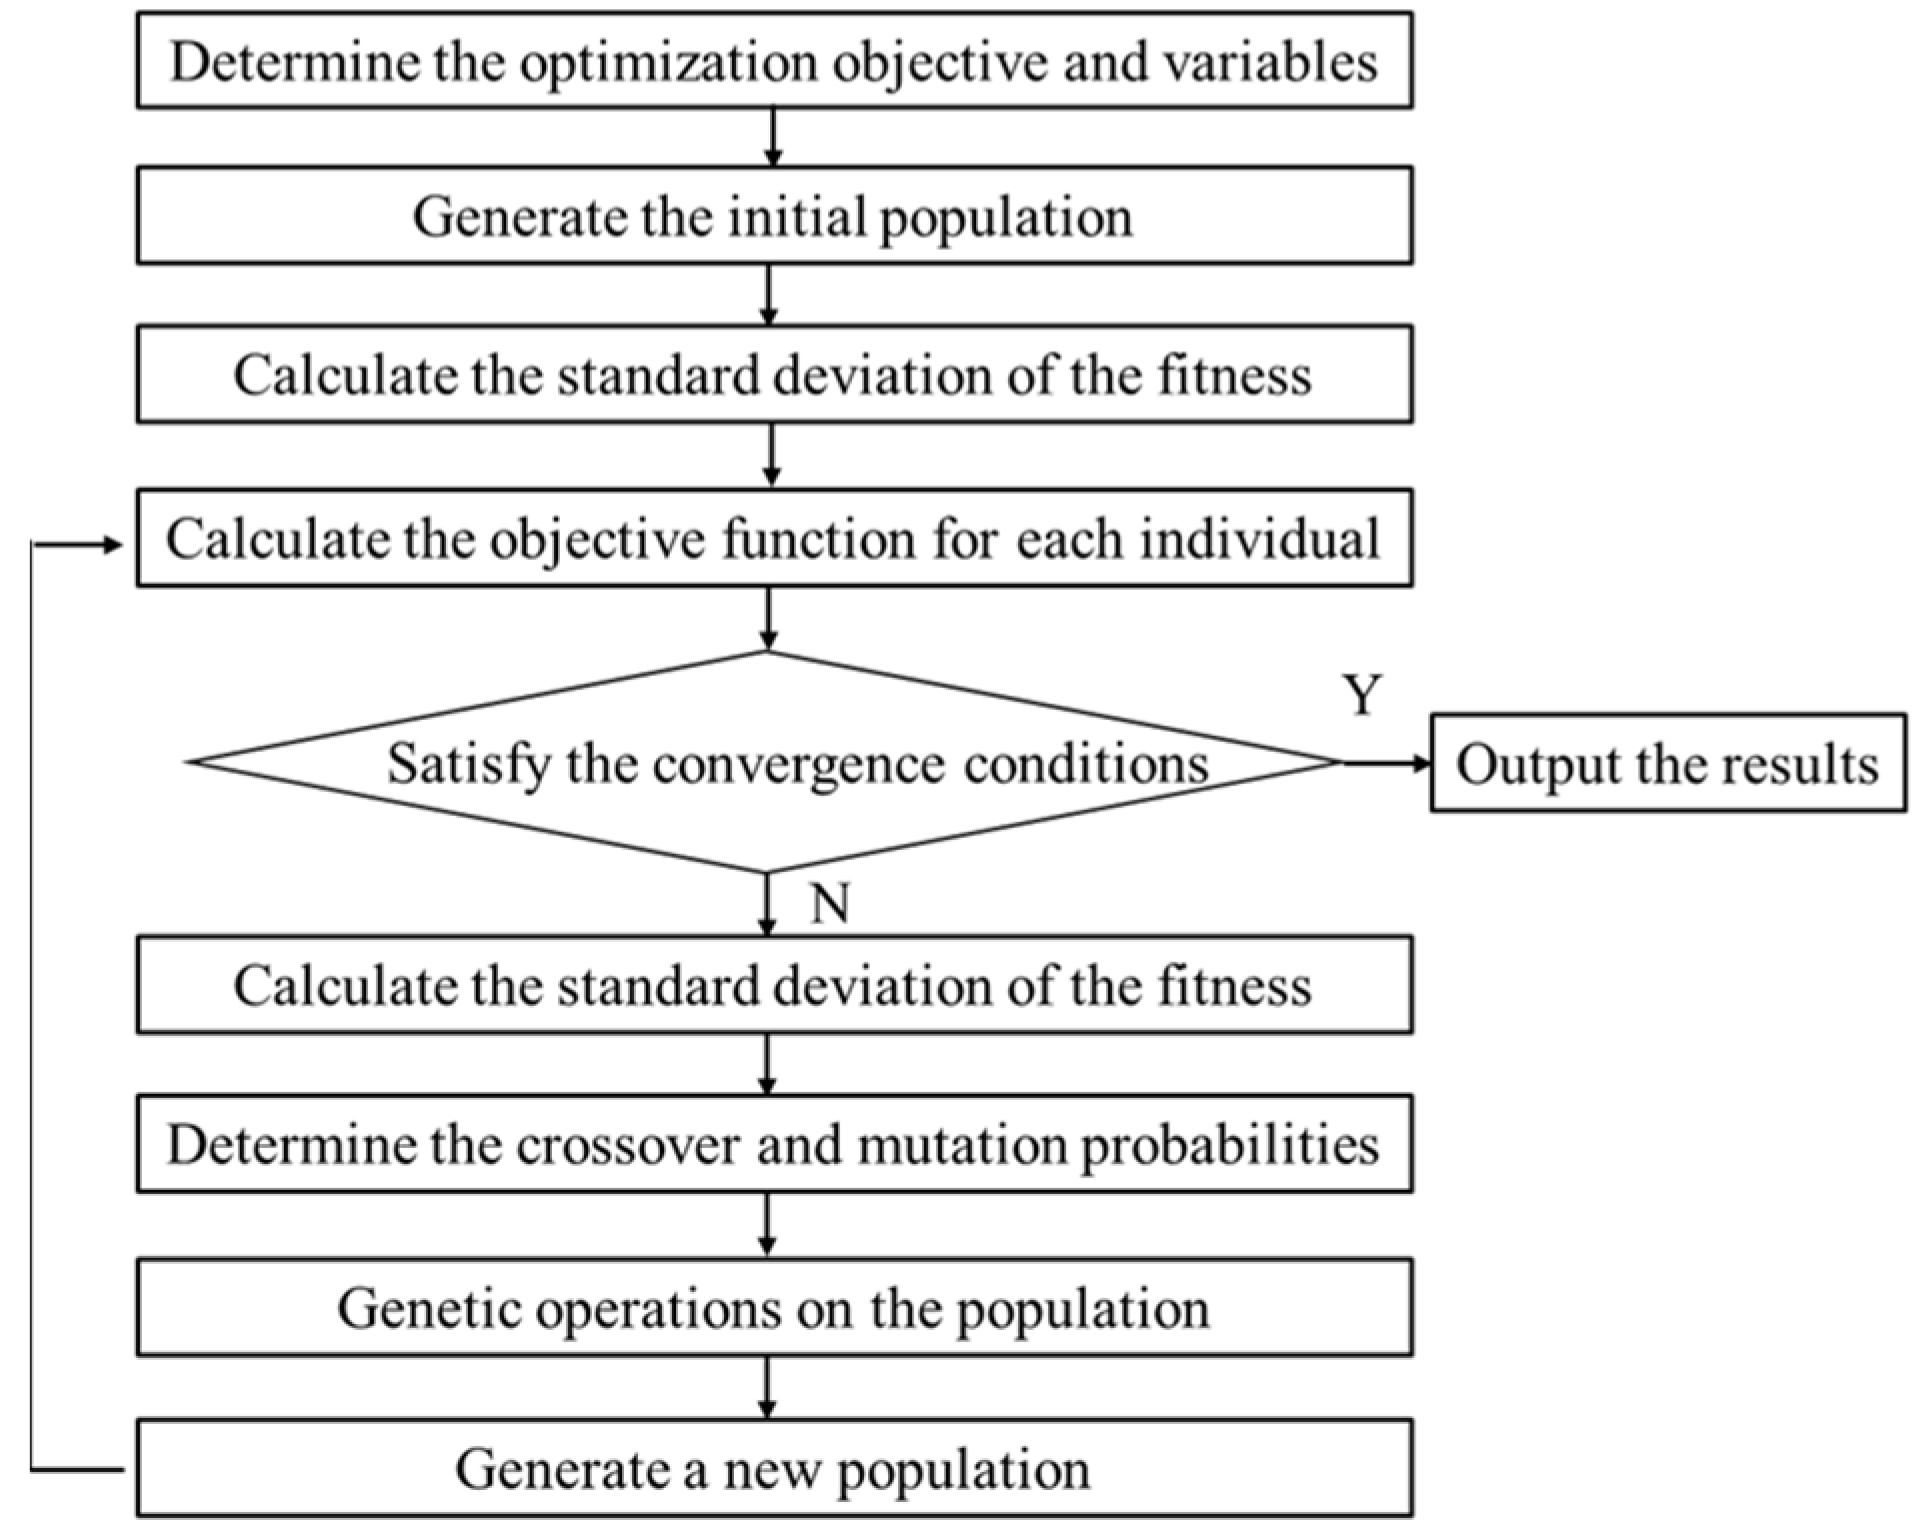
This paper proposed an adaptive genetic algorithm that simultaneously considers individual fitness and population diversity. The Pc and Pm for inferior individuals should be increased when the population diversity is low to enhance the search capability. Conversely, when the population diversity is high, the Pc and Pm for superior individuals should be decreased to ensure the preservation of their excellent genetics. The formulas for calculating the Pc and Pm are as follows:
where is the maximum fitness of individuals in the population, is the average fitness of individuals in the population, is the fitness of the individual with higher fitness in the parent individuals, is the fitness of the individual entering the mutation operator, is the fitness standard deviation of the current population, is the initial fitness standard deviation, , , , , , , , and are the control parameters for the cross probability and mutation probability in the adaptive genetic algorithm, , and , with all values in the range [0, 1]. The adaptive genetic algorithm considering population diversity is illustrated in Figure 6.
3.3. Validation of the Efficiency of the Improved Genetic Algorithm
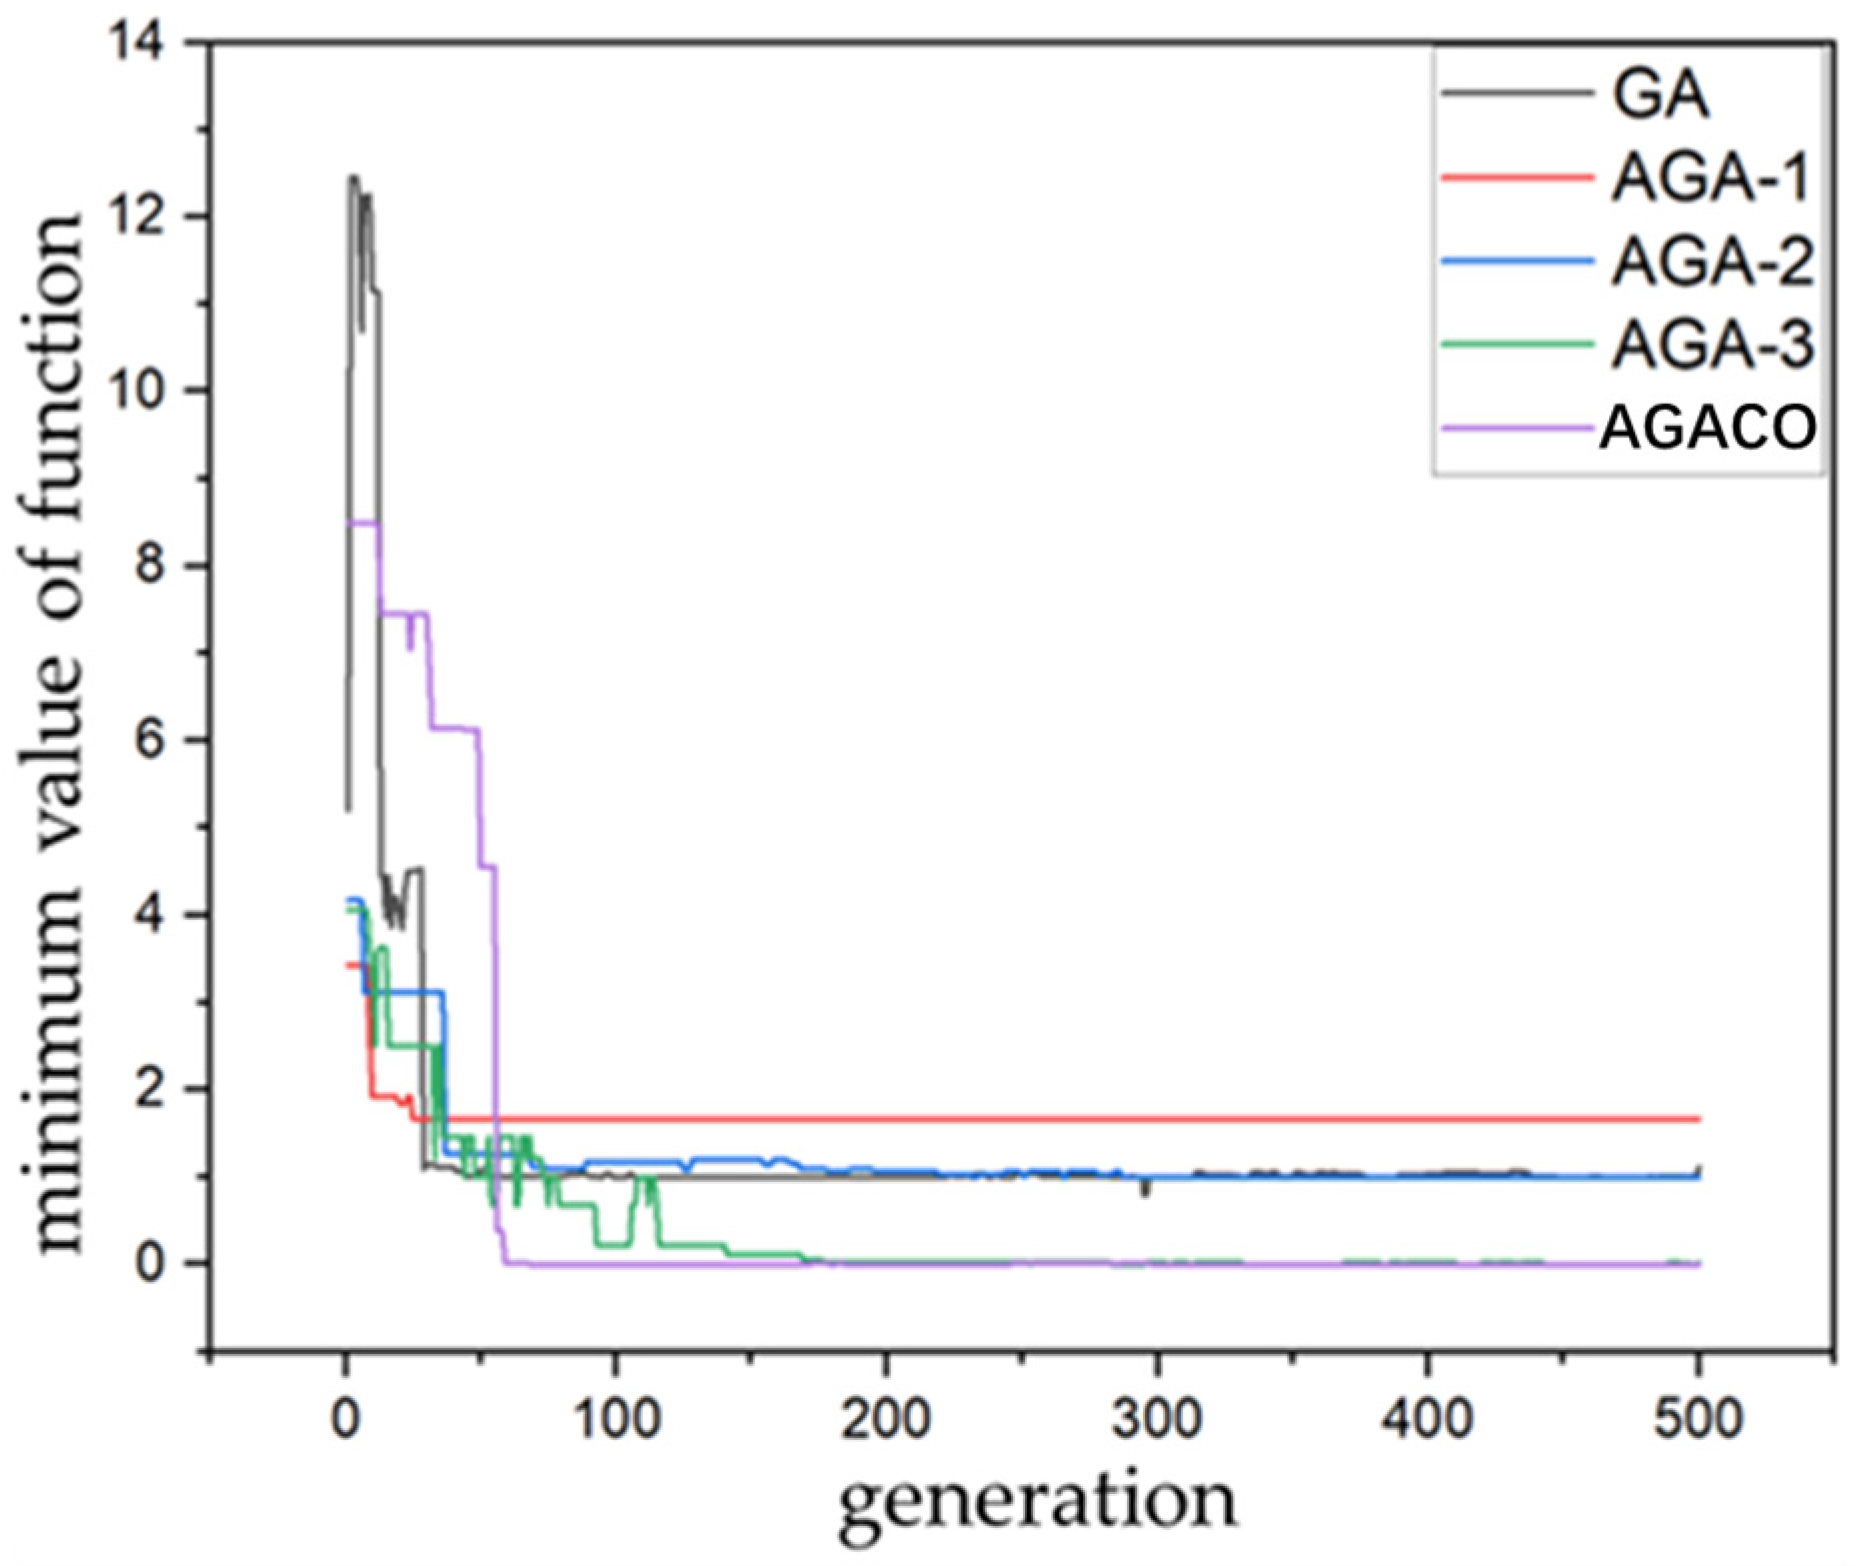
The traditional genetic algorithm is denoted as GA, the basic adaptive genetic algorithm as AGA-1, the bilinear adaptive genetic algorithm as AGA-2, the nonlinear adaptive genetic algorithm as AGA-3, and the adaptive genetic algorithm considering the overall evolutionary status of the population as AGACO. The optimization capabilities of these five adaptive genetic algorithms are compared using the minimum value problem of the Rastrigin function. Previous studies have shown that the recommended value for mutation probability is between 0 and 0.3, and the recommended value for crossover probability is around 0.6 [20]. Here, , , , , , , , . For these genetic algorithms, the population size is uniformly set to 100, the chromosome length is 24, and the number of generations is 500. The process of finding the minimum value of the function using different genetic algorithms is shown in Figure 7.
It can be observed from the figure that GA, AGA-1, and AGA-2 converge to local optimal solutions without finding the global optimum. AGA-3 and AGACO find the global optimum. AGACO converges earlier than AGA-3, and AGA-3 has a final error of 0.02419, while AGACO has a final error of 0.00342. By comparing the five genetic algorithms, it can be concluded that the traditional genetic algorithm, due to its fixed Pc and Pm, is prone to premature convergence or the destruction of excellent genotypes in complex optimization problems. And adaptive genetic algorithms can reduce the destruction of excellent genotypes while enhancing global search efficiency. However, if only the individual fitness is considered and the overall evolutionary status is ignored, there is still a risk of getting stuck in local optima when population diversity decreases. The genetic algorithm that simultaneously considers population diversity and individual fitness can effectively improve convergence efficiency and avoid premature convergence.
4. Finite Element Numerical Simulation
4.1. Finite Element of the Underground Station
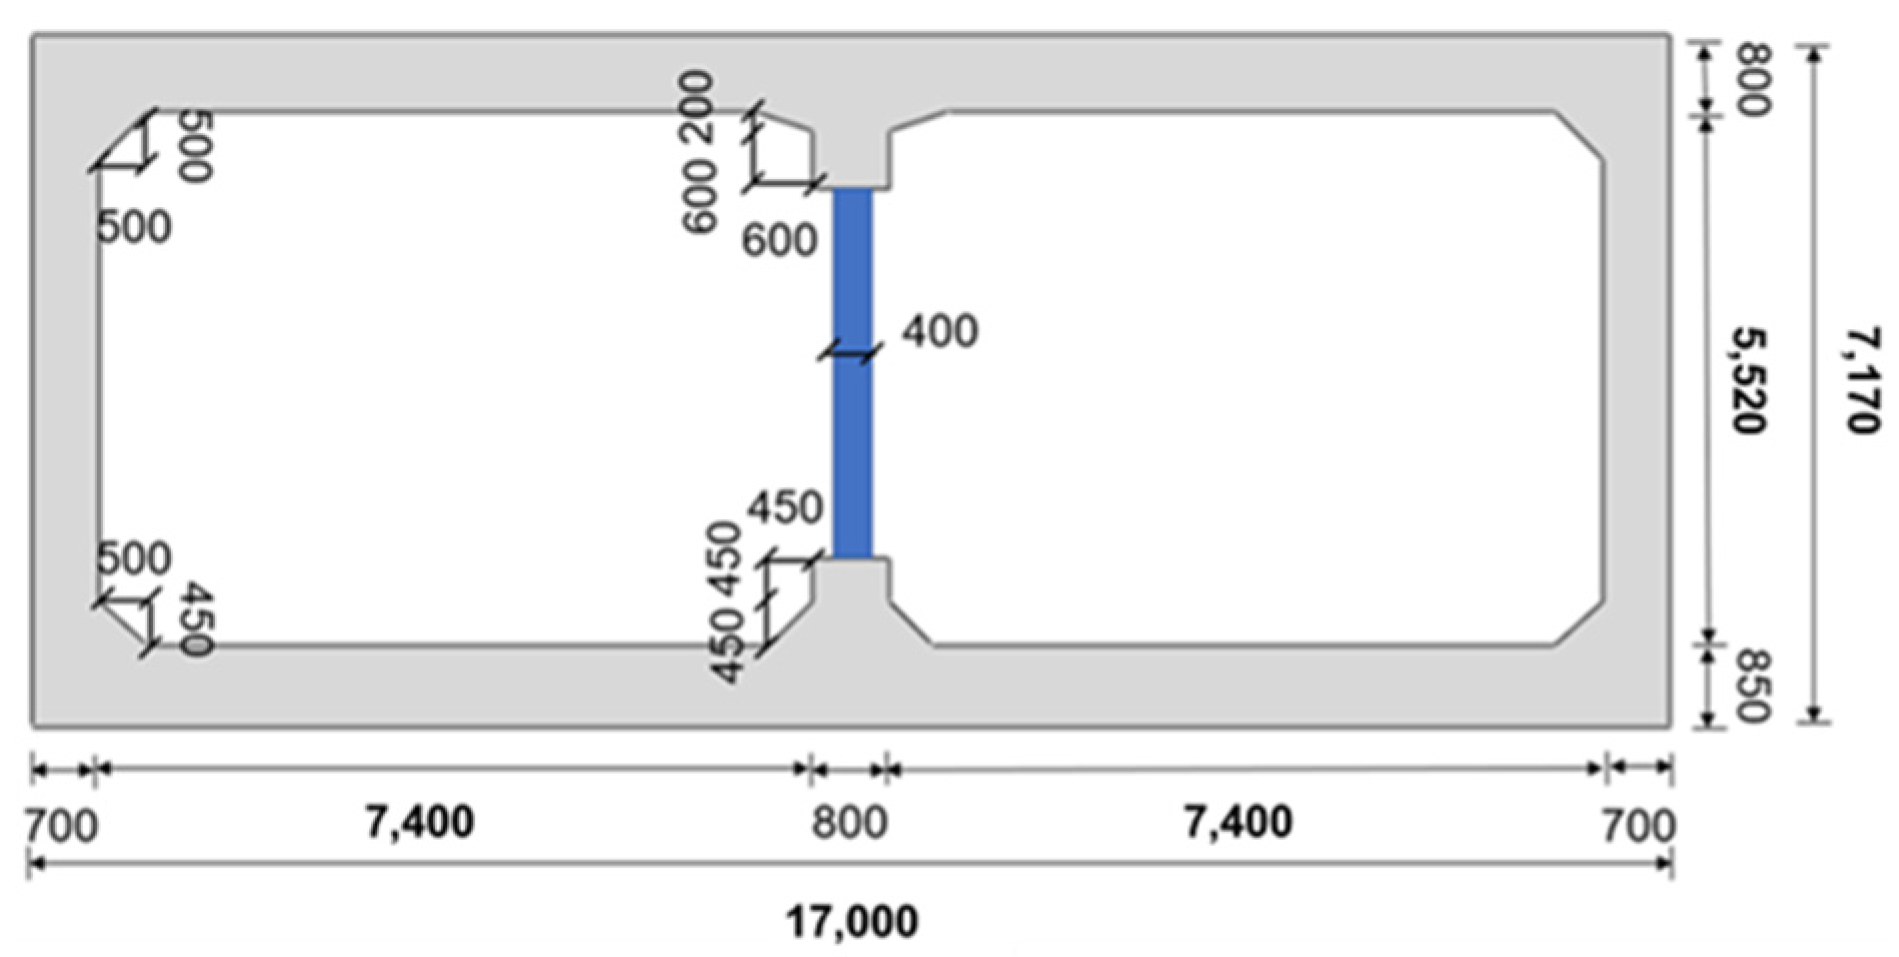
Daikai Station was chosen as the underground structure for the application of friction pendulum bearings. The cross-section of the station is illustrated in Figure 8, representing a two-span station on one level. The station has a width of 17 m, height of 7.17 m, central pillar width of 0.4 m, side wall thickness of 0.7 m, top plate thickness of 0.8 m, and bottom plate thickness of 0.85 m. The spacing of the central pillars along the tunnel alignment is 3.5 m.
During earthquakes, the structure may experience plastic deformation. Considering the material nonlinearity of the structure will result in a greater dynamic response. After considering the nonlinearity of the material, the optimization result of the friction coefficient will not change, and the optimization result of the equivalent radius will slightly increase. But considering the nonlinearity will increase computational costs, and it may cause the calculation to fail to converge. To simplify the analysis, the station materials were considered equivalent to homogeneous materials, using an elastic constitutive model. The material has a density of 2500 kg/m3, a Poisson’s ratio of 0.2, and an elastic modulus of 31.5 Gpa.
Based on historical seismic damage records [21,22], the burial depth of the station is 4.8 m, and the soil layers at the site can be roughly divided into six layers, each with specific soil properties as indicated in Table 1. Rayleigh damping was employed for the soil layers. Using Abaqus modal analysis functionality, the first and second mode frequencies of the site were determined to be 1.8 Hz and 4.2 Hz, respectively. Calculating with Formula (4), the Rayleigh damping coefficients for the soil layers were obtained as α = 0.799 and β = 0.00264.
4.2. Finite Element of the Friction Pendulum Bearings
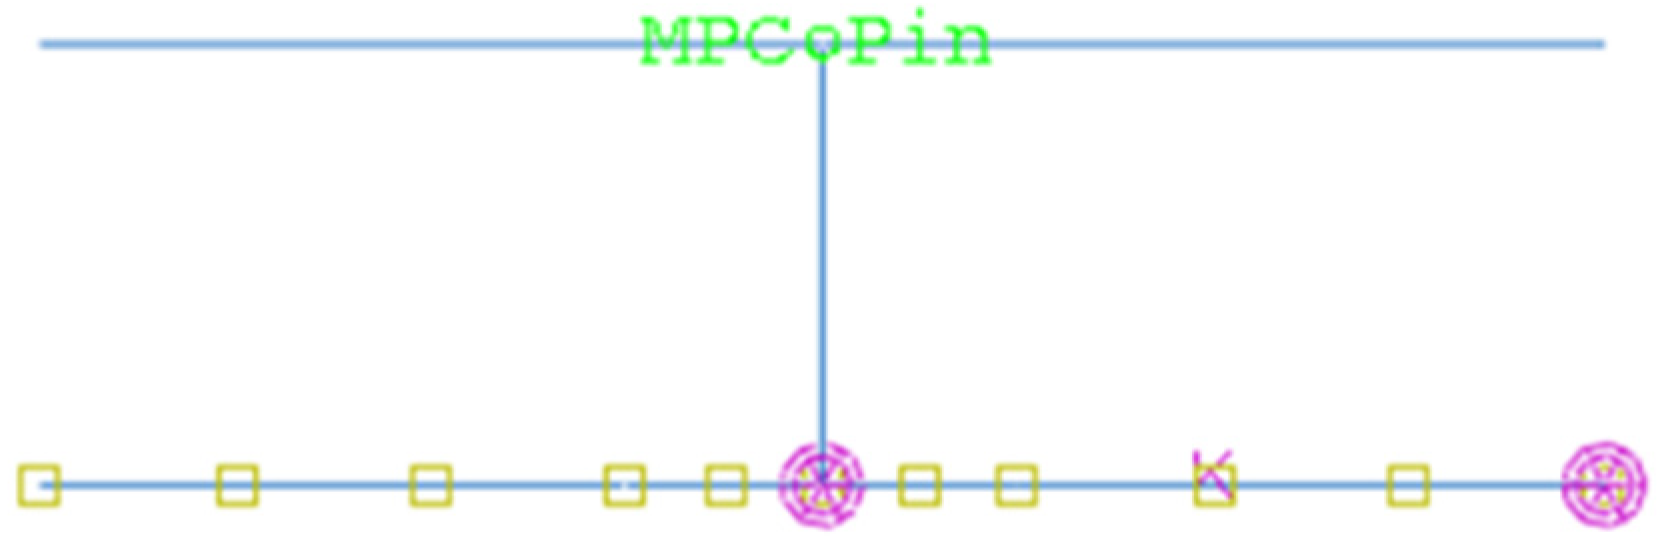
The single curved friction pendulum bearing was chosen for the study. It is mainly composed of three parts, which are a housing plate, a concave plate, and a slider. The friction pendulum bearing has a height of 110 mm and a width of 400 mm. In the process of parameter optimization, it is necessary to calculate the seismic reduction effectiveness of friction pendulum bearings with different parameters. It is required to calculate the seismic reduction effectiveness corresponding to each individual in each generation. The simplified model can reduce computation time and lower computational costs. So, the beam elements were used to simulate the friction pendulum bearing, and the finite element model is shown in Figure 9. The changes in the friction coefficient and equivalent radius of the bearings can be achieved by changing the surface friction coefficient and spring stiffness of the simplified model. A linear elastic constitutive model was selected to simulate the material properties. The material of the friction pendulum bearing is steel, with a density of 7850 kg/m3, elastic modulus of 206 GPa, and Poisson’s ratio of 0.3.
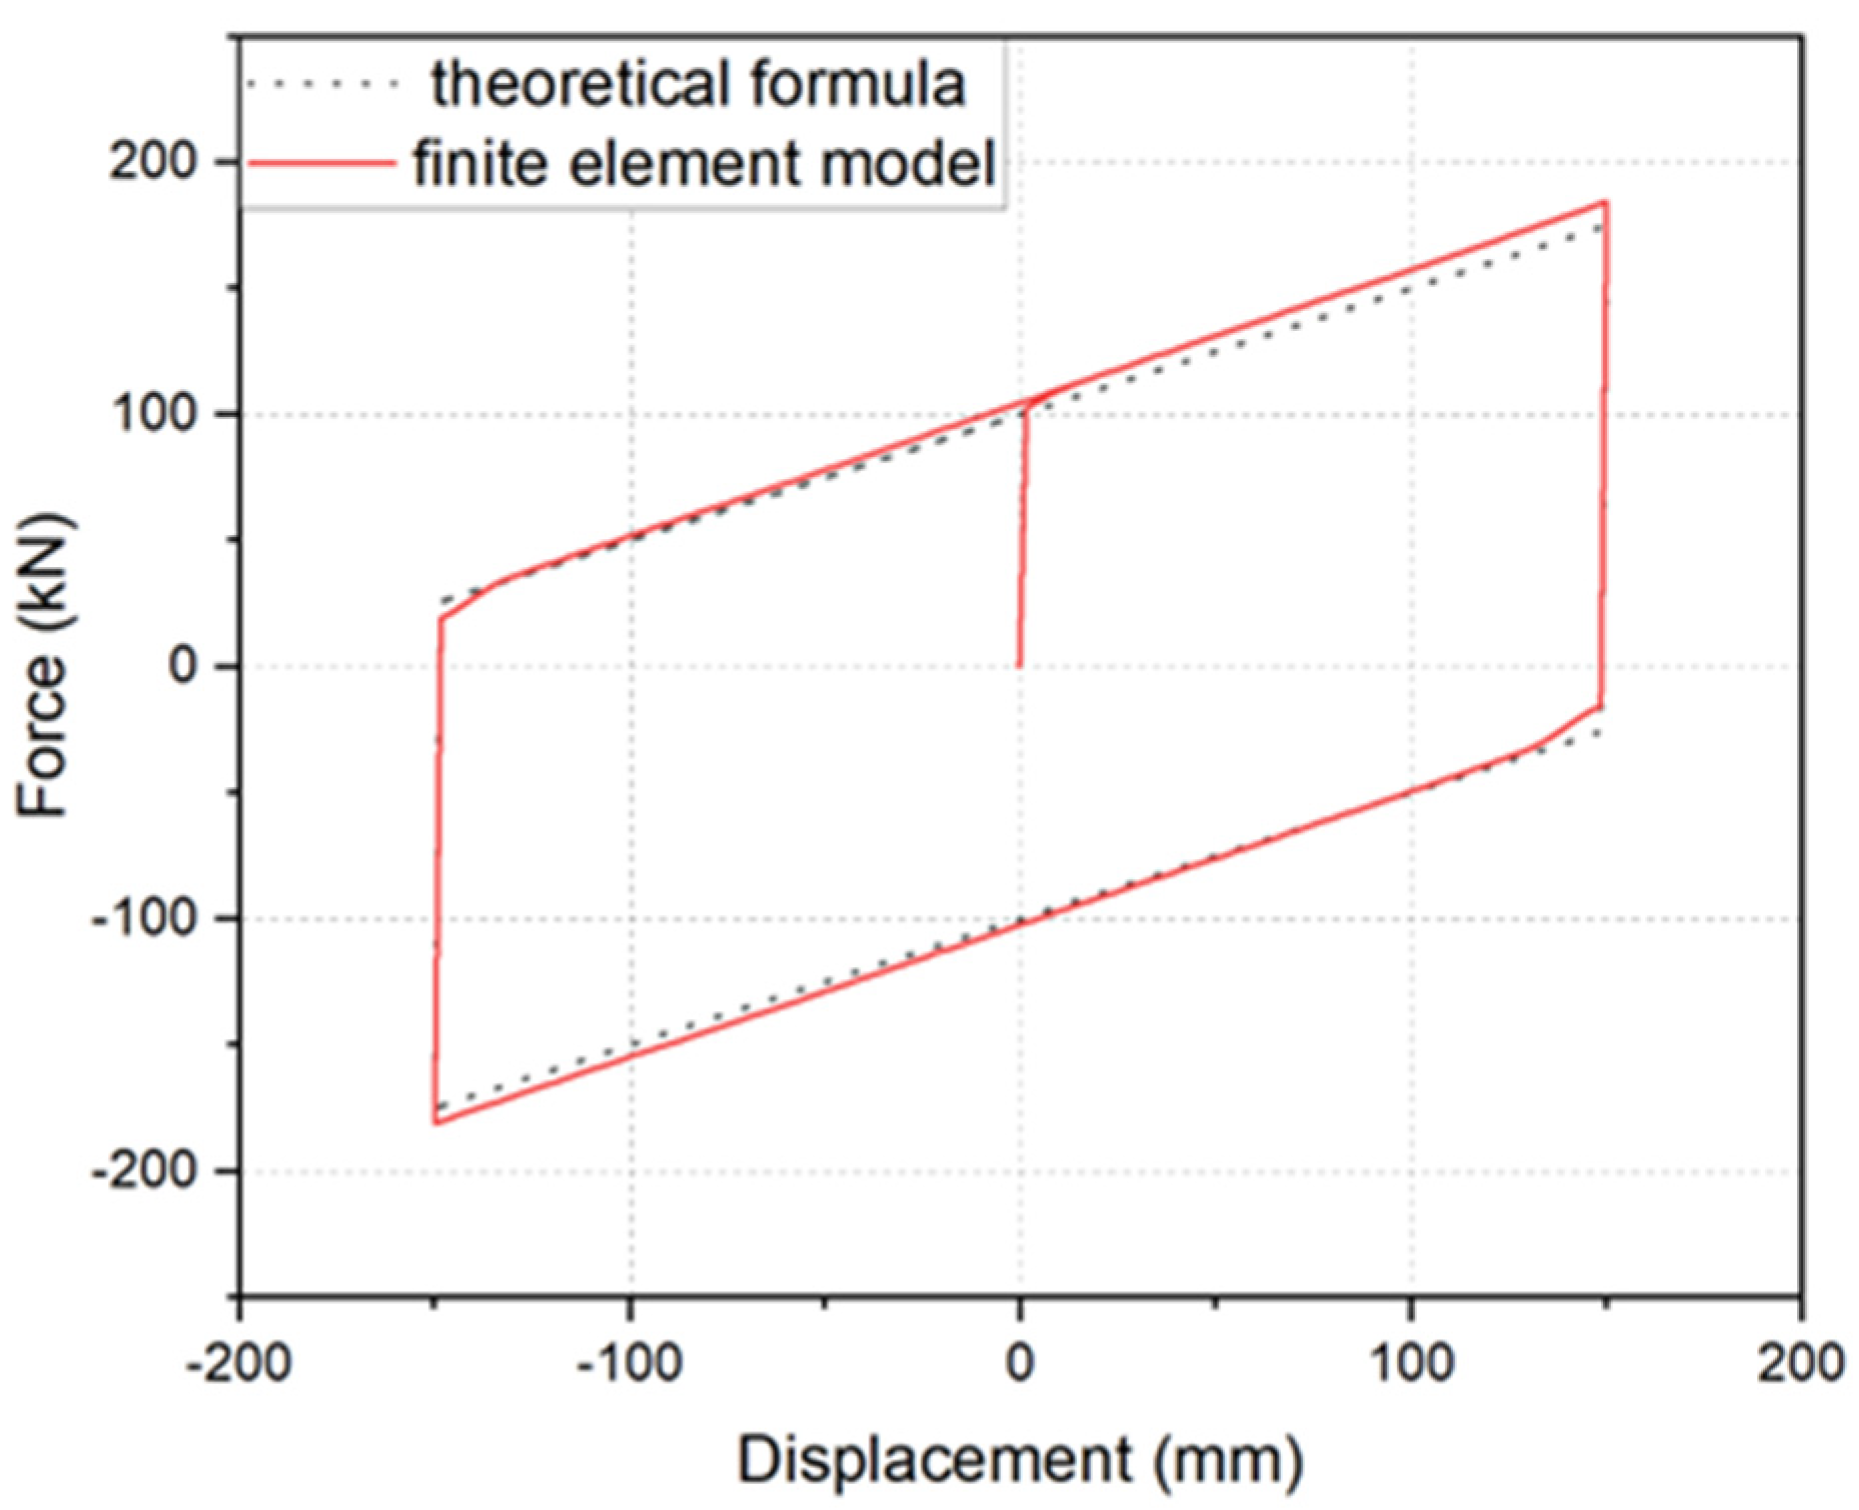
4.3. Accuracy Verification of the Simplified Model
During the seismic process, the slider of the friction pendulum bearing is mainly subjected to the vertical pressure W, the normal force on the sliding surface N, frictional force f, and the horizontal restoring force F transmitted by the structure. Assuming the friction coefficient of the sliding surface is μ, the equivalent radius of the sliding surface is R, the angle of rotation is θ, and the horizontal sliding distance of the slider is D, the following calculation formula can be obtained based on the moment balance condition:
When θ is relatively small, Formula (7) can be simplified to Formula (8):
To verify the accuracy of the finite element model of the friction pendulum bearing, compare the calculation results of this finite element model with those of the theoretical formula. The results are shown in Figure 10.
As shown in the figure, the curves are roughly coincident, indicating that the finite element model can simulate the mechanical characteristics of the friction pendulum bearing well.
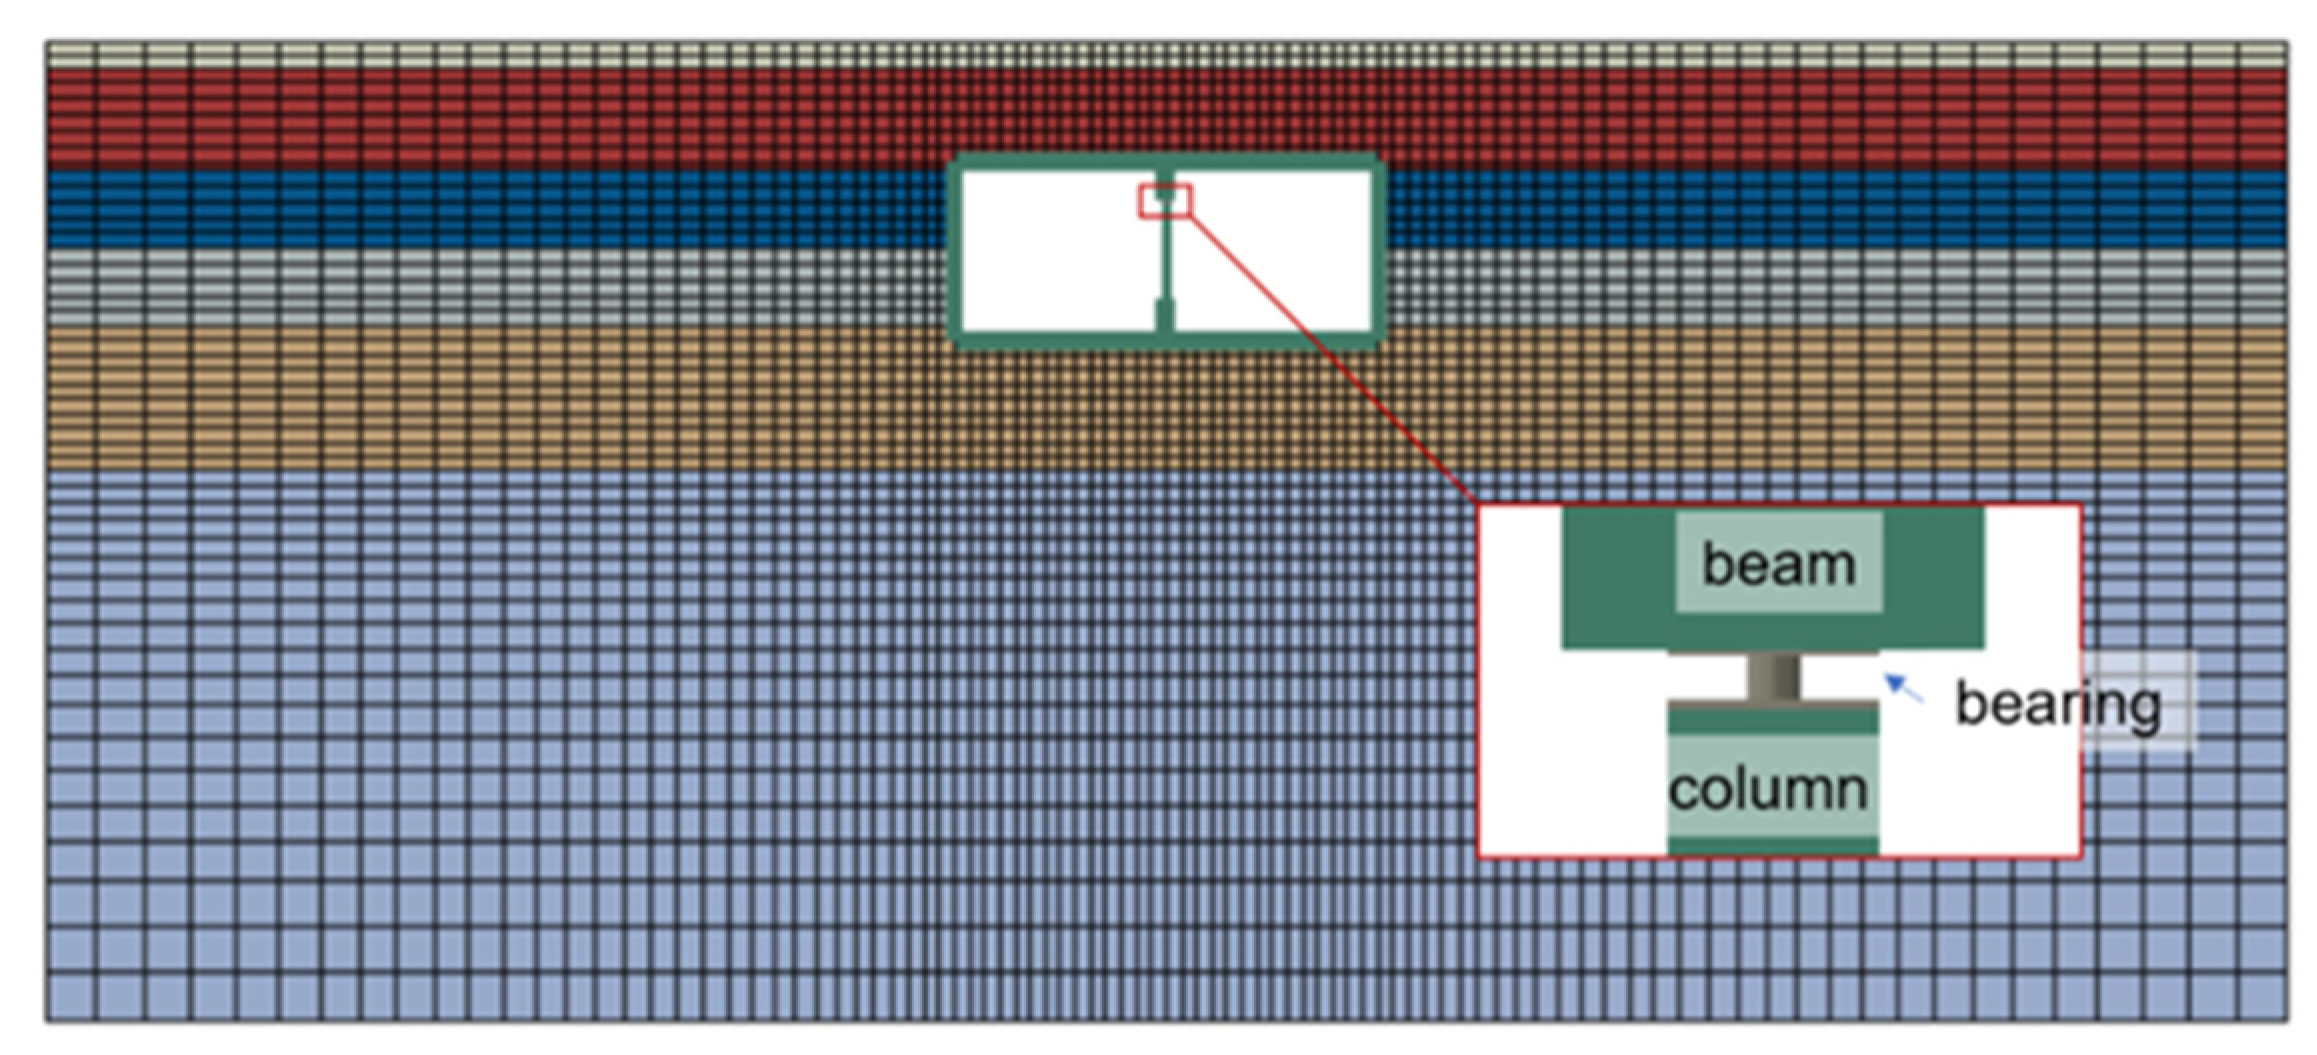
For above-ground buildings, friction pendulum bearings are placed under the structures. They can extend structures’ natural period and reduce the seismic damage degree [23]. For underground structures, friction pendulum bearings are placed at the vulnerable parts in the structures. The friction pendulum bearing is placed at the top of the column in the station, and the overall finite element model is shown in Figure 11. The station surface and the soil surface are tied together. The bottom of the finite element model is fixed except for the direction of the seismic wave input. And an equal displacement boundary is adopted to the side boundaries, which can avoid the reflection and refraction of seismic waves.
5. Parameter Optimization of Friction Pendulum Bearings
5.1. Key Parameters of Friction Pendulum Bearings
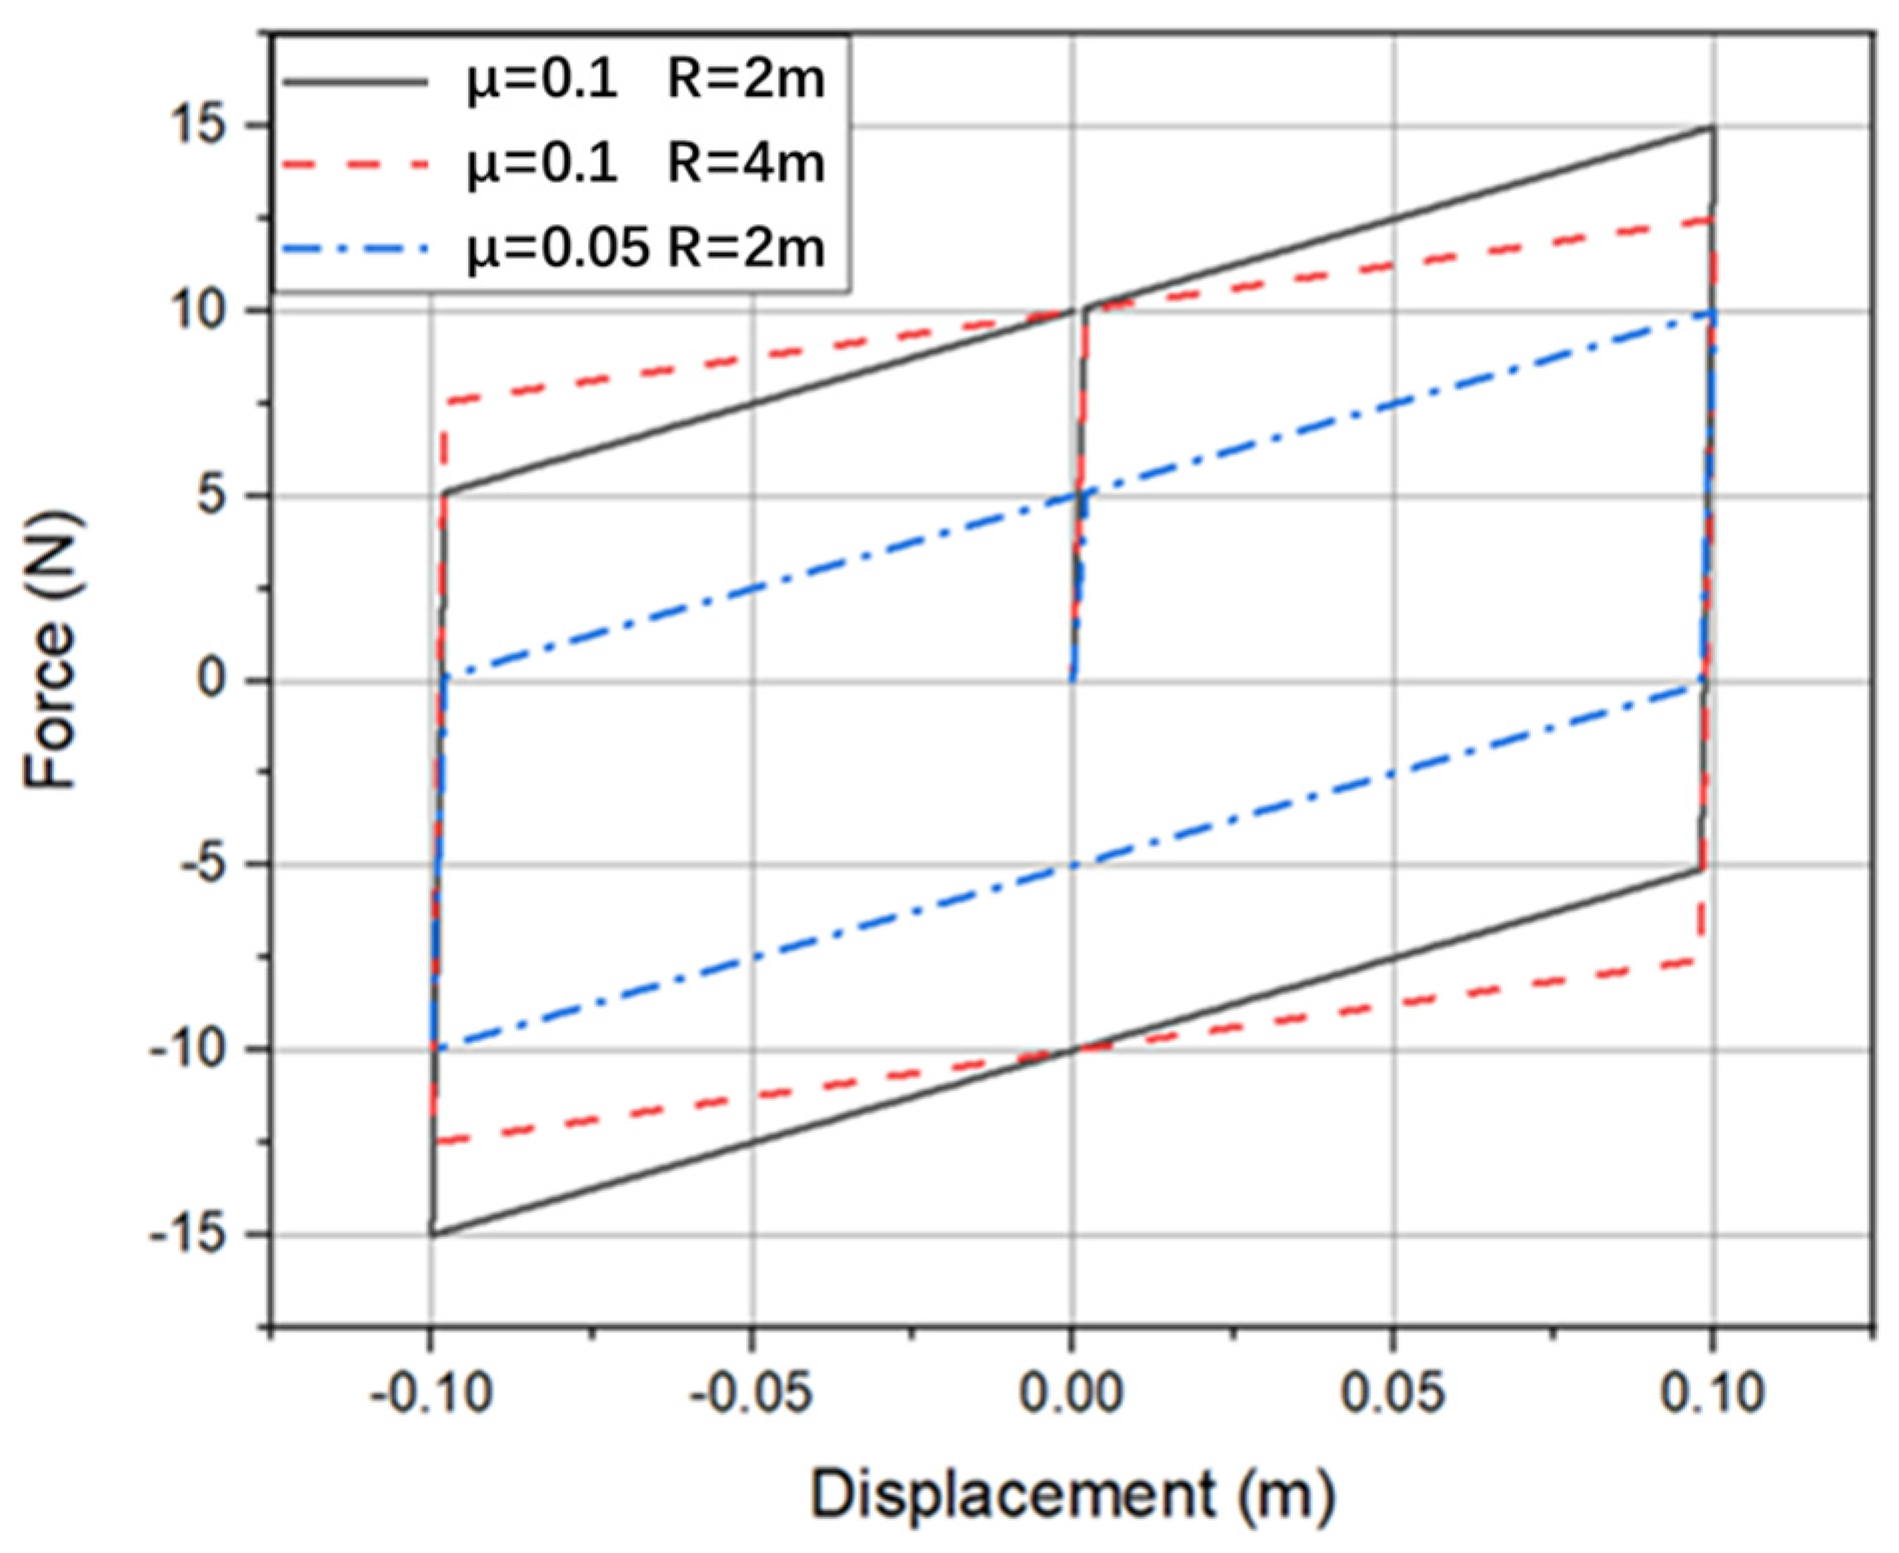
The force–displacement curves of friction pendulum bearings with different equivalent radii and friction coefficients under the same vertical pressure are shown in Figure 12.
In the figure, curves of different colors represent different combinations of bearing parameters. According to Formula (8), the force–displacement curve is mainly determined by vertical pressure , equivalent radius , and friction coefficient . When the displacement is the same, different directions of slider movement will change . So, in the force–displacement curves, the same will correspond to two restoring forces.
When simulating friction pendulum bearings, the focus is on modeling the mechanical characteristics, particularly the force–displacement curve. The mechanical performance of friction pendulum bearings is mainly influenced by the friction coefficient and the equivalent radius, which are the key parameters of friction pendulum bearings.
5.2. Seismic Reduction Effectiveness of Friction Pendulum Bearing
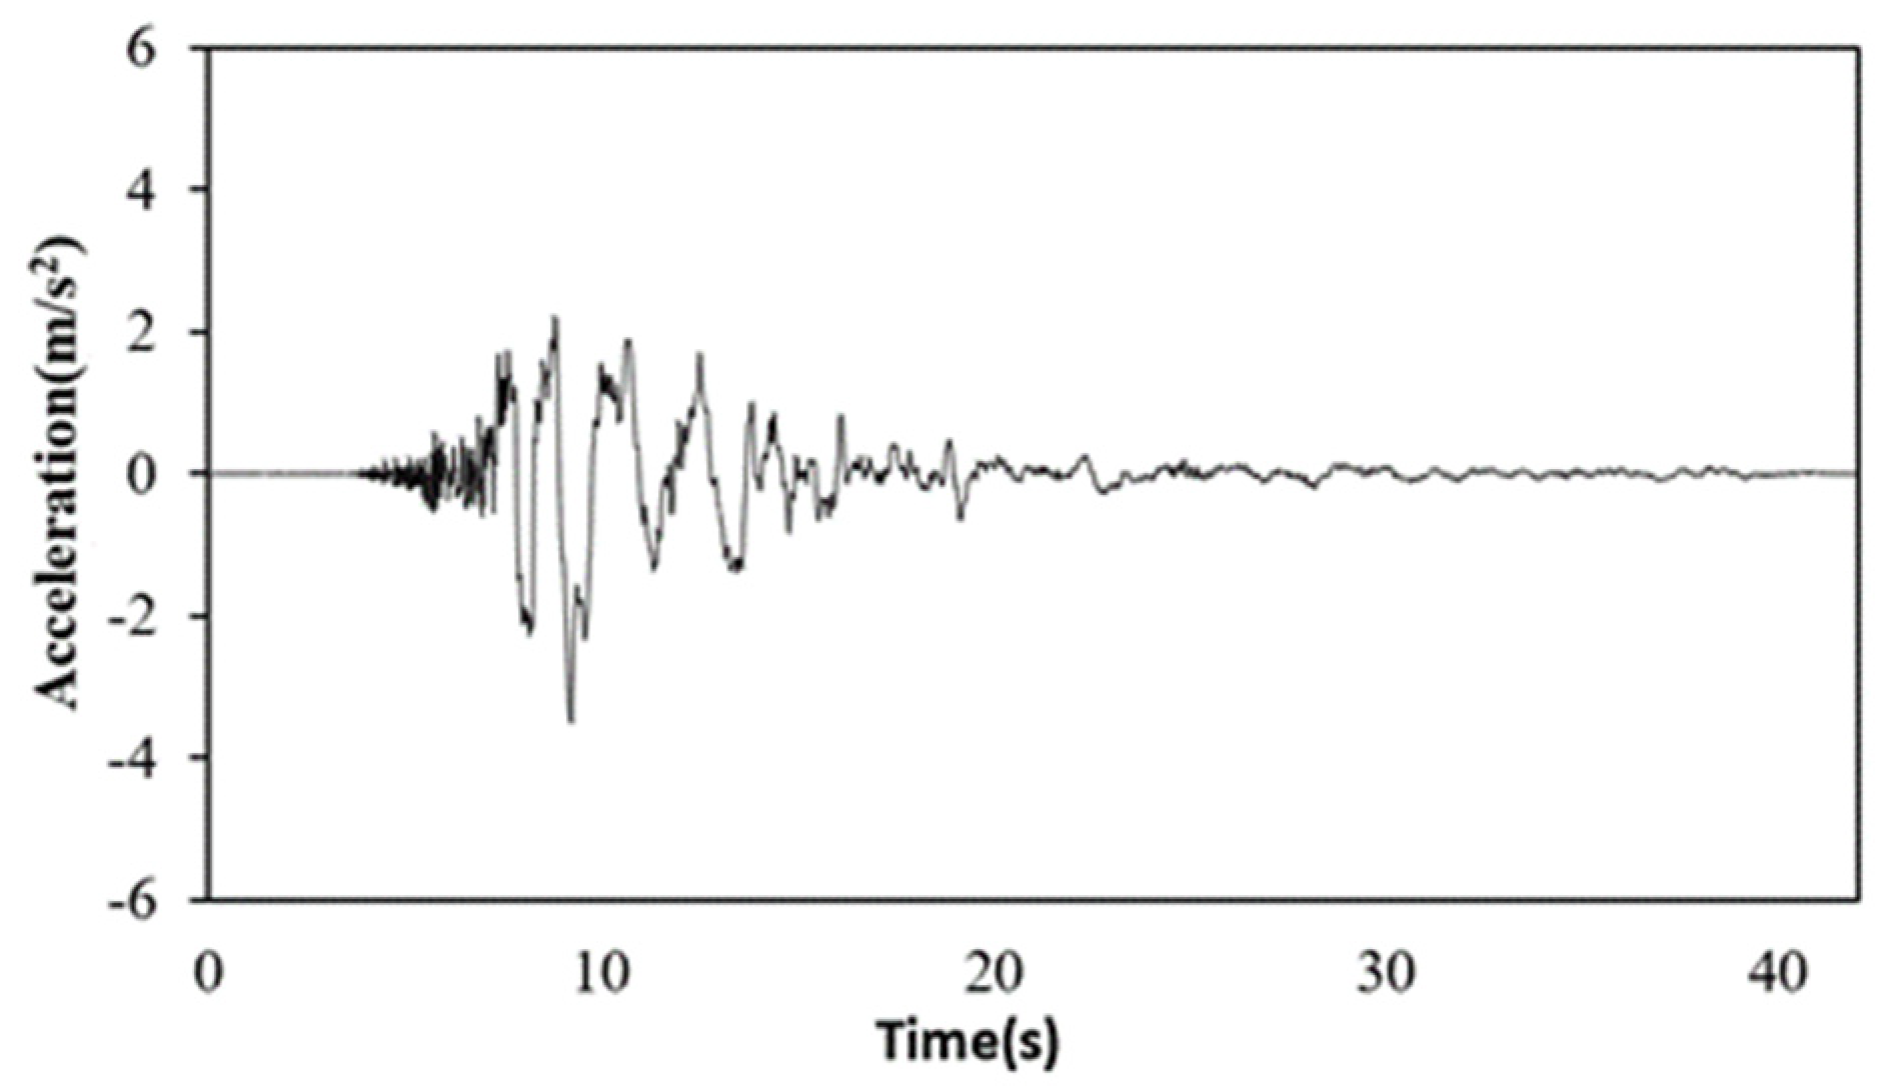
The friction coefficient of the sliding surface of the friction pendulum bearing was taken as 0.02, and the equivalent radius was taken as 2 m. The Kobe wave with acceleration amplitudes of 0.1 g, 0.2 g, and 0.4 g was input in the horizontal direction at the bottom of the model. The original acceleration time history curve of the Kobe wave is shown in the Figure 13.
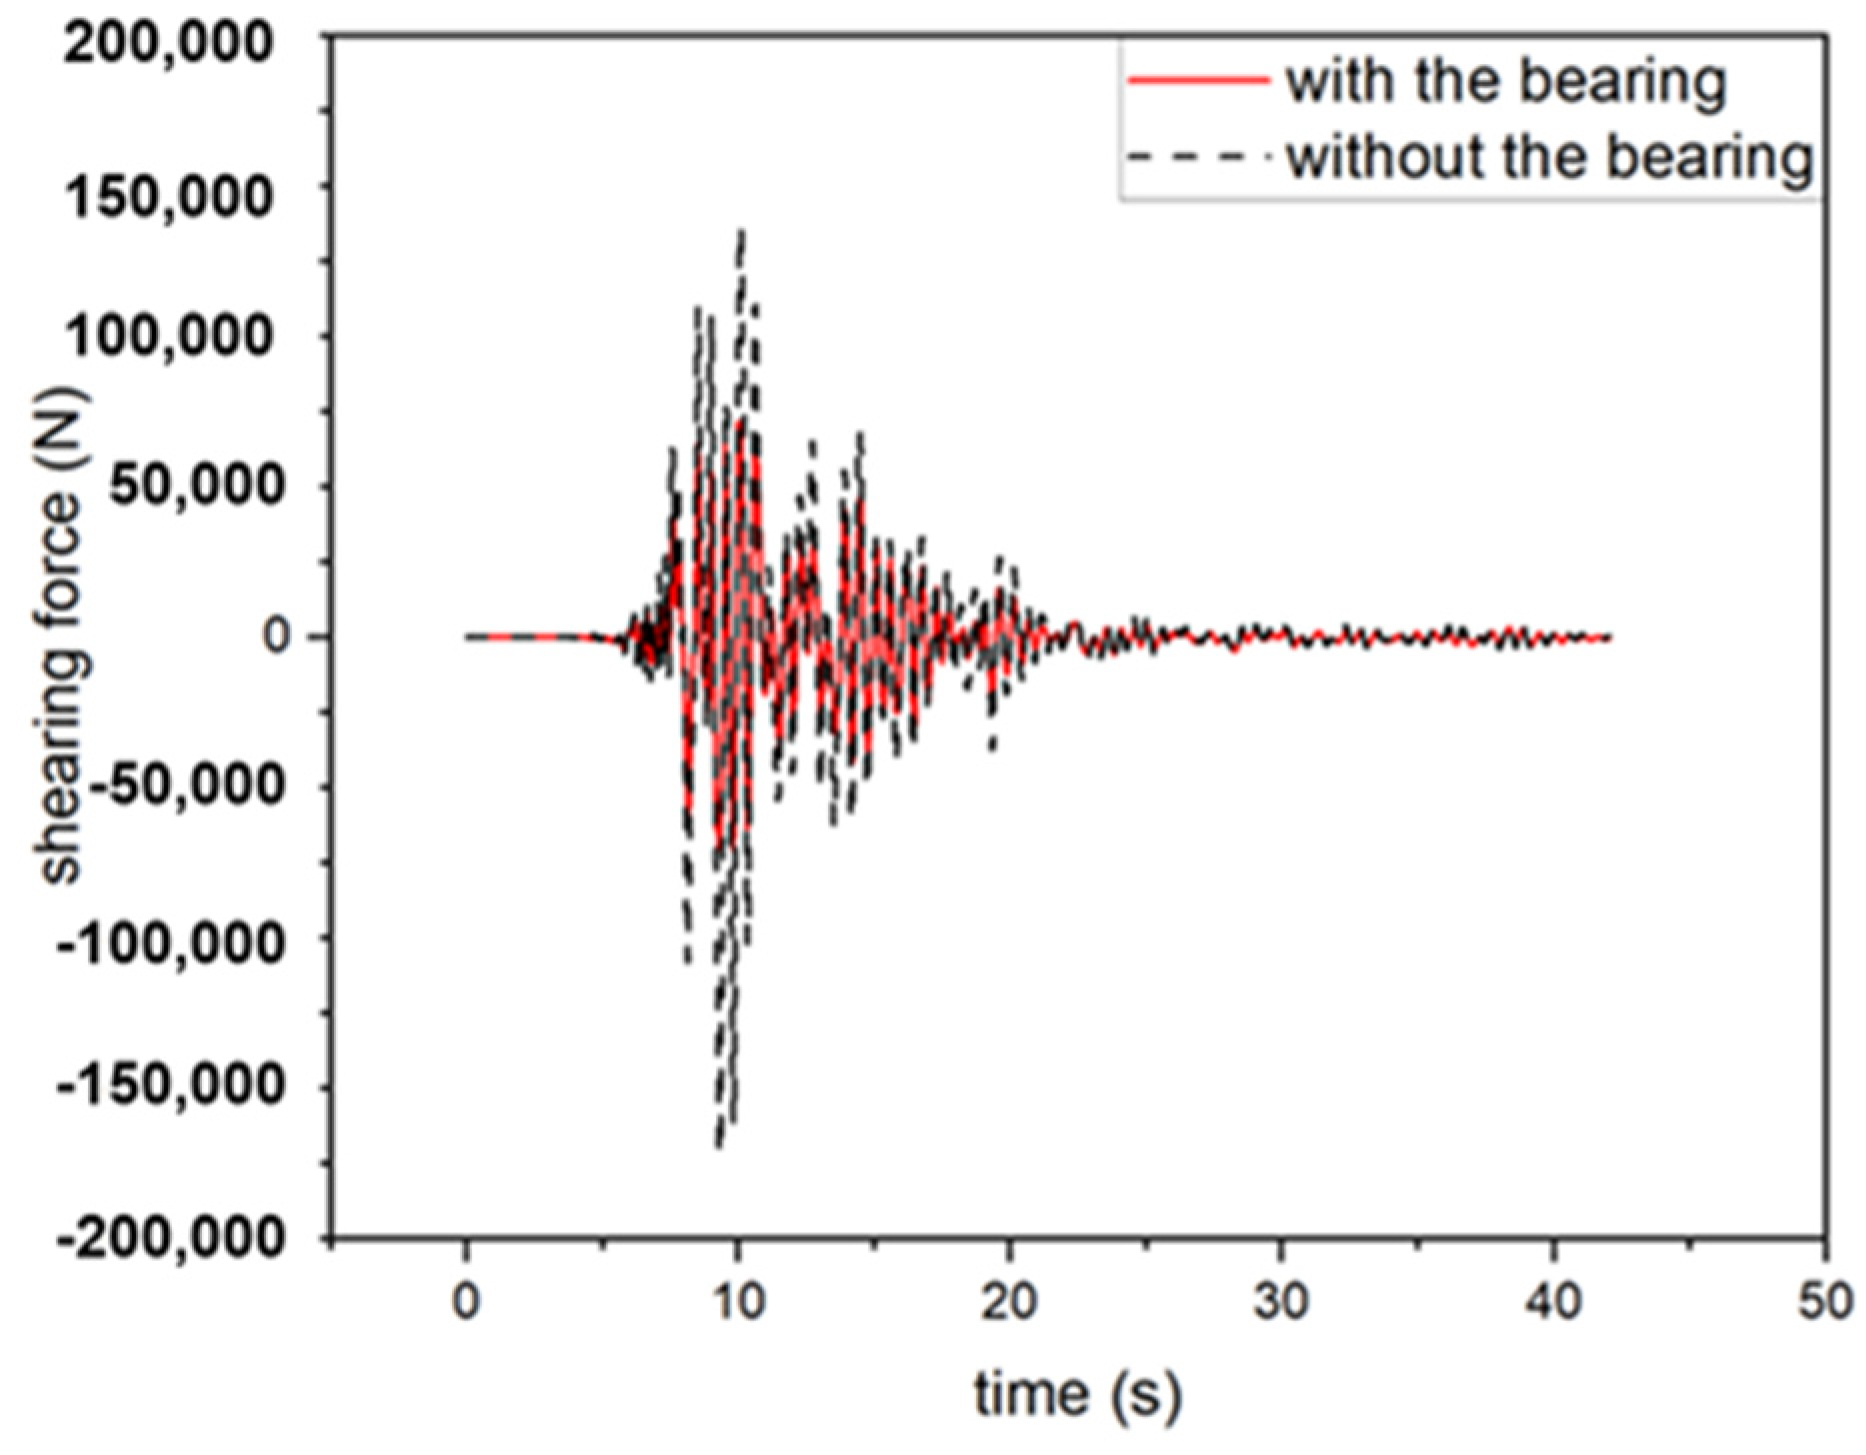
The Kobe wave is the near-field seismic wave, which is more detrimental to the safety of structures [24,25]. The effect of the friction pendulum bearing on the station under the action of 0.2 g seismic wave is shown in the Figure 14. After installing the bearing, the shearing force at the bottom of the central column has significantly decreased.
The calculation formula for seismic reduction effectiveness is as follows:
where is the dynamic response of the central column with the seismic isolation device installed, and is the dynamic response without the seismic isolation device. The destruction of underground stations is mainly caused by the destruction of central columns. In other words, the internal force of central columns is crucial to the safety of underground stations. The maximum shearing forces at the bottoms of central columns are extracted as the indexes of dynamic response during the earthquake.
The seismic reduction effectiveness of friction pendulum bearings under different intensities of earthquakes is shown in the Table 2.
From the table, it can be seen that as the seismic intensity increases, the seismic reduction effectiveness of the bearing also increases.
The friction coefficients of the friction pendulum bearings were set to 0.01, 0.02, 0.03, and 0.04, and the equivalent radii were set to 1 m, 2 m, 3 m, and 4 m. The maximum shearing forces of the central column during the earthquake under the action of bearings with different parameter combinations are shown in the Table 3.
5.3. Parameter Optimization Based on the Improved Genetic Algorithm
A Kobe seismic wave was selected as the input wave, and Daikai Station was selected as the underground structure. The optimization variables include the friction coefficient and equivalent radius of the friction pendulum bearing, with the friction coefficient values ranging from 0.01 to 0.10 and the equivalent radius values from 1 m to 10 m. The parameters were encoded using Gray code, with each parameter represented by a code of 6 units in length. The optimization objective is to maximize the seismic reduction effectiveness of the friction pendulum bearings.
The optimization of friction pendulum bearing parameters can be viewed as a mathematical problem of finding the maximum value of a function. Design parameters serve as independent variables, while seismic reduction effectiveness represents the dependent variable. Utilizing the finite element model as a function solver, the model parameters are adjusted based on design parameters, and the seismic reduction effectiveness is computed.
The crossover probabilities for the adaptive genetic algorithm are set as , , , , and mutation probabilities as , , , . The population size is set to 30, and the total number of generations is set to 100. The formula for calculating individual fitness is as follows:
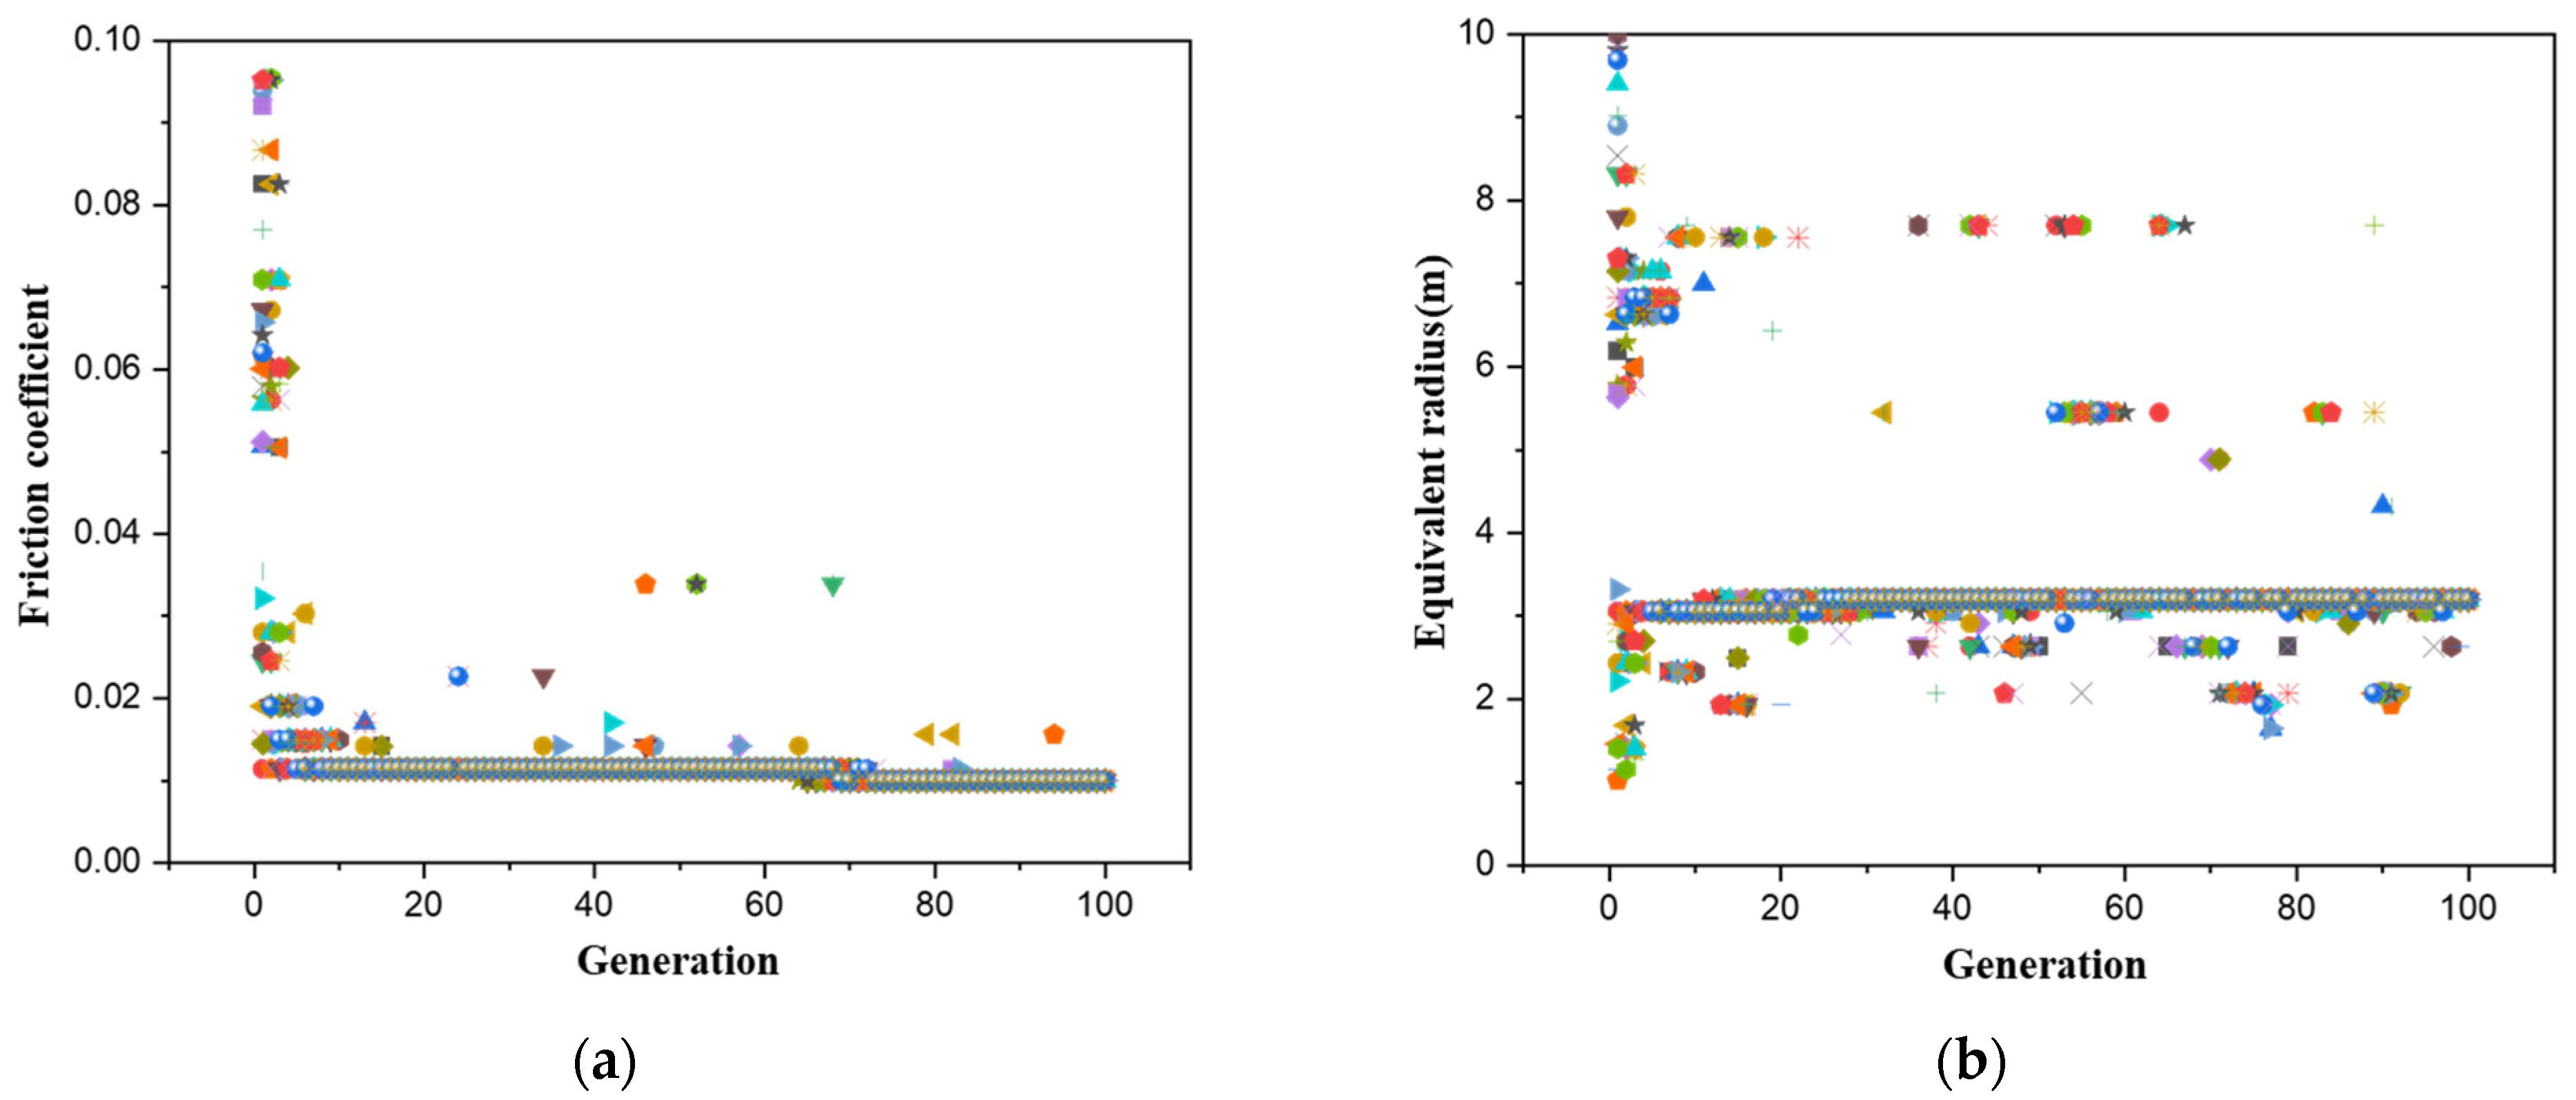
where is the normalized fitness of the k-th individual in the population, is the seismic reduction effectiveness of the individual with the highest seismic reduction effectiveness, is the seismic reduction effectiveness of the individual with the lowest seismic reduction effectiveness. is the seismic reduction effectiveness of the k-th individual in the population. To avoid hiding individuals with zero fitness, a small constant value is added after the calculation. The optimization process for the friction pendulum bearing parameters is shown in Figure 15.
It can be observed from the figure that, due to the utilization of an adaptive genetic algorithm considering overall evolutionary status, even in the later stages of evolution, some individuals continue to perform random searches in the space, attempting to find the other optimum. Eventually, the friction coefficient of the friction pendulum bearing converges to 0.01, and the equivalent radius converges to 3.30 m. When the friction pendulum bearing is set to these parameter values, the seismic reduction effectiveness is maximized.
6. Conclusions
This paper analyzes the impact of Pc and Pm on the optimization process of genetic algorithms. A genetic algorithm considering the overall evolutionary status is proposed. Compared to traditional adaptive genetic algorithms, this algorithm considers the evolutionary state of the population, allowing the algorithm to still have strong spatial search ability in the later stages of evolution. Utilizing the improved genetic algorithm and finite element calculation method, an optimization method is proposed. This optimization method can solve optimization problems in complex engineering. In this paper, the parameters of friction pendulum bearings are optimized based on this method. The conclusions are as follows.
- (1)
- When the Pc and Pm of the genetic algorithm are small, the algorithm converges quickly, and the optimization process is stable, but it is prone to converge to a local optimal solution rather than a global optimal solution. When the Pc and Pm are large, the randomness of spatial search is high, and the genes of excellent individuals are easily disrupted, making convergence difficult. Choosing appropriate values of Pc and Pm is crucial for the optimization ability of genetic algorithms.
- (2)
- Using population diversity as an evaluation metric, an adaptive genetic algorithm considering the overall evolutionary status is proposed. The algorithm dynamically adjusts the Pc and Pm based on the fitness of individuals and the diversity of the population. Comparing AGACO with other genetic algorithms validates that AGACO has better global search capability and convergence efficiency.
- (3)
- Combining the improved genetic algorithm with the finite element model, a parameter optimization method is proposed. The parameters of friction pendulum bearings are optimized based on the optimization method. The optimal friction coefficient of the friction pendulum bearing is 0.01 and the optimal equivalent radius is 3.3 m. The optimization method proposed has universal applicability. It is applicable to various engineering optimization problems. But the optimization results are only applicable to the situations proposed in this paper.
- (4)
- The optimization results provide reference suggestions for the design of friction pendulum bearings in future. According to the process of parameter optimization, it can be found that the smaller the friction coefficient of the friction pendulum bearing, the better the seismic reduction effectiveness. Simultaneously, the existence of an optimal equivalent radius can maximize the seismic reduction effectiveness. In the future design of friction pendulum bearings, the friction coefficient should be minimized as much as possible. And the optimal equivalent radius can be found by the optimization method.
Author Contributions
Conceptualization, G.Y. and M.M.; methodology, P.J.; software, P.J. and X.M.; validation, P.J., G.Y. and X.M.; formal analysis, P.J.; investigation, X.M.; resources, G.Y. and M.M.; data curation, P.J.; writing—original draft preparation, P.J.; visualization, P.J.; supervision, G.Y.; project administration, X.M.; funding acquisition, G.Y. All authors have read and agreed to the published version of the manuscript.
Funding
This research received no external funding.
Data Availability Statement
The data presented in this study are available on request from the corresponding author. The data are not publicly available due to privacy.
Conflicts of Interest
Author Guanghua Yin, Minglei Ma, Peng Jia and was employed by the company China Construction 8th Engineering Bureau. The authors declare that the research was conducted in the absence of any commercial or financial relationships that could be construed as a potential conflict of interest.
References
- Zheng, Z.J.; Wang, Z.L.; Liu, S.; Ma, W. Exploring the spatial effects on the level of congestion caused by traffic accidents in urban road networks: A case study of Beijing. Travel Behav. Soc. 2024, 35, 100728. [Google Scholar] [CrossRef]
- Chen, X.S.; Xu, Y.J.; Bai, X.; Chu, K.F. Exploration on the Comprehensive Planning Mode of Underground Space in High-density Urban Residential Areas. Chin. J. Undergr. Space Eng. 2022, 18, 1–11. [Google Scholar] [CrossRef]
- Broere, W. Urban underground space: Solving the problems of today’s cities. Tunn. Undergr. Space Technol. 2016, 55, 245–248. [Google Scholar] [CrossRef]
- Qiao, Y.K.; Peng, F.L.; Sabri, S.; Rajabifard, A. Low carbon effects of urban underground space. Sustain. Cities Soc. 2019, 45, 451–459. [Google Scholar] [CrossRef]
- Chen, Z.Y.; Fan, H.; Bian, G.Q. Parameter Analysis of Shear Panel Dampers under High Axial Compression. Adv. Steel Constr. 2015, 11, 1–14. [Google Scholar] [CrossRef]
- Liu, Z.Q.; Chen, Z.Y.; Liang, S.B.; Li, C.X. Isolation mechanism of a subway station structure with flexible devices at column ends obtained in shaking-table tests. Tunn. Undergr. Space Technol. 2020, 98, 103328. [Google Scholar] [CrossRef]
- Chen, Z.Y.; Jia, P. Seismic response of underground stations with friction pendulum bearings under horizontal and vertical ground motions. Soil Dyn. Earthq. Eng. 2021, 151, 106984. [Google Scholar] [CrossRef]
- Zhuang, H.Y.; Zhao, C.; Chen, S.; Fu, J.S.; Zhao, K.; Chen, G.X. Seismic performance of underground subway station with sliding between column and longitudinal beam. Tunn. Undergr. Space Technol. 2020, 102, 103439. [Google Scholar] [CrossRef]
- Chen, Z.Y.; Jia, P.; Liu, Z.Q. Parameter analysis of friction pendulum bearings in underground stations during the earthquake. China Civ. Eng. J. 2022, 55, 12–22. [Google Scholar] [CrossRef]
- Zhou, Y. Resilience-Based Seismic Mitigation Measure and Optimal Layout for Subway Stations. Master’s Thesis, Tongji University, Shanghai, China, 2020. [Google Scholar]
- Di Trapani, F.; Malavisi, M.; Marano, G.C.; Sberna, A.P.; Greco, R. Optimal seismic retrofitting of reinforced concrete buildings by steel-jacketing using a genetic algorithm-based framework. Eng. Struct. 2020, 219, 110864. [Google Scholar] [CrossRef]
- Bekdaş, G.; Nigdeli, S.M.; Yang, X.S. A novel bat algorithm based optimum tuning of mass dampers for improving the seismic safety of structures. Eng. Struct. 2018, 159, 89–98. [Google Scholar] [CrossRef]
- Bagley, J.D. The Behavior of Adaptive Systems Which Employ Genetic and Correlation Algorithms. Ph.D. Thesis, University of Michigan, Ann Arbor, MI, USA, 1967. [Google Scholar]
- Rastrigin, L.A. Random Search in Problems of Optimization, Identification and Training of Control Systems. J. Cybern. 1974, 3, 93–103. [Google Scholar] [CrossRef]
- Srinivas, M.; Patnaik, L.M. Adaptive probabilities of crossover and mutation in genetic algorithms. IEEE Trans. Syst. Man. Cybern. 1994, 24, 656–667. [Google Scholar] [CrossRef]
- Sung, W.; Hsiao, C. IHPG algorithm for efficient information fusion in multi-sensor network via smoothing parameter optimization. Informatica 2013, 24, 291–313. [Google Scholar] [CrossRef]
- Song, J.; Hou, C.; Xue, G.; Ma, M. Study of Constellation Design of Pseudolites Based on Improved Adaptive Genetic Algorithm. J. Commun. 2016, 11, 879–885. [Google Scholar] [CrossRef]
- Yan, M.; Hu, H.; Otake, Y.; Taketani, A.; Wakabayashi, Y.; Yanagimachi, S.; Wang, S.; Pan, Z.; Hu, G. Improved adaptive genetic algorithm with sparsity constraint applied to thermal neutron CT reconstruction of two-phase flow. Meas. Sci. Technol. 2018, 29, 055404. [Google Scholar] [CrossRef]
- Wang, L.L. Research on emergency management capability evaluation of hazardous chemical supply chain. Chem. Eng. Trans. 2017, 62, 1369–1374. [Google Scholar] [CrossRef]
- Patil, V.P.; Pawar, D.D. The optimal crossover or mutation rates in genetic algorithm: A review. Int. J. Appl. Eng. Technol. 2015, 5, 38–41. [Google Scholar]
- Hiroomi, I.; Toshio, H.; Nozomu, Y.; Masahiko, I. Damage to Daikai Subway Station. Soils Found. 1996, 36, 283–300. [Google Scholar] [CrossRef]
- Nguyen, V.Q.; Nizamani, Z.A.; Park, D.; Kwon, O.S. Numerical simulation of damage evolution of Daikai station during the 1995 Kobe earthquake. Eng. Struct. 2020, 206, 283–300. [Google Scholar] [CrossRef]
- Shang, J.; Tan, P.; Zhang, Y.; Han, J.; Mi, P. Seismic isolation design of structure using variable friction pendulum bearings. Soil Dyn. Earthq. Eng. 2021, 148, 106855. [Google Scholar] [CrossRef]
- Rayegani, A.; Nouri, G. Application of smart dampers for prevention of seismic pounding in isolated structures subjected to near-fault earthquakes. J. Earthq. Eng. 2022, 26, 4069–4084. [Google Scholar] [CrossRef]
- Rayegani, A.; Nouri, G. Seismic collapse probability and life cycle cost assessment of isolated structures subjected to pounding with smart hybrid isolation system using a modified fuzzy based controller. Structures 2022, 44, 30–41. [Google Scholar] [CrossRef]
Figure 1.
Rastrigin function diagram.

Figure 2.
Optimization process with different Pcs.

Figure 3.
Optimization process with different Pms.

Figure 4.
Errors for x of different combinations Pc and Pm.

Figure 5.
Errors for y of different combinations Pc and Pm.

Figure 6.
Improved adaptive genetic algorithm flowchart.

Figure 7.
Optimization processes of different genetic algorithms.

Figure 8.
Cross-section of Daikai Station.

Figure 9.
Finite element model of the friction pendulum bearing.

Figure 10.
Comparison between model results and theoretical results.

Figure 11.
Overall finite element model.

Figure 12.
Force–displacement curve with different equivalent radii and friction coefficients.

Figure 13.
Original acceleration time history curve of the Kobe wave.

Figure 14.
Effect of the friction pendulum bearing on the station.

Figure 15.
Evolution process of two key parameters: (a) evolution process of friction coefficients; (b) evolution process of equivalent radius.
Figure 15.
Evolution process of two key parameters: (a) evolution process of friction coefficients; (b) evolution process of equivalent radius.


Table 1.
Material properties of each soil layer.
| Soil Type | Thickness (m) | Density (kN/m3) | Shear Wave Velocity (m/s) | Poisson’s Ratio | Dynamic Modulus of Elasticity (Mpa) |
|---|---|---|---|---|---|
| Clay | 1 | 19 | 140 | 0.333 | 99.3 |
| Sand | 4.1 | 19 | 140 | 0.488 | 111 |
| Sand | 3.2 | 19 | 170 | 0.493 | 164 |
| Clay | 3.1 | 19 | 190 | 0.494 | 205 |
| Clay | 5.8 | 19 | 240 | 0.49 | 326 |
| Sand | 22 | 20 | 330 | 0.487 | 648 |
Table 2.
Shearing force in the central column under different earthquakes.
| Acceleration Amplitude | 0.1 g | 0.2 g | 0.4 g |
|---|---|---|---|
| Without bearing | 88 kN | 172 kN | 346 kN |
| With bearing | 50 kN | 71 kN | 96 kN |
| Seismic reduction effectiveness | 43% | 59% | 72% |
Table 3.
Shearing force in the central column under different friction pendulum bearings.
| = 0.01 | = 0.02 | = 0.03 | = 0.04 | |
|---|---|---|---|---|
| R = 1 m | 50 kN | 75 kN | 96 kN | 101 kN |
| R = 2 m | 42 kN | 71 kN | 95 kN | 101 kN |
| R = 3 m | 41 kN | 71 kN | 95 kN | 101 kN |
| R = 4 m | 43 kN | 73 kN | 95 kN | 101 kN |
Disclaimer/Publisher’s Note: The statements, opinions and data contained in all publications are solely those of the individual author(s) and contributor(s) and not of MDPI and/or the editor(s). MDPI and/or the editor(s) disclaim responsibility for any injury to people or property resulting from any ideas, methods, instructions or products referred to in the content. |
© 2024 by the authors. Licensee MDPI, Basel, Switzerland. This article is an open access article distributed under the terms and conditions of the Creative Commons Attribution (CC BY) license (https://creativecommons.org/licenses/by/4.0/).
Share and Cite
MDPI and ACS Style
Yin, G.; Ma, M.; Jia, P.; Ma, X. Parameter Optimization of Friction Pendulum Bearings Based on the Adaptive Genetic Algorithm Considering the Overall Evolutionary Status. Buildings 2024, 14, 435. https://doi.org/10.3390/buildings14020435
AMA Style
Yin G, Ma M, Jia P, Ma X. Parameter Optimization of Friction Pendulum Bearings Based on the Adaptive Genetic Algorithm Considering the Overall Evolutionary Status. Buildings. 2024; 14(2):435. https://doi.org/10.3390/buildings14020435
Chicago/Turabian StyleYin, Guanghua, Minglei Ma, Peng Jia, and Xinxu Ma. 2024. "Parameter Optimization of Friction Pendulum Bearings Based on the Adaptive Genetic Algorithm Considering the Overall Evolutionary Status" Buildings 14, no. 2: 435. https://doi.org/10.3390/buildings14020435
Note that from the first issue of 2016, this journal uses article numbers instead of page numbers. See further details here.