Article

Fragility Assessment of a Long-Unit Prestressed Concrete Composite Continuous Girder Bridge with Corrugated Steel Webs Subjected to Near-Fault Pulse-like Ground Motions Considering Spatial Variability Effects

1
CCCC First Highway Consultants Co., Ltd., Xi’an 710068, China
2
School of Transportation Science and Engineering, Harbin Institute of Technology, Harbin 150090, China
3
Road & Bridge International Co., Ltd., Beijing 100027, China
*
Author to whom correspondence should be addressed.
Buildings 2024, 14(2), 330; https://doi.org/10.3390/buildings14020330
Submission received: 27 December 2023 / Revised: 17 January 2024 / Accepted: 22 January 2024 / Published: 24 January 2024

Abstract

:
Prestressed concrete composite girder bridges with corrugated steel webs (PCCGBCSWs) are extensively employed in bridge construction because of their low dead weight, fast construction, and high prestressing efficiency. Moreover, PCCGBCSWs will experience deformation and failure of the corrugated steel webs, including steel fatigue and fracture, during earthquakes. These changes will introduce safety hazards, which can be addressed via bridge disaster prevention and mitigation. Because near-fault pulse-like ground motions (NFPLGMs) have high peak accelerations, these motions can easily cause damage to a bridge. Therefore, in this study, a seismic fragility assessment is performed for long-unit PCCGBCSWs subjected to NFPLGMs considering spatial variability effects, and a sensitivity evaluation of the seismic fragility is conducted considering girder type, bearing type, ground motion type, and apparent wave velocity to offer a point of reference for seismic design. The results show that PCCGBCSWs are less vulnerable than concrete bridges. The shock absorption effect of the friction pendulum bearing is better than that of the viscous damper. The impact of NFPLGMs on bridges is greater than that of near-fault non-pulse-like ground motions (NFNPLMs) and far-fault ground motions (FFGMs). The seismic fragility under nonuniform excitation conditions is greater than that under uniform excitation conditions, showing an increasing trend with decreasing apparent wave velocity.

1. Introduction

Urban development is highly intensive and complex and characterized by a high population density, high wealth concentration, and high infrastructure saturation. However, earthquake disasters can be severe because they exhibit a wide range of characteristics, occur at a high frequency, and can cause considerable destruction. During earthquake disasters, urban bridge structures can be damaged or even destroyed, which has a significant impact on transportation systems and urban social functions [1,2,3]. Therefore, it is very important to prevent extreme damage to bridge structures during earthquake disasters and improve the postdisaster functional recovery capabilities of infrastructure systems.
PCCGBCSWs are a relatively recently developed bridge typology that is well suited for urban construction owing to their distinctive structural features and associated benefits, including a low dead weight, rapid construction, and efficient prestressing process [4]. The first PCCGBCSW put into operation was the Cognac bridge, completed by a French engineer in 1986 [5]. Based on the authors’ data, the global construction of PCCGBCSWs has surpassed 300 structures, with significant growth observed in Japan, China, and various other regions. Representative PCCGBCSWs are listed in Table 1. Recently, scholars have conducted theoretical analyses, numerical simulations and indoor experimental research on this type of bridge, resulting in numerous studies on its static properties, such as flexural strength [6] and elastic stiffness in shear [7] and torsional strength [8], with the goal of improving the static mechanical performance of bridges. However, there have been no in-depth studies on the seismic fragility assessment of PCCGBCSWs, resulting in an inability to guarantee the dynamic performance of bridge structures during disasters.
Jiang [9] conducted a comparison between the seismic dynamic responses of PCCGBCSWs, as determined through response spectrum analysis, and those of traditional concrete girder bridges. Wang [10] employed numerical simulation methods to analyse the dynamic characteristics of rigid frame bridges featuring corrugated steel webs, subsequently deriving seismic dynamic responses. In a study by Zhao [11], a comparative analysis of seismic dynamic responses was conducted on structures, considering and not considering pile–soil interactions. The results indicate the noteworthy impact of pile–soil interactions on the dynamic performance of structures. In the study by Wang [12], a quasistatic loading test was performed on a scaled model of composite girders with corrugated steel webs. The investigation involved a comparative analysis and examination of fundamental mechanical properties, including the structural failure modes, hysteresis loops, ductile behaviour, and deformation recovery ability. To bolster the seismic resistance of PCCGBCSWs during earthquakes, Zheng [13] devised a control system utilizing semiactive control technology. Wang [14] employed a “cloud method” to analyse fragility during construction. While certain scholars have focused on the dynamic performance of PCCGBCSWs under seismic waves, they have not thoroughly considered the structural and load characteristics. This has led to an underestimation of structural risks when earthquake disasters occur during operation phases, thus introducing potential safety risks for resilient urban disaster prevention and mitigation. Zheng [15] proposed a stiffness adaptive bearing, which solves the problem of considering the significant thermal deformation and thermal motion of the bearing during the vulnerability assessment of long-span bridges. A new type of isolation device was proposed for enhancing the adaptability and recovery ability of bearings to seismic responses [16]. Wang [17] studied the damping effect of 24 kinds of elastic connecting rods and viscous dampers with different parameters. The improved analytic hierarchy process (AHP) was used to optimize the control of the three-tower suspension bridge, and the optimal scheme was obtained.
Because NFPLGMs are characterized by large peak accelerations, high-frequency components, instantaneous onset, and nonperiodicity, structures may exhibit large dynamic responses when subjected to such ground motions, which can easily cause severe damage to PCCGBCSWs. Moreover, for large-span or long-unit bridges, neglecting the impact of the effects of the wave passage, site response, and incoherence may result in an underestimation of the ductility demands on piers [18]. Hence, it is fundamental to adequately consider the spatial variability impacts of inputs during structural response analysis. Therefore, in this study, the fragility of long-unit PCCGBCSWs subjected to NFPLGMs considering spatial variability effects was investigated. By selecting key structural and load parameters such as girder type, bearing type, ground motion type, and apparent wave velocity, the seismic fragility of a bridge under complex conditions can be comprehensively evaluated. This approach facilitates bridge safety and resiliency, and serves as a valuable resource for establishing seismic design parameters and criteria for these structures.

2. Analysis Methodology

2.1. Seismic Fragility Assessment Method

We carry out fragility analysis through previous research results based on reliability theory [19]. To comprehensively address the influence of load variability on seismic dynamic response, it is imperative to construct a probabilistic seismic demand model that encapsulates the stochastic interplay between ground motion intensity (input) and seismic dynamic response (output). Research findings have indicated that in the context of bridge dynamic analysis with random earthquake inputs, the seismic dynamic response follows a lognormal distribution [20].
S = ln ( μ ˜ d t ln , β d t )
where μ ˜ d t ln is the median value of the conditional seismic demand; these two parameters are calculated according to Formulas (2) and (3).
ln ( μ ˜ d t ln ) = α + β ln I M
β d t = t = 1 n [ ln ( d t ) ( α + β ln I M t ) ] 2 n 2
where IMt represents the intensity measure associated with the t-th input; α and β denote the statistical coefficients; and the seismic dynamic response represents the seismic dynamic response under the influence of the t-th input.
Xie [21] asserted that the structural resistance function subjected to seismic waves conforms to a lognormal distribution.
R = ln ( μ ˜ c t ln , β c t )
where β c t is the logarithmic standard deviation, which is taken as 0.2 [22], and μ ˜ c t ln corresponds to the central tendency or median value of the bridge seismic defence capacity when earthquakes occur.
This paper categorizes bridge structure damage into five states: no damage ( ψ 1 ), slight damage ( ψ 2 ), moderate damage ( ψ 3 ), extensive damage ( ψ 4 ), and complete damage ( ψ 5 ) [23]. The progression of damage in the pier is characterized as follows [24,25]: when the rebar of the pier begins to yield, the pier enters a state of minor damage; the emergence of a plastic hinge indicates a state of moderate damage; reaching the maximum bearing capacity in the bottom section signifies a state of severe damage; and when the compressive strain of the concrete reaches 0.002, the pier is considered completely damaged. The damage index results for different displacement ductility ratios of the piers are shown in Table 2. The P-M-φ analysis utilizes a nonlinear stress–strain relationship to accurately describe the material behaviour of the section. This method is applied to determine the cross-sectional curvature of a pier in its characteristic state. Subsequently, the damage assessment index is converted from curvature-based ductility to displacement-based ductility, establishing a displacement-based criterion for assessing the bridge damage state [19]. A pier is generally regarded as a compression–bending member when analysing the bending moment–curvature of reinforced concrete piers. Assuming a constant axial pressure, Formulas (5) and (6) can be derived from the internal force balance of the section. When the stress–strain relationships of the protective layer concrete, core concrete, and steel bar are known, the relationship between the bending moment and curvature for the section is established through the computation of Formulas (5) and (6).
N = σ ( ε y ) d A + j = 1 m A s j σ ( ε y j ) =   c o r e σ c o r e ( ε y ) d A c o r e +   c o v e r σ c o v e r ( ε y ) d A c o v e r + j = 1 m A s j σ ( ε y j )
M = σ ( ε y ) y d A + j = 1 m A s j σ ( ε y j ) y s j =   c o r e σ c o r e ( ε y ) y d A c o r e +   c o v e r σ c o v e r ( ε y ) y d A c o v e r + j = 1 m A s j σ ( ε y j ) y s j
Building upon the aforementioned analysis, the exceedance probability of component γ is computed according to Formula (7) [19].
P ψ ψ κ γ = Φ [ ln ( μ ˜ d t ln ) ln ( μ ˜ c t ln ) β c t 2 + β d t 2 ]
Assuming that the fragility between different components is completely independent [26], the bridge fragility is obtained based on reliability technology; see Formula (8).
max γ = 1 g [ P ψ ψ κ γ ] P ψ ψ κ s 1 γ = 1 g [ 1 P ψ ψ κ γ ]
In this context, P ψ ψ κ s denotes the probability of reaching at least the κ-th state of the system, P ψ ψ κ γ denotes the probability of attaining at least the κ-th state of component γ, and g is the total number of components.
Assuming that each component is connected in series, that is, as long as one of the components of the structure fails, the whole structure fails, the maximum exceedance probability of components for a certain damage state is taken as the lower limit of the structural exceedance probability for the damage state. Assuming that each component is in parallel, that is, only when all the components of the structure fail does the whole structure fail, the probability that at least one component will surpass a particular level of damage is taken as the upper limit of the structural exceedance probability. Studies have shown that the structural fragility calculated by assuming that the components are in parallel is close to the results of a Monte Carlo simulation [27]. Therefore, this paper adopts the latter as the calculation method for obtaining the fragility of a bridge structure.

2.2. Seismic Responses Considering Ground-Motion Spatial Variability Effects

For a discrete unit structural system rigidly connected to the ground, under seismic excitation, the dynamic equilibrium equation is as follows [28]:
[ M q q M q o M o q M o o ] { u ¨ q u ¨ o } + [ C q q C q o C o q C o o ] { u ˙ q u ˙ o } + [ K q q K q o K o q K o o ] { u q u o } = { 0 P o }
where qq and q represent the degrees of freedom at unsupported locations; oo and o represent the degrees of freedom at supported locations; qo and oq represent coupling terms between the unsupported location and the supported location; K, C, and M are the stiffness matrix, damping matrix, and mass matrices, respectively; u , u ˙ , and u ¨ represent the absolute displacement, velocity, and acceleration response, respectively; and Po is the external load vector caused by the earthquake.
For the external load Po between u supported locations, the ground motion spatial variability effect is represented by the acceleration cross-power spectral matrix [28].
S ( i ω ) = [ S 11 ( i ω ) S 1 z ( i ω ) S 1 u ( i ω ) S 21 ( i ω ) S 2 z ( i ω ) S 2 u ( i ω ) S h 1 ( i ω ) S h z ( i ω ) S h u ( i ω ) S u 1 ( i ω ) S u z ( i ω ) S u u ( i ω ) ]
where S h z ( i ω ) is the cross-power spectral density function of ground accelerations at supported locations h and z; see Formula (11).
S h z ( i ω ) = γ h z ( i ω ) S h h ( ω ) S z z ( ω )
where γ h z ( ω ) is the coherency function for the accelerations at supported locations h and z, and S h h ( i ω ) and S z z ( i ω ) are the self-power spectral density functions of ground accelerations at supported locations h and z, respectively; see Formula (12) [29].
S ( ω ) = ω g 4 + 4 ζ g 2 ω g 2 ω 2 ( ω g 2 ω 2 ) 2 + 4 ζ g 2 ω g 2 ω 2 ω 4 ( ω f 2 ω 2 ) 2 + 4 ζ f 2 ω f 2 ω 2 S 0
where S0 is the spectral intensity factor; ω g and ω f are the natural frequencies of the first filter and second filter, respectively; and ζ g and ζ f are their damping ratios.
Kiureghian [30] examined the factors influencing the coherence function of ground motion, and highlighted the negligible impact of the attenuation effect. Building upon this observation, he introduced a seismic excitation model that combines the effects of the spatial variability arising from the lack of coherence, the wave passage, and the site response. Soyluk [28] adopted Formula (13) [31].
γ h z ( i ω ) = | γ h z ( ω ) | exp { i [ θ h z , w p ( ω ) + θ h z , s r ( ω ) ] }
where | γ h z ( ω ) | represents the incoherence effect, θ h z , w p ( ω ) represents the wave passage effect, and θ h z , s r ( ω ) represents the site response effect.
In this paper, the coherence decay component is defined as shown in Formula (14):
| γ h z ( ω ) | = exp [ ( α d h z ω v s ) 2 ]
where α / v s is the coherency decay parameter, vs is the shear wave velocity, and dhz is the distance between sites h and z.
The impact of the wave passage phenomenon arising from the diverse arrival times of waves at supported locations is [32]
θ h z , w p ( ω ) = ω d h z L sin ( ϕ ) v s = ω d h z L v a p p
where d h z L is the projection of dhz onto the ground surface along the path of wave propagation, v a p p is the apparent wave velocity, and ϕ denotes the incidence angle of plane waves arriving at sites h and z.
The influence of the site response effect resulting from distinct local soil conditions is derived with Formula (16), solely relying on the soil properties.
θ h z , s r ( ω ) = tan 1 Im [ H h ( ω ) H z ( ω ) ] Re [ H h ( ω ) H z ( ω ) ]
where H h ( ω ) and H z ( ω ) are the local soil frequency–response functions, which are
H h ( ω ) = ω h 2 + 2 i ζ h ω h ω ω h 2 ω 2 + 2 i ζ h ω h ω
where ω h and ζ h are the frequency and damping ratio of site h, respectively, in which the soil layer is idealized as an oscillator with a single degree of freedom.

3. Case Study

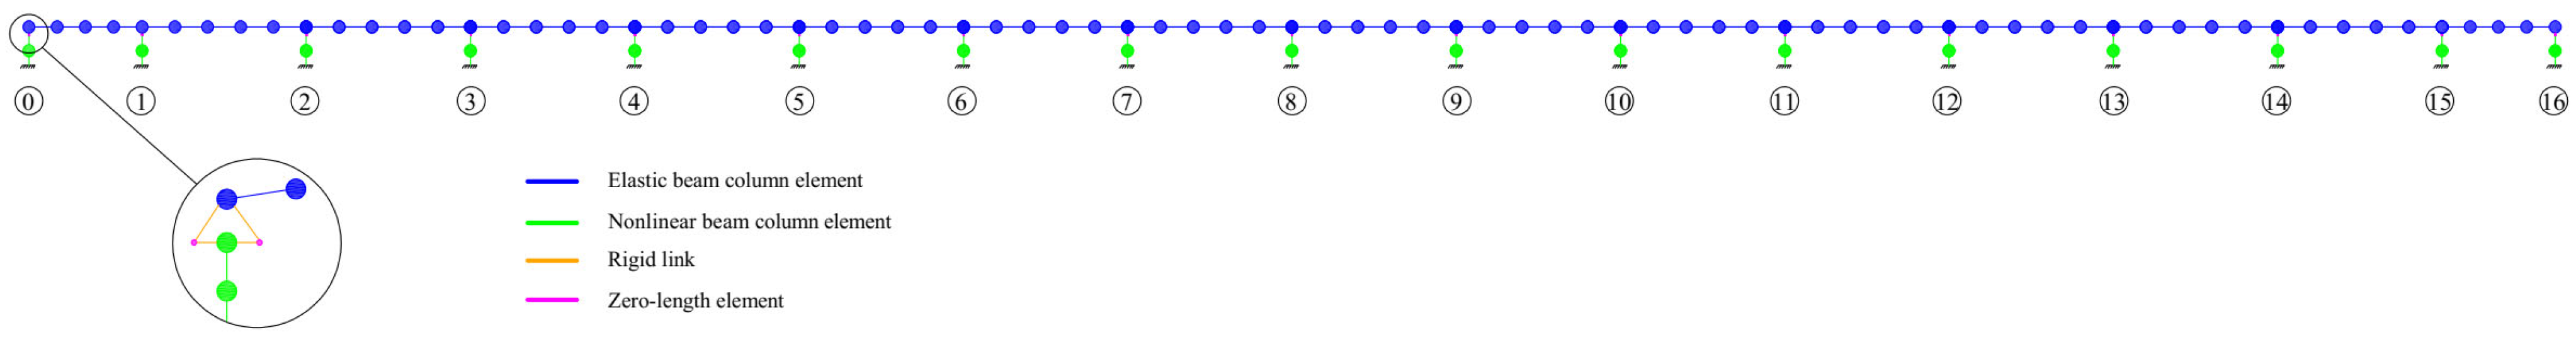
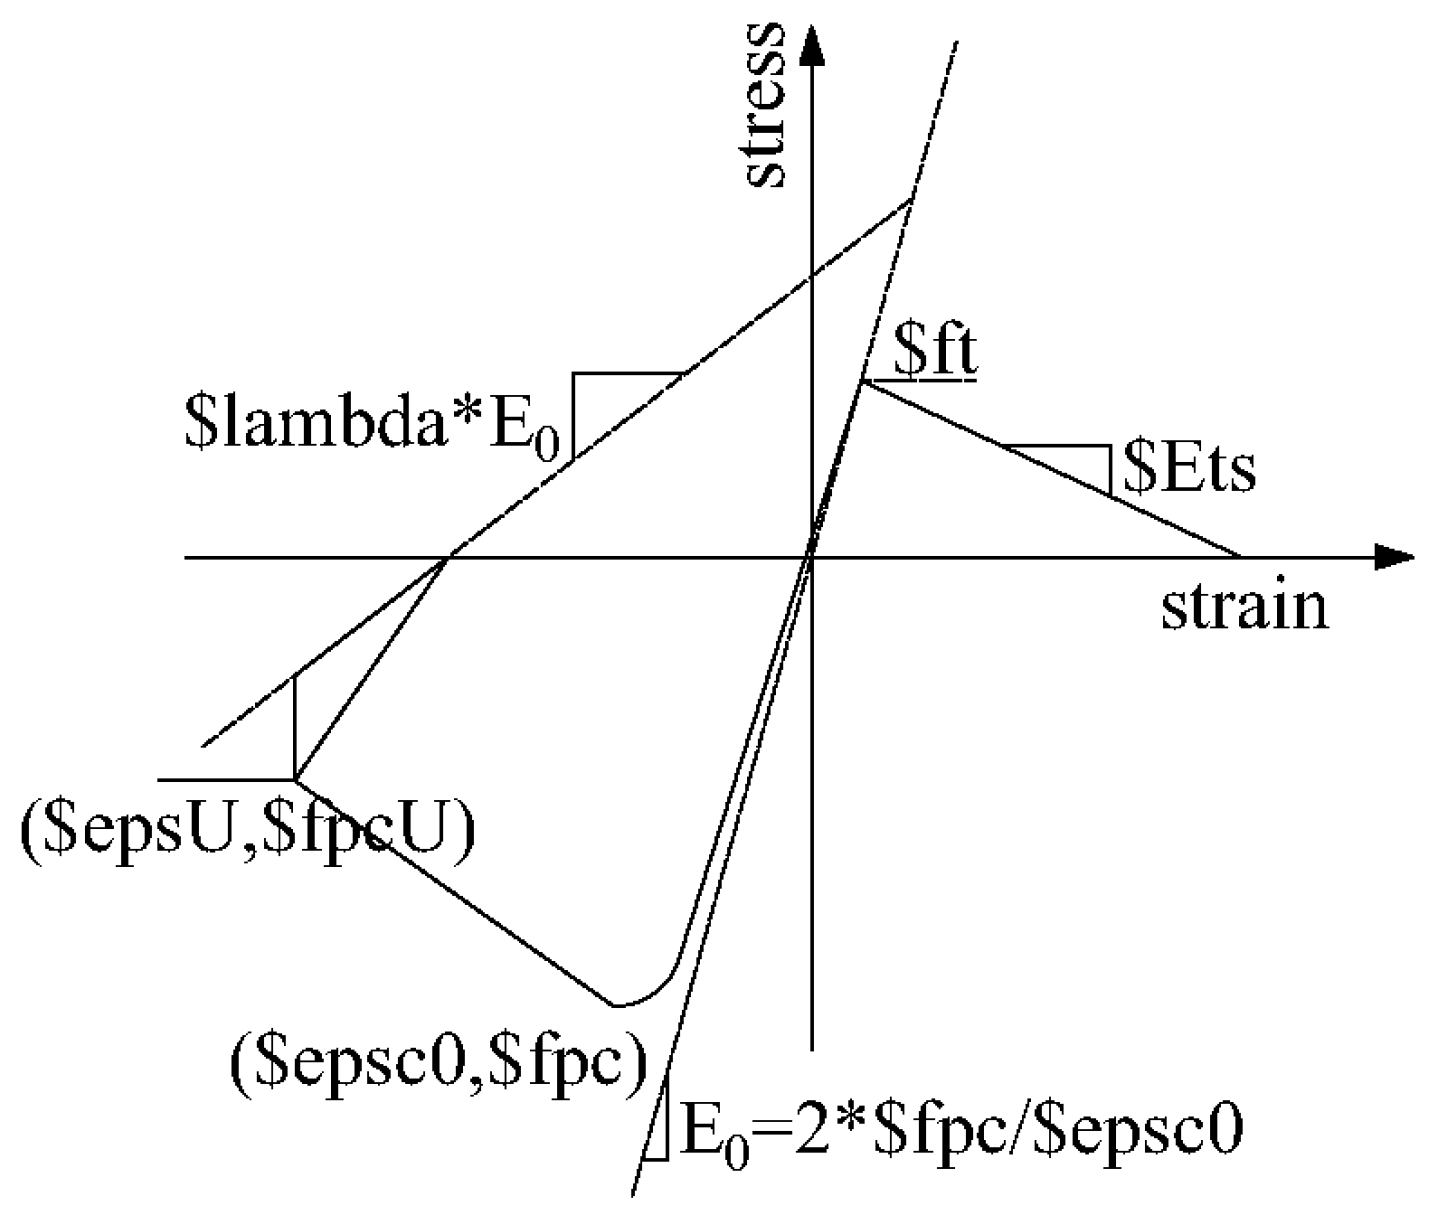
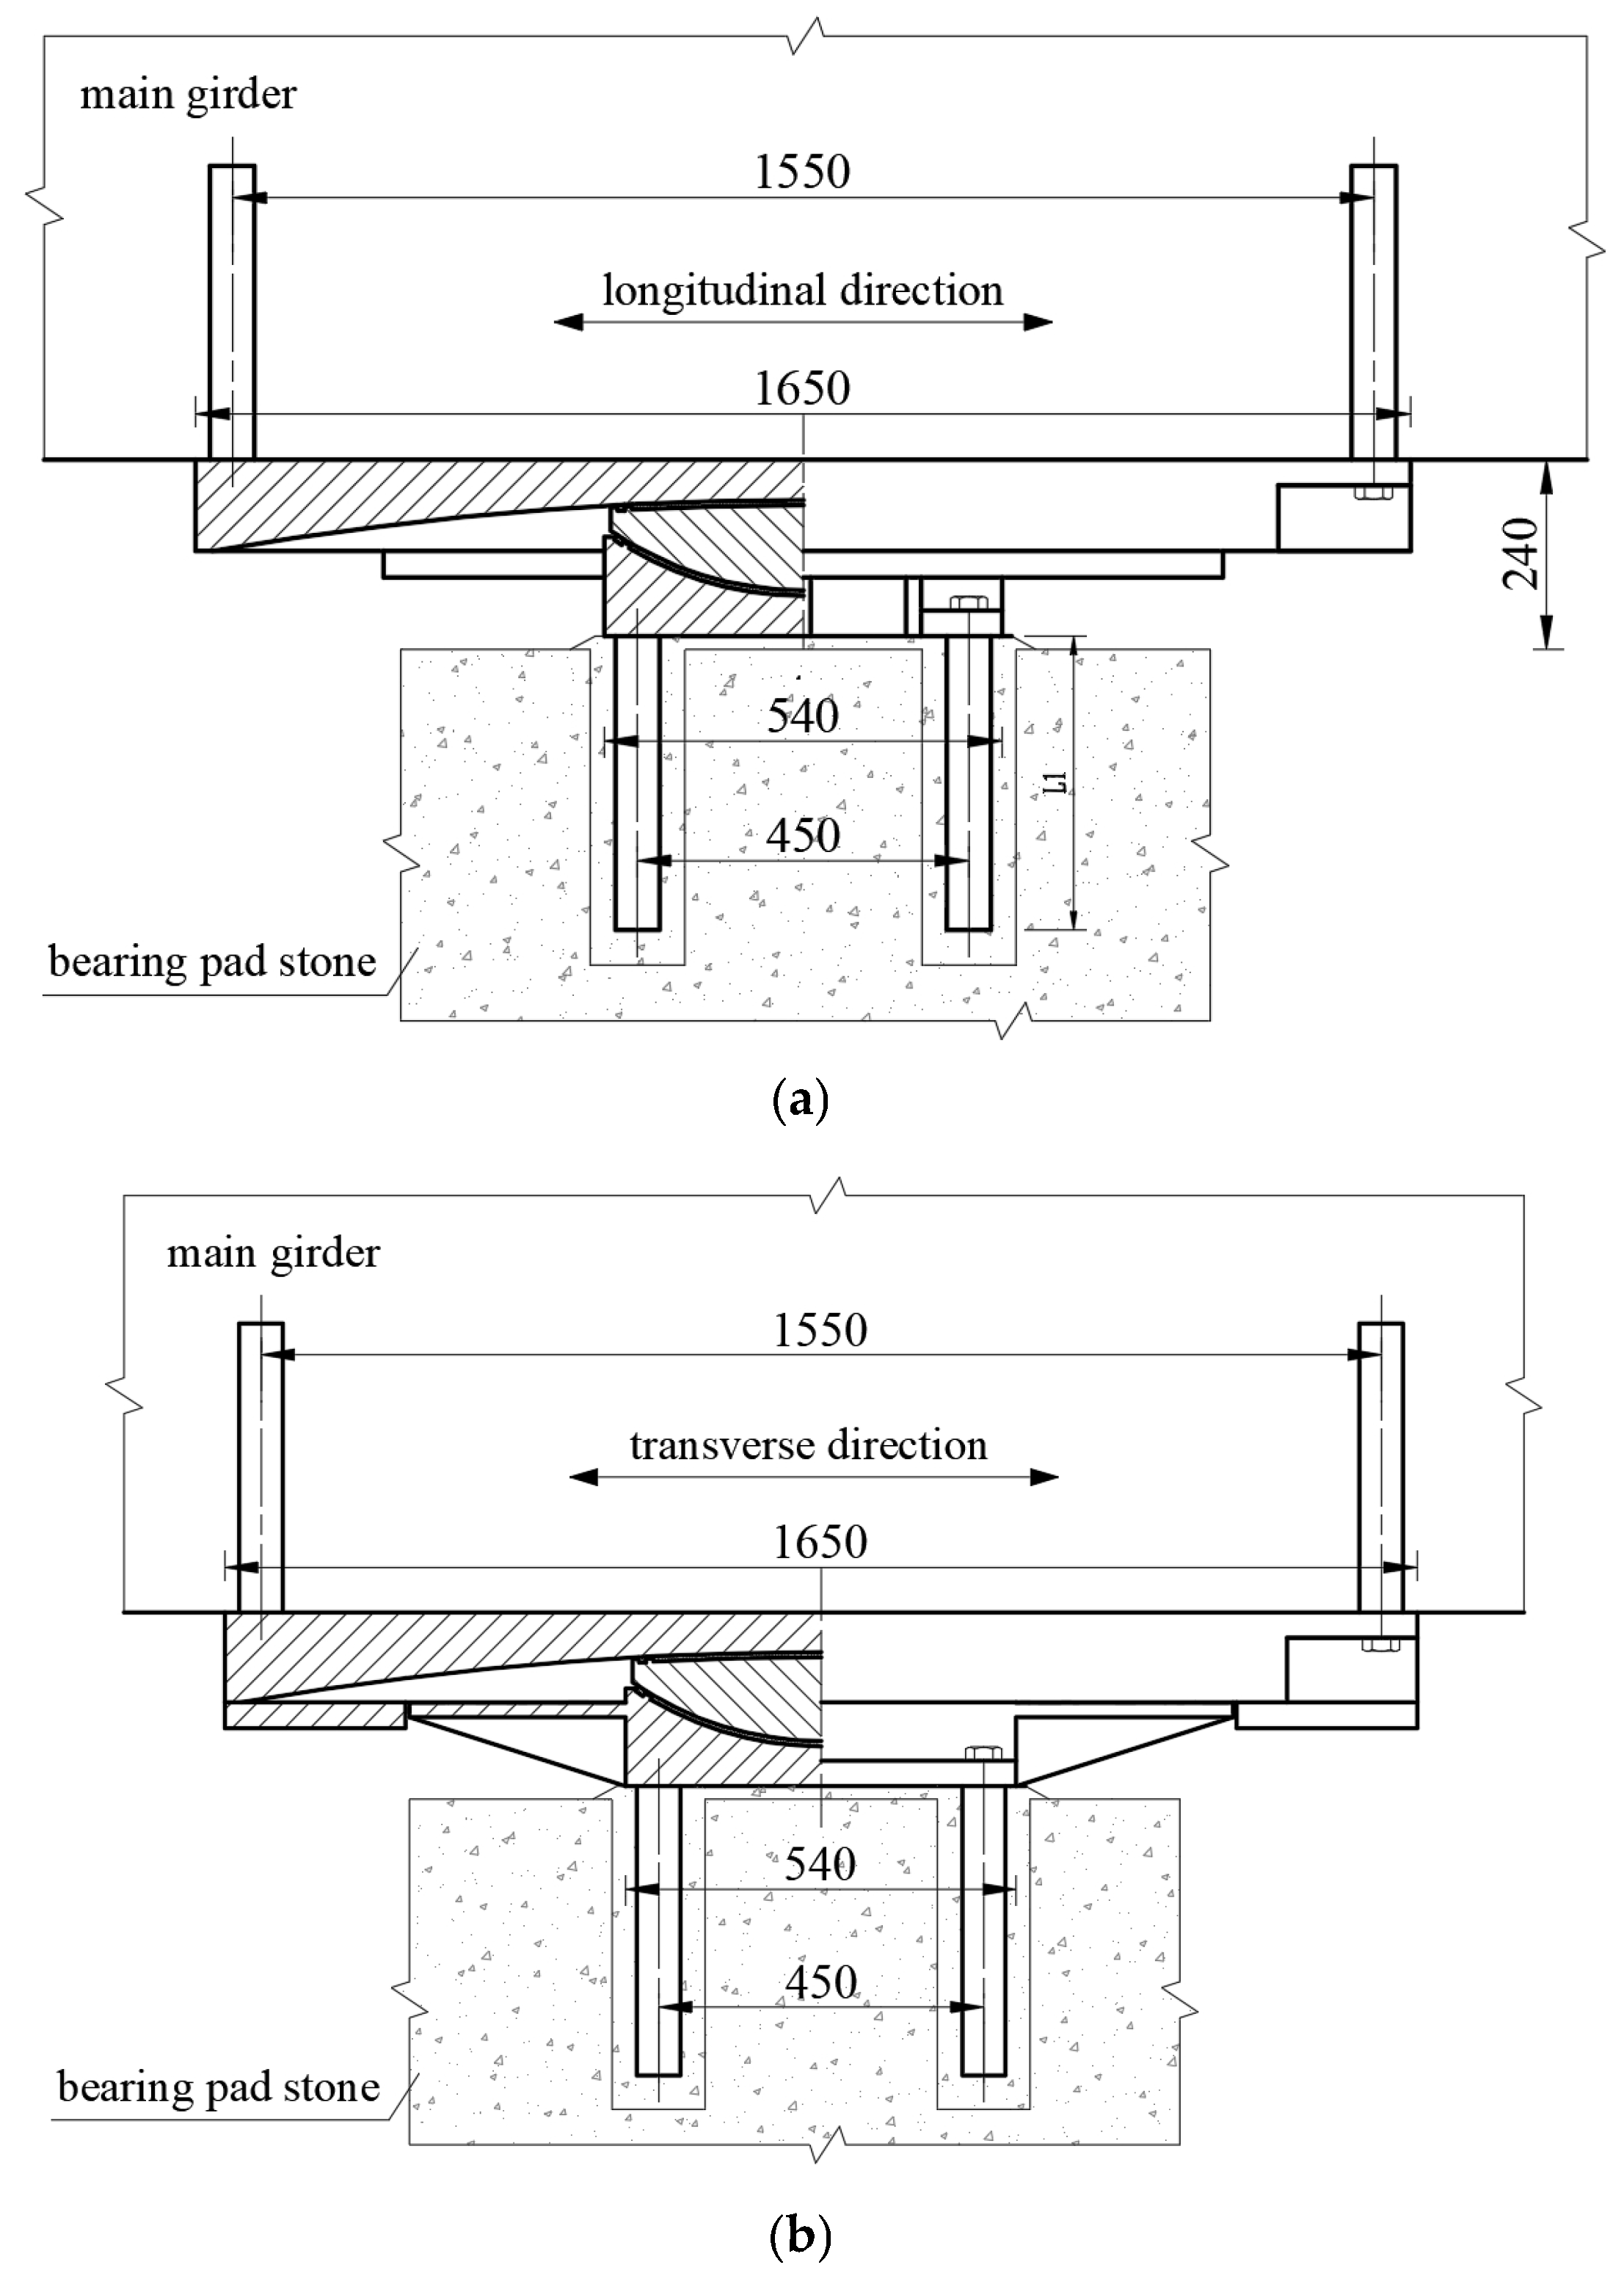
3.1. Numerical Model

The bridge studied in this paper is the Ningxia Shizuishan Hongyazi Yellow River Bridge, whose span layout is 62 + 14 × 90 + 62 m. This bridge is a PCCGBCSW bridge, and the substructure is a reinforced concrete pier column. As shown in Figure 1, Figure 2, Figure 3 and Figure 4, the girder adopts a variable cross section, and the height of the girder varies from 3 m to 6 m. The heights of the main pier and transition pier are 15.0 m and 12.0 m, respectively. In addition, the bridge uses friction pendulum bearings. Table 3 shows the structural characteristics of this bridge.
OpenSees is used to analyse the fragility of PCCGBCSWs subjected to NFPLGMs. As shown in Figure 5, the numerical model is established. The number in the figure is the label of each pier. The girder of the bridge is in a linear elastic state when ground motions occur, and the beam–column element based on displacement is used for the simulation. The main girder and pier are C50 and C40, respectively, and they are assigned the Kent–Park constitutive model [33]. In the OpenSees framework, the Concrete02 material, which is grounded on the Kent–Park model, is employed, and its constitutive relation model is presented in Figure 6. Usually, it is assumed that the superstructure remains elastic during an earthquake event. The concrete bridge deck is simulated by an elastic plate element, and the corrugated steel web is simulated by an elastic beam-column element. A rigid connection is established between the bridge deck and the steel beam. The rebar in the pier, composed of HRB400, adopts the Giuffré–Menegotto–Pinto model [34]. In the OpenSees software, the Steel02 material, utilizing the Giuffré–Menegotto–Pinto model, is selected, and its constitutive relation model is illustrated in Figure 7. In this study, nonlinear beam-column elements in OpenSees (v2.2.2) are used for piers, caps, and piles. The pier elements near the bottom of the pier are Beam with Hinges Element, the remaining pier body is made of ElementnonlinearBeamColumn, and the body and the pile cap are made of ElementdispBeamColumn. The soil is made of Quad Element, and the soil spring around the pile is made of zero-length elements. The details of the soil spring around the pile are shown in Figure 8 [35]. The zero-length element is utilized to emulate the friction pendulum bearing, and its model for restoring force is illustrated in Figure 9. The essential parameters for the bearing are outlined in Table 4. The mechanical properties of the friction pendulum support are shown in Table 5, and its geometric properties are shown in Figure 10. The mechanical properties of the materials used in the bridge structure are shown in Table 6.
In this paper, midas Civil (2022) is utilized to establish a numerical model for eigenvalue analysis to obtain the periods and frequencies of each mode of vibration. Then, the calculation results for midas Civil are contrasted with those for OpenSees. Table 7 shows the period and frequency data of the first ten modes of vibration.
The above table shows that the period and frequency of the first ten modes obtained by the eigenvalue analysis of the models based on these two software programs not being very different. It can be concluded that the nonlinear finite element model built in OpenSees is very accurate.

3.2. Probabilistic Seismic Demand Analysis

Sixty NFPLGMs in the PEER database are selected and adopted as inputs to Pier 0. To effectively identify the pulse effect of NFGMs, the peak ground velocity (PGV)/peak ground acceleration (PGA) is selected as the index. The criteria for selecting NFPLGM records include a fault distance less than 12.43 miles, a PGV/PGA of at least 0.2, and a magnitude exceeding 6.0. According to the relevant regulations [36], when there is no reliable basis, 1000 m/s or the most unfavourable apparent wave velocity for structural response of at least 1000 m/s should be taken. Assuming an apparent wave velocity of 1000 m/s, the inputs for the remaining piers are produced using the approach outlined in this paper. The ground motion displacement time histories of the three orthogonal directions are input into OpenSees, which are adjusted according to the coefficient of 1:0.85:0.65 [37].
The PGA is chosen as the IM to encompass the variability in ground motions. In this study, the uncertainty of structural materials is accounted for by choosing two parameters: the strength of the steel yield and the compressive strength of the concrete. The statistical information of the random variables obtained by Latin hypercube sampling is shown in Table 8 [38]. The displacement-to-ductility ratio is considered the primary engineering demand parameter. Utilizing a dataset consisting of 60 sets of ground motion inputs and corresponding bridge structure models, the probabilistic seismic demand model for each pier in orthogonal directions is derived via rigorous nonlinear dynamic time history analysis. Using pier 1 as an illustrative case, according to 60 sets of ground motion and statistical information of random variables, 60 sample points containing ground motion intensity and sound can be obtained. The probabilistic seismic demand model is regressed by the least squares method, as illustrated in Figure 11.

3.3. Damage Index Analysis

To evaluate the structural damage grade of the PCCGBCSWs, the displacement ductility ratio is computed based on various key curvatures, including the first yield curvature, equivalent yield curvature, curvature at a concrete strain of 0.002, and ultimate curvature of the pier. In the moment–curvature curve, the initial elastic section is defined as the connection between the origin and the first yield point of the tensile steel bar. The equivalent yield curvature is determined by adjusting the position of the horizontal line of the plastic section so that the areas of the two shadowed parts in Figure 12 are equal. The curvature is the equivalent yield curvature. The ultimate curvature is the maximum curvature that the pier can reach under extreme loading conditions. These curvatures collectively serve as damage assessment indices for piers across different damage states. The P-M-φ analysis for each pier is conducted through XTRACT, resulting in the calculation of the damage index, as listed in Table 9.

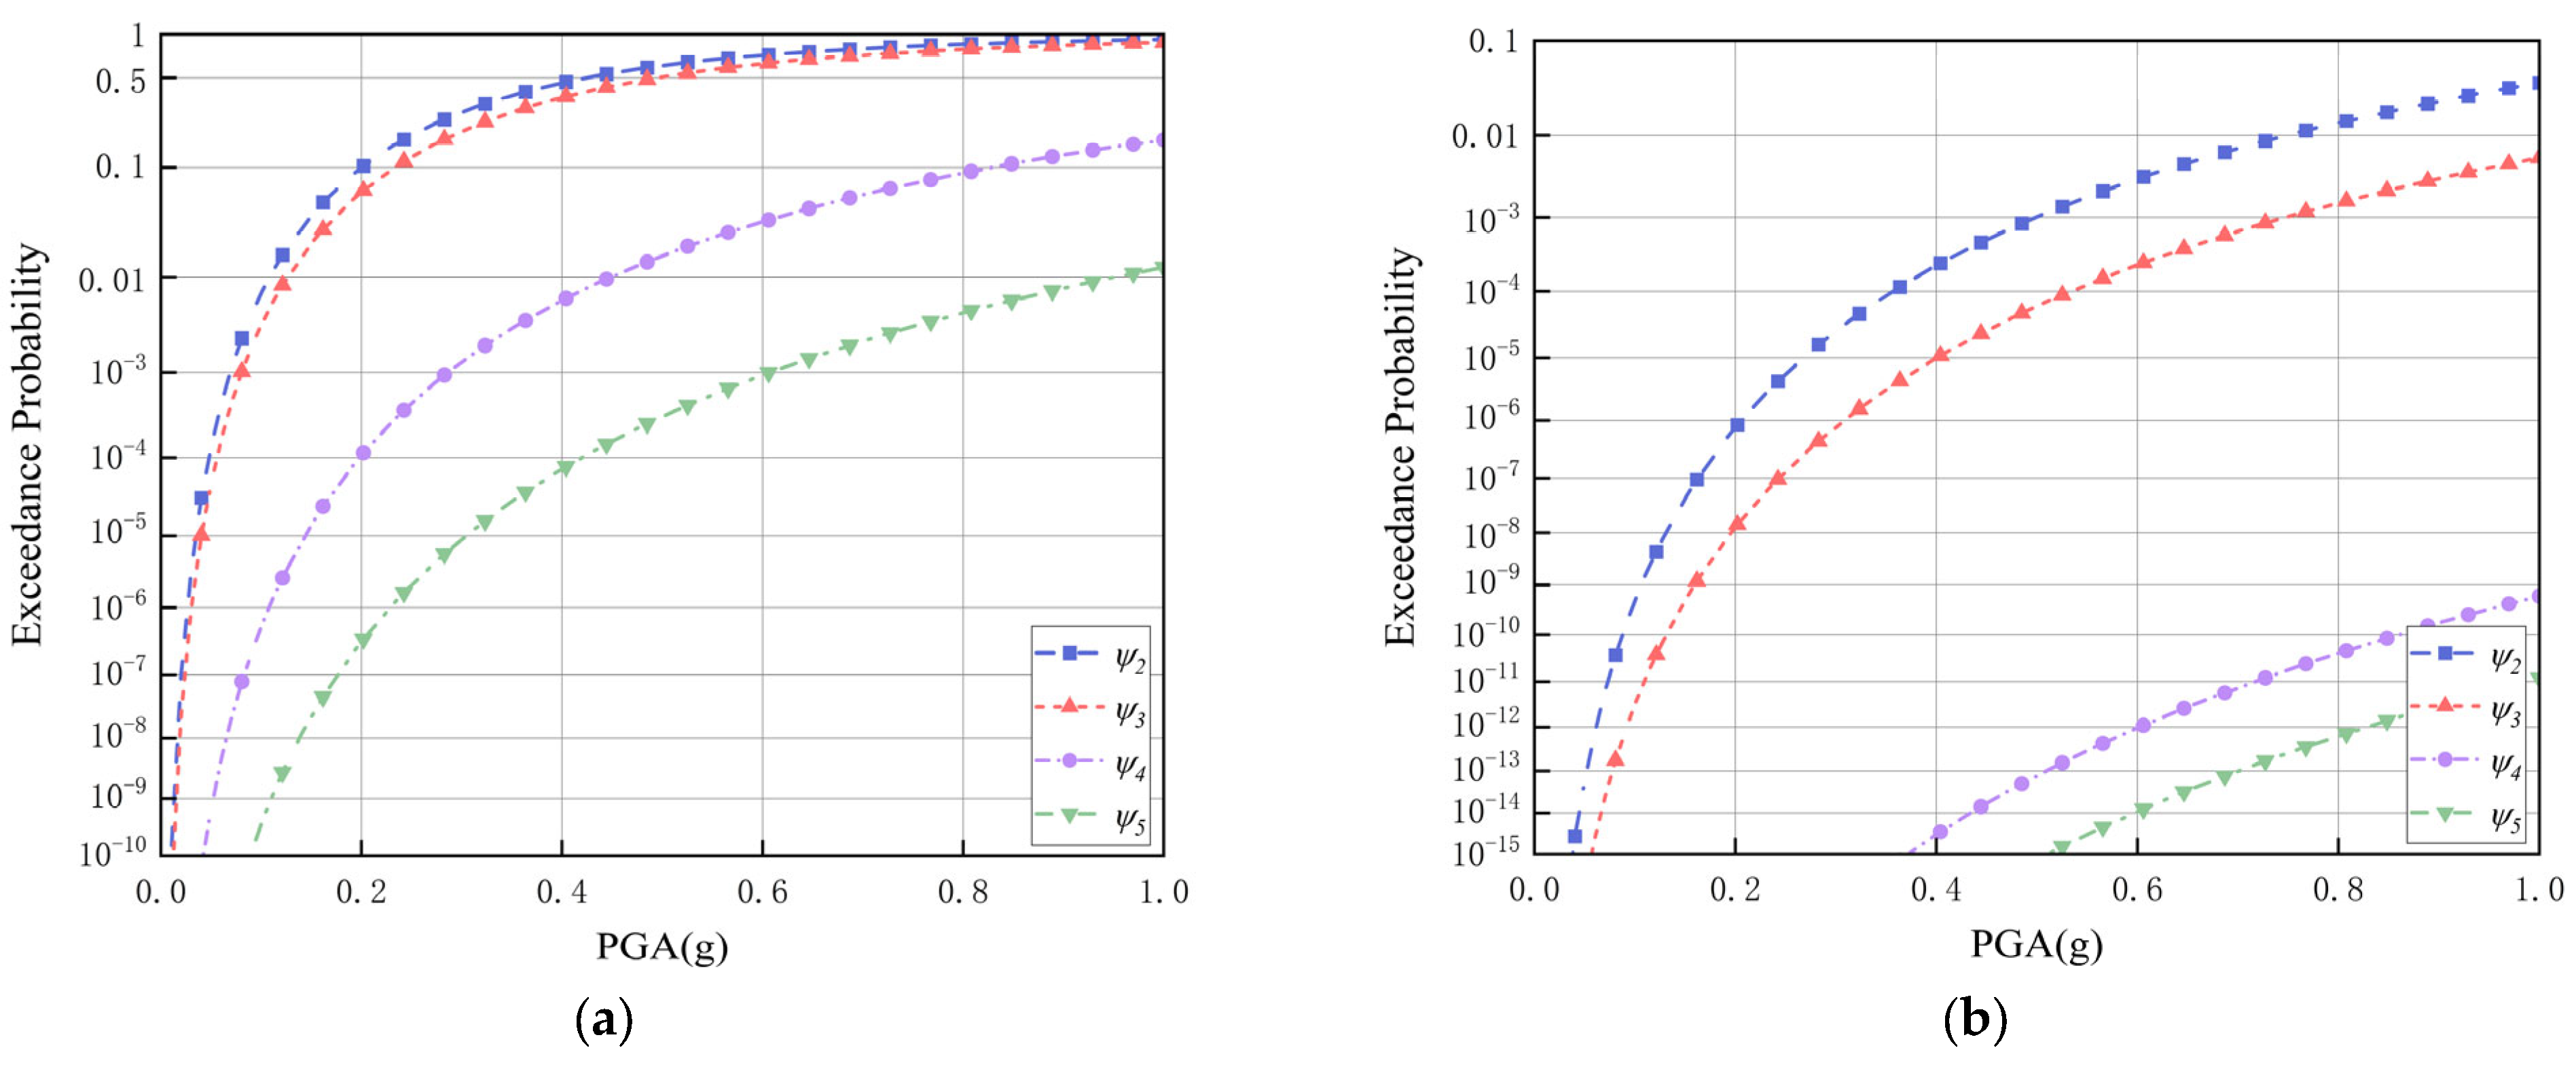
3.4. Fragility Assessment

Taking pier 1 as an example, the seismic fragility in the orthogonal direction is obtained according to Formula (7), as shown in Figure 13. According to Formula (8), the bridge structure fragility is obtained, as illustrated in Figure 14.
According to Figure 13, the pier fragility in the longitudinal orientation exceeds that in the perpendicular direction. The pier longitudinal section is smaller than the transverse section, which increases the probabilistic seismic demand and reduces the ductility index, thus increasing the fragility. According to Figure 13b, the fragility associated with the four damage states evidently shows considerable seismic capacity. Because the transverse length of the pier is nearly three times the longitudinal length, the transverse seismic resistance capacity of the transverse pier significantly surpasses that of the longitudinal pier.
Based on the information in Figure 14, the bridge is susceptible to minor and moderate damage. Because the transverse pier fragility is lower, the bridge fragility structure closely corresponds to that observed in the axial direction of piers. Therefore, when designing bridges, the section sizes of the pier should be reasonably designed to prevent the problem of an insufficient seismic capacity of the bridge in a certain direction.

4. Discussion

4.1. Girder Type

Considering the unique characteristics of PCCGBCSWs, in this study, the variation trends of seismic fragility are investigated when the superstructure is a prestressed concrete girder, a composite girder with CSWs, and a steel girder under the constraint of keeping the girder height and the width of the box girder constant. To visually portray the influence of girder type on bridge vulnerability and for subsequent analysis and discussion, this study contrasts the fragility curves of the three girder types under the same bridge damage state, as depicted in Figure 15.
In Figure 15, the seismic fragility comparison among various bridge superstructure forms reveals the conspicuous impact of the superstructure configuration on the seismic resilience of bridges. When the PGA is constant, the fragility of the steel girder, composite girder with CSWs, and prestressed concrete girder increases in turn.
According to the seismic fragility analysis, the density of steel is lower than that of concrete. Changing the form of the upper structure actually changes the weight of the girder. Reducing the quality of the upper structure will reduce the seismic fragility to a certain extent. Therefore, in the structural design of a bridge considering seismic waves, a balance between the weight of the superstructure and the girder type should be sought to reduce the seismic fragility to achieve the optimal solution.

4.2. Bearing Type

Considering the influence of different bearing forms of isolation and shock absorption measures on seismic fragility, the variation trends of the seismic fragility of basin rubber bearings, friction pendulum bearings, and viscous dampers plus sliding bearings are studied. For a more intuitive depiction of the bearing type’s impact on the bridge’s fragility and for subsequent analysis and discussion, this study contrasts the fragility curves for the three types of bearings under identical bridge damage conditions, as depicted in Figure 16.
In Figure 16, the comparison of bridge structure fragility with various bearing forms reveals that seismic isolation bearings significantly enhance the seismic capacity of the bridge under fixed PGA conditions. Moreover, the damping effect of friction pendulum bearings surpasses that of viscous dampers.
In seismic fragility analysis, in the event of an earthquake, friction pendulum bearings and viscous dampers dissipate some of the energy, thereby mitigating the seismic dynamic response and reducing bridge vulnerability. Therefore, when engineering bridges in seismically active regions, the seismic isolation design at the bearing should be considered, and basin rubber bearings should be avoided as much as possible to enhance the seismic capacity and reduce losses when disasters occur.

4.3. Ground Motion Type

Based on the fault distance and PGV/PGA, three ground motion categories are chosen, while the number of each type of seismic wave is 60; these ground motion categories include NFPLGMs, NFNPLMs, and FFGMs. Then, the variation in seismic fragility subjected to three seismic waves is studied. For a clearer illustration of how the vulnerability of a bridge is influenced by ground motion type and for subsequent analysis and discussion, this study contrasts three ground motion type fragility curves under the same bridge damage state, as depicted in Figure 17.
As shown in Figure 17, by comparing the fragility of bridges subjected to different ground motion types, the bridge fragility for the NFPLGMs, NFNPLMs, and FFGMs decreases in turn at a constant PGA.
From the perspective of seismic fragility analysis, compared with that of FFGMs, the source of NFGMs is closer to bridges and has a directional effect. The intensity of NFGMs perpendicular to the fracture often greater than that in the direction coinciding with the fracture. The closer the ground motion is to the epicentre, the more obvious the direction is, resulting in a greater NFGM response than FFGM response. According to the NFPLGM data, due to the Doppler effect, if the fracture development direction is consistent with the propagation direction, the fractures will be superimposed together to form a pulse, resulting in an NFPLGM response greater than that of the NFNPLMs. Therefore, bridge sites should be far from seismically active regions, and bridge design in seismically active regions should fully consider the damage degree of NFGMs to bridges to reduce seismic fragility.

4.4. Apparent Wave Velocity

Given the significant influence of the wave passage effect in shaping spatial variations in ground motion [39], this research examines fluctuations in the seismic vulnerability of bridges exposed to both consistent and different excitations, considering apparent wave velocities of 1500, 1000, and 500 m/s [40]. To visually illustrate the influence of the apparent wave velocity on the seismic fragility and for subsequent analysis and discussion, this paper contrasts fragility curves corresponding to the three apparent wave velocities under the same bridge damage state, as portrayed in Figure 18.
As shown in Figure 18, the bridge seismic fragility at different apparent wave velocities is compared with the seismic fragility at constant excitation. It is clear that the seismic fragility under nonuniform excitation is greater than that under uniform excitation when the PGA remains consistent and increases with decreasing apparent wave velocity.
In terms of seismic fragility analysis, the influence of the wave passage effect yields an amplified seismic dynamic response in the bridge, leading to an increase in bridge fragility. Consequently, it is crucial to include the fragility associated with the wave passage effect during seismic fragility assessments to prevent an overestimation of earthquake resistance.

5. Conclusions

In this study, a fragility analysis of long-unit PCCGBCSWs subjected to NFPLGMs considering spatial variability effects was carried out using OpenSees. For the purpose of comprehensively considering the seismic performance of PCCGBCSWs under complex conditions, a sensitivity analysis of the girder type, bearing type, and ground motion type was conducted with different apparent wave velocities. The main conclusions are summarized as follows:
(1)
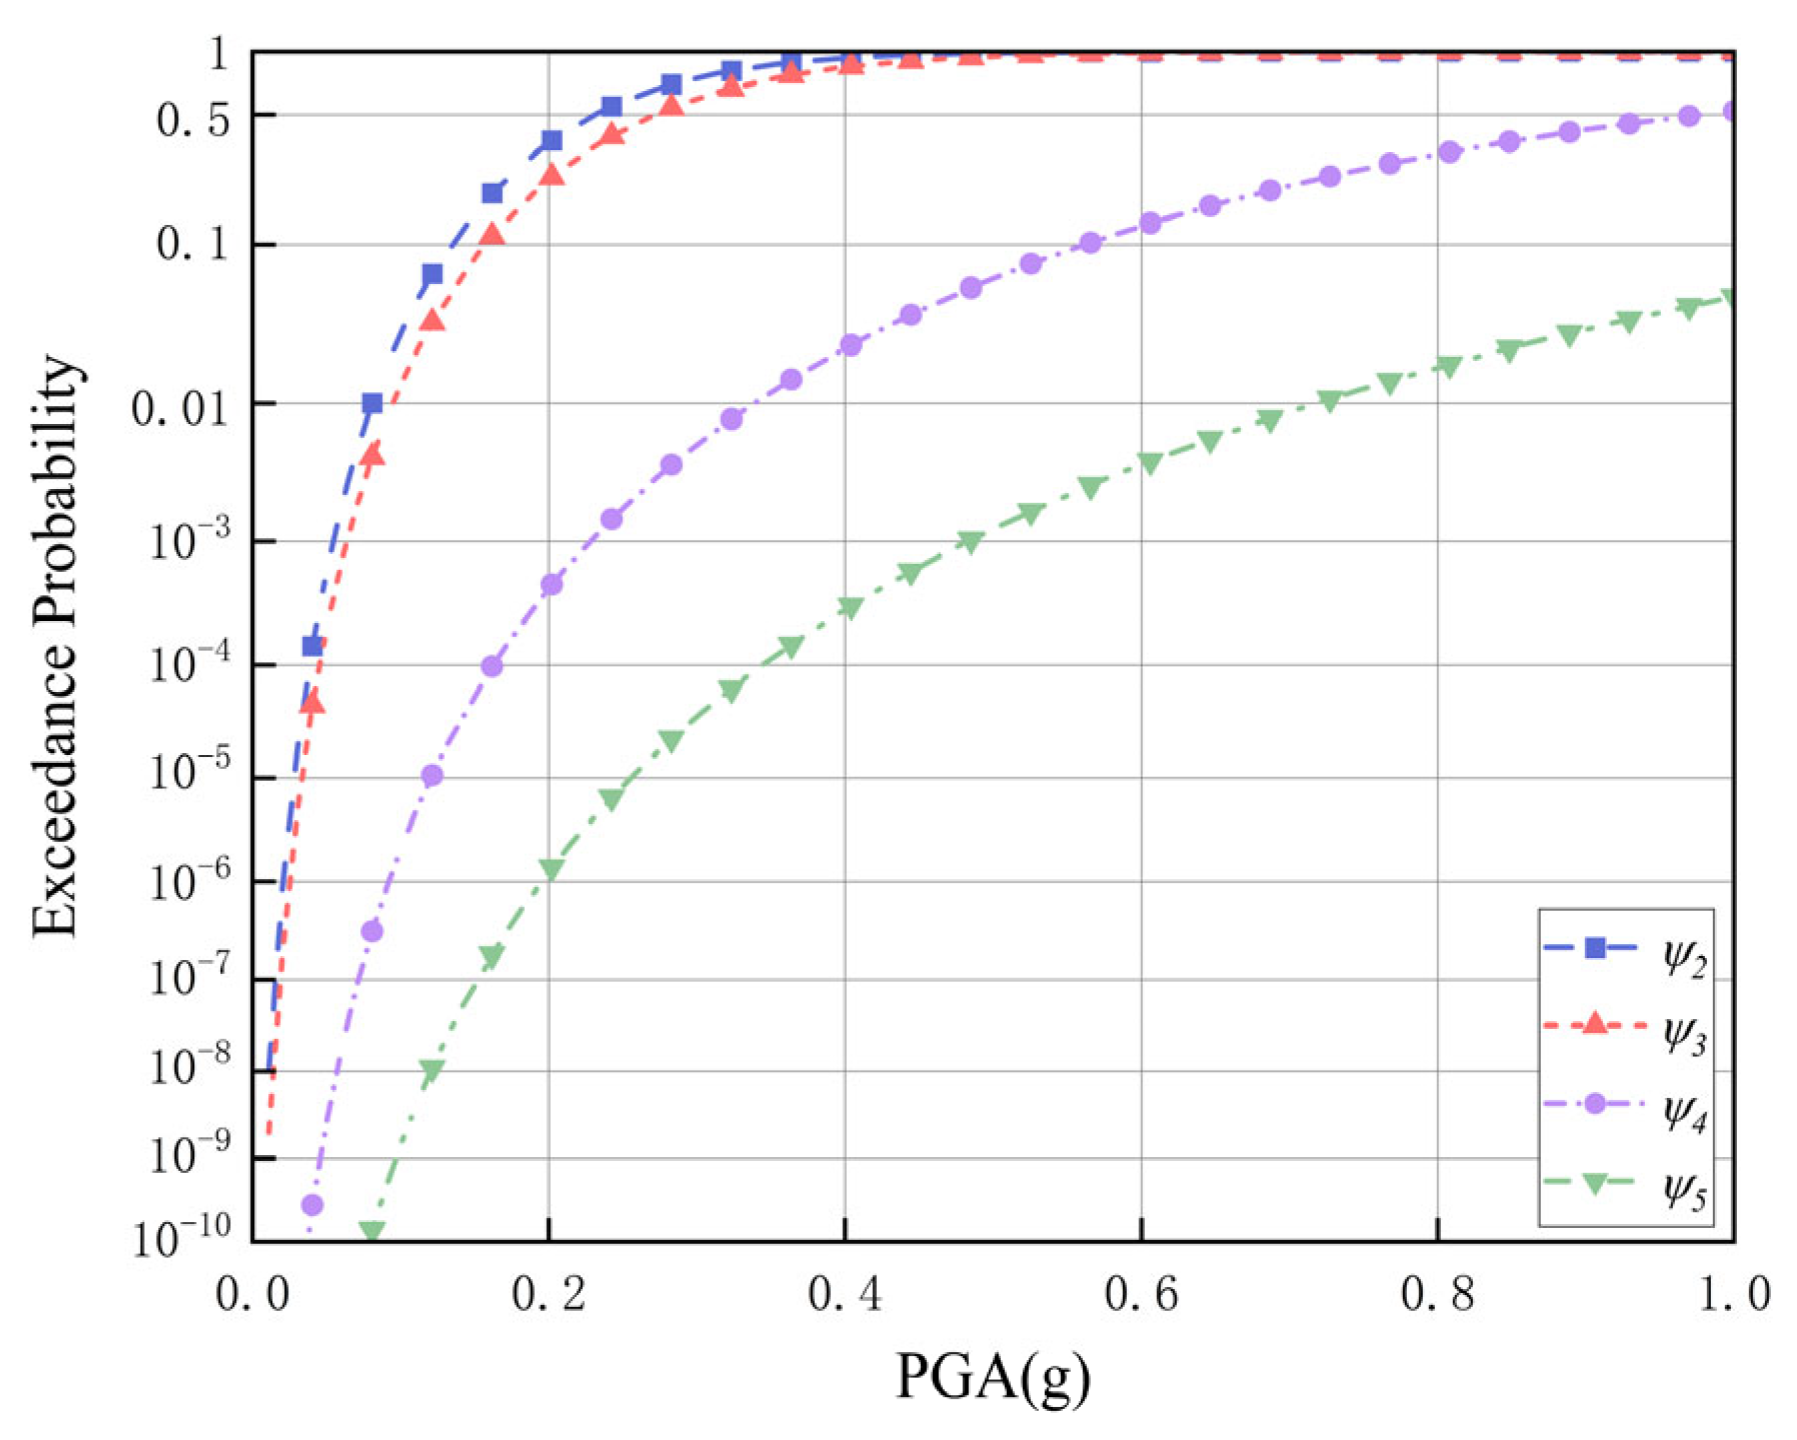
The fragility of PCCGBCSWs increases with increasing PGA, whereas the odds of experiencing ψ 2 and ψ 3 surpass the likelihood of extensive and complete damage, exhibiting considerably greater growth rates. Therefore, in the seismic design of bridges, a judiciously designed pier section size is paramount for mitigating the risk of inadequate seismic resilience in specific directional scenarios.
(2)
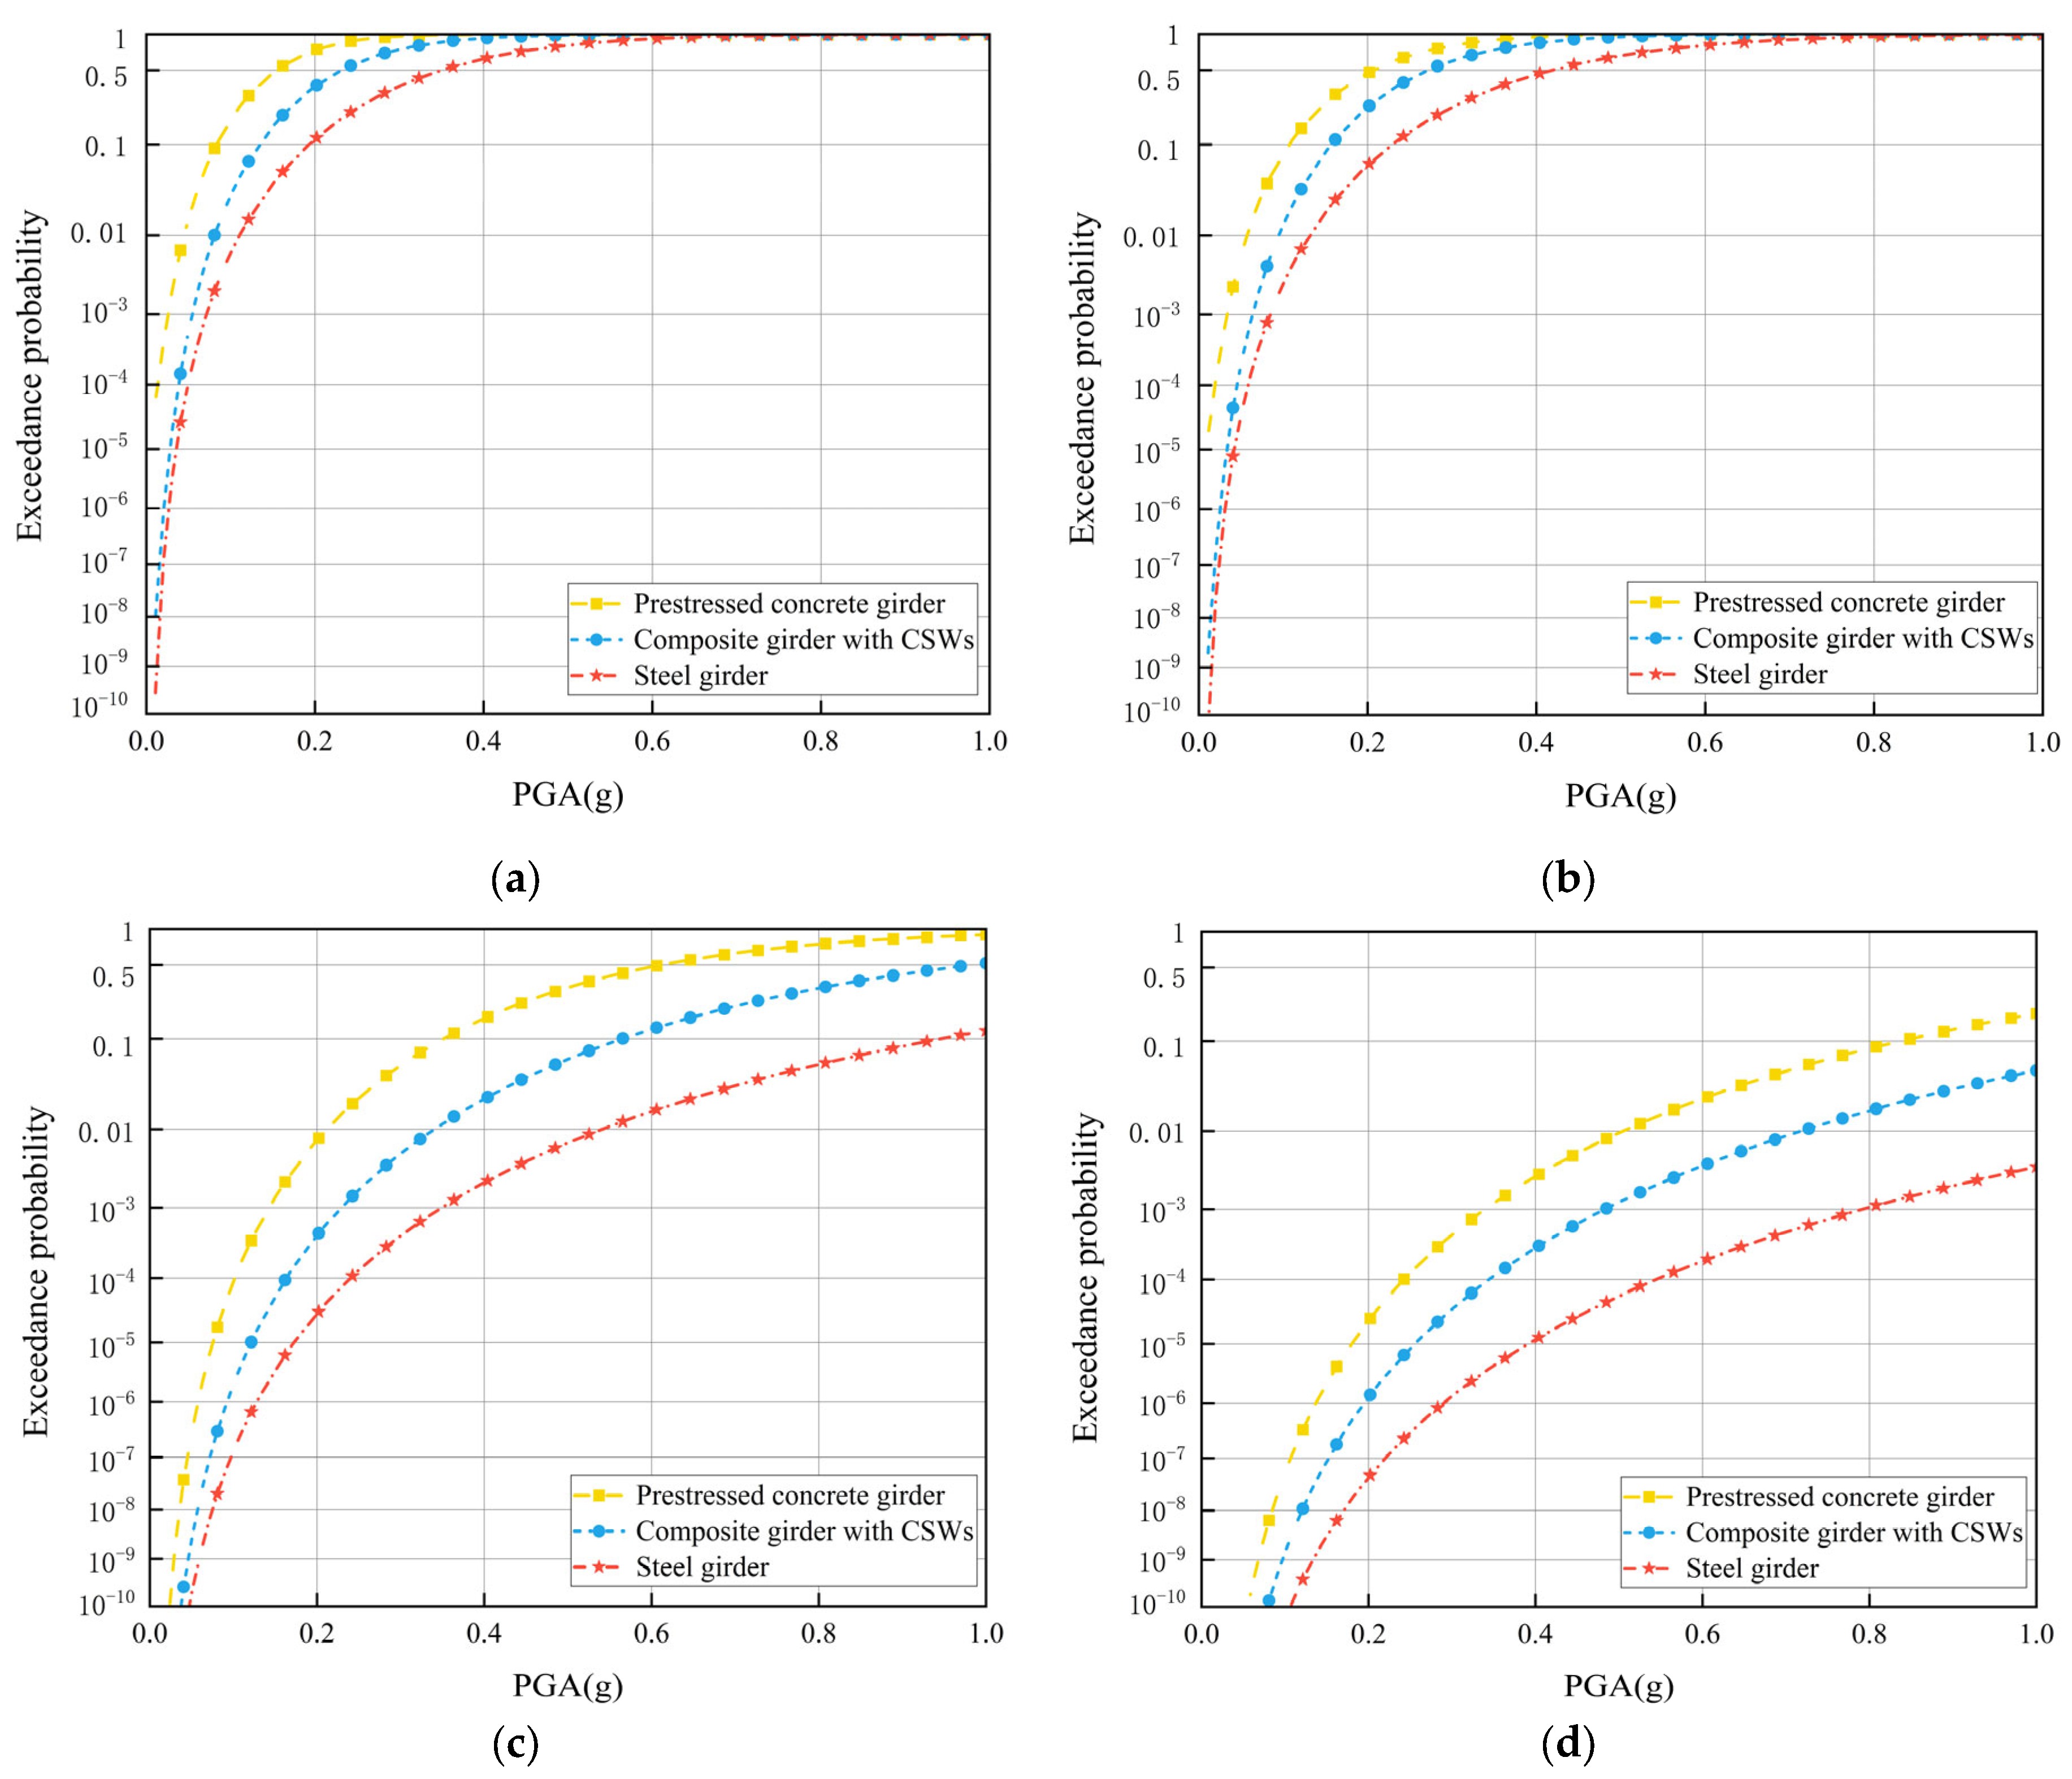
When the PGA is constant, the fragility of the steel girder composite girder with CSWs and prestressed concrete girder increases in turn. The weight of the upper structure is changed due to the different selections of materials. Reducing the weight of the upper structure will reduce the seismic fragility to a certain extent. Therefore, to account for the unique structural characteristics of PCCGBCSWs, such as low self-weight, fast construction, and high prestressing efficiency, a balance should be found between the dead weight of the superstructure and the structural form to achieve the optimal solution while designing bridges.
(3)
The seismic isolation bearing and viscous damper limit the seismic dynamic response of a bridge by reducing part of the energy when an earthquake occurs. When the PGA is certain, the seismic isolation bearing can effectively enhance the bridge seismic capacity, and the damping effect of friction pendulum bearings is better than that of viscous dampers. In addition, basin rubber bearings should be avoided as much as possible.
(4)
The bridge fragility decreases with increasing distance from the source, and the ground motion pulse effect exerts a substantial influence on the robustness of the bridge vulnerability. The bridge fragility for the NFPLGMs is lower than that for the NFNPLMs, which is lower than that for the FFGMs. In the assessment of bridge seismic capacity, fully considering the characteristics of NFPLGM effects is highly important for avoiding the overestimation of the earthquake resistance.
(5)
The fragility of long-unit PCCGBCSWs is related to the apparent wave velocity. As the apparent wave velocity decreases, the magnitude of its impact is amplified. In applied engineering planning, consideration of the wave passage effect should be site-category-specific to enhance the safety of bridge structures.

Author Contributions

Conceptualization, M.H. and T.W.; methodology, T.W.; software, Y.D.; validation, M.H., Y.D. and M.D.; formal analysis, M.H.; investigation, Y.D.; resources, Q.G.; data curation, M.H.; writing—original draft, Y.D.; writing—review and editing, T.W.; visualization, M.D.; supervision, M.H.; project administration, Q.G.; funding acquisition, Q.G. All authors have read and agreed to the published version of the manuscript.

Funding

This research was funded by the Key Research and Development Program of Heilongjiang Province of China under Grant number GY2021ZB0063 and the National Natural Science Foundation of China under Grant number 51778194.

Data Availability Statement

Data are contained within the article.

Conflicts of Interest

Author Mingcheng Han was employed by the company CCCC First Highway Consultants Co., Ltd. Author Mingqu Du was employed by the company Road & Bridge International Co., Ltd. The remaining authors declare that the research was conducted in the absence of any commercial or financial relationships that could be construed as a potential conflict of interest.

References

  1. Akiyama, M.; Frangopol, D.M.; Ishibashi, H. Toward life-cycle reliability-, risk-and resilience-based design and assessment of bridges and bridge networks under independent and interacting hazards: Emphasis on earthquake, tsunami and corrosion. Struct. Infrastruct. Eng. 2020, 16, 26–50. [Google Scholar] [CrossRef]
  2. Wang, T.; Liu, Y.; Li, Q.Y.; Du, P.; Zheng, X.G.; Gao, Q.F. State-of-the-Art review of the resilience of urban bridge networks. Sustainability 2023, 15, 989. [Google Scholar] [CrossRef]
  3. Zucca, M.; Crespi, P.; Stochino, F.; Puppio, M.L.; Coni, M. Maintenance interventions period of existing RC motorway viaducts located in moderate/high seismicity zones. Structures 2023, 47, 976–990. [Google Scholar] [CrossRef]
  4. Jiang, R.J.; Kwong, A.F.T.; Xiao, Y.F. Prestressed concrete girder bridges with corrugated steel webs. J. Struct. Eng. 2015, 141, 04014108. [Google Scholar] [CrossRef]
  5. Rosignoli, M. Prestressed concrete box girder bridges with folded steel plate webs. Proc. Inst. Civ. Eng. Struct. Build. 1999, 134, 77–85. [Google Scholar] [CrossRef]
  6. Kim, K.S.; Lee, D.H. Flexural behavior of prestressed composite beams with corrugated web: Part II. Experiment and verification. Compos. Part B Eng. 2011, 42, 1617–1629. [Google Scholar] [CrossRef]
  7. Johnson, R.P.; Cafolla, J.; Bernard, C. Corrugated webs in plate girders for bridges. Proc. Inst. Civ. Eng. Struct. Build. 1997, 122, 157–164. [Google Scholar] [CrossRef]
  8. Shen, K.; Wan, S.; Mo, X.L.; Li, X.Y.; Aiming, S. A softened membrane model for composite box-girders with corrugated steel webs under pure torsion. Eng. Struct. 2018, 173, 357–371. [Google Scholar] [CrossRef]
  9. Jiang, R.J.; Gai, W.M.; He, X.F.; Chen, Y.Y. Comparative study on seismic performance of prestressed concrete box-girder bridges with corrugated steel webs. Appl. Mech. Mater. 2012, 178, 2418–2423. [Google Scholar] [CrossRef]
  10. Wang, Y.Q.; Fan, B.B.; Li, L. Analysis on seismic performance of corrugated steel web continuous rigid frame bridge. Appl. Mech. Mater. 2014, 501, 1471–1476. [Google Scholar] [CrossRef]
  11. Zhao, W.Z.; Li, Z.C.; Zhang, C.; Wan, S. Influence of spile-soil interaction on seismic response of PC continuous beam bridge with corrugated steel webs. In AIP Conference Proceedings; AIP Publishing: Wuhan, China, 2019; Volume 2073. [Google Scholar]
  12. Wang, S.H.; Liu, Y.Q.; He, J.; Xin, H.H.; Yao, H.B. Experimental study on cyclic behavior of composite beam with corrugated steel web considering different shear-span ratio. Eng. Struct. 2019, 180, 669–684. [Google Scholar] [CrossRef]
  13. Zheng, S.; Shen, Q.; Guan, C.; Cheng, H.; Zhuang, H.; Zhou, M. Semi-active control of seismic response on prestressed concrete continuous girder bridges with corrugated steel webs. Appl. Sci. 2022, 12, 12881. [Google Scholar] [CrossRef]
  14. Wang, R.; Hu, Z.; Hao, Z.; Chen, L.; Shi, G.; Hou, R.; Zuo, R. Seismic fragility analysis of long-span prestressed concrete composite box girder bridge with corrugated steel webs under Construction. Buildings 2023, 13, 1598. [Google Scholar] [CrossRef]
  15. Zheng, W.Z.; Wang, H.; Li, J.; Shen, J. Parametric study of superelastic-sliding LRB system for seismic response control of continuous bridges. J. Bridge Eng. 2020, 25, 04020062. [Google Scholar] [CrossRef]
  16. Zheng, W.Z.; Tan, P.; Li, J.; Wang, H.; Liu, Y.H.; Xian, Z.B. Superelastic pendulum isolator with multi-stage variable curvature for seismic resilience enhancement of cold-regional bridges. Eng. Struct. 2023, 284, 115960. [Google Scholar] [CrossRef]
  17. Wang, H.; Wu, Y.; Sha, B.; Zheng, W.Z.; Gao, Y.Q. Compositive optimal control for the seismic response of a long-span triple-tower suspension bridge. Int. J. Struct. Stab. Dyn. 2018, 18, 1840009. [Google Scholar] [CrossRef]
  18. Kim, S.H.; Feng, M.Q. Fragility analysis of bridges under ground motion with spatial variation. Int. J. Non-Linear Mech. 2003, 38, 705–721. [Google Scholar] [CrossRef]
  19. Huang, M.G. Seismic Fragility, Hazard and Risk Analysis of Reinforced Concrete Continuous Girder Bridges. Master’s Thesis, Harbin Institute of Technology, Harbin, China, 2011. [Google Scholar]
  20. Hwang, H.; Liu, J.B. Seismic fragility analysis of reinforced concrete bridges. China Civ. Eng. J. 2004, 37, 47–51. [Google Scholar]
  21. Xie, L.L.; Ma, Y.H.; Zhai, C.H. Performance-Based Seismic Design and Design Ground Motion; Science Press: Beijing, China, 2009. [Google Scholar]
  22. Ellingwood, B.R.; Kinali, K. Quantifying and communicating uncertainty in seismic risk assessment. Struct. Saf. 2009, 31, 179–187. [Google Scholar] [CrossRef]
  23. Hwang, H.; Liu, J.B.; Chiu, H. Seismic fragility analysis of highway bridges. In Mid-America Earthquake Center CD Release 01–06; University of Illinois Urbana-Champaign: Champaign-Urbana, IL, USA, 2001. [Google Scholar]
  24. Mosleh, A.; Jara, J.; Razzaghi, M.S.; Varum, H. Probabilistic seismic performance analysis of RC bridges. J. Earthq. Eng. 2020, 24, 1704–1728. [Google Scholar] [CrossRef]
  25. Xiang, Y.; Sun, J.C.; Hou, L.C.; Liang, R.W.; Yao, X.; Liu, F.M. Seismic Fragility Assessment for a Prefabricated Composite Box-girder Bridge with Corrugated Steel Webs. Highw. Eng. 2018, 43, 32–38. [Google Scholar]
  26. Li, H.N.; Cheng, H.; Wang, D.S. A review of advance in seismic fragility research on bridge structures. Eng. Mech. 2018, 35, 1–16. [Google Scholar]
  27. Choi, E.; DesRoches, R.; Nielson, B. Seismic fragility of typical bridges in moderate seismic zones. Eng. Struct. 2004, 26, 187–199. [Google Scholar] [CrossRef]
  28. Soyluk, K.; Sicacik, E.A. Soil–structure interaction analysis of cable-stayed bridges for spatially varying ground motion components. Soil Dyn. Earthq. Eng. 2012, 35, 80–90. [Google Scholar] [CrossRef]
  29. Clough, R.W.; Penzien, J. Dynamics of Structures, 2nd ed.; McGraw-Hill, Inc.: New York, NY, USA, 1993. [Google Scholar]
  30. Kiureghian, A.D. A coherency model for spatially varying ground motions. Earthq. Eng. Struct. Dyn. 1996, 25, 99–111. [Google Scholar] [CrossRef]
  31. Bi, K.; Hao, H. Numerical simulation of pounding damage to bridge structures under spatially varying ground motions. Eng. Struct. 2013, 46, 62–76. [Google Scholar] [CrossRef]
  32. Ma, K.; Zhong, J.; Feng, R.; Yuan, W. Investigation of ground-motion spatial variability effects on component and system vulnerability of a floating cable-stayed bridge. Adv. Struct. Eng. 2019, 22, 1923–1937. [Google Scholar] [CrossRef]
  33. Wang, Z.; Wang, J.Q.; Liu, T.X.; Zhang, F. Modeling seismic performance of high-strength steel-ultra-high-performance concrete piers with modified Kent-Park model using fiber elements. J. Eng. 2016, 8, 1687814016633411. [Google Scholar] [CrossRef]
  34. Birrell, M.; Astroza, R.; Carreno, R.; Restrepoet, J.; Araya-Letelier, D. Bayesian parameter and joint probability distribution estimation for a hysteretic constitutive model of reinforcing steel. Struct. Saf. 2021, 90, 102062. [Google Scholar] [CrossRef]
  35. Bu, O.W.; Guo, Y.R. Research on OpenSees based substructure pseudo-dynamic test method for bridge considering multi-point excitation effect. J. Railw. Sci. Eng. 2018, 15, 919–925. [Google Scholar]
  36. GB 50909-2014; Detailed Rules for Seismic Design of Urban Rail Transit. China Plan Publishing House: Beijing, China, 2014.
  37. Guo, Q.Q.; Zhang, W.F.; Wu, G.Y.; Liu, J.K.; Li, Z. Seismic analysis of grand national theatre of china. Eng. Mech. 2003, 20, 43–48. [Google Scholar]
  38. GB/T 50283-1999; Unified Standard for Reiability Design of Highway Engineering Structure. China Plan Publishing House: Beijing, China, 1999.
  39. He, Q.X.; Shen, Z.Y. Review of structural seismic analysis of travelling wave effects. Earthq. Eng. Eng. Vib. 2009, 29, 50–57. [Google Scholar]
  40. Pan, S.X.; Tang, M.; Song, X.M. Seismic behavior of asymmetric extradosed bridge with action of traveling wave effect. J. Cent. South Univ. (Sci. Technol.) 2020, 51, 1862–1872. [Google Scholar]
Figure 1. Ningxia Shizuishan Hongyazi Yellow River Bridge.
Buildings 14 00330 g001
Figure 2. Cross-section of the composite girders with CSWs (cm): (a) position on the top of the main pier; (b) position at the midspan.
Buildings 14 00330 g002
Figure 3. Parameters of the CSWs (mm).
Buildings 14 00330 g003
Figure 4. Cross-section of the pier (cm).
Buildings 14 00330 g004
Figure 5. Numerical model of the PCCGBCSWs.
Buildings 14 00330 g005
Figure 6. Concrete02 constitutive relation model.
Buildings 14 00330 g006
Figure 7. Steel02 constitutive relation model.
Buildings 14 00330 g007
Figure 8. Schematic diagram of the soil spring around the pile.
Buildings 14 00330 g008
Figure 9. Restoring force model of the friction pendulum bearing.
Buildings 14 00330 g009
Figure 10. Geometric characteristics of the friction pendulum bearing: (a) longitudinal direction size diagram; (b) transverse direction size diagram; (c) plane size diagram.
Buildings 14 00330 g010aBuildings 14 00330 g010b
Figure 11. Probabilistic seismic demand model of pier 1: (a) longitudinal direction; (b) transversal direction.
Buildings 14 00330 g011
Figure 12. Moment–curvature relationship.
Buildings 14 00330 g012
Figure 13. Fragility for pier 1: (a) axial direction; (b) orthogonal direction.
Buildings 14 00330 g013
Figure 14. Bridge fragility structure.
Buildings 14 00330 g014
Figure 15. Bridge fragility considering girder types: (a) ψ 2 ; (b) ψ 3 ; (c) ψ 4 ; and (d) ψ 5 .
Buildings 14 00330 g015
Figure 16. Bridge fragility considering bearing types: (a) ψ 2 ; (b) ψ 3 ; (c) ψ 4 ; and (d) ψ 5 .
Buildings 14 00330 g016
Figure 17. Bridge fragility considering ground motion types: (a) ψ 2 ; (b) ψ 3 ; (c) ψ 4 ; and (d) ψ 5 .
Buildings 14 00330 g017
Figure 18. Bridge fragility considering apparent wave velocity: (a) ψ 2 ; (b) ψ 3 ; (c) ψ 4 ; and (d) ψ 5 .
Buildings 14 00330 g018
Table 1. Representative PCCGBCSWs worldwide.
NumberNameCountryTypeSpan Arrangement (m)Construction Year
1Cognac BridgeFranceContinuous
girder
31.0 + 42.9 + 41.01986
2Bengu BridgeJapanContinuous
rigid frame
44.0 + 97.2 + 56.01998
3Altwipfergrund BridgeGermanyContinuous
girder
84.6 + 115.0 + 80.52001
4Rijianmeng BridgeJapanExtradosed
cable-stayed bridge
91.8 + 180.0 + 91.82003
5Bohe BridgeChinaContinuous
girder
4 × 30.02005
6Ilsun BridgeSouth KoreaContinuous
girder
50.0 + 10 × 60.0 + 50.0 + 2 × 50.52005
7Tisza BridgeHungaryCable-stayed girder96.0 + 180.0 + 96.02012
8Chang Zhuang Reservoir BridgeChinaContinuous
girder
9 × 50.0 + 9 × 50.0 + 40.02015
9BR-06 Bridge in Northern Teheran ExpresswayIranContinuous
girder
83.0 + 153.0 + 83.02016
10Zhaojun Yellow River BridgeChinaContinuous
girder
85.0 + 9 × 150.0 + 85.02022
Table 2. Damage indicators of the displacement ductility ratio of the main pier.
Damage StateIndex ZoneDamage Index
ψ 1 μ ˜ d t ln μ ˜ c 1 μ ˜ c 1 is the displacement ductility ratio of the member section when the first steel bar yields.
ψ 2 μ ˜ c 1 < μ ˜ d t ln μ ˜ c 2 μ ˜ c 2 is the displacement ductility ratio of the member section when the equivalent yield occurs.
ψ 3 μ ˜ c 2 < μ ˜ d t ln μ ˜ c 3 μ ˜ c 3 is the displacement ductility ratio of the concrete at the edge of the section when the compressive strain reaches 0.002.
ψ 4 μ ˜ c 3 < μ ˜ d t ln μ ˜ max μ ˜ c 4 is the displacement ductility ratio when the concrete at the edge of the section reaches the ultimate compressive strain.
ψ 5 μ ˜ d t ln > μ ˜ max μ ˜ max = μ ˜ c 3 + 3 is the maximum displacement ductility ratio.
Table 3. Structural characteristics.
PartCharacteristics
Superstructure16-span PCCGBCSW
SubstructureReinforced concrete rectangular solid plate pier
BearerFriction pendulum bearing
Table 4. Crucial parameters of the friction pendulum bearing.
ItemValue
Radius of curvature (m)10
Design horizontal displacement (mm)2.5
Sliding friction coefficient0.03
Table 5. Mechanical properties of the friction pendulum support.
ItemValue
Side SupportMiddle Support
Elastic stiffness (kN/m)27,094.62123,845.58
Yield strength (kN)67.74309.61
Stiffness after yield (kN/m)
Ratio of postyield stiffness to elastic stiffness
225.791032.05
0.00830.0083
Table 6. Mechanical properties of the materials used in bridge structures.
Bridge ComponentMaterialStrength GradeElastic Modulus (MPa)
GirderConcreteC553.55 × 104
Pier C403.25 × 104
RebarSteelHPB3002.10 × 105
HRB4002.00 × 105
CSWQ345D2.15 × 105
Table 7. Periods and frequencies of the first ten orders.
Mode NumberPeriod (s)Frequency (Hz)
Midas CivilOpenSeesMidas CivilOpenSees
11.4191.480.7050.676
21.1531.1140.8680.898
31.1391.1680.8790.856
41.0141.030.9860.971
50.9890.9461.0111.057
60.9890.9711.0111.030
70.9740.9361.0271.068
80.9640.9811.0381.019
90.8560.8011.1691.248
100.8560.8641.1691.157
Table 8. Statistical information of random variables.
Random
Variable
Dispersion
Pattern
Statistical Parameter
MeanStandard DeviationCoefficient of Variation
fc (N/mm2)Normal
distribution
56.505.320.0942
fy (N/mm2)Normal
distribution
434.9126.090.0606
Table 9. Damage indices of the piers.
Damage StateDamage Index
Main PierTransition Pier
LongitudinalTransversalLongitudinalTransversal
ψ 1 μ ˜ d t ln ≤ 1 μ ˜ d t ln ≤ 1 μ ˜ d t ln ≤ 1 μ ˜ d t ln ≤ 1
ψ 2 1 < μ ˜ d t ln ≤ 1.141 < μ ˜ d t ln ≤ 1.471 < μ ˜ d t ln ≤ 1.171 < μ ˜ d t ln ≤ 1.54
ψ 3 1.14 < μ ˜ d t ln ≤ 3.361.47 < μ ˜ d t ln ≤ 8.641.17 < μ ˜ d t ln ≤ 3.531.54 < μ ˜ d t ln ≤ 8.36
ψ 4 3.36 < μ ˜ d t ln ≤ 6.368.64 < μ ˜ d t ln ≤ 11.643.53 < μ ˜ d t ln ≤ 6.538.36 < μ ˜ d t ln ≤ 11.64
ψ 5 μ ˜ d t ln > 6.36 μ ˜ d t ln > 11.64 μ ˜ d t ln > 6.53 μ ˜ d t ln > 11.64
Disclaimer/Publisher’s Note: The statements, opinions and data contained in all publications are solely those of the individual author(s) and contributor(s) and not of MDPI and/or the editor(s). MDPI and/or the editor(s) disclaim responsibility for any injury to people or property resulting from any ideas, methods, instructions or products referred to in the content.

