
CNN- and UAV-Based Automatic 3D Modeling Methods for Building Exterior Inspection
1
Architectural Engineering, Hanyang University ERICA, 55, Hanyangdaehak-ro, Sangnok-gu, Ansan 15588, Republic of Korea
2
Center for AI Technology in Construction, Hanyang University ERICA, 55, Hanyangdaehak-ro, Sangnok-gu, Ansan 15588, Republic of Korea
3
Post-Construction Evaluation and Management Center, Department of Construction Policy Research, Korea Institute of Civil Engineering and Building Technology, Goyang 10223, Republic of Korea
4
Department of Smart Convergence Engineering, Hanyang University ERICA, Ansan 15588, Republic of Korea
*
Authors to whom correspondence should be addressed.
Buildings 2024, 14(1), 5; https://doi.org/10.3390/buildings14010005
Submission received: 21 November 2023
/
Revised: 15 December 2023
/
Accepted: 16 December 2023
/
Published: 19 December 2023
(This article belongs to the Special Issue Engineering Safety Monitoring and Management)
Abstract
:Building maintenance plays an increasingly important role as buildings age. During maintenance, it is necessary to analyze building defects and record their locations when performing exterior inspections. Hence, this study proposes an automatic three-dimensional (3D) modeling method based on image analysis using unmanned aerial vehicle (UAV) flights and convolutional neural networks. A geographic information system is used to acquire geographic coordinate points (GCPs) for the geometry of the building, and a UAV is flown to collect the GCPs and images, which provide location information on the building elements and defects. Comparisons revealed that the generated 3D models were similar to the actual buildings. Next, the recorded locations of the building defects and the actual locations were examined, and the results confirmed that the defects were generated correctly. Our findings indicated that the proposed method can improve building maintenance. However, it has several limitations, which provide directions for future research.
1. Introduction
Buildings protect their residents from external environmental factors. However, over a period of time, the performance of buildings deteriorates, and they become vulnerable to defects, which can be dangerous to their residents. Building defects are caused by various factors, such as the materials, the construction, the environment, and the structure. They can degrade the performance of the building’s facilities. Therefore, as a building lifespan elapses and aging progresses, it is necessary to diagnose defects and to carry out regular maintenance in a timely manner by performing suitable repairs [1]. Defects in buildings include cracks, leaks, detachment, and spalling, and they are mainly due to long-term exposure to temperature and climate changes [2]. The lifespan and properties of a building can be inferred from the directions and shapes of cracks, and crack occurrence is directly related to building performance [3,4].
To inspect a building, inspectors perform direct visual inspections to identify defects. Then, the identified defects are recorded in a blueprint, and the building’s condition is analyzed. The visual inspection method is expensive and time-consuming for high-rise buildings, and it becomes necessary to rely on the inspector’s subjective judgment in cases where defects are difficult to access. In addition, when defects are recorded on blueprints, there may be cases where the blueprints have been lost if the building is old, and recording errors can occur because of inaccurate information in the case of inspecting locations on high-rise buildings that are difficult to examine via the visual-inspection method [5]. To overcome these limitations, research is actively being conducted on the use of unmanned aerial vehicles (UAVs) in inspections. UAVs can easily access high-rise buildings, and image analysis can be performed using UAVs’ built-in cameras. Such research allows inspectors to perform indirect inspections and may eliminate the risk associated with direct inspections. Additionally, indirect inspections are efficient: compared with direct inspection, they allow a larger area to be inspected in the same amount of time [6,7]. Researchers have proposed various methods for analyzing UAV-acquired images, including photogrammetric three-dimensional (3D) building model generation and convolutional neural network (CNN)-based building defect recognition [8,9,10].
The method of generating a photogrammetric 3D building model begins by collecting visual information of the target building’s exterior from various angles in the form of images. Feature points are extracted from overlapping portions of the building in each region of the images. These generated feature points enable the measurement of depth information for the 3D building within the images. Through this process, the 3D positions of each point are calculated, resulting in the acquisition of a point cloud. Finally, by employing texture mapping on the 3D form of the building generated from the point cloud, the visual quality of the building is enhanced, providing a sense of realism.
This process of creating a photogrammetry-based building model generates information that faithfully represents the genuine shape and size of the building, diverging from the blueprint format. Building models endowed with these characteristics empower inspectors to quantify the dimensions, lengths, and other parameters of defects accurately. Furthermore, they facilitate the correct evaluation of defect data in challenging high-rise locations, where visual inspection is difficult. Importantly, these models also offer the potential for monitoring, enhancing the capacity for continuous assessment and observation [11,12,13].
In this study, when acquiring images of target buildings, the UAV must capture the target shapes from a variety of angles. In addition, connection points between the images are required for the matching process, and the target’s feature points must be superimposed. Therefore, such methods require large numbers of images for generating precise building shapes. With more images, more computational resources are needed to process the images. Additionally, for a larger building, more time is needed to generate the building shape. Consequently, issues related to the precision of photography and time-consuming processes may arise.
In addition to photo-based methods, there are also studies utilizing scanners for 3D model construction research. These studies predominantly focus on the city-wide construction of 3D buildings using scanners, with the goal of analyzing energy performance [14,15,16]. A scanner projects laser beams onto surfaces and objects, capturing distance and positional information through the reflected signals. The acquired data are organized into a point cloud, representing a 3D structure that encapsulates diverse features, contours, and curves of the target building. This 3D representation is visually refined by incorporating texture and color information. Scanners are distinguished by their capacity to faithfully replicate high-density, precise spatial details; however, the accurate measurement of distances is challenged by reflective materials, such as glass, owing to the characteristics of laser beam projection. Furthermore, the pursuit of a 3D structure with heightened resolution may lead to increased demands on data capacity and processing time.
Building defect recognition systems, utilizing convolutional neural networks (CNNs), undergo extensive training with diverse datasets containing various instances of building defects. This approach seeks to mitigate reliance on the subjective judgments of individual inspectors, instead enabling the system to autonomously and objectively identify and categorize defects. During training, the CNN processes a comprehensive dataset with meticulously labeled images, encompassing different types of defects such as cracks, structural anomalies, and irregularities. Through the intricate process of backpropagation, the CNN refines its internal parameters to optimize the accurate classification of defects. The resulting system demonstrates the capacity to objectively identify the presence and type of defects when presented with new building images. This departure from traditional inspection methods reduces subjectivity, offering a more standardized and consistent approach to defect identification. The learned features and patterns contribute to heightened objectivity, which is particularly valuable in scenarios where human judgment introduces variability. Additionally, the scalability and efficiency of CNN-based systems make them advantageous for large-scale building inspections, ensuring a thorough and reliable assessment of defects in a timely manner [17,18]. In addition, researchers have analyzed overall defect conditions by measuring defect data (crack width, defect size, etc.) to perform analyses based on the recognized defect images [19,20]. These characteristics allow researchers to accurately ascertain and analyze the shapes of defects by using UAVs in locations that are difficult to access. However, the images include only some of a building’s regions. Thus, although this approach can detect the presence of defects in images, a different method is necessary to locate them.
In the realm of unmanned aerial vehicle (UAV)-based research, investigators have proposed a more efficient methodology for safety inspections, depending on the applied analysis, compared to conventional approaches. The methodology suggested in previous research ensures the safety of inspectors and facilitates the objective and indirect monitoring of defects. However, to execute safety inspections with enhanced efficiency, it is crucial to devise methods that consider the required time. Therefore, this manuscript proposes an approach that utilizes the geographic coordinate system (GCS) to generate the shape of building objects and to visually represent the external configuration of buildings through image identification, expressing the location of defects.
This method involves the execution of defect recognition based on convolutional neural networks (CNNs) and utilizes images acquired by a UAV to collect relevant information. Additionally, the GCS plays a crucial role in reproducing the architectural form of a building and specifying the location of defects. The proposed method simplifies the visual information required to construct a 3D building shape, compared to previous research. This approach reduces the time required for inspection generation and facilitates easy identification of defect locations within a building structure. Furthermore, it ensures the safety of inspectors and enables an objective assessment of potential defects that may occur in a building.
2. Materials and Methods
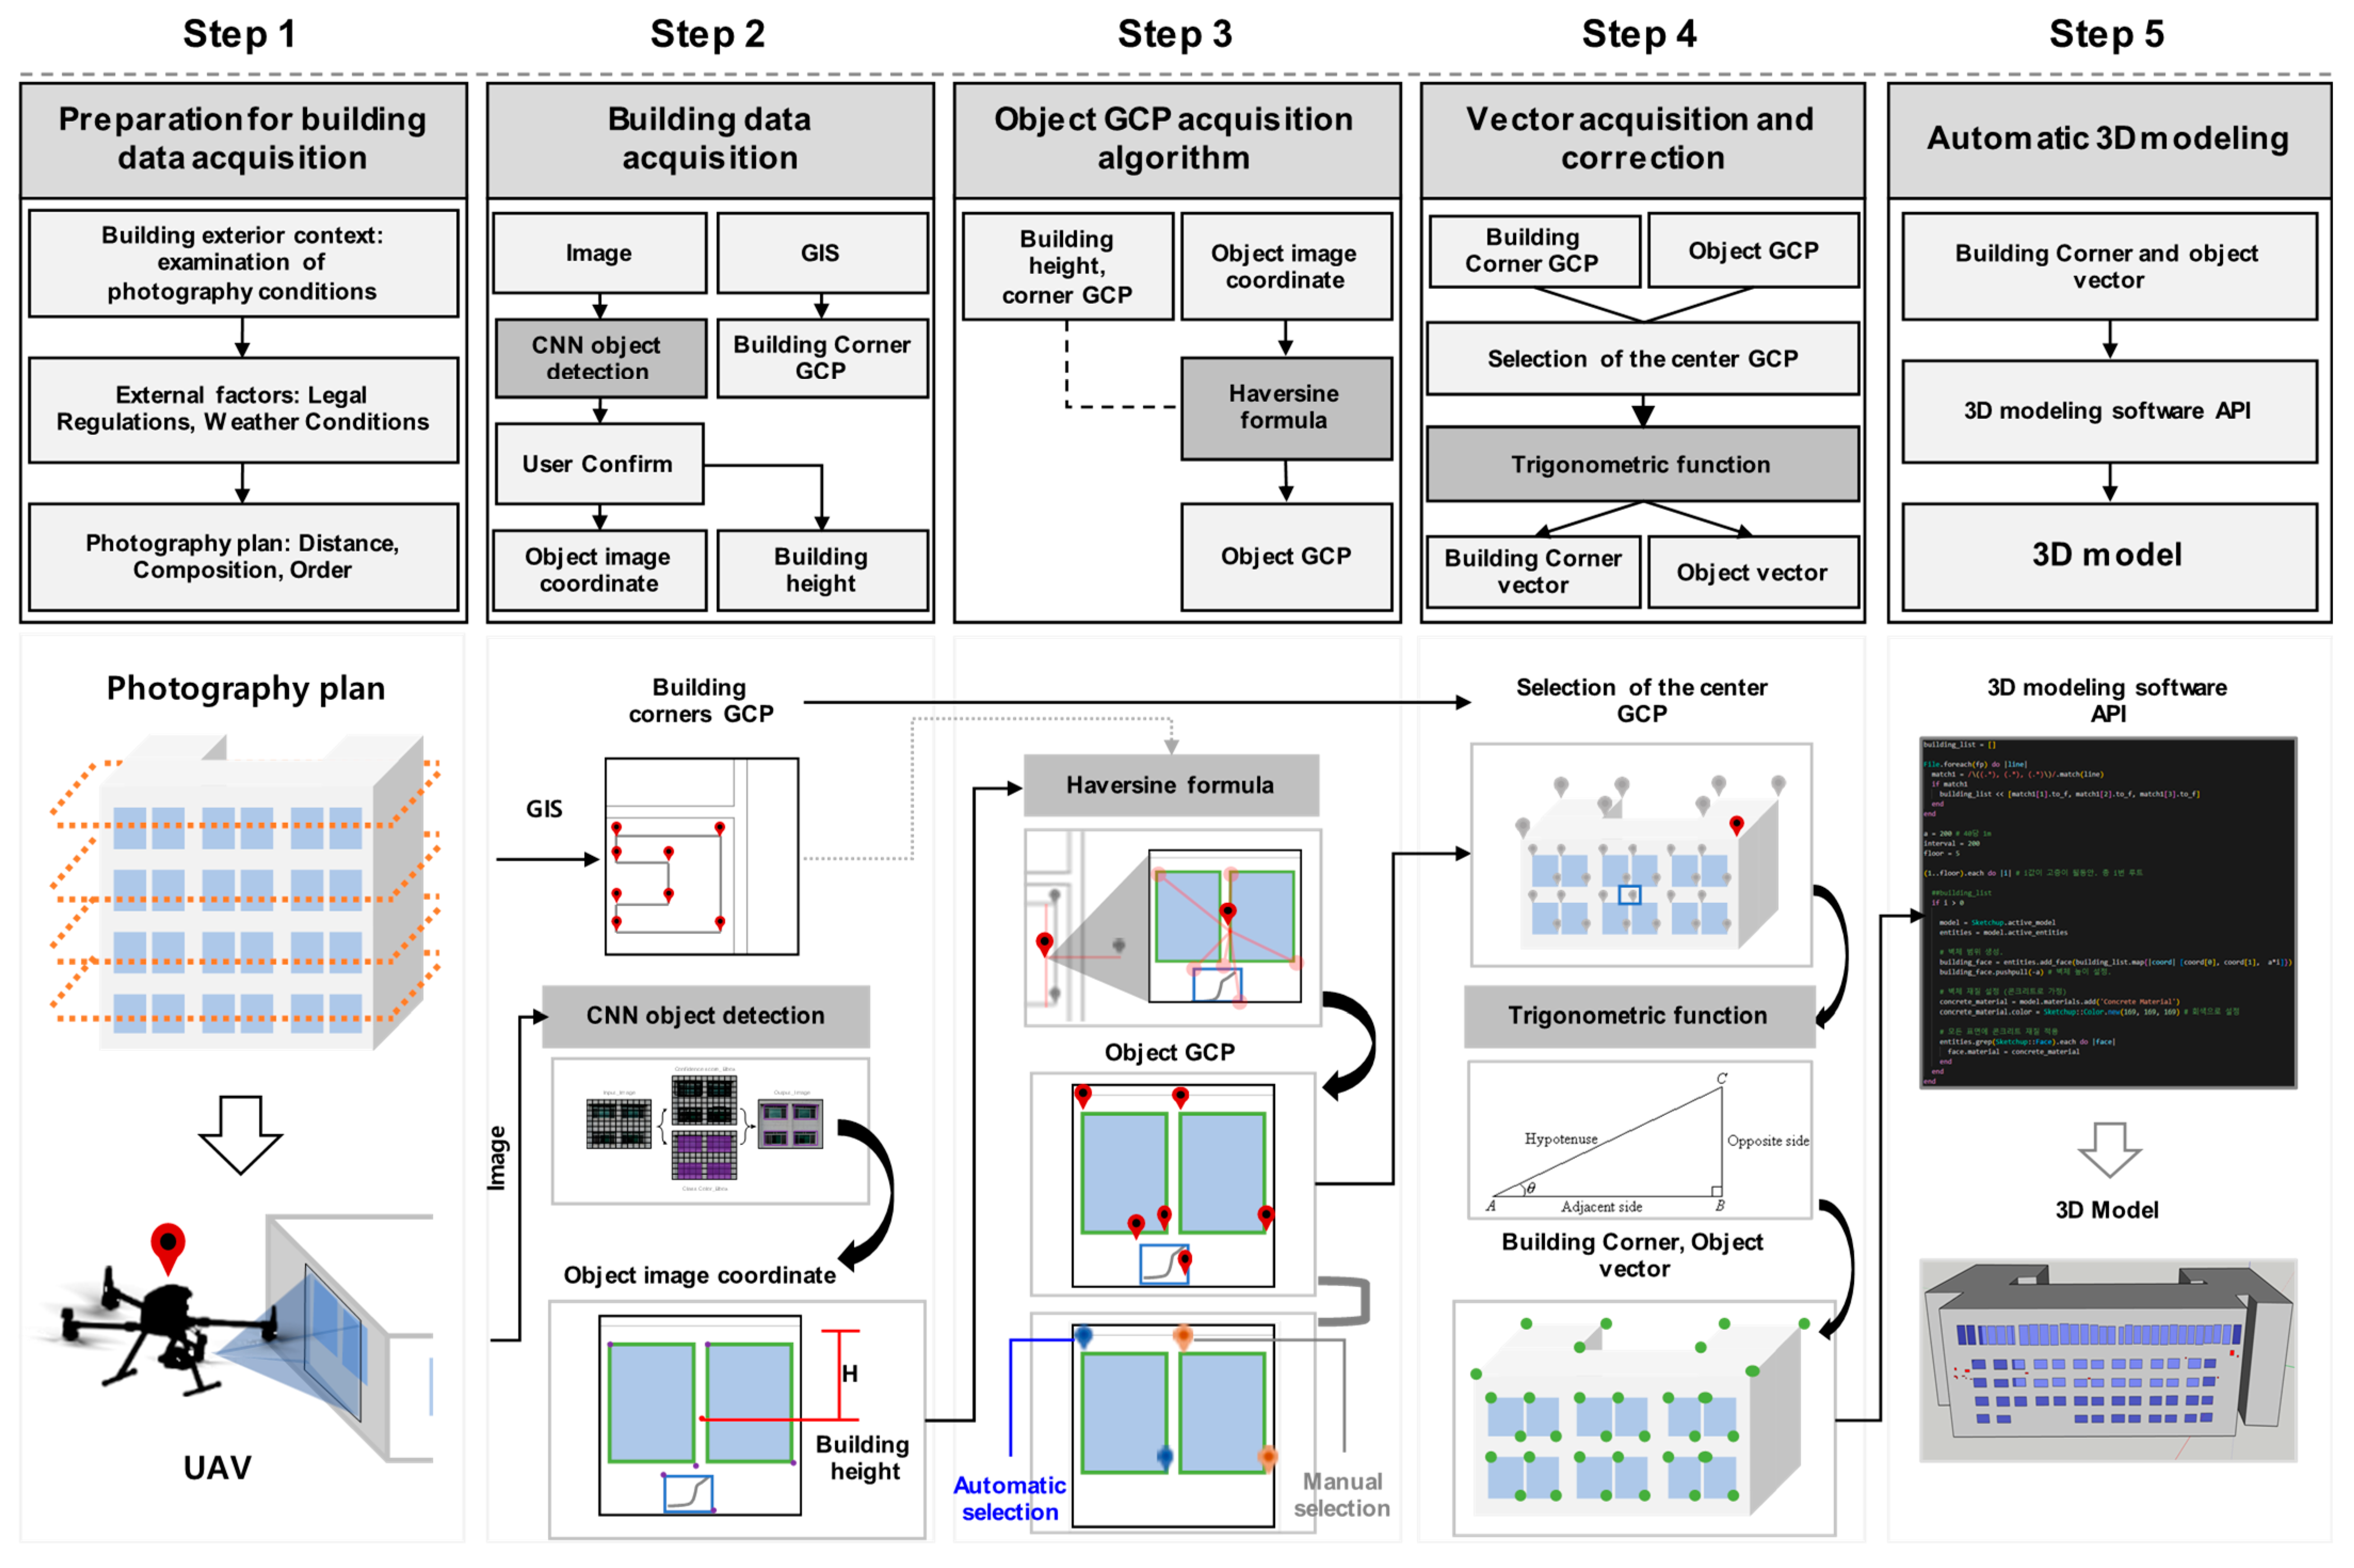
To analyze and record building defects, it is necessary to ascertain the locations of the defects. The proposed method uses the GCS to generate a geographic coordinate point (GCP)-based building shape. The GCS employs latitude and longitude to specify locations on Earth’s 3D surface—i.e., it is a standard that defines specific locations on Earth’s surface [21]. The GCP of the building corners that are to be generated using the GCS are acquired. The acquired coordinates form the building’s overall framework. Next, a UAV is flown to acquire images of the building’s exterior walls, and CNN model-based image object recognition is used to input the defects in the building’s shape and the windows, which are building elements. A CNN is a deep-learning model that contains several layers (convolutional, pooling, fully connected, etc.) and exhibits good image data processing performance [22]. Images that include the objects that are to be recognized are used to train an artificial-intelligence model, and the learned objects are found in images that were not used for training. Section 2.2 presents concepts related to the model. The image-resolution coordinates are extracted from recognized objects, and the coordinates are converted into GCPs via an object GCP-acquisition algorithm. This algorithm uses the building corner GCPs and the Haversine formula, and it is described in Section 2.3. The GCPs of the building corners and objects (windows and cracks) acquired in this manner are converted into vector coordinates using vector acquisition, which is described in Section 2.4, to define the size of the actual building and its elements. Finally, the converted coordinates are automatically generated via 3D modeling software Sketchup 2022. The proposed method can automatically execute all processes except for Step 1, which corresponds to data collection. However, for Step 3, the method offers a manual handling option for objects that are not recognized. This method is shown in Figure 1.
2.1. Step 1: Preparation for Building Data Acquisition
In this step, the building’s surrounding environment (adjacent buildings, landscaping, etc.) is examined. The environment, including adjacent buildings and landscaping, can impede the UAV’s acquisition of building information. Therefore, it is necessary to establish a plan that considers the environment when photographing the building, to ascertain its shape. To measure the actual sizes of areas in images that were acquired as part of the photography plan, the camera and the building must be in a parallel state when the photography is performed. To measure actual sizes, information such as the resolution, focal length, GCPs, and sensor size must be included in the captured images’ metadata. In addition, the established plan must consider the flight conditions of the photographed area, including weather conditions and legal regulations regarding UAV flights. The UAV that is employed must be able to acquire GCP information through global navigation satellite system (GNSS) transmissions. The GCPs are expressed as longitude and latitude and correspond to two-dimensional (2D) (x, y) coordinates. This transmitted GCP information is linked to the GCPs for the building shape acquired in Step 2 to measure distance.
2.2. Step 2: Building Data Acquisition
In Step 1, the UAV performs the planned flight and acquires images of the building. A CNN is used to recognize building elements (windows) and defects (cracks) in the images. In this study, the You Only Look Once version 5 (YOLOv5) [23] CNN model was used, and concepts related to this model are discussed in Section 2.2.1 and Section 2.2.2. The recognized elements are depicted as box shapes, and the top-left and bottom-right image resolution coordinates (x, y) of the box boundaries are acquired. These coordinates are used to acquire the GCPs of the building elements. After a user review of the acquired images for parts of the images that were not recognized, the image-resolution coordinates of the building elements need to be manually inputted. Next, the coordinates for all the building’s elements are acquired. The height of the building is found through images that include the uppermost floor of the building, according to the UAV’s altitude during photography. Finally, the Google Maps application programming interface (API) is used to acquire GCP data regarding the corners of the building, based on a geographic information system (GIS). The Google Maps API is a web map service (WMS) module that loads images from a map server containing GIS data. It is used to record the building GCP information acquired from the map.
2.2.1. Object Detection
This section presents concepts related to the image object-recognition algorithm. The purpose of the algorithm is to recognize elements in an image and perform automatic 3D modeling. YOLOv5 was selected as the model. This algorithm is used in various fields because of its high detection accuracy and processing speed [24,25].
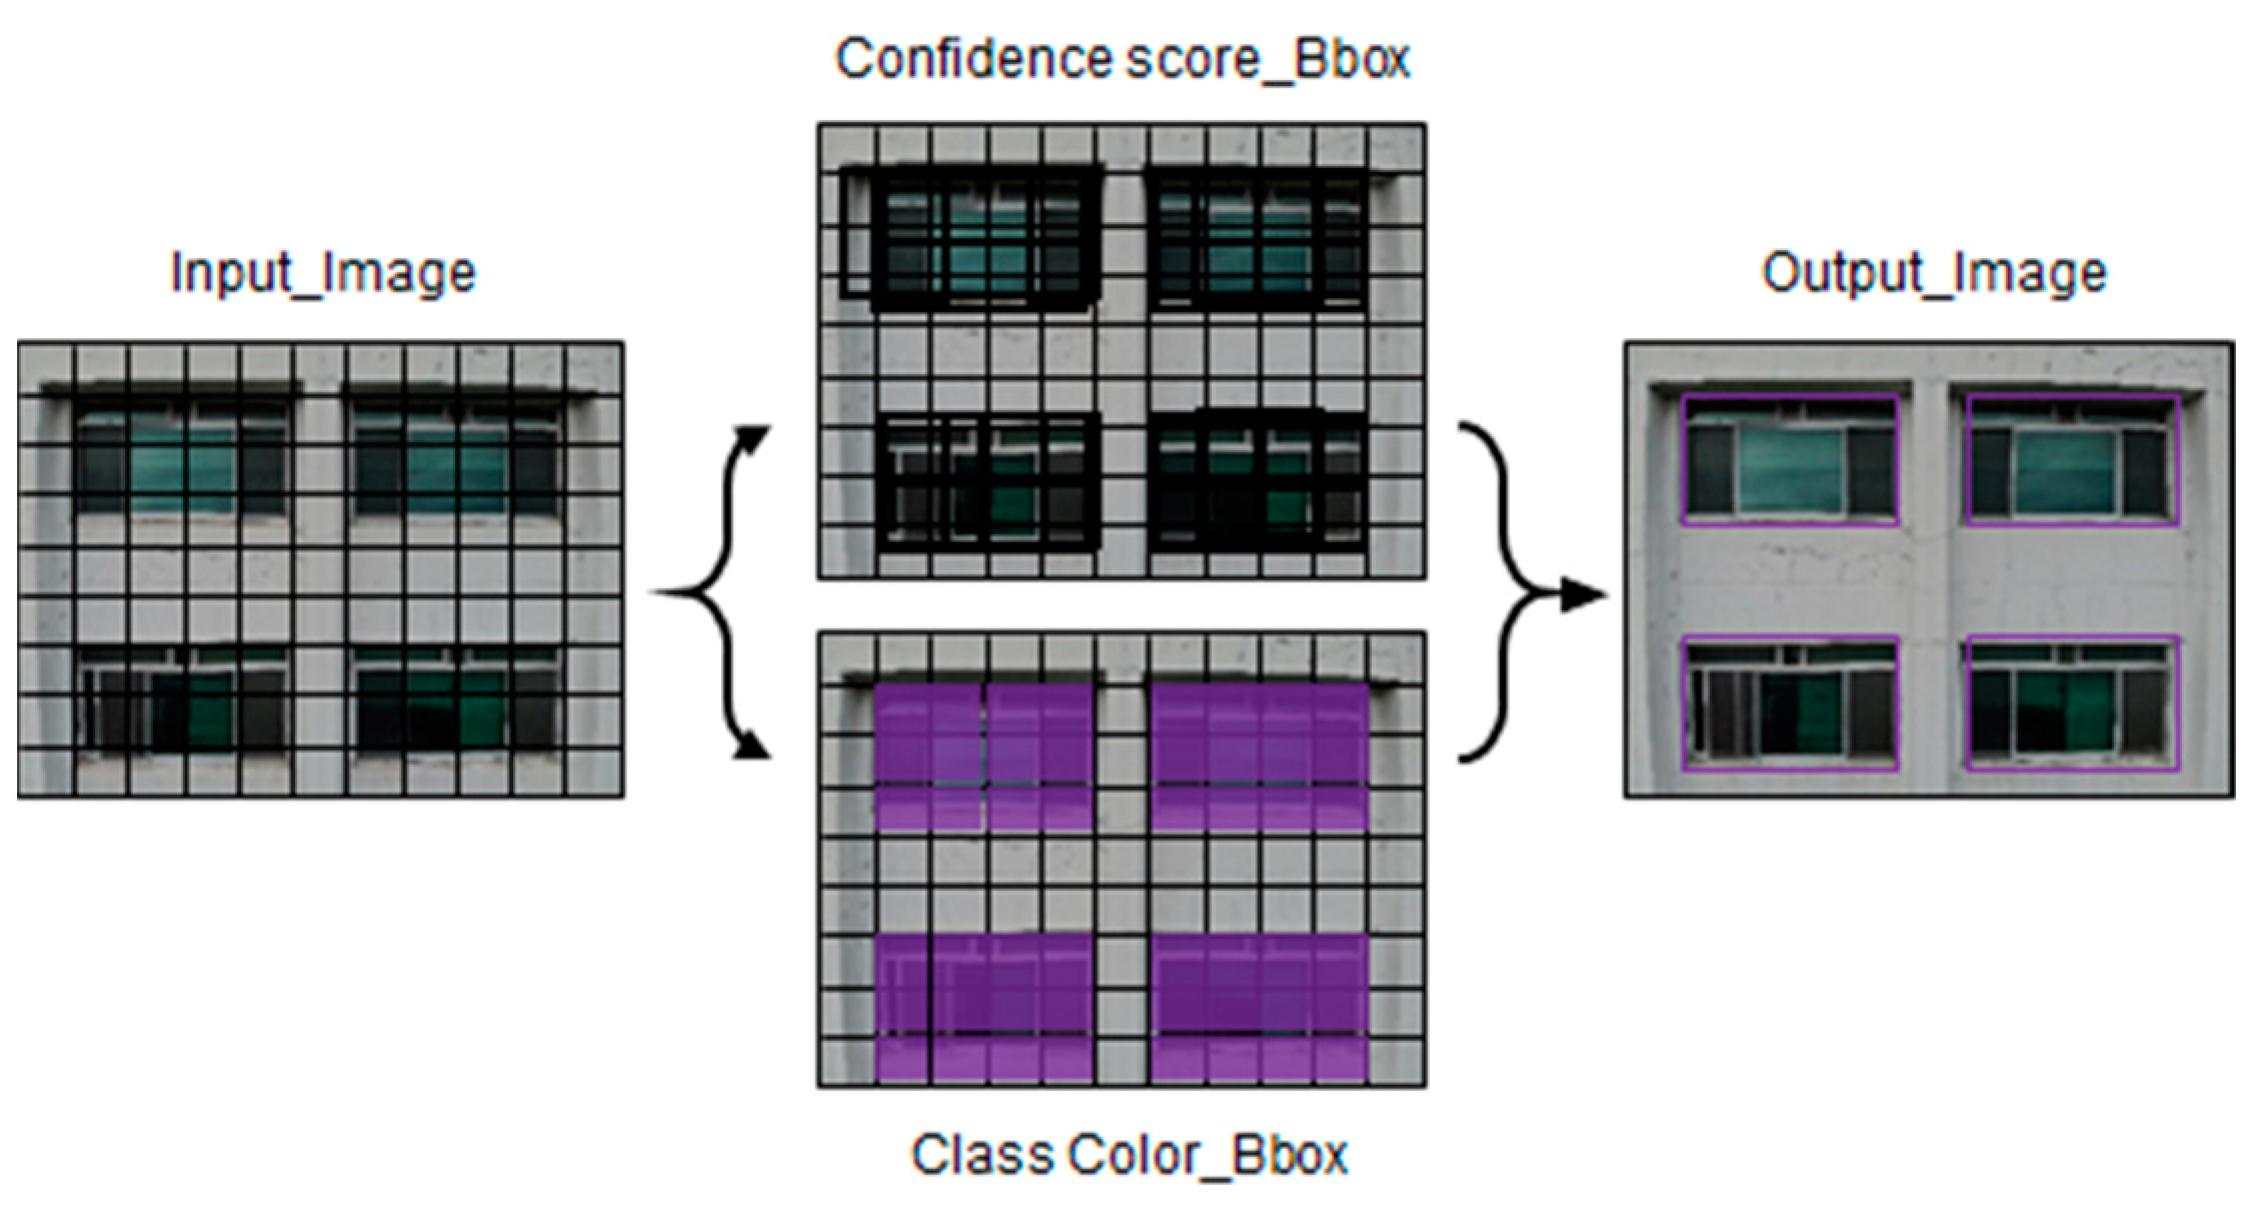
YOLO can predict the bounding boxes (Bboxes) and classes of objects in input images. First, it divides the input image into a grid of size X,X. Then, thin Bboxes of various sizes are created within the grid area. The algorithm predicts the locations where the learned objects are estimated to be within the Bboxes. Confidence scores for the predicted locations are predicted, and the Bboxes in these areas are made thicker. Finally, only thick Bboxes are left, and the thin Bboxes are removed. The non-maximum suppression (NMS) algorithm is applied to the remaining Bboxes to select the final Bboxes [26]. This description is shown in Figure 2.
The NMS algorithm removes duplicated Bboxes. First, it identifies Bboxes with high confidence scores and examines other Bboxes that overlap with these Bboxes. Then, overlapping Bboxes with low confidence scores are removed. The algorithm calculates the Intersection over union (IoU) as an index. To obtain the IoU, the size of two overlapping Bboxes is divided by the total area. It is expressed as a value between 0 and 1.
In Equation (1), A represents the correct Bbox and B represents the predicted Bbox. In Equation (2), is 1 if an object is predicted to be within the grid of size X, X; otherwise, it is 0. The Bbox consists of five predicted values (x, y, w, h, and confidence). The x and y coordinates give the relative location of the center of the Bbox within the grid cell. The w, h pair consists of the relative width and height of the Bbox. (x, y) and (w, h) both have values between 0 and 1. Conditional class probabilities (C) are predicted for each grid cell. In Equation (3), C represents the conditional probability that an object is in a certain class under the condition that the object is within the grid cell. In a single grid cell, the probability for only one class is found, even if there are several Bboxes within the grid cell.
In the test step, the conditional class probability (C) is multiplied by the confidence scores of individual Bboxes. This indicates the probability that a certain class object will appear in the Bbox (= Pr(Class_i)) and how well the predicted Bbox fits in the class.
In Equation (4), is C (conditional class probabilities), and is the confidence score. Ultimately, the class-specific confidence score indicates the probability that a certain class will appear in the Bbox and how well the Bbox fits in the class, and the dimensions of the final prediction tensor can be calculated as X × X (5 × B + C).
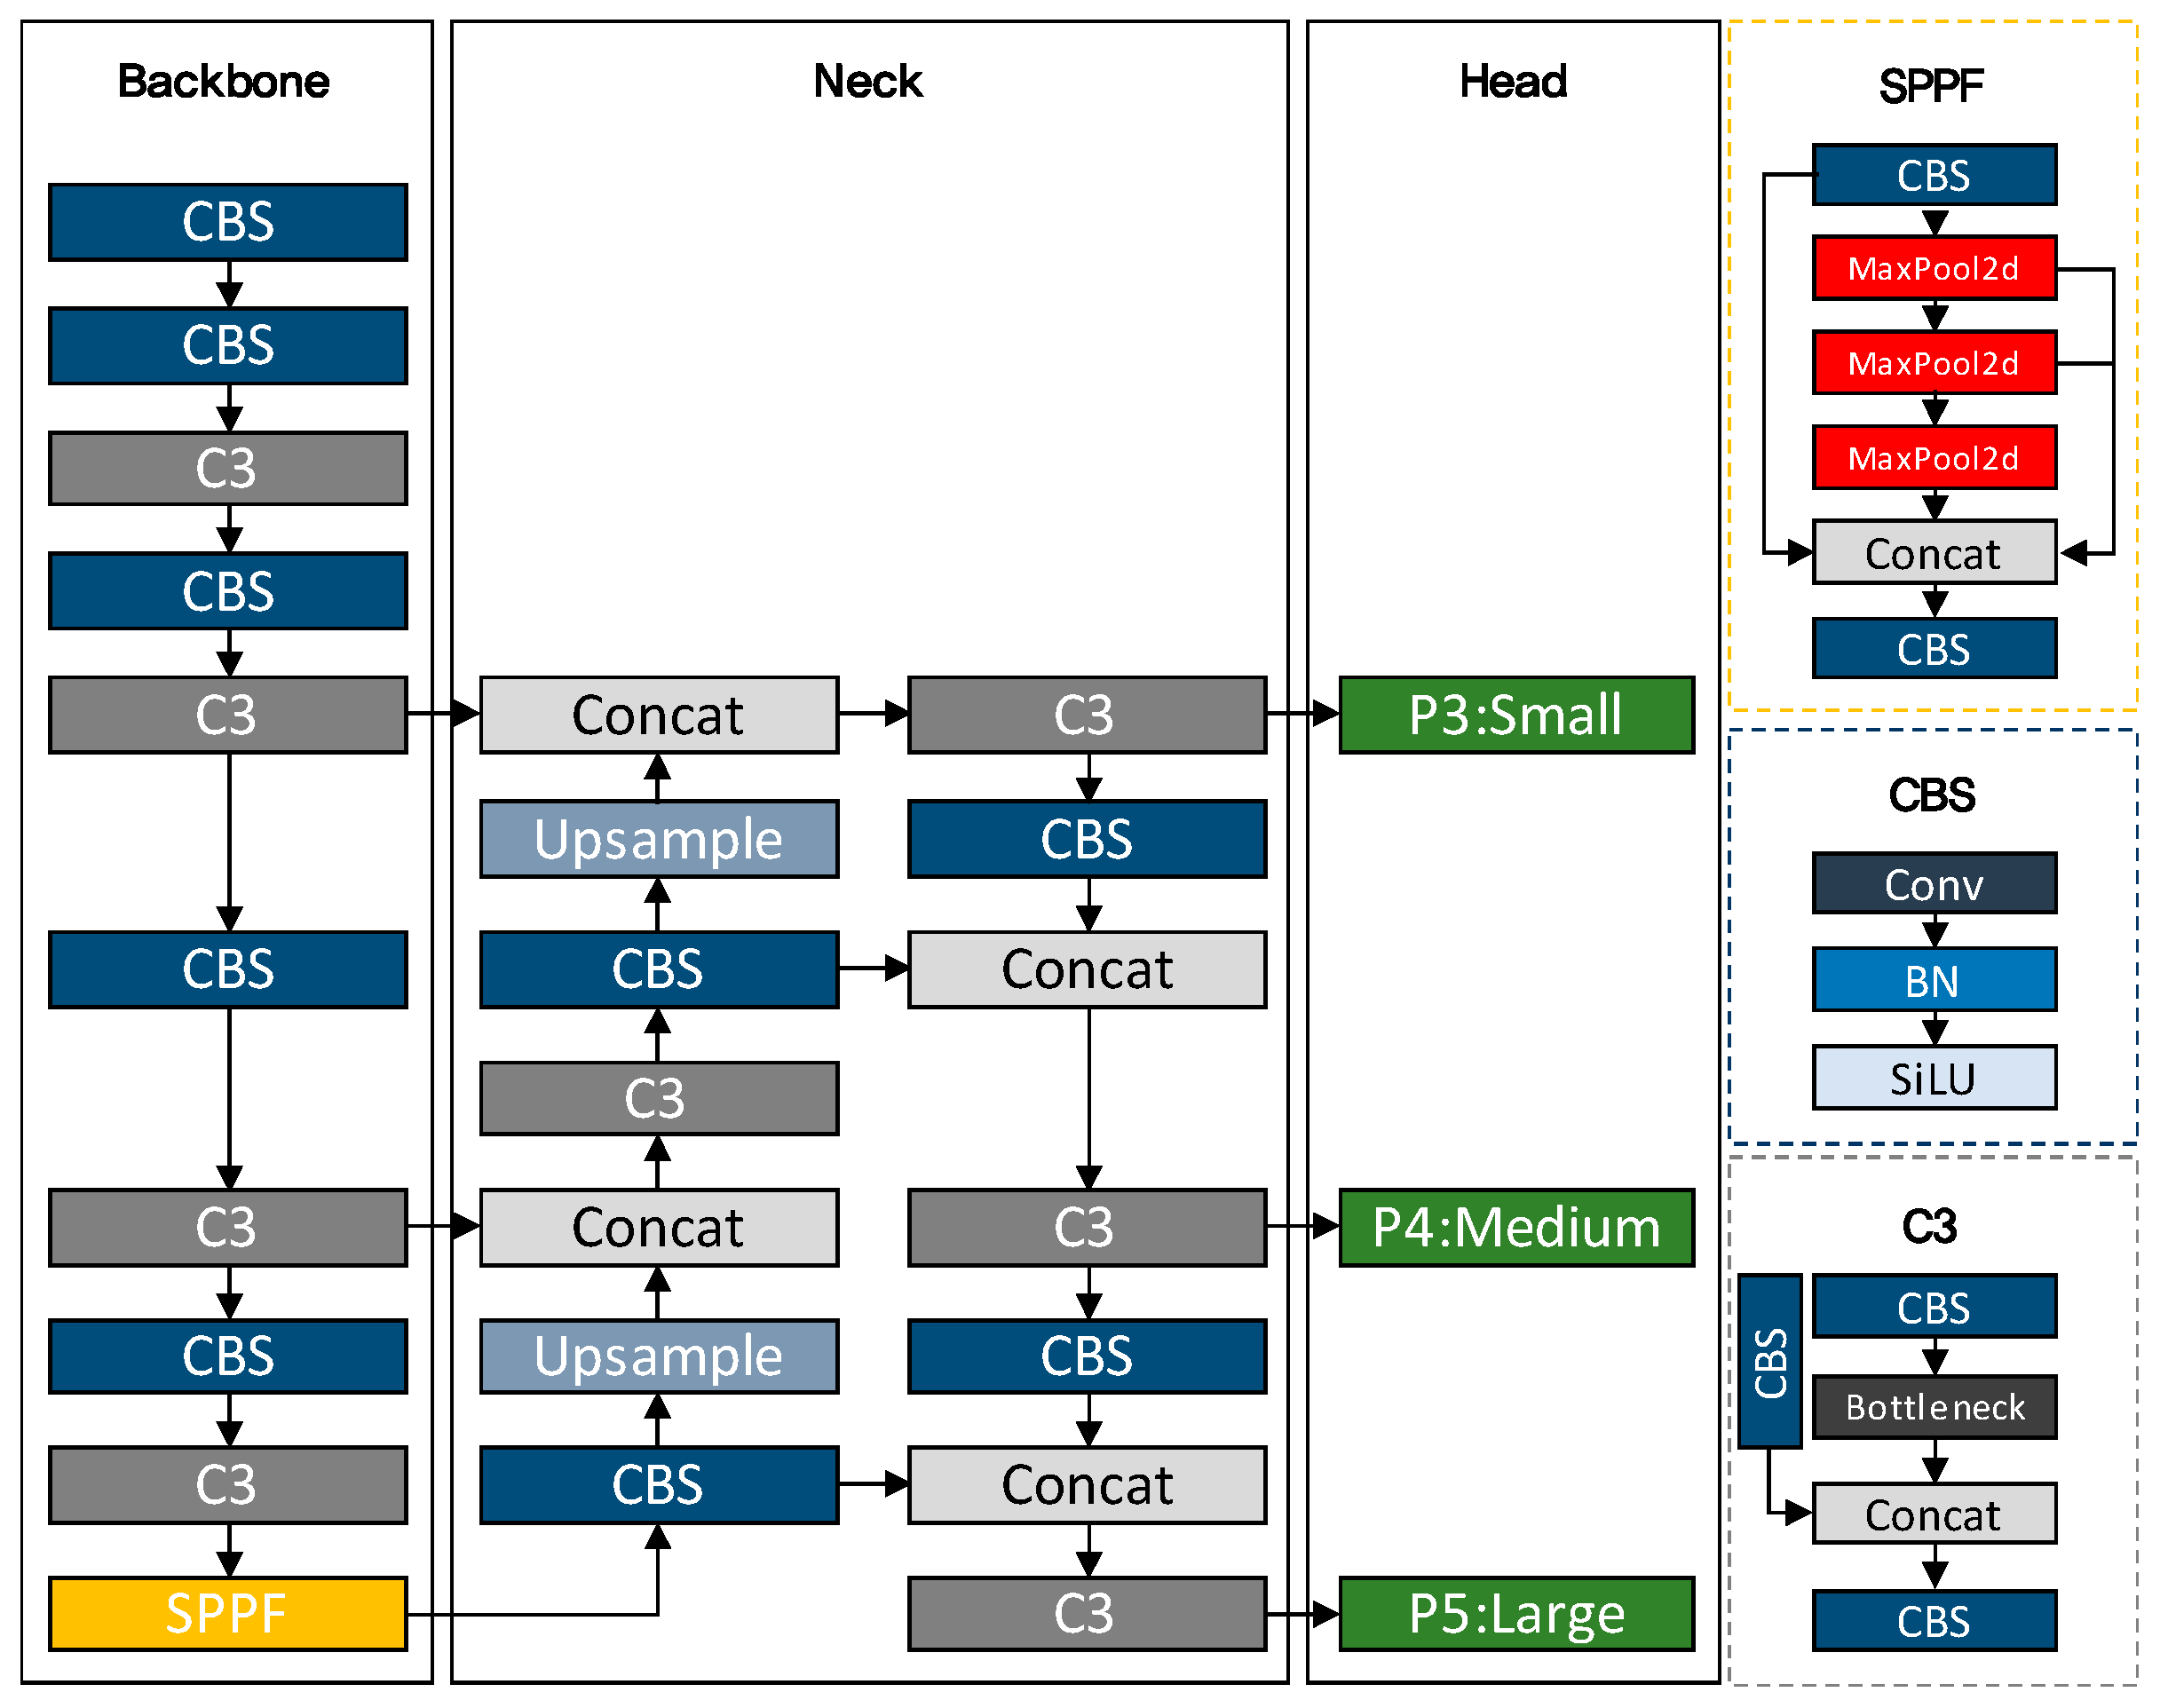
The architecture of YOLOv5 can be divided into the backbone, neck, and detection parts. The backbone consists of Cross Stage Partial Network (CSPNet), CSP Bottleneck with 3 convolutional layers (C3), and spatial pyramid pooling with factorized convolutions (SPPF) modules. The CSPNet module serves to reduce the number of model parameters and the amount of computation by reducing the network’s depth. The C3 module uses a CSP structure to efficiently combine multiple convolutional layers. Thus, it can effectively extract features for object detection and classification tasks. The SPPF module combines spatial pyramid pooling and factorized convolution to handle the various sizes and proportions of objects by extracting features from pyramid regions of various sizes. The neck part uses the concat and upsample modules, and the concat module links multiple tensors to create a single large tensor. Thus, it can combine various feature maps, and the model can use features of various sizes and levels. The upsample module serves to expand the size of the input so that predictions can be made without losing the objects’ detailed information. Finally, the head performs object detection and predicts the Bboxes and classes of the detected objects. Modules P3, P4, and P5 present the pyramid feature maps, and the feature maps provide data of various sizes for object detection and are used to detect objects in input images of different resolutions. P3 is a feature map that is obtained by downsampling the input image’s resolution by 1/8, and it is used to detect small objects. P4 has 1/16 resolution and is used to detect medium-sized objects, whereas P5 has 1/32 resolution and is used to detect large objects [27]. This method is shown in Figure 3.
2.2.2. Object Detection Evaluation Metrics
To evaluate the reliability of the image object-recognition model, average precision (AP) is used, which is an index that evaluates the performance of object-detection algorithms. AP is based on precision, recall, and the IoU formula. It calculates the IoU of the Bbox information that corresponds to the correct answer in the verification image and the Bbox estimated by the algorithm. A value closer to 1 indicates that the estimated Bbox region is more similar to the correct Bbox region. true positive (TP), false positive (FP), and false negative (FN) are defined according to the calculated IoU value and the set IoU threshold value, and then a precision–recall (PR) curve is drawn. AP calculates the area of the PR curve that is calculated at each threshold value.
2.3. Step 3: Object GCP Acquisition Algorithm
The algorithm acquires GCP for the building elements (windows and defects) via the object GCP-acquisition algorithm, which uses the Haversine formula. The Haversine formula that is used to gather the object GCP calculates the great circle distance between two points on a sphere, and it determines the distance between two points by assuming that Earth is a sphere [28]. A specific point on Earth’s surface is defined by latitude and longitude, which are geographic coordinates. Latitude indicates how far north or south a point on Earth is, and longitude indicates how far east or west a point is. These coordinates are used to accurately express geographic location.
In Equation (8), Δϕ is the difference between the latitudes of the two points on the sphere. ϕ1 and ϕ2 represent the first and second points’ latitudes, respectively. Δλ is the difference between the longitudes of the two points. represents the radius of Earth. The average radius of Earth is approximately 6371 km.
This Haversine formula is used to calculate the distance between the building GCP and the image GCP. The minimum distance is defined as the photography shooting distance. The actual size of the image region is calculated via the proportion formula using the image data’s metadata (i.e., the focal length, sensor size, and image resolution) and the photography shooting distance.
Equation (11) provides the actual size that is included in a single pixel of resolution. FL represents the focal length of the camera, SS represents the sensor size, L represents the shooting distance, and R represents the image resolution.
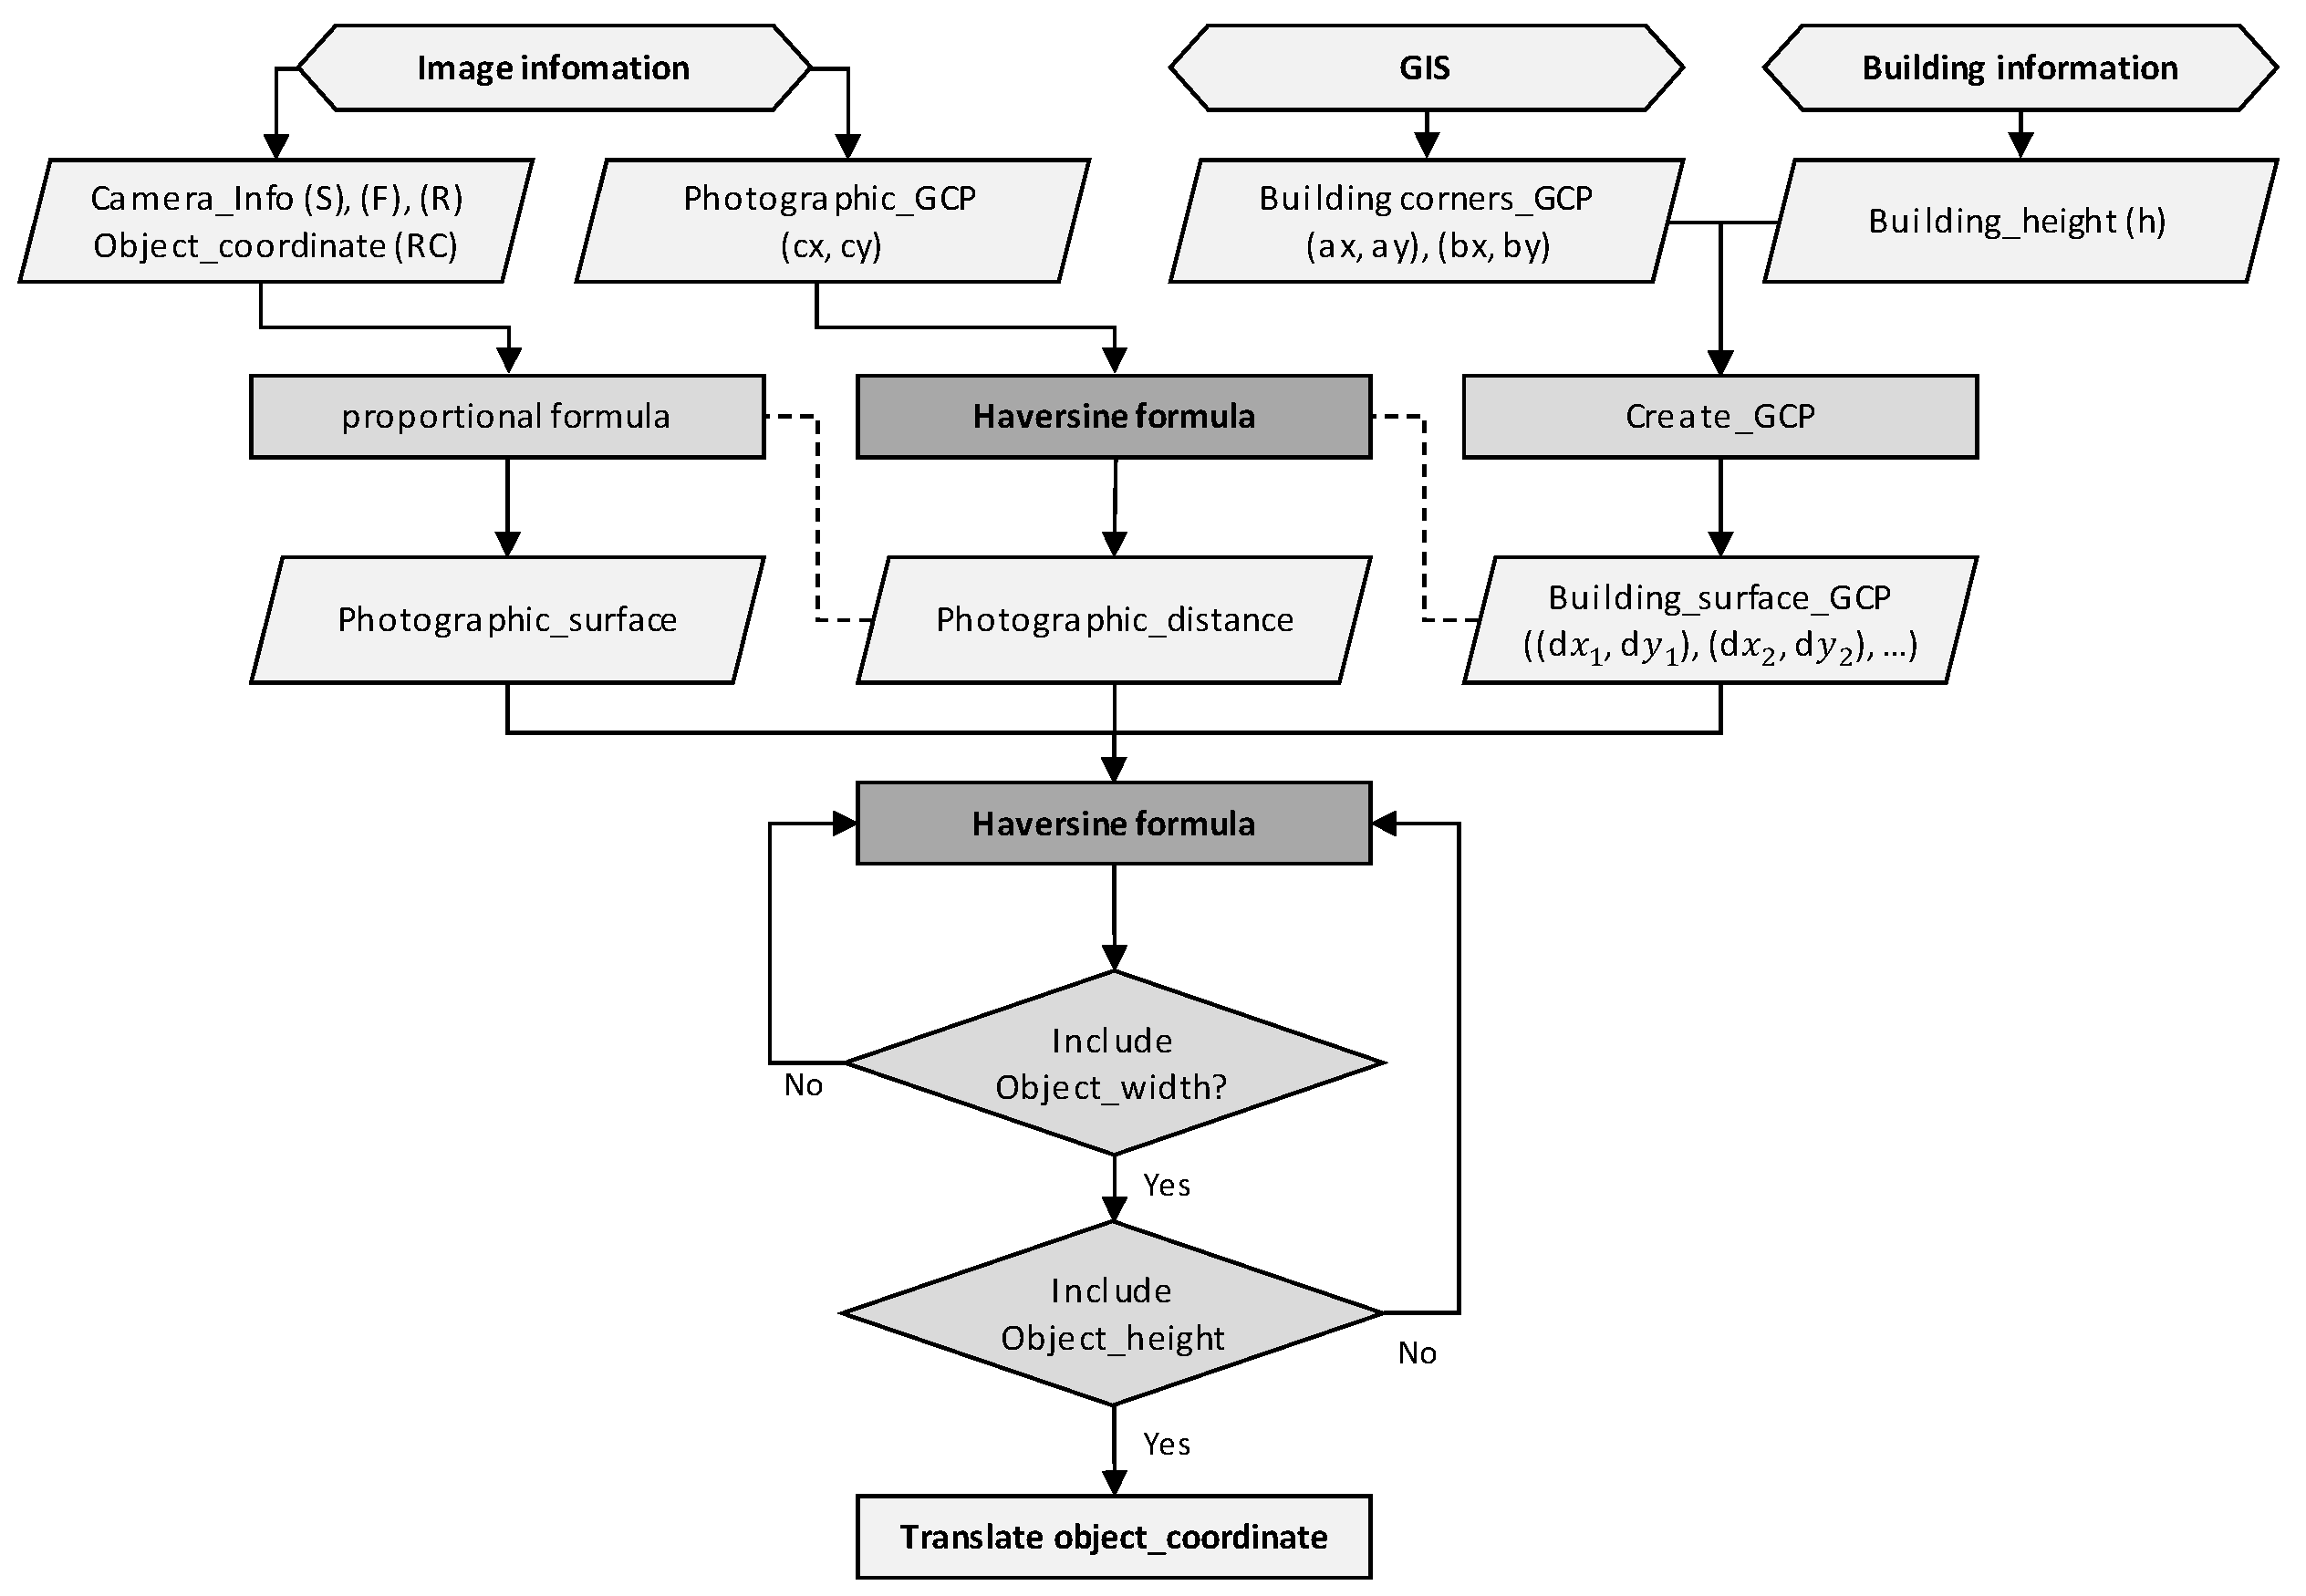
Next, the building GCP, which is defined by the image resolution’s center position and the image-acquisition distance, is defined as 0. Then, the algorithm calculates the pixel difference between the coordinates that correspond to the center of the image and the coordinates of the image object. In the proportional formula, the pixel difference is multiplied by the actual size of one pixel of resolution to measure the actual distance from the center of the image resolution to the object location. Then, the measured actual distance value is defined as the standard value for obtaining the object GCP. The Haversine formula is used to calculate the distance between the building GCP that is defined as 0 and the other building GCP values. Next, calculated values that are the same as the measured distance values are matched. In the distance-based GCP acquisition, both the x and y values of image object coordinates must be acquired. The x coordinates are acquired via the aforementioned distance matching, and then distance matching is performed again for the y coordinates. An algorithm with this structure is used to convert the image coordinates of the objects that are recognized in the images into GCP data and define object GCP values in the building geometry. The defined object GCP includes two GCP data that are located at the top left and bottom right of the object’s shape. Figure 4 shows the structure of the algorithm described above.
2.4. Step 4: Vector Acquisition and Correction
In the final section, all the GCP information (i.e., building corners and objects) is converted into vectors, and the vector values are used as coordinates for generating a 3D model. For the object GCP, the vector correction algorithm presented in Section 2.4.2 is used to acquire the vectors that are included in the range of building-corner vector values. The vectors acquired in this manner are used as location coordinates for 3D modeling.
2.4.1. Vector Acquisition
To acquire the 3D spatial x, y, and z values of the building shape, one of the acquired GCP values is defined as the reference point (0, 0, 0), and the locations of the other acquired GCP are measured. To define the 3D space, measurements must be performed using the length and direction of the reference point and relative point. For the length, the Haversine formula described in Section 2.3 is used. For the direction, the bearing between the two points is calculated using a bearing formula based on spherical trigonometry. The length and direction between the two points are calculated using the GCP that corresponds to the reference point and the GCP that corresponds to the relative point. Ultimately, 2D x, y vector values are acquired for the measured distance and direction values. The z value, which corresponds to the third dimension, is defined as the acquired building height value. The bearing formula is Equation (15) as follows [29].
In Equation (13), (x,y) indicates the latitude and longitude of the reference point, and (x,y) is a value that indicates the latitude and longitude of the relative point.
In Equation (16), d represents the distance between two points based on the Haversine formula, and BF represents the direction between the two points based on the bearing formula.
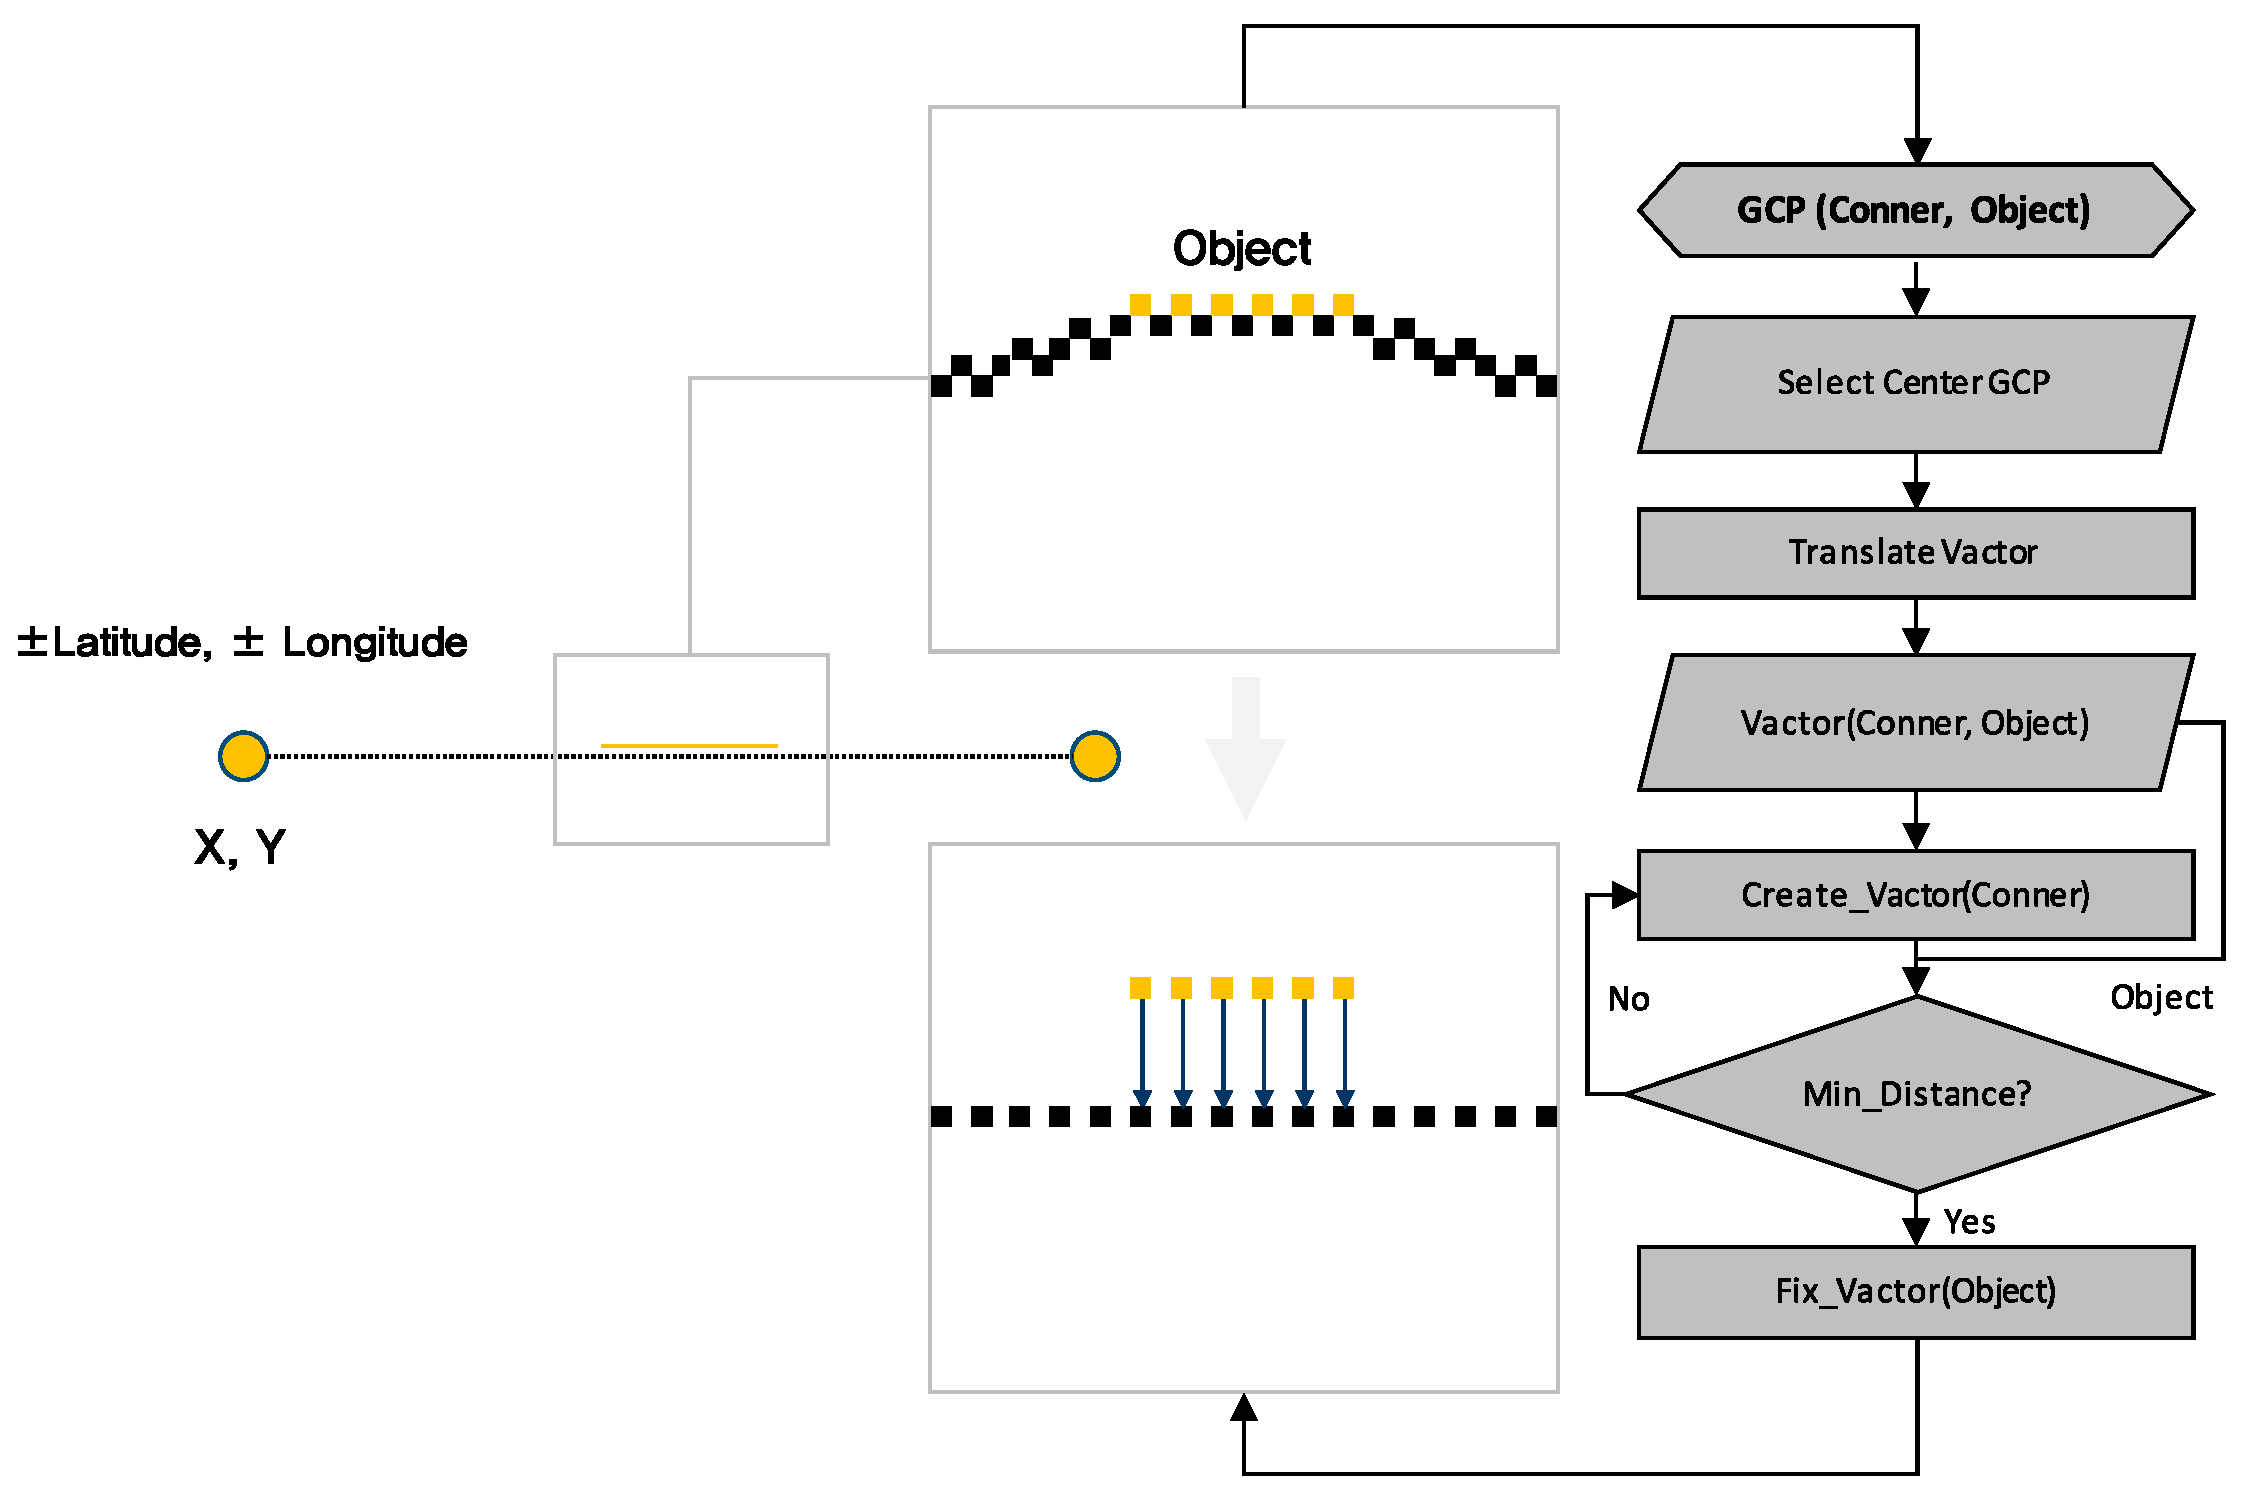
2.4.2. Vector Correction
The building geometry is based on Earth’s spheroid body, and its shape consists of curves rather than straight lines. Therefore, in the vector-based 3D model that is constructed using the GCP that corresponds to the building corners, the GCP object locations that are acquired via the building geometry may deviate from the vector-based model. In the present study, to compensate for this, a vector-correction algorithm is used, in which the location that corresponds to the vector-based 3D model’s closest coordinates is replaced with the object vector value. The vector-correction algorithm generates virtual point coordinates that correspond to straight lines between two vector coordinates corresponding to the building corners. Then, the object vector coordinates and distance are repeatedly measured. Subsequently, the minimum distance is determined, and the virtual coordinates are defined as the acquired object coordinates. Figure 5 shows the structure of the vector-correction algorithm.
2.5. Step 5: Automatic 3D Modeling
Finally, in the automatic 3D modeling stage, SketchUp API-based Ruby code is created to use tools within SketchUp. Then, the results are used to perform automatic 3D modeling. The SketchUp API is employed when using geometric tools to perform modeling based on the acquired data. The acquired vector coordinates contain unique information, such as building contour lines and objects. Therefore, the defined vectors for each unique piece of information are grouped so that they can be recognized as a single element. All vectors included in a recognized element are generated using the rectangle tool. Next, the height information is inputted, and building contour lines are created in a single building model. Objects are placed in regions that correspond to object locations in the generated building model.
3. Case Study
The proposed method was implemented to perform automatic 3D modeling of a specific building. Then, the building’s actual data and the model size data were compared to verify the results by analyzing the generated building in terms of the element-area and defect-location errors.
3.1. Building Information
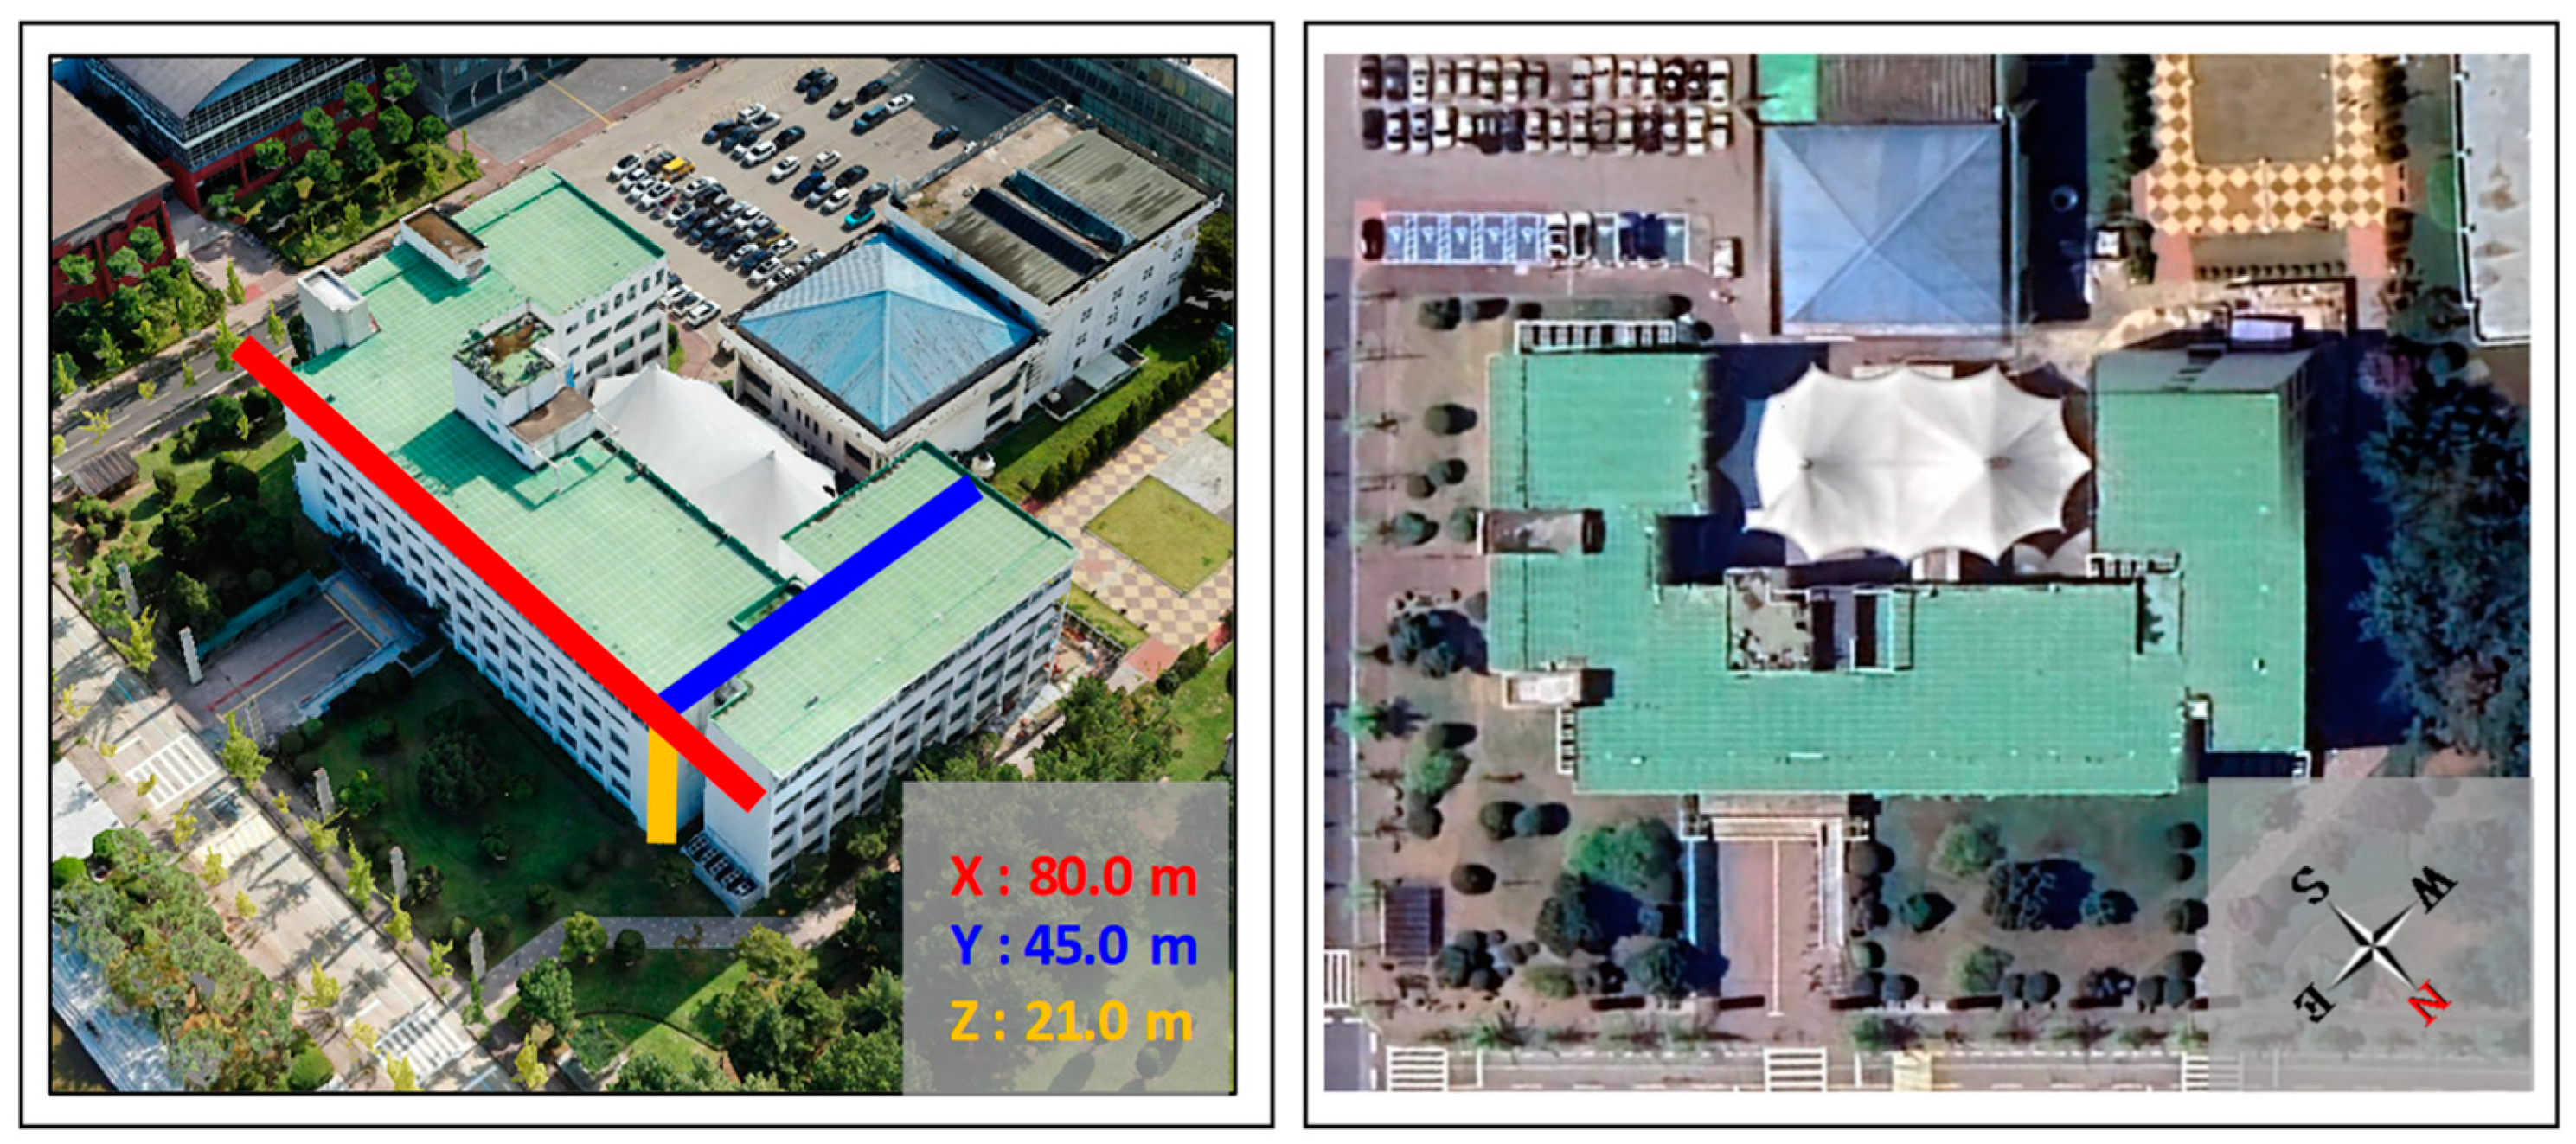
To implement the proposed method, “Engineering Building #2”, which is located at a latitude of 37.297224° N and a longitude of 126.832766° E, was selected. The target building is a polygonal building with five stories. There are trees near the building on the left, on the right, and at the front, and there is an adjacent building at the rear. This building was selected because it allowed the UAV photography plan to be reviewed under various environmental conditions. The exterior of the building is shown in Figure 6.
3.2. Acquisition of Flight Path and GCP
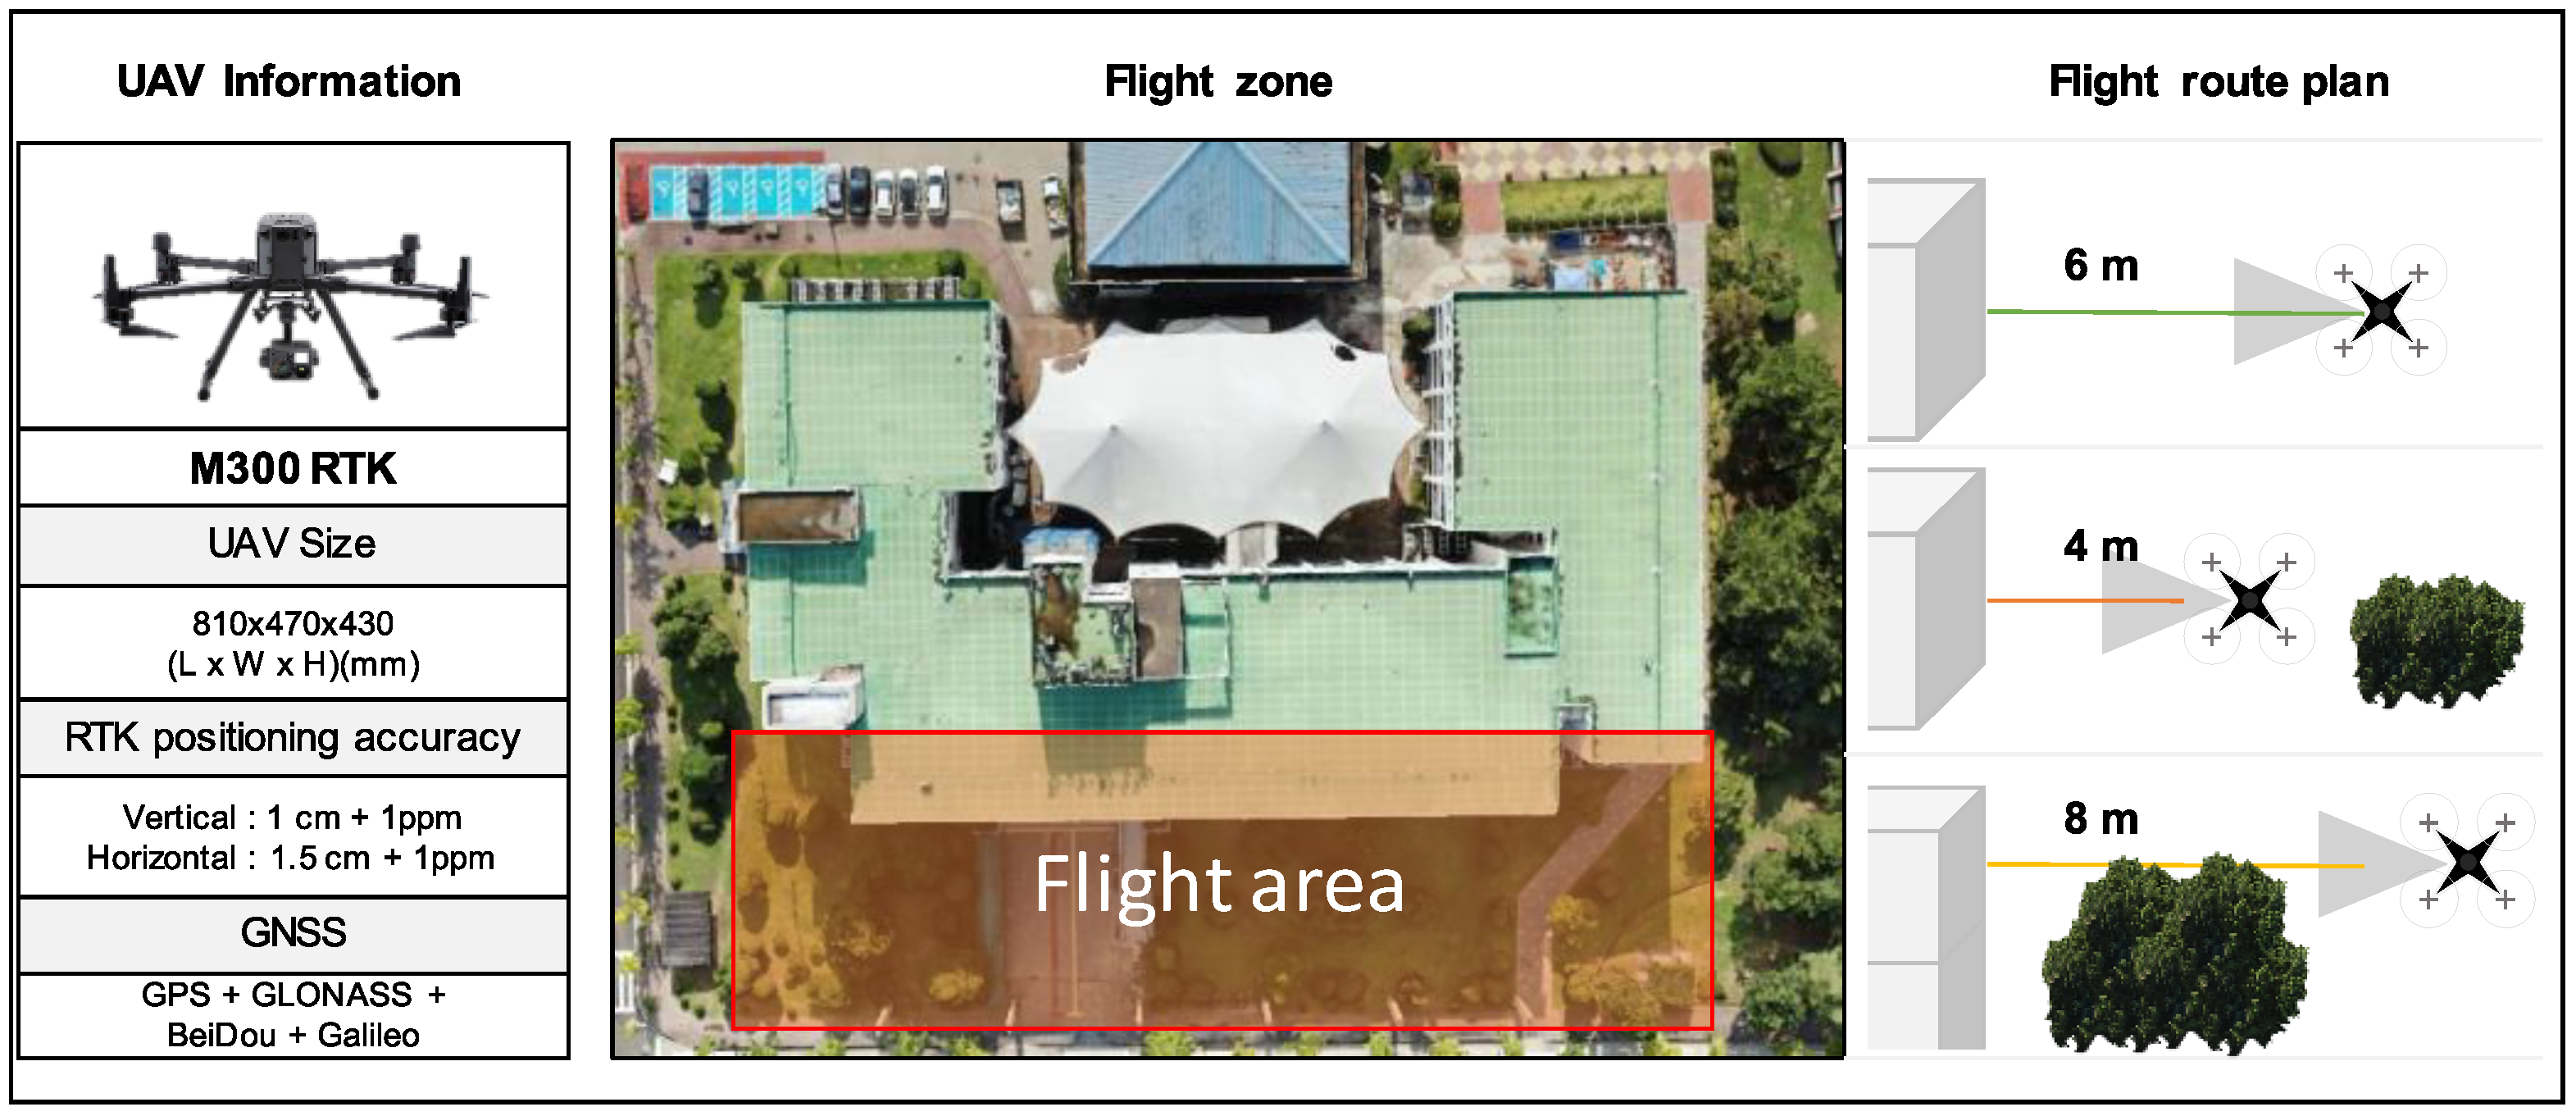
To acquire the shape of the building, a photography plan was established with consideration of the nearby environmental factors. In the photography plan, a photography flight was performed across the entire span of the building’s front at a 6 m distance from the walls without any duplicated regions. However, the surrounding area in front of the target building was a landscaped environment, and parts of the lower floors were photographed from less or more than 6 m to avoid the landscaping. When photography was performed from far away, manual records were used to replace the parts of the building that were blocked by trees and shrubs. When 3D modeling of the building was performed later, the manual records roughly depicted the locations of windows and the areas of cracks. The layout of the windows in the manual records was created by duplicating windows of the same size that were captured by photography. An “DJI M300 RTK” was selected as the UAV to acquire the images. This airframe included real-time kinetic (RTK) features for accurately transmitting GCP information. An H20T camera was attached to the airframe, and the resolution of the images captured by the camera was 4056 × 3040 pixels. The focal length was kept at 4.5 mm, and the sensor was a 1/2.3 complementary metal-oxide-semiconductor (CMOS) sensor. The information above is shown in Figure 7.
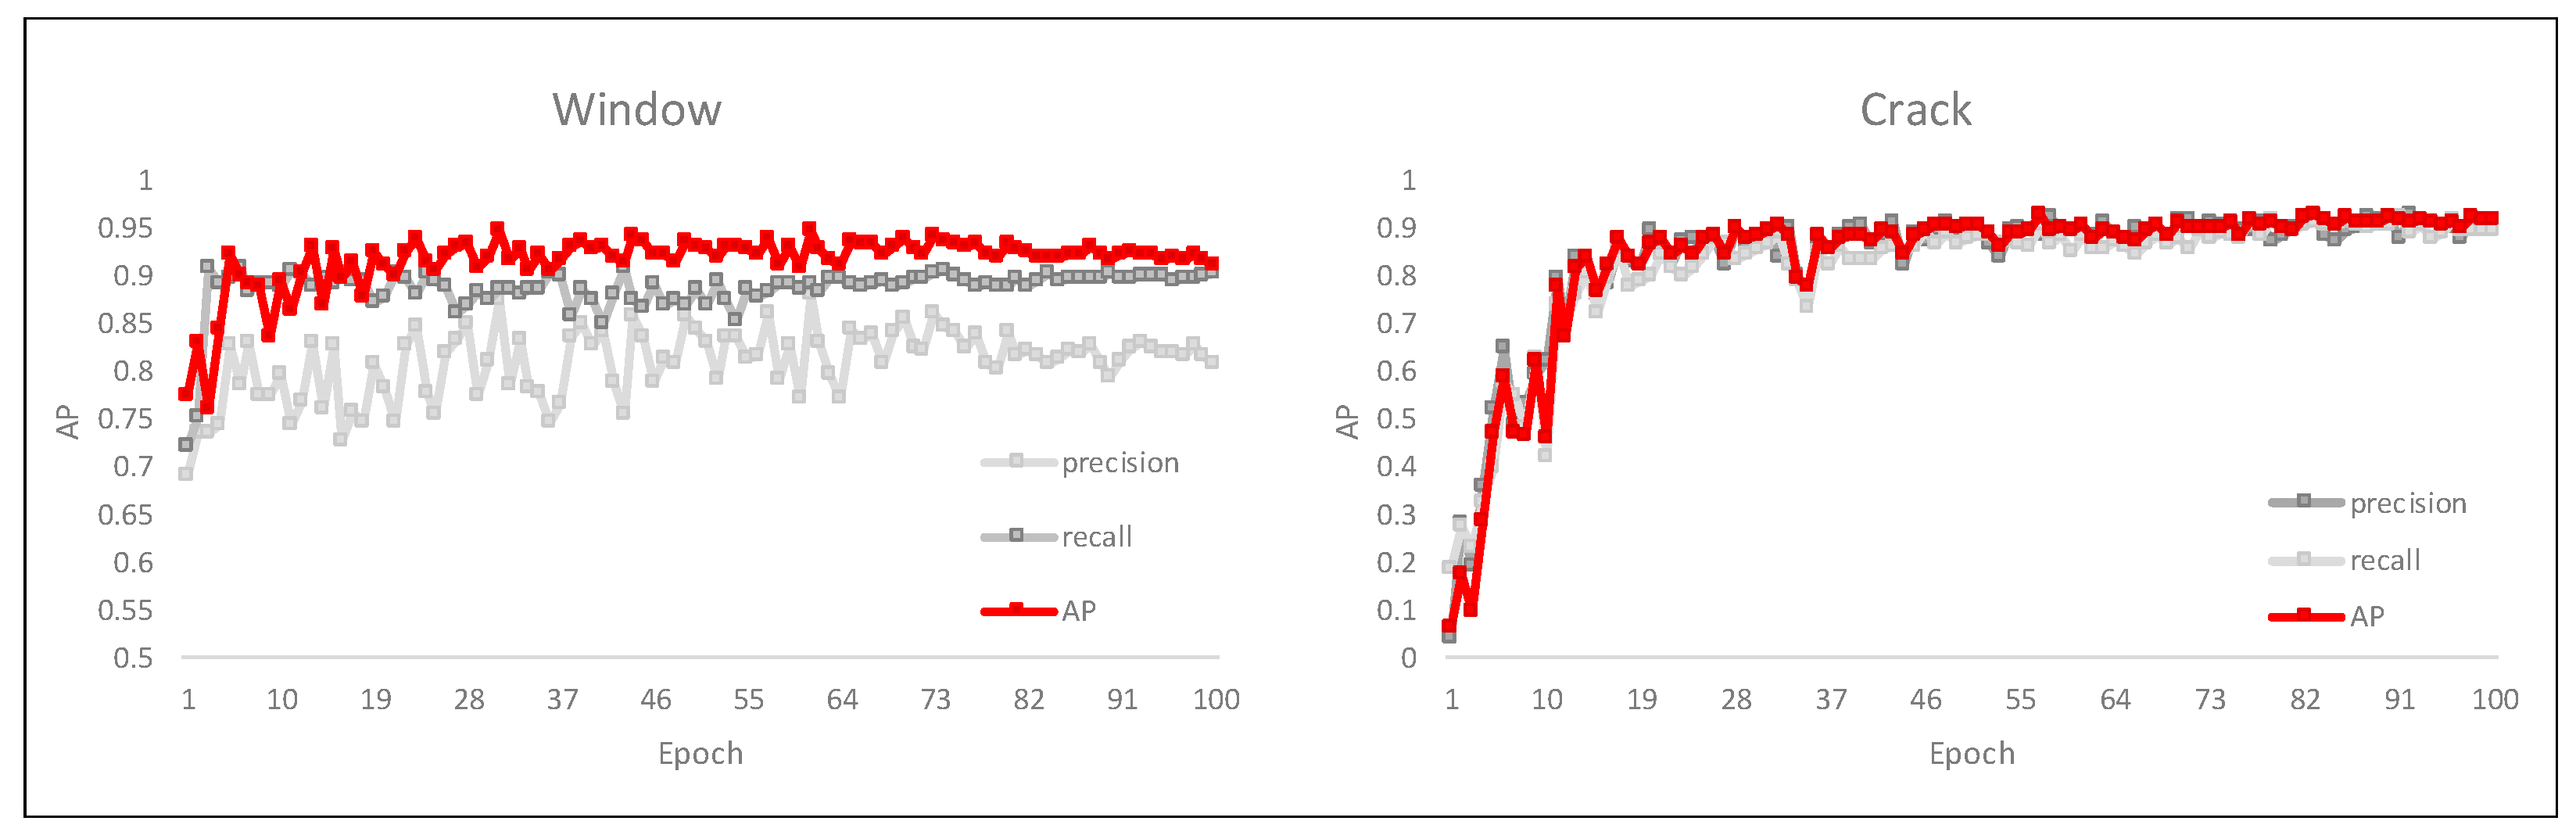
To acquire the windows’ resolution coordinates from the acquired images, 10,000 window training data were used in the YOLOv5 CNN model. Additionally, to acquire the resolution coordinates of the cracks, 500 crack-training data were used. The two types of training data were each used to perform training for 100 epochs, and object recognition was performed according to the epoch with the best performance. Crack achieved the highest AP score of 0.926 at Epoch 56, with a precision of 0.884 and a recall of 0.91. Additionally, window achieved the highest AP score of 0.947 at Epoch 60, with a precision of 0.88 and a recall of 0.89. The performance is illustrated through Figure 8.
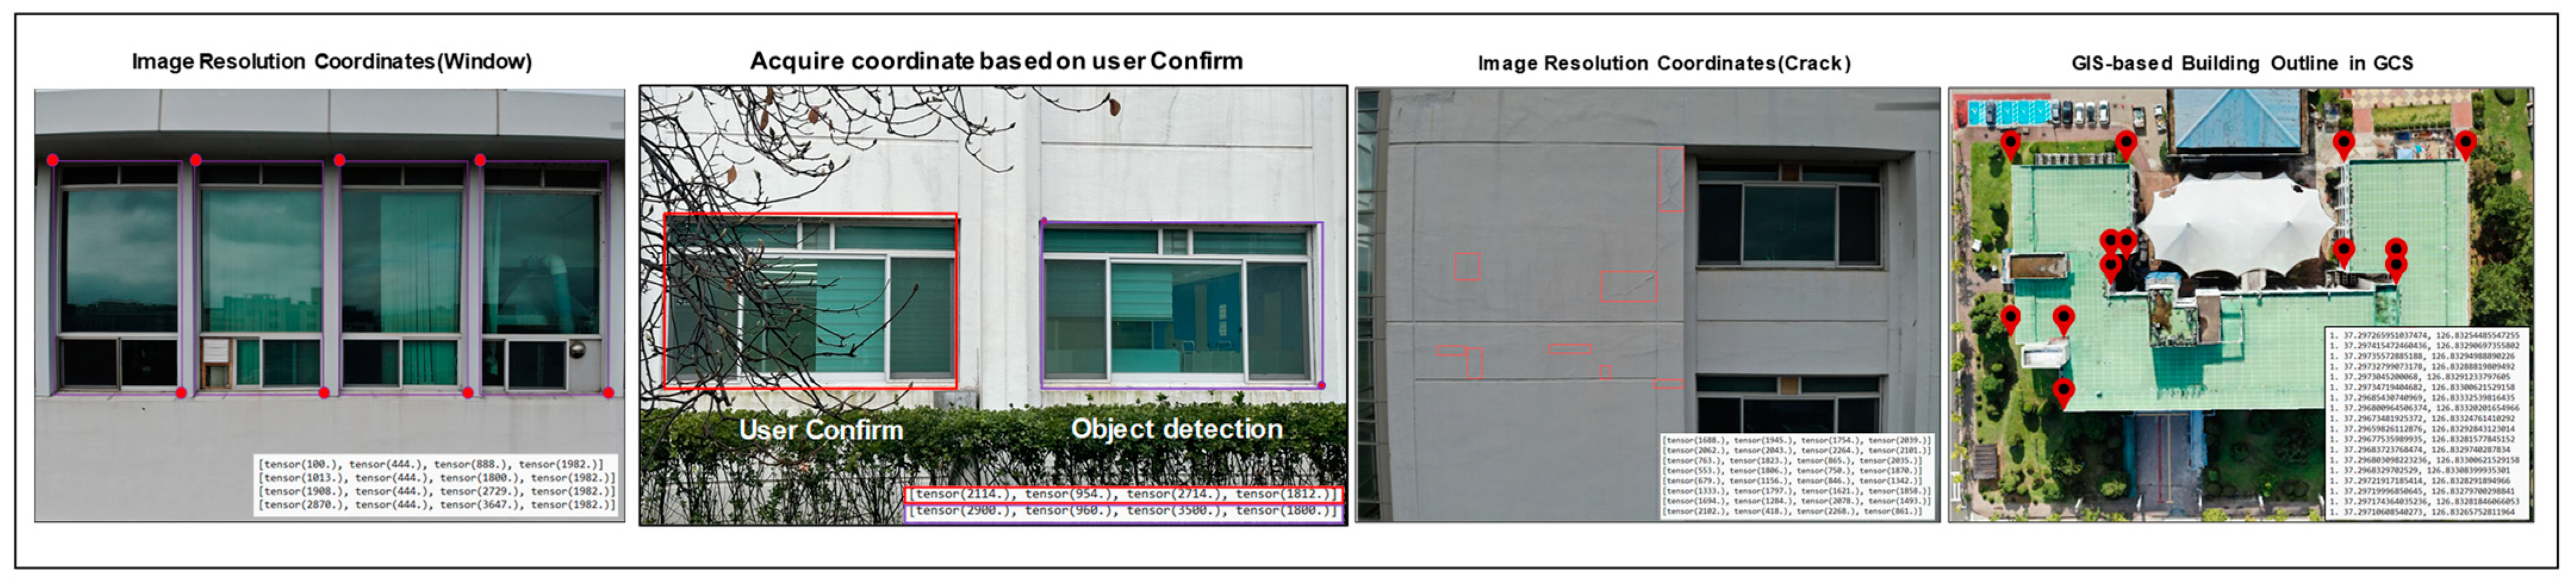
The trained model was used to recognize the windows in the images as box shapes, and the boxes’ top-left and bottom-right resolution coordinates were acquired. However, in areas where image object detection was not performed, the user reviewed it and manually entered the resolution coordinates of the window. Next, to acquire the GCP data that corresponded to the GIS-based building corners, the Google Maps API and JavaScript were used to load a GIS-based satellite map and acquire the coordinates that corresponded to the target building. As for the acquired building corner GCP information, the box coordinates of the windows and cracks that were acquired from the images were converted into GCP using an object GCP-acquisition algorithm. Figure 9 visualizes the above content.
3.3. Building Vector Acquisition
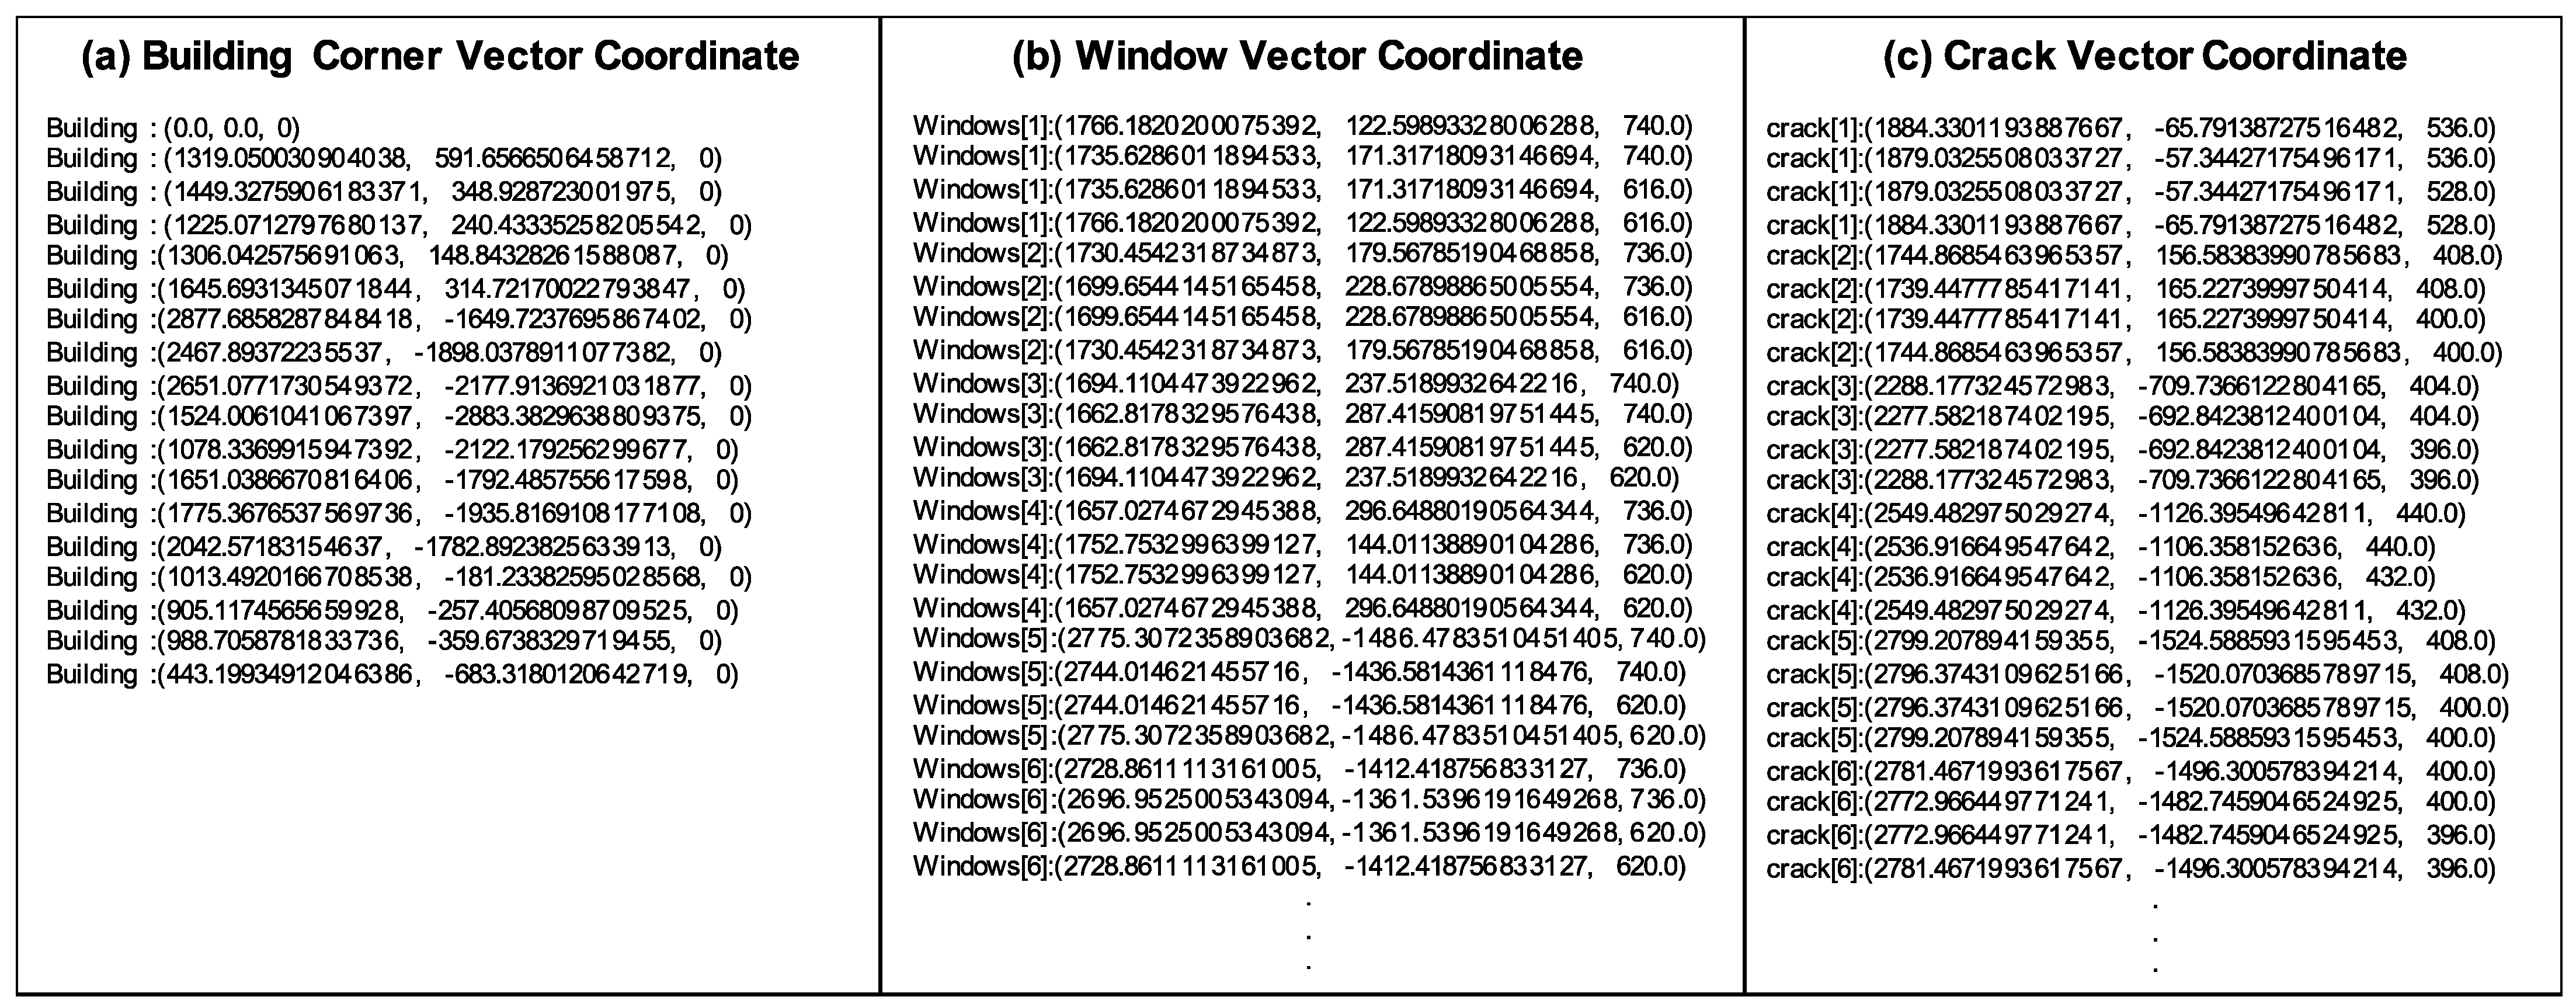
One of the previously acquired building-corner GCP values was defined as the reference vector coordinate 0, 0, 0. Next, the remaining building-corner GCP values were converted into vector coordinates by calculating their distances to the reference. The window and crack GCP values were similarly converted into vector coordinates. Then, they were modified again using the building vector coordinates to acquire the final vector coordinates. The information of collected coordinates can be observed in Figure 10.
3.4. Automatic 3D Modeling
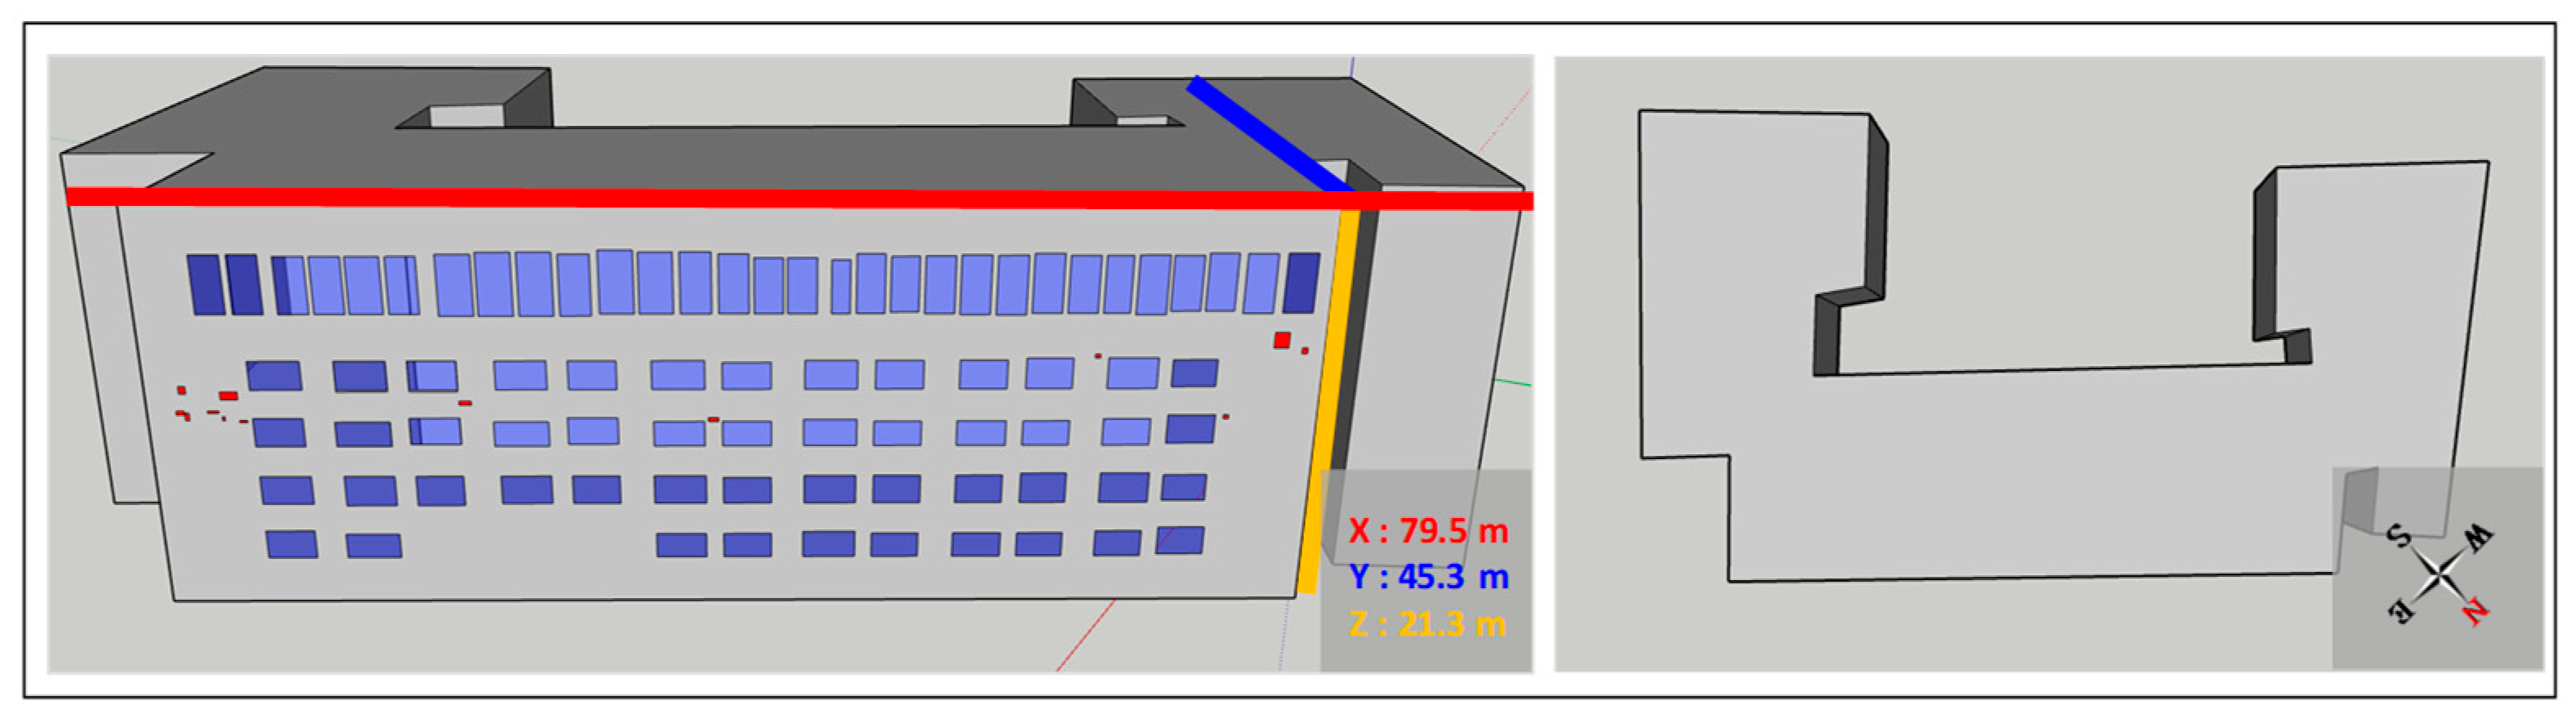
Finally, modeling tools (e.g., SketchUp) were used to generate a vector coordinate-based 3D model. SketchUp API-based modeling tools (e.g., face, line, and height creation) were used, and the shape of the building was first created using the vector coordinates of the building corners. Next, the other vector coordinates for the windows and cracks were inputted for the corresponding wall surfaces. This method was written in Ruby code and implemented as active code in the SketchUp 2022 software. The generated 3D model is presented in Figure 11.
The sizes of the actual building and the modeled building were compared, and the results are presented in Table 1.
The overall sizes of the building and the inputted windows’ sizes were compared, and the results indicated that there were errors of 1.47% for the building, 21.3% for Window 1, and 7.3% for Window 2. Additionally, there was close agreement in the shape of the front of the building.
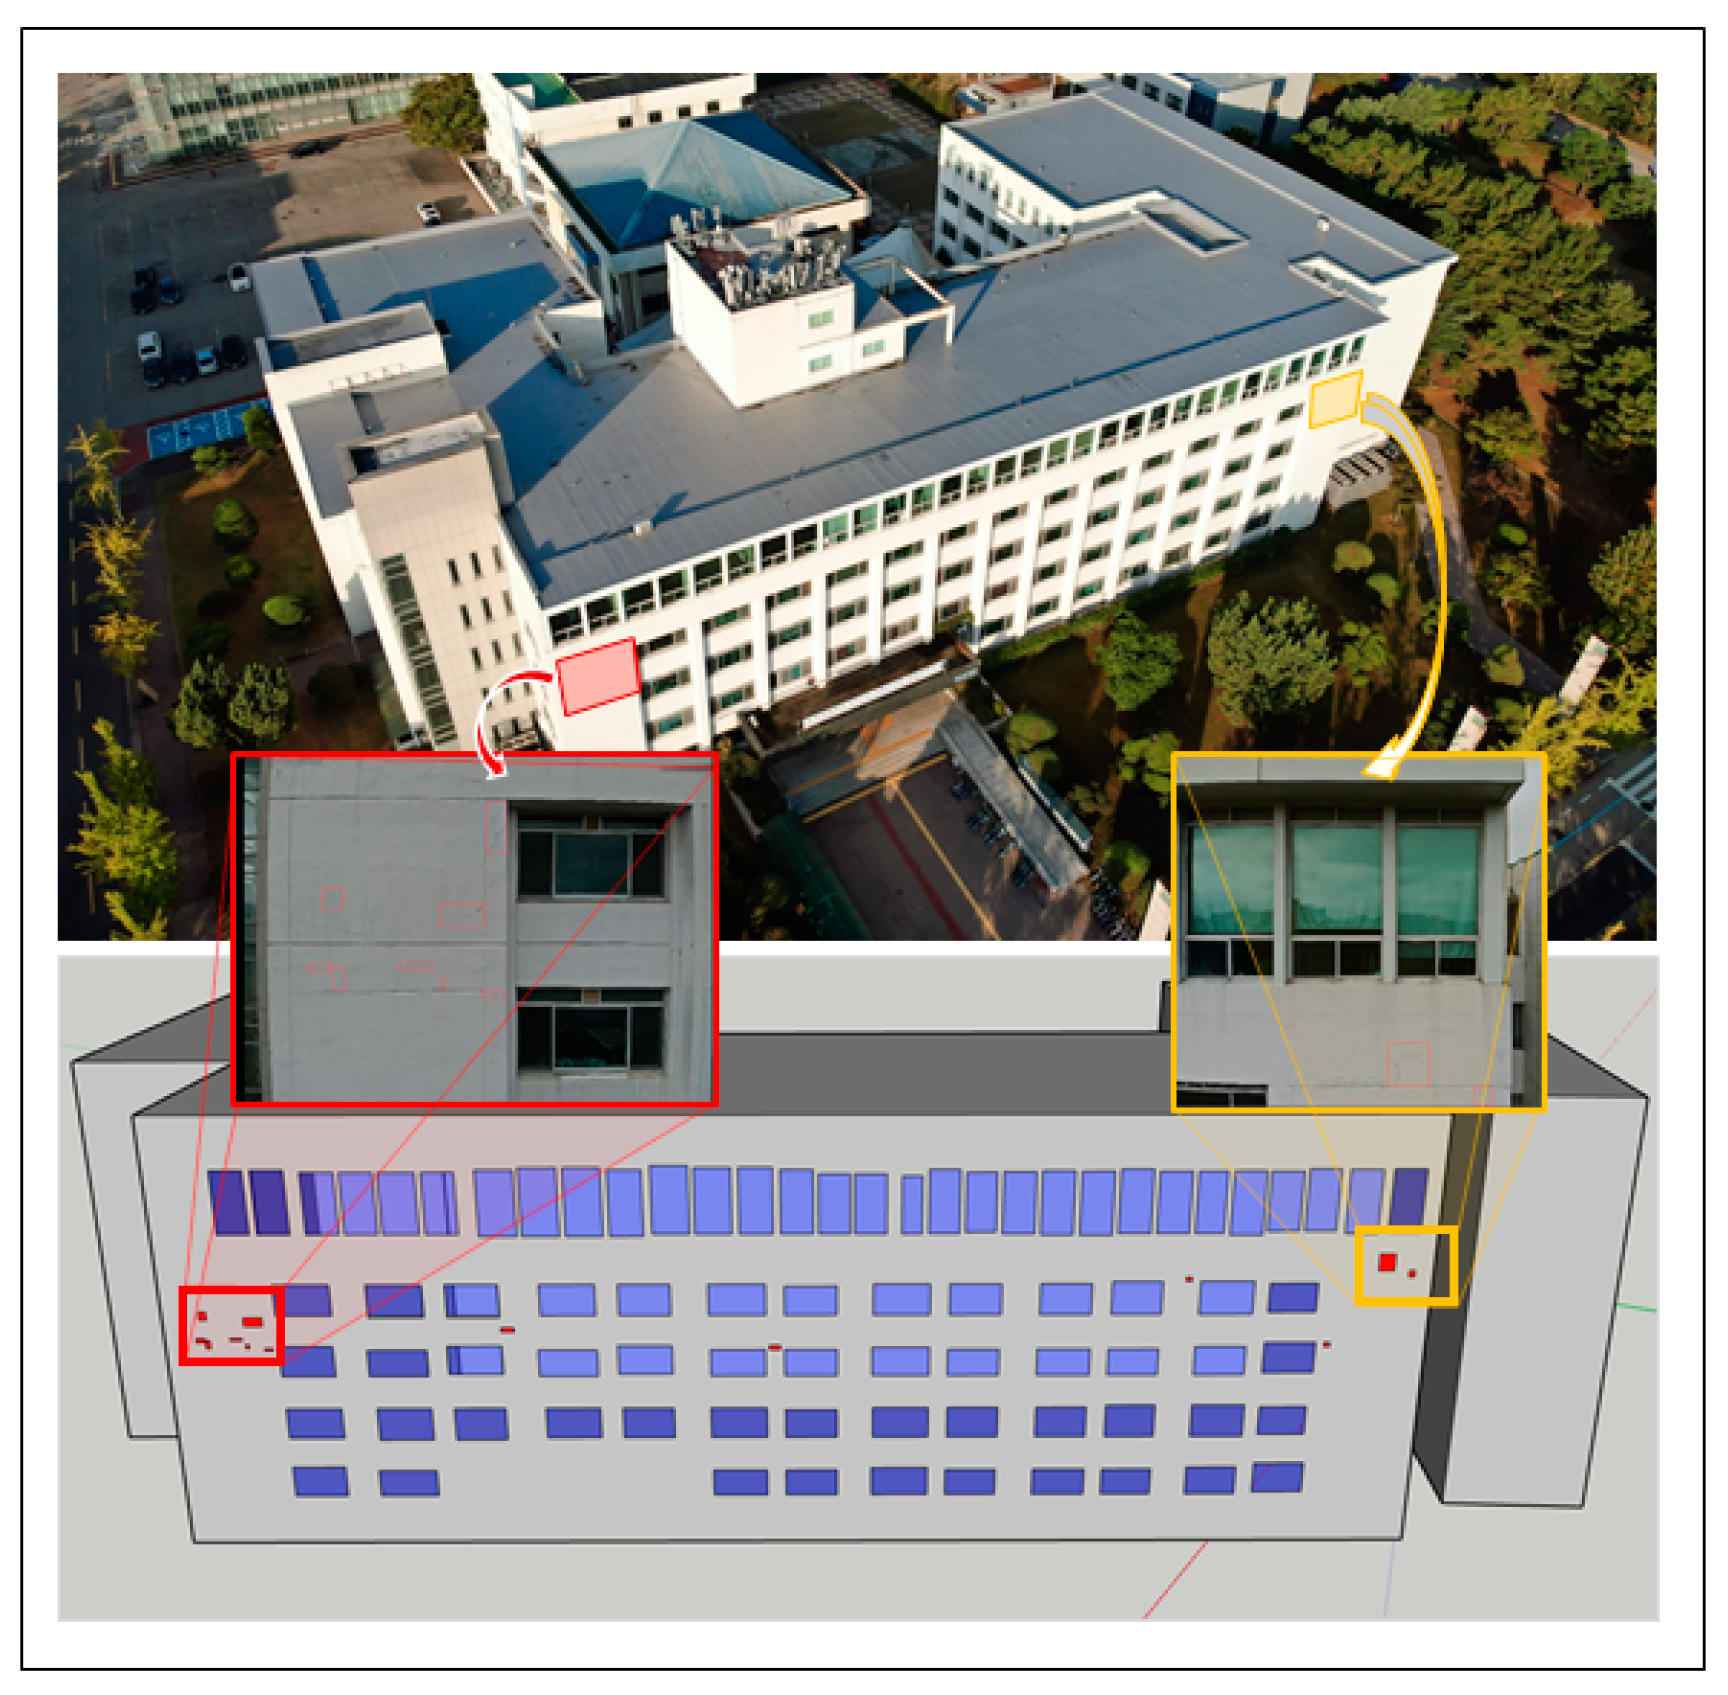
When the building’s inputted crack locations were judged according to the window locations, it was confirmed that all the inputted crack locations were the same as the locations that were visually confirmed. The generated crack locations are shown in Figure 12.
4. Discussion
It was demonstrated that the proposed method can model the target building. Even in cases where there is no building blueprint data, a UAV can be used to perform 3D modeling of high-rise buildings that are difficult to access, and similar building shapes can be modeled in a relatively short time. The positions of cracks and windows in the 3D model closely resemble those in the actual building, indicating that fault locations can be verified through the 3D model. It can be noted that this involves accurately determining and defining the shooting position and building location from the resolution of the captured images. The results of this study indicate that using the proposed method, defects can be identified, and their locations can be recorded and analyzed more quickly and efficiently during defect inspections. However, there are several limitations.
Locations that included building landscaping restricted the UAV’s access and made it difficult to acquire the entire building shape. The proposed method can generate the building’s shape if the entire shape can be acquired; however, areas that cannot be acquired owing to landscaping must be entered manually by the user. As such, additional exploration, such as additional training using images where only partial building elements are displayed to enable detection even when architectural components are partially obscured due to landscaping, should be included. Additionally, investigating methods like merging data from multispectral sensors or thermal sensors to separate and recognize necessary objects based on color is necessary to address these scenarios.
It is easy to record and confirm the locations of building defects; however, more analysis data, such as the defects’ lengths, widths, and areas, are needed to analyze the states of defects in models. For vertical and horizontal defects, the area of the box is similar to the area of the defect. However, for diagonal defects, a large box is created, and the area of the defect is depicted as very large. This can lead to errors in analyzing the areas of defects, and further research on the use of segmentation to input defect shapes into models is necessary.
In the case of crack defects, the widths of the cracks—not just the lengths—must be analyzed to evaluate building performance. However, the data provided by the model include only information on the locations and areas of defects, which makes it difficult to analyze cracks accurately. Therefore, it is necessary to develop a method that allows crack width to be measured using the extracted area.
Addressing these limitations can allow building maintenance to be conducted more effectively, reducing the risk to personnel and shortening inspection times, while allowing quantitative building performance evaluations through objective assessments.
5. Conclusions
A method was developed that automatically models buildings and records the locations of the buildings’ identified defects in the generated models. In contrast to existing inspection methods in which workers manually identify and record defects, a UAV is used to accurately analyze and record the shapes of defects in high-rise buildings. Additionally, we demonstrated through empirical evidence that a simplified representation of the building’s shape, allowing for visual recognition of the building’s form to a degree less sophisticated than the high-quality visualization proposed in previous research, can significantly reduce the generation time. This streamlined representation not only facilitates the efficient identification of defects but also enables more effective recording of their locations. In addition to recording the location, a 3D shape allows for the calculation of the maintenance area for defects occurring in the target building during the inspection phase. Moreover, it can also be utilized for the purpose of analyzing the energy performance of the building. By addressing the limitations mentioned in Section 4, a maintenance process can be developed in which damage is recorded and analyzed using building models so that high-rise buildings can be managed efficiently. Moreover, it is envisaged that ongoing refinement of the process will enable access to and utilization of diverse applications beyond the enhancement of building 3D creation. It is believed that future processes will save time and money for exterior inspections during the building maintenance phase and ensure the safety of inspectors.
Author Contributions
J.Y. developed the concept and drafted the manuscript. H.S. revised the manuscript. S.L. and K.K. supervised the overall research. All authors have read and agreed to the published version of the manuscript.
Funding
This work was supported by a Korea Agency for Infrastructure Technology Advancement (KAIA) grant funded by the Ministry of Land, Infrastructure, and Transport (Grant RS-2022-00141900).
Data Availability Statement
The data presented in this study are available on request from the corresponding author. The data are not publicly available due to privacy.
Conflicts of Interest
The authors declare no conflict of interest.
References
- Chen, A.; Reichard, G.; Xu, X.; Akanmu, A. Automated crack segmentation in close-range building façade inspection images using deep learning techniques. J. Build. Eng. 2021, 43, 102913. [Google Scholar] [CrossRef]
- Wu, X.; Liu, X. Building crack identification and total quality management method based on deep learning. Patt. Recognit. Lett. 2021, 145, 225–231. [Google Scholar] [CrossRef]
- Zheng, M.; Lei, Z.; Zhang, K. Intelligent detection of building cracks based on deep learning. Image Vis. Comput. 2020, 103, 103987. [Google Scholar] [CrossRef]
- Doshi, S.; Patel, D.B.; Patel, K.B.; Patel, K.B.; Mavani, P.D. Methodology for prevention and repair of cracks in building. GRD J. Eng. 2018, 3, 52–57. [Google Scholar]
- Choi, S.-s.; Kim, E.K. Building Crack Inspection Using Small UAV. In Proceedings of the 2015 17th International Conference on Advanced Communication Technology (ICACT), PyeongChang, Rupblic of Korea, 1–3 July 2015; pp. 235–238. [Google Scholar]
- Perry, B.J.; Guo, Y.; Atadero, R.; van de Lindt, J.W. Streamlined bridge inspection system utilizing unmanned aerial vehicles (UAVs) and machine learning. Measurement 2020, 164, 108048. [Google Scholar] [CrossRef]
- Hubbard, B.; Hubbard, S. Unmanned aircraft systems (UAS) for bridge inspection safety. Drones 2020, 4, 40. [Google Scholar] [CrossRef]
- Mohammad, F.; AlZoubi, A.; Du, H.; Jassim, S. Automatic Glass Crack Recognition for High Building Façade Inspection. In Proceedings of the SPIE 11399, Mobile Multimedia/Image Processing, Security, and Applications 2020, Online, 27 April–9 May 2020; p. 113990W. [Google Scholar]
- Kim, I.-H.; Jeon, H.; Baek, S.-C.; Hong, W.-H.; Jung, H.-J. Application of crack identification techniques for an aging concrete bridge inspection using an unmanned aerial vehicle. Sensors 2018, 18, 1881. [Google Scholar] [CrossRef]
- Cavalagli, N.; Gioffrè, M.; Grassi, S.; Gusella, V.; Pepi, C.; Volpi, G.M. On the accuracy of UAV photogrammetric survey for the evaluation of historic masonry structural damages. Procedia Struct. Integr. 2020, 29, 165–174. [Google Scholar] [CrossRef]
- Ioli, F.; Pinto, A.; Pinto, L. UAV photogrammetry for metric evaluation of concrete bridge cracks. Int. Arch. Photogramm. Remote Sens. Spatial Inf. Sci. 2022, XLIII-B2-2022, 1025–1032. [Google Scholar] [CrossRef]
- Bae, J.; Lee, J.; Jang, A.; Ju, Y.K.; Park, M.J. SMART SKY EYE system for preliminary structural safety assessment of buildings using unmanned aerial vehicles. Sensors 2022, 22, 2762. [Google Scholar] [CrossRef]
- Wang, F.; Zou, Y.; Castillo, E.d.R.; Ding, Y.; Xu, Z.; Zhao, H.; Lim, J.B.P. Automated UAV path-planning for high-quality photogrammetric 3D bridge reconstruction. Struct. Infrastruct. Eng. 2022, 1–20. [Google Scholar] [CrossRef]
- Park, Y.; Guldmann, J.-M. Creating 3D city models with building footprints and LIDAR point cloud classification: A machine learning approach. Comput. Environ. Urban Syst. 2019, 75, 76–89. [Google Scholar] [CrossRef]
- Zhao, Q.; Zhou, L.; Lv, G. A 3D modeling method for buildings based on LiDAR point cloud and DLG. Comput. Environ. Urban Syst. 2023, 102, 101974. [Google Scholar] [CrossRef]
- Liu, W.; Zang, Y.; Xiong, Z.; Bian, X.; Wen, C.; Lu, X.; Wang, C.; Marcato, J.; Gonçalves, W.N.; Li, J. 3D building model generation from MLS point cloud and 3D mesh using multi-source data fusion. Int. J. Appl. Earth Obs. Geoinformation 2023, 116, 103171. [Google Scholar] [CrossRef]
- Fang, F.; Li, L.; Gu, Y.; Zhu, H.; Lim, J.-H. A novel hybrid approach for crack detection. Pattern Recognit. 2020, 107, 107474. [Google Scholar] [CrossRef]
- Pan, Y.; Zhang, G.; Zhang, L. A spatial-channel hierarchical deep learning network for pixel-level automated crack detection. Autom. Constr. 2020, 119, 103357. [Google Scholar] [CrossRef]
- Ni, F.; Zhang, J.; Chen, Z. Zernike-moment measurement of thin-crack width in images enabled by dual-scale deep learning. Comput.-Aided. Civ. Inf. 2019, 34, 367–384. [Google Scholar] [CrossRef]
- Yoon, J.; Shin, H.; Song, M.; Gil, H.; Lee, S. A crack width measurement method of UAV images using high-resolution algorithms. Sustainability 2023, 15, 478. [Google Scholar] [CrossRef]
- Kumar, M.; Singh, R.B.; Singh, A.; Pravesh, R.; Majid, S.I.; Tiwari, A. Referencing and coordinate systems in GIS. In Geographic Information Systems in Urban Planning and Management; Springer: Singapore, 2023. [Google Scholar]
- Albawi, S.; Mohammed, T.A.; Al-Zawi, S. Understanding of a Convolutional Neural Network. In Proceedings of the 2017 International Conference on Engineering and Technology (ICET), Antalya, Turkey, 21–23 August 2017; pp. 1–6. [Google Scholar]
- Deng, L.; Bi, L.; Li, H.; Chen, H.; Duan, X.; Lou, H.; Zhang, H.; Bi, J.; Liu, H. Lightweight aerial image object detection algorithm based on improved YOLOv5s. Sci. Rep. 2023, 13, 7817. [Google Scholar] [CrossRef]
- Li, Z.; Pang, C.; Dong, C.; Zeng, X. R-YOLOv5: A lightweight rotational object detection algorithm for real-time detection of vehicles in dense scenes. IEEE Access 2023, 11, 61546–61559. [Google Scholar] [CrossRef]
- Zhu, X.; Lyu, S.; Wang, X.; Zhao, Q. TPH-YOLOv5: Improved YOLOv5 based on transformer prediction head for object detection on drone-captured scenarios. In Proceedings of the 2021 IEEE/CVF International Conference on Computer Vision Workshops (ICCVW), Montreal, BC, Canada, 11–17 October 2021; pp. 2778–2788. [Google Scholar]
- Hosang, J.; Benenson, R.; Schiele, B. Learning Non-maximum Suppression. In Proceedings of the 2017 IEEE Conference on Computer Vision and Pattern Recognition (CVPR), Honolulu, HI, USA, 21–26 July 2017; pp. 6469–6477. [Google Scholar]
- Ultralytics, G. YOLOv5 in PyTorch. 2022. Available online: https://github.com/ultralytics/yolov5 (accessed on 15 December 2023).
- Baskar, A.; Xavior, M.A. A facility location model for marine applications. Mater. Today Proc. 2021, 46, 8143–8147. [Google Scholar] [CrossRef]
- Veness, C. Calculate Distance and Bearing between Two Latitude/Longitude Points Using Haversine Formula in Javascript. Movable Type Scripts. 2011. Available online: https://www.movable-type.co.uk/scripts/latlong.html (accessed on 15 December 2023).
Figure 1.
Method for UAV-based automatic 3D modeling of a building.

Figure 2.
Object recognition based on YOLO.

Figure 3.
YOLOv5 model.

Figure 4.
Object GCP acquisition algorithm.

Figure 5.
Vector-correction algorithm.

Figure 6.
Building photograph.

Figure 7.
Flight mission.

Figure 8.
YOLOv5 model performance.

Figure 9.
Image resolution coordinates and the building outline in the GCP.

Figure 10.
Vector coordinates (building, windows, cracks).

Figure 11.
Automatic 3D modeling.

Figure 12.
Defect locations.


Table 1.
Comparison of actual and model sizes for buildings and windows.
| Object | Real Data (m) | Modeling Result (m) | Deviation (%) |
|---|---|---|---|
| Building | 80.0 × 45.0 × 21.0 | 79.5 × 45.3 × 21.3 | 1.47 |
| Window 1 | 3.10 × 1.68 | 2.66 × 1.54 | 21.3 |
| Window 2 | 1.55 × 3.70 | 1.62 × 3.30 | 7.3 |
Disclaimer/Publisher’s Note: The statements, opinions and data contained in all publications are solely those of the individual author(s) and contributor(s) and not of MDPI and/or the editor(s). MDPI and/or the editor(s) disclaim responsibility for any injury to people or property resulting from any ideas, methods, instructions or products referred to in the content. |
© 2023 by the authors. Licensee MDPI, Basel, Switzerland. This article is an open access article distributed under the terms and conditions of the Creative Commons Attribution (CC BY) license (https://creativecommons.org/licenses/by/4.0/).
Share and Cite
MDPI and ACS Style
Yoon, J.; Shin, H.; Kim, K.; Lee, S. CNN- and UAV-Based Automatic 3D Modeling Methods for Building Exterior Inspection. Buildings 2024, 14, 5. https://doi.org/10.3390/buildings14010005
AMA Style
Yoon J, Shin H, Kim K, Lee S. CNN- and UAV-Based Automatic 3D Modeling Methods for Building Exterior Inspection. Buildings. 2024; 14(1):5. https://doi.org/10.3390/buildings14010005
Chicago/Turabian StyleYoon, Jonghyeon, Hyunkyu Shin, Kyonghoon Kim, and Sanghyo Lee. 2024. "CNN- and UAV-Based Automatic 3D Modeling Methods for Building Exterior Inspection" Buildings 14, no. 1: 5. https://doi.org/10.3390/buildings14010005
Note that from the first issue of 2016, this journal uses article numbers instead of page numbers. See further details here.