
Experimental and Numerical Study on the Shear Performance of the Stone Panel–Panel Joint in Stone Cladding

1
College of Civil Engineering, Huaqiao University, Xiamen 361021, China
2
Key Laboratory for Structural Engineering and Disaster Prevention of Fujian Province, Huaqiao University, Xiamen 361021, China
*
Author to whom correspondence should be addressed.
Buildings 2023, 13(12), 3079; https://doi.org/10.3390/buildings13123079
Submission received: 29 October 2023
/
Revised: 1 December 2023
/
Accepted: 8 December 2023
/
Published: 11 December 2023
(This article belongs to the Special Issue Research on Reinforced Concrete Buildings Structural Analysis and Durability Assessment)
Abstract
:The evaluation of the shear performance of stone panel–panel joints (SPPJs) in stone cladding has important engineering significance, as it plays a crucial role in stone cladding failure. The purpose of this paper is to analyze and predict the influence of the dimension and the Young’s modulus of sealant on the shear performance of SPPJs. Based on monotonic and cyclic loading tests, the effects of Young’s modulus and the dimension of sealant on the failure characteristics, stress–strain characteristics, stiffness degradation, and energy dissipation capacity of an SPPJs were investigated. According to finite element analysis, the strain distribution of an SPPJ under monotonic loading was analyzed for different sealant widths and number of sealant layers. The results indicate that the failure modes of SPPJs change with the variation of sealant amount. As the Young’s modulus of the sealant increases, the shear failure strength and shear yield strain of SPPJs increase. The increase in sealant thickness reduces the shear failure strength and stiffness of SPPJs. Based on the same shear strain, the increase in the sealant thickness enhances the cumulative energy consumption of SPPJs. The strain concentration zone of the specimens with two sealant layers in unilateral SPPJs becomes larger with the increase in sealant width.
1. Introduction
Silicone sealant is often adopted as a sealing material for the stone panel-panel joint (SPPJ) of the stone cladding due to its excellent waterproofness, sealing performance, and deformation resistance. However, under strong winds or earthquakes, the SPPJs often encounter tearing failure after undergoing reciprocating deformation, which is caused by shear force [1,2]. The neglect of the shear performance of SPPJs will seriously threaten the safety of the stone cladding [3]. Through investigation, it is found that in the construction field, there are numerous cases of damage to the steel keel of stone cladding due to shear failure of the sealant joint, resulting in maintenance costs ranging from 65 billion dollars to 80 billion dollars [4,5]. The consequences of the failure of SPPJs under shear force have made many scholars realize the importance of the shear performance of the SPPJ. Therefore, it is of great practical significance to comprehensively and accurately evaluate the shear performance of the SPPJ in the stone cladding.
At present, there has some research on the shear strength of the sealant joint [6]. The results show that the sealant can effectively improve the ultimate bearing capacity of the specimen. Chataigner et al. [7] conducted shear tests on shear specimens which were made of two different sealants and carbon plates. Based on monotonic and cyclic loading tests, DalLago et al. [8,9] and Negro [10] investigated the mechanical properties of concrete joints filled with the sealant. The results indicated that the shear performance of concrete joints was closely related to their strain rate. Nemati et al. [11] analyzed the effect of the amount and type of sealant on the shear strength of timber–concrete joints and proposed that different amounts of sealant would change the shear strength of timber–concrete joints. Based on single lap joint tests, Giannis and Adams [12] studied the effects of four different sealant thicknesses and two types of adherend on the shear performance of specimens. Based on finite element analysis, Gupta [13] proposed that the strain distribution of adhesively bonded structure is mainly influenced by the thickness of the adhesive layer [14]. The previous research indicated that the shear strength of adhesive joints was related to the mechanical properties of the sealant and adherend.
Due to the influence of installation environment and on-site environment [15], adhesion failure often occurs during the practical application of sealants. Therefore, in-depth research on the shear performance of SPPJs is beneficial for better controlling the quality of claddings [16]. Hagl [17] and Staudt et al. [18] studied the failure mode of silicone sealant and found that it is mainly caused by cohesive failure. The shaking table test of glass curtain walls conducted by Broker et al. [19], the explosion–proof test conducted by Clif et al. [20], and the in-plane shear test completed by Wallau and Recknagel [21] all indicate that the silicone sealant at the sealant joint plays an important role in coordinating the deformation of adjacent panels in the curtain wall system. The in-depth study of the shear performance of SPPJs provides a new direction for improving the performance of the stone cladding.
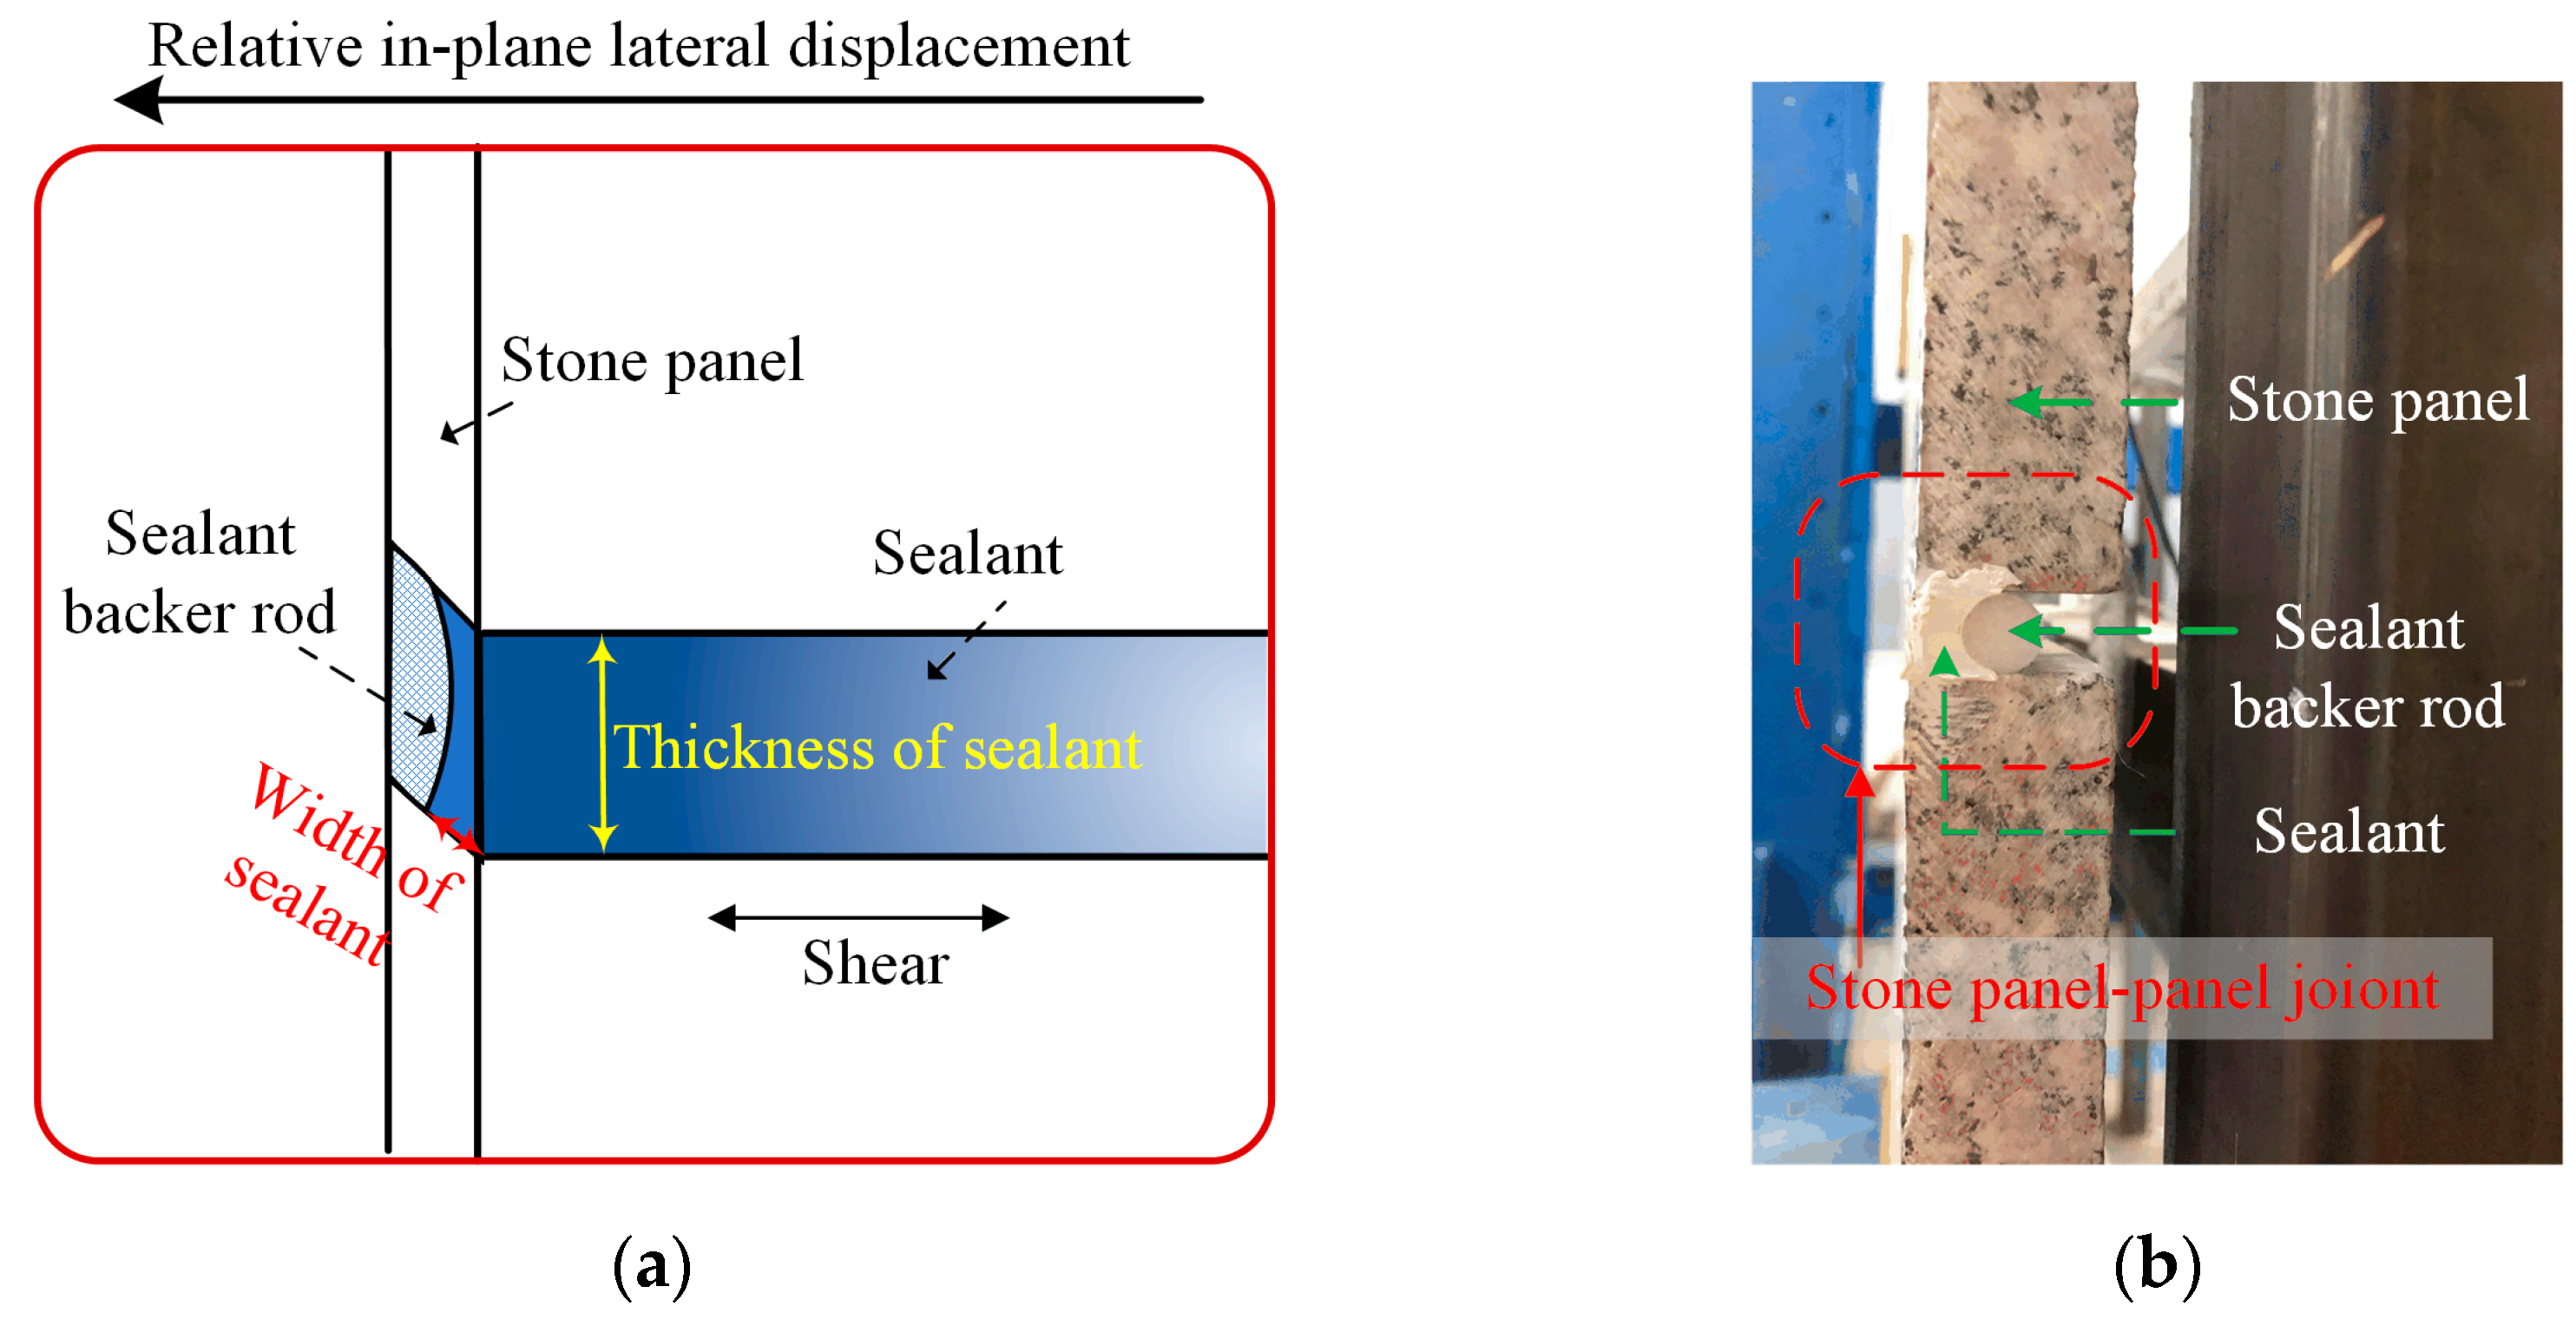
However, for the stone cladding system, there is no comprehensive analysis of the shear performance of SPPJs [22,23], which reflects a lack of attention to the research on the shear of SPPJs in the stone cladding. The purpose of this paper is to analyze and predict the influence of the dimension and the Young’s modulus of the sealant on the shear performance of the SPPJ. Based on monotonic and cyclic loading tests, the shear performance of double–shear specimens with the SPPJ, which is made of three stone panels and the sealant, is investigated. The influence of the Young’s modulus, width, and thickness of the sealant on the failure characteristics and stress–strain characteristics of the SPPJ is analyzed. Furthermore, the difference in shear performance of SPPJs under different loading methods was investigated. By analyzing the stiffness variation curve and the cumulative energy consumption curve, the influence of sealant thickness on the energy consumption and stiffness degradation of the specimen is discussed. In order to investigate the numerical modeling strategy for predicting the shear performance of the SPPJ in the stone cladding, the finite element models of double–shear specimens with SPPJs are established by using ABAQUS. The correctness of the established finite element models is verified based on experimental results, and the strain distributions of SPPJs filled with different sealant widths under monotonic loading are analyzed. In addition, the influence of the number of sealant layers in the unilateral SPPJ on the strain of the SPPJ was investigated. Figure 1 shows a typical SPPJ of the stone cladding.
The research results and finite element model of this paper can provide a comprehensive reference for the evaluation and prediction of the shear performance of the SPPJ of the stone cladding. This study has important guiding significance for practical applications and provides a theoretical basis for the engineering design and construction of stone claddings.
2. Experiment Program
2.1. Specimen Information
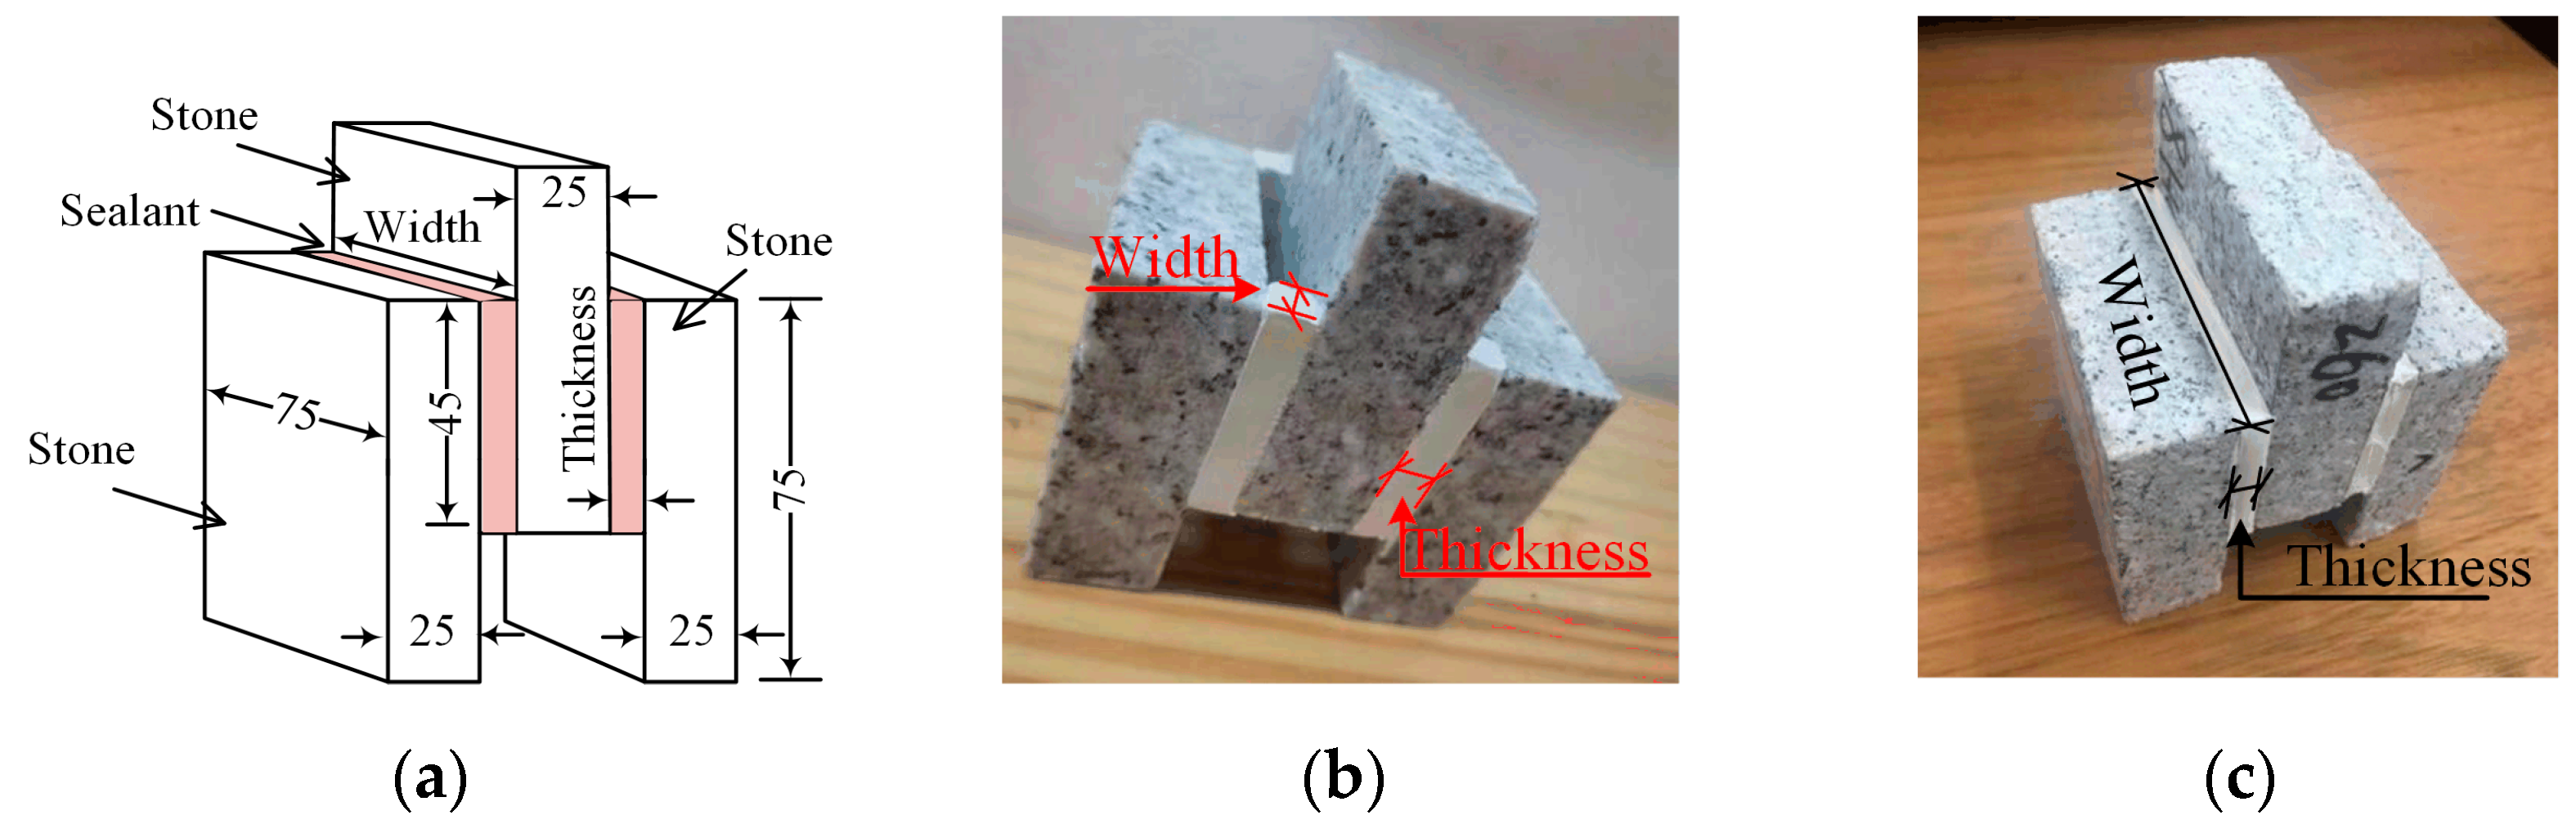
In this paper, the double-shear specimens with sealant were made according to the JC/T 989–2016 [24], which are shown in Figure 2a. In all specimens, the dimension of the stone panel was considered to be 75 mm × 75 mm × 25 mm. The granite (No. G636), which was produced from China, was adopted as the material of the stone panels. Based on material performance tests, the compressive strength, splitting strength, and elastic initial Young’s modulus of the granite used in this paper were measured to be 118.3 MPa, 9.0 MPa, and 45 GPa, respectively. In order to investigate the influence of the Young’s modulus of sealant filled between stone panels and the dimension of the sealant layer on the shear performance of the SPPJ in the stone cladding, 12 groups of specimens with different parameters were designed and manufactured. Two types of specialized silicone sealants with initial Young’s moduli of 0.500 MPa and 1.079 MPa were selected for connecting stone panels. The thicknesses of the sealant layers were considered to be 6 mm, 8 mm, and 10 mm. Based on the dimension of the specimen, the widths of the sealant layers were set to 10 mm and 75 mm. In addition, the lengths of the sealant layers of all specimens were considered to be 45 mm. In order to reduce random errors during the experimental process, 4 specimens were made for each parameter group, totaling 48 specimens. Figure 2b,c show specimens with sealant layer widths of 10 mm and 75 mm, respectively. Table 1 shows the parameter information of the specimens. For the naming of the specimen, SA (Sealant A) represented that the Young’s modulus of the sealant was 0.5 MPa, SB (Sealant B) represented that the Young’s modulus of the sealant was 1.079 MPa, T represented that there were two sealant layers in the SPPJ on each side of the specimen, O represented that there was one sealant layer in the SPPJ on each side of the specimen, and the two numbers in the specimen code represent the thickness and width of the sealant separately. For example, SA-6-10-T represents that the SPPJ on each side of the specimen contains two sealant layers with the Young’s modulus of 0.5 MPa, and the thickness and width of each sealant layer are 6 mm and 10 mm, respectively.
2.2. Test Setup, Instrumentation, and Loading Protocol
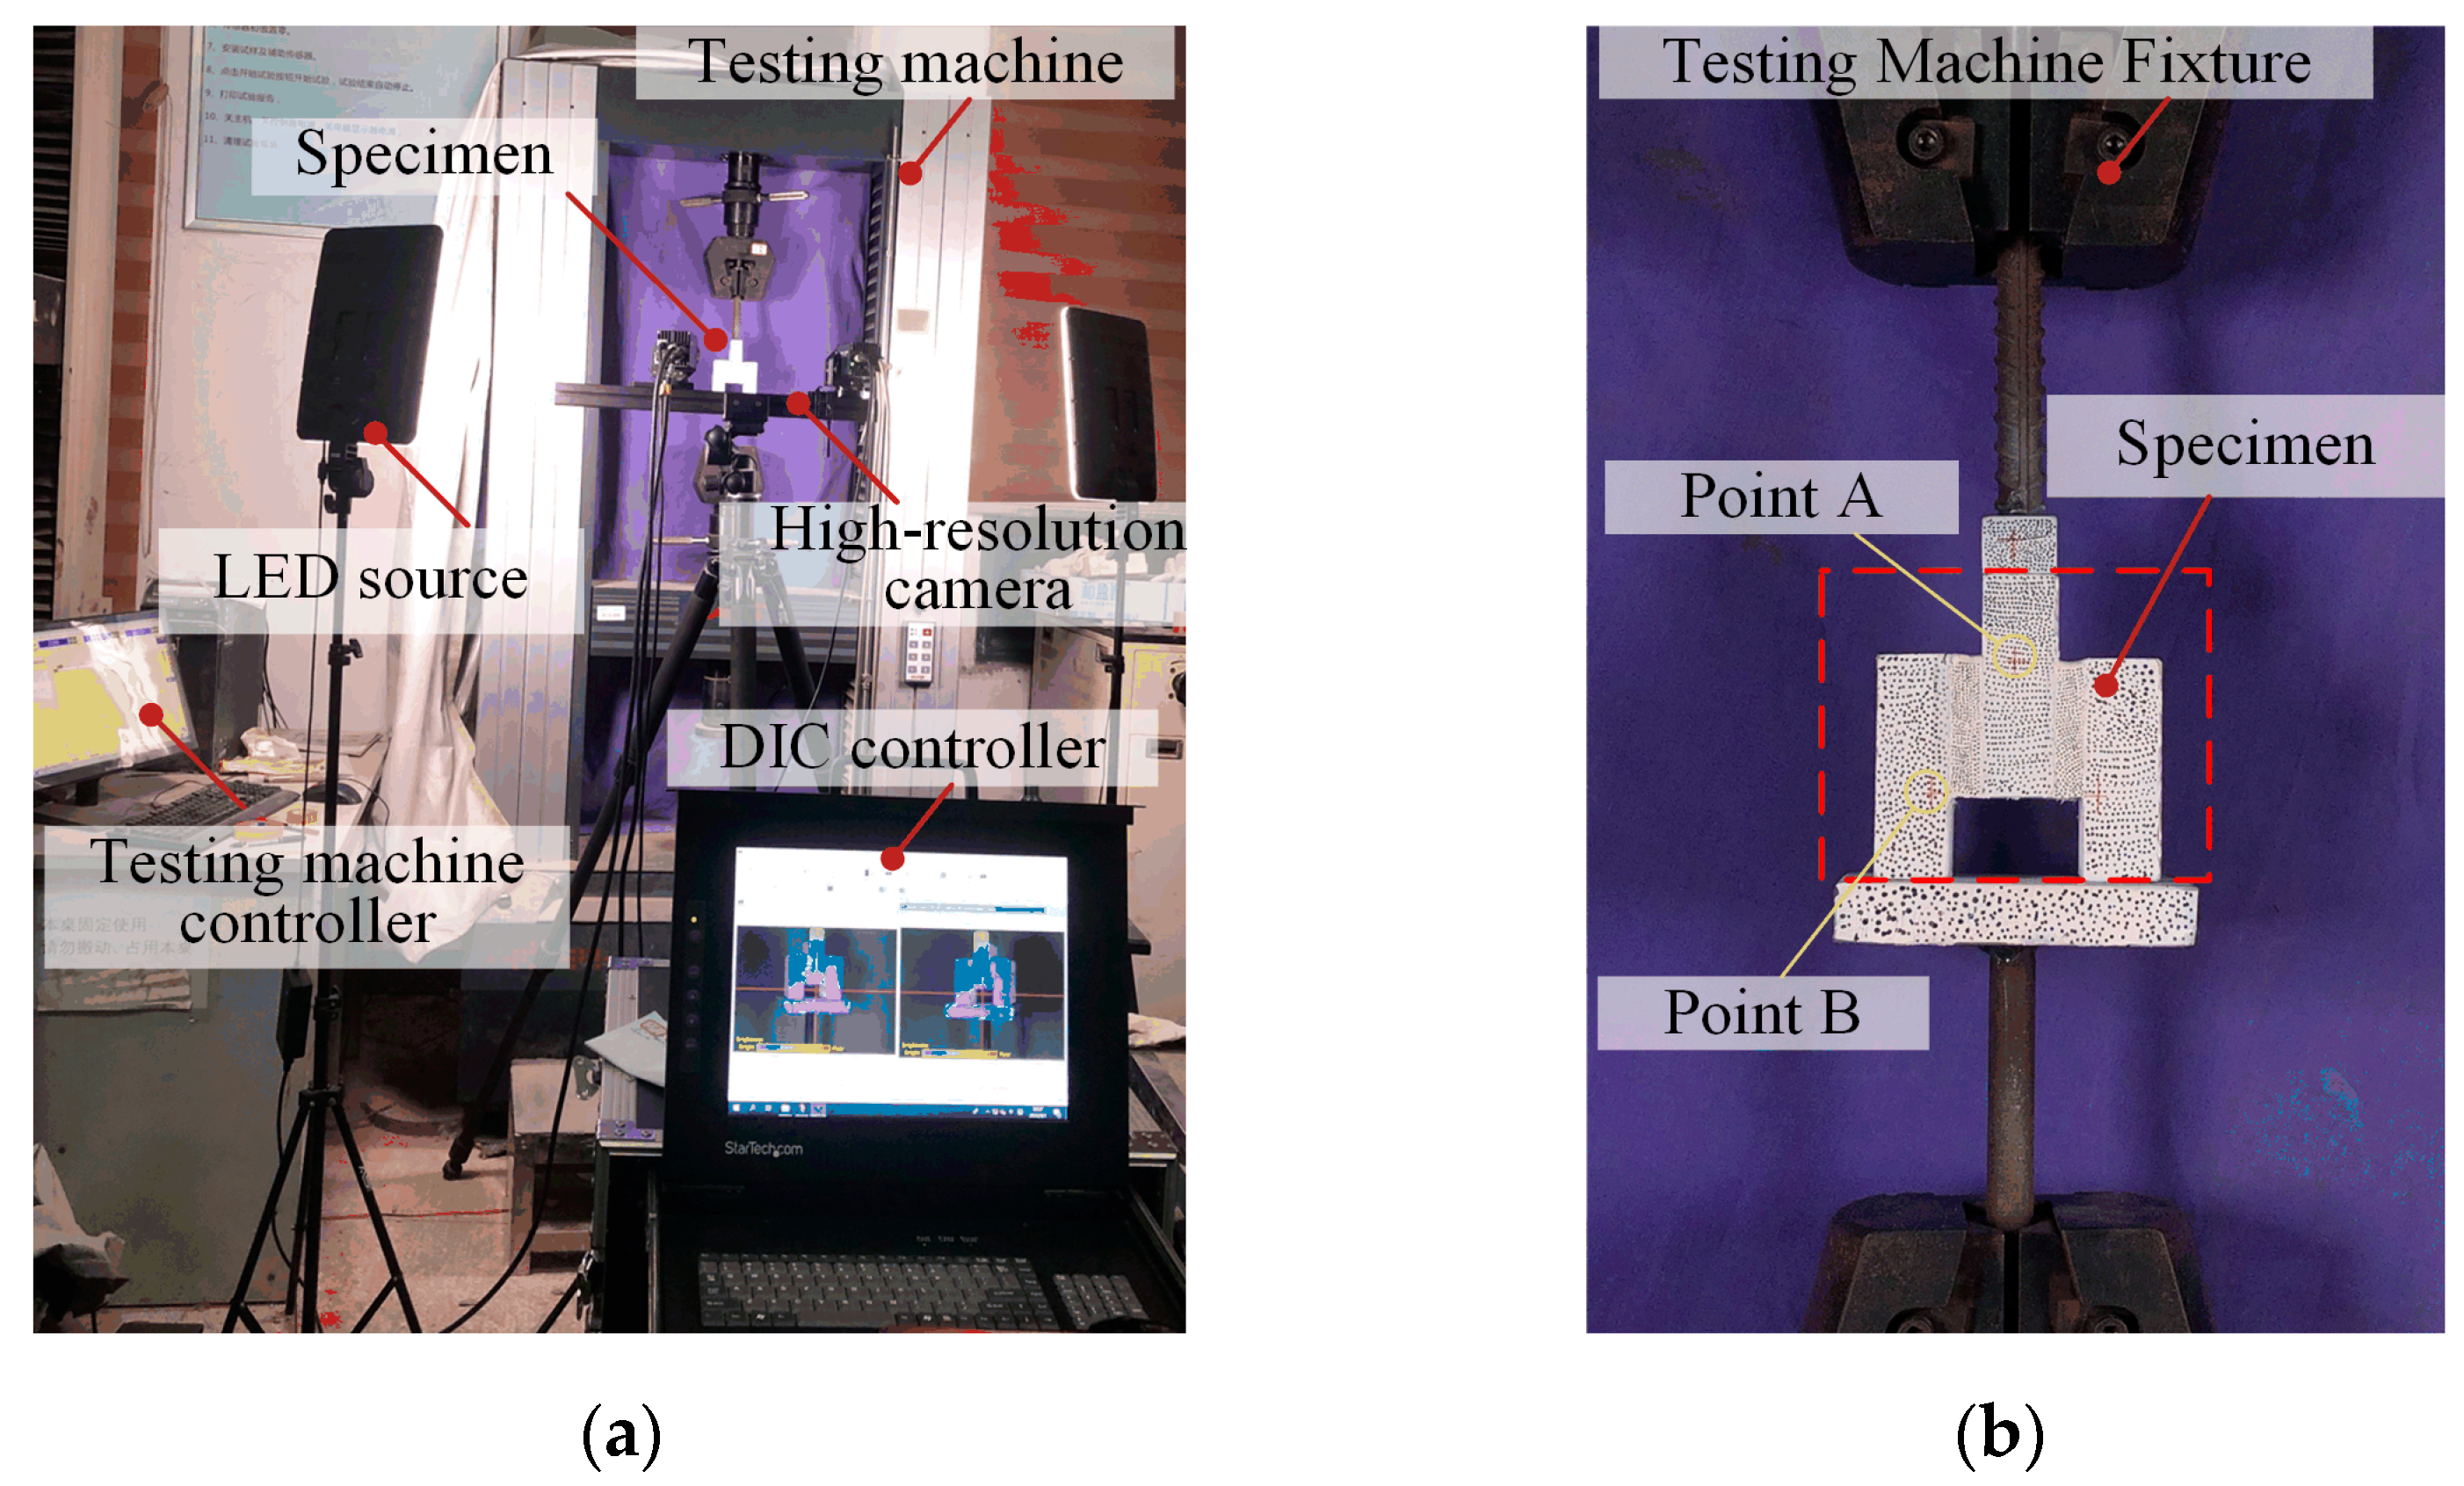
In this paper, the specimen was fixed on a universal testing machine for shear test. However, during the loading process, there was inevitably a slip phenomenon between the fixture and the specimen. Therefore, in order to eliminate the interference of this phenomenon on the test results, the digital image correlation (DIC) technology was used to measure the test results. The DIC measurement system included a high-resolution camera, an LED source, a DIC controller, and the professional post-processing software [25]. Figure 3 shows the equipment used in the experiment. This system could accurately measure the deformation of the sealant layer by tracking the position changes of discrete points. Before the experiment, in order to improve image contrast, the front of the specimen was painted white and its surface was covered with black spots. At the same time, points A and B were marked on the front of the specimen, as shown in Figure 3b. During the experiment, a set of images that reflected the deformation process of the sealant layer was obtained at a frequency of 1 Hz, and the vertical displacement changes between points A and B in the specimen were calculated by post-processing software. The change in distance between marked points A and B was defined as the shear displacement value of the sealant layer.
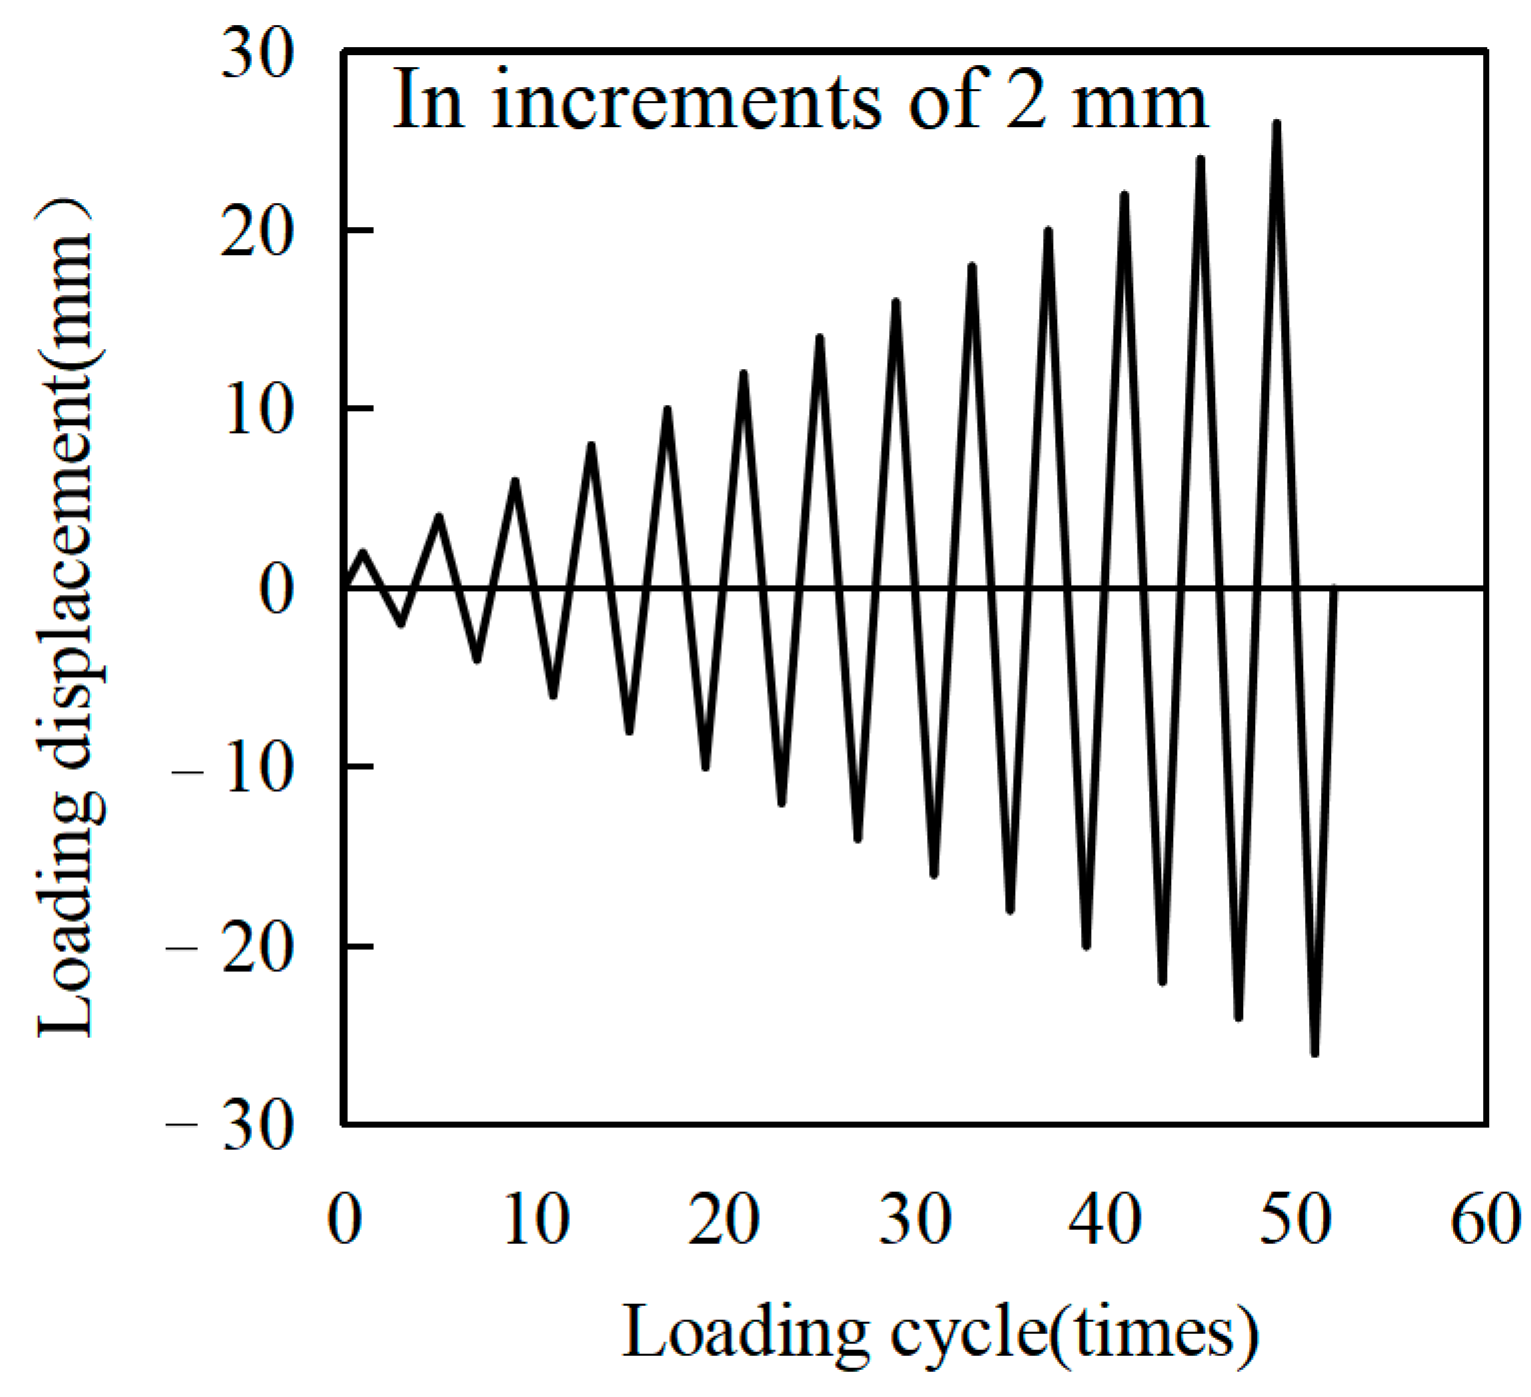
In order to investigate the influence of loading methods on the strength, deformation capacity, and failure mode of specimens, monotonic and cyclic loading tests were conducted on 12 groups of double-shear specimens with SPPJs. The displacement control was used as the loading system for monotonic loading tests, and the loading rate was set to 5 mm/min in accordance with the requirements of GB/T 12830–2008 [26]. When the loading displacement reached 28 mm, the test was terminated and the load was removed. For the cyclic loading experiment, displacement control was still applied for testing, and the tensile direction of the specimen was considered as positive. The displacement increment was set to 2 mm. After the positive loading displacement reached the set value for each level, negative loading was carried out. Each level of displacement was cycled once. When the loading displacement reached 28 mm, the test was stopped. Figure 4 shows the loading method of the cyclic loading test. The experimental data were taken as the average of the data results at each loading level. All mechanical tests were performed at ambient laboratory conditions of 23 ± 2 °C and 55 ± 5% RH.
3. Experimental Results and Discussion
3.1. Failure Mode
According to the experimental results, the deformation characteristics and failure process of the specimens corresponding to silicone sealants with different Young’s moduli were basically consistent. Based on ASTM D907 [27], the failure mode of SPPJs after testing was visually evaluated and classified [28]. The failure mode of the SPPJ in the specimens was mainly influenced by the sealant layer width. When the width of the sealant was 10 mm, the main form of failure of the SPPJ in the specimen was cohesive failure, which meant the failure occurred in the sealant itself. However, for specimens with the sealant width of 75 mm, the primary failure mode of the SPPJ was a mixed failure of both adhesive and cohesive failures, which appear at the sealant–stone interface and in the sealant itself.
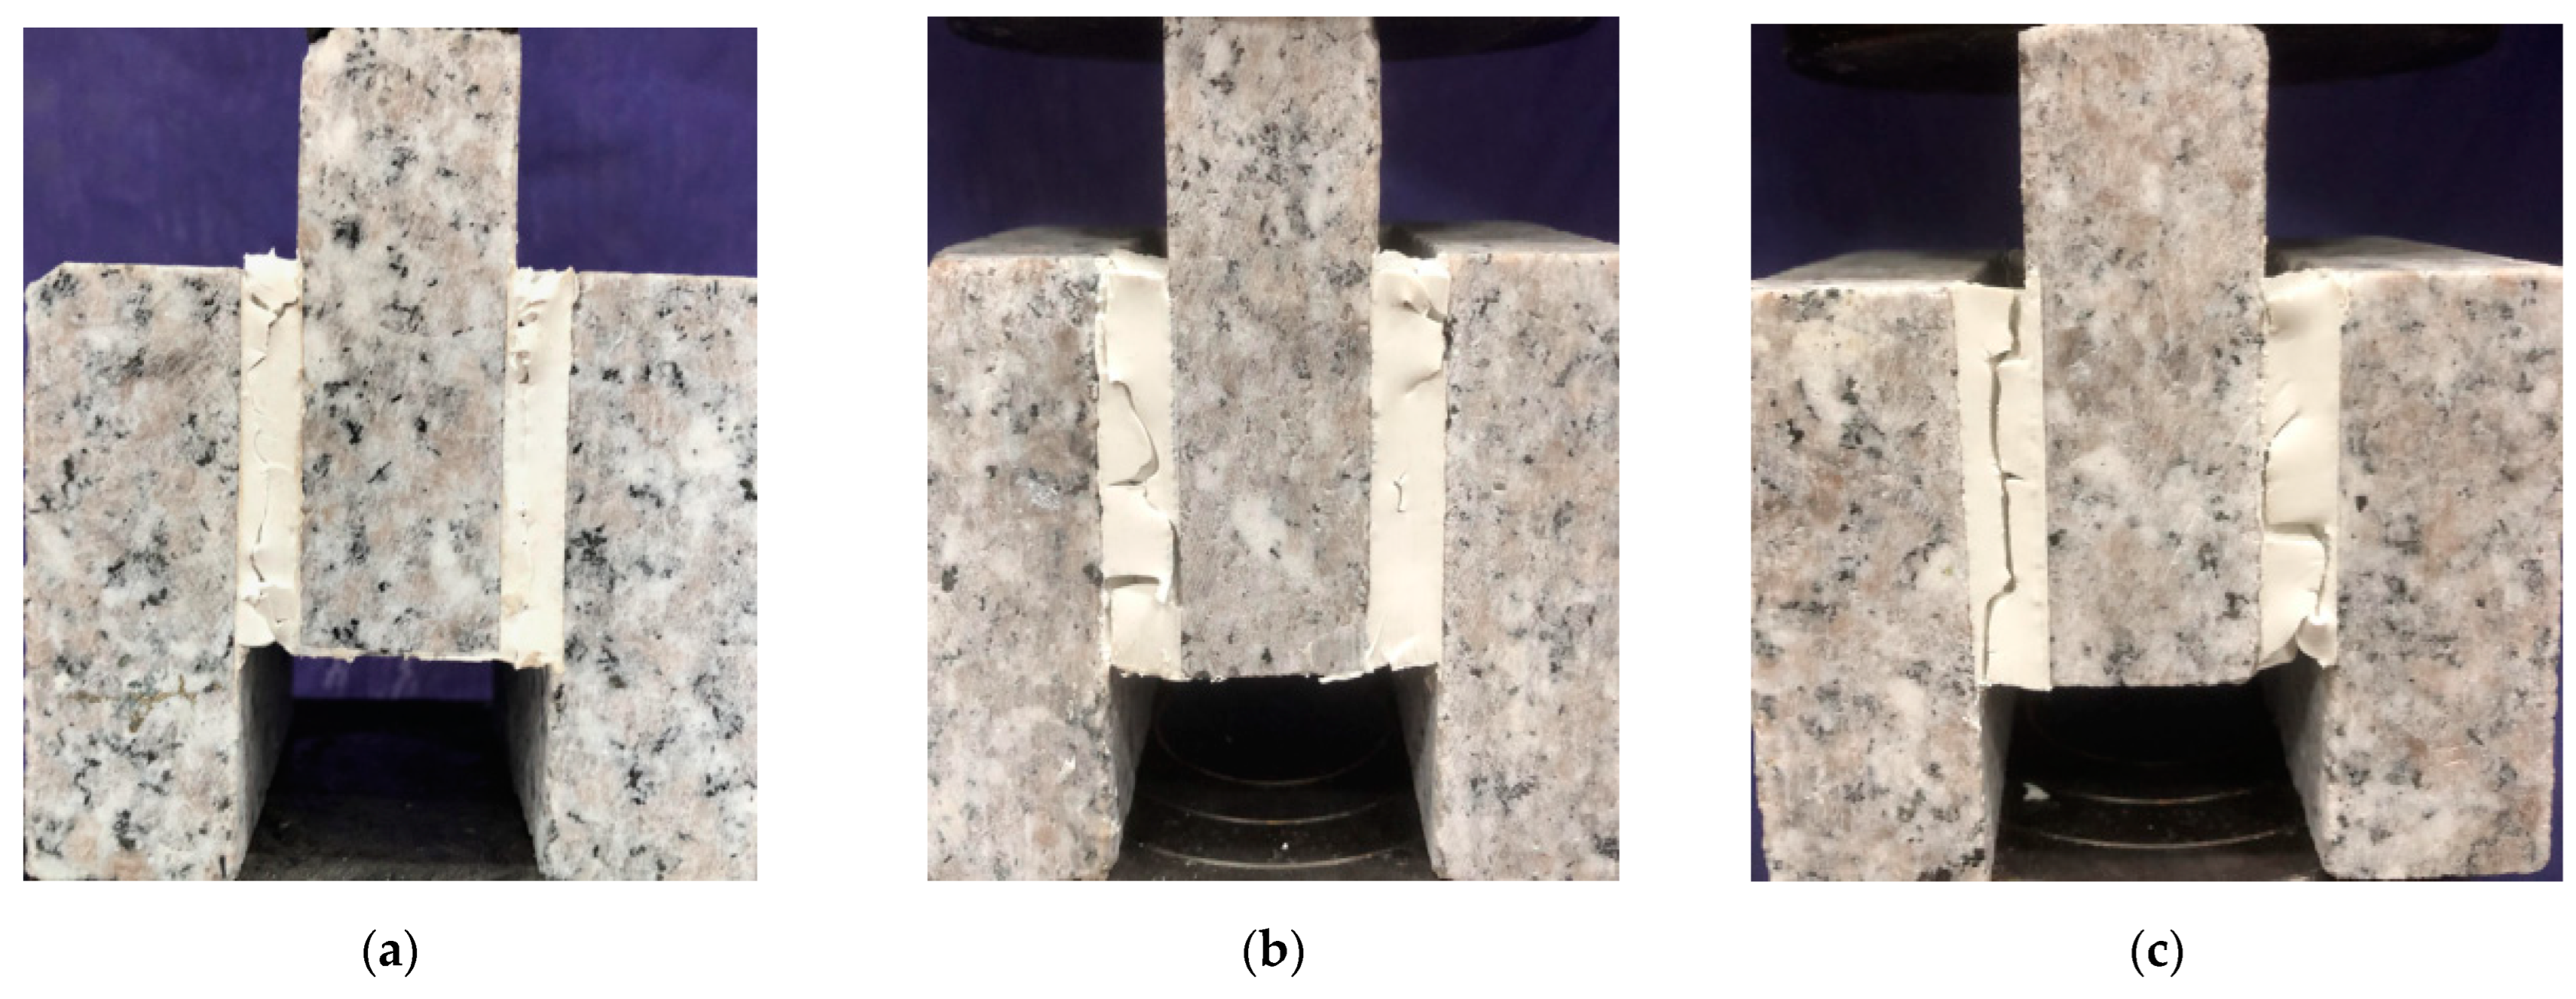
In order to present the cohesive failure of the sealant more clearly, the back of the specimen without black spots was selected for display. Figure 5 shows the final failure of specimens with the sealant layer width of 10 mm and the sealant Young’s modulus of 1.079 MPa under different sealant thicknesses. During the experiment, it was found that the failure phenomenon of SPPJs with different sealant layer thicknesses began with small cracks appearing at both ends of the sealant. As the load increased, the size and number of cracks also increased, and ultimately the cracks penetrated and converged together, which led to shear failure of the sealant. In addition, the damage path of the sealant mainly extended from the end to the middle.
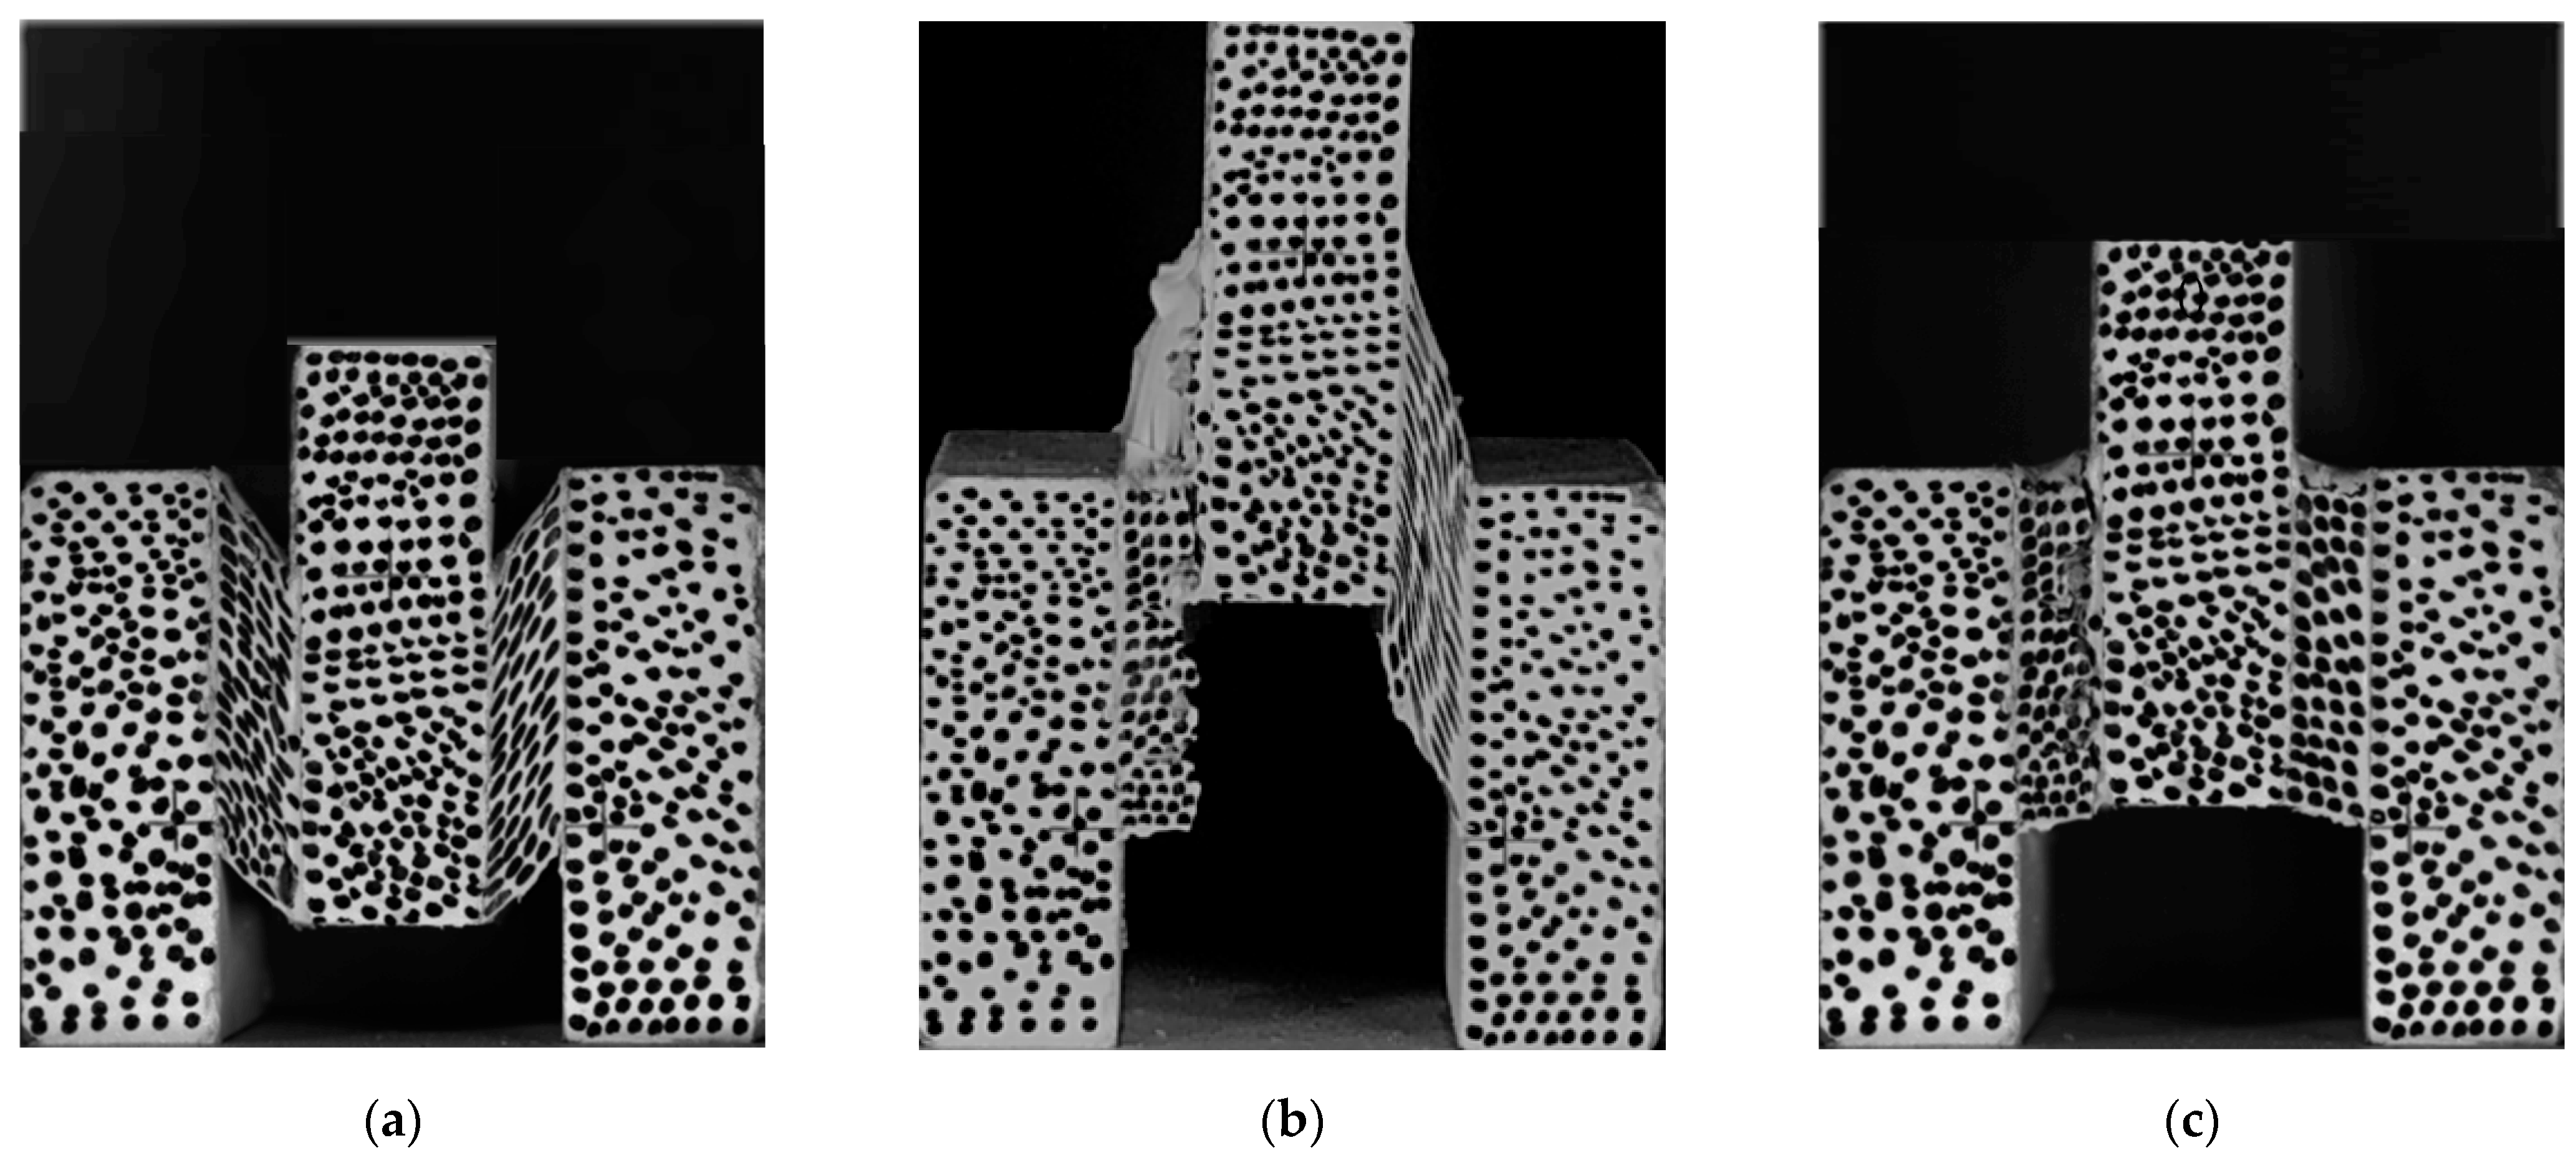
Figure 6 shows the failure process of the SB-10-75-O specimen during the cyclic loading test. When the shear strain was about 0.8, the specimen exhibited small-scale end interface failure, as shown in Figure 6a. From Figure 6b, it could be seen that as the shear strain increased to 2.8, the sealant showed a significant distortion. The surface of the sealant encountered shear failure and inward expansion. Therefore, it could be inferred that the inner core sealant was in a plastic stress state at this time. After the test was completed, the residual displacement of the adhesive seam reached 2.8 mm, which is shown in Figure 6c. Based on the failure process of the SB-10-75-O specimen, it was demonstrated that when the width of the sealant layer was 75 mm, the failure characteristic of the specimen’s sealant was a mixed failure of both adhesive and cohesive failures. In addition, the specimens with the sealant layer width of 75 mm and the sealant Young’s modulus of 1.079 MPa did not show complete fracture at the end of the test, indicating that the increase of the width of the sealant layer can effectively reduce the degree of the specimens’ failure.
3.2. Stress–Strain Analysis
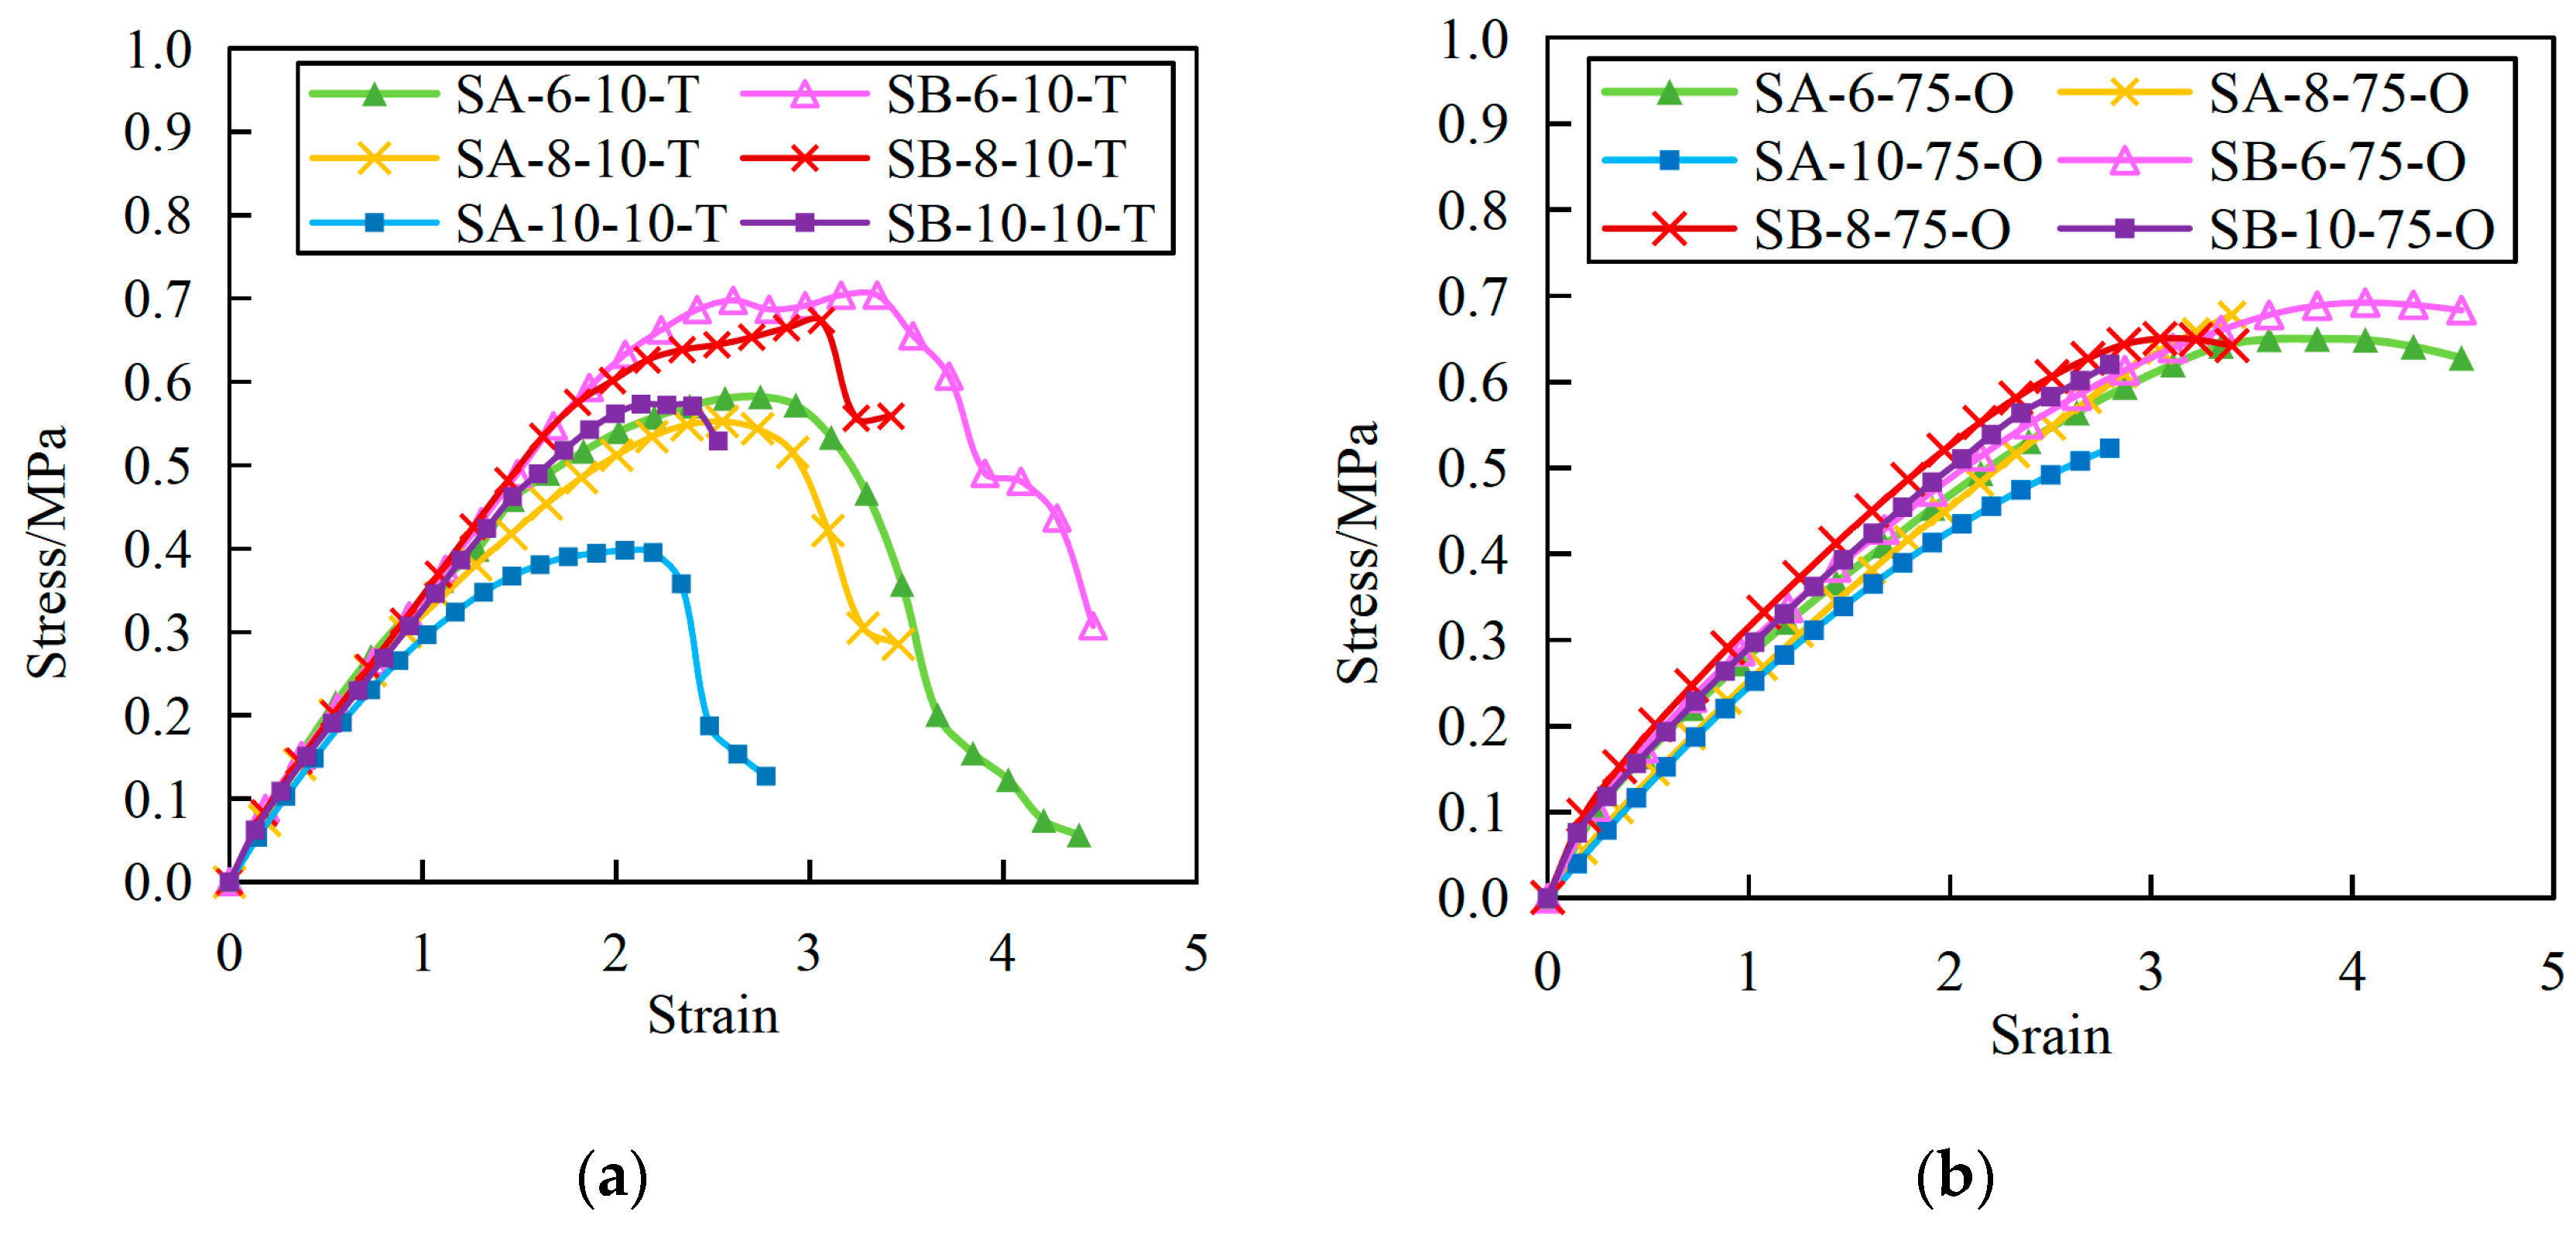
Based on the shear displacement values collected by the DIC system and the load values obtained by the testing machine, the shear stress–strain curves of the specimens under monotonic loading test are shown in Figure 7. The failure process of sealant layers between panels in the stone cladding generally went through three stages: elastic stage, plastic stage, and failure stage. At the initial stage of loading, the shear stress–strain curves of the specimens approximated a straight line. As the shear displacement increased, the sealant entered the plastic stage from the elastic stage. During the plastic stage, the sealant appeared to have severe deformation and its surface began to show damage. For the failure stage, when the load reached the ultimate load, the displacement continuously accumulated. In addition, the cracks in the sealant began to expand from the surface to the interior and eventually ran through the entire sealant layer. By comparing Figure 7a,b, it was found that the strain attenuation rate of the specimens with the sealant layer width of 75 mm was significantly slower than that of the specimens with the sealant layer width of 10 mm. It indicated that the number of sealants could effectively change the plastic deformation of the specimens. As the width of the sealant layer increased, the plastic stage of the specimens also extended, and its ductility was significantly improved.
In addition, in contrast to the specimens with the sealant layer width of 10 mm, there was no significant decrease in the stress–strain curves of the SPPJs with the sealant layer width of 75 mm. This observation was attributed to the fact that the sealants in the specimens with the sealant layer width of 75 mm did not completely break after the experiment. However, the SPPJs with the sealant layer width of 10 mm were completely destroyed. For SPPJs, the increase in the width of the sealant layer provided a larger bonding area and stronger adhesion. This meant that when the width of the sealant layer increased to 75 mm, the stress transfer of the SPPJ was enhanced, resulting in a decrease in the difference on stress–strain values for samples. Therefore, there are very small differences in stress–strain values for samples with sealant layer width of 75 mm. For the specimens that had SPPJs of the same dimension, when the Young’s modulus of the sealant was higher, the shear failure strength and yield strain of the specimens were also higher. For example, compared with SA-10-10-T, the shear failure strength and shear yield strain of SB-10-10-T increased by 43.3% and 22.6%, respectively. Under the same shear strain, the stresses of specimens with different sealant thicknesses were nearly the same in the elastic stage. However, in the plastic stage, as the sealant layer width increased, the shear stress of the specimens decreased.
According to the stress–strain curve of the SPPJ, it could be seen that the change in thickness of the sealant layer did not affect the distribution trend of shear stress at the bonding interface. However, its change had a certain impact on the magnitude of shear stress. As the thickness of the sealant layer increased from 6 mm to 10 mm, the shear yield strain, shear yield stress, and shear failure strength of the specimen all decreased. Compared with SA-6-10-T, the shear failure strengths of SA-10-10-T and SA-8-10-T decreased by 32.6% and 2.7%, respectively. The shear failure strengths of SB-10-10-T and SB-8-10-T decreased by 20.9% and 9.6%, respectively, compared with SB-6-10-T. This indicated that as the thickness of the sealant layer increased, the likelihood of cracks or pores forming within the sealant increased, which led to a decrease in the cohesive strength of the sealant.
3.3. The Influence of the Loading Mode
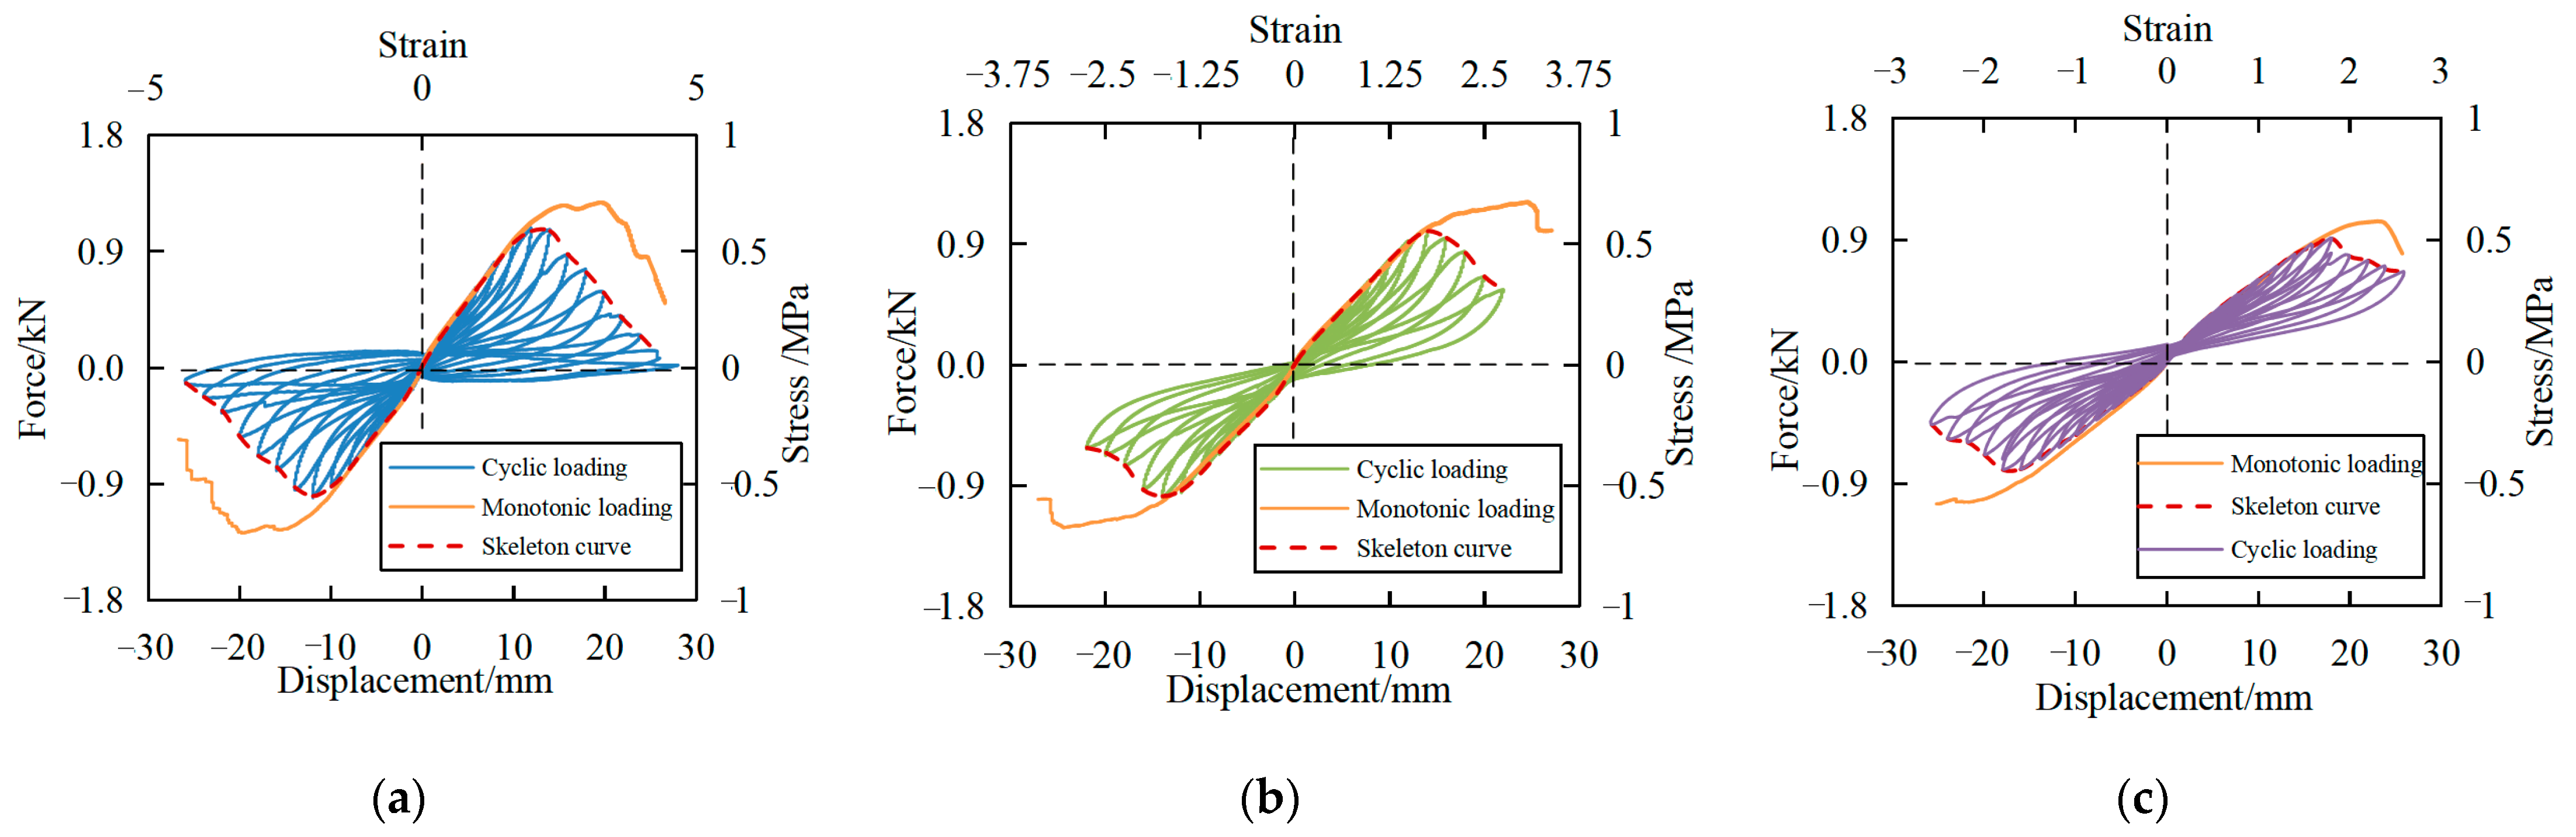
In order to investigate the influence of different loading methods on the shear performance of SPPJs, monotonic and cyclic loading tests were conducted on specimens with the sealant layer width of 10 mm and the Young’s modulus of 1.079 MPa under different thicknesses of sealant. From Figure 8, it could be concluded that a slight decrease in the failure load was found to occur with increasing sealant layer thickness. This is due to the higher bending moments introduced to the SPPJ ends with the thickness increase of the sealant. The cyclic loading caused cumulative damage to the specimens. In particular, when the sealant thickness decreased, the cumulative damage caused by cyclic loading on specimens became more obvious. Compared with the monotonic loading test, the peak loads of SB-6-10-T, SB-8-10-T, and SB-10-10-T under the cyclic loading test decreased by 18%, 15%, and 11%, respectively, and the failure displacements decreased by 31%, 40%, and 29%, respectively.
Under the cyclic loading test, the failure displacement of SB-10-10-T and SB-8-10-T increased by 28% and 17%, respectively, compared with SB-6-10-T. This also explained that in practical engineering, when the inter-story drifts of the main structure were the same, a smaller spacing set between adjacent panels led to an earlier failure of the SPPJs in the stone claddings. In addition, under monotonic or cyclic loading, as the thickness of the sealant layer increased, the ultimate bearing capacity of the specimen showed a decreasing trend.
In order to better analyze the differences in deformation characteristics of specimens from yield to failure under different loading methods, the normalization method was used to perform dimensionless treatment on the stress–strain curves of the specimens, and the curve of τ/τmax–γ was obtained. τ represented stress, τmax was maximum stress, and γ was strain. Figure 9 shows the curves of τ/τmax–γ for specimens with the sealant layer width of 10 mm and the Young’s modulus of 1.079 MPa under different thicknesses of sealant. Compared with the stress–strain curves, normalized data exhibited more obvious regularity. The results showed that the plastic part of the specimens under monotonic loading were more pronounced than that under cyclic loading, which indicated that different loading methods had a significant impact on the plastic deformation of the specimens. During the monotonic loading process, as the sealant layer thickness decreased, the plastic part of the specimens showed an increasing trend.
3.4. Stiffness Degradation
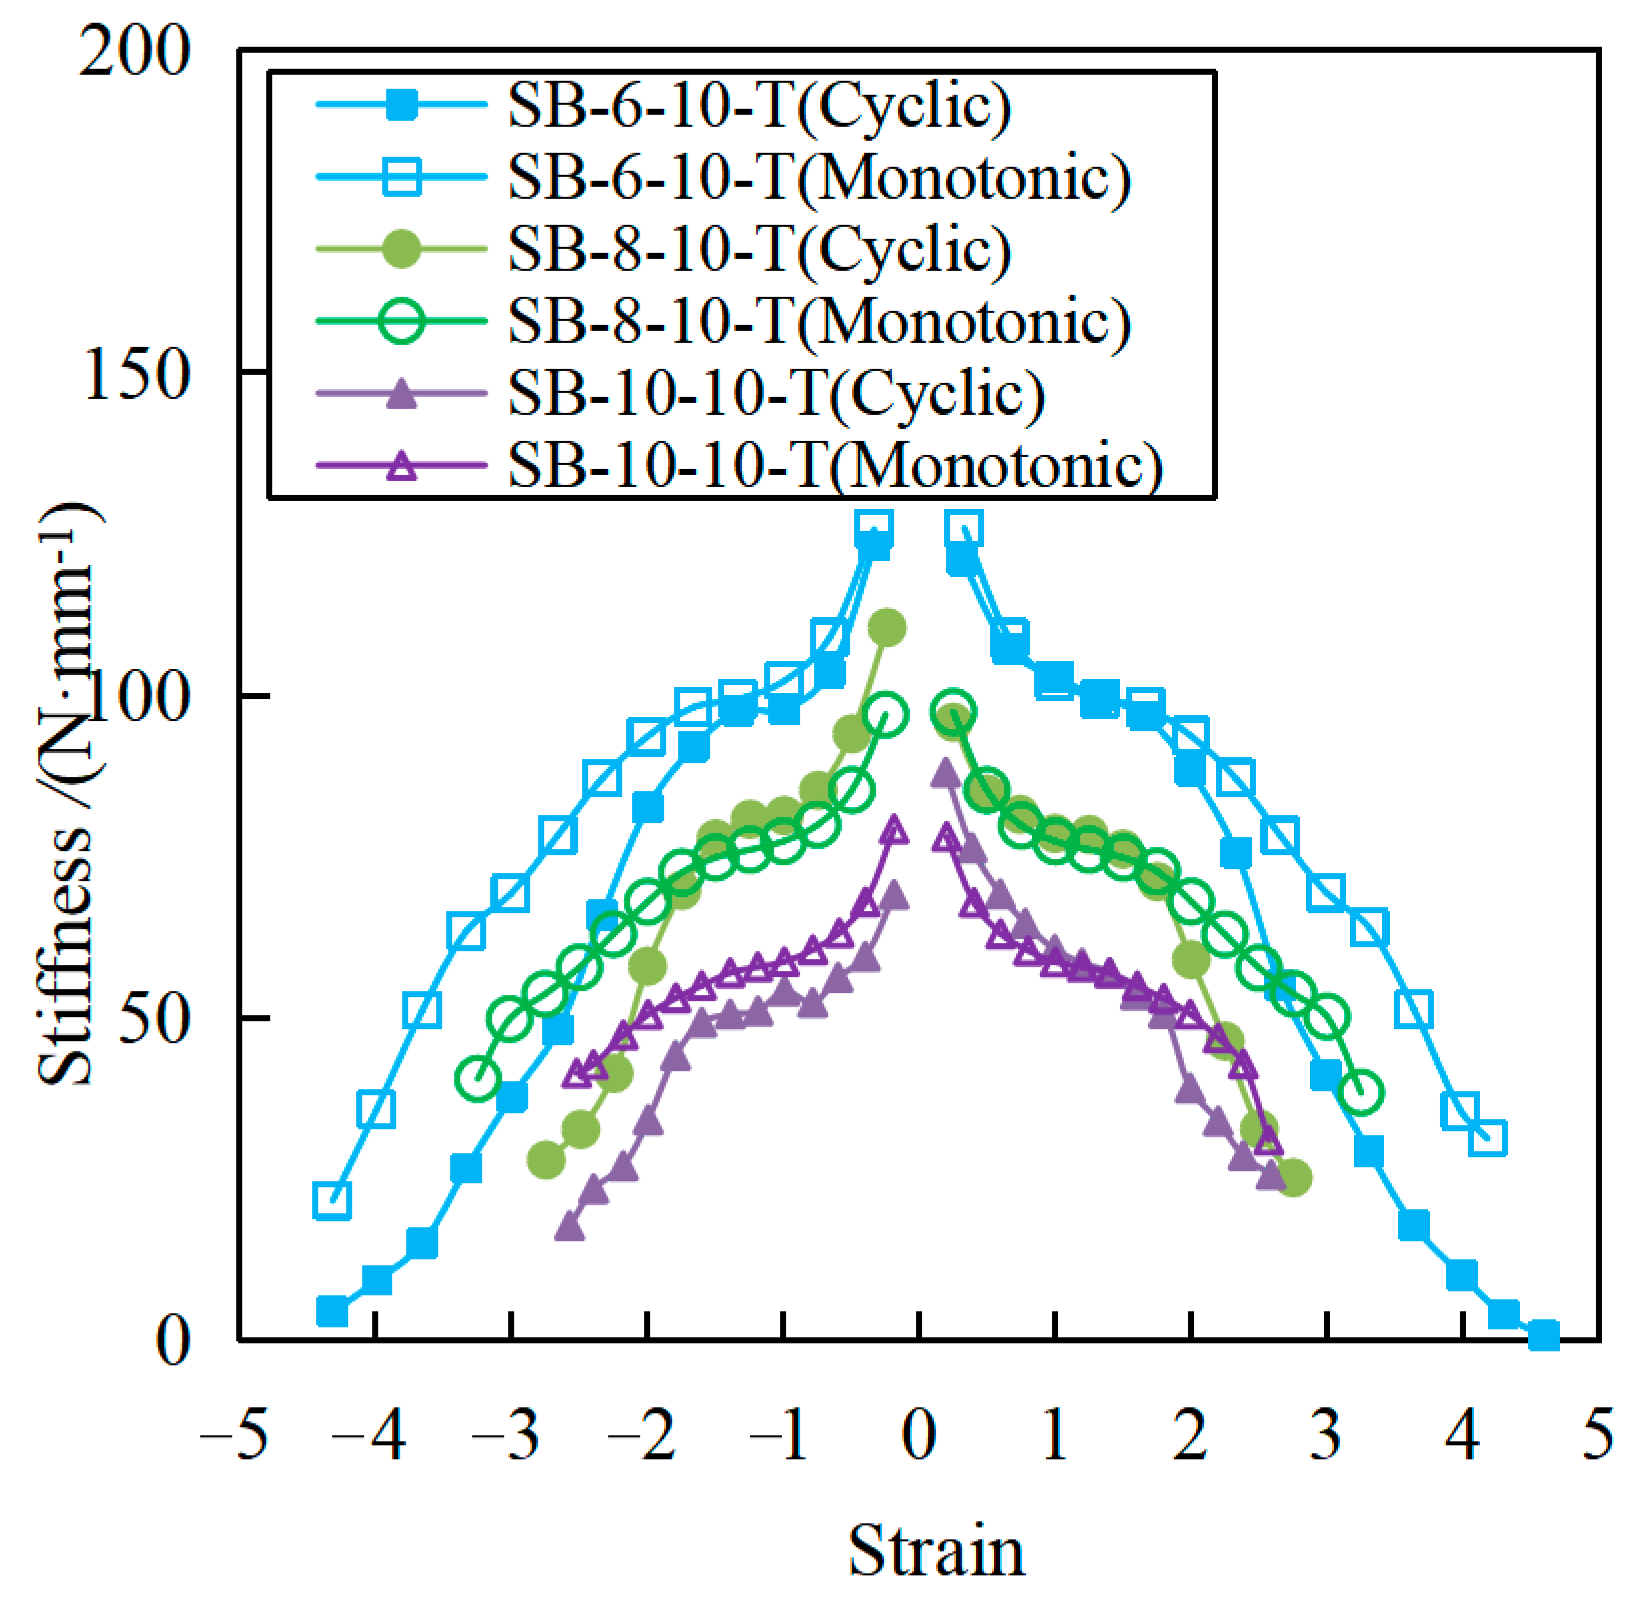
Figure 10 shows the variation of stiffness of specimens with the sealant layer width of 10 mm and the sealant Young’s modulus of 1.079 MPa under different shear strains. As the shear strain increased, the stiffness of the specimens gradually decreased, and the rate of this decrease showed an increasing trend. At the initial stage of monotonic loading and cyclic loading, there was a difference in the initial stiffnesses of the specimens corresponding to forward loading and negative loading. However, in the later elastic stage, the stiffnesses of the specimens corresponding to these two loading directions tended to be the same, which indicated that no permanent damage occurred to the specimens during this stage. When the shear strain was 1.6, the stiffnesses of the specimens decreased significantly, and the magnitudes of the decrease in stiffnesses corresponding to cyclic loading were greater than that corresponding to monotonic loading. The variation trends of stiffnesses of specimens with different sealant thicknesses were the same. The specimens with larger sealant thickness exhibited lower stiffness. In addition, the stiffness degradation rate of SB-6-10-T was the fastest, followed by SB-8-10-T and SB-10-10-T. It indicated that the stiffness degradation rate of the specimen would decrease as the thickness of the sealant layer in the SPPJ increased.
3.5. Energy Dissipation Capacity
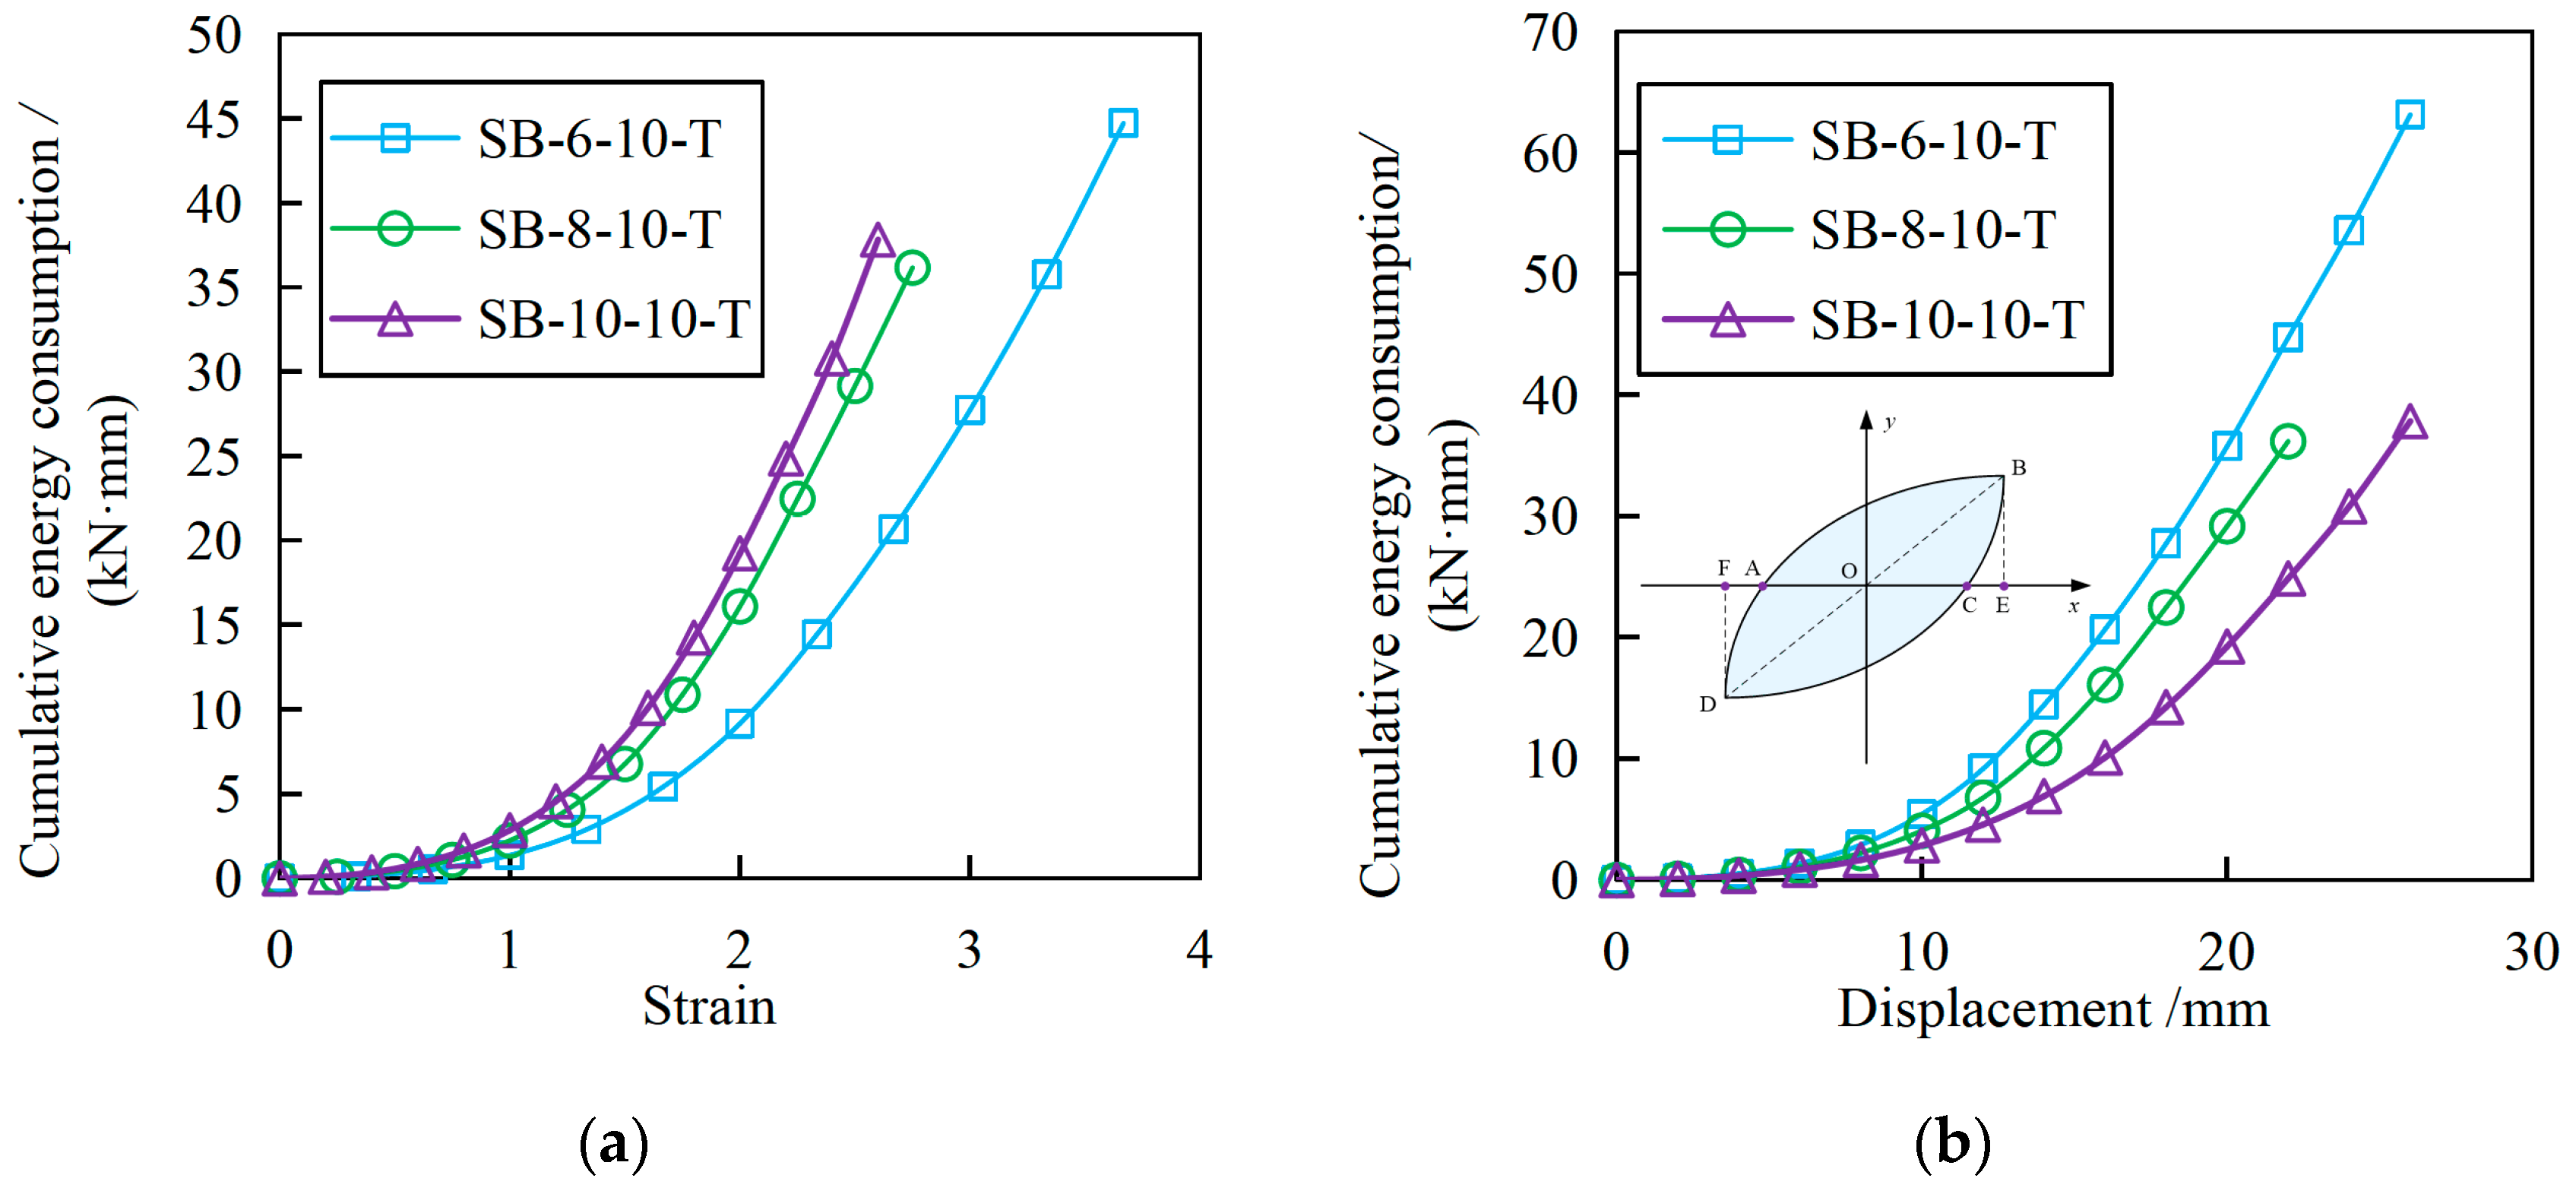
In order to investigate the effect of the thickness of the sealant under cyclic loading on the energy consumption capacity of the specimen, the cumulative energy consumptions of the specimens with the sealant layer width of 10 mm and the sealant Young’s modulus of 1.079 MPa were calculated under different sealant thicknesses. Based on JGJ/T 101–2015 [29], the equation for calculating the cumulative energy consumption of the specimen could be expressed as:
where Ed is the energy consumption capacity; SABC and SCDA represent the areas enclosed by the hysteretic loop; SOBE and SODF are the areas of the two dotted line triangles in Figure 11a.
Figure 11 shows the cumulative energy consumption of specimens under different shear displacements and shear strains. From Figure 11a, it could be seen that under the same shear displacement, the cumulative energy consumption of the specimen increased with the decrease of the thickness of the sealant. For instance, when the loading displacement was 10 mm, the cumulative energy dissipation of SB-10-10-T and SB-8-10-T was 0.52 times and 0.74 times that of SB-6-10-T, respectively. As the loading displacement increased to 20 mm, the cumulative energy consumption of SB-10-10-T and SB-8-10-T decreased by 46% and 17%, respectively, compared with SB-6-10-T. Figure 11b shows the energy consumption of specimens under different shear strains. As the shear strain increased, the cumulative energy consumption of each specimen increased. Under the same shear strain, with the thickness of the sealant increased, the cumulative energy consumption of the specimen showed an increasing trend. When the shear strain was less than 1, the cumulative energy consumptions of specimens with different sealant thicknesses were similar. It indicated that when the shear strain was small, the change in sealant thickness had little effect on the cumulative energy consumption of the specimen. However, when the shear strain reached 1, the cumulative energy consumption of SB-10-10-T and SB-8-10-T was 2.02 times and 1.63 times higher than that of SB-6-10-T, respectively. As the shear strain continued to increase to 2, the cumulative energy consumption of SB-10-10-T and SB-8-10-T increased by 2.10 and 1.75 times, respectively, compared with SB-6-10-T. The results showed that as the shear strain increased, the change in the thickness of the sealant had a more significant impact on its energy dissipation ability, which further indicated that the sealant of the stone cladding had a certain energy dissipation ability.
4. Finite Element Analysis
4.1. Finite Element Modeling of SPPJs
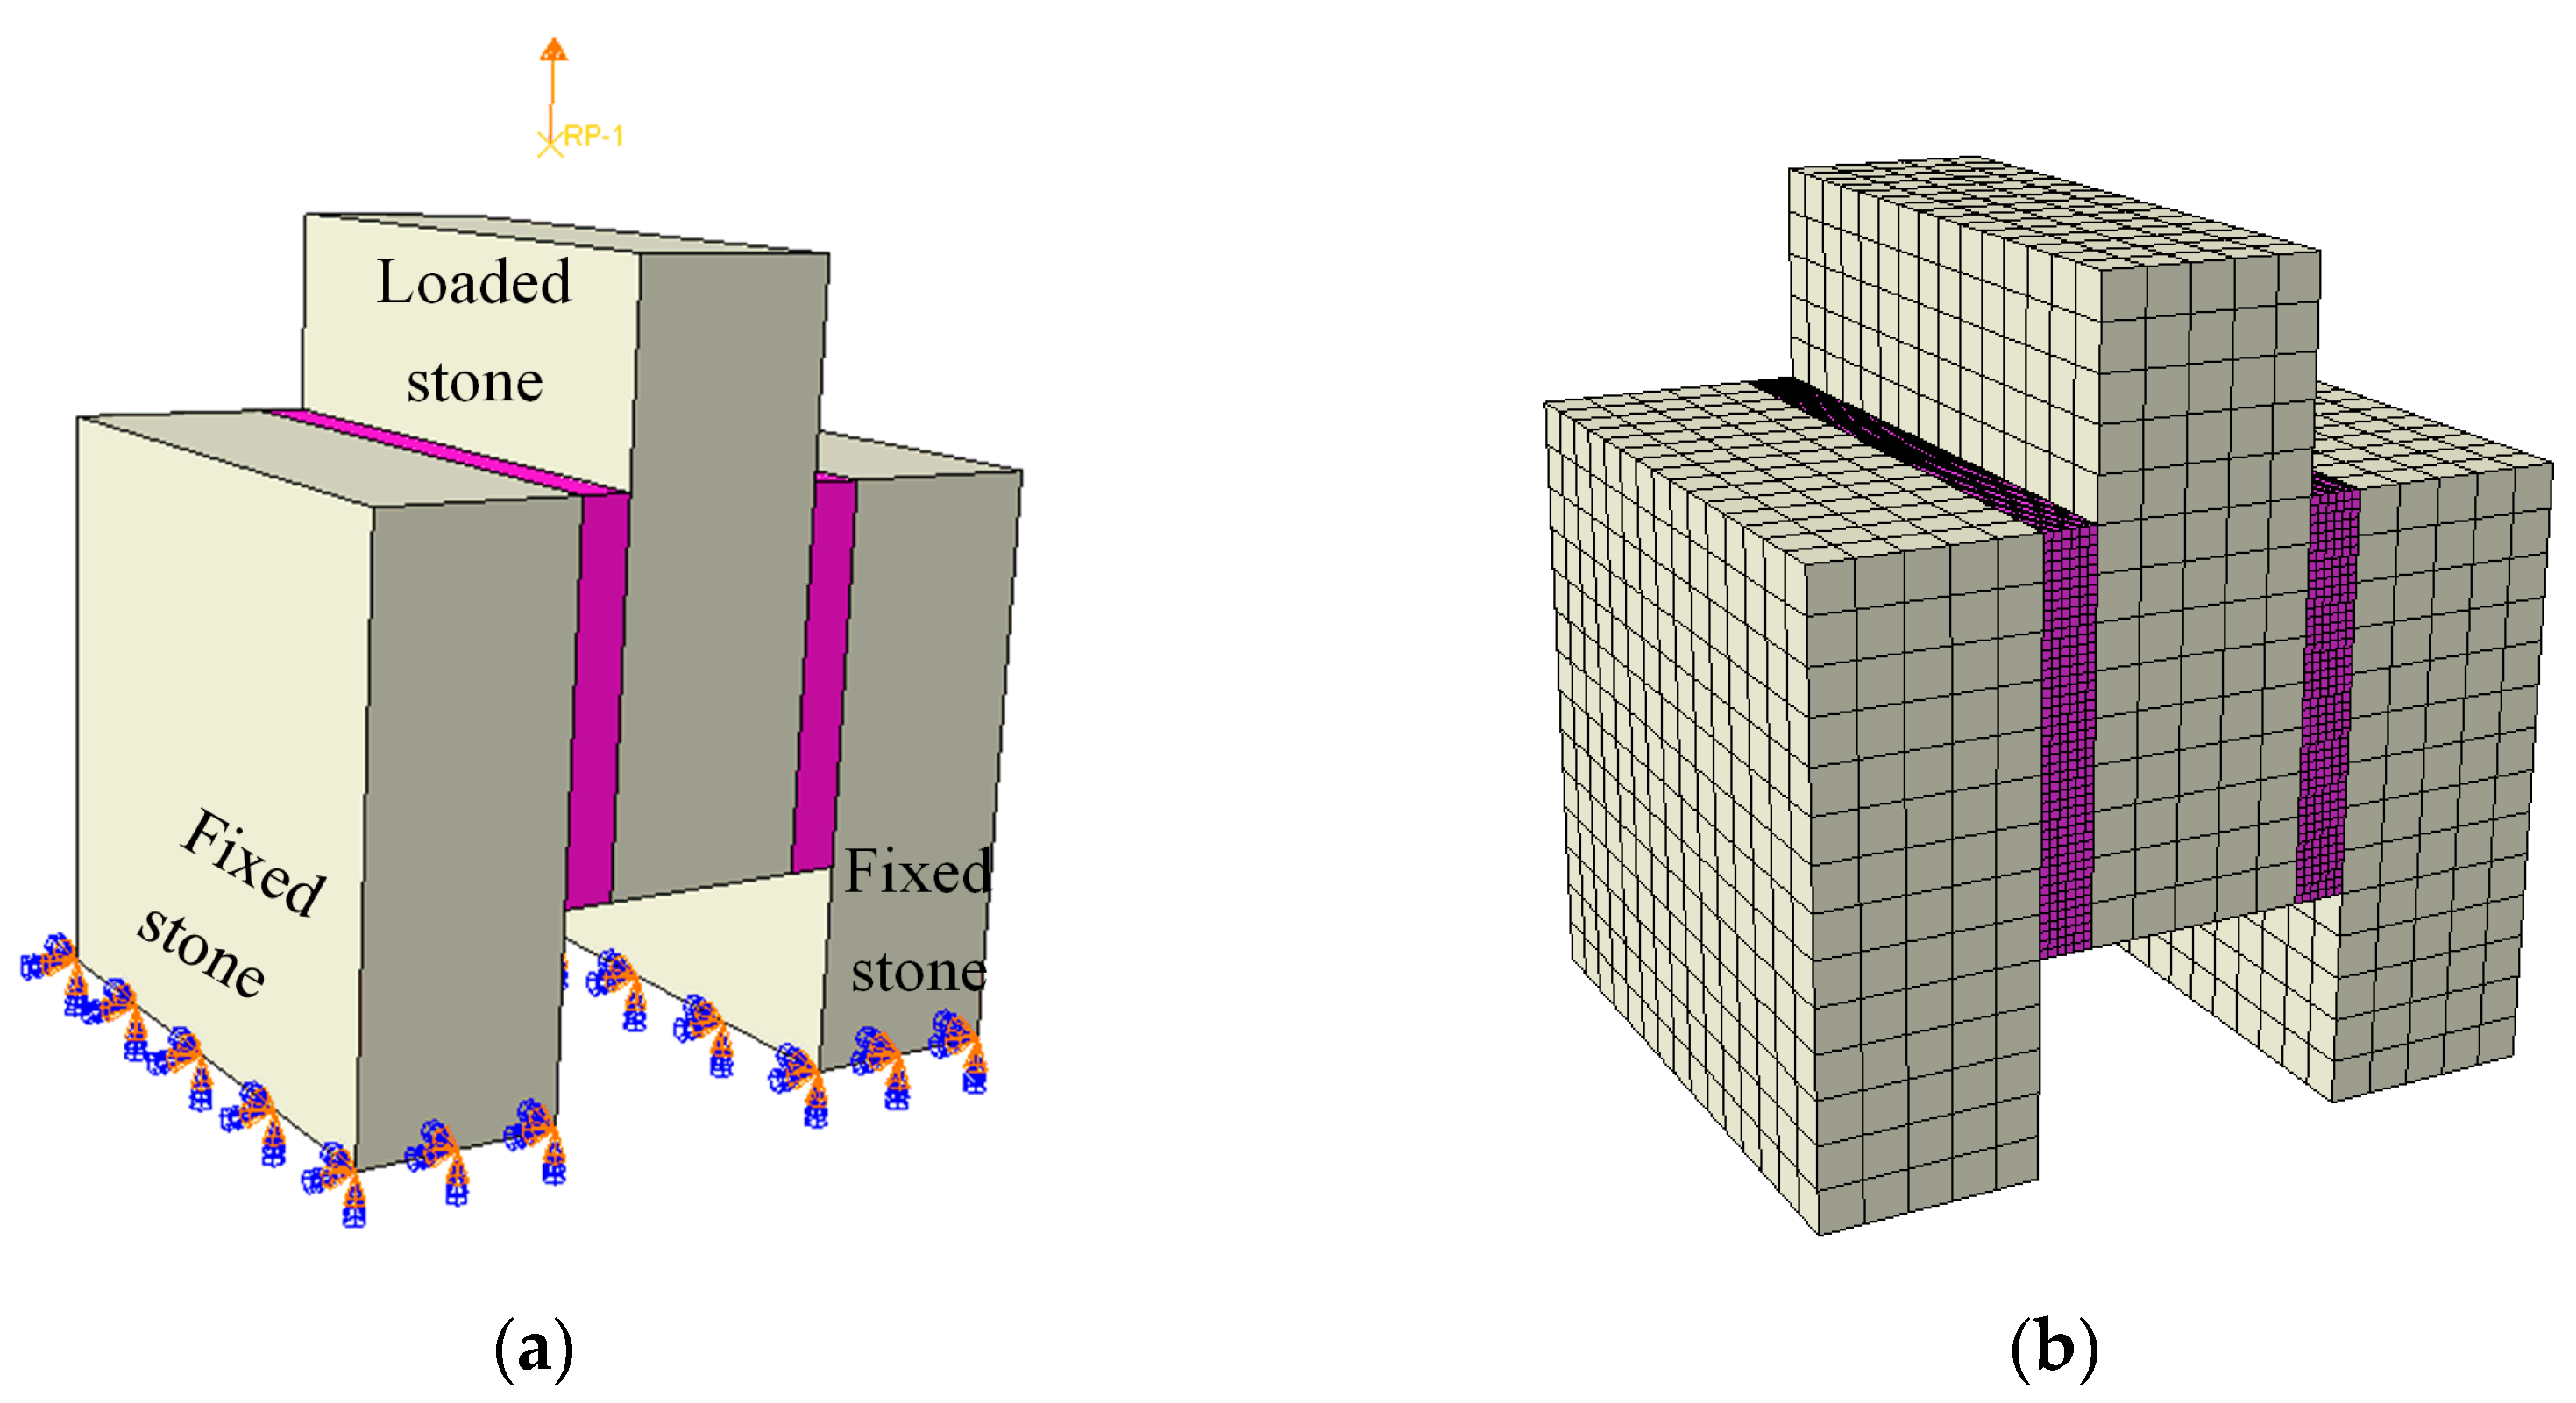
In order to investigate the numerical modeling strategy for predicting the shear performance of SPPJs in the stone cladding, the three-dimensional finite element models of double-shear specimens with the Young’s modulus of 0.5 MPa were established based on ABAQUS. The correctness of the established finite element models was verified based on experimental results, and the strain distributions of specimens with different sealant layer widths under monotonic loading were analyzed. The effect of the number of sealant layers in the unilateral SPPJ on the strain of the SPPJ was investigated. Figure 12 shows the finite element model of the double-shear specimen. The face-to-face contact was applied to the contact between the stone panel and the sealant in this model. The penalty function was used to define the tangential mechanical behavior of the contact interface, and the friction coefficient was considered to be 0.3. The normal behavior was considered as “hard” contact. Once the contact surface separated, the pressure dropped to 0 and the contact constraint also disappeared. The boundary conditions of the lower surfaces of the bilateral stone panels were considered to be completely fixed. The reference point RP-1 was defined at the center of the upper surface of the intermediate stone panel. Then, the motion coupling constraint was established between the reference point RP-1 and the upper surface of the intermediate stone panel, which was to prepare for subsequent displacement loading. In addition, the displacement loading system in the model was consistent with the displacement loading system in Section 2.2. The stone panel was simulated by adopting the eight-noded hexahedral elements with reduced integration (C3D8R), and the sealant layer was modeled using the hybrid uniform-strain hexahedron with reduced integration and enhanced hourglass stabilization element (C3D8RH). Based on mesh sensitivity analysis, the element sizes of the stone panel and sealant were considered to be 10 mm and 1 mm respectively. The mesh density through the thickness of the sealants was kept the same for all the different sealant layer thicknesses modeled.
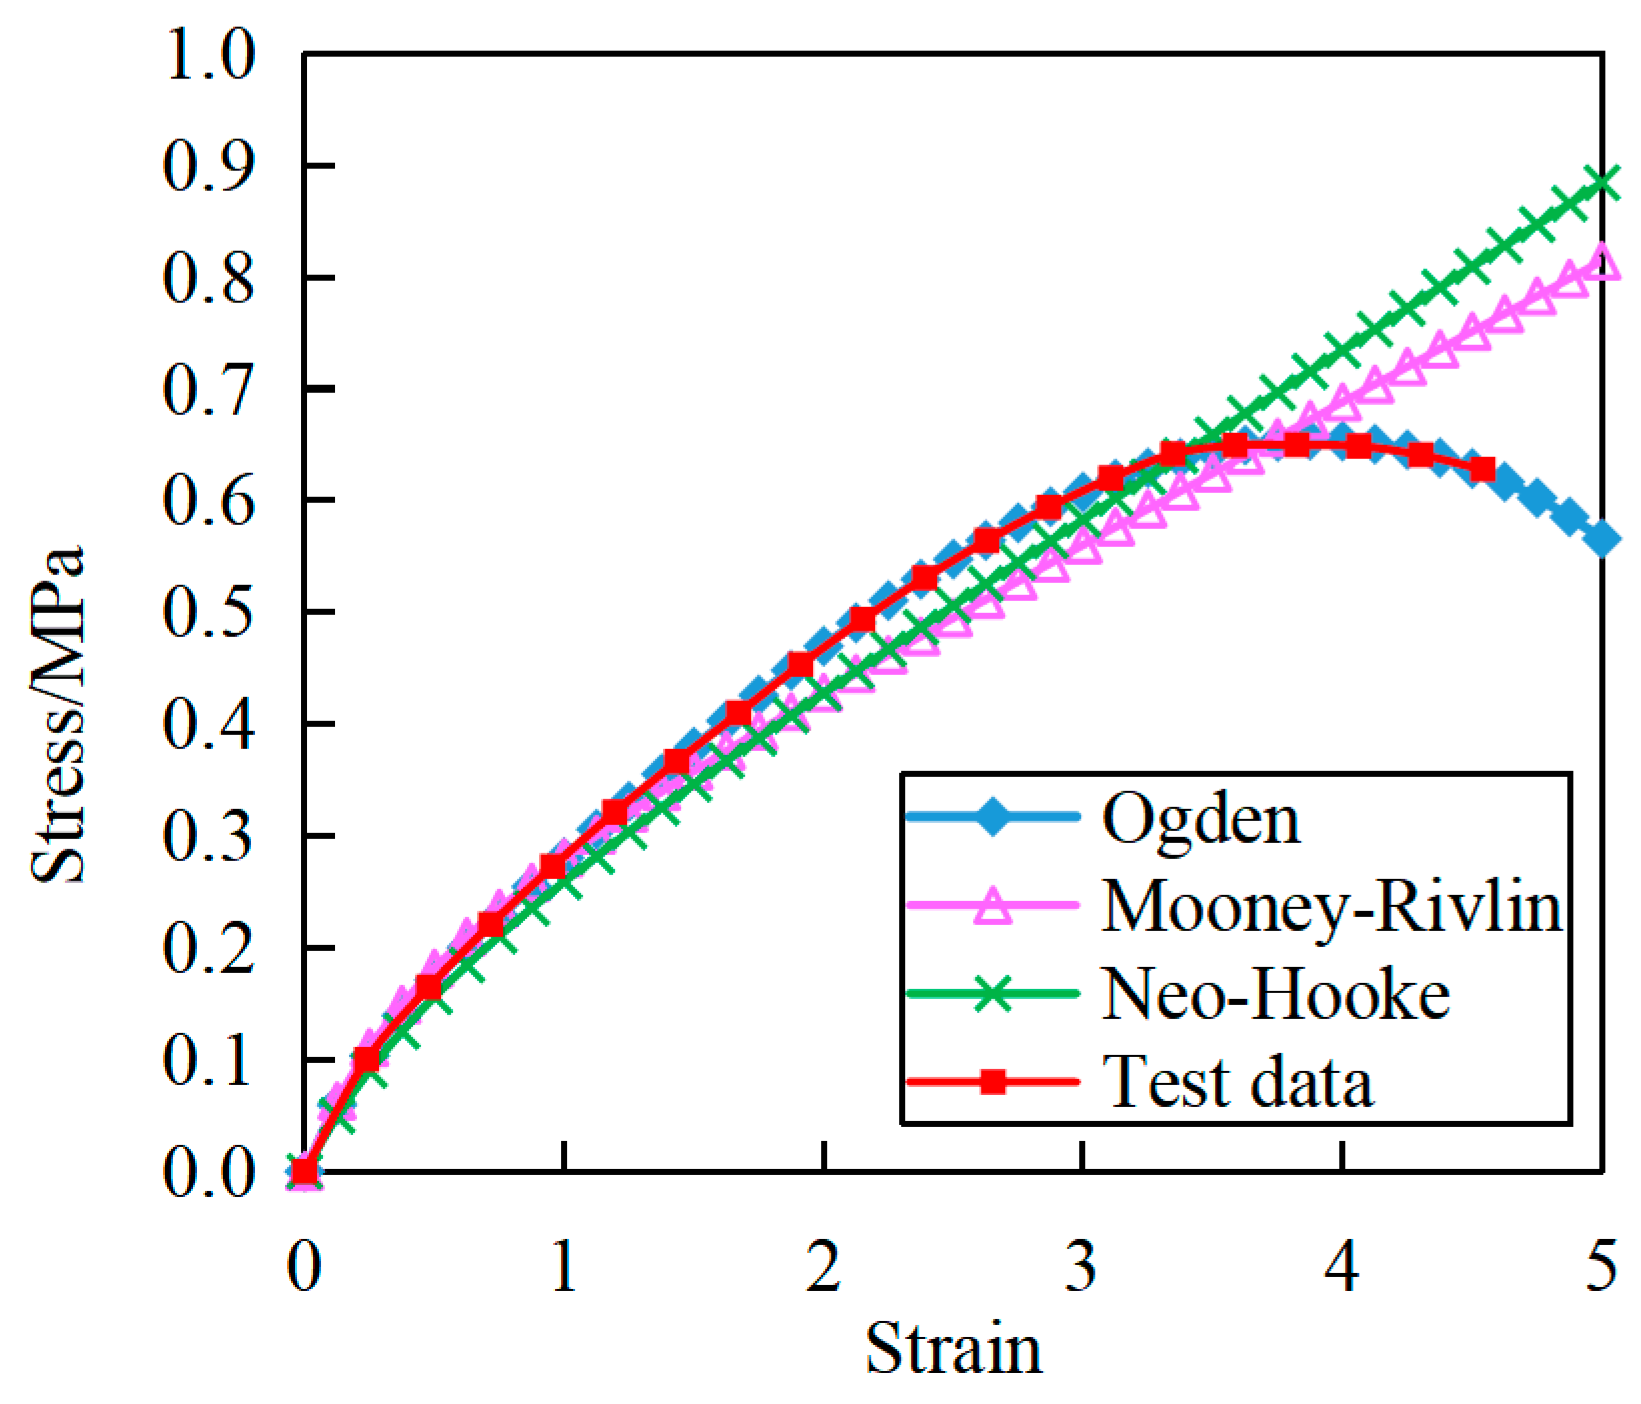
According to the test results, the stone panel did not deform. Therefore, in the simulation of the stone panel, only the elastic stage was considered. The elastic modulus value of the stone panel was consistent with the result of the material performance test, which was 45GPa. The Poisson’s ratio of the stone panel was set to 0.125. The sealant was a nonlinear material, which belonged to the category of super elastic materials. This meant that the sealant would encounter significant deformation under external force and could be restored to its original state after the external force was removed. The commonly used constitutive models for hyperelastic materials included the Neo Hookean model, Mooney Rivlin model [30], and Ogden model [31]. Therefore, in order to determine the constitutive model of the sealant used in this paper, based on the tensile test results of typical specimen SA-6-75-O, the material behavior evaluation function in ABAQUS 2019 software was used to fit the constitutive model of the sealant. Figure 13 shows the fitting results of the stress–strain curve of SA-6-75-O with the commonly used constitutive models of hyperelastic materials. The results indicated that the stress–strain curve of the sealant was very similar to the third-order Ogden model. Therefore, in subsequent simulations, the third-order Ogden model was used as the constitutive model for the sealant.
4.2. Validation of the Model
In order to verify the correctness of the established finite element models, the finite element analysis results and experimental results of SA-6-10-T, SA-8-10-T, SA-10-10-T, SA-6-75-O, SA-8-75-O, and SA-10-75-O under monotonic loading were compared. As shown in Figure 14, the finite element analysis results are in good agreement with the experimental results, which verified the accuracy of the finite element model established in this paper. It also demonstrated the rationality of using finite element technology to analyze the shear performance of SPPJs in the stone cladding.
4.3. The Strain Field in the SPPJs with Various Sealant Layer Widths
In order to further investigate the strain distribution of SPPJs filled with different sealant layer widths, four finite element models corresponding to specimens with two sealant layers in unilateral SPPJs and three finite element models corresponding to specimens with one sealant layer in the unilateral SPPJ were established. For the three finite element models of specimens with two sealant layers in unilateral SPPJs, the width of each sealant layer was considered to be 10 mm, 20 mm, and 30 mm, respectively. Based on the naming method of the specimens in Section 2.1, the names of the specimens corresponding to the three finite element models were defined as SA-6-10-T, SA-6-20-T, and SA-6-30-T. For the four finite element models of specimens with one sealant layer in the unilateral SPPJ, the width of each sealant layer was set to 20 mm, 40 mm, 60 mm, and 70 mm, respectively. These specimens were named as SA-6-20-O, SA-6-40-O, SA-6-60-O, and SA-6-75-O. Furthermore, the effect of the number of sealant layers in the unilateral SPPJ on the strain distribution of the SPPJ under the same total sealant content was investigated.
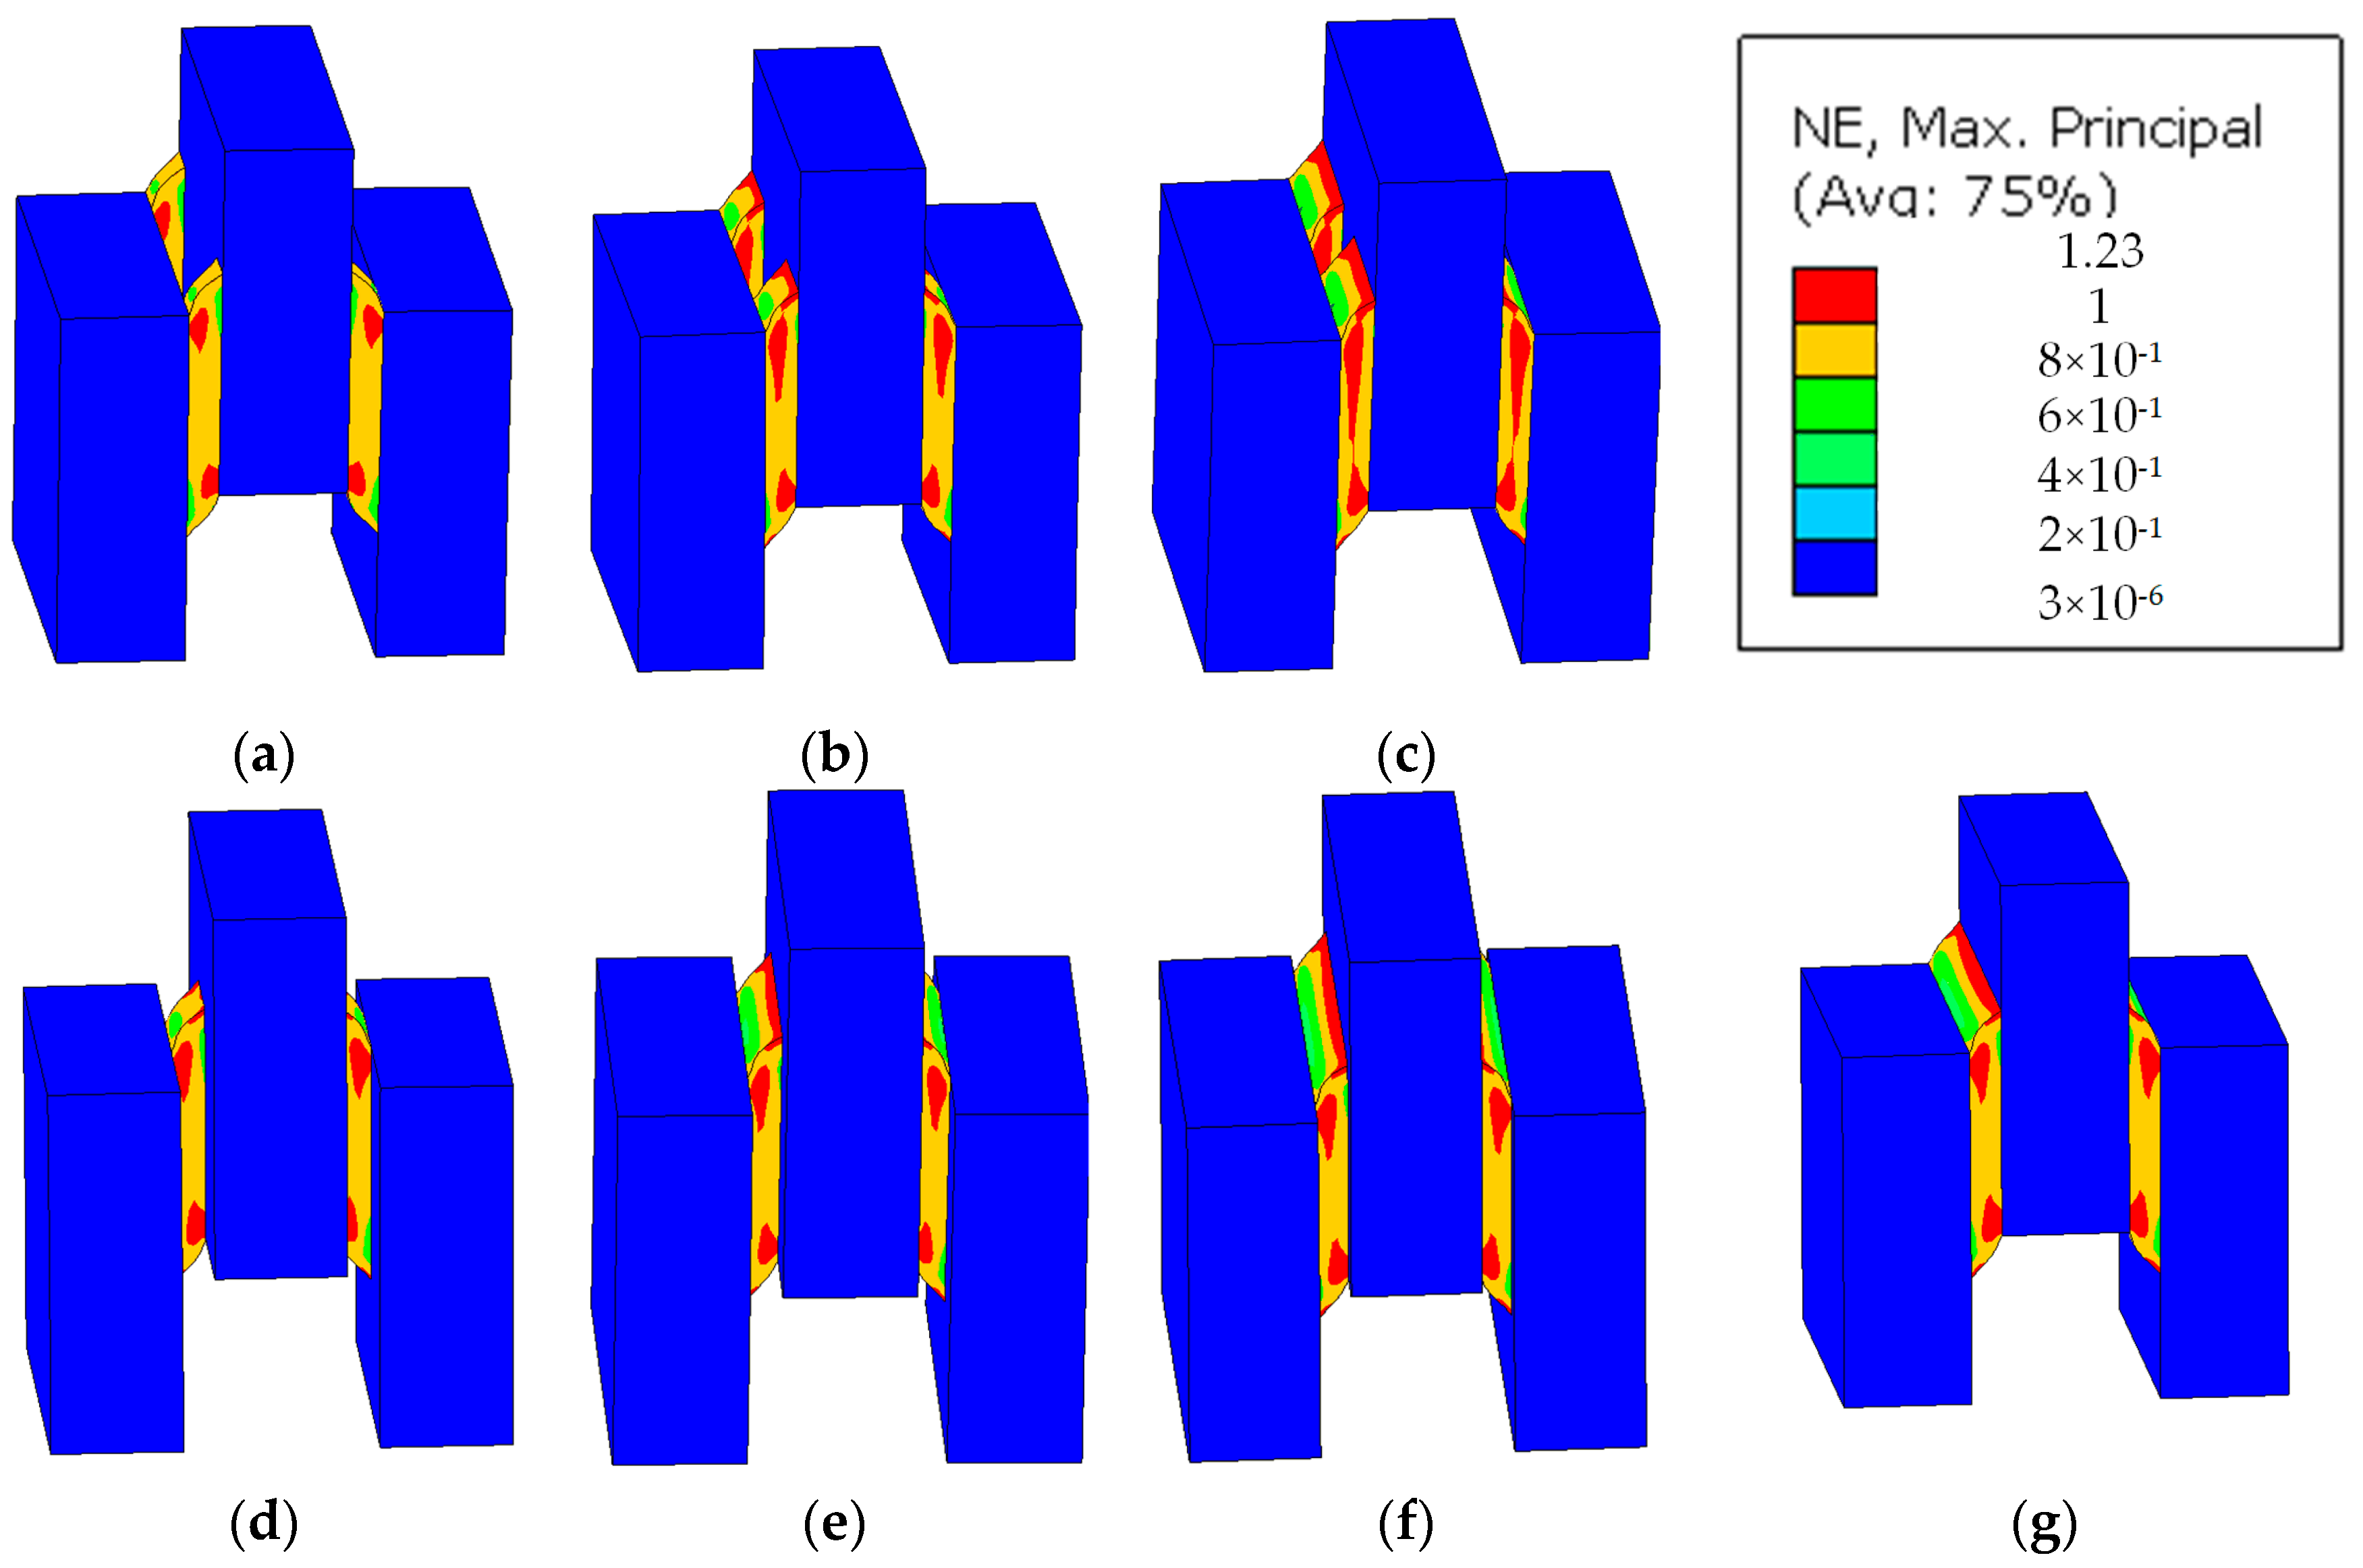
Figure 15 shows the strain distribution of each specimen at a shear displacement of 8 mm. For the sealant that was parallel to the length direction of the SPPJ, the strain distribution at both ends was more concentrated than the strain distribution in the middle. From Figure 15a–c, it could be seen that for the models corresponding to specimens with two sealant layers in the unilateral SPPJ, as the width of the sealant increased, the deformation of the sealant edge increased, resulting in an increase in the area where the strain of the sealant parallel to the length direction of the SPPJ was greater than 1. When the width of the sealant layer was 30 mm, the zone area with the strain greater than 1 almost ran through the surface of the sealant (Figure 15c). It indicated that when the width of the sealant ranged from 0 to 30 mm, the main damage of the SPPJ occurred in the sealant. Figure 15d–g show the stress distribution of the specimens with one sealant layer in the unilateral SPPJ under different sealant widths. With the increase of sealant width, the difference in strain distribution among the specimens with one sealant layer in unilateral SPPJs was relatively small. In addition, by comparing Figure 15c,f, it could be seen that when the total sealant content was the same, the change in the number of sealant layers in the unilateral SPPJ changed the strain distribution of the specimen and even caused changes in the failure mode of the SPPJ.
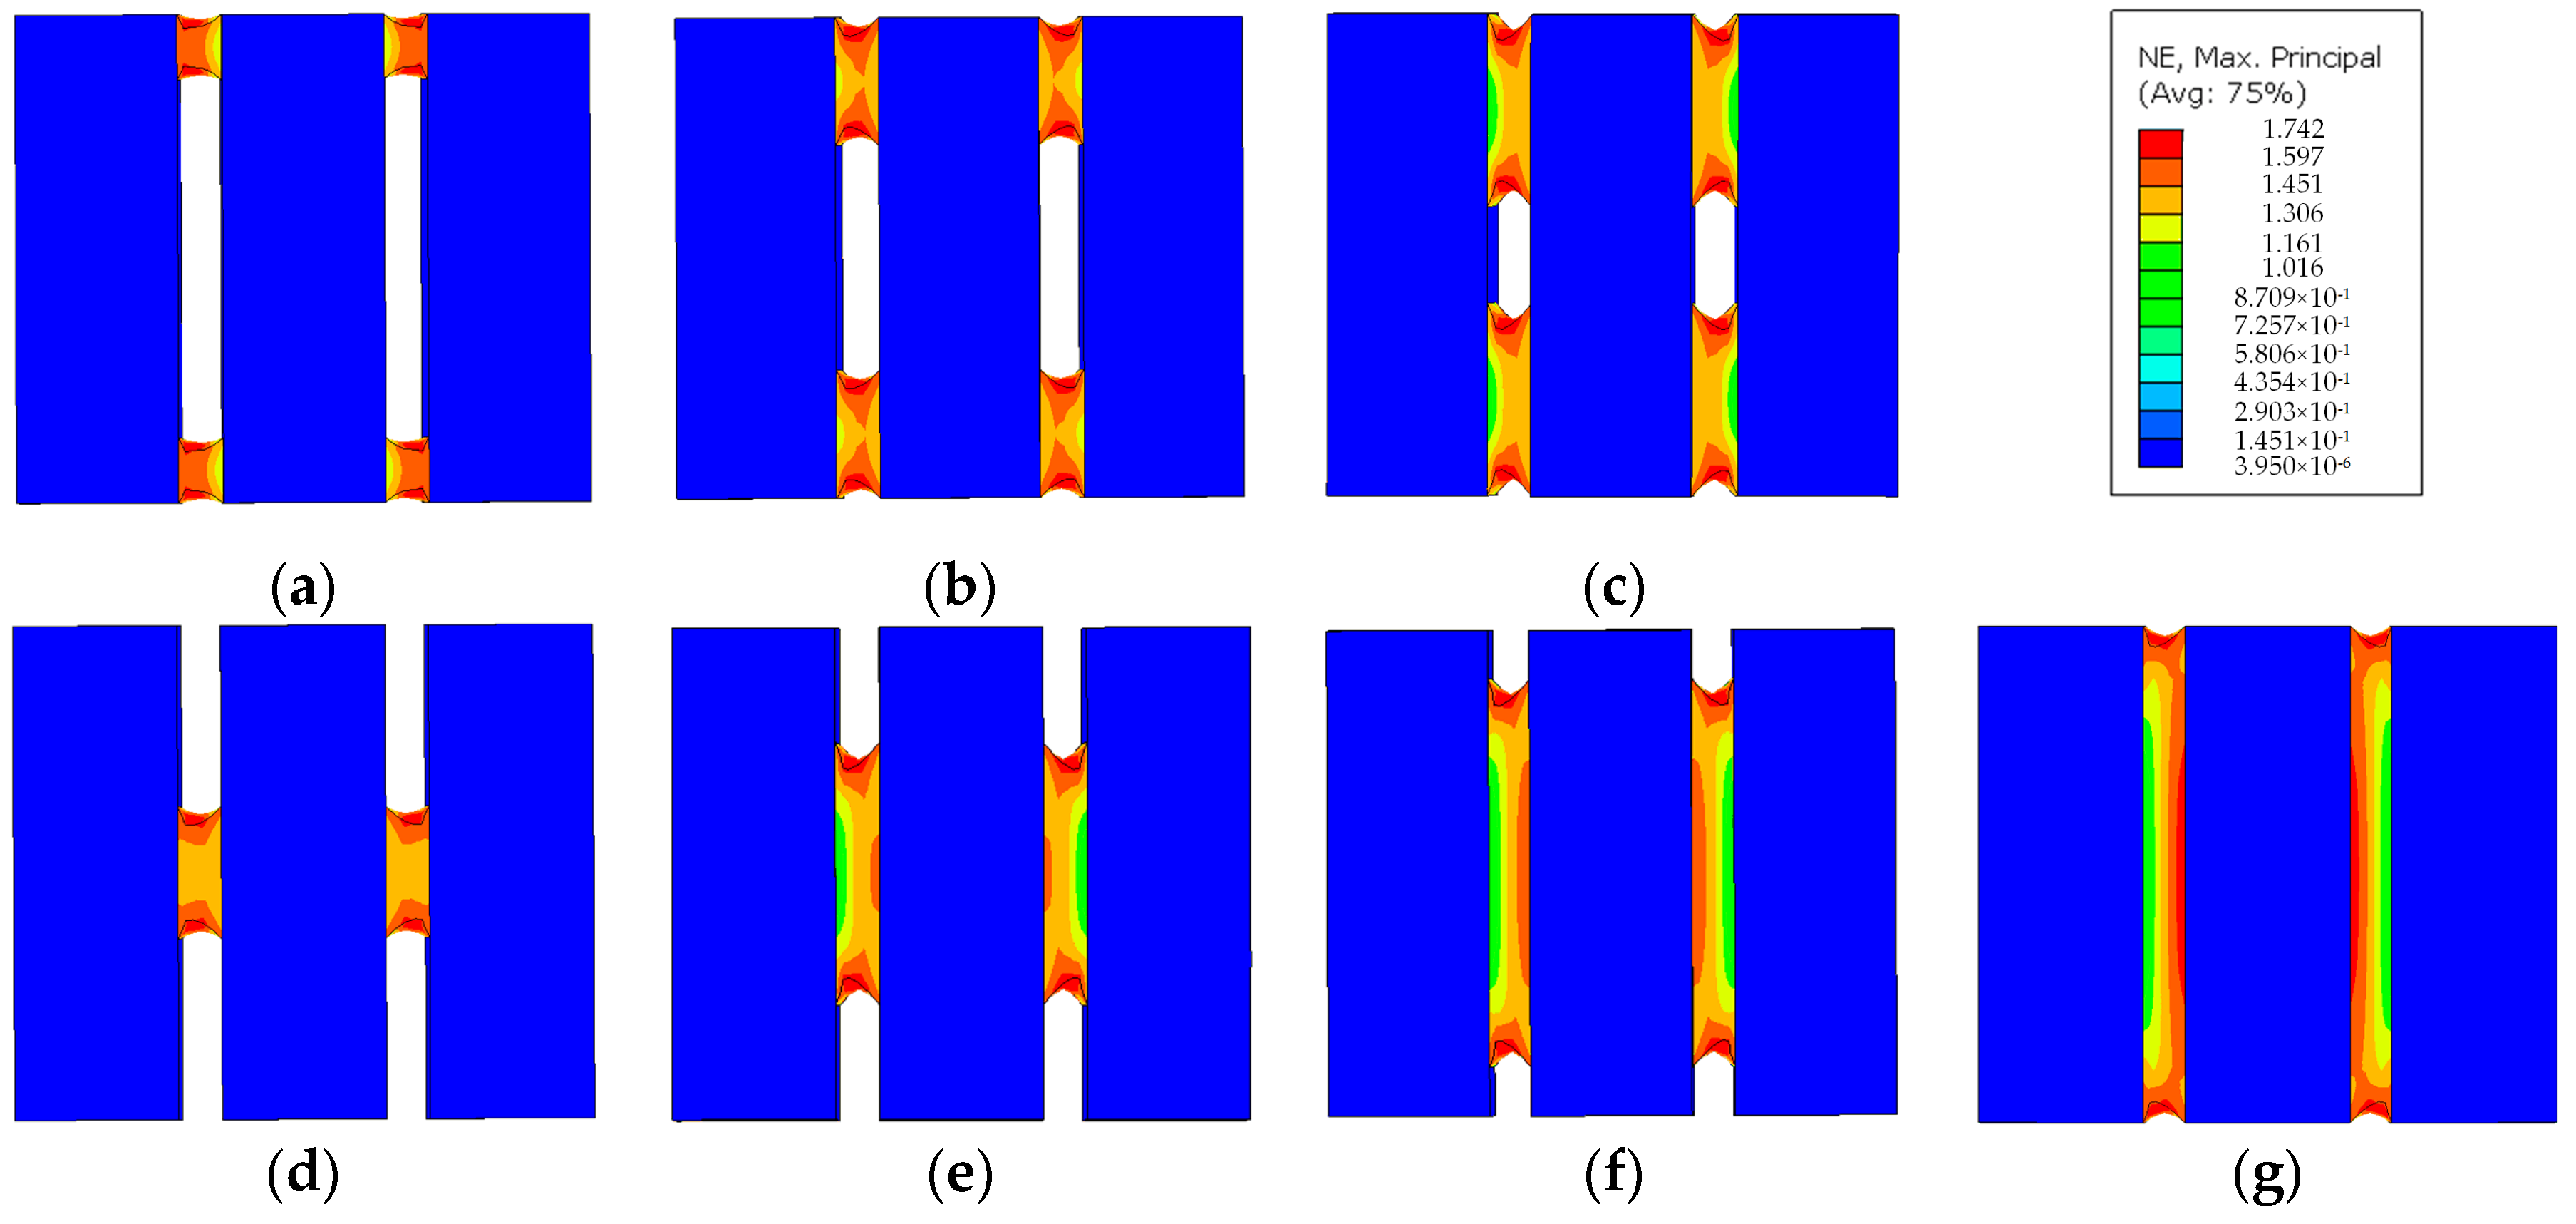
Figure 16 shows the top view of the strain distribution of the specimens when the shear displacement is 12 mm. For the sealant that was parallel to the width direction of the SPPJ, the strain at both ends was greater than that at the middle. Furthermore, there was a significant concavity in the sealant, which was caused by the Poisson’s ratio effects at the free edges of the sealant. For the strain distribution of the sealant parallel to the thickness direction of the SPPJ, the strain near the loaded stone was greater than that of the fixed stone. As shown in Figure 16a–c, the strain at the sealant–stone interface of the specimens with two sealant layers in the unilateral SPPJs did not significantly change with the increase of sealant width. However, in contrast to specimens with two sealant layers in unilateral SPPJs, the increase of sealant width resulted in a higher strain at the sealant-stone interface in specimen with one sealant layer in the unilateral SPPJ (Figure 16d–g. It demonstrated that the increase in the width of the sealant exacerbated the damage of the sealant–stone interface in the specimen with one sealant layer in the unilateral SPPJs.
5. Conclusions
In this paper, based on monotonic and cyclic loading tests, the shear performance of the double-shear specimen with SPPJs, which was made of three stone panels and the sealant, was investigated. The influence of the Young’s modulus and dimension of the sealant on the failure characteristics, stress–strain characteristics, stiffness degradation, and energy dissipation capacity of the SPPJ was analyzed. Furthermore, the difference in shear performance of the SPPJs under different loading methods was investigated. In order to investigate the numerical modeling strategy for predicting the shear performance of the SPPJ in the stone cladding, the finite element models of double-shear specimens were established by using ABAQUS. The strain distribution of the SPPJ under the monotonic loading was analyzed for different sealant widths and the number of sealant layers in the unilateral SPPJ. The following conclusions are drawn:
- In the shear tests of double-shear specimens with SPPJs, the specimens corresponding to the silicone sealant with different Young’s modulus exhibited good deformation ability and similar failure phenomena. As the thickness of the sealant increased, the failure mode of the SPPJ in the specimen gradually shifted from cohesive failure to a mixed failure of both adhesive and cohesive failures.
- Under the same shear strain, the increase of the sealant thickness led to the reduction in shear yield strain, shear yield stress, and shear failure strength of the SPPJ. For example, for specimens with the sealant width of 10 mm and the sealant Young’s modulus of 0.5 MPa under different thicknesses of the sealant, the shear failure strength of the SPPJ decreased by 32.6% when the thickness of the sealant increased from 6 mm to 8 mm. Compared to the specimen with the sealant Young’s modulus of 0.5 MPa, the sealant width of 10 mm and the sealant thickness of 10 mm, and the shear failure strength and shear yield strain of the specimen with the sealant Young’s modulus of 1.079 MPa, the sealant width of 10 mm and the sealant thickness of 10 mm increased by 43.3% and 22.6%, respectively.
- Compared with cyclic loading, the plastic part reflected in the SPPJ under monotonic loading was more pronounced. As the thickness of the sealant decreased, the stiffness degradation of the SPPJ increased. Based on the same shear strain, the increase in the thickness of the sealant enhanced the cumulative energy consumption of the specimen. For specimens with the sealant width of 10 mm and the sealant Young’s modulus of 1.079 MPa under different thicknesses of the sealant, when the shear strain was 2, the cumulative energy consumptions of SPPJs with sealant thicknesses of 10 mm and 8 mm were 2.10 and 1.75 times higher than that of the SPPJ with the sealant thickness of 6 mm, respectively.
- By comparing experimental data and finite element analysis data, the correctness of the finite element model of the specimen with SPPJs established in this paper had been verified. When the total sealant content was the same, the change in the number of unilateral sealant layers resulted in the variation of the SPPJ’s strain distribution. The strain concentration zone of the specimen with two sealant layers in the unilateral SPPJ became larger with the increase of the sealant width. For specimens with one sealant layer in the unilateral SPPJ, the difference in strain distribution between specimens with different sealant widths was relatively small.
- In this paper, the influence of the dimension and the Young’s modulus of sealant on the shear performance of SPPJs was studied based on experiments and finite element analysis. However, there are still some limitations to this work. The limitation of this article is that it is difficult to obtain the shear performance and other properties of SPPJs under dynamic loads and different environmental conditions. Therefore, in subsequent research, the performance analysis of SPPJs under dynamic loads and the durability analysis of SPPJs under different environments will be comprehensively investigated. Moreover, the effects of temperature, humidity, and the type of stone or sealant on the shear performance of SPPJs will be more comprehensively quantified. In addition to finite element numerical analysis, the SPPJ strength damage prediction model based on the Weibull distribution will be further analyzed. The operability and related issues of SPPJs in practical engineering applications will be the focus of subsequent research.
- In summary, the quantification of the influence of the size of the sealant and the Young’s modulus on the shear performance of SPPJs can provide a comprehensive reference for the evaluation and prediction of the shear performance of SPPJs in the stone claddings. In addition, from the analysis of data, it can be concluded that the selection of sealant size in practical engineering needs to consider the design requirements, required deformation capacity, and tolerable failure modes of SPPJs. When designing the size of the sealant, it is necessary to balance the performance requirements and cost-effectiveness of SPPJs to ensure that they exhibit good performance and reliability under various conditions.
Author Contributions
Test conduction, writing—original draft preparation, and formal analysis, S.Y.; conceptualization, methodology, and resources, Z.G.; software and writing—review and editing, Y.Y.; validation and supervision, Y.L. All authors have read and agreed to the published version of the manuscript.
Funding
This research was supported by National Natural Science Foundation of China (Grant No. 52178485), the Science and Technology Project of Fujian Province, China (Grant No. 2020Y4011) and the Natural Science Foundation of Fujian Province, China (Grant No. 2021J01284). The support is highly appreciated.
Data Availability Statement
The data presented in this study are available upon request from the corresponding author. The data are notpublicly available due to the project privacy.
Conflicts of Interest
The authors declare no conflict of interest. The funders had no role in the design of the study; in the collection, analyses, or interpretation of data; in the writing of the manuscript; or in the decision to publish the results.
References
- Gams, M.; Starešinič, G.; Isaković, T. Seismic response of reinforced-concrete one-storey precast industrial buildings with horizontal cladding panels. Buildings 2023, 13, 2519. [Google Scholar] [CrossRef]
- Hayez, V.; Bianchi, S.; Lori, G.; Feng, J.; Kimberlain, J. Performance of silicone bonded facades during seismic events. In Proceedings of the GPD Glass Performance Days, Tampere, Finland, 3 July 2023. [Google Scholar]
- Aiello, C.; Caterino, N.; Maddaloni, G.; Bonati, A.; Franco, A.; Occhiuzzi, A. Experimental and numerical investigation of cyclic response of a glass curtain wall for seismic performance assessment. Constr. Build. Mater. 2018, 187, 596–609. [Google Scholar] [CrossRef]
- Yang, S.; Guo, Z.; Ye, Y.; Liu, Y. Mechanical performance of anchorage joints on short kerf stone curtain wall. J. Build. Mater. 2022, 25, 1300–1305. [Google Scholar] [CrossRef]
- Li, Q.; Crowley, R.W.; Bloomquist, D.B.; Roque, R. Newly developed adhesive strength test for measuring the strength of sealant between joints of concrete pavement. J. Mater. Civ. Eng. 2014, 26, 04014097. [Google Scholar] [CrossRef]
- Figueiredo, J.C.P.; Campilho, R.D.S.G.; Marques, E.A.S.; Machado, J.J.M.; da Silva, L.F.M. Adhesive thickness influence on the shear fracture toughness measurements of adhesive joints. Int. J. Adhes. Adhes. 2018, 83, 15–23. [Google Scholar] [CrossRef]
- Castagnetti, D.; Spaggiari, A.; Dragoni, E. Effect of bondline thickness on the static strength of structural adhesives under nearly-homogeneous shear stresses. J. Adhes. 2011, 87, 780–803. [Google Scholar] [CrossRef]
- Dal Lago, B.; Biondini, F.; Toniolo, G. Seismic perfSormance of precast concrete structures with energy dissipating cladding panel connection systems. Struct. Concr. 2018, 19, 1908–1926. [Google Scholar] [CrossRef]
- Dal Lago, B.; Biondini, F.; Toniolo, G.; Lamperti Tornaghi, M. Experimental investigation on the influence of silicone sealant on the seismic behaviour of precast façades. Bull. Earthq. Eng. 2017, 15, 1771–1787. [Google Scholar] [CrossRef]
- Negro, P.; Lamperti Tornaghi, M. Seismic response of precast structures with vertical cladding panels: The SAFECLADDING experimental campaign. Eng. Struct. 2017, 132, 205–228. [Google Scholar] [CrossRef]
- Nemati Giv, A.; Fu, Q.N.; Yan, L.; Kasal, B. The effect of adhesive amount and type on failure mode and shear strength of glued timber-concrete joints. Constr. Build. Mater. 2022, 345, 128375. [Google Scholar] [CrossRef]
- Giannis, S.; Adams, R.D. Failure of elastomeric sealants under tension and shear: Experiments and analysis. Int. J. Adhes. Adhes. 2019, 91, 77–91. [Google Scholar] [CrossRef]
- Gupta, V.; Mohapatra, P.C.; Smith, L.V. The effect of adhesive bondline thickness on joint strength. In Proceedings of the CAMX 2014—Composites and Advanced Materials Expo: Combined Strength, Unsurpassed Innovation, Orlando, FL, USA, 13 October 2014. [Google Scholar]
- Wang, T.; Zhang, X.a.; Yang, S.; Shahzad, M.M. Quantifying the influence of modeling uncertainties on performance evaluation of mega column-core tube-outrigger structure under near-field and far-field ground motions. J. Build. Eng. 2022, 59, 105052. [Google Scholar] [CrossRef]
- Lee, A.D.; Shepherd, P.; Evernden, M.C.; Metcalfe, D. Measuring the effective Young’s modulus of structural silicone sealant in moment-resisting glazing joints. Constr. Build. Mater. 2018, 181, 510–526. [Google Scholar] [CrossRef]
- Somarathna, H.M.C.C.; Raman, S.N.; Mohotti, D.; Mutalib, A.A.; Badri, K.H. The use of polyurethane for structural and infrastructural engineering applications: A state-of-the-art review. Constr. Build. Mater. 2018, 190, 995–1014. [Google Scholar] [CrossRef]
- Hagl, A. Mechanical characteristics of degraded silicone bonded pointsupports. J. ASTM Int. 2012, 9, 1–14. [Google Scholar] [CrossRef]
- Staudt, Y.; Odenbreit, C.; Schneider, J. Failure behaviour of silicone adhesive in bonded connections with simple geometry. Int. J. Adhes. Adhes. 2018, 82, 126–138. [Google Scholar] [CrossRef]
- Broker, K.; Fisher, S.; Memari, A. Seismic racking test evaluation of silicone used in a four-sided structural sealant glazed curtain wall system. J. ASTM Int. 2012, 9, 104144. [Google Scholar] [CrossRef]
- Clift, C.; Carbary, L.; Hutley, P.; Kimberlain, J. Next generation structural silicone glazing. J. Facade Des. Eng. 2015, 2, 137–161. [Google Scholar] [CrossRef]
- Wallau, W.; Recknagel, C. Durability assessment of structural sealant glazing systems applying a performance test method. J. Adhes. 2022, 98, 464–487. [Google Scholar] [CrossRef]
- Wang, G.; Zhou, Z.; Zhang, K.; Wu, L.; Zhang, X.; Shi, X. Study on corrosion resistance of passive sealant to Fe-based amorphous coating at atomic-scale. Constr. Build. Mater. 2023, 408, 133661. [Google Scholar] [CrossRef]
- Jiang, K.; Pan, D.; Huang, Y.; Fu, X. Construction defect identification for structural sealant by statistical driving-point accelerance. Constr. Build. Mater. 2023, 392, 131817. [Google Scholar] [CrossRef]
- JC/T 989-2016; Structural Load-Unbearing Stone Adhesive. Standardization Administration of China: Beijing, China, 2016.
- Schreier, H.W.O.; Orteu, J.-J.; Sutton, M.A. Image Correlation for Shape, Motion and Deformation Measurements: Basic Concepts, Theory and Applications; Springer: Boston, MA, USA, 2009. [Google Scholar]
- GB/T 12830-2008; Determination of Shear Modulus and Adhesive Strength of Vulcanized Rubber or Thermoplastic Rubber and Rigid Plate Four Plate Shear Method. Standardization Administration of China: Beijing, China, 2008.
- ASTM D907; Standard Terminology of Adhesives. International American Society of Testing and Materials: West Conshocken, PA, USA, 2011.
- Kumar, S.; Scanlan, J.P. On axisymmetric adhesive joints with graded interface stiffness. Int. J. Adhes. Adhes. 2013, 41, 57–72. [Google Scholar] [CrossRef]
- JGJ/T 101–2015; Specification for Seismic Test of Buildings. Standardization Administration of China: Beijing, China, 2015.
- Soleymani, M.; Tahani, M.; Zamani, P. On the influence of resin pocket area on the failure of tapered sandwich composites. Adv. Struct. Eng. 2021, 24, 42–51. [Google Scholar] [CrossRef]
- Tutunchi, A.; Kamali, R.; Kianvash, A. Adhesive strength of steel–epoxy composite joints bonded with structural acrylic adhesives filled with silica nanoparticles. J. Adhes. Sci. Technol. 2015, 29, 195–206. [Google Scholar] [CrossRef]
Figure 1.
Typical sealant joint of stone cladding: (a) schematic representation and (b) photograph.

Figure 2.
The double-shear specimens with sealant: (a) schematic representation, (b) sealant layer width of 10 mm, and (c) sealant layer width of 75 mm.
Figure 2.
The double-shear specimens with sealant: (a) schematic representation, (b) sealant layer width of 10 mm, and (c) sealant layer width of 75 mm.

Figure 3.
Typical experimental test setup: (a) DIC measurement and (b) specimen.

Figure 4.
The loading protocol of the cyclic loading test.

Figure 5.
The failure mode of SPPJs with the sealant width of 10 mm and the sealant Young’s modulus of 1.079 MPa (after the end of test loading): (a) SB-6-10-T, (b) SB-8-10-T, and (c) SB-10-10-T.
Figure 5.
The failure mode of SPPJs with the sealant width of 10 mm and the sealant Young’s modulus of 1.079 MPa (after the end of test loading): (a) SB-6-10-T, (b) SB-8-10-T, and (c) SB-10-10-T.

Figure 6.
The failure mode of the SPPJ of SB-10-75-O (test loading process): (a) initial cracking, (b) crack expansion, and (c) residual deformation.
Figure 6.
The failure mode of the SPPJ of SB-10-75-O (test loading process): (a) initial cracking, (b) crack expansion, and (c) residual deformation.

Figure 7.
Shear stress–strain curve for SPPJs: (a) sealant layer width of 10 mm and (b) sealant layer width of 75 mm.
Figure 7.
Shear stress–strain curve for SPPJs: (a) sealant layer width of 10 mm and (b) sealant layer width of 75 mm.

Figure 8.
Results of monotonic loading and low cycle loading for SPPJs: (a) SB-6-10-T, (b) SB-8-10-T, and (c) SB-10-10-T.
Figure 8.
Results of monotonic loading and low cycle loading for SPPJs: (a) SB-6-10-T, (b) SB-8-10-T, and (c) SB-10-10-T.

Figure 9.
The skeleton curve: (a) monotonic loading and (b) cyclic loading.

Figure 10.
Stiffness degradation curve.

Figure 11.
Cumulative energy consumption curve: (a) changes with displacement and (b) changes with shear strain.
Figure 11.
Cumulative energy consumption curve: (a) changes with displacement and (b) changes with shear strain.

Figure 12.
Finite element model of the SPPJs: (a) boundary conditions and (b) mesh division.

Figure 13.
Comparison of stress–strain curves of SA-6-75-O under different constitutive models.

Figure 14.
Comparison between calculation results of finite element method (FEM) and test results: (a) SA-6-10-T, (b) SA-8-10-T, (c) SA-10-10-T, (d) SA-6-75-O, (e) SA-8-75-O and (f) SA-10-75-O.
Figure 14.
Comparison between calculation results of finite element method (FEM) and test results: (a) SA-6-10-T, (b) SA-8-10-T, (c) SA-10-10-T, (d) SA-6-75-O, (e) SA-8-75-O and (f) SA-10-75-O.

Figure 15.
Strain distribution (shearing displacement of 8 mm): (a) SA-6-10-T, (b) SA-6-20-T, (c) SA-6-30-T, (d) SA-6-20-O, (e) SA-6-40-O, (f) SA-6-60-O, and (g) SA-6-75-O.
Figure 15.
Strain distribution (shearing displacement of 8 mm): (a) SA-6-10-T, (b) SA-6-20-T, (c) SA-6-30-T, (d) SA-6-20-O, (e) SA-6-40-O, (f) SA-6-60-O, and (g) SA-6-75-O.

Figure 16.
Vertical view of strain distribution (shearing of 12 mm): (a) SA-6-10-T, (b) SA-6-20-T, (c) SA-6-30-T, (d) SA-6-20-O, (e) SA-6-40-O, (f) SA-6-60-O, and (g) SA-6-75-O.
Figure 16.
Vertical view of strain distribution (shearing of 12 mm): (a) SA-6-10-T, (b) SA-6-20-T, (c) SA-6-30-T, (d) SA-6-20-O, (e) SA-6-40-O, (f) SA-6-60-O, and (g) SA-6-75-O.


Table 1.
Parameters of specimens.
| Specimen | Young’s Modulus /MPa | Thickness /mm | Width /mm | Specimen | Young’s Modulus /MPa | Thickness /mm | Width /mm |
|---|---|---|---|---|---|---|---|
| SA-6-10-T | 0.500 | 6 | 10 | SB-6-10-T | 1.079 | 6 | 10 |
| SA-8-10-T | 0.500 | 8 | 10 | SB-8-10-T | 1.079 | 8 | 10 |
| SA-10-10-T | 0.500 | 10 | 10 | SB-10-10-T | 1.079 | 10 | 10 |
| SA-6-75-O | 0.500 | 6 | 75 | SB-6-75-O | 1.079 | 6 | 75 |
| SA-8-75-O | 0.500 | 8 | 75 | SB-8-75-O | 1.079 | 8 | 75 |
| SA-10-75-O | 0.500 | 10 | 75 | SB-10-75-O | 1.079 | 10 | 75 |
Disclaimer/Publisher’s Note: The statements, opinions and data contained in all publications are solely those of the individual author(s) and contributor(s) and not of MDPI and/or the editor(s). MDPI and/or the editor(s) disclaim responsibility for any injury to people or property resulting from any ideas, methods, instructions or products referred to in the content. |
© 2023 by the authors. Licensee MDPI, Basel, Switzerland. This article is an open access article distributed under the terms and conditions of the Creative Commons Attribution (CC BY) license (https://creativecommons.org/licenses/by/4.0/).
Share and Cite
MDPI and ACS Style
Yang, S.; Guo, Z.; Ye, Y.; Liu, Y. Experimental and Numerical Study on the Shear Performance of the Stone Panel–Panel Joint in Stone Cladding. Buildings 2023, 13, 3079. https://doi.org/10.3390/buildings13123079
AMA Style
Yang S, Guo Z, Ye Y, Liu Y. Experimental and Numerical Study on the Shear Performance of the Stone Panel–Panel Joint in Stone Cladding. Buildings. 2023; 13(12):3079. https://doi.org/10.3390/buildings13123079
Chicago/Turabian StyleYang, Shixuan, Zixiong Guo, Yong Ye, and Yang Liu. 2023. "Experimental and Numerical Study on the Shear Performance of the Stone Panel–Panel Joint in Stone Cladding" Buildings 13, no. 12: 3079. https://doi.org/10.3390/buildings13123079
Note that from the first issue of 2016, this journal uses article numbers instead of page numbers. See further details here.