


The Effect of Printing Direction on the Strength Characteristics of a 3D Printed Concrete Wall Section

1
Department of Civil Engineering and Architecture, School of Engineering, Tallinn University of Technology, 19086 Tallinn, Estonia
2
Tartu College, School of Engineering, Tallinn University of Technology, 51008 Tartu, Estonia
*
Author to whom correspondence should be addressed.
Buildings 2023, 13(12), 2917; https://doi.org/10.3390/buildings13122917
Submission received: 31 May 2023
/
Revised: 30 October 2023
/
Accepted: 1 November 2023
/
Published: 23 November 2023
(This article belongs to the Special Issue 3D Concrete Printing: Materials, Process, Design and Application)
Abstract
:Digital construction is expected to reduce the high volume of waste and the labour shortage in the construction sector. The properties of hardened concrete used in 3D printing depend on numerous parameters within the manufacturing process. This study collected data using 208 specimens to measure the effect of the loading direction relative to the printing direction on the strength characteristics of printed concrete. The compressive strength was not significantly affected by the directions, but showed a 30% reduction from mould-casted strength due to lesser amount of compaction in the printing process. Flexural tensile strength showed a 14% reduction in one direction, possibly caused by heterogeneity due to the use of extrusion head with a 35% smaller diameter than the width of the layer. Splitting tensile strength was 14% lower when split between the printed layers. Splitting tensile strength is possibly 5% higher when PP fibres are oriented favourably.
1. Introduction
Three-dimensional concrete printing is a symbiosis between construction and automation, which creates a new way to erect buildings or cast building elements by placing fine grain concrete in thin continuous layers (filaments) with computer-based numerical controllers (CNCs). Three-dimensional concrete printing is similar in many ways to printing with plastic or metal materials. However, due to the hardening properties of cementitious materials, it faces different technological challenges.
In construction, automation and concrete 3D printing is hoped to relieve problems such as affordable housing, the skilled labour shortage, the environmental impact of conventional concrete, precision, and reliability in construction work [1,2]. The industry and universities are showing an increased research interest in concrete 3D printing. The number of published studies has increased by 30% annually since 2019 [3]. Despite this unified effort, there are several open technological challenges, such as reinforcement methods [4,5] or high porosity [6]. Concrete 3D printing is not a drop-in replacement as it also requires changes in other areas, such as plumbing and running wiring, for maximum benefit [7,8,9]. The change in processes needs to start at the design phase of a project, the question to ask early on is if printing can be performed using current technology?
The properties of 3D printed concrete mostly depend on the mixture design. The mixture usually contains fine sand, which is required for printability and pumpability. Most progressing cavity mortar pumps have an upper aggregate size limit of 4–6 mm. The large specific surface, in turn, increases the required dosage of the binder. The dose of ordinary Portland cement (OPC) is usually 40% larger than that for equivalent conventional concrete. Some mixtures have up to five times larger binder dosage compared to conventional concrete [10,11]. There is also greater need for admixtures: set-acceleration admixture is often needed to reduce the time delay between adjacent layers; super-plasticizers and viscosity modifying agents (VMA) are needed for printability. As a result, both the price and the global warming potential (GWP) per cubic metre of 3D printed mixtures are worse compared to conventional concrete. This disparity can be reduced by using unconventional geometry which includes voids, this is helpful in some types of load bearing structures. For heavily loaded columns and walls, combining a 3D printed permanent framework filled with conventional concrete is likely the optimal solution. Benefits in the environmental performance of 3D printed concrete are still possible when alternative binders are used, such as calcium sulfoaluminate cement or geopolymers instead of OPC [12].
The GWP calculations of 3D printed concrete are sometimes performed by comparing non-reinforced 3D printed concrete with reinforced regular concrete [13,14]. A lack of good reinforcement methods can explain this disparity; however, reinforced conventional concrete and non-reinforced 3D-printed concrete should not be directly compared. If non-reinforced 3D-printed concrete suits the project, it is likely that masonry could have suited it as well, which would have been a better direct comparison from a structural standpoint.
The properties of a printed wall also depend on the exact technology and process parameters used. Two widely used technologies for material extrusion are pump feeding and screw-type extrusion [15]. Pump feeding technology uses a progressing cavity mortar pump at the start of the line and has less control on extrusion at the nozzle. The screw type has an extruding screw with or without a hopper at the printing head. Using a hopper at the printing head makes it possible for the wet concrete to be additionally compacted before the final extrusion, which can be further helped with the forced vibration of the hopper [16].
Another important set of factors is the environment of printing [17]. Low humidity, high temperatures, solar radiation, and the speed of air movement cause rapid drying of water from the surface of the printed layers and severely affect interlayer bonding (up to a 32% reduction). When a new layer is placed, the water from the new layer together with some cement is absorbed by the previous layer. In the cross section of the printed concrete this can be seen as a dark line between the layers. A proven method to prevent drying is creating a high-humidity environment using tents and humidifiers, or delaying the works until favourable weather is forecast. Curing admixtures or bonding agents can also be used to fix this problem.
The torque required for pumping depends on the pumpability of the wet mix, the shape of the extrusion head, the length, and the diameter of the line. Longer lines and mixes with lower pumpability require higher pressures and a higher power pump. Much of the energy used by the pump ends up heating the mix. The temperature of air voids in the wet mix rises when compressed by the pump which, in turn, heats up the whole mixture. For the common progressing cavity pump, increasing the speed of the axle causes friction between the axle and the rubber sleeve, and the rubber sleeve has less time for cooling per turn. This raises the temperature of the pump and most of the heat is passed on to the mix. The raised temperature quick starts the cement curing at the pump, which further reduces the pumpability. This can cause dramatic changes in the properties of the mix such as changes in the volume of material deposited, tearing of the printed filament, gaps in the placed filament, or even clogging of the line. Adding an accelerator near the extrusion point is usually a solution for pumping problems [18].
Changes in the deposition rate cause a change in the width or sometimes even height of the printed filament, depending on the position and type of the extrusion head. This can also create voids between adjacent layers with adverse effects on strength or over extrusion, resulting in a wrong shape of the element and increased use of materials. Changes in the deposition rate are often counteracted with changes in the speed of the extrusion head. Counteracting to the changes by changing the deposition rate is often performed manually. Continuous mixers are required, and only very short pauses in material deposition can be allowed.
For 3D printed concrete, a notable strength difference caused by different printing directions has been reported [17,19,20,21,22,23,24]. The key strength problem is the strength of the bond between the layers and anisotropy. The lower bonding strength sometimes affects other types of strength as well, especially when the top of the layer is curved.
The difference in compressive strength between loading directions either varies greatly (up to 40% difference) [20] or not (2% difference) [22]. There are novel approaches to this problem, such as using sulphur-black carbon–sand interlayers which enhances bonding strength between layers [25]. If fibres are used, the tensile strength of the printed specimens is sometimes greater than that of moulded specimens [24].
Most notably, there is a significant reduction in the compressive strength of the specimens cut from a printed wall when compared to mould-casted and thoroughly compacted specimens. A printed wall has a 30–40% lower strength depending on the direction of the load [20,22]. There has been one study with exceptional results where moulded cubes had slightly lower density and equal strength compared to the printed elements. This was caused by the additional compaction of concrete in the hopper of the pump with vibration, and the poor compaction of the mould-casted cubes [16].
This study aims to verify the effect of testing directions on strength characteristics of 3D-printed concrete specimens. The dataset consists of 206 specimens in total.
2. Materials and Methods
2.1. Preparation of Concrete
The concrete composition (Table 1) used in the study aimed to be affordable (the cost of raw materials less than 100 €/m3) and to have good printability. The recipe had been previously used and was based on the recommendations of the manufacturer of dry mixes, Mira Ehitusmaterjalid Ltd. (Saue, Estonia), with the possibility of being easily produced as a single-component dry mix [26]. The recipe was given for a cubic metre of printed concrete with 16% porosity. This mix allowed printing of up to 20 layers in one printing session (55 mm layer width, 15 mm layer height, 60 s delay between layers). Three admixtures, plasticizer, set accelerator, and viscosity modifying agent (VMA), were mixed into the dry mix as powders. The water–binder ratio was 0.58, the water-to-dry-mix ratio was 0.144, and the aggregate-to-binder ratio was 3.0.

Table 1.
The composition of the mortar.
| Material | Dosage, kg/m3 |
|---|---|
| Portland cement CEM I 52.5R (average strength 61 N/mm2) | 424 |
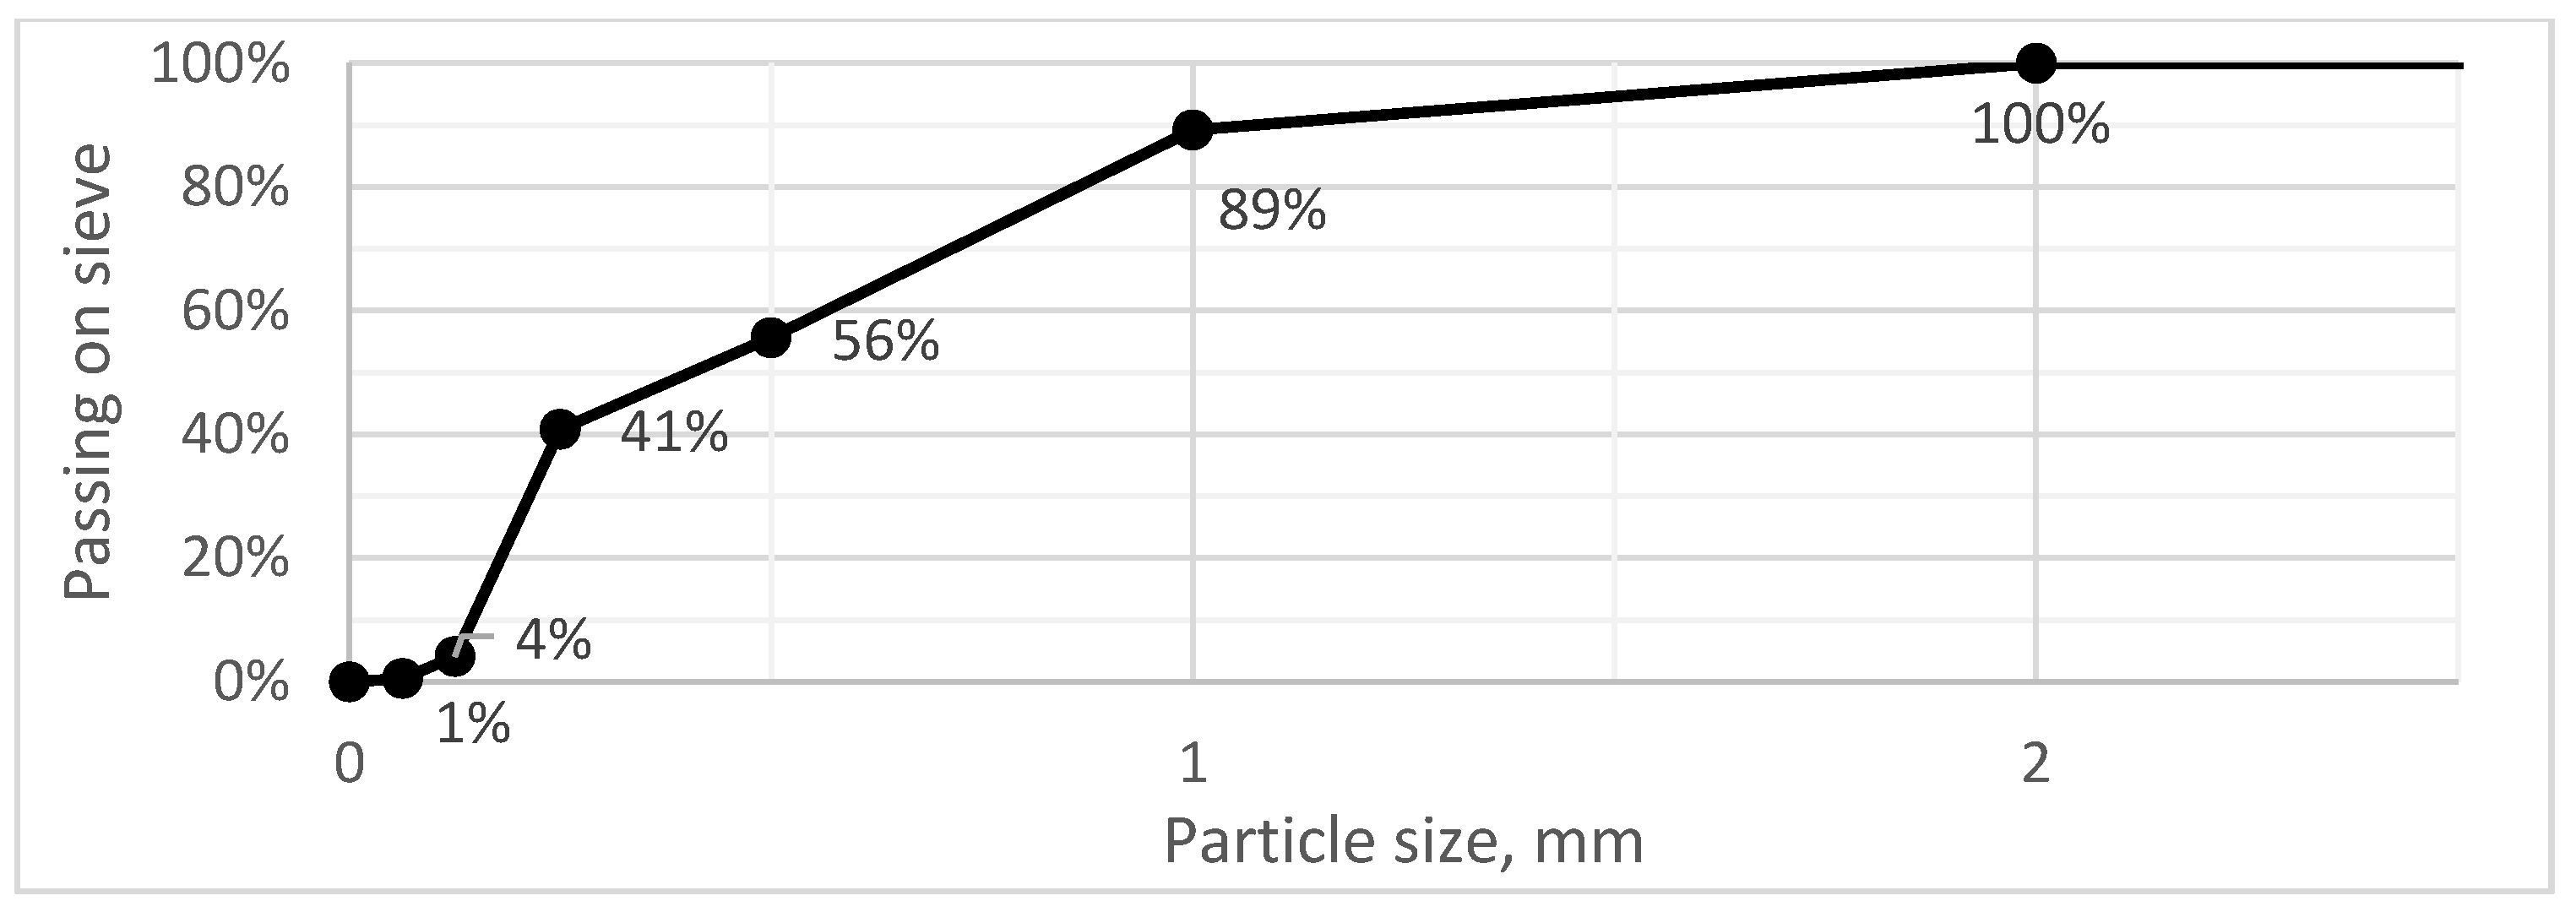
| Sand 0–1.5 mm (silica sand, Figure 1) | 1271 |
| Water, potable | 246 |
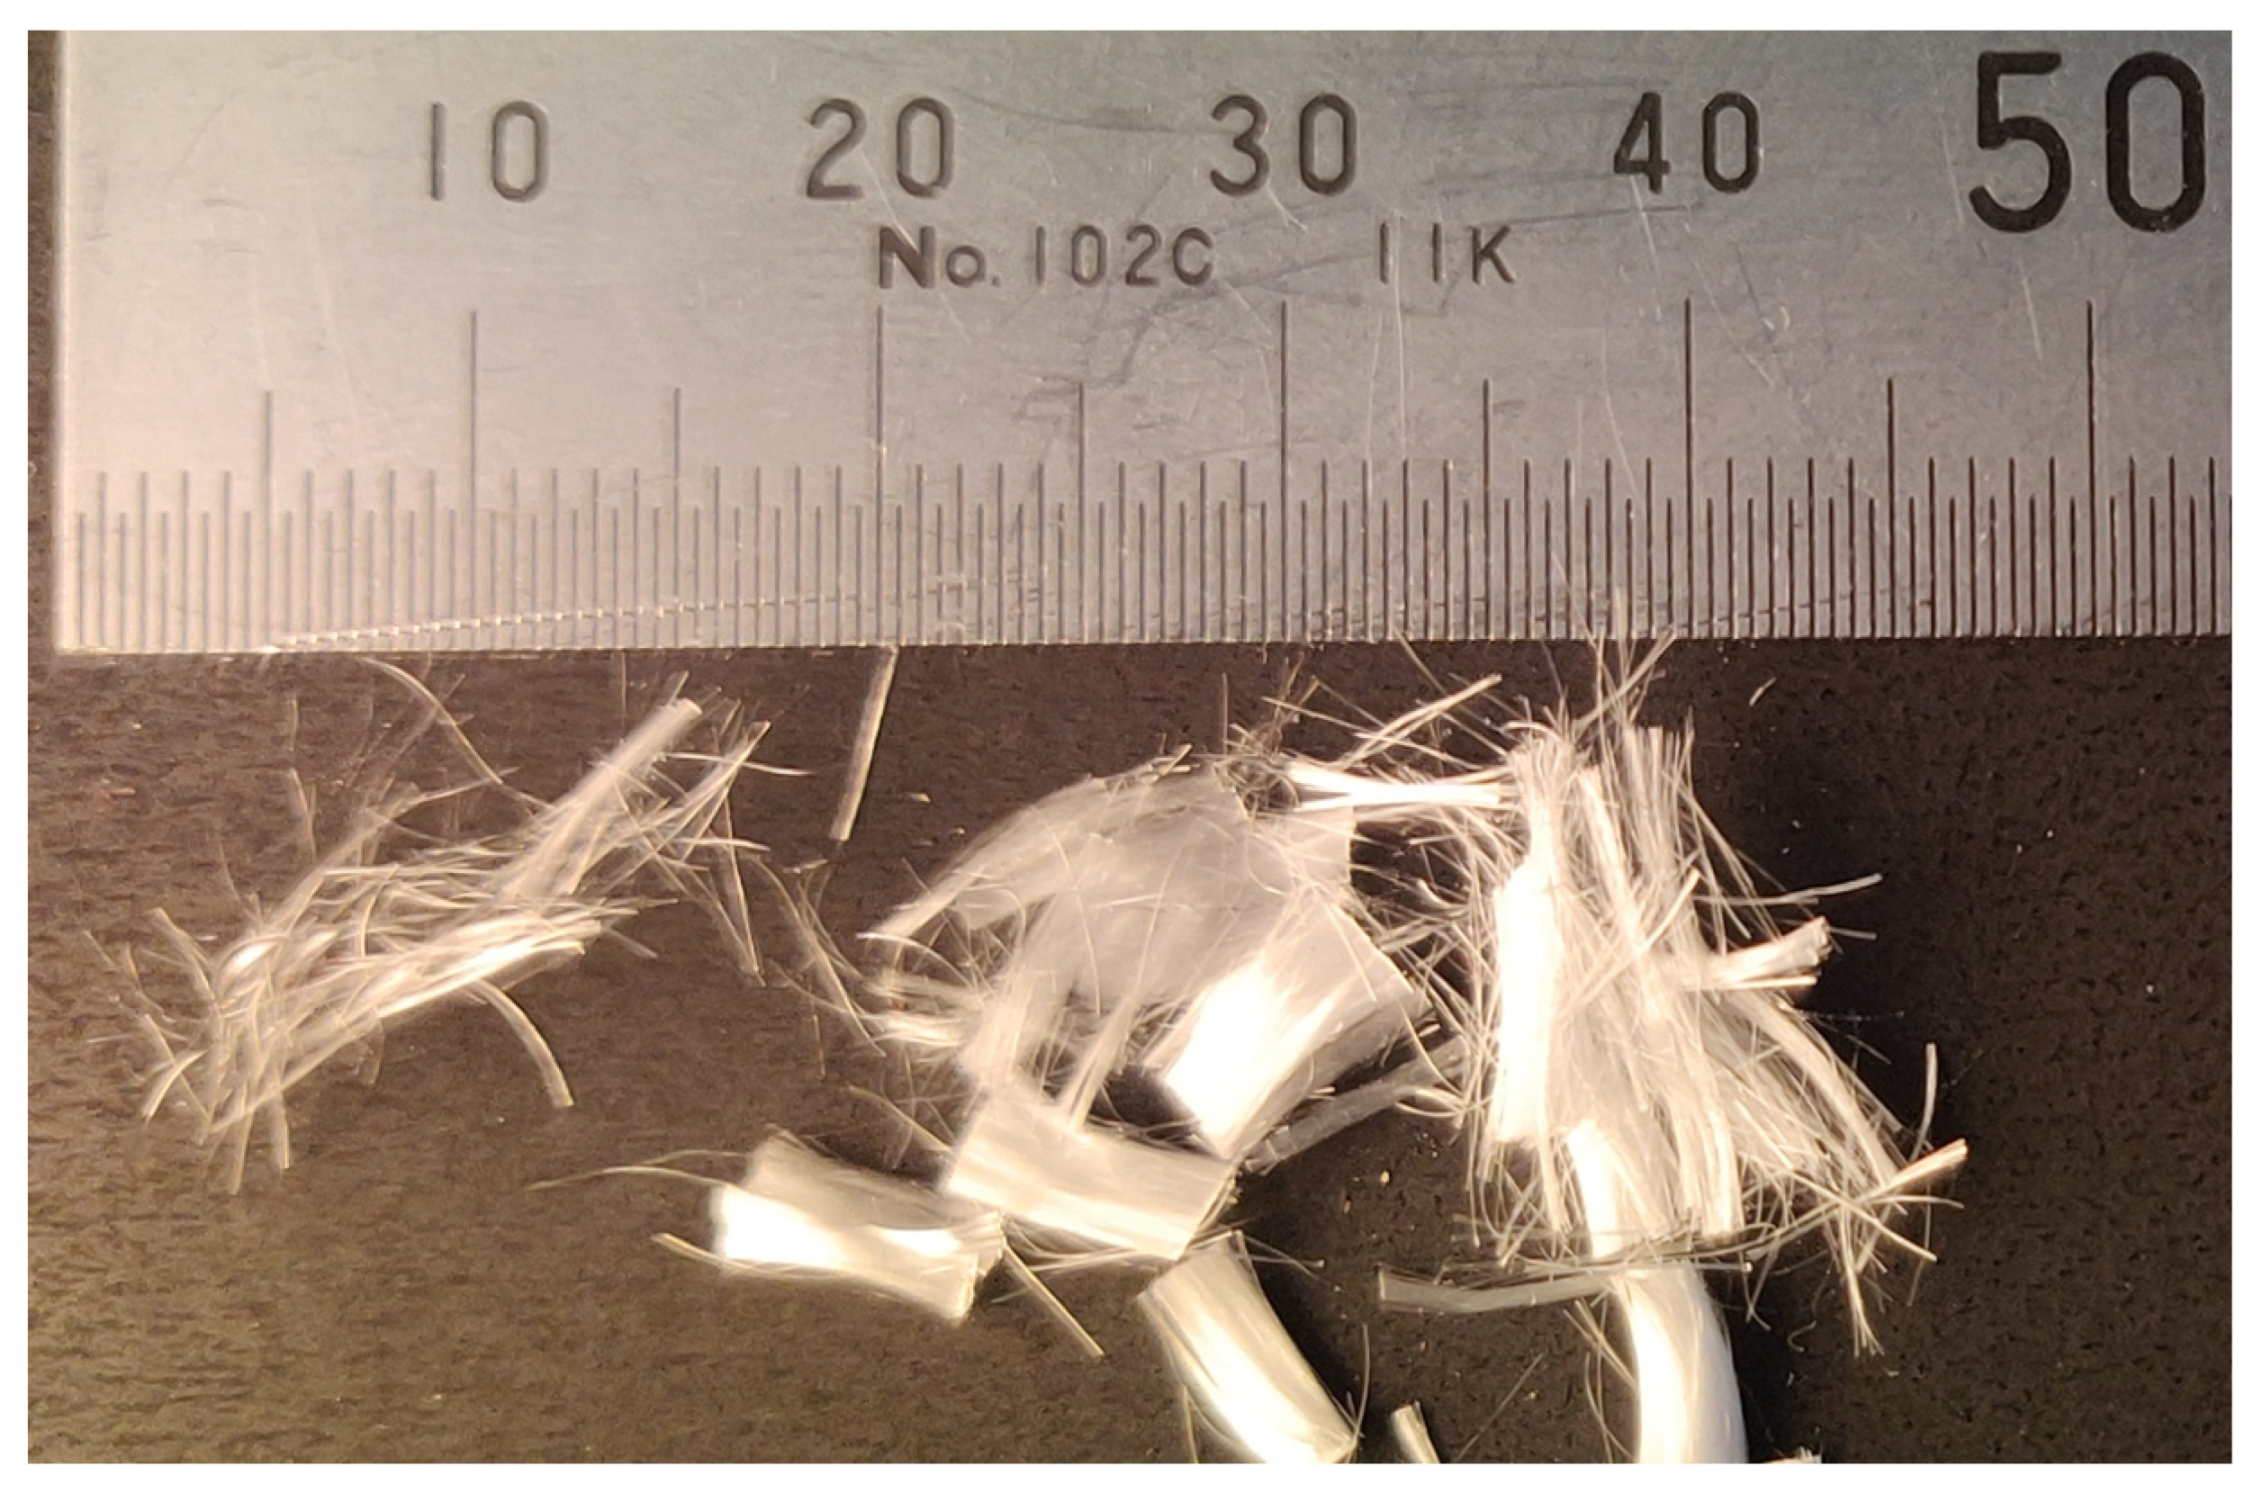
| Polypropylene (PP) fibres (Figure 2) | 0.8 |
| Dosage, % of Cement | |
| Super-plasticizer, polycarboxylate ethers | 0.08% |
| Set-accelerator, calcium formate | 1.0% |
| Dosage, % of Dry Mix | |
| VMA, methyl ethyl hydroxyethyl cellulose (MEHEC) | 1.0% |
The mixing was conducted in two steps. For dry mixing, a planetary pan mixer with a vertical shaft was used (SoRoTo 40L-30, 40 L capacity, 30 rpm, 0.75 kW, SoRoTo A/S, Glostrup, Denmark). The mixing time was 10 min per batch to ensure an even distribution of the polypropylene fibres and powdered admixtures. After dry mixing, the produce was weighed and stored in 20 L airtight containers. The total amount of dry mix used was 180 kg for one test print.
For wet mixing, a larger mixer was used (Collomatic TMS 2000, 100 L capacity, 42 rpm, 2.0 kW, Collomix Ruehr- und Mischgeraete GmbH, Gaimersheim, Germany). During wet mixing, the water was added in several batches. If the mix turned out not to be homogenous, the mortar was reloaded into the mixer and mixed again. The mixing time for the wet run was 10 min at minimum, after which the mortar was discharged to the pump’s hopper.
2.2. Printing and Curing
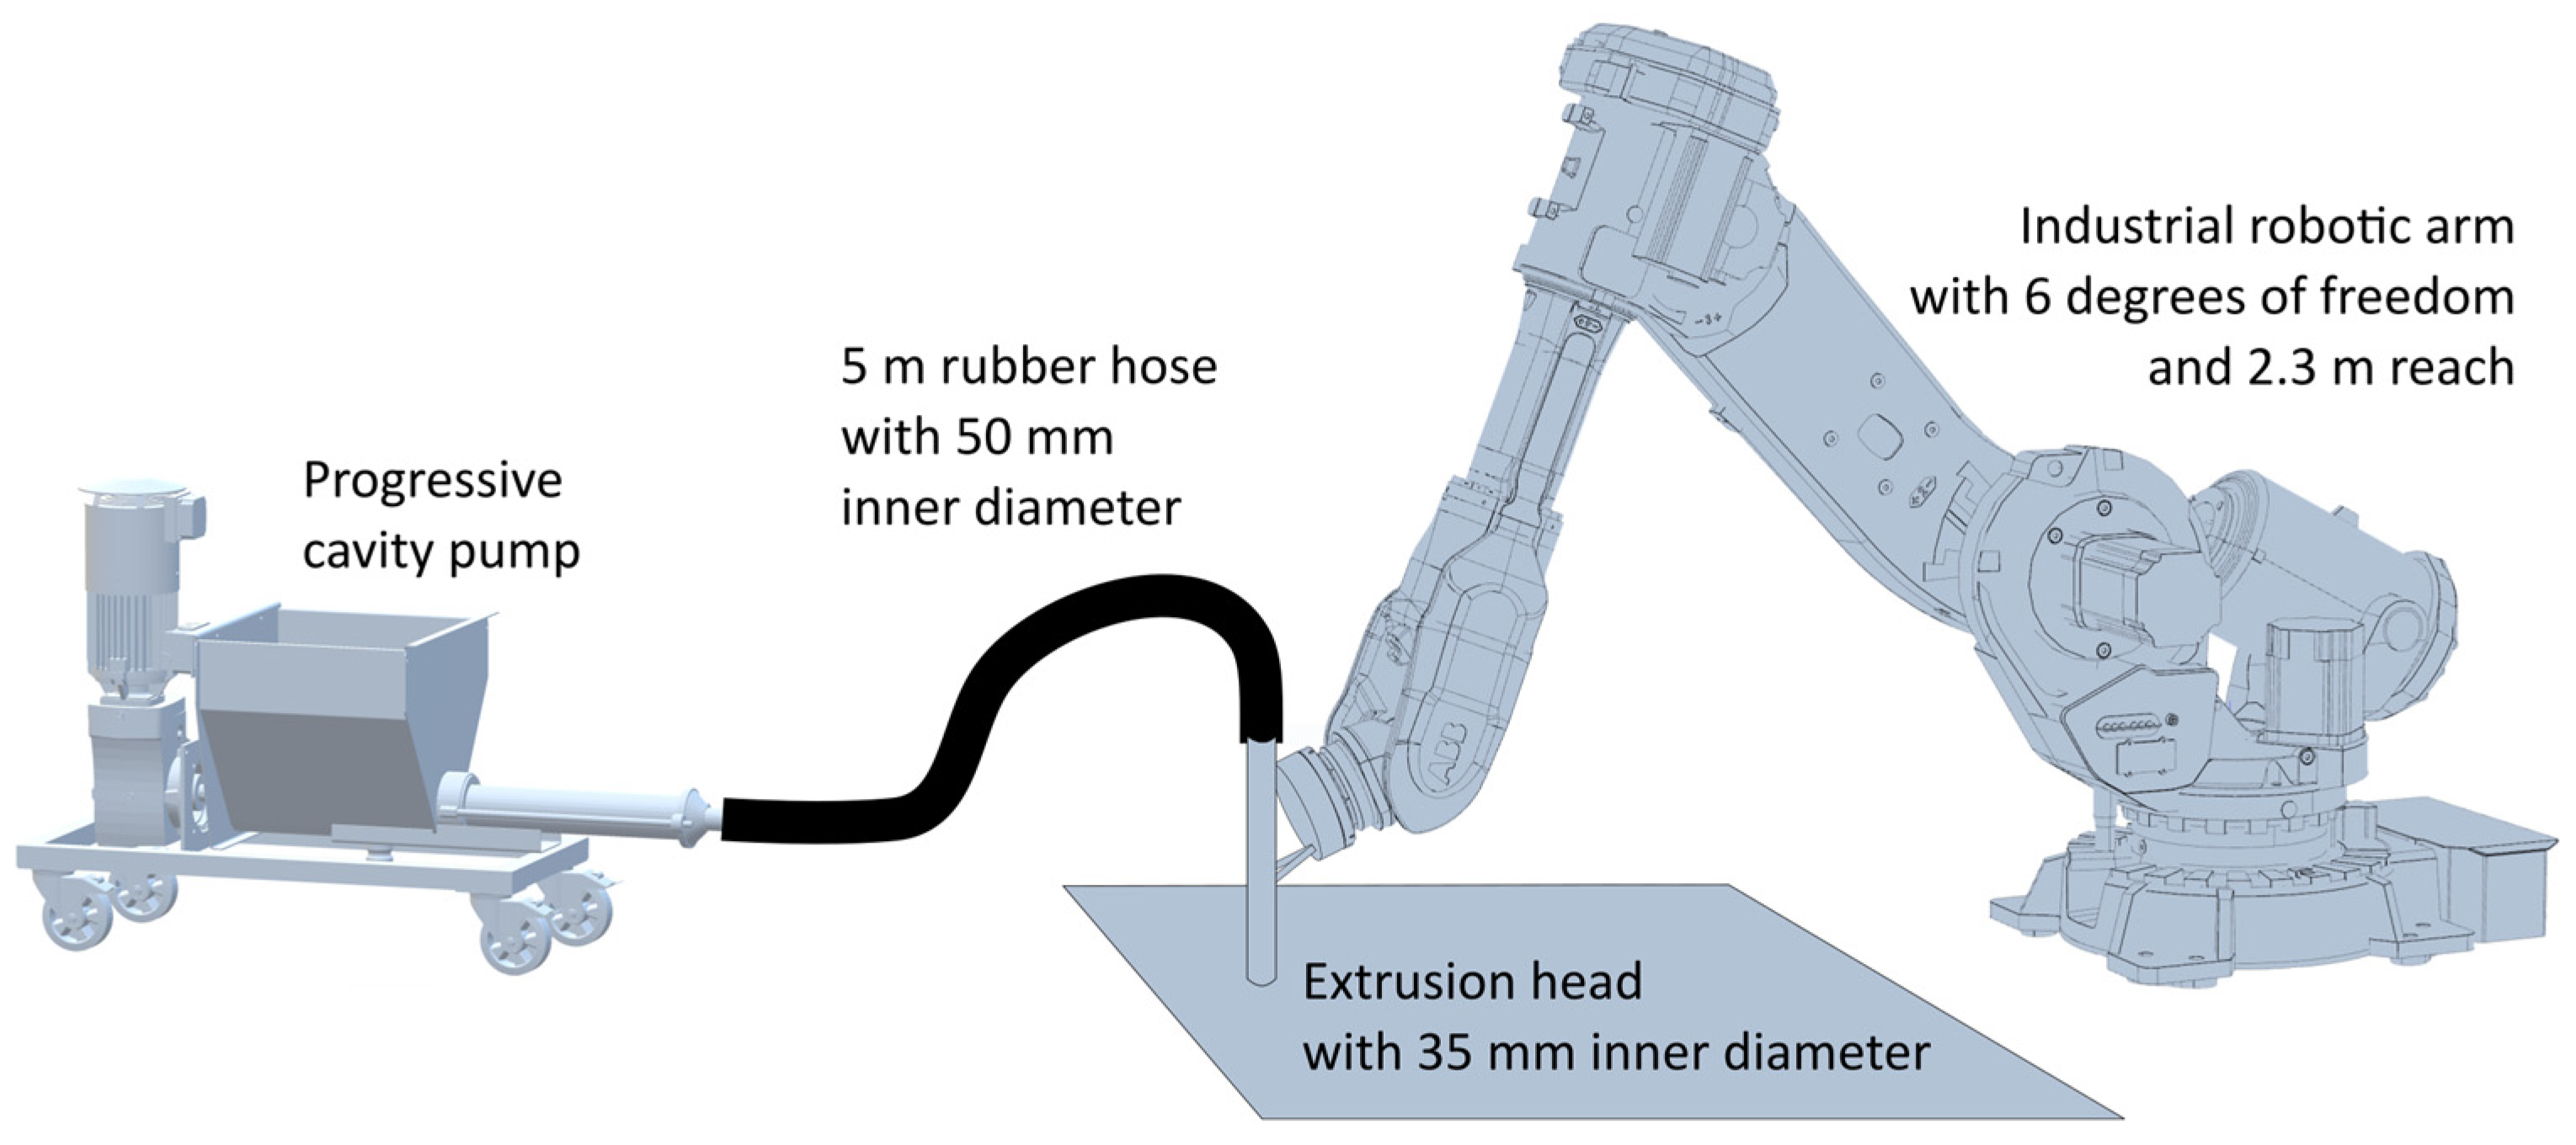
The printing system (Figure 3) included a custom progressing cavity pump suitable for up to 8 mm aggregate, with a 90 L hopper and variable pumping speed. A rubber hose with a 50 mm inner diameter and 5 m length was used. At the end of the hose there was a cylindrical pipe, with a 35 mm inner diameter, where the material was extruded. A smaller diameter ending was useful to prevent dripping of the material from the vertical pipe. The pipe was moved by a six-axis industrial robot ABB IRB 6640-235/2.55 (ABB Ltd, Västerås, Sweden) at approximately 7 cm/s.
Because the robot arm is more responsive to speed changes than the pump, the speed of the robot arm was changed to achieve the desired width of the layers. The changes in the pump speed affected material deposition with an approximately 30 s delay, which was mostly caused by the flexibility of the hose. Since the wet mix was prepared in batches, extrusion time may have differed on a larger scale. Changes in the rheological properties have an enormous effect on the amount of concrete deposited at the same settings of the pump. This is especially important with low-cost mixes, which prohibits excessive use of admixtures.
The process started with priming the pump system with water. Using the pump and hoses without priming posed a high risk of congestion. When the water reached the extruding end of the hose, the excess water was removed from the hopper. The priming water was followed by the regular mix. The mix was compacted in the hopper using a portable needle vibrator. The first 3 litres of the mix exiting the line were disposed because of the initial higher water content. This process was mostly similar to the one used in ETH Zürich [27].
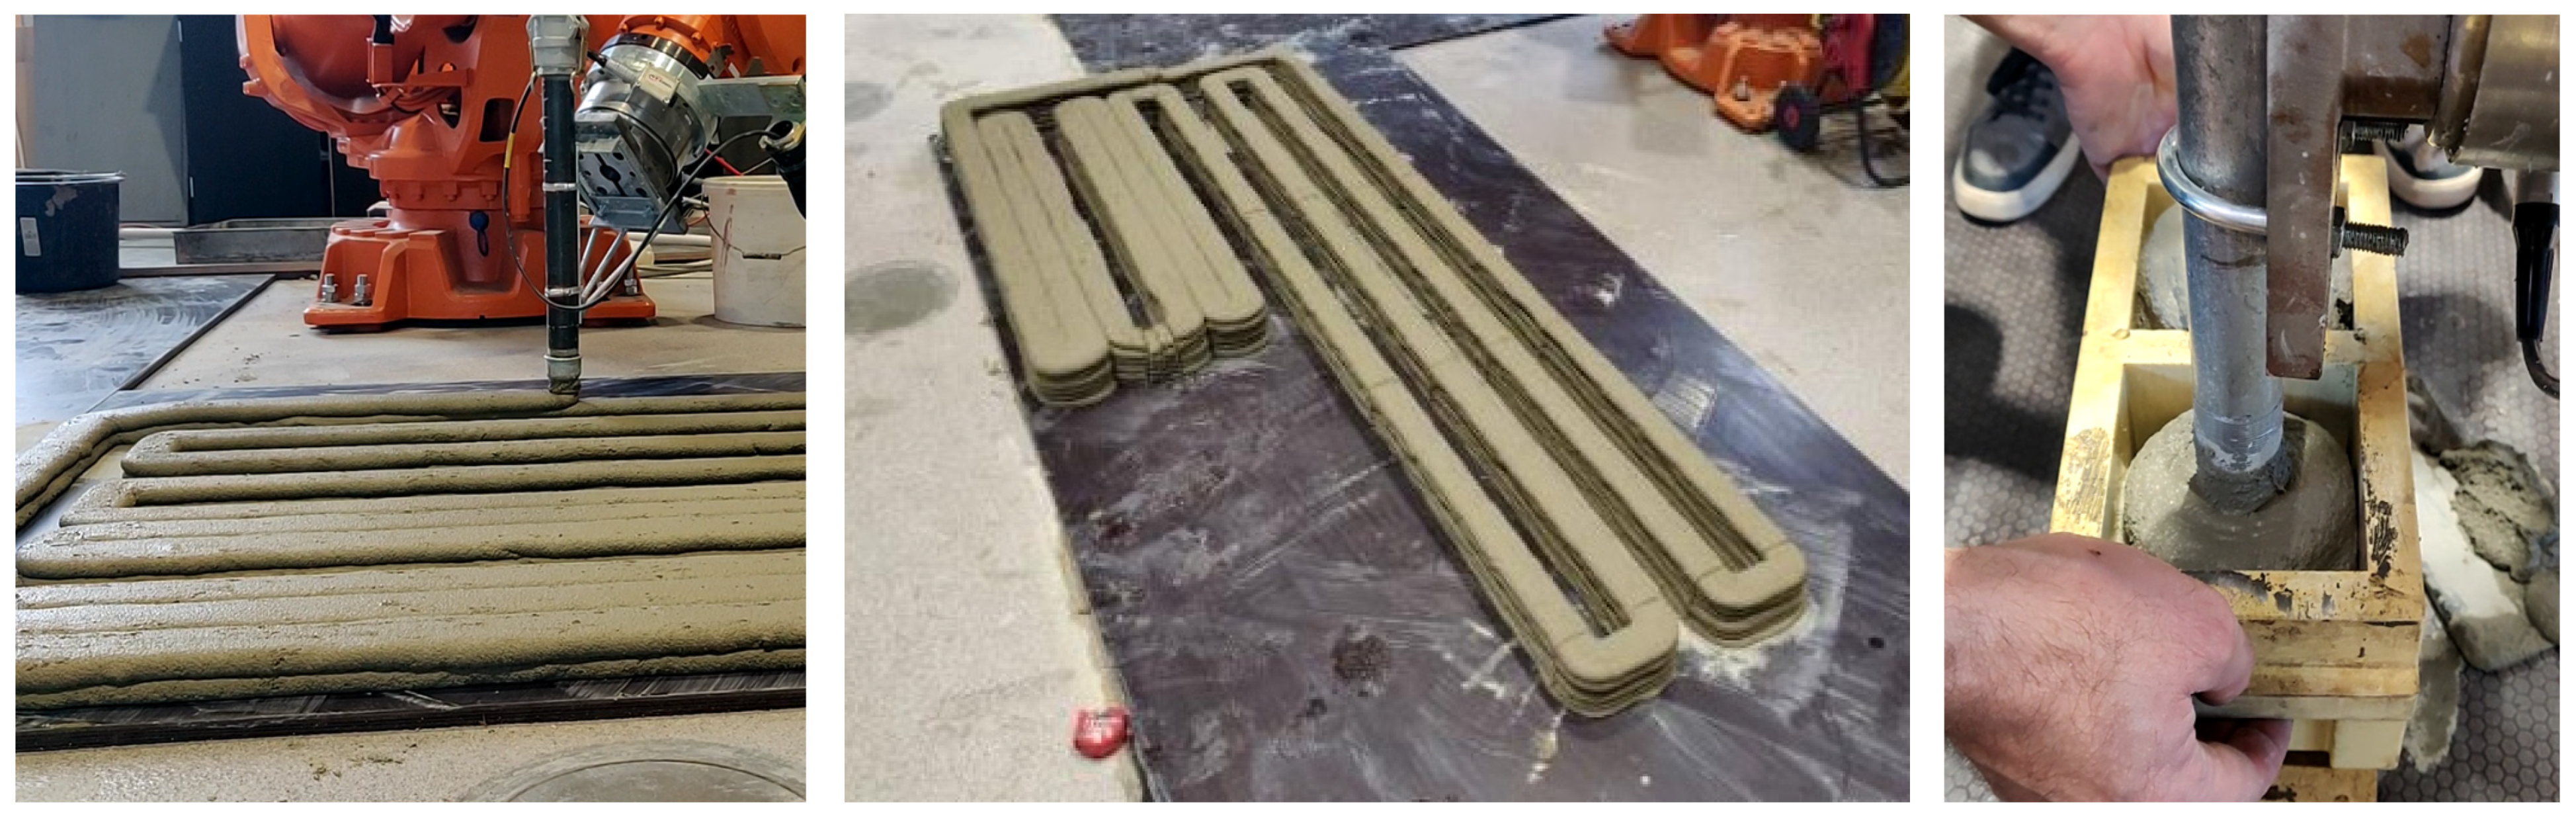
A small wall section with 15 layers was uninterruptedly printed to achieve the desired height of the wall. The printing was performed indoors in 20 ± 2 °C and 40 ± 10% RH environment. The curing conditions conformed to EN 12390-2 [28]. The printed wall (Figure 4) was covered with a PE film 15 min after the printing was complete. The specimens were then repeatedly sprayed with water to keep ≥95% humidity under the film until cutting.
The moulded specimens were made by filling the moulds directly from the nozzle of the 3D printer mortar line (Figure 4) and filled in one layer. After that, the mould was placed on a vibrating table or until the extraction of large air bubbles stopped, which took at least 20 s. The cubes were unmoulded the next day and cured in a 20 ± 2 °C room covered with a PE film. The uniaxial compression of the cubes was tested according to EN 12390-3 [29] at the age of 28 days.
2.3. Acquisition of Specimens and Testing
The wall was divided into sections using vertical cuts while in the fresh state. Up to two days before the testing, the specimens were cut from the wall sections using a conventional rotary stone saw. The loading surfaces of the specimens were sanded and placed back into the water. The specimens were removed from the water less than 60 min before the test. The specimens were tested at the age of 3, 7, and 28 days in water-saturated states.
The water-saturated density at the time of the test was determined by weighing; the remaining parts of the specimens were dried in an oven at 105 °C until stabilisation after completing the destructive tests to determine the water content.
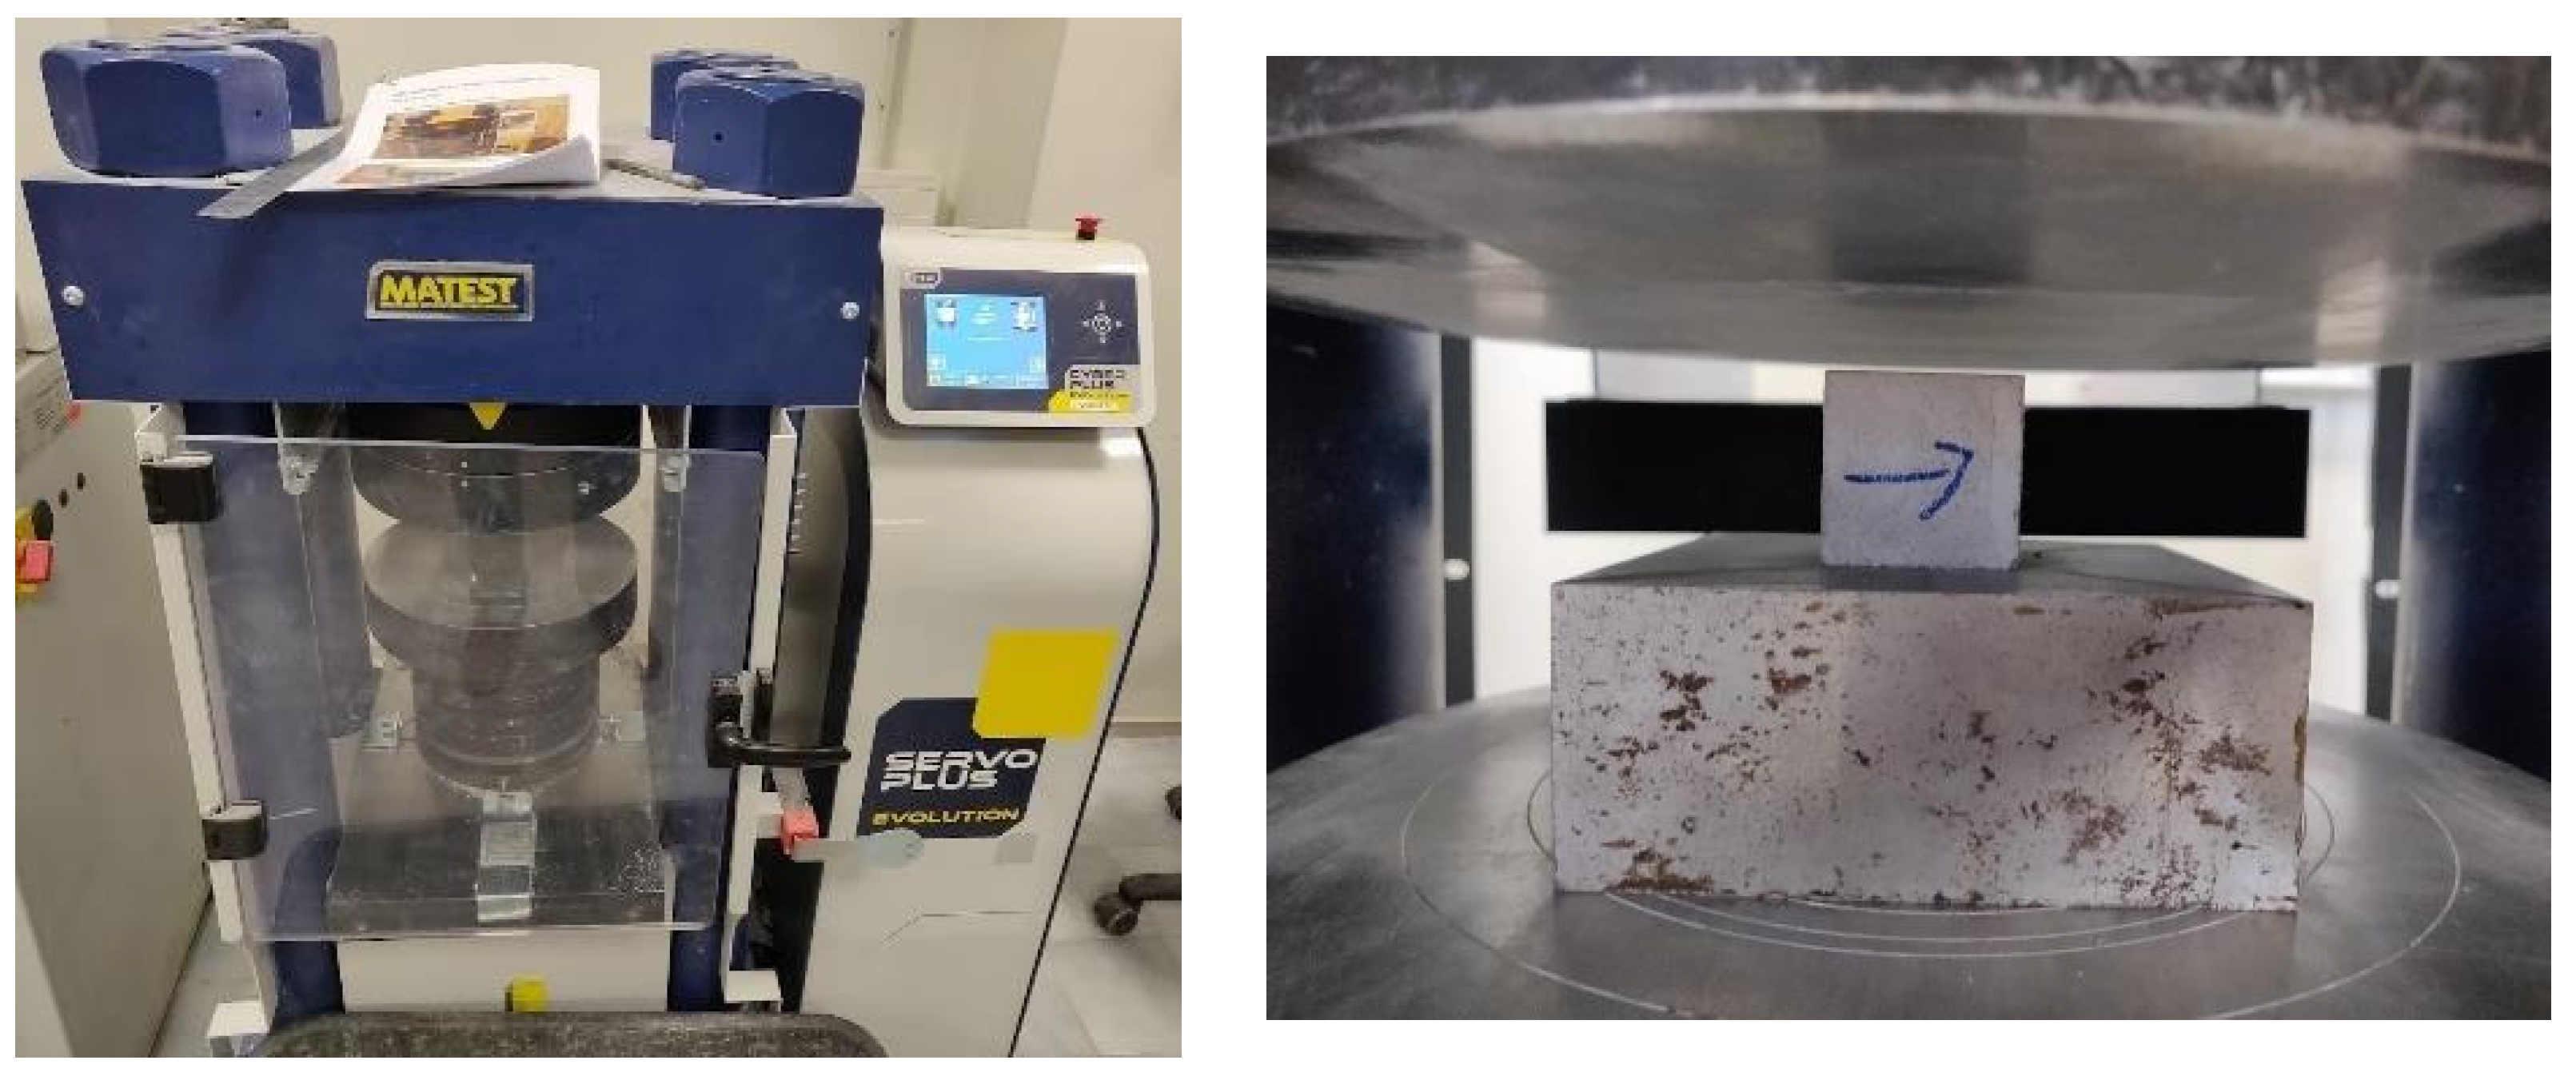
The compressive strength was tested using 40 mm cubes with uniaxial loading at 0.6 N/(mm2·s) in different directions relative to the direction of printing (Figure 5 and Figure 6). The testing procedure was in accordance with EN 12390-3 [29], except for the dimensions of the specimens.
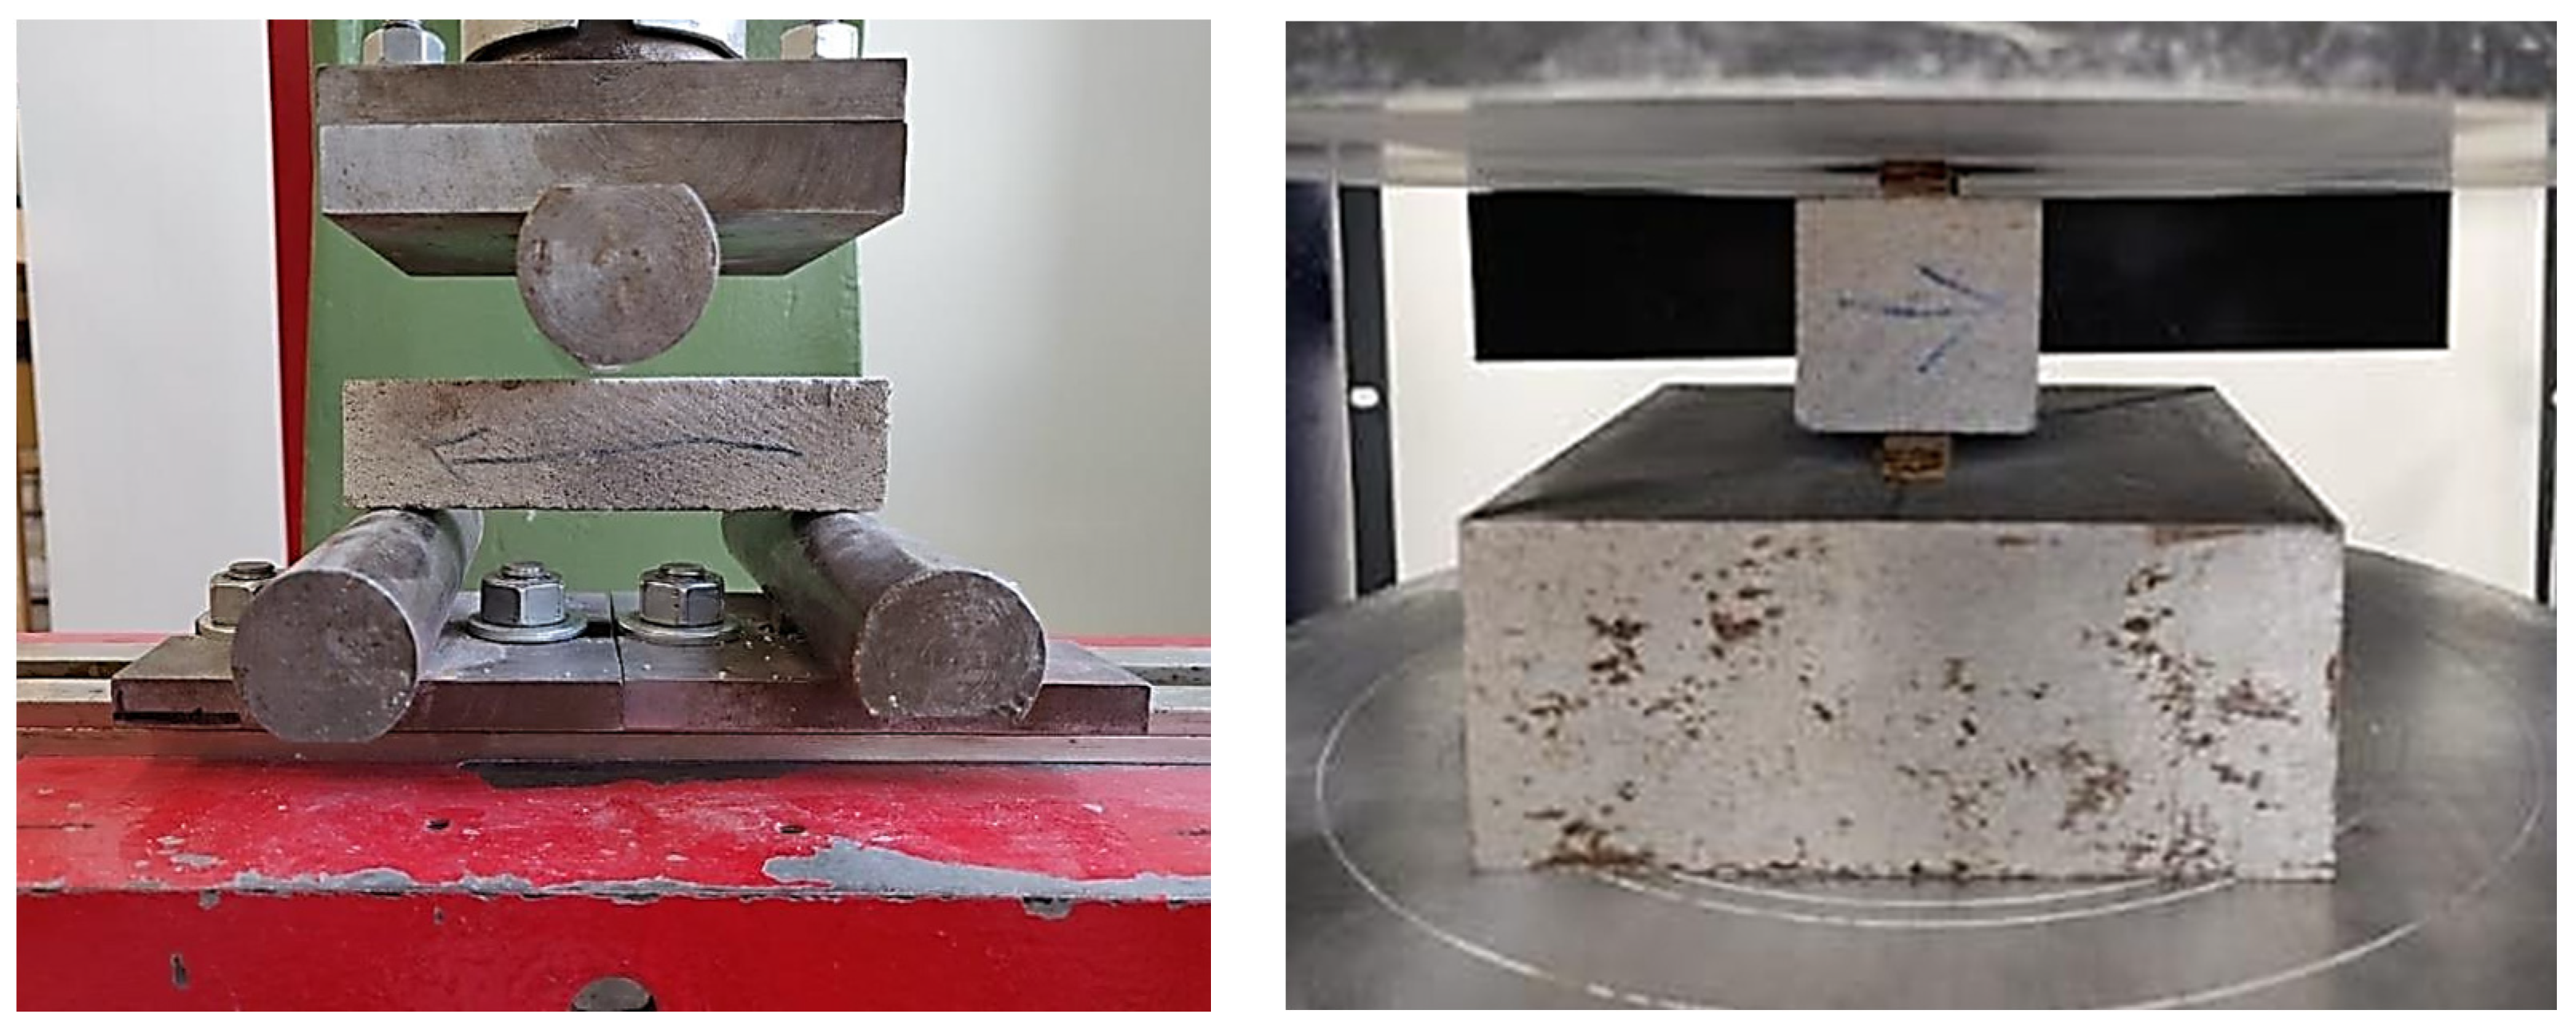
The flexural strength test method (Figure 7, left) was based on the Annex A of EN 12390-5 [30], with a support distance of 100 mm and specimen dimensions of 30 × 30 × 120 mm. The inclination of cylindrical supports was enabled, while the rotation of supports was not possible. The dimensions of the specimen were chosen because of practical concerns during cutting.
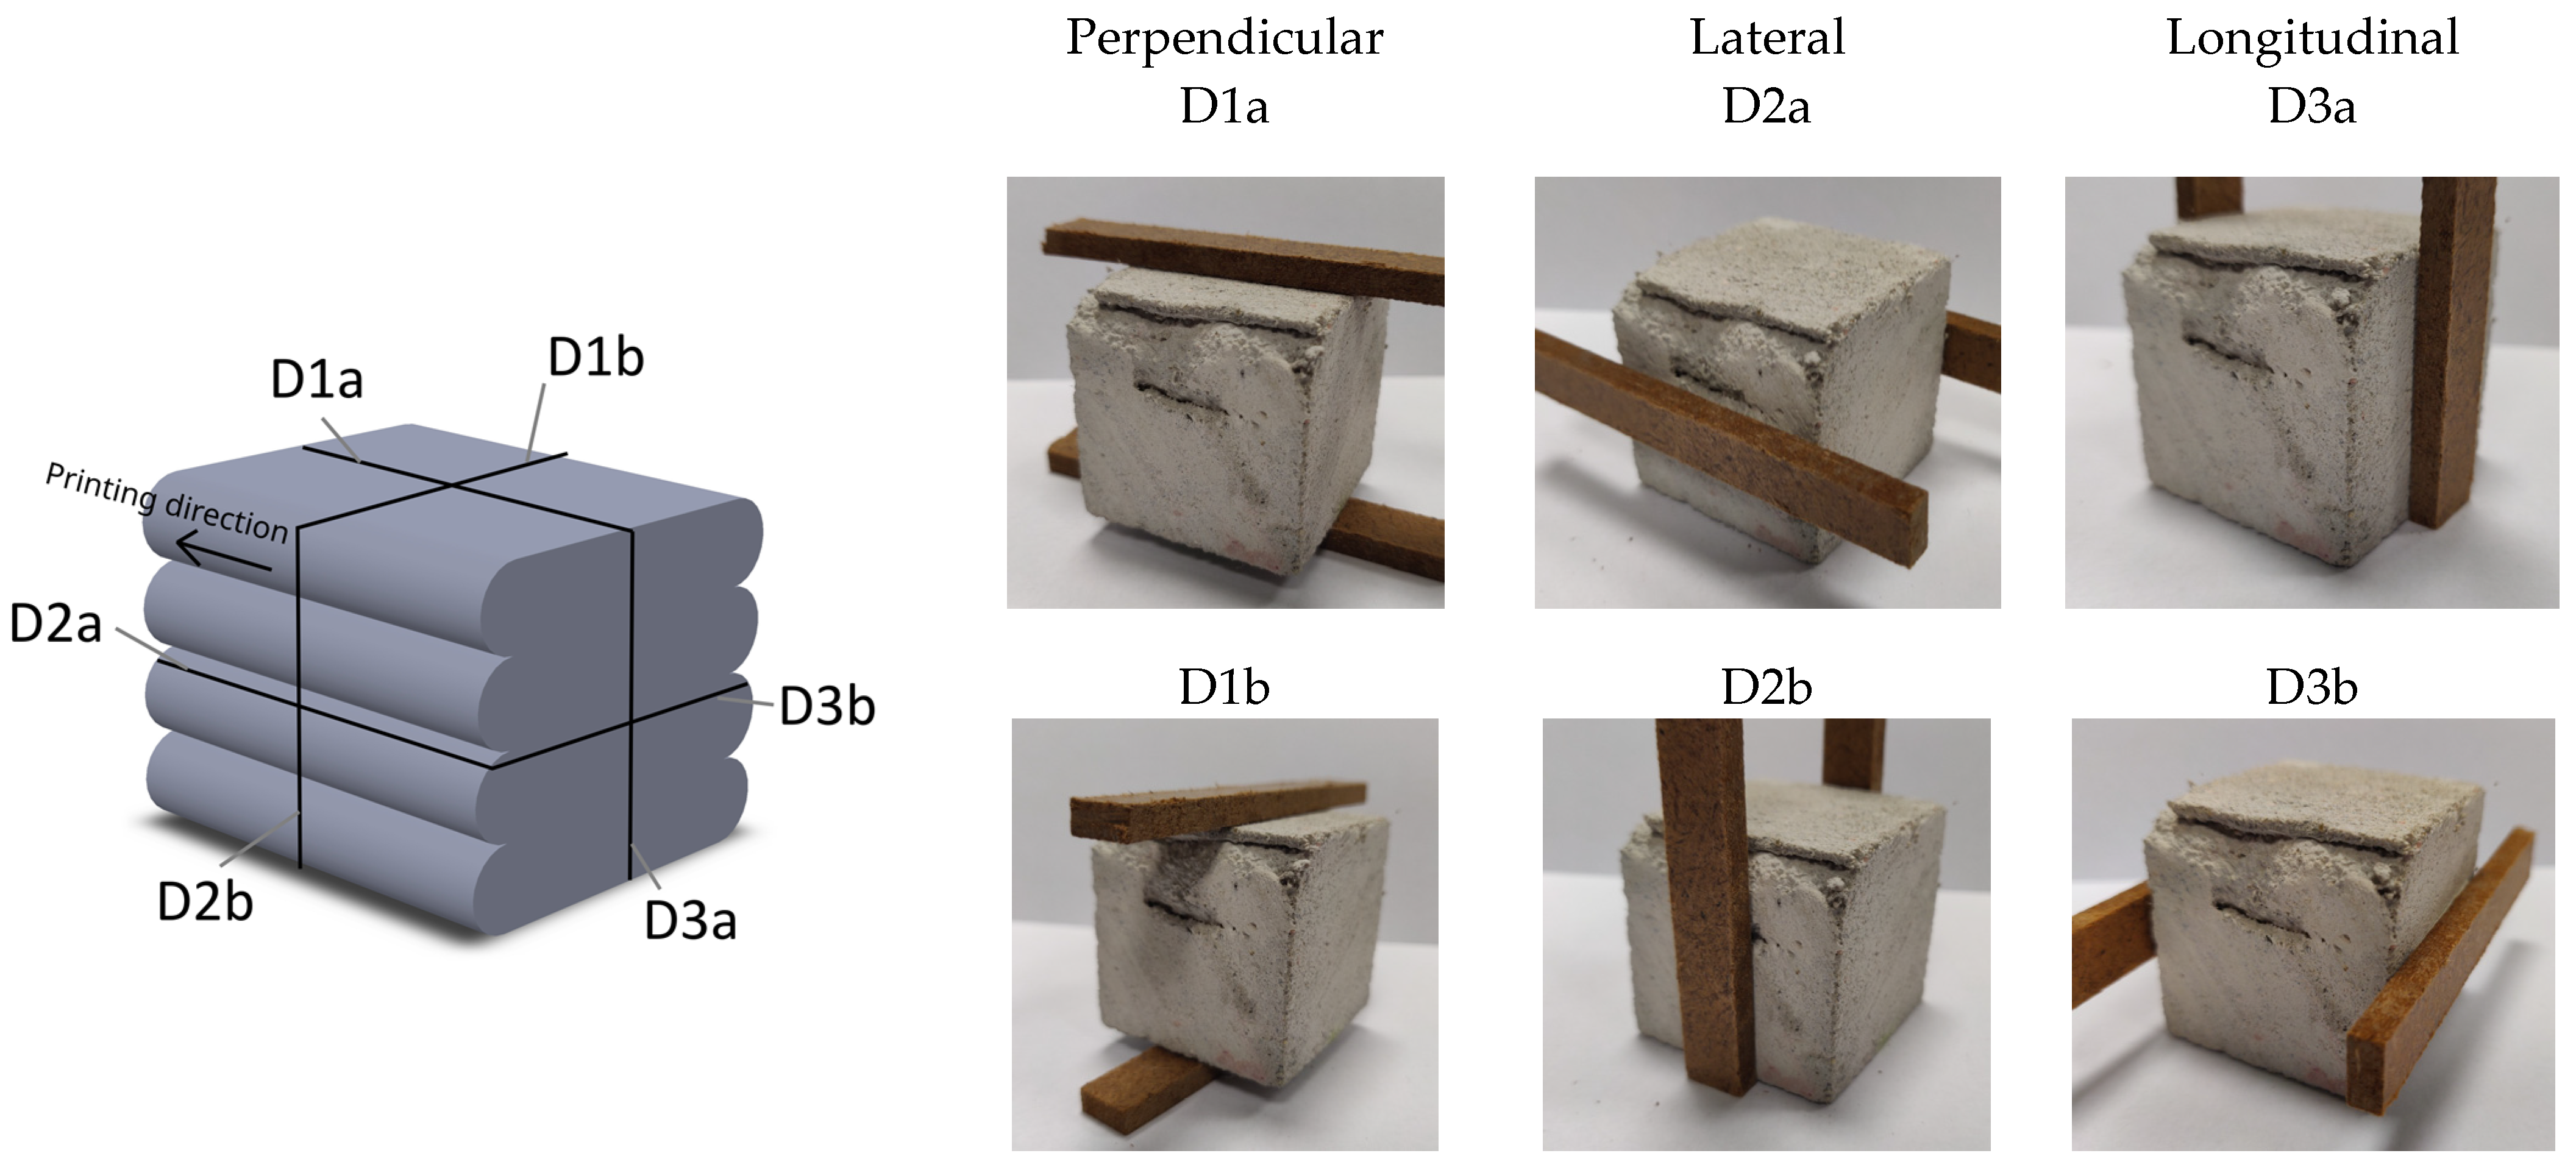
The splitting test setup was inspired by EN 12390-6 [31] (Figure 7, right). Instead of cylindrical loading surfaces, the loading plates had flat surfaces. Wood-fibre board strips, according to EN 316 [32] (10 mm in width, 4.5 mm thick, 1000 kg/m3 density), concentrated the force causing the splitting. The splitting test used 40 mm cubes identical to the specimens used in the compressive test. All six possible perpendicular splitting directions were tested (Figure 8).
Where the standard deviation of a group is shown on graphs, it was calculated using four or more samples from the group. The statistical t-test was used to find the significance of the results using a 0.05 threshold.
3. Results and Discussion
3.1. Compressive Strength
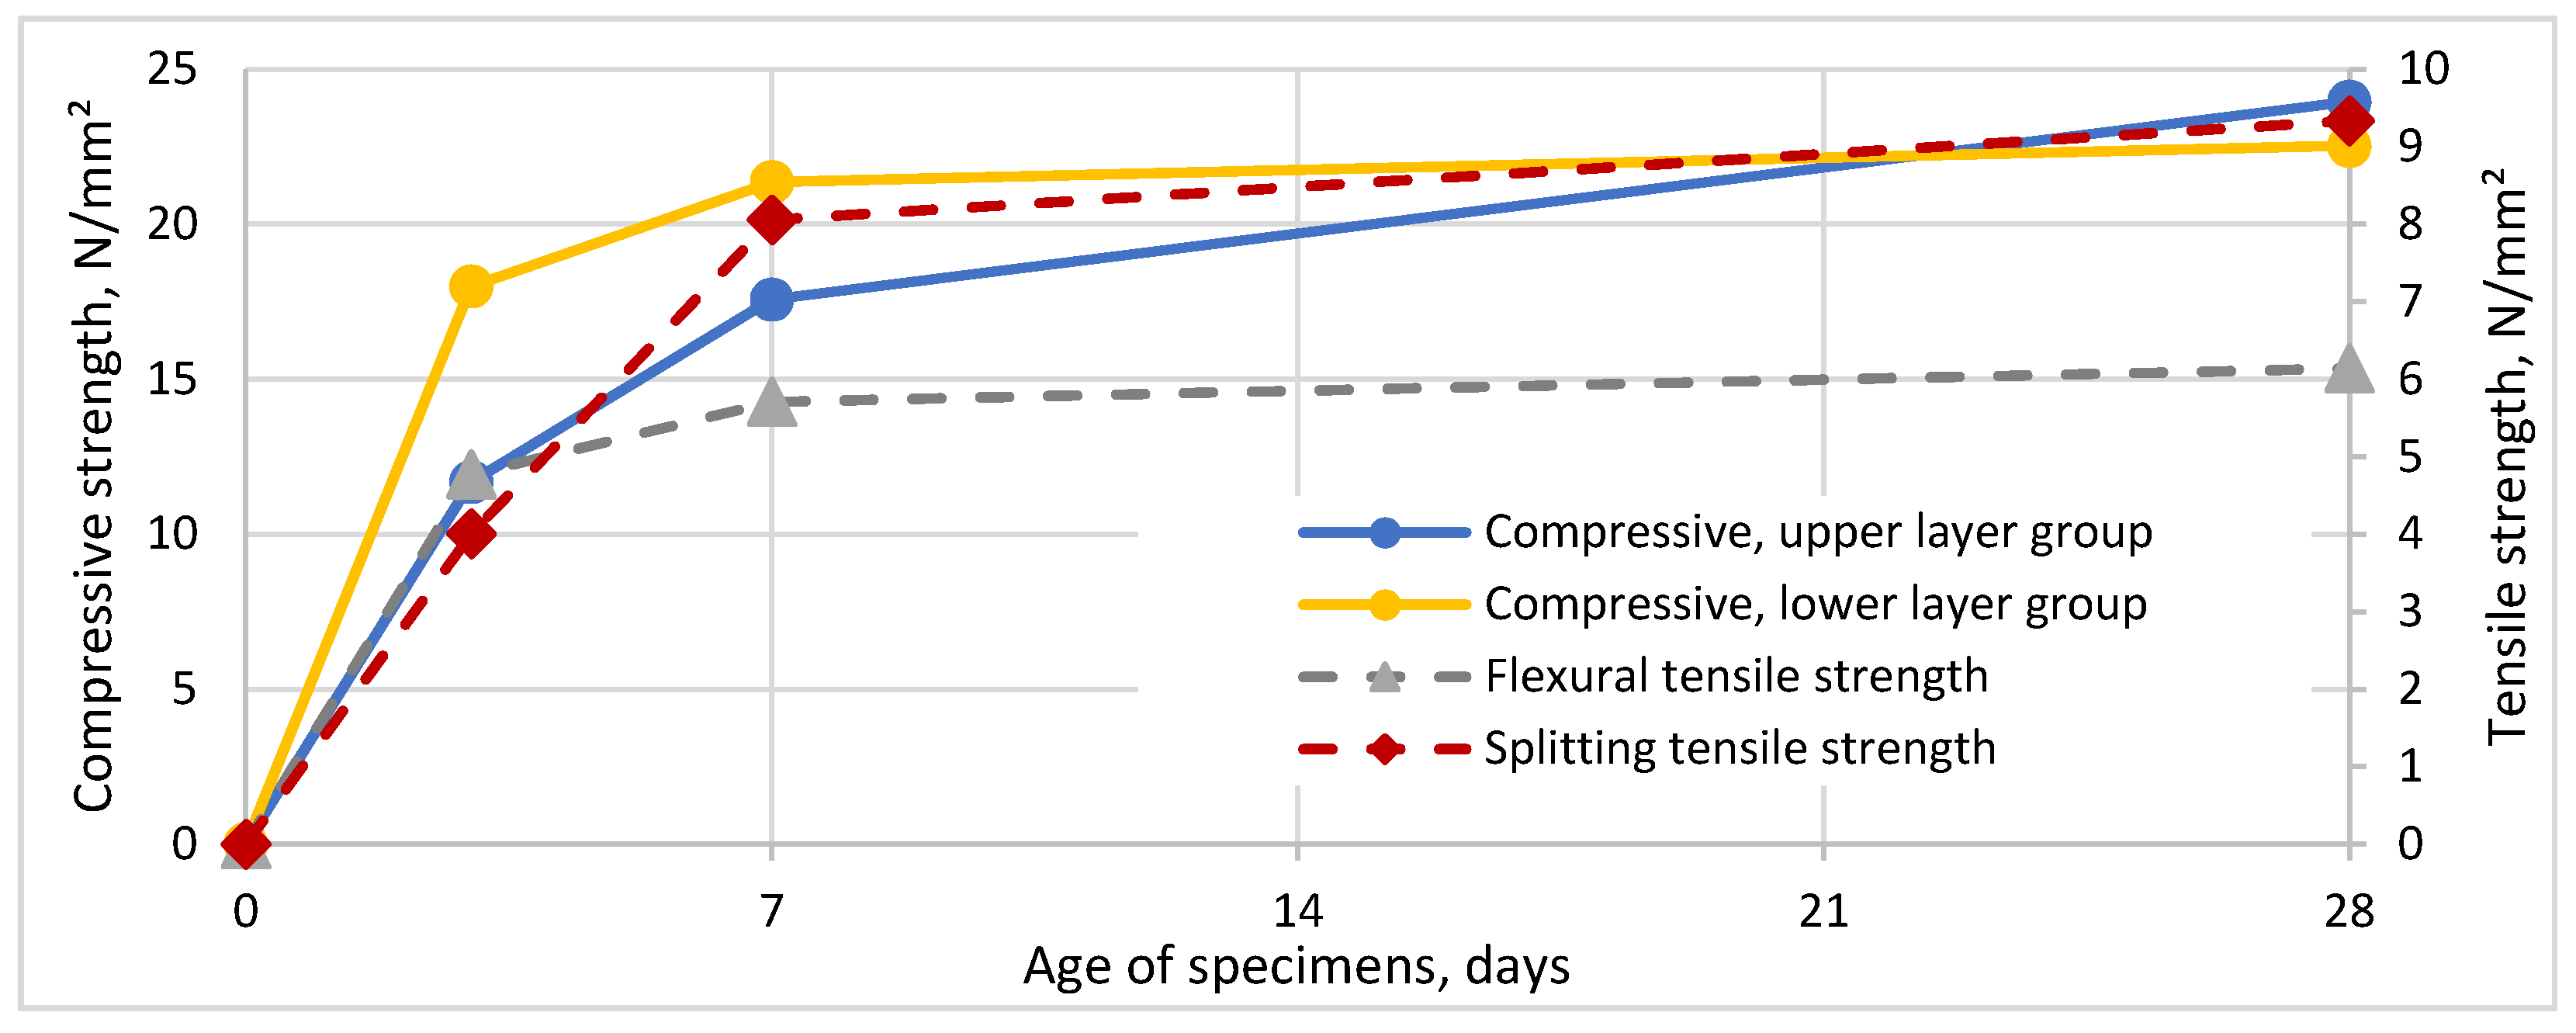
Due to the use of cement with a high early strength, the compressive strength at 7 days was, on average, 84% of the 28-day strength (Figure 9), reducing the impact of later curing conditions. An increase in strength after 7 days was especially unimportant for tensile strength.
The difference in compressive strength at 3 and 7 days between the upper and the lower layer groups appeared significant, with p = 0.001 and p = 0.02. This could have been caused by the temperature difference of the layers due to the possibly lower temperature near the floor; not ideal curing conditions because of possible air leaks of PE film cover or something else. Finding the cause requires further research.
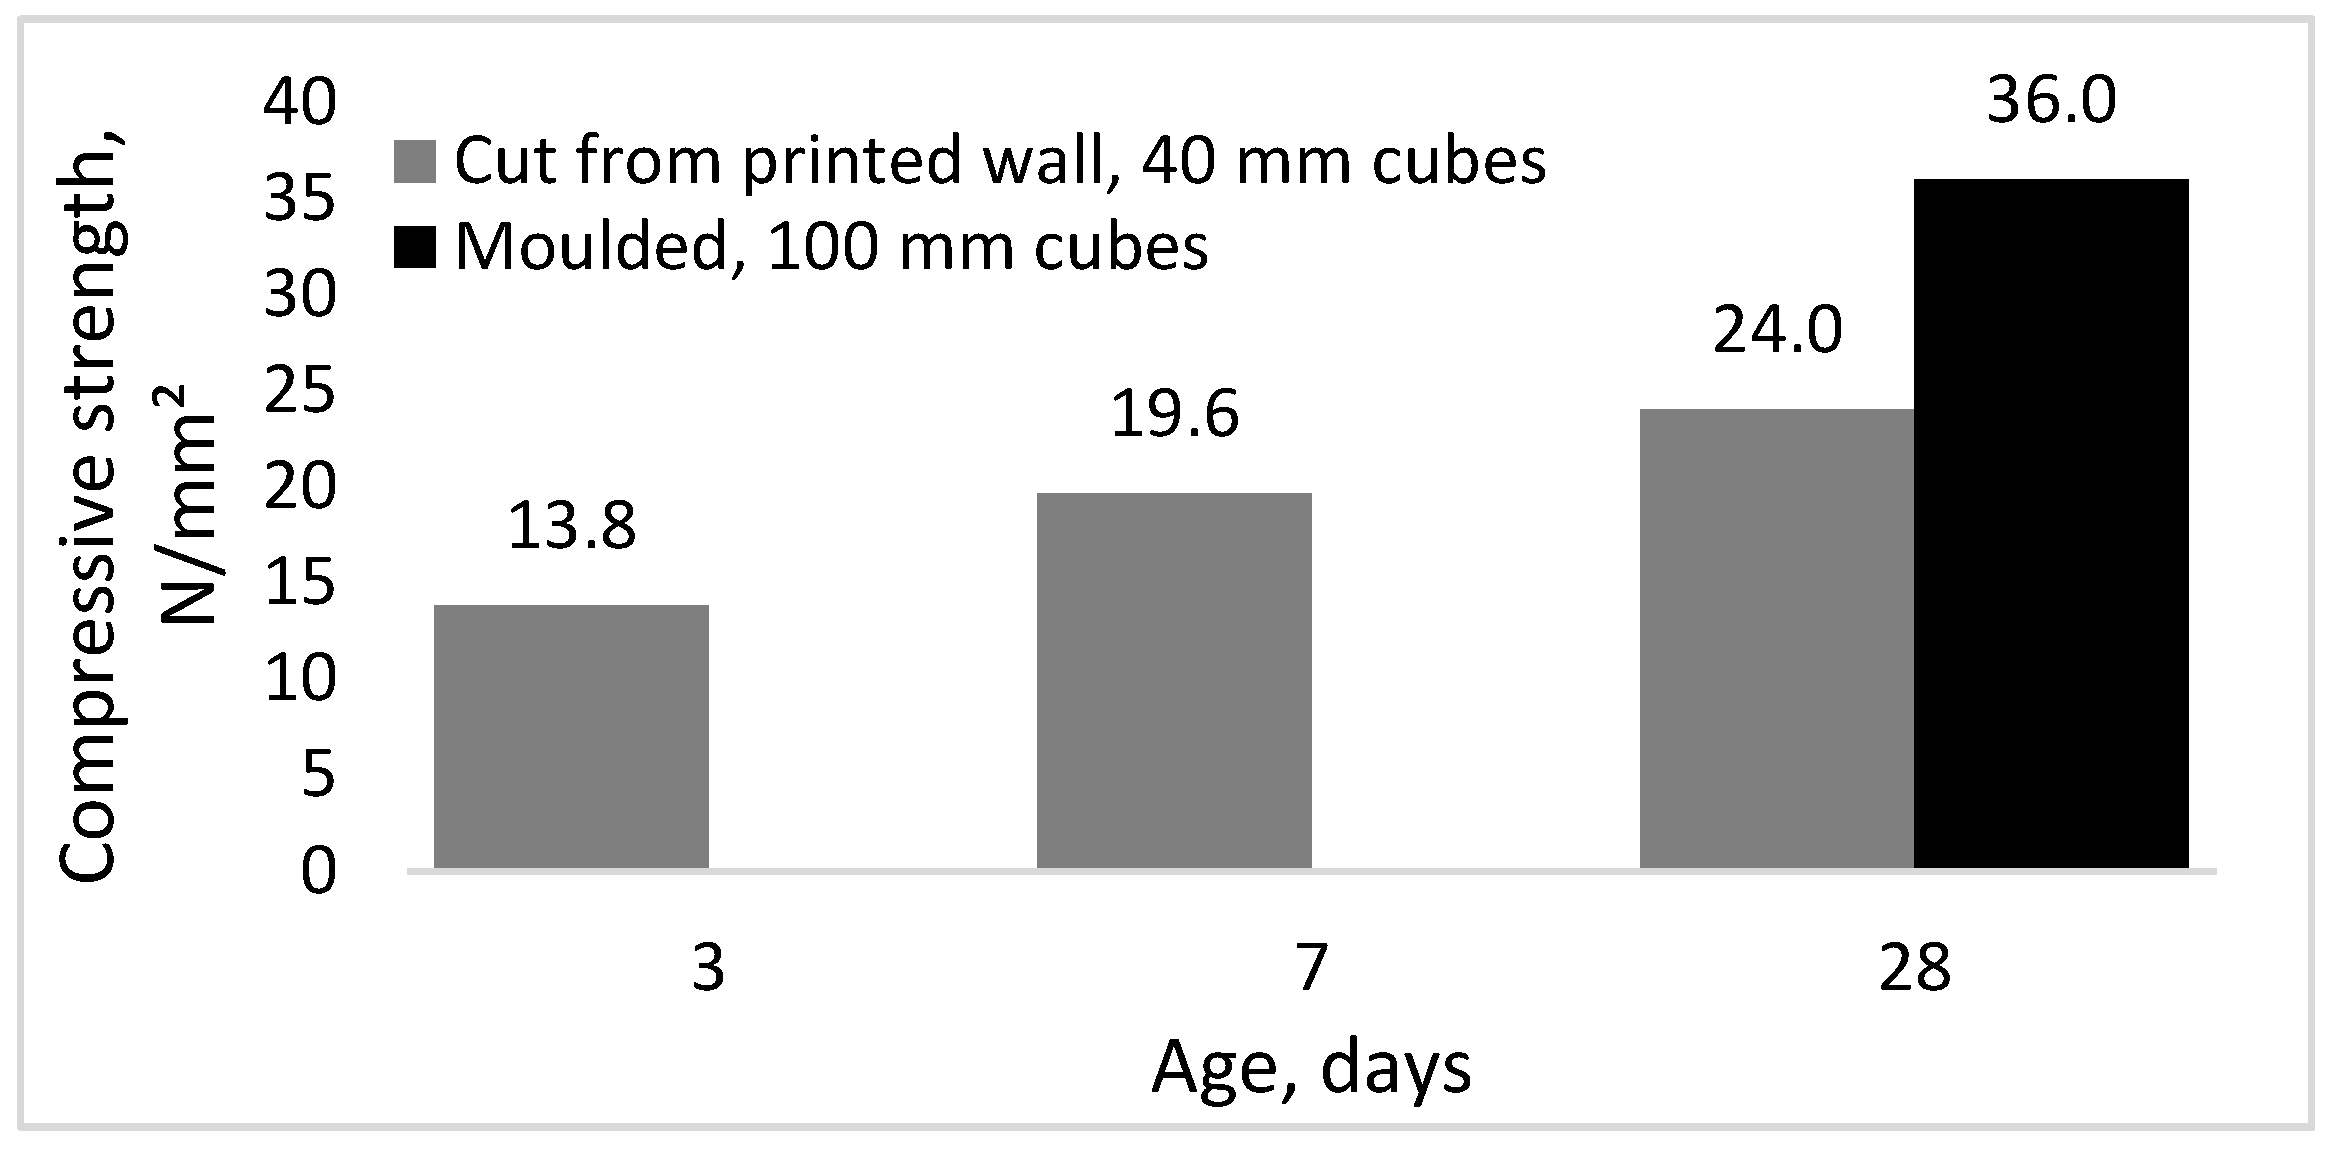
Using 100 mm compacted cubes with the same mix resulted in an average strength of 36.0 N/mm2 (n = 36, average apparent density 1912 kg/m3), which indicates that the increased porosity and other effects of printing process caused a 33% reduction in the compressive strength. The size effect of the specimens further increased the difference but was unaccounted for.
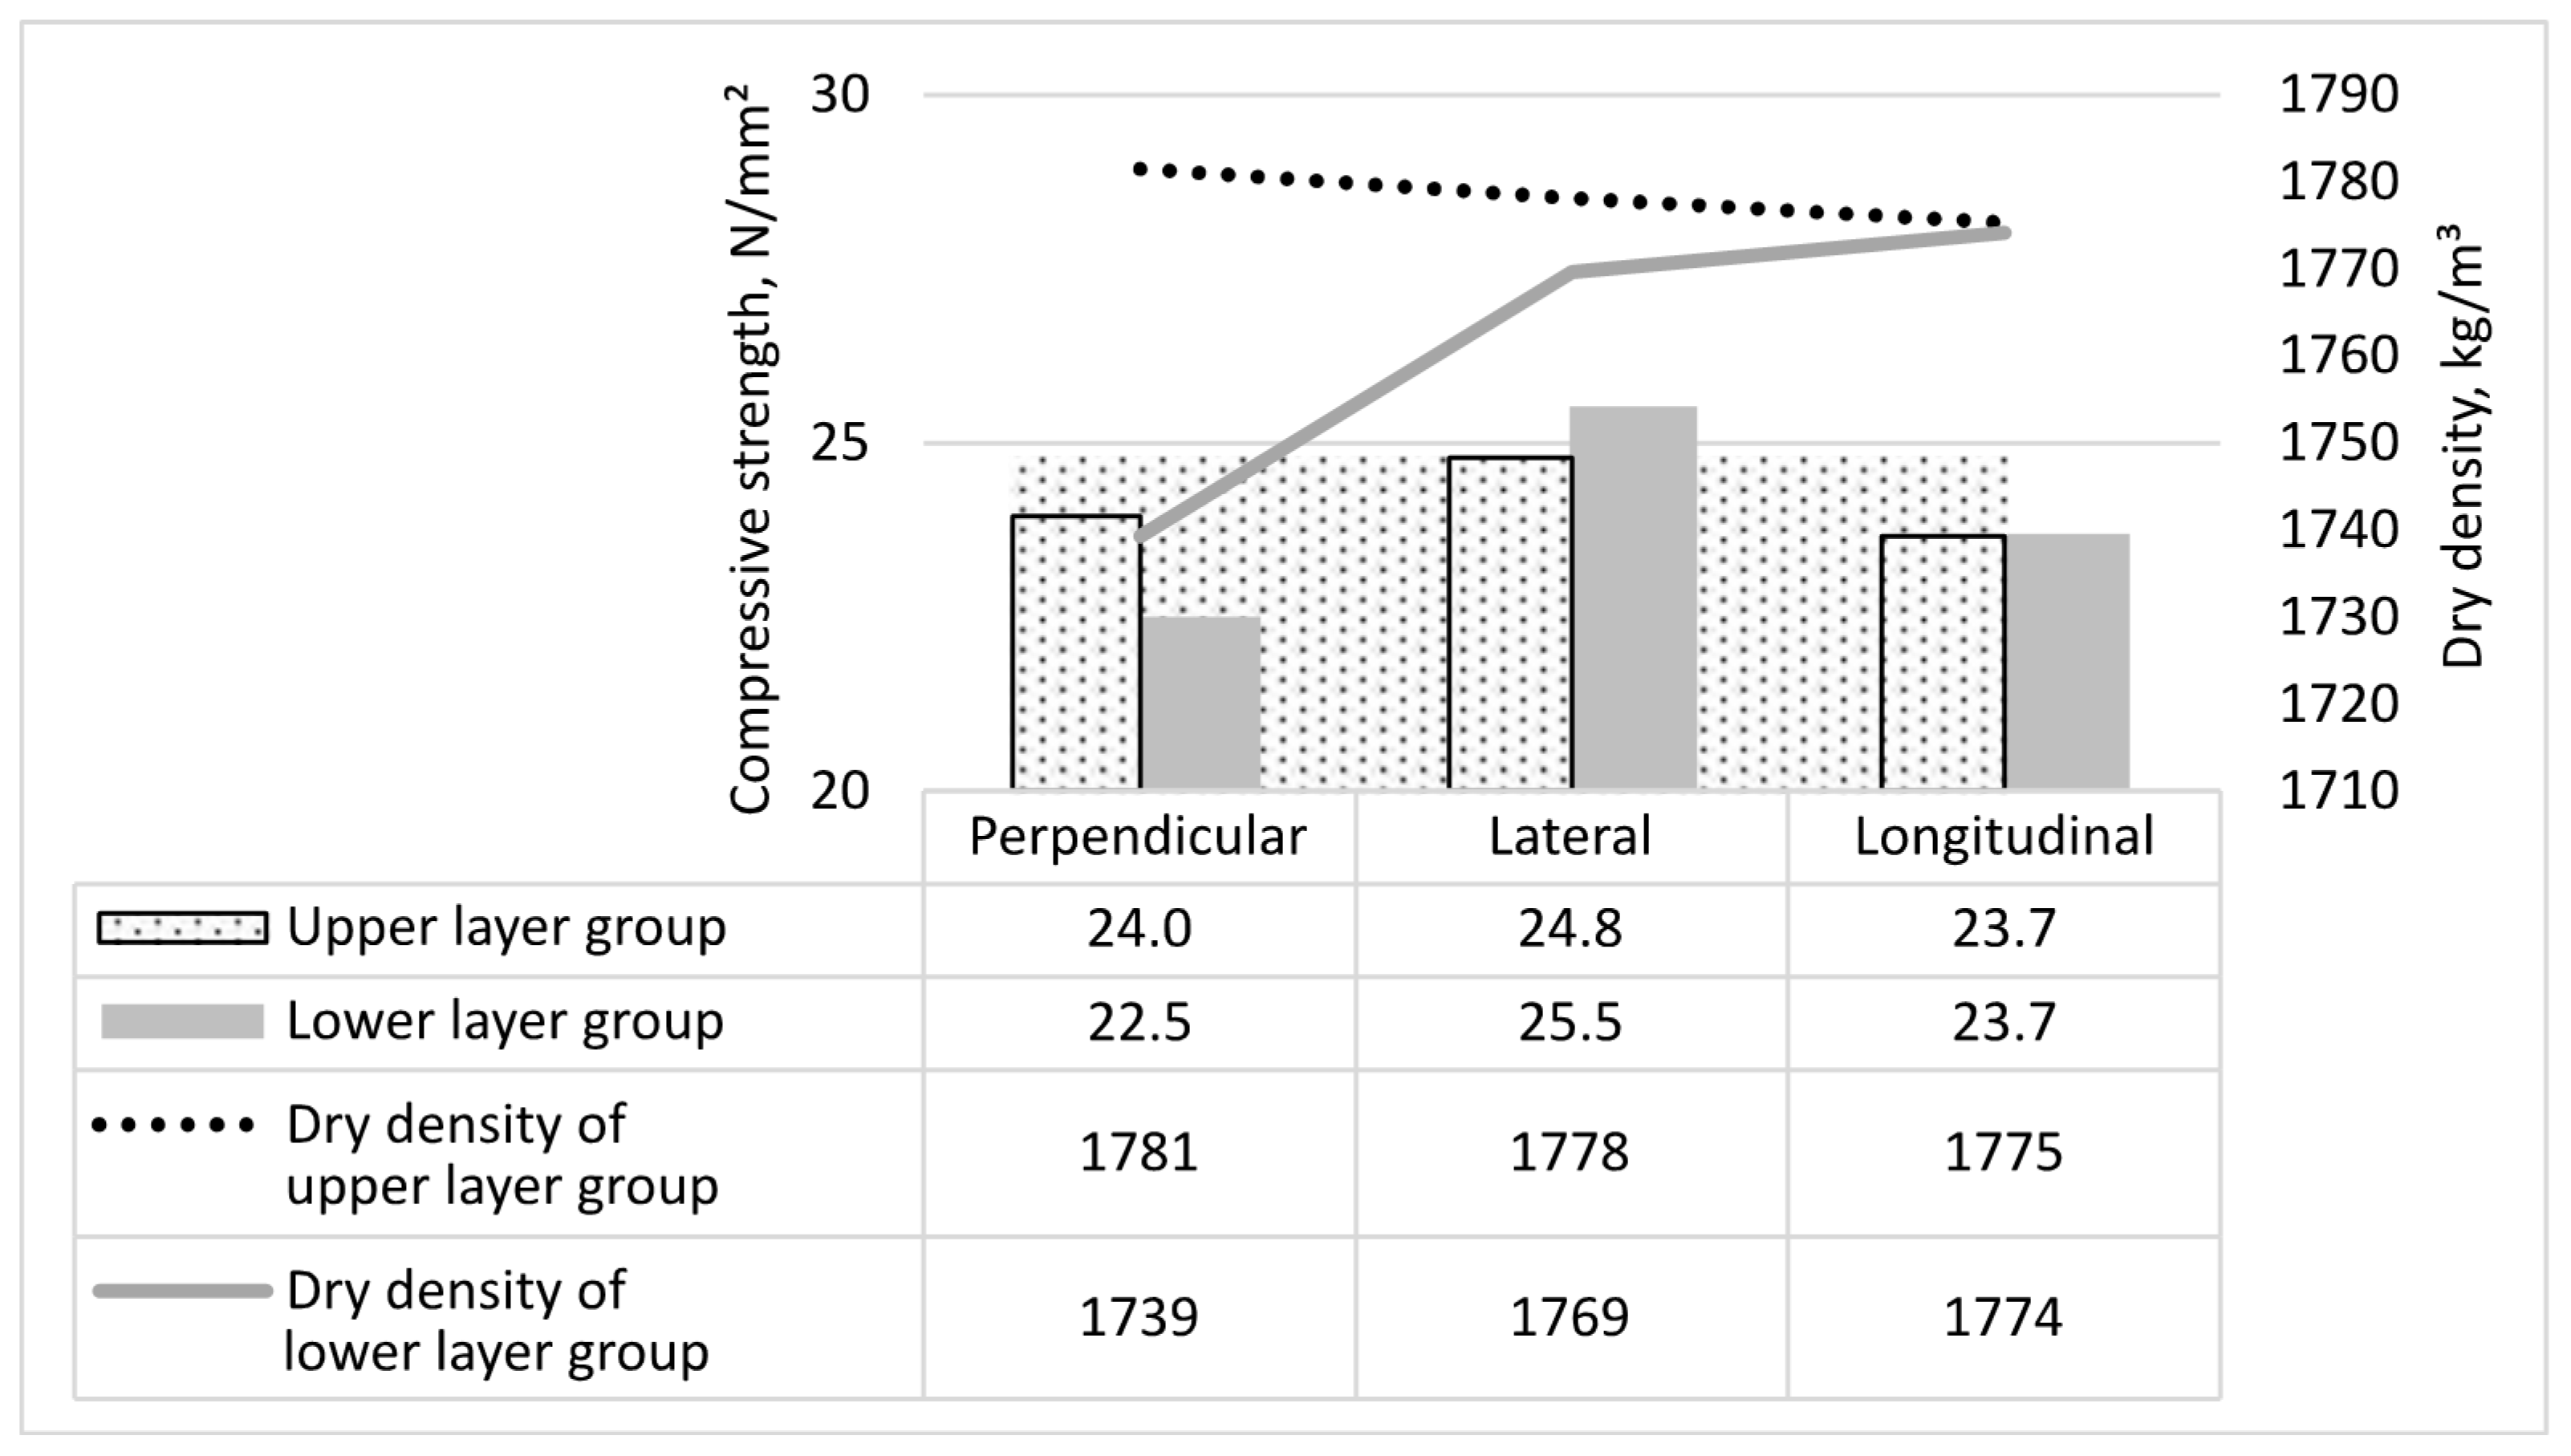
The data did not show statistically significant differences between the strengths of the upper- and lower-layer groups at 28 days, so the small additional mass of the upper layers did not cause a higher level of compaction in the lower layers. The upper-layer group in the longitudinal direction had the largest spread of the test results with a standard deviation of 3.2 (Figure 10). The results of the upper- and lower-layer groups could be combined.
There was a single specimen with a significantly lower dry density of 1635 kg/m3, and a low strength of 20.5 N/mm2 (the second lowest was 1723 kg/m3), in the lower-layer group in the perpendicular direction. When excluding the outlier, there was no significant difference in the compressive strength between different loading directions at 28 days.
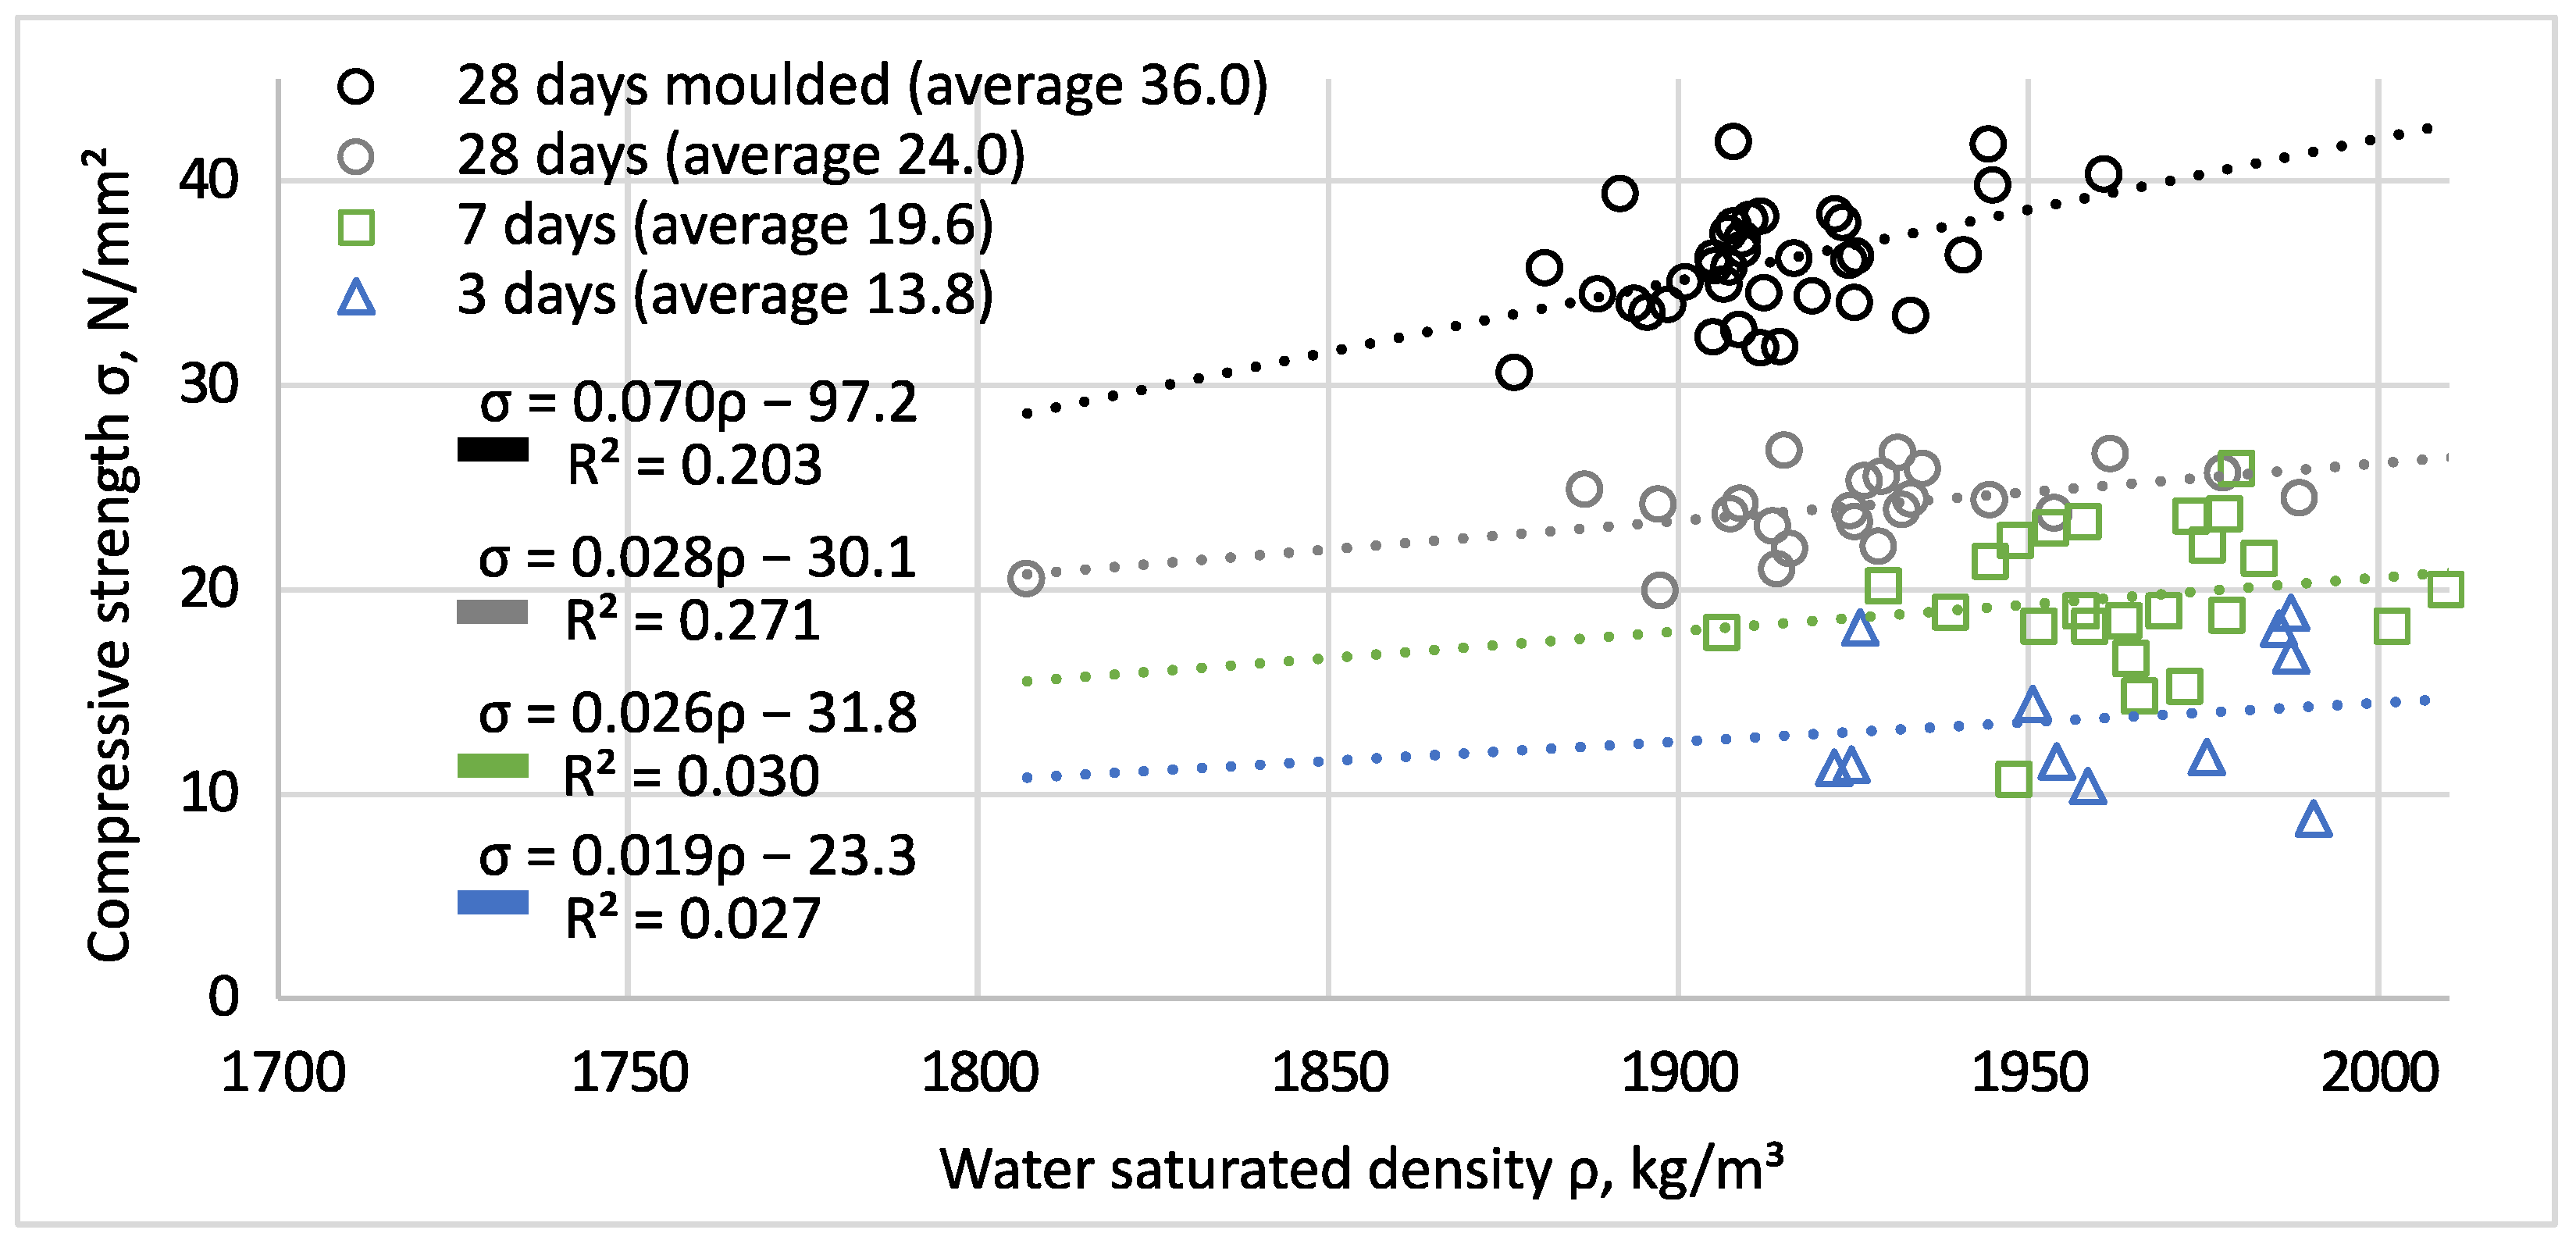
The compressive strength of the printed wall increased by 0.3 Ν/mm2 when the water saturated density increased by 10 kg/m3 at 28 days (Figure 11), while the compressive strength of the compacted cubes increased by 0.7 N/mm2 for an increase in density of 10 kg/m3. The relationship between dry density and compressive strength was similar for the printed wall specimens.
The difference in the compressive strength between the upper- and lower-layer groups was negligible at the age of 28 days. The early difference at three days might have been a false result, but this needs further research.
It appears that 3D-printed concrete has a significantly lower compressive strength when compared to the strength of moulded specimens, which indicates the potential of the mix. The data showed an approximately 30% reduction in the mean compressive strength using the common 3D-printing technology with a progressing cavity mortar pump, which was used in this study (Figure 12). This was in line with similar research [20,22]. If a 3D-printing system uses a single pump at the start of a long line, all the compaction happens inside the hopper before the wet mix enters the pump. After the wet mix enters the line, it is not possible for the entrapped air to escape, making compaction virtually impossible. Some level of compaction still happens as the air bubbles in the mix float to the top of the line and cause small depressions on the top and side surfaces, depending on the printing direction. This has adverse effects of higher porosity, lower strength, and very fast water uptake because the pores are open, which is different from conventional concrete technology.
3.2. Flexural Tensile Strength
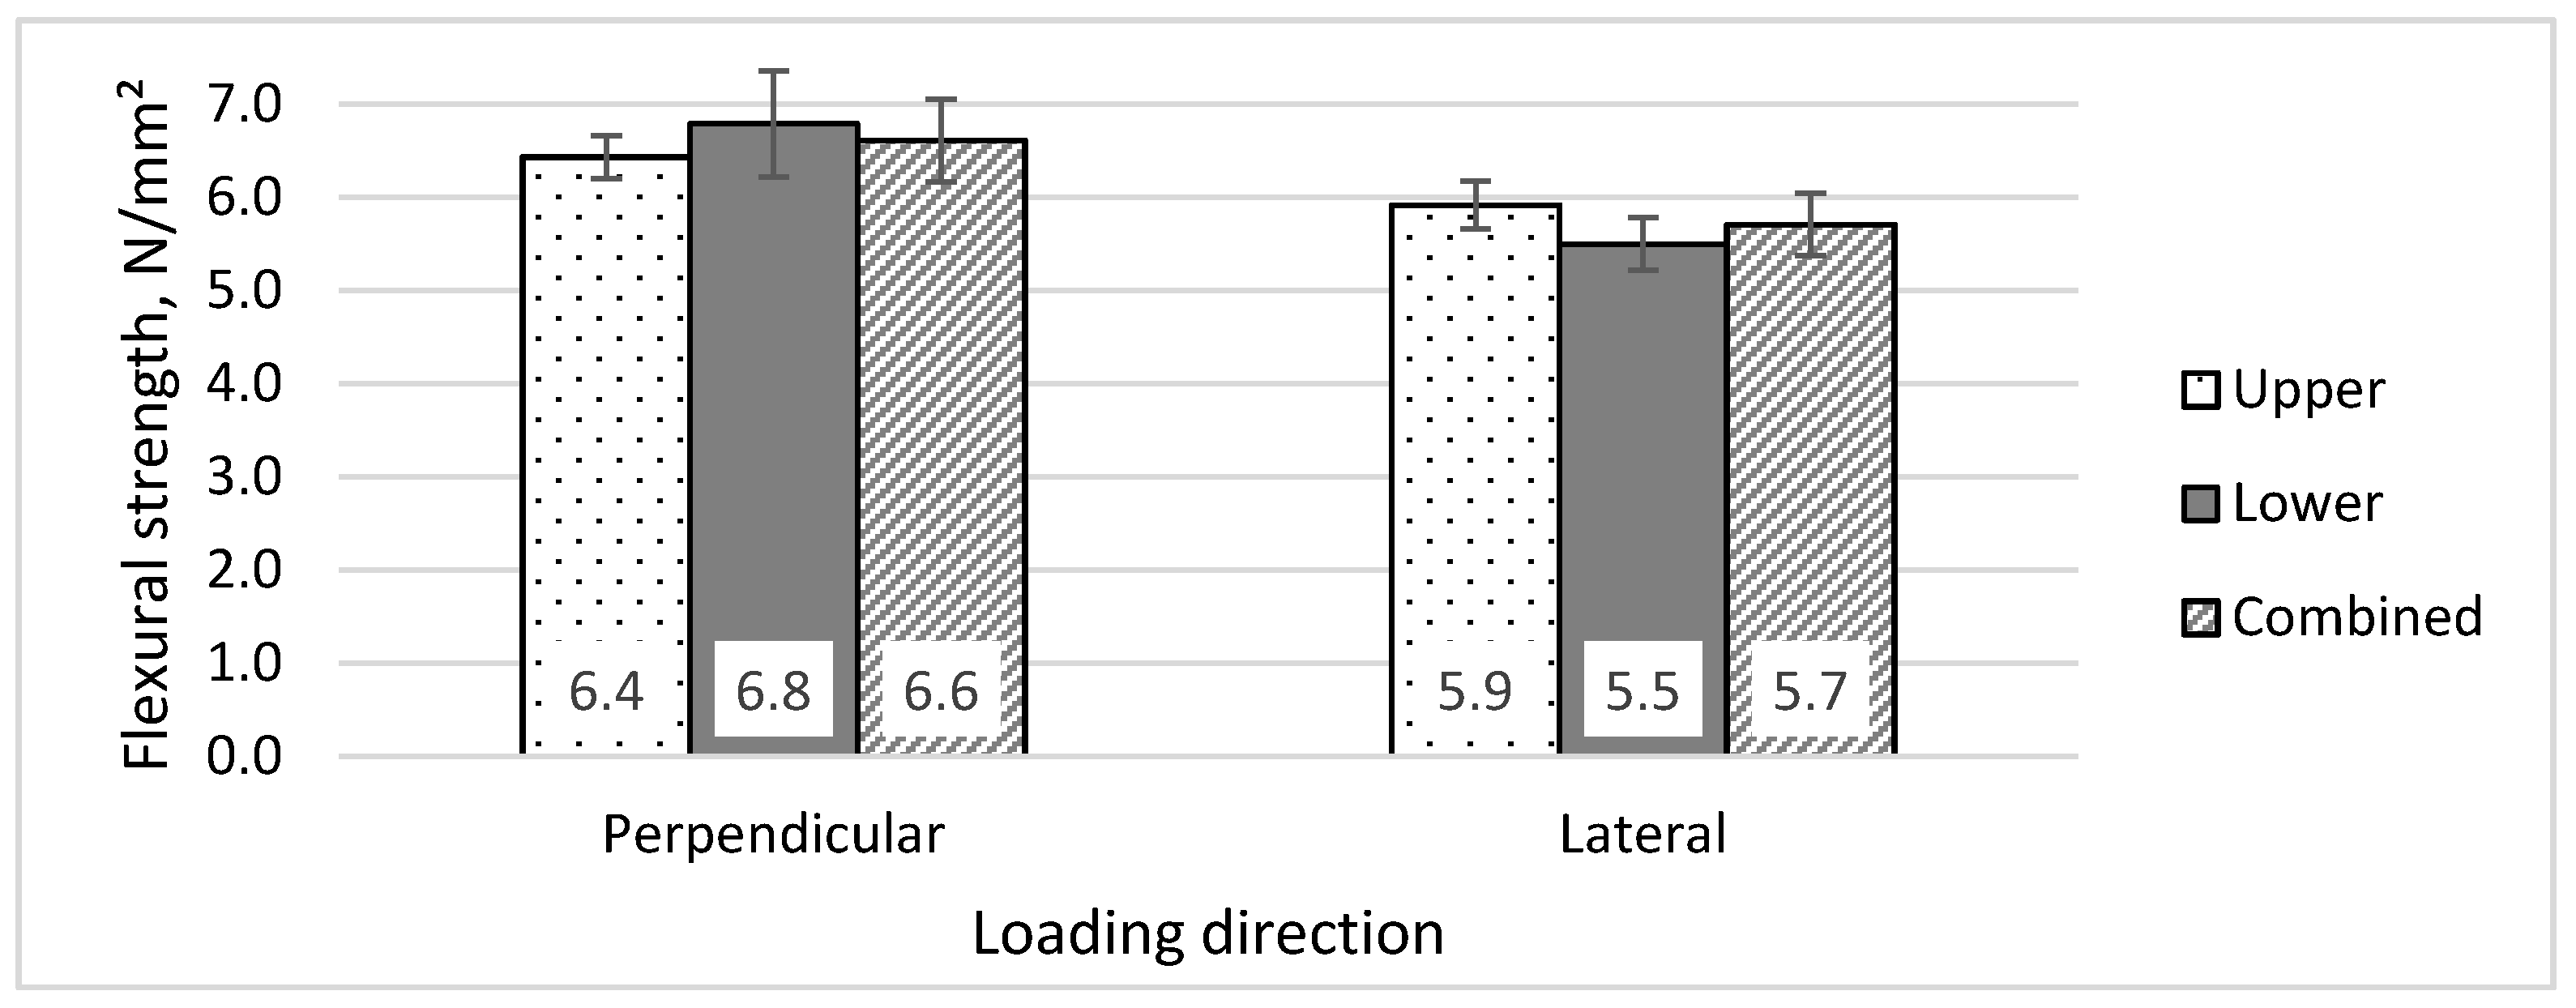
The flexural tensile strength (Figure 13) of the upper- and lower-layer groups in the perpendicular and lateral directions did not show statistically significant differences (two-tailed t-test, equal variance, n = 4, p = 0.29 and p = 0.072), therefore, the results were grouped together. The difference in the flexural strength at 28 days between the perpendicular and lateral loading directions was significant (n = 8, p = 0.0004).
The lateral flexural strength was, on average, 14% lower than in the perpendicular direction. This result is similar to a result obtained by Eindhoven University: 9% reduction in strength [22], but rather different from a result from Tongji University: 27% reduction [20]. The reason for the discrepancy was most likely related to the exact technological parameters of printing. It is possible that using extrusion head smaller than the hose may have caused the mixture to flow differently, causing the sides of the layers to have a different orientation of PP fibres, and introducing cracks perpendicular to the sides, which became easily visible on test batches with lower flowability.
The measured mean flexural strength was 6.6 or 5.7 N/mm2, depending on the direction of the test, which was 23% or 27% of the mean compressive strength. This was two times more than the expected relationship for conventional concrete (12%) [1]. The difference was caused by higher cement content, smaller aggregate size [33], and the use of PP fibres, possibly also due to the orientation of the fibres [21].
3.3. Splitting Tensile Strength
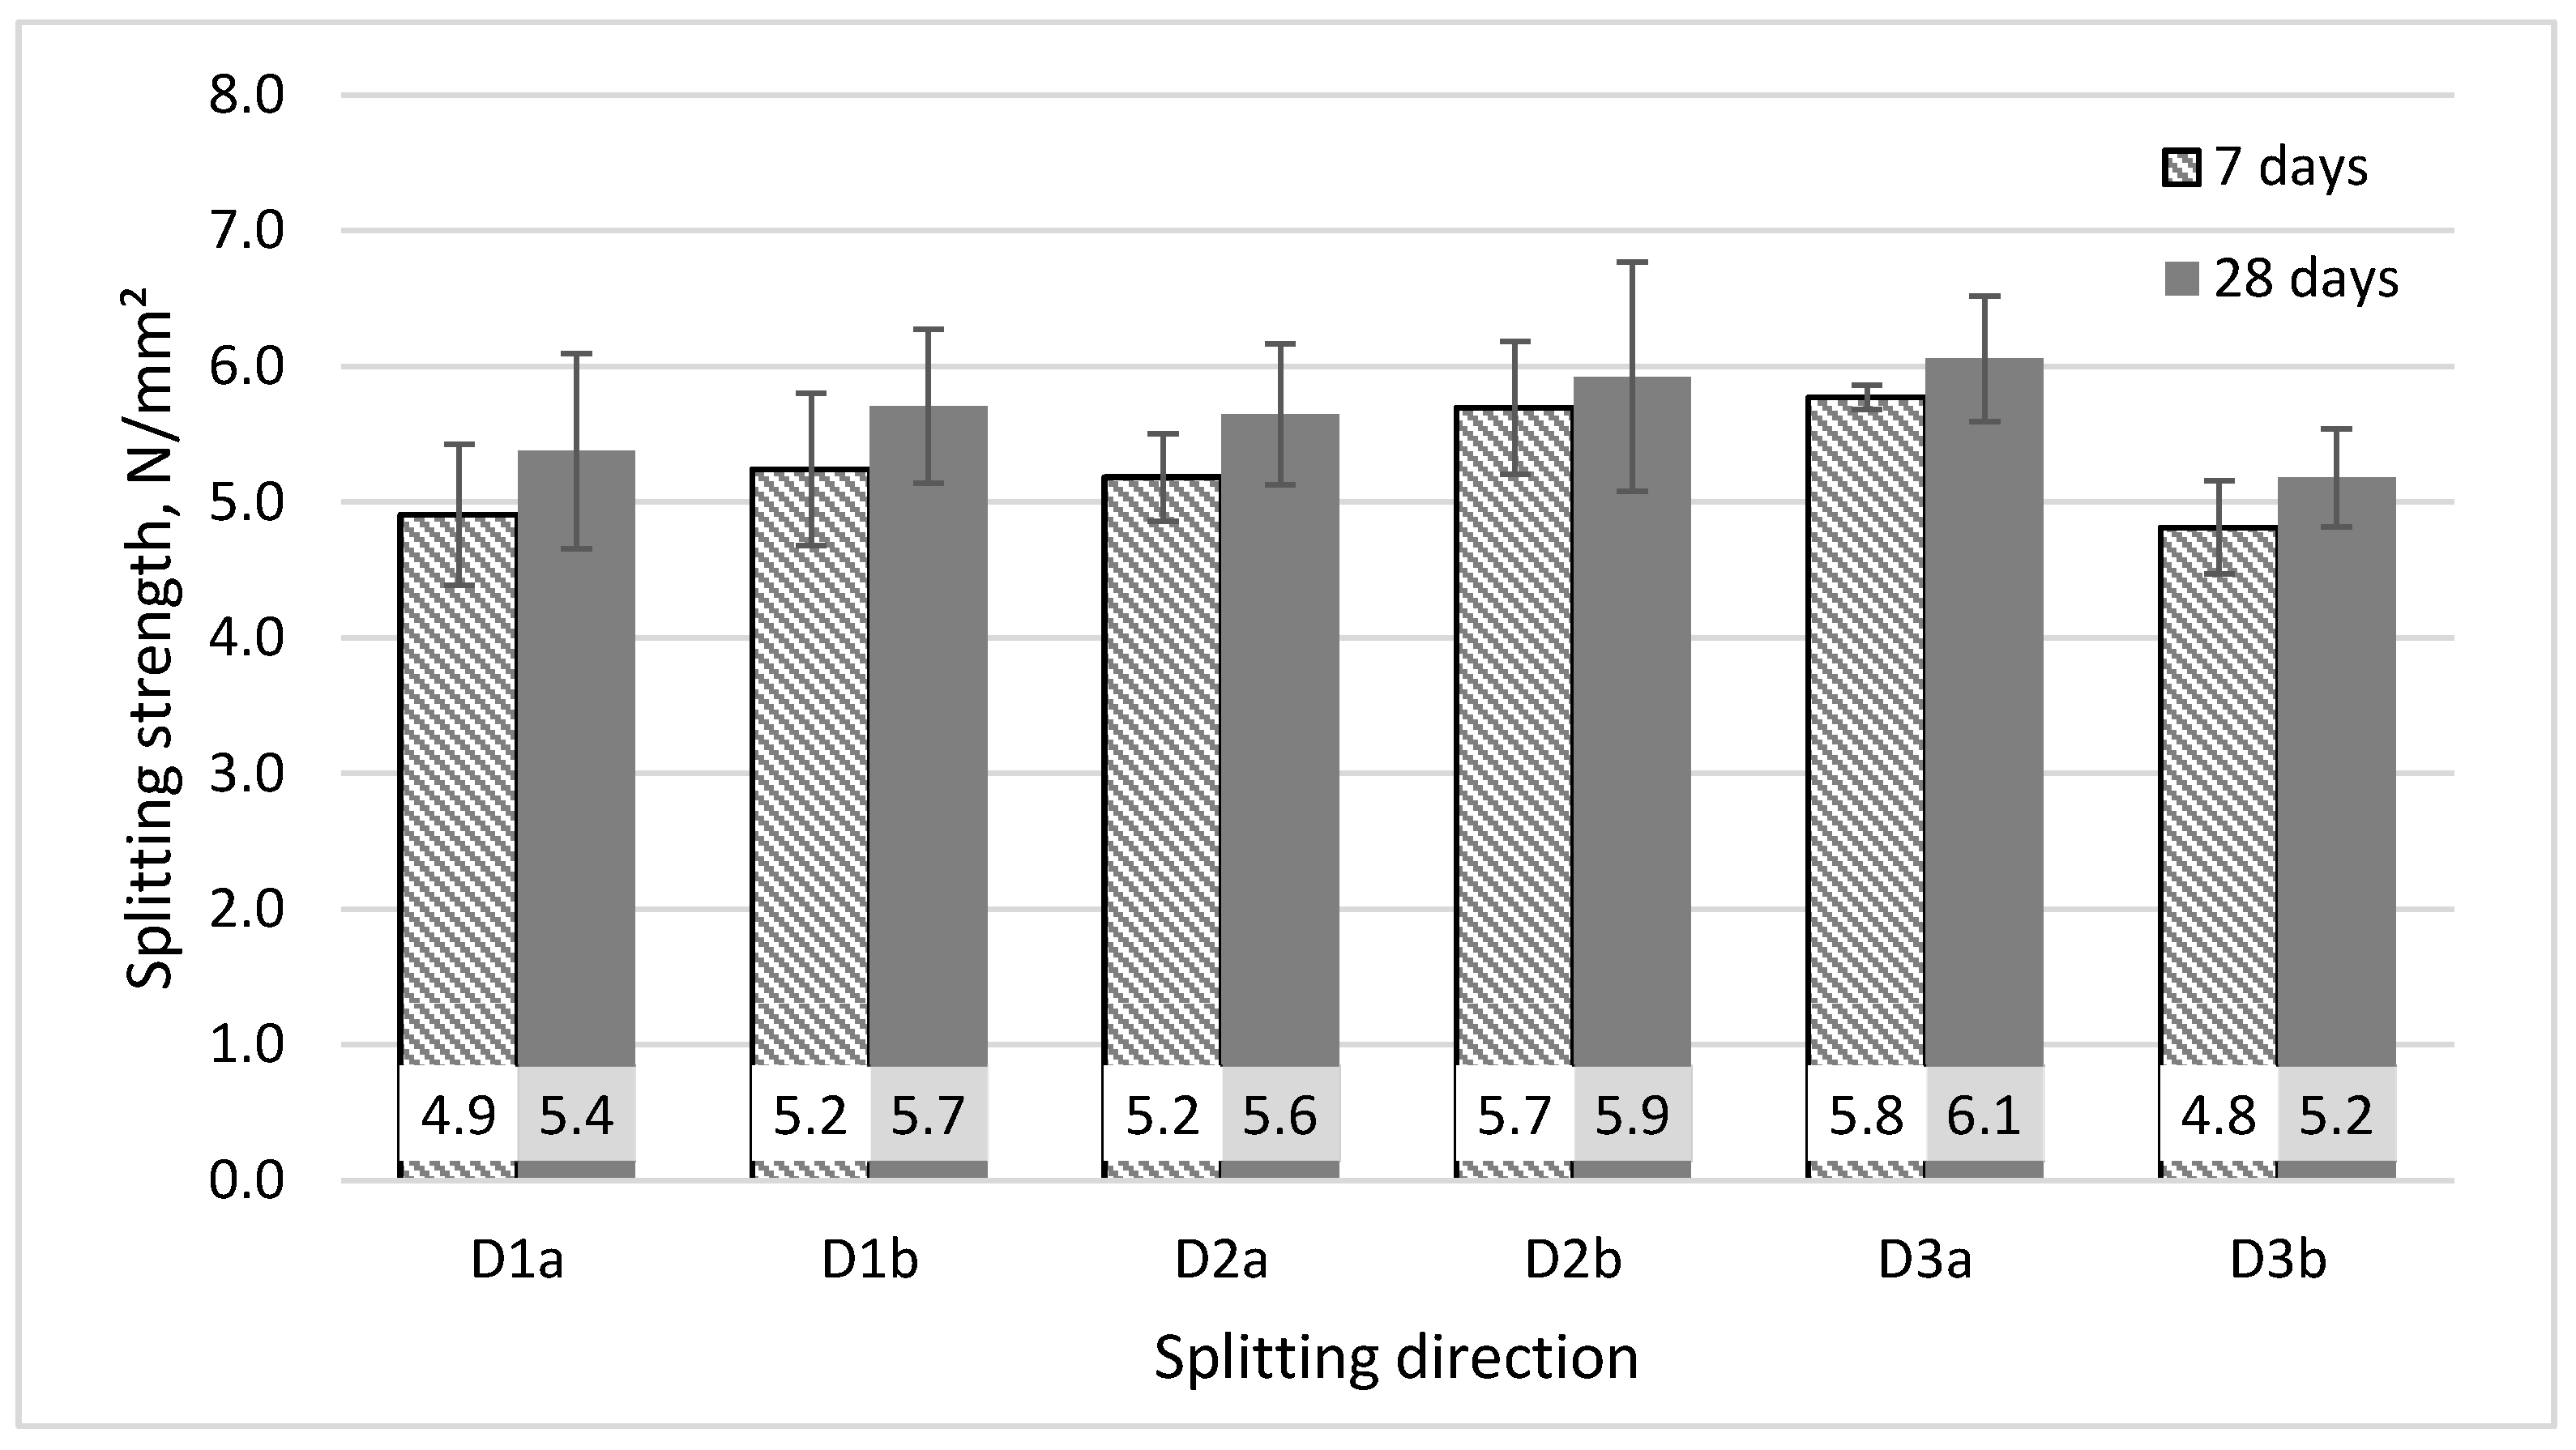
The splitting tensile strength (Figure 14) was determined in six different directions at 7 and 28 days. The lower- and upper-layer groups did not show significant differences and were combined. The only significant difference from the others was direction D3b, where the bonding between layers affected the splitting strength when the directions of the layer-to-layer interface and the splitting plane matched. The biggest difference between splitting directions was between D3a and D3b, both at the ages of 7 and 28 days (17% and 14%, p = 0.002 and p = 0.001, respectively, n = 8). There was a small tendency (5%) for a higher tensile strength in directions (D1b and D2b) where the fibre orientation matched the normal of the cracking surface; however, current data did not show this as statistically significant.
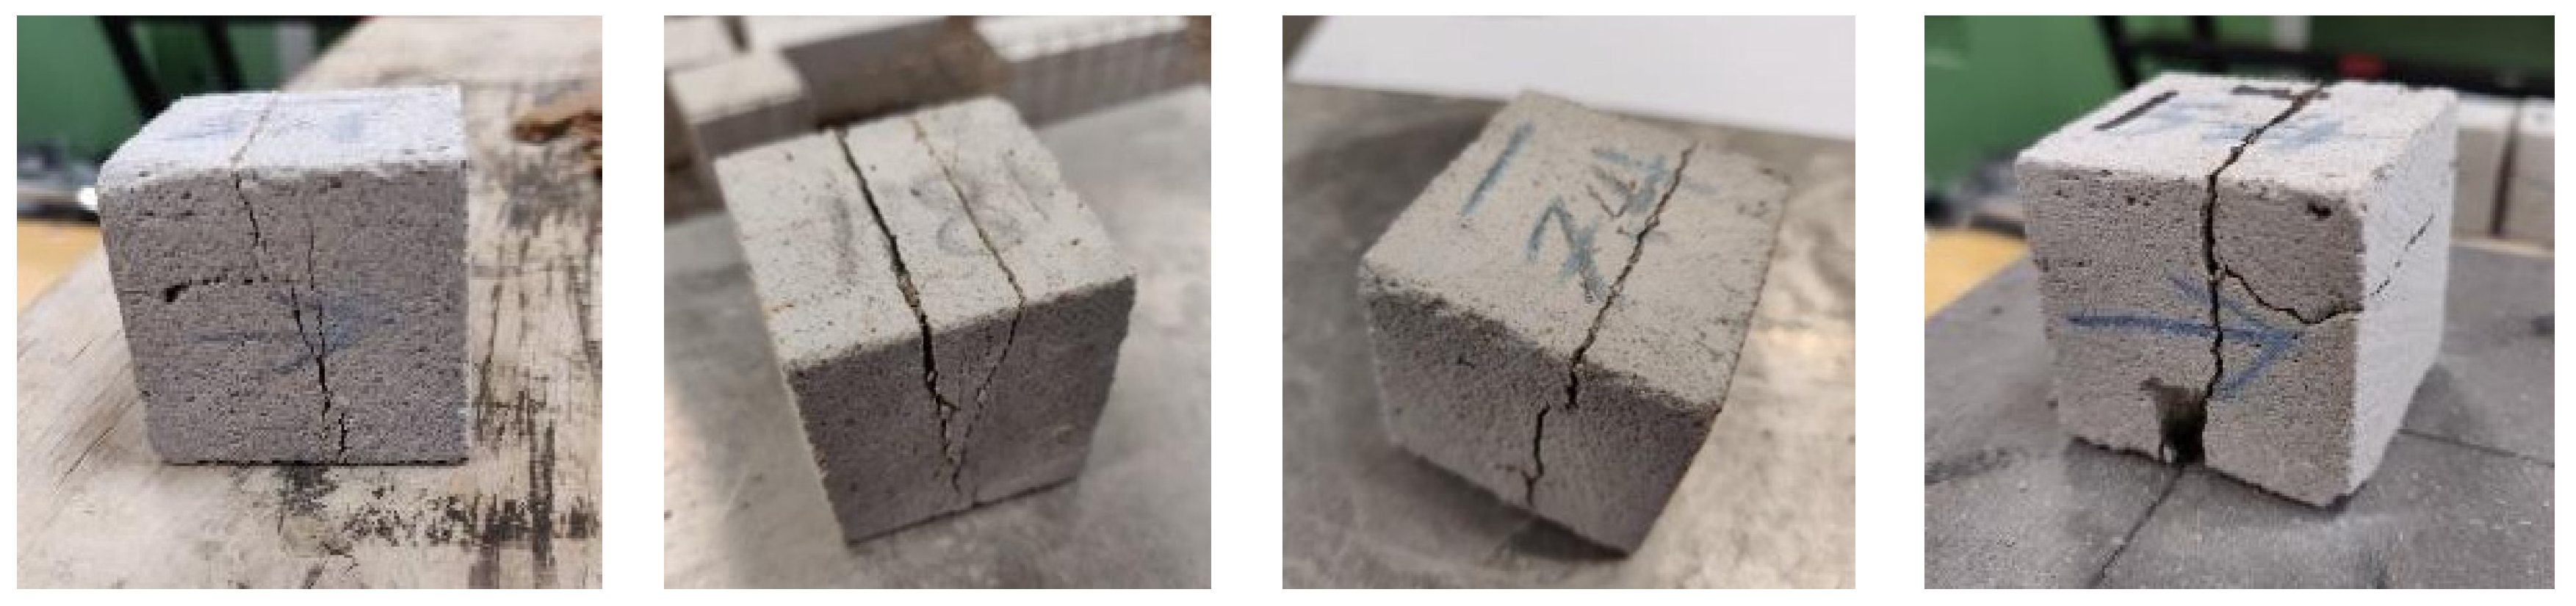
The break often occurred at the edge of the loading strip, as seen in Figure 15. This indicates that the stress-concentrating effect of the edge affected the fracture images. This caused the results to appear smaller by an unknown margin compared to the test method with spherical contact surfaces.
4. Conclusions
The current state of 3D concrete printing technology is promising. It can be expected to revolutionise the industry, reduce the labour intensity of the core processes, and result in many changes in the design and construction processes. There is a lot of architectural freedom in two dimensions without additional costs, and severe limitations in the third direction when 3D printing technology is used.
The differences caused by the directionality of strength depend on the actual printing setup and parameters, mainly humidity, wind speed, time delay between the printing of layers, distribution of voids, and others. The directionality is mostly caused by either unintended voids or lower bonding strength between the layers, which can be further affected by the shape of the layers. If drying out and the time between layers is limited, as in this study, the differences by directionality are less significant.
It is clear that 3D-printing technology causes higher concrete porosity and at least a 23% reduction in compressive strength of printed walls, when compared to the mould-casted specimens, which indicate the potential of the mix.
The current study revealed that the flexural tensile strength and compressive-strength relation for printed concrete was two times higher than for conventional concrete. This may reduce the need for steel reinforcement in some construction projects and may offset the adverse effect of higher cement dosages.
There was a 14% difference in the flexural strength between the two tested directions. This may have been related to the use of a smaller extrusion head. The differences in splitting tensile strength between directions of loading, as used in this study, were mostly small, except when splitting happened directly between the layers (14% reduction). There was a tendency for slightly higher (5%) strengths in the directions where the PP fibre was orientated favourably.
No significant differences were found between the properties of the last printed layers and those of the rest.
Author Contributions
Conceptualization, M.P. and T.T.; methodology, M.P. and T.T.; validation, M.P. and T.T.; formal analysis, M.P.; investigation, K.T., M.P. and T.T.; data curation—M.P. and K.T.; writing—original draft preparation, M.P.; writing—review and editing, M.P., T.T., R.P., M.K. and K.T.; supervision, R.P. and M.K.; project administration, M.P. All authors have read and agreed to the published version of the manuscript.
Funding
This research was supported by development funding of Tallinn University of Technology.
Data Availability Statement
Data are available upon request. The data are not publicly available due to privacy.
Conflicts of Interest
The authors declare that they have no conflict of interest.
References
- Alami, A.H.; Olabi, A.G.; Ayoub, M.; Aljaghoub, H.; Alasad, S.; Abdelkareem, M.A. 3D Concrete Printing: Recent Progress, Applications, Challenges, and Role in Achieving Sustainable Development Goals. Buildings 2023, 13, 924. [Google Scholar] [CrossRef]
- Khan, S.A.; Koç, M.; Al-Ghamdi, S.G. Sustainability Assessment, Potentials and Challenges of 3D Printed Concrete Structures: A Systematic Review for Built Environmental Applications. J. Clean. Prod. 2021, 303, 127027. [Google Scholar] [CrossRef]
- Dimensions—Publications. Available online: https://app.dimensions.ai/discover/publication (accessed on 16 May 2023).
- Ahmed, G.H. A Review of “3D Concrete Printing”: Materials and Process Characterization, Economic Considerations and Environmental Sustainability. J. Build. Eng. 2023, 66, 105863. [Google Scholar] [CrossRef]
- Wu, Z.; Memari, A.M.; Duarte, J.P. State of the Art Review of Reinforcement Strategies and Technologies for 3D Printing of Concrete. Energies 2022, 15, 360. [Google Scholar] [CrossRef]
- Kruger, J.; du Plessis, A.; van Zijl, G. An Investigation into the Porosity of Extrusion-Based 3D Printed Concrete. Addit. Manuf. 2021, 37, 101740. [Google Scholar] [CrossRef]
- Ter Haar, B.; Kruger, J.; van Zijl, G. Off-Site Construction with 3D Concrete Printing. Autom. Constr. 2023, 152, 104906. [Google Scholar] [CrossRef]
- Bos, F.; Wolfs, R.; Ahmed, Z.; Salet, T. Additive Manufacturing of Concrete in Construction: Potentials and Challenges of 3D Concrete Printing. Virtual Phys. Prototyp. 2016, 11, 209–225. [Google Scholar] [CrossRef]
- Marijnissen, M.P.A.M.; van der Zee, A. 3D Concrete Printing in Architecture—A Research on the Potential Benefits of 3D Concrete Printing in Architecture. In Proceedings of the 35st International Conference on Education and Research in Computer Aided Architectural Design in Europe, Rome, Italy, 20–22 September 2017; pp. 299–308. [Google Scholar]
- Dey, D.; Sahu, A.; Prakash, S.; Panda, B. A Study into the Effect of Material Deposition Methods on Hardened Properties of 3D Printed Concrete. Mater. Today Proc. 2023. [Google Scholar] [CrossRef]
- Pan, Z.; Si, D.; Tao, J.; Xiao, J. Compressive Behavior of 3D Printed Concrete with Different Printing Paths and Concrete Ages. Case Stud. Constr. Mater. 2023, 18, e01949. [Google Scholar] [CrossRef]
- Mohan, M.K.; Rahul, A.V.; De Schutter, G.; Van Tittelboom, K. Early Age Hydration, Rheology and Pumping Characteristics of CSA Cement-Based 3D Printable Concrete. Constr. Build. Mater. 2021, 275, 122136. [Google Scholar] [CrossRef]
- Mohammad, M.; Masad, E.; Al-Ghamdi, S.G. 3D Concrete Printing Sustainability: A Comparative Life Cycle Assessment of Four Construction Method Scenarios. Buildings 2020, 10, 245. [Google Scholar] [CrossRef]
- Abdalla, H.; Fattah, K.P.; Abdallah, M.; Tamimi, A.K. Environmental Footprint and Economics of a Full-Scale 3D-Printed House. Sustainability 2021, 13, 11978. [Google Scholar] [CrossRef]
- Jo, J.H.; Jo, B.W.; Cho, W.; Kim, J.-H. Development of a 3D Printer for Concrete Structures: Laboratory Testing of Cementitious Materials. Int. J. Concr. Struct. Mater. 2020, 14, 13. [Google Scholar] [CrossRef]
- Le, T.T.; Austin, S.A.; Lim, S.; Buswell, R.A.; Law, R.; Gibb, A.G.F.; Thorpe, T. Hardened Properties of High-Performance Printing Concrete. Cem. Concr. Res. 2012, 42, 558–566. [Google Scholar] [CrossRef]
- Ma, L.; Zhang, Q.; Jia, Z.; Liu, C.; Deng, Z.; Zhang, Y. Effect of Drying Environment on Mechanical Properties, Internal RH and Pore Structure of 3D Printed Concrete. Constr. Build. Mater. 2022, 315, 125731. [Google Scholar] [CrossRef]
- Tao, Y.; Lesage, K.; Van Tittelboom, K.; Yuan, Y.; De Schutter, G. Twin-Pipe Pumping Strategy for Stiffening Control of 3D Printable Concrete: From Transportation to Fabrication. Cem. Concr. Res. 2023, 168, 107137. [Google Scholar] [CrossRef]
- Hou, S.; Duan, Z.; Xiao, J.; Ye, J. A Review of 3D Printed Concrete: Performance Requirements, Testing Measurements and Mix Design. Constr. Build. Mater. 2021, 273, 121745. [Google Scholar] [CrossRef]
- Ding, T.; Xiao, J.; Zou, S.; Wang, Y. Hardened Properties of Layered 3D Printed Concrete with Recycled Sand. Cem. Concr. Compos. 2020, 113, 103724. [Google Scholar] [CrossRef]
- Chaves Figueiredo, S.; Romero Rodríguez, C.; Ahmed, Z.Y.; Bos, D.H.; Xu, Y.; Salet, T.M.; Çopuroğlu, O.; Schlangen, E.; Bos, F.P. Mechanical Behavior of Printed Strain Hardening Cementitious Composites. Materials 2020, 13, 2253. [Google Scholar] [CrossRef] [PubMed]
- Wolfs, R.J.M.; Bos, F.P.; Salet, T.A.M. Hardened Properties of 3D Printed Concrete: The Influence of Process Parameters on Interlayer Adhesion. Cem. Concr. Res. 2019, 119, 132–140. [Google Scholar] [CrossRef]
- Chen, Y.; Çopuroğlu, O.; Romero Rodriguez, C.; de Mendonca Filho, F.F.; Schlangen, E. Characterization of Air-Void Systems in 3D Printed Cementitious Materials Using Optical Image Scanning and X-Ray Computed Tomography. Mater. Charact. 2021, 173, 110948. [Google Scholar] [CrossRef]
- Arunothayan, A.R.; Nematollahi, B.; Ranade, R.; Bong, S.H.; Sanjayan, J. Development of 3D-Printable Ultra-High Performance Fiber-Reinforced Concrete for Digital Construction. Constr. Build. Mater. 2020, 257, 119546. [Google Scholar] [CrossRef]
- Hosseini, E.; Zakertabrizi, M.; Korayem, A.H.; Xu, G. A Novel Method to Enhance the Interlayer Bonding of 3D Printing Concrete: An Experimental and Computational Investigation. Cem. Concr. Compos. 2019, 99, 112–119. [Google Scholar] [CrossRef]
- Pogga, M. Base Study for the Composition of 3D-Printable Concrete. Master’s Thesis, Tallinn University of Technology, Tallinn, Estonia, 2021. [Google Scholar]
- Anton, A.; Reiter, L.; Wangler, T.; Frangez, V.; Flatt, R.J.; Dillenburger, B. A 3D Concrete Printing Prefabrication Platform for Bespoke Columns. Autom. Constr. 2021, 122, 103467. [Google Scholar] [CrossRef]
- EVS-EN 12390-2:2019; Testing Hardened Concrete—Part 2: Making and Curing Specimens for Strength Tests. Estonian Centre for Standardisation: Tallinn, Estonia, 2019.
- EVS-EN 12390-3:2019; Testing Hardened Concrete—Part 3: Compressive Strength of Test Specimens. Estonian Centre for Standardisation: Tallinn, Estonia, 2019.
- EVS-EN 12390-5:2019; Testing Hardened Concrete—Part 5: Flexural Strength of Test Specimens. Estonian Centre for Standardisation: Tallinn, Estonia, 2019.
- EVS-EN 12390-6:2009; Testing Hardened Concrete—Part 6: Tensile Splitting Strength of Test Specimens. Estonian Centre for Standardisation: Tallinn, Estonia, 2009.
- EVS-EN 316:2009; Wood Fibre Boards—Definition, Classification and Symbols. Estonian Centre for Standardisation: Tallinn, Estonia, 2009.
- Lan, T.; Yang, S.; Wang, M.; Xu, M.; Cheng, S.; Chen, Z. Prediction of Interfacial Tensile Bond Strength in 3D Printed Concrete Based on a Closed-Form Fracture Model. J. Build. Eng. 2023, 70, 106411. [Google Scholar] [CrossRef]
Figure 1.
Sand particle size distribution.

Figure 2.
Polypropylene fibres, length L = 5 mm, diameter d = 0.05 mm.

Figure 3.
Printing setup. Concrete mixer is not depicted.

Figure 4.
Printing process (left), printed wall section before covering with PE film (middle), and filling the cubes before compaction (right).
Figure 4.
Printing process (left), printed wall section before covering with PE film (middle), and filling the cubes before compaction (right).

Figure 5.
Compressive test with 40 mm cubes. The arrow, marked at the time of cutting, indicates the direction of movement of the extruding head.
Figure 5.
Compressive test with 40 mm cubes. The arrow, marked at the time of cutting, indicates the direction of movement of the extruding head.

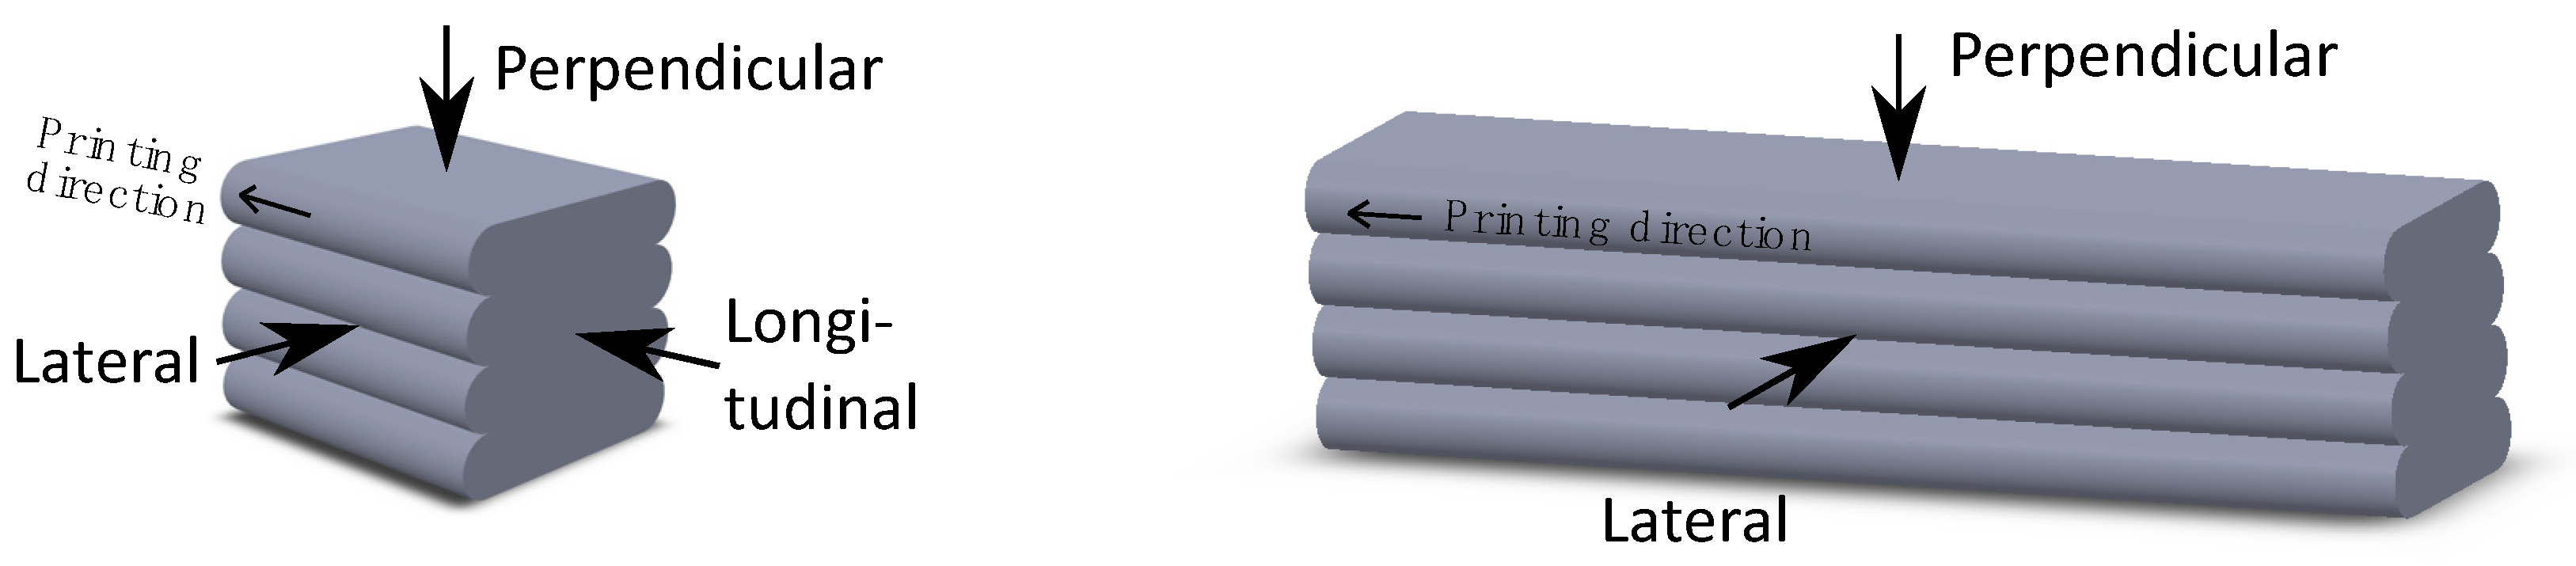
Figure 6.
Directions of the compressive test and the 3-point flexural test.

Figure 7.
Three-point flexural test and simplified splitting test.

Figure 8.
Six splitting directions of the splitting test, direction of applying the load was perpendicular to the layer: (D1a, D1b), lateral: (D2a, D2b), longitudinal: (D3a, D3b).
Figure 8.
Six splitting directions of the splitting test, direction of applying the load was perpendicular to the layer: (D1a, D1b), lateral: (D2a, D2b), longitudinal: (D3a, D3b).

Figure 9.
Increase in different types of strength over time, n ≥ 4. Loading direction is perpendicular; for splitting test an average of D1a and D1b is shown.
Figure 9.
Increase in different types of strength over time, n ≥ 4. Loading direction is perpendicular; for splitting test an average of D1a and D1b is shown.

Figure 10.
Compressive strength at 28 days by layer group and loading direction given with standard deviation error bars (n = 4) and dry density. The average water content was 0.15 m3/m3.
Figure 10.
Compressive strength at 28 days by layer group and loading direction given with standard deviation error bars (n = 4) and dry density. The average water content was 0.15 m3/m3.

Figure 11.
Positive correlation between water-saturated density and compressive strength at different ages, all layers and directions combined, compared to the strength of compacted moulded cubes.
Figure 11.
Positive correlation between water-saturated density and compressive strength at different ages, all layers and directions combined, compared to the strength of compacted moulded cubes.

Figure 12.
The average compressive strength of 40 mm cubes cut from the wall at different ages compared to the strength of moulded and compacted 100 mm cubes.
Figure 12.
The average compressive strength of 40 mm cubes cut from the wall at different ages compared to the strength of moulded and compacted 100 mm cubes.

Figure 13.
Flexural tensile strength at 28 days by loading direction and layer group given with standard deviation error bars (n = 4). The average water content was 0.14 m3/m3.
Figure 13.
Flexural tensile strength at 28 days by loading direction and layer group given with standard deviation error bars (n = 4). The average water content was 0.14 m3/m3.

Figure 14.
Splitting tensile strength by direction at 7 and 28 days.

Figure 15.
Fracture images of the splitting test.

Disclaimer/Publisher’s Note: The statements, opinions and data contained in all publications are solely those of the individual author(s) and contributor(s) and not of MDPI and/or the editor(s). MDPI and/or the editor(s) disclaim responsibility for any injury to people or property resulting from any ideas, methods, instructions or products referred to in the content. |
© 2023 by the authors. Licensee MDPI, Basel, Switzerland. This article is an open access article distributed under the terms and conditions of the Creative Commons Attribution (CC BY) license (https://creativecommons.org/licenses/by/4.0/).
Share and Cite
MDPI and ACS Style
Põldaru, M.; Tammkõrv, K.; Tuisk, T.; Kiviste, M.; Puust, R. The Effect of Printing Direction on the Strength Characteristics of a 3D Printed Concrete Wall Section. Buildings 2023, 13, 2917. https://doi.org/10.3390/buildings13122917
AMA Style
Põldaru M, Tammkõrv K, Tuisk T, Kiviste M, Puust R. The Effect of Printing Direction on the Strength Characteristics of a 3D Printed Concrete Wall Section. Buildings. 2023; 13(12):2917. https://doi.org/10.3390/buildings13122917
Chicago/Turabian StylePõldaru, Mattias, Karl Tammkõrv, Tanel Tuisk, Mihkel Kiviste, and Raido Puust. 2023. "The Effect of Printing Direction on the Strength Characteristics of a 3D Printed Concrete Wall Section" Buildings 13, no. 12: 2917. https://doi.org/10.3390/buildings13122917
Note that from the first issue of 2016, this journal uses article numbers instead of page numbers. See further details here.