
Rolling Shear Strength of Cross Laminated Timber (CLT)—Testing, Evaluation, and Design


1
Institute of Timber Engineering and Wood Technology, Graz University of Technology, 8010 Graz, Austria
2
Holz.Bau Forschungs GmbH, 8010 Graz, Austria
*
Author to whom correspondence should be addressed.
Buildings 2023, 13(11), 2831; https://doi.org/10.3390/buildings13112831
Submission received: 27 September 2023
/
Revised: 6 November 2023
/
Accepted: 9 November 2023
/
Published: 11 November 2023
(This article belongs to the Special Issue The Application and Performance of Timber in Construction)
Abstract
:Cross laminated timber (CLT), with its typical orthogonal layering and exposure to out-of-plane bending, develops inherent rolling shear stresses. These stresses need to be checked during the ultimate limit state design process. With the ongoing revision of Eurocode 5, a discussion regarding the characteristic value of the rolling shear strength of CLT has arisen. One obstacle in the discussion is seen in the lack of harmonized regulations concerning how to determine rolling shear properties. This circumstance manifests in the greatly diverging test results of different institutions testing the rolling shear strength. The paper at hand aims to propose a candidate for such harmonized regulations. To achieve this, the most common test setups, such as the inclined shear test, three- and four-point bending tests, etc., were numerically and experimentally investigated. Within the numerical investigations, a comparison of the most common calculation methods (Timoshenko beam theory, modified γ-method, Shear Analogy Method, and Finite Element Analysis) for evaluating rolling shear stresses was included. In the experimental program, parameters such as the specimen width, number, and thickness of the cross layer(s), shear length, optional reinforcement against the stresses perpendicular to the grain, and the overall test setup were varied. It was found that the used test setups themselves and the area of the cross layer(s) (shear length, number, and thickness of the cross layer(s)) have a major impact on the rolling shear strength. In contrast, no effect was found from the calculation methods. Based on these findings and on a database of approx. 300 four-point bending rolling shear tests on CLT specimens from five well-established CLT manufacturers, a model for the regulation of the rolling shear strength of CLT is proposed, in combination with a corresponding four-point bending test setup. Afterwards, with two additionally conducted four-point bending test series, the proposed model is successfully validated. The conclusions and recommendations in respect to the test setup (four-point bending), evaluation procedure (Timoshenko beam theory), reference characteristic rolling shear strength, and the model, which allows adapting the reference rolling shear strength to individual conditions, are seen as a worthy basis for a more objective discussion on this topic.
1. Introduction
1.1. General
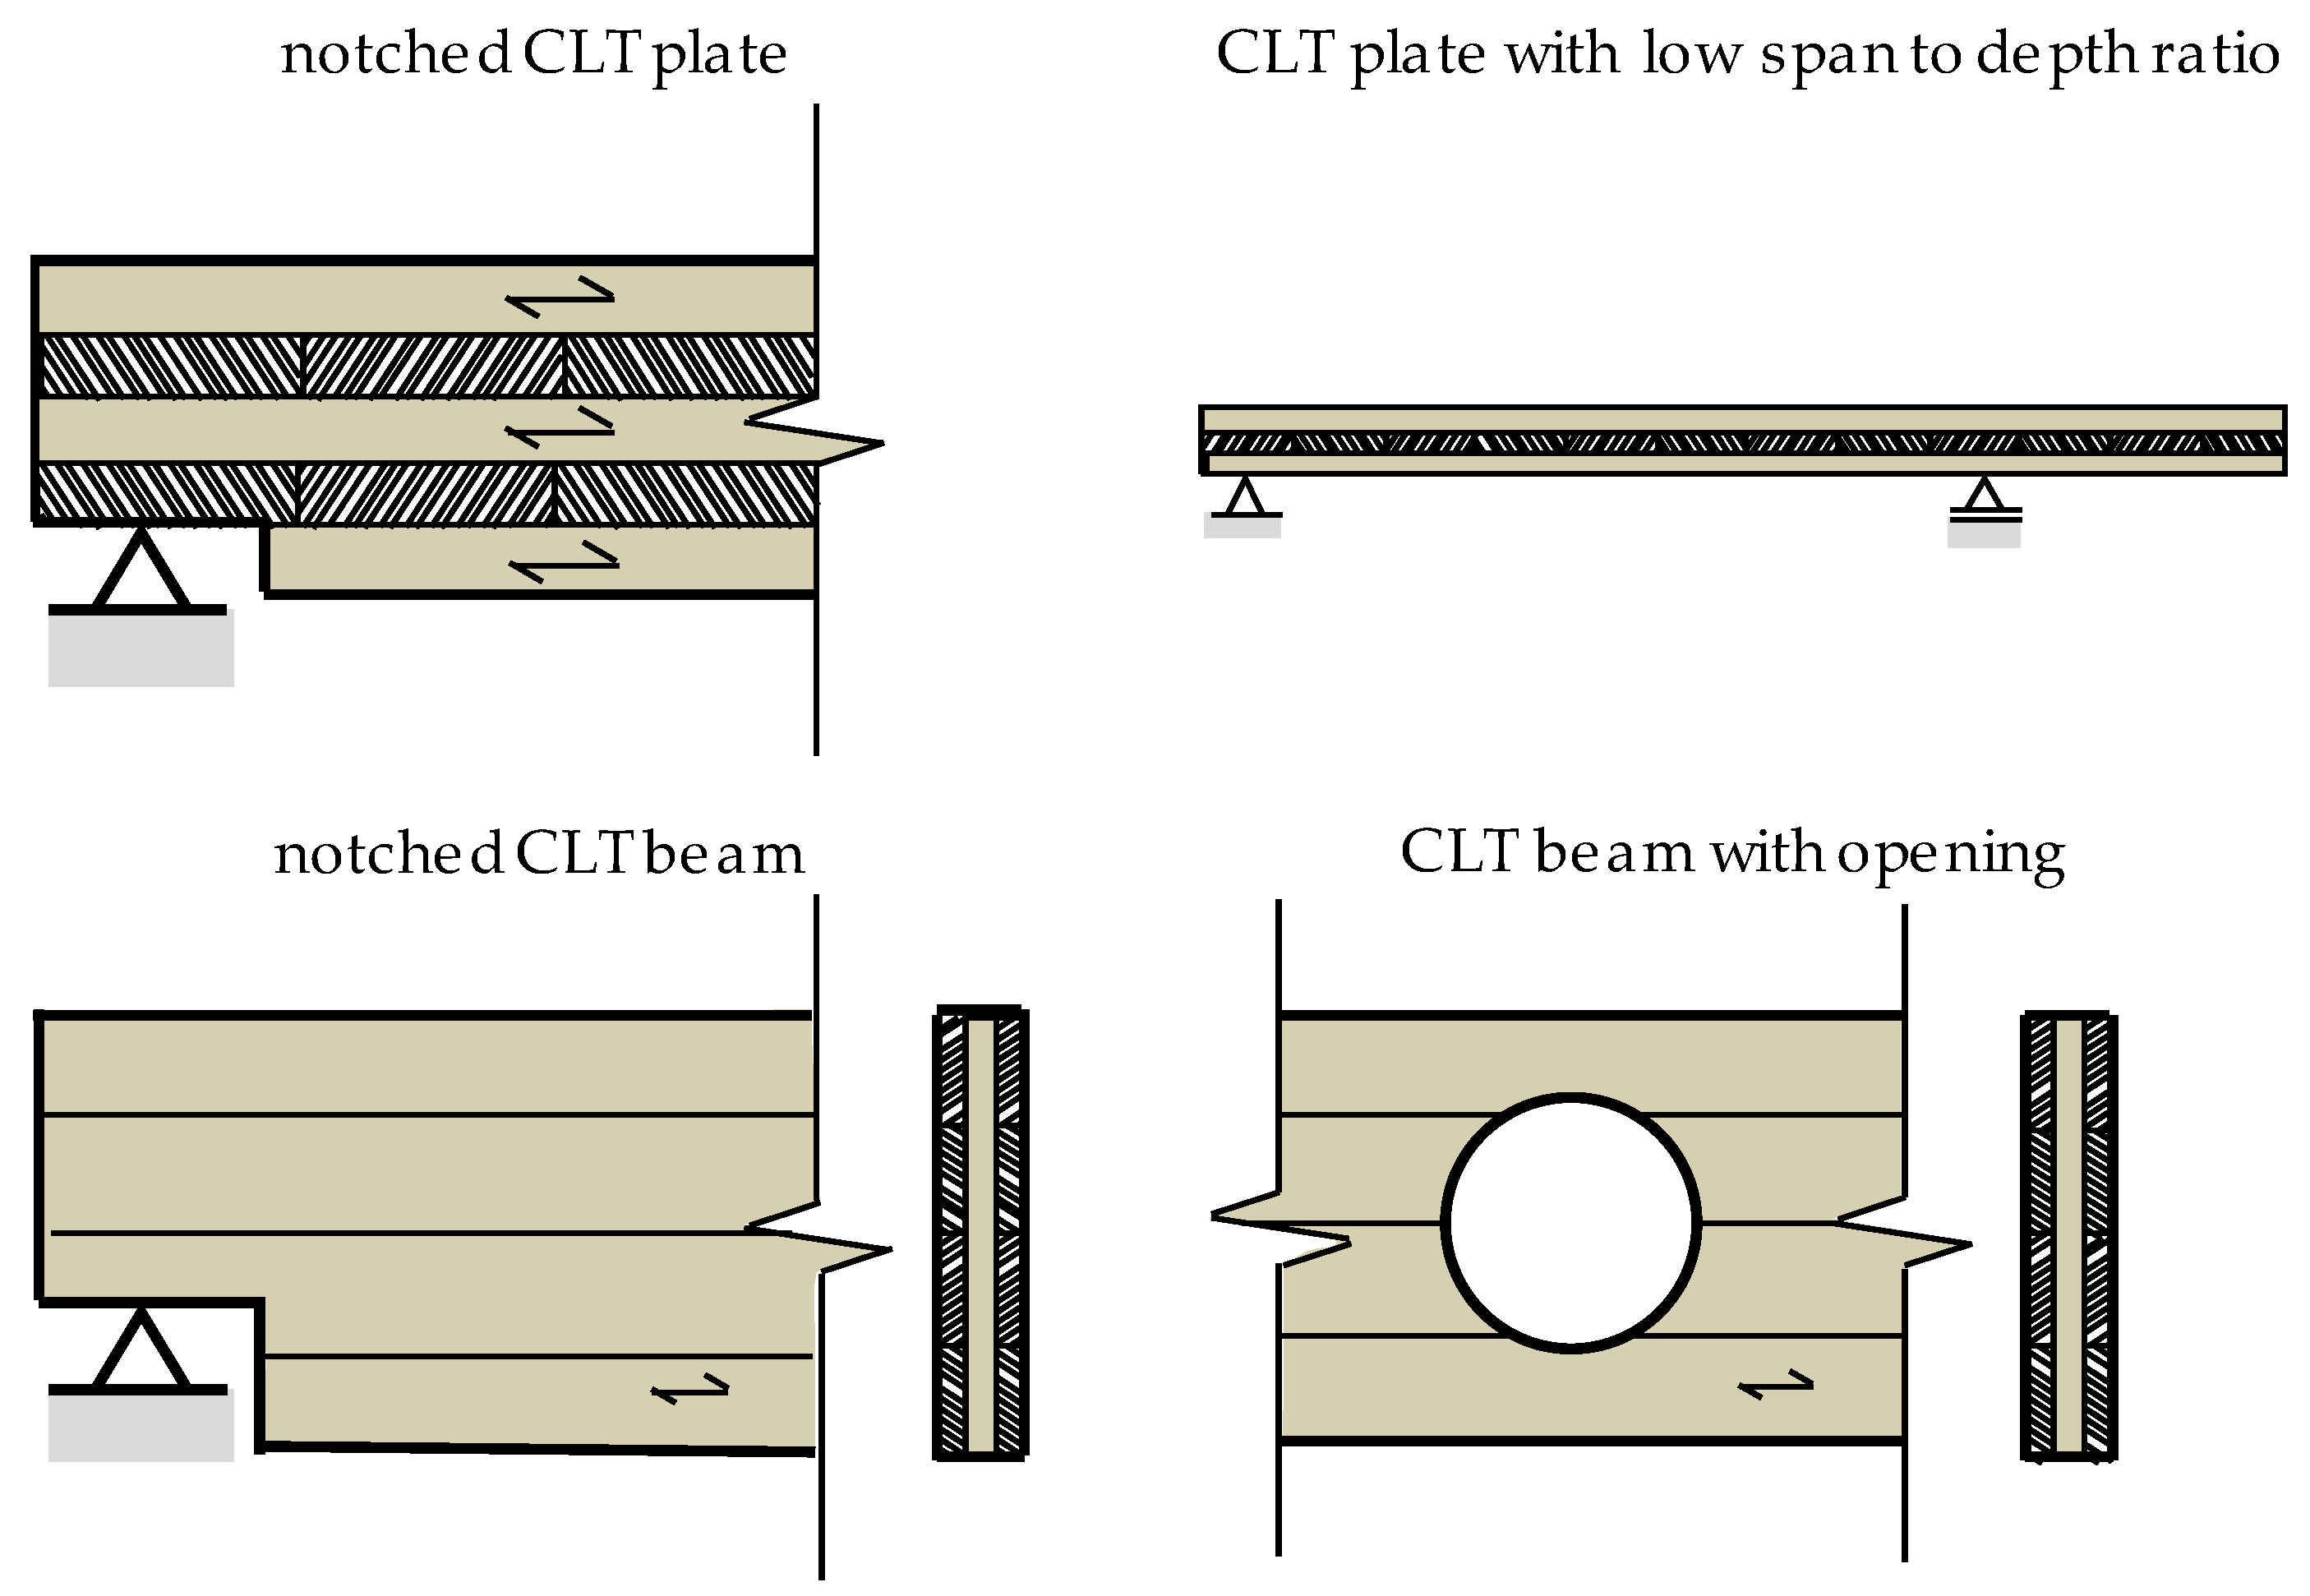
Cross laminated timber (CLT) is typically a board-based structural timber product characterized by a symmetric layup of crosswise arranged layers of lengthwise finger jointed strength graded boards and/or wood-based panels applicable for structural purposes. Being usually produced as large-dimensional panels (e.g., up to 16 m in length, 3.5 m in width, and 500 mm in thickness), CLT is commonly used for floor, ceiling, and wall elements, as well as girders, acting as a slab, diaphragm, and/or beam. In CLT elements that are exposed to out-of-plane bending, i.e., acting as slabs, so-called rolling shear stresses, i.e., shear stresses transverse to the fiber direction, occur in the cross layers that are oriented transverse to the acting moment. These rolling shear stresses, which represent inherent characteristics of this orthogonally-layered timber product, dominate the shear resistance of CLT slabs and need to be checked during the ultimate limit state (ULS) design rather than the shear stresses in the longitudinal direction. Although the rolling shear resistance is rarely a limiting criterion in the ULS design of CLT elements, there are some cases (e.g., slabs with low span-to-depth ratios, notched areas, or CLT beams with holes and openings, see Figure 1) where it might become the limiting ULS criterion.
In any case, for the ULS design, according to the load and resistance factor design (LRFD) approach, a representative characteristic rolling shear strength value is needed. Such a value shall be based on sufficient engineering knowledge regarding the principle mechanisms and an awareness of the main influencing parameters on the rolling shear properties of CLT. Prior to the herein presented investigations, some of these parameters have still been overlooked or have, thus far, deliberately not been considered. This, for example, is reflected by the large variety of test methods in current standards and literature (c.f. [1]) and by the partly contradicting regulations—with respect to the evaluation procedures—as well as the characteristic properties.
The two most important standards or guidelines in this context in Europe are EAD 130005-00-0304:2015 [2] (hereby simply referred to as EAD), which serves as a guideline for obtaining a European Technical Assessment (ETA), and EN 16351:2021 [3], the (still not harmonized) European product standard for CLT. Both the EAD [2] and EN 16351 [3] rule four-point-bending (4PB) test configurations for determining the rolling shear strength of CLT, while the geometric properties for the test setup according to EN 16351 [3] are related to the CLT thickness tCLT = h, and the EAD test setup demands a constant geometry irrespective of the CLT thickness.
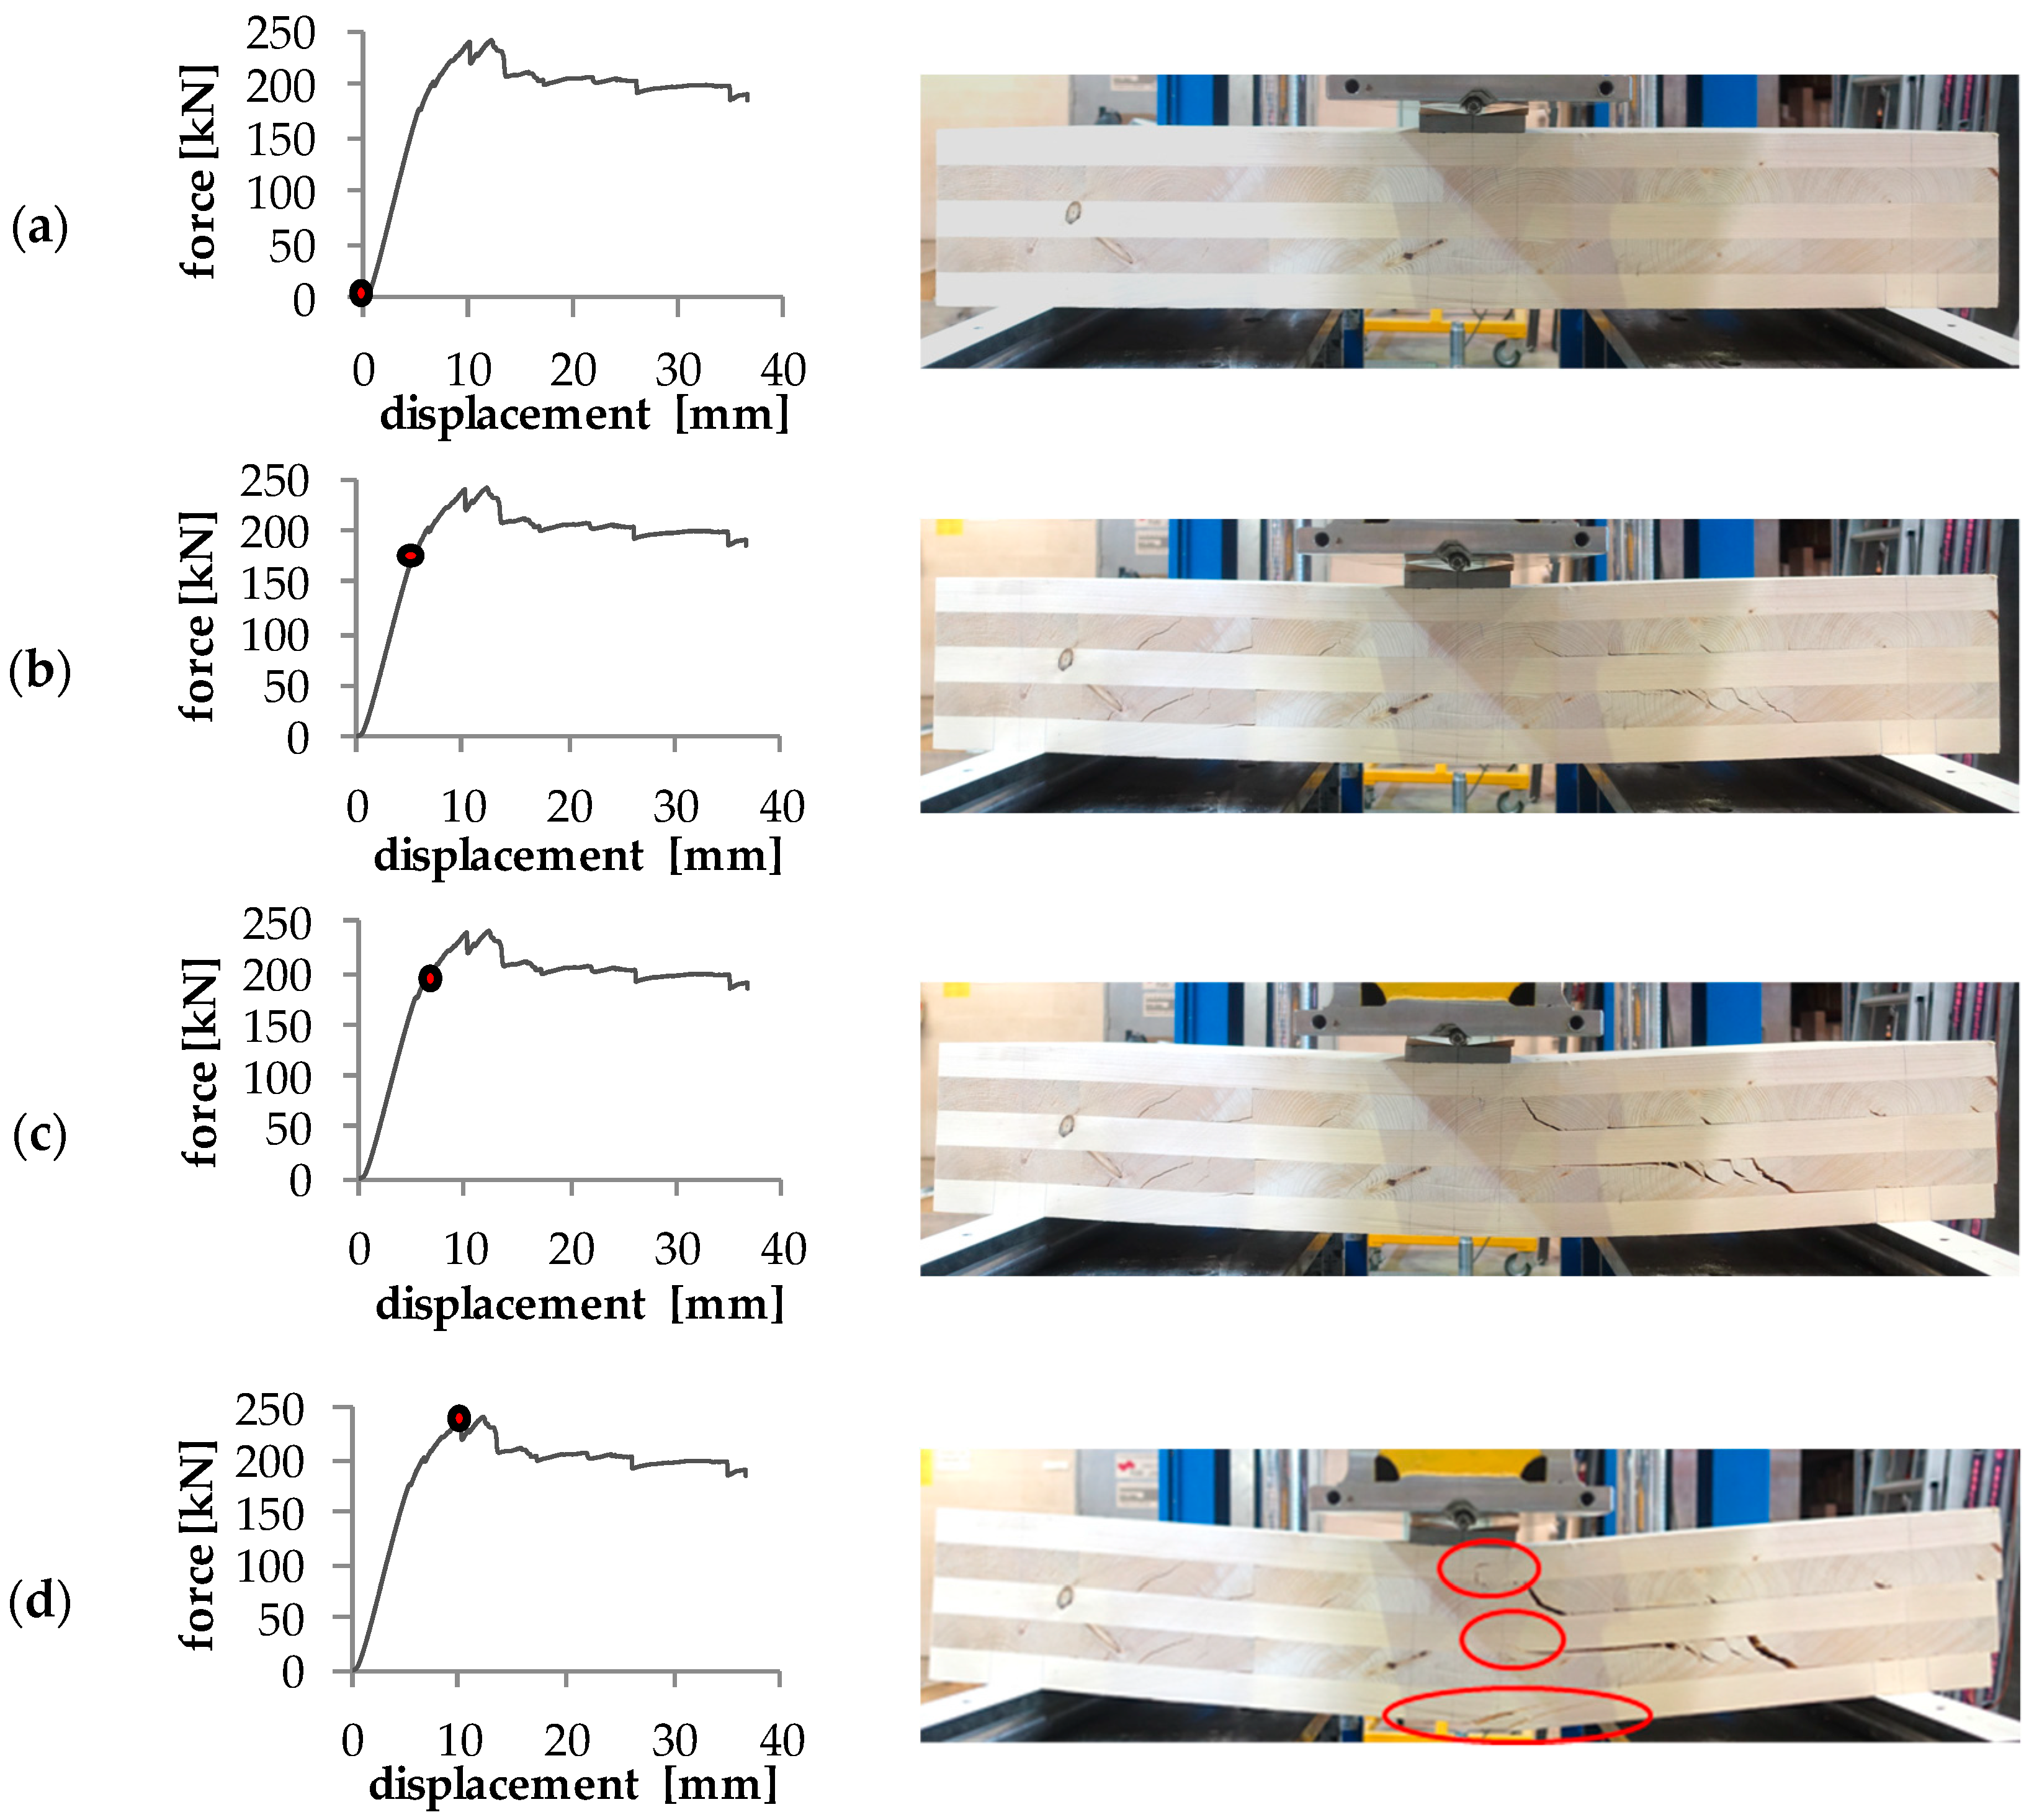
As EN 16351 [3] is not yet harmonized for CE-marking (declaration of conformity of products with essential requirements), thus far, every European CLT product is regulated via an ETA for which compliance with the requirements under EAD [2] is mandatory. Based on the experience gained from executing multiple test programs in the frame of such ETA processes at the Lignum Test Center (LTC), as part of the Institute of Timber Engineering and Wood Technology at Graz University of Technology, it needs to be concluded, that the test setup for rolling shear according to EAD [2] frequently fails to generate satisfactory results, i.e., to provoke rolling shear failures at the maximum load. Especially in CLT elements featuring multiple cross layers (nCL > 1), usually associated also with thicker CLT slabs, rolling shear cracks occur already prior to the ultimate failure. This behavior is observed partly already at 80% of the subsequently achieved maximum load, which is then limited by bending or a mixed bending and rolling shear failure. Figure 2 illustrates various steps exemplarily from a three-point-bending (3PB) test (a1 according to EAD [2]; a2 = 0). After an initial linear-elastic phase, the first rolling shear cracks occur. They are visible by short-term load drops in the force–displacement diagram (Figure 2b).
The cracks open and extend further but at a slower rate, which is because of the displacement-controlled test execution in combination with the reduced stiffness caused by the already occurred partial failures (see Figure 2c). As already mentioned, the maximum load is often associated with a tensile-bending failure of the longitudinal layer in the bending-tension zone. This is followed by successive tensile-bending failures of all longitudinal layers (Figure 2d), a consequence of the change from a rigid to a more flexible composite caused by the rolling shear failure of the cross layers. Such an ultimate bending failure was observed in approximately 30% of the total approximately 300 rolling shear tests conducted at the LTC in accordance with the EAD [2].
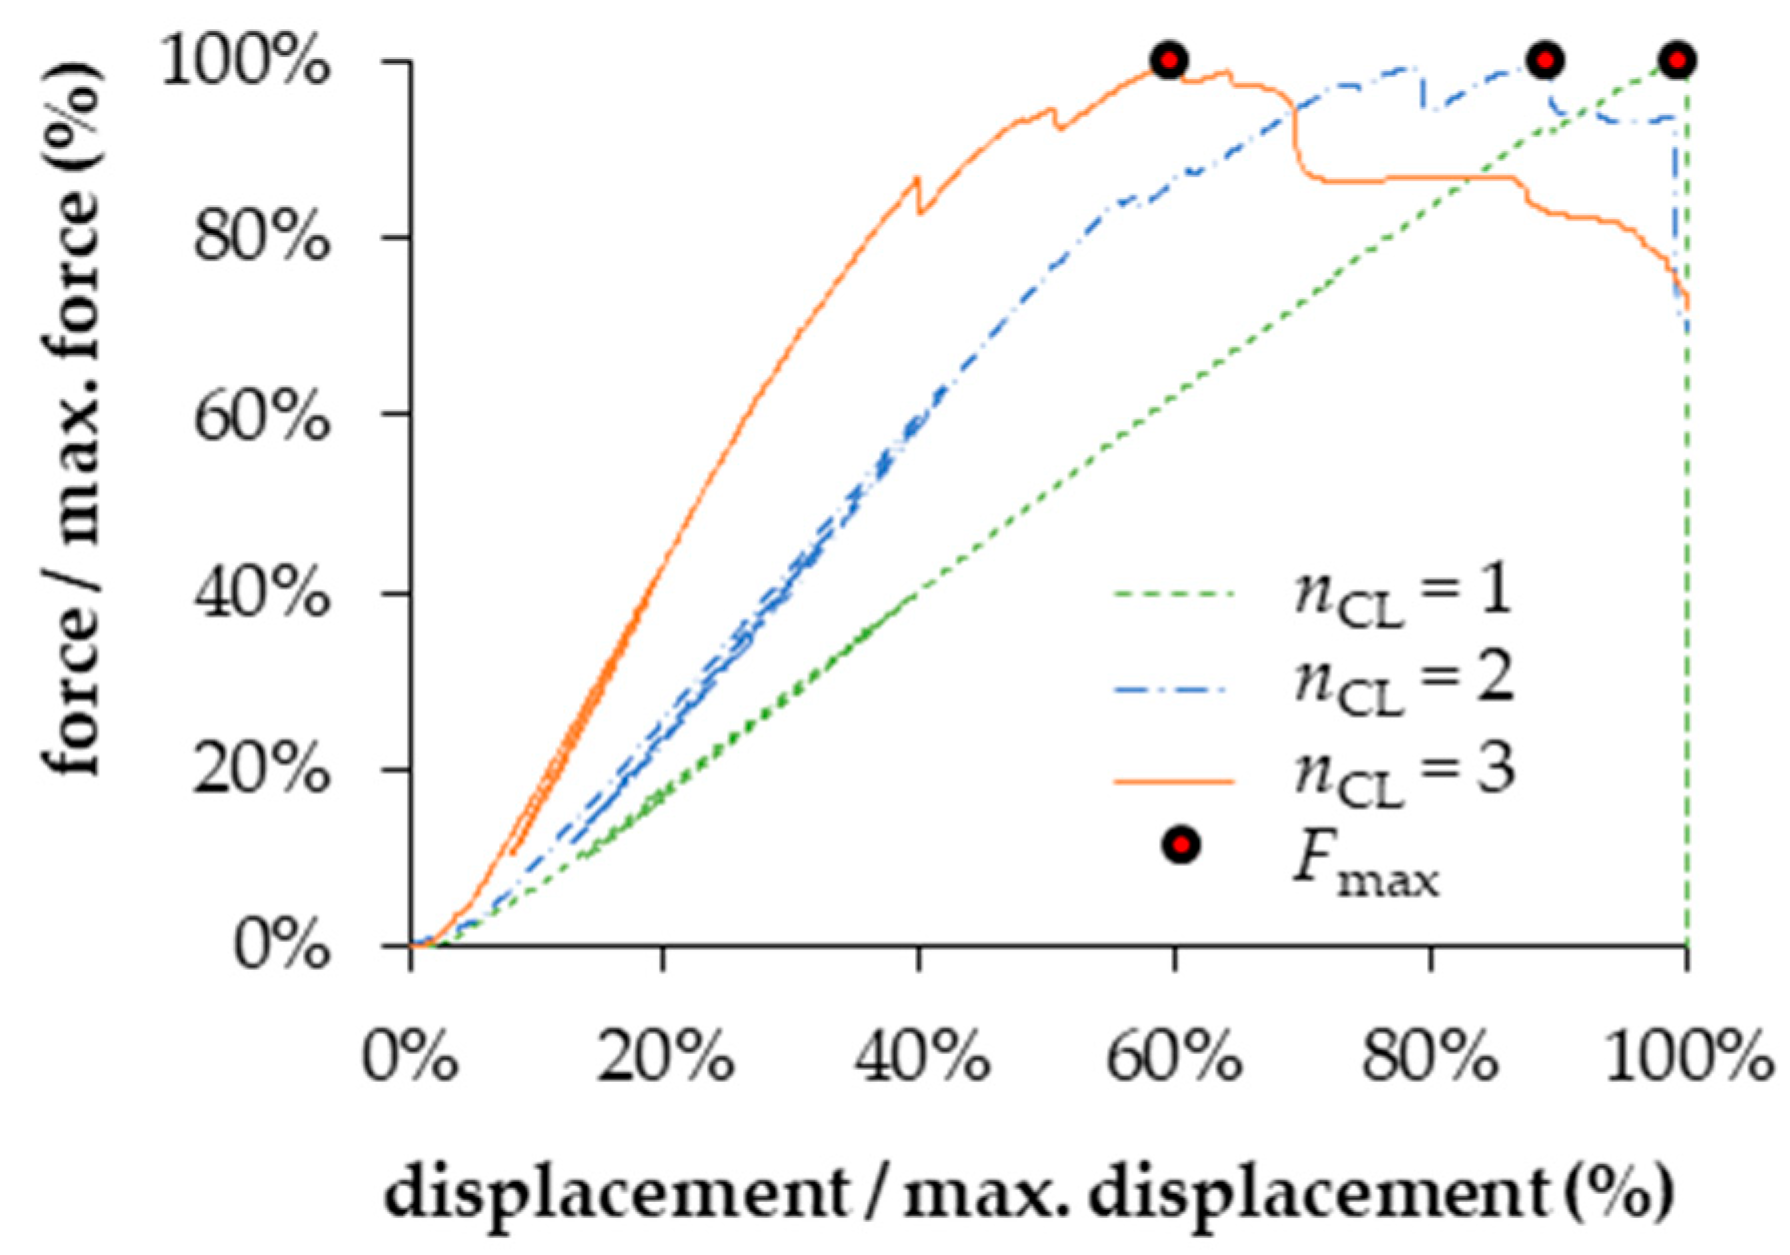
The above described behavior increases with the increasing number of cross layers, i.e., the increasing thickness of the CLT slab, is illustrated in Figure 3, which shows typical normalized force–displacement curves of 4PB tests according to EAD [2] for CLT with nCL = {1; 2; 3}, clearly pointing out that CLT slabs featuring just one cross layer can be characterized by a linear-elastic material response and a quasi-brittle failure. In CLT slabs featuring multiple cross layers, however, several short-term force drops associated with multiple partial failures prior to and post the maximum force are observed. As the first rolling shear cracks already occur prior to the maximum force (partially already at 80% of the maximum force) and as the failure mode at the maximum force is usually not rolling shear but rather primarily bending, there is no on-hand solution available for a reliable and objective definition of the rolling shear failure, the corresponding resistance and thus the rolling shear strength. This necessitates further in-depth analyses. In addition, it appears of utmost importance to generally question the current regulations for rolling shear testing in EAD [2], e.g., regarding the constant shear field length, which provokes direct load transfer (and possibly the pronounced cracking behavior prior to the maximum force) when testing thick CLT slabs, and to develop a proposal for a test procedure that reliably leads to the intended rolling shear failures of CLT at maximum force.
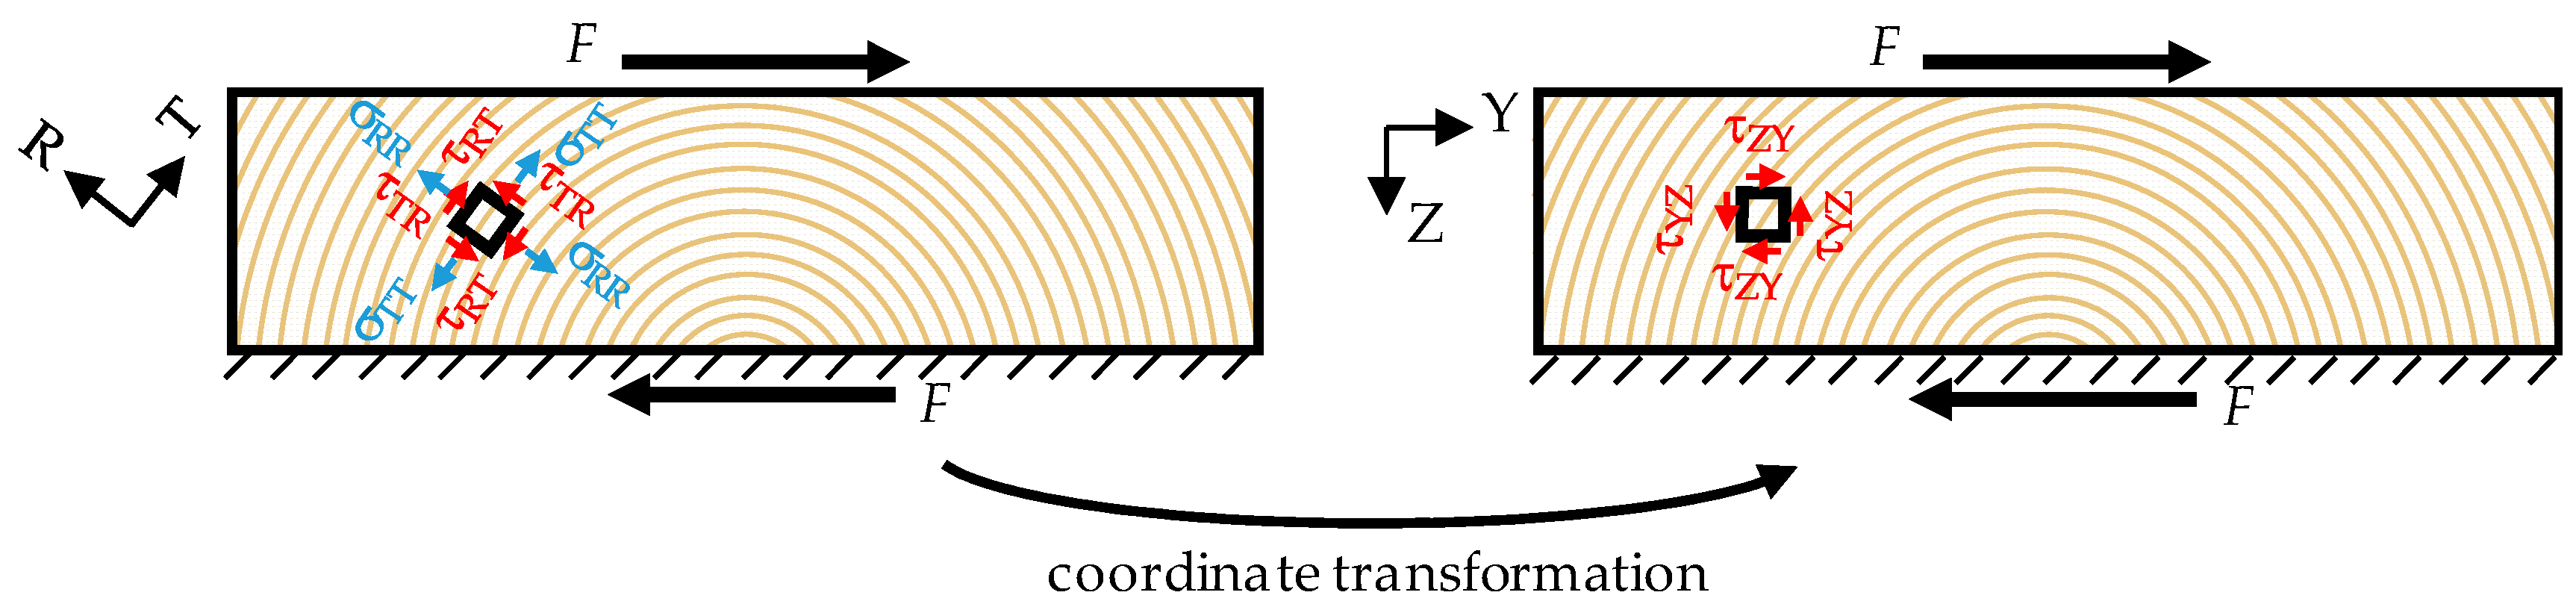
Nevertheless, before rolling shear in the context of CLT can be properly discussed, first, the definition of rolling shear, as it is used further in this contribution, is needed. Currently, there are two explicit definitions in the literature: the first one defines rolling shear properties in reference to the cylindrical coordinate system (CS) with longitudinal (L), radial (R), and tangential (T) directions. The anisotropic behavior of timber can be well described in this CS. Here, rolling shear stresses τRT are shear stresses in the RT-plane. The corresponding rolling shear strength fr,RT can be seen as a material property. While this definition is very suitable for wood technology and for representing the material on the corresponding hierarchical scale, it is hardly applicable in timber engineering, which treats timber as an orthogonally isotropic building material. This is because the annual ring orientation, along which τRT gradually changes, is generally unknown to engineers, and in the case of structural timber products, such as glued laminated timber (glulam) and CLT composed of a large number of face-glued unidirectionally and orthogonally laminated boards/lamellas, is subject to the individual components but not representative of the products. In such cases, it becomes beneficial to define rolling shear stresses τYZ also in the cartesian XYZ-CS of a board, as the shear stresses in the YZ-plane. This can be seen as a coordinate transformation of the stress state in the LRT-coordinates to the XYZ-coordinates (c.f. Figure 4). However, as τYZ now consists of normal stresses σRR and σTT of the cylindrical CS, the corresponding rolling shear properties fr,XY and Gr,XY can no longer be seen as material properties, and rather, they represent system properties that are dependent on the stress state and the sawing pattern of the individual board as a function of annual ring orientation, pith distance, eccentricity and aspect ratio.
Within this contribution, rolling shear stresses will be treated as τYZ in the XYZ-CS unless stated otherwise.
1.2. Common Setups for Testing the Rolling Shear Strength
As already outlined in Section 1.1, there are different test setups to determine the rolling shear strength fr. According to Ehrhart and Brandner [1], these test setups can be divided into two groups: the atomistic testing of single elements that form the system CLT and the holistic testing of entire CLT slabs. Concentrating on the holistic approach, the test methods can be categorized into: (i) out-of-plane bending tests and (ii) shearing tests. The most widely used out-of-plane bending test is the four-point bending (4PB) test, which is also anchored in EAD [2] and EN 16351 [3]. The dimensions and overall setup of the 4PB tests according to EAD [2] and EN 16351 [3] can be found in Table 1 and Figure 5. The main difference between these two is the definition of the geometry of the slab, which is constant in the case of EAD [2] and dependent on the slab thickness tCLT in the case of EN 16351 [3]. This difference, however, may be significant, as it has a huge impact on the volume under shear stress. Although the volume dependency is not yet proven for the rolling shear strength, it is widely known to impact a number of other strength values of timber and engineered timber products, such as the tensile strengths parallel and perpendicular to the grain, longitudinal shear strength of solid timber and glulam and in-plane shear strength of CLT [4,5,6,7,8].
Another major difference between the regulations in EN 16351 [3] and EAD [2] is the evaluation of stresses. Whereas the stresses according to EAD [2] should be calculated either using the Shear Analogy Method (SAM) according to [9] or the modified γ-method, EN 16351 [3] prescribes the Timoshenko beam theory. However, it is still unclear how the rolling shear strengths determined from different calculation methods coincide.
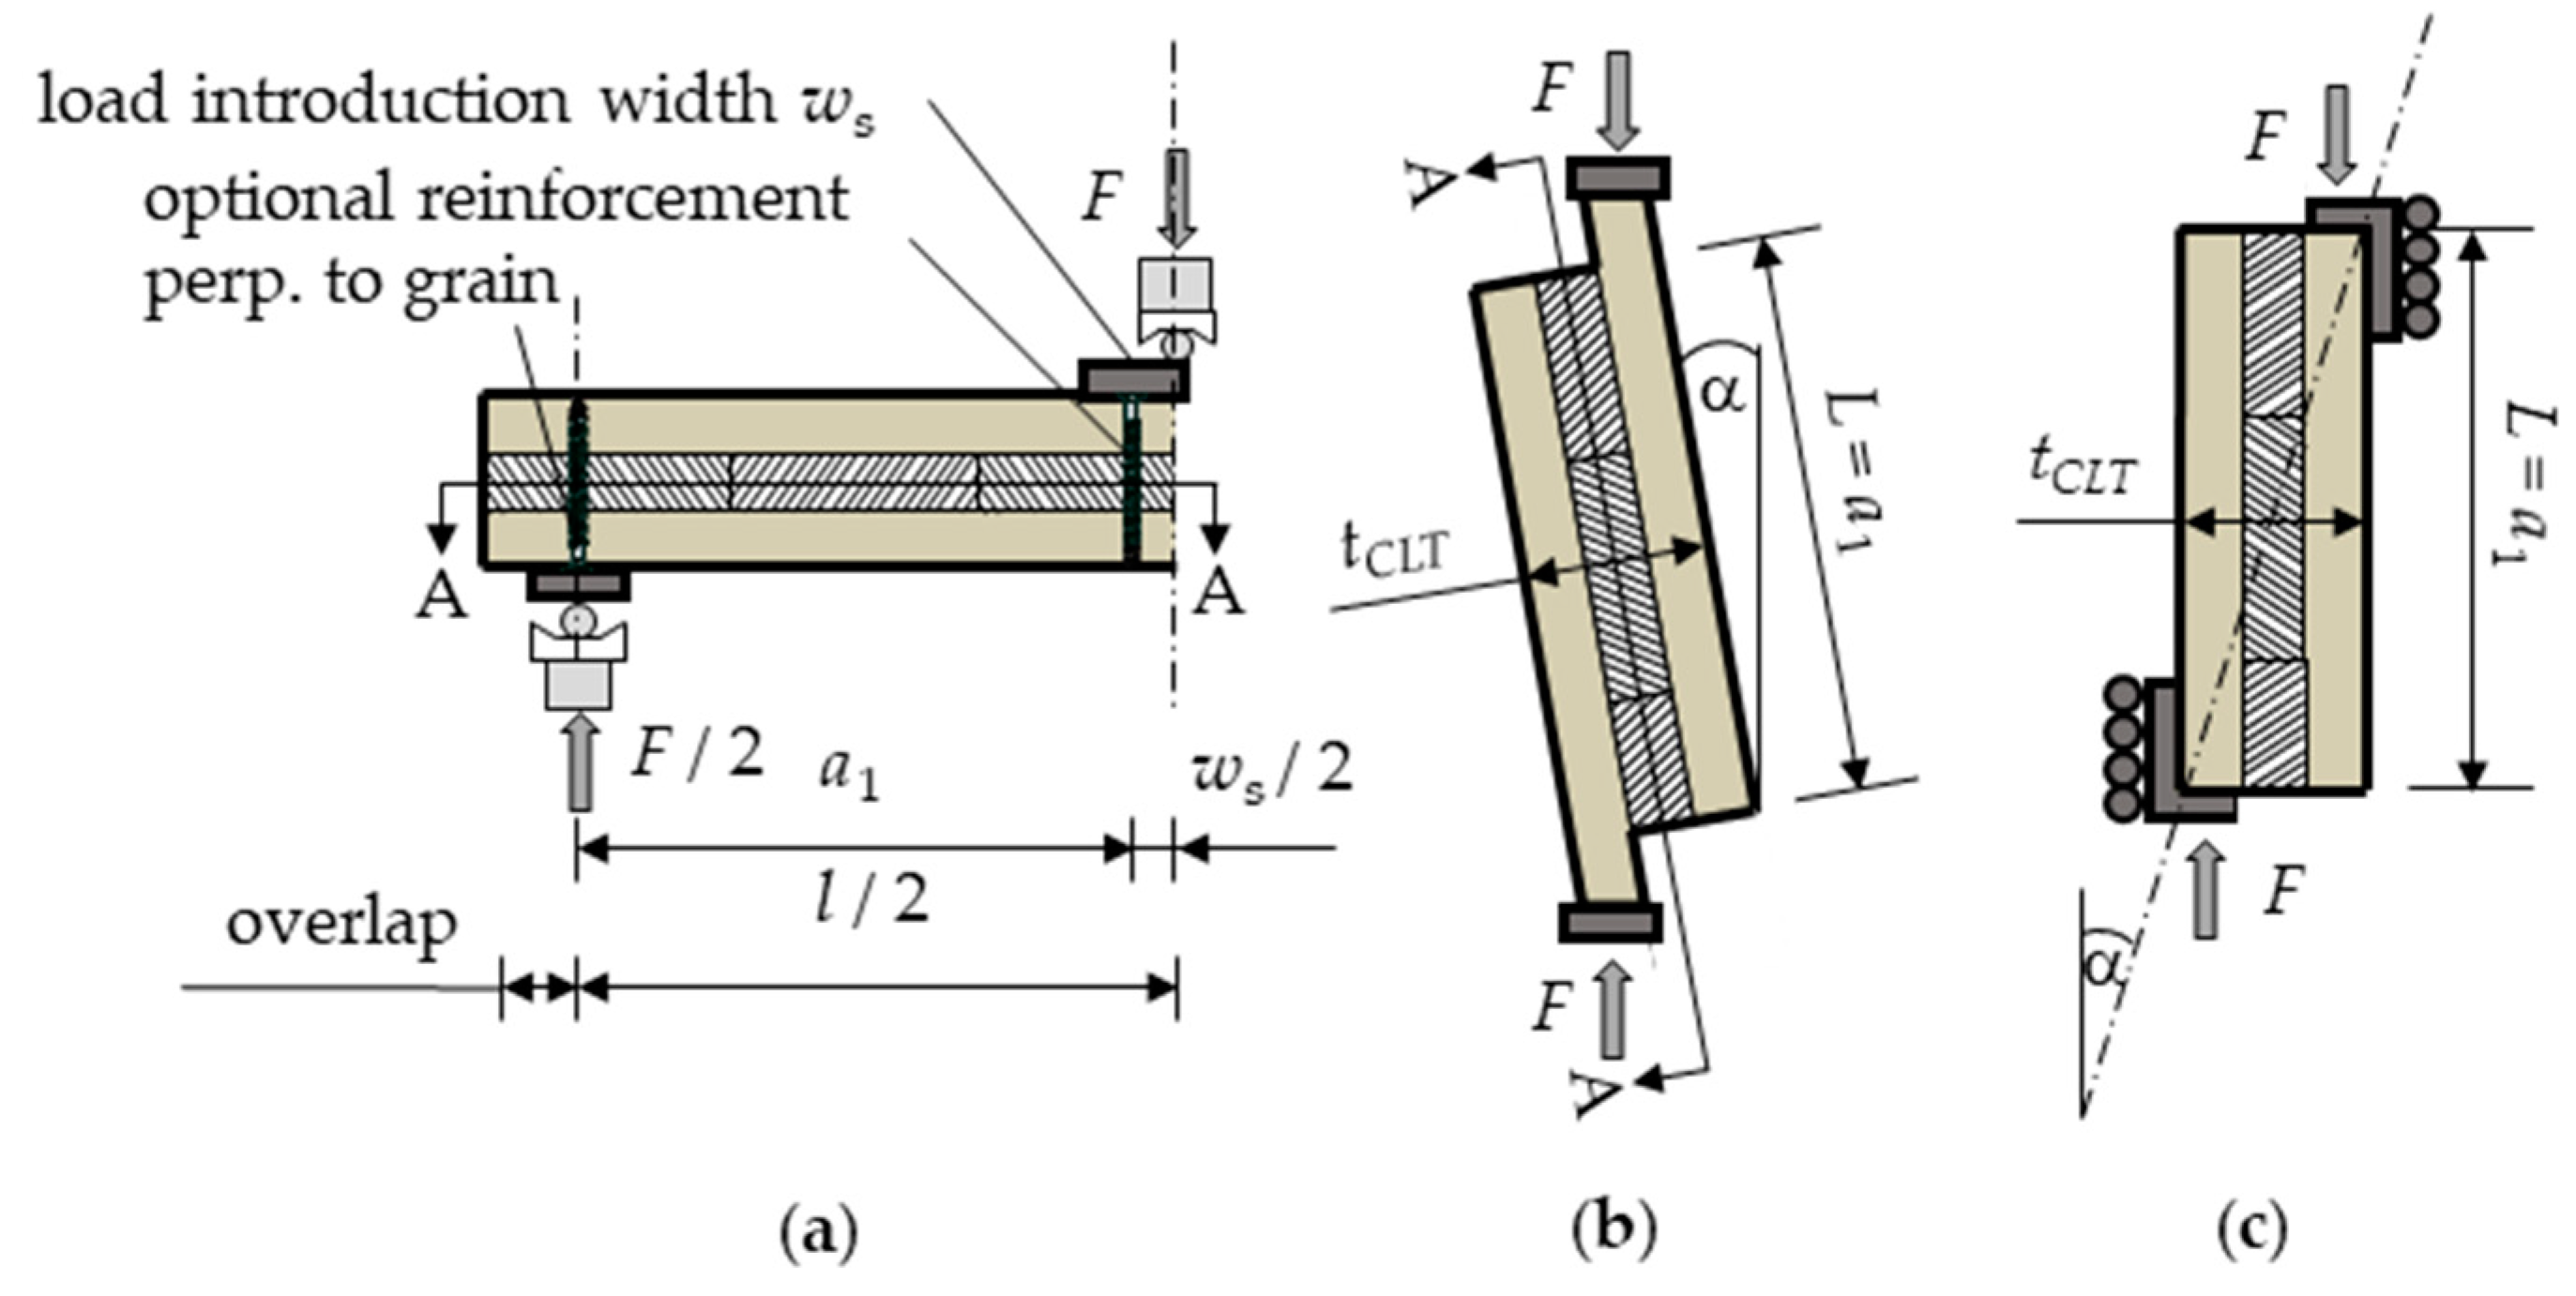
In respect to rolling shear, a simplification of the 4PB test is the three-point bending (3PB) test, where the distance between the load introductions a2 is reduced to zero (Figure 6a). For a better load introduction, an optional reinforcement perpendicular to the grain in the form of self-tapping, fully-threaded timber screws or glued-in rods, is possible. However, the latter is rather complex to realize when it comes to CLT, as a multitude of discrete reinforcements must be placed along the slab width in the respective areas.
In general, the great advantage of an out-of-plane bending test—as compared to other setups—comes from the representation of a stress state, which is very similar to typical practical exposures. However, the major downsides of these configurations are the overall higher material usage and—especially when tested according to EAD [2]—the previously mentioned regular occurrence of ultimate bending failures instead of ultimate rolling shear failures.
An example of a shear test in the form of an inclined compression shear (IS) test is given in Figure 6b, which was used, for example, in [10,11,12] and was derived from the inclined compression shear test for determining the longitudinal shear properties in EN 408 [13]. In this configuration, the shear force is introduced in the longitudinal layers of the specimen, which is rotated by 14° to the vertical axis. EN 16351 [3] also offers a shear test, which is in accordance with the shear test configuration according to EN 789 [14] (see Figure 6c). For this test, the shear force is applied on the end grain (parallel to the grain direction) of the outer layers. The minimum width is 100 mm, and the length L shall be chosen in dependence of tCLT to obtain an inclination angle α = 14° between the diagonal and vertical force directions. However, Aicher et al. [15] noted, in reference to the IS test in EN 408 [13], that the inclination angle should rather refer to the resultant force than the diagonal of the specimen.
Figure 6.
(a) Three-point bending test; (b) IS test analog to EN 408 [13]; (c) rolling shear test according to EN 16351 [3] and EN 789 [14].

A first comparison of different test setups was made by Silly [16], who investigated the suitability for testing the rolling shear modulus and strength of the already discussed test setups and some additional atomistic approaches, which will not be dealt with within this paper. He recommended the IS test compared to the 3PB and 4PB tests due to the reduced material usage, although it was noted that the IS test is not really suited to investigate CLT with multiple cross layers.
1.3. Previous Research Regarding the Rolling Shear Strength
The IS test configuration was then used by Ehrhart and Brandner [12] on single board segments and also multiple board segments in parallel and serial arrangements of different European softwoods and hardwoods. In the case of Norway spruce, no influence of the density on fr was found. Instead, a decrease in fr with a decreasing board aspect ratio wb/tb was observed. Their recommended equation, which is based on the tests on single board segments, fr,k = 0.2 + 0.3 wb/tb, with a minimum value of 0.8 N/mm2, was included in the former working draft of Eurocode 5 (prEN 1995-1-1 (2018) [17]) for the CLT strength class CL24. However, this equation was later excluded from prEN 1995-1-1 (2021) [18], where fr,k was set to a constant value of 0.7 N/mm2, due to reasons unknown to the authors of the present contribution. Meanwhile, the influence of the board aspect ratio on fr of single boards was confirmed by several researchers (e.g., [19,20]).
In contrast, IS tests on CLT (i.e., a number of boards acting as a system) made of spruce–pine–fir (SPF) with a board aspect ratio of wb/tb ≈ 2.3 indicated that the board aspect ratio was less relevant as long as the boards have close contact at the narrow faces [21], i.e., without any gaps between boards/laminations within the same layer (fr,mean = 1.50 N/mm2 and 1.52 N/mm2 for the specimens with and without narrow face bonding, no gaps). Instead, fr decreased by 25% when 6 mm gaps were present. A similar result was found by Gardner et al. [22] using a 3PB test on SPF specimens with a1 ≈ 3 tCLT and wb/tb ≈ 5.1. Here, fr,mean = 1.53 N/mm2 without gaps decreased by approximately 45% if the gap width was roughly wb, which is similar to the 50% loss of rolling shear area.
Zare [23] conducted 4PB tests according to EN 16351 [3] and IS tests on CLT made of split boards without narrow face bonding (and a reference series with narrow face bonding) and with different wb/tb ratios and cross layer thicknesses tCL. The wb/tb ratios were varied between 1 and 5 in integer numbers, and the cross layer thicknesses were varied between 10 mm and 40 mm in 10 mm steps. For the IS tests, a decreasing fr with the increasing cross layer thickness tCL (keeping wb/tb constant) and decreasing wb/tb (keeping tCL constant) was reported. By increasing tCL from 10 mm to 40 mm, the rolling shear strength was reduced by approximately 35%. However, except for wb/tb = 1, the differences between the different board aspect ratios were very small and mostly in the range of the scatter within each test series, thus indicating no statistical relevance of the board aspect ratio. Regarding the presence of gaps, no clear trend was found for 4 mm wide gaps and a board aspect ratio of wb/tb = 5 compared to the specimens without gaps.
The 4PB test setup according to EN 16351 [3] was used by O’Ceallaigh et al. [24] on CLT of Irish Sitka spruce with a constant ratio of wb/tb ≈ 3.8 and without gaps or relief grooves for all layups. They observed a decrease in fr,mean from 2.22 N/mm2 to 1.30 N/mm2 when tCLT increased from 60 mm to 120 mm, given the layups of 20-20-20 mm and 40-40-40 mm (cross layers are underlined), which indicates a size effect. The additionally tested five-layered test series of 20-20-20-20-20 mm resulted in fr,mean = 1.40 N/mm2. The minimum resulting fr,k of the 3s-120 layup makes the currently proposed regulation of the EC 5 draft seem rather conservative.
Apart from the above, Mestek et al. [10] observed that the interaction of rolling shear stresses with compression stresses perpendicular to the grain leads to an increase in fr,mean by up to 20%. Looking at the EAD test setup, this could lead to an overestimation of the rolling shear strength for elements with a high tCLT, as the volume relatively free of compressive stresses decreases with the decreasing a1/tCLT (cf. Figure 5(1b)). The influence of stresses perpendicular to the grain on the rolling shear resistance was also investigated by Akter and Bader [25], who applied different failure criteria (according to Hill [26], Hoffman [27], and Steiger and Gehri [28]) on their test results. These results showed a less pronounced positive effect of compressive stresses perpendicular to the grain on the rolling shear resistance in general and a better agreement of test data with Hoffman’s criterion, compared to the criterion according to Steiger and Gehri, which is anchored in the Swiss standard SIA 265:2021 [29] for the interaction of stresses perpendicular to the grain with longitudinal shear. However, the test samples by Akter and Bader were made with Norway spruce clear wood, and the tests were evaluated in the cylindrical CS (cf. Section 1.1), i.e., not according to the hereby treated “engineering” stresses in the cartesian CS.
Like many other properties of timber, it is assumed that the rolling shear strength is influenced by the wood moisture content u. However, there is very limited work regarding this phenomenon. The findings of Akter et al. [30] indicate a (as a simplification for the paper at hand linearized) decrease in fr,RT by ~2% per percent increase in moisture content and even a decrease of almost 4% per percent increase in moisture content for the compression strength in the radial direction for moisture contents within 4% and 24%. As these test results are again based on clear wood evaluated in the cylindrical CS, a simplified consideration with a 3% decrease per percent increase in moisture content, which is in line with the proposal for longitudinal shear, according to Brandner et al. [6], seems reasonable.
1.4. Scope
To summarize the methods of current testing practice, the findings of previous research on the topic, and our own experience in testing the rolling shear strength that was presented in Section 1.1–Section 1.3, the main unresolved issues regarding the rolling shear strength of CLT are:
- a reliable and objective definition of the rolling shear failure and strength of CLT is not available;
- it is unclear whether different calculation methods anchored in various standards give comparable results;
- the comparability of test results gained by different test setups is uncertain;
- the interaction of rolling shear stresses with stresses perpendicular to the grain is not considered in current testing practice;
- although very likely, the dependency of the rolling shear strength on the specimen size was not yet considered nor quantified.
The aim of this paper is to resolve these open questions and combine the hereby gained knowledge with existing research to propose recommendations for a harmonized standard. These above listed open questions will be dealt with in the following sections. In Section 2.1, a proposal for the definition of rolling shear failure and the associated rolling shear strength is made. Material and methods for the comparison of calculation methods and for the numerical comparison of test setups will be presented in Section 2.2, while material and methods for the experimental comparison of test setups will be described in Section 2.3. The results of the numerical investigations are shown in Section 3.1, and of the experimental program in Section 3.2. The results of the previous sections are then combined to derive a strength model to describe the rolling shear strength of CLT in Section 4. The paper will then close with a summary and conclusions of the main findings of this contribution in Section 5. The major part of the herein discussed results were presented already at the INTER Meeting 2022 [31]. In the meantime, these have been extended and complemented by two additional test series to validate the proposed strength model.
2. Material and Methods
The following Section presents a method to objectively define and evaluate the rolling shear failure and strength of CLT. This method will then be applied to the following experimental investigations of this paper. Furthermore, the material and methods for the numerical investigation, consisting of FE analyses of IS, 3PB, and 4PB tests, and a comparison of different calculation methods and experimental tests are presented.
2.1. Proposal for the Definition of Rolling Shear Failure and Strength of CLT
As mentioned in Section 1.1, in out-of-plane bending tests, rolling shear cracks may already occur prior to the ultimate failure of the specimen. These cracks lead to a reduction of the effective bending stiffness of the total beam. This, as a consequence of ongoing crack propagation, leads to lower rolling shear stresses in the cross layers and higher normal stresses in the longitudinal layers. This stress redistribution takes place because the (assumed) quasi-rigid connection of the layers (rigid composite) gradually decomposes until—in theory—the limit state of a loose connection is established (flexible composite without any connection stiffness between the layers). In reality, the normal stresses in the longitudinal layers increase until the bending strength of a single longitudinal layer is reached, which marks the ultimate bending failure through a characteristic bending-tension failure mode. The loss of the initial quasi-rigid connection between the layers violates the assumptions usually made in the calculation of stresses, which is also indicated in the regular tensile failure of multiple longitudinal layers, c.f. Figure 2d. If the quasi-rigid connection would last after the observed partial failures, the ultimate bending failure would only manifest as a bending-tension failure in the outermost longitudinal layer in the bending-tension zone of the slab.
Given these circumstances and the necessity of following the EAD test setup, at the LTC, an internal rule was established to evaluate fr at the force Fcrack associated with the occurrence of the first clearly detectable rolling shear cracks instead of automatically taking the maximum force Fmax. Fcrack is determined by manually identifying force drops in the force versus time curves—in combination with the notes of the lab staff in the testing protocols. However, this identification lacks objectivity, meaning the uncertainty or even the bias introduced by individual interpretations cannot be fully prevented. In order to gain a more objective determination of the rolling shear strength, guidance was taken from existing regulations for the determination of the compressive strength perpendicular to the grain [13]. Therein, fc,90 is determined at the level of the intersection of the stress–strain curve with the tangent modulus (modulus of elasticity in compression perpendicular to the grain, evaluated between 10% and 40% of fc,90) shifted by 1% strain. An analog rule for rolling shear would require that the shear displacement must be continuously recorded. This is, however, not deemed suitable as (i) the arrangement of a shear field measurement is rather complex; (ii) common measurement devices, e.g., displacement transducers, are very likely to get damaged during the cracking/fracture of the specimen; and (iii) as CLT generally consists of multiple cross layers with intermediate longitudinal layers, the sole measurement of rolling shear displacement is both challenging and demanding (a possible solution could be contactless field measurements via digital camera systems coupled with real-time data evaluation via the digital image correlation, i.e., DIC).
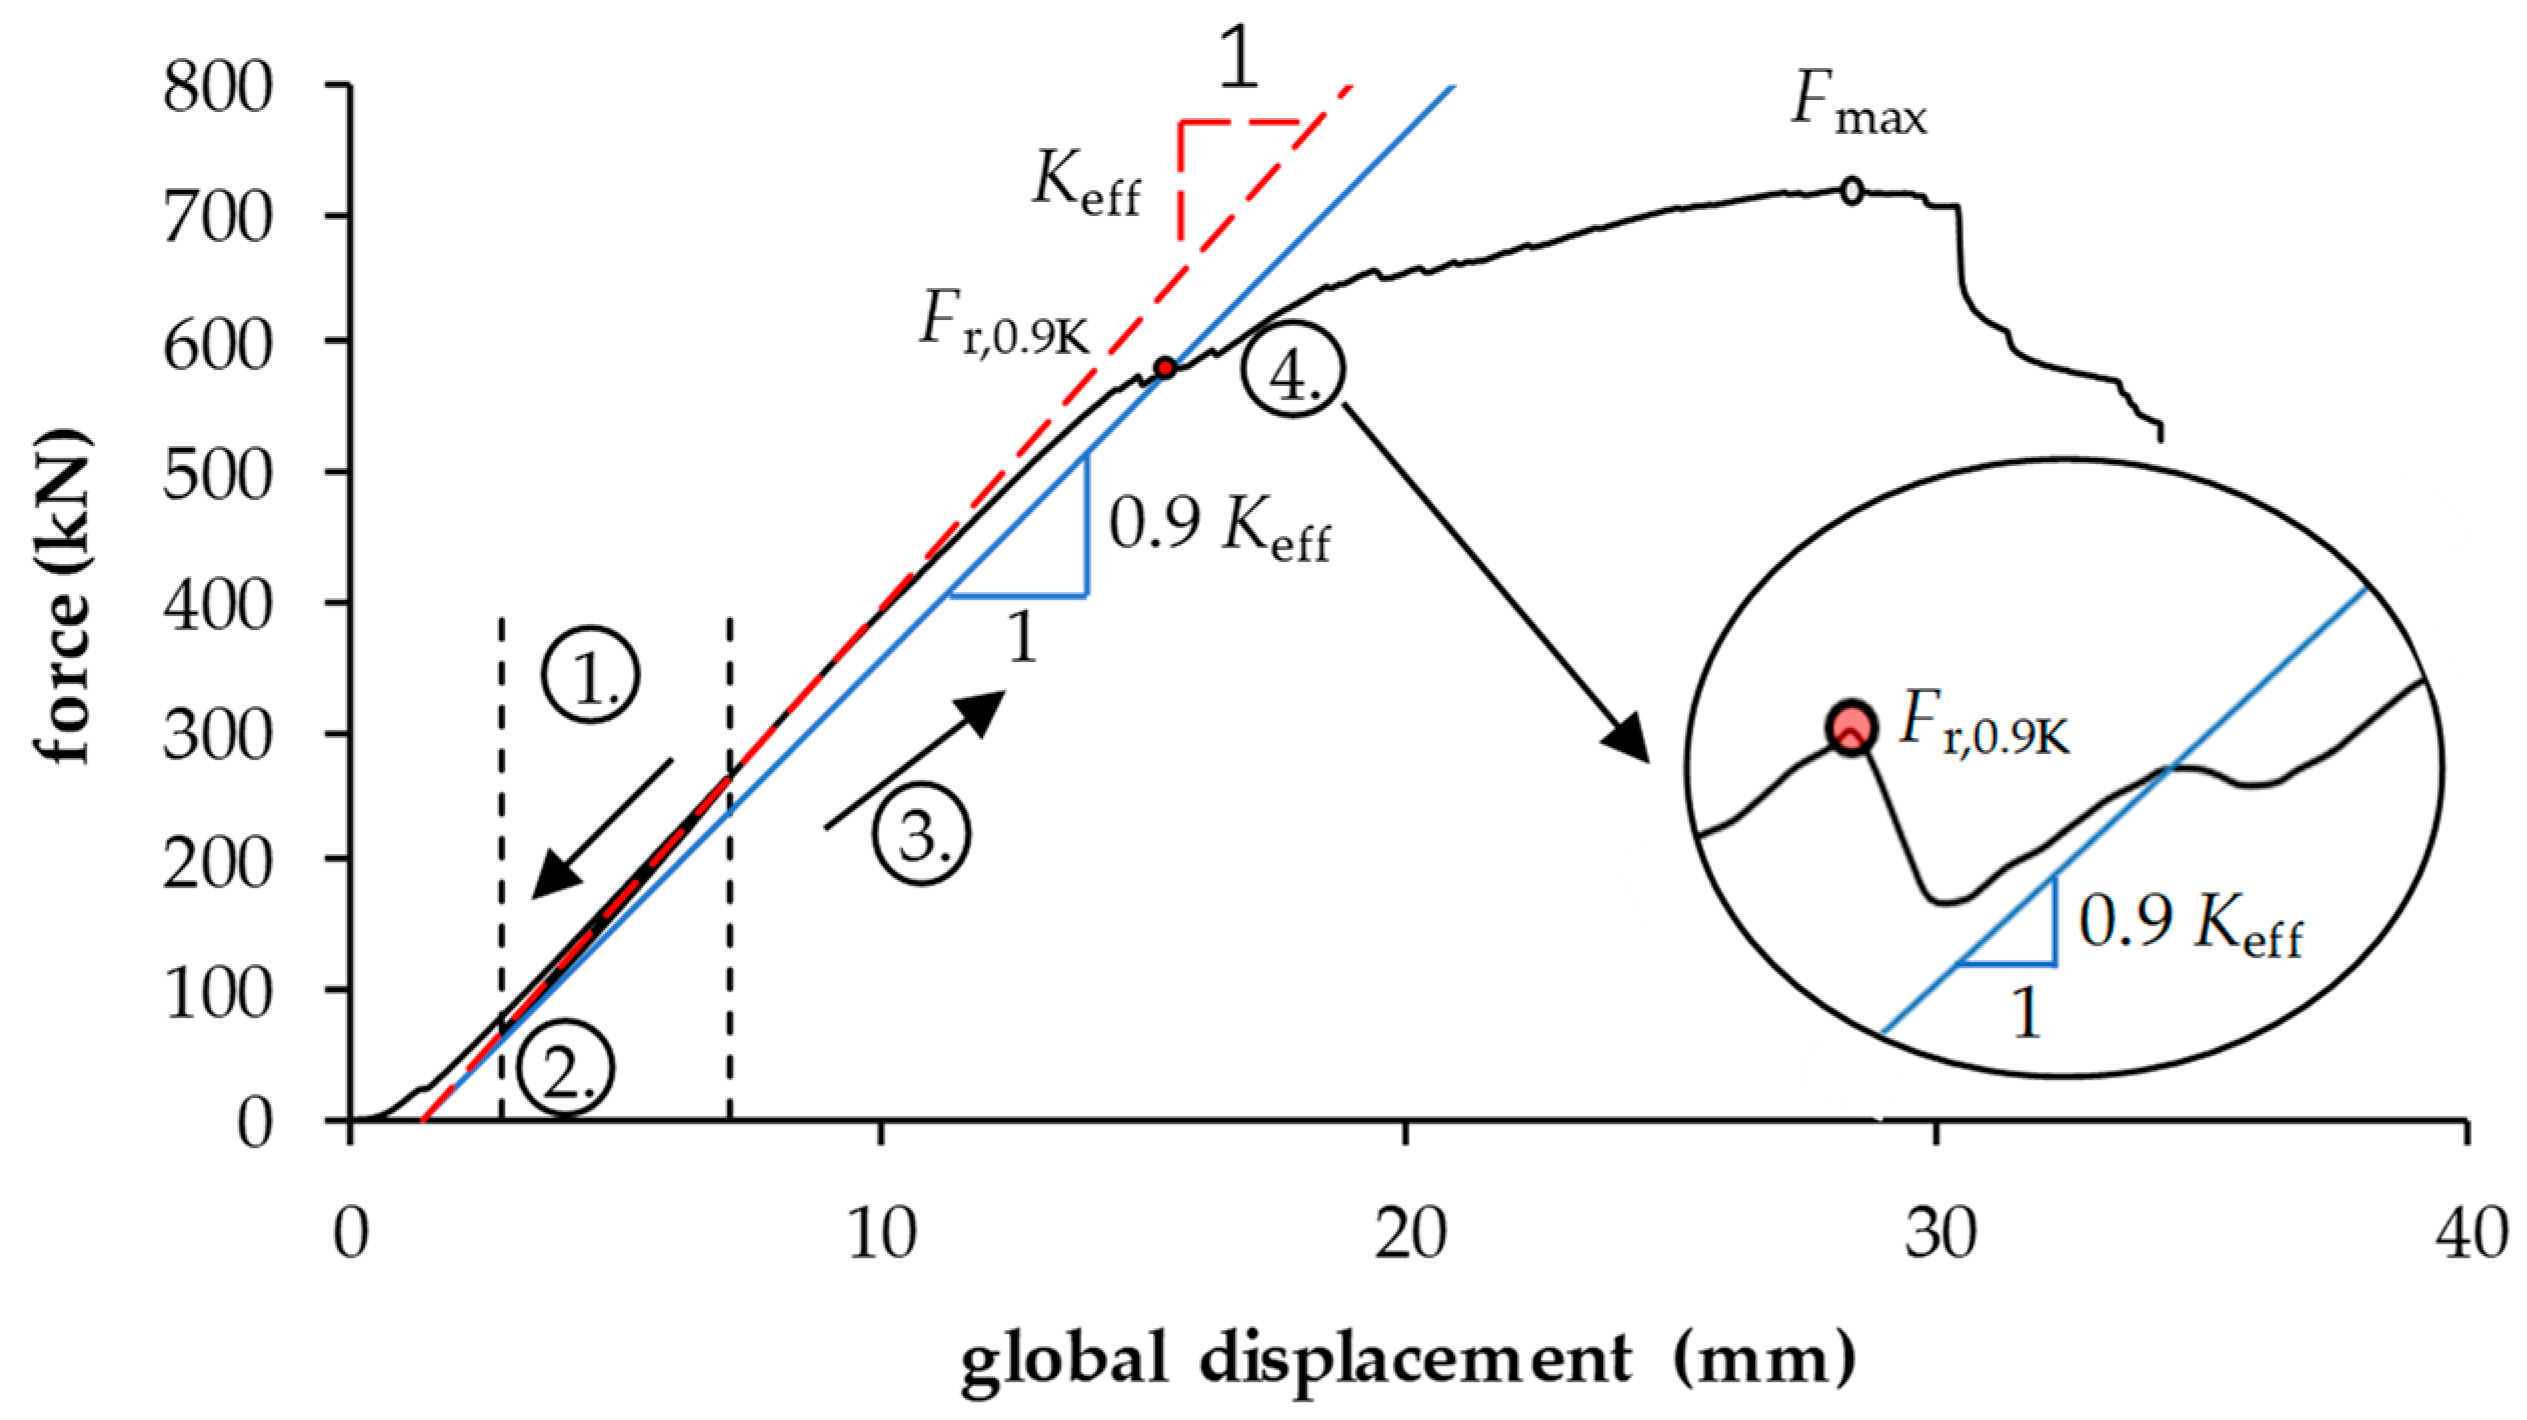
An alternative was found by considering the effect of rolling shear cracks on the effective bending stiffness, i.e., the transformation from a rigid to a flexible composite. Based on this effect, it is proposed to define fr based on a limit for an acceptable stiffness reduction brought about by partial rolling shear failures. In detail, it is proposed to define fr based on the maximum force that occurred until the effective system stiffness Keff of the CLT slab under test, determined as a secant stiffness within the apparent linear-elastic range, is reduced by 10%. The evaluation consists of the following steps, which are illustrated in Figure 7:
- determination of the effective system stiffness Keff by linear regression of the force versus global displacement relationships between 10% and 40% of Fmax;
- intersection of the linear regression line at F = 0;
- construction of a second linear function with a slope of 0.9 Keff, which intersects with the linear regression line from Step 2 at F = 0;
- intersection of the linear function from Step 3 with the force–displacement curve of the tested specimen. Fr,0.9K, which is used to calculate fr, is then the maximum force, which occurred until this intersection.
The 10% stiffness reduction was determined conservatively as a value that only allows for a very limited stress redistribution within the CLT slab after partial failures, i.e., after the first rolling shear cracks occur. The results of this approach were also compared with those based on the current LTC internal testing procedure, and a very good agreement was found. Still, the hereby presented methodology does not intend to substitute the visual assessment and manual recording of the lab staff during testing, which is still a mandatory part of the overall testing procedure.
2.2. Numerical Investigations
2.2.1. Comparison of Calculation Methods
The comparison of calculation methods was made to identify possible differences in the calculated stresses considering the Timoshenko beam theory, modified γ-method, Shear Analogy Method (SAM), and Finite Element (FE) Analysis. For this comparison, past data from fifteen 4PB rolling shear test series held at the LTC served as the basic input for the geometric parameters and layup information (c.f. Table 2). These tests were carried out in the scope of EAD test programs with the specimens being produced by five different European CLT manufacturers. Additional information regarding the manufacturing process will be presented in Section 2.3.2. As all test series were manufactured with softwood boards of nominal strength class C24 according to EN 338:2016 [32], the corresponding elastic parameters were taken as basis for the calculation methods (E0,mean = 11,000 N/mm2, E90,mean = 370 N/mm2, and G090,mean = 690 N/mm2). Additionally, the mean value of the rolling shear modulus was set to Gr,mean = 100 N/mm2 according to [12]. For the simple beam theories, however, the modulus of elasticity perpendicular to the grain was set to zero. In the frame of a first check on the influence of Poisson’s ratio on the outcomes for rolling shear stress distributions for one specific test setup, no significant influence was found. As a consequence, the Poisson’s ratio was also set to zero in the following investigations.
For the assembly of the 2D-FE shell models with RFEM 5.17 [33], quadrilateral Mixed Interpolation of Tensorial Components (MITC4) elements (c.f. [34]) with a constant mesh size of 5 mm were used—assuming linear elastic orthotropic material properties. The steel plates at the supports and load introductions were modeled via beam elements with no axial stiffness (in span direction), and with the load introduction, respectively, the support located in the center of the beam with the length ws. The cross sections of the steel beams were rectangular, with a height of 20 mm and a width equal to the width of the CLT slab. All models used the axis of symmetry at midspan. For the SAM, the distance between the hinged couplings of the beams was set to 50 mm as a compromise between the resolution of results and the numerical stability of the model.
For the constant shear force distribution along the shear field in the 4PB tests, the resulting shear stress distributions calculated by the modified γ-method and the Timoshenko beam theory also remain constant. In the case of the SAM, however, the resulting shear stress distribution is non-constant and of similar shape to the stress distribution calculated by FE analysis. Thus, for better comparability, the maximum resulting rolling shear stress τr,max and the mean rolling shear stress τr,i,mean,a1 according to Equation (1), which is defined as the rolling shear flow along the span in reference to the shear length a1 in cross layer i were used. For CLT elements with an odd number of transversal layers, only the middle layer was evaluated as the maximum rolling shear stresses occur within this layer. Thus, it can be assumed that the initial failure occurs within this layer. For an even number of cross layers, the mean value of both cross layers closest to the center layer was taken. Additionally, as a simplification, only the stresses at mid-height of the respective cross layers were evaluated (along section A-A according to Figure 6).
2.2.2. Comparison of Test Setups
As currently, several different test setups are used to determine the rolling shear properties of CLT, the aim was also to analyze a selected number of setups numerically. This was done with respect to possible differences in the rolling shear stress distributions and the resulting stress maxima, which, as a consequence, would result in different rolling shear strengths. For this purpose, via FE models a three-layered element with a layup of 40-40-40 mm was analyzed mirroring two 4PB test setups as anchored in EN 16351 [3] (a2 = 3 tCLT = 360 mm and a2 = 6 tCLT = 720 mm), a 3PB test setup (a2 = ws = tCLT/2 = 60 mm), and an IS test with α = 10°, all while maintaining the nominal shear field length a1 = 3 tCLT = 360 mm. The modeling of the setups was done using the approach already described in Section 2.2.1. Furthermore, these test setups were compared to a unidirectional layup of 40-40-40 mm (without a cross layer). Lastly, the influence of reinforcement against the stresses perpendicular to the grain on the rolling shear stress distribution was investigated. The reinforcement was realized assuming fully-threaded self-tapping timber screws with a nominal diameter of dnom = 10 mm and positioned as one column transverse to the span direction with a constant spacing of s = 70 mm (13 screws/m). This screw application was then implemented into the FE models as beam elements with an axial stiffness equal to the effective steel cross-section of the whole screw group and all other stiffness components equal to zero.
2.3. Experimental Tests
2.3.1. Parameter Variation
This Section describes the materials and methodologies used to analyze the influence of the parameters: test setup, geometric properties, stressed volume, and the effect of reinforcement against stresses perpendicular to the grain. For this purpose, an additional test program consisting of eleven 3PB and two IS test series was carried out. The 3PB test setup was chosen in favor of 4PB tests to reduce material usage. The CLT specimens were manufactured by manufacturer 05 in three different layups: two layups with three layers (L1: 40-20-40 mm, L2: 40-40-40 mm) and one layup with five layers (L3: 40-40-40-40-40 mm). The boards used for the transversal layers of L1 and all layers of L3 had a width of wb = 200 mm (wb/tb = 10, respectively, 5), whereas the boards of the transversal layers of L2 had a width of wb = 160 mm (wb/tb = 4). The CLT specimens consisted of softwood boards (Norway spruce; Picea abies) of nominal strength class C24 according to EN 338:2016 [32] had no narrow-face bonding and no relief grooves or visible gaps. A summary of the main geometric parameters is given in Table 3.
Although the specimens of equal layup were taken from the same CLT master panel, special attention was paid to ensure that the cross layers within a test series contained different boards. This was carried out to ensure a more realistic depiction of the natural variability of timber properties within common CLT slabs. Still, with this test program, it was not possible to represent the variability between different production batches or manufacturers (cf. [35]).
Some test series were reinforced at the loading and support areas to introduce compressive stresses perpendicular to the grain deeper and more concentrated into the specimen in order to reduce the interaction and the overall increasing effect of those stresses on the rolling shear resistance. The reinforcement was realized by means of fully-threaded self-tapping timber screws with a nominal diameter of dnom = 10 mm, which were positioned as one column transverse to the span direction with a constant spacing and edge distance of s = 70 mm.
Parallel to the tests, each setup was also evaluated with 2D FE models by applying the same methodology as described in Section 2.2. In the case of the reinforced test series, the screws were considered, as outlined in Section 2.2.2.
2.3.2. Tests of EAD Database
The findings of the test program described in Section 2.3.1 were then used on a database containing 295 4PB test results from past EAD test campaigns, with the geometric properties according to Table 2 and a width of w = 800 mm, to derive a basic model for predicting the rolling shear strength of CLT slabs made of softwood boards. The adhesives used for side-face bonding were either one component polyurethane or two component melamine–urea formaldehyde. All CLT specimens were produced using hydraulic presses. During testing, no indication of insufficient bond line integrity in the form of delamination was given. The boards of the cross layers were either narrow-face bonded or had wb/tb > 3.6. Due to confidentiality reasons, more detailed information about the CLT production process cannot be provided.
The base material of all test series was softwood, mainly Norway spruce with a possible share of Scots pine and Silver fir, classified according to EN 338:2016 [32], and the boards did not contain any relief grooves and were arranged without visible gaps. All rolling shear strength values calculated from the test results were corrected to a reference moisture content uref = 12% according to the already mentioned proposal by Brandner et al. [6] for longitudinal shear.
2.3.3. Interaction of Rolling Shear Stresses and Stresses Perpendicular to the Grain
The effect of stresses perpendicular to the grain on the rolling shear resistance was considered by the application of two ellipsoidal failure criteria (according to Steiger and Gehri [28], whose approach is anchored in SIA 265 [29], and according to Hoffman [27]) and the bilinear model according to Mestek et al. [10]).
The failure criteria were adapted for fr, see Equations (2)–(4). For Hoffman’s criterion, it was assumed that σRR = σ90, σRR = 0, and τRT = τr. Furthermore, the required strength values were set to the mean values fc,90,mean = 3.50 N/mm2 according to [36] and ft,90,mean = 1.50 N/mm2 according to [7].
The rolling shear strength fr, corrected for influences from stresses perpendicular to the grain and based on the stress distribution τr,corr,i(x), was obtained by continuously applying the failure criteria (Figure 8b) on the stress distributions τr,i(x) and the corresponding σ90(x) along section A-A in the centerline of the cross layer(s) i (cf. Figure 8a). The rolling shear strength fr,i was then obtained by evaluating Equation (1) for τr,corr,i(x) instead of τr,i(x).
3. Results and Discussion
3.1. Numerical Investigations
3.1.1. Comparison of Calculation Methods
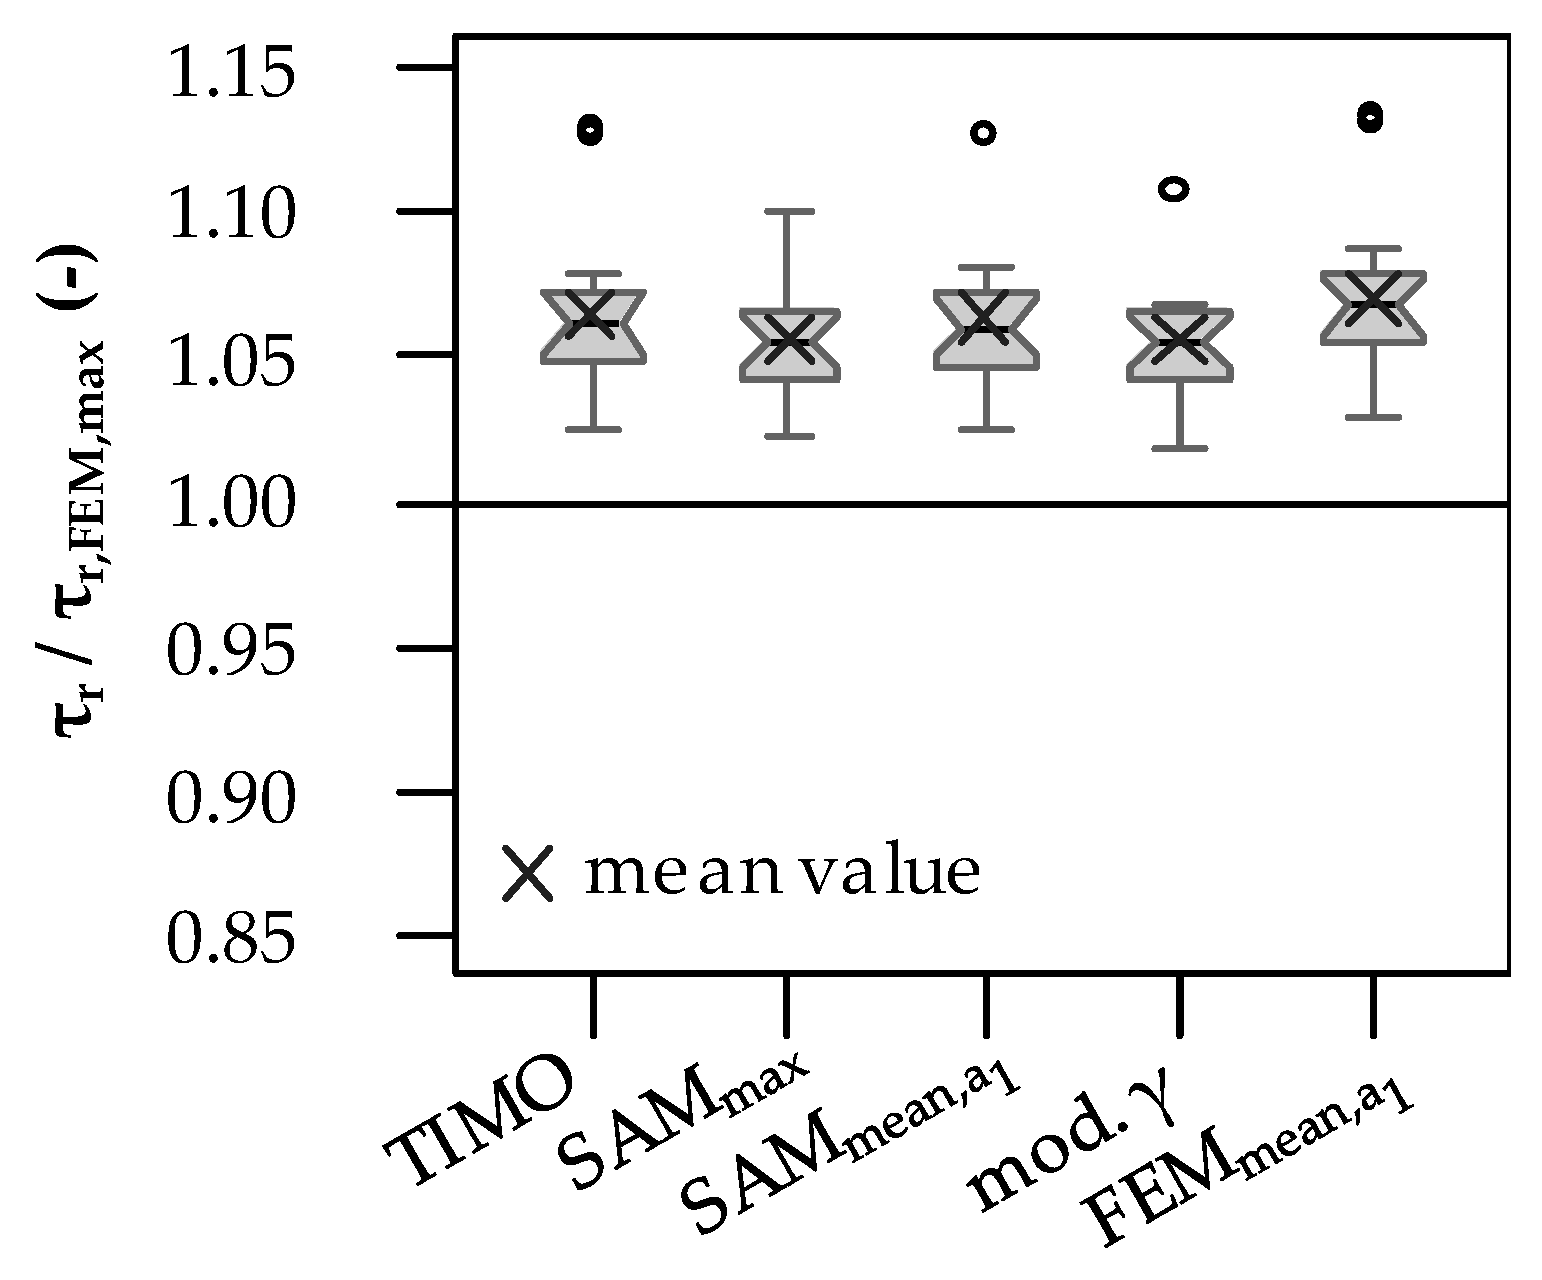
The results of the comparison of the calculation methods can be seen in Figure 9. For each calculation method, these are related to the maximum calculated shear stress from the FE-analysis τr,FEM,max carried out for the corresponding test setup.
Regarding the investigated test setups, it is shown that the differences between the calculation methods are overall negligible. The highest values of each method refer to test series 02 and 10, which both contain double outer layers. Although the rolling shear stresses and, consequently, the rolling shear strengths are overestimated by all simple beam theories by approx. 5% when compared to τr,FEM,max; at this point, it should be kept in mind that the calculation methods used for evaluating test results should follow the same calculation methods used in the design practice. With respect to CLT slabs, these are usually one of the herein investigated simple beam theories. If this principle is adhered to, the slightly overestimated rolling shear strengths are equalized again during the design process. For the remainder of this contribution, however, τr,FEM,mean,a1 will be used because it allows for a continuous interaction of rolling shear stresses with stresses perpendicular to the grain, as described in Section 2.3.3.
3.1.2. Comparison of Test Setups
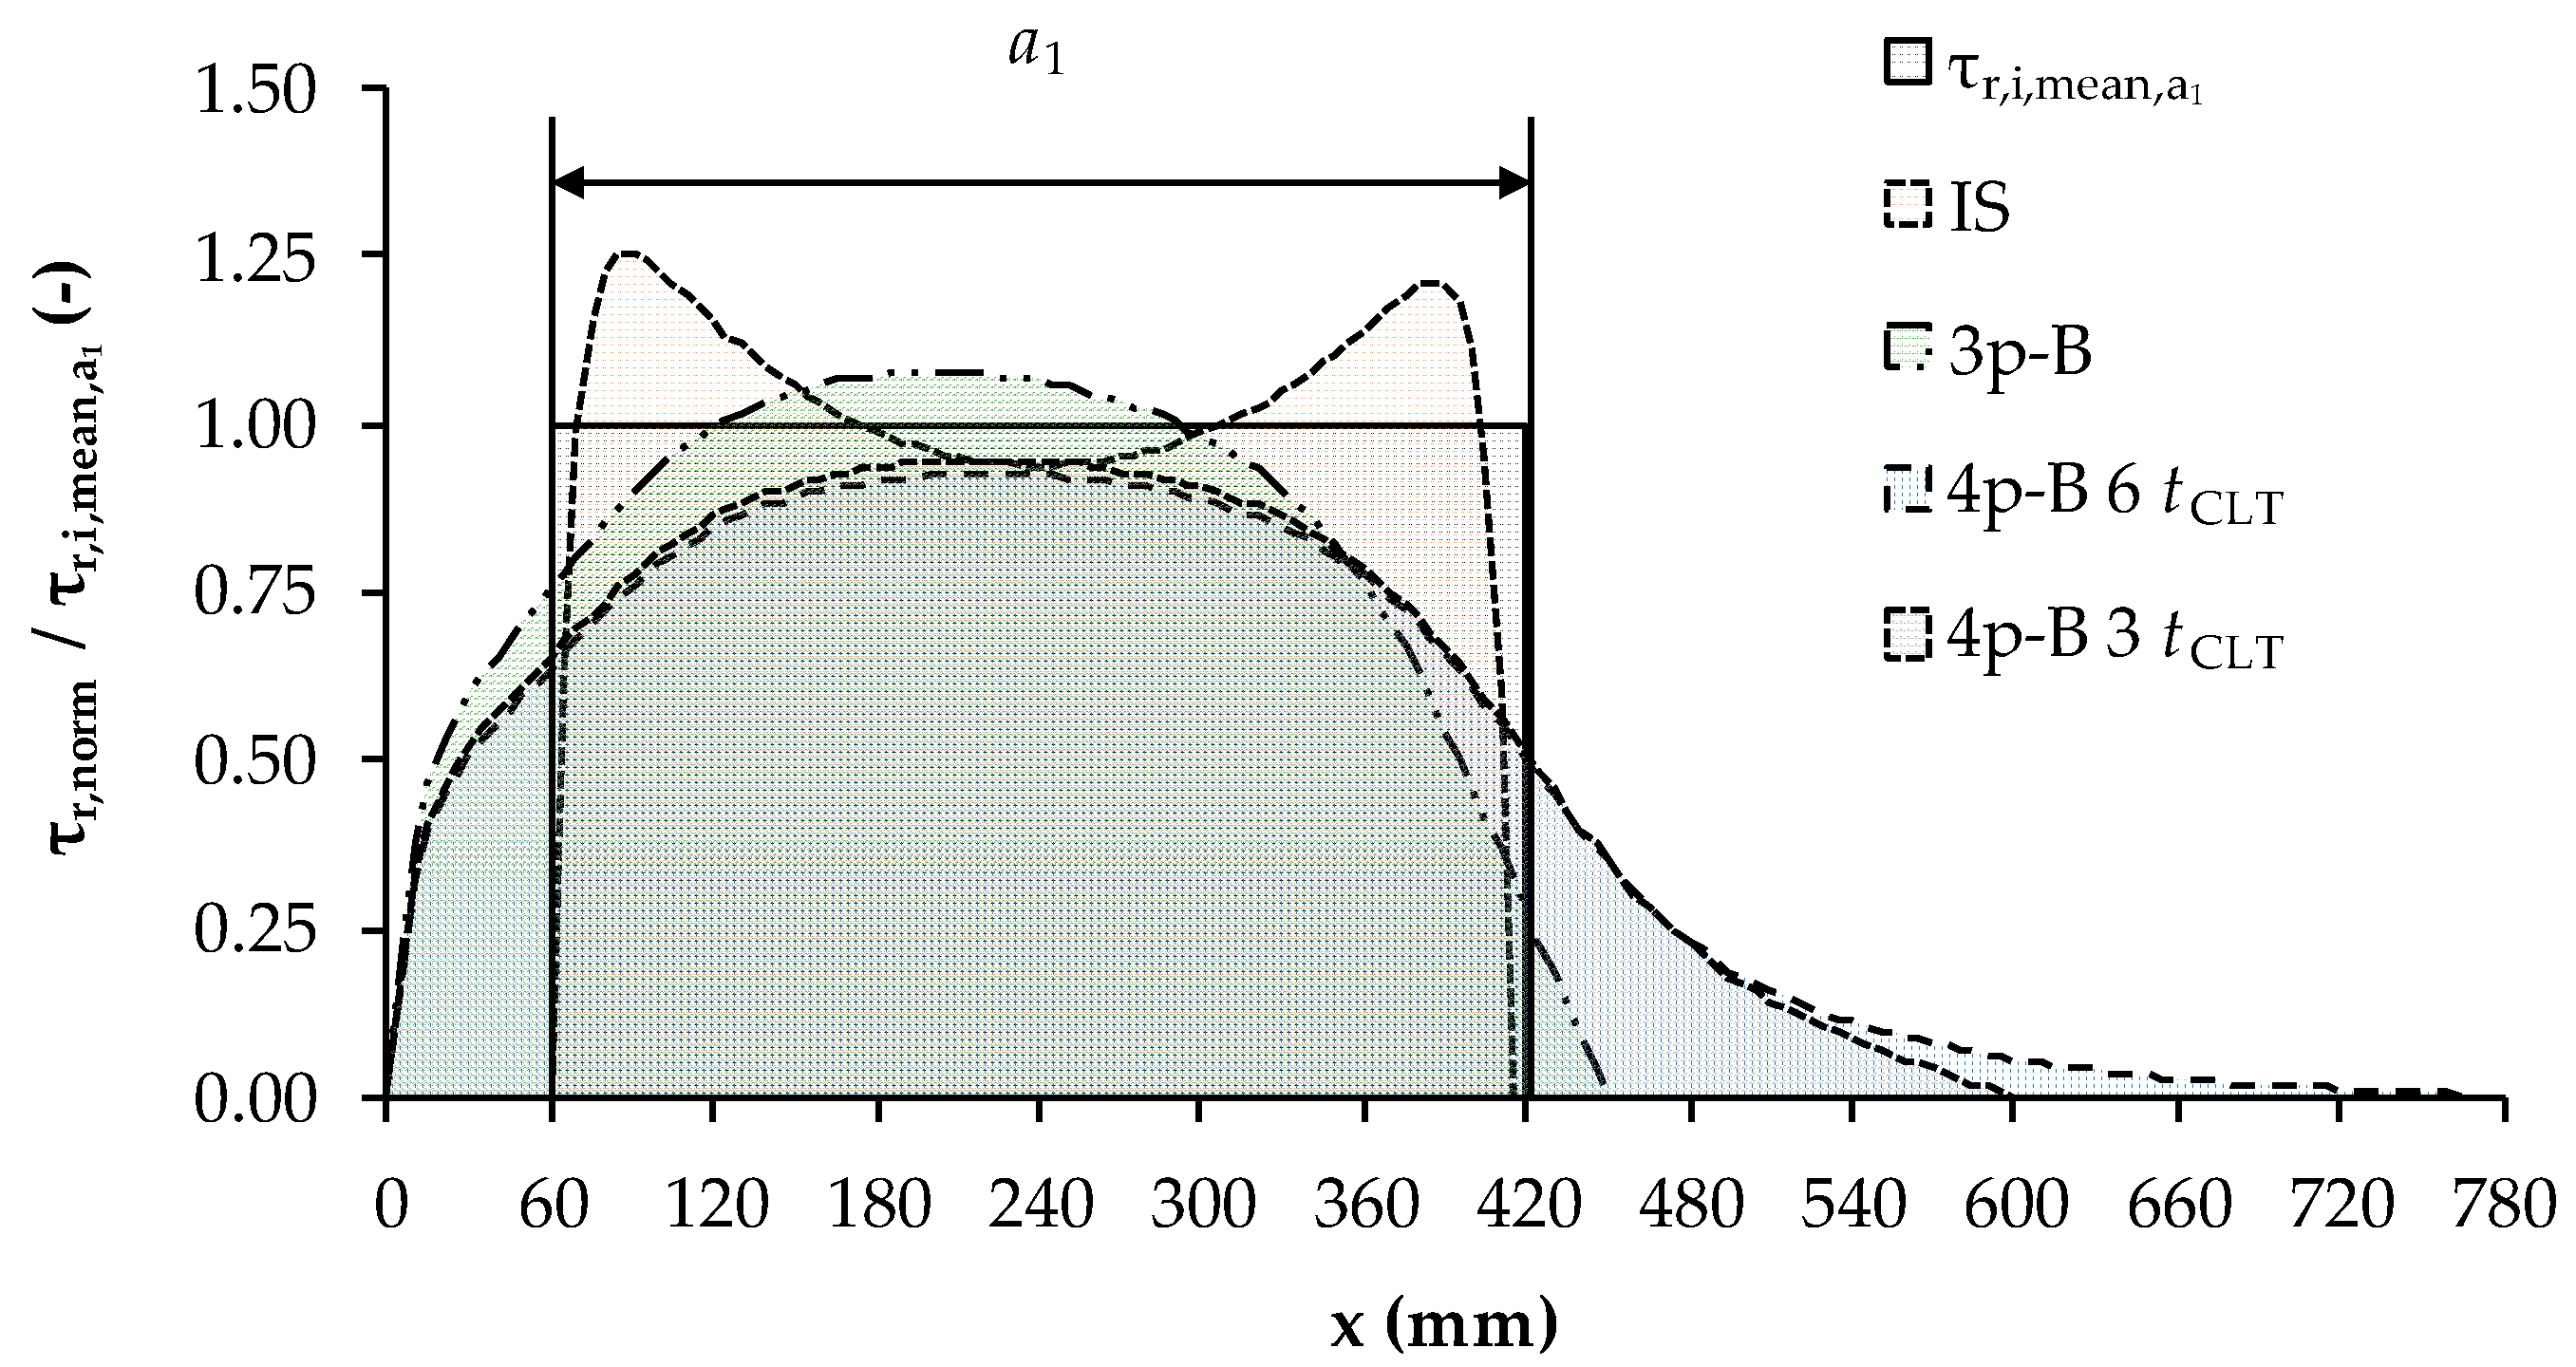
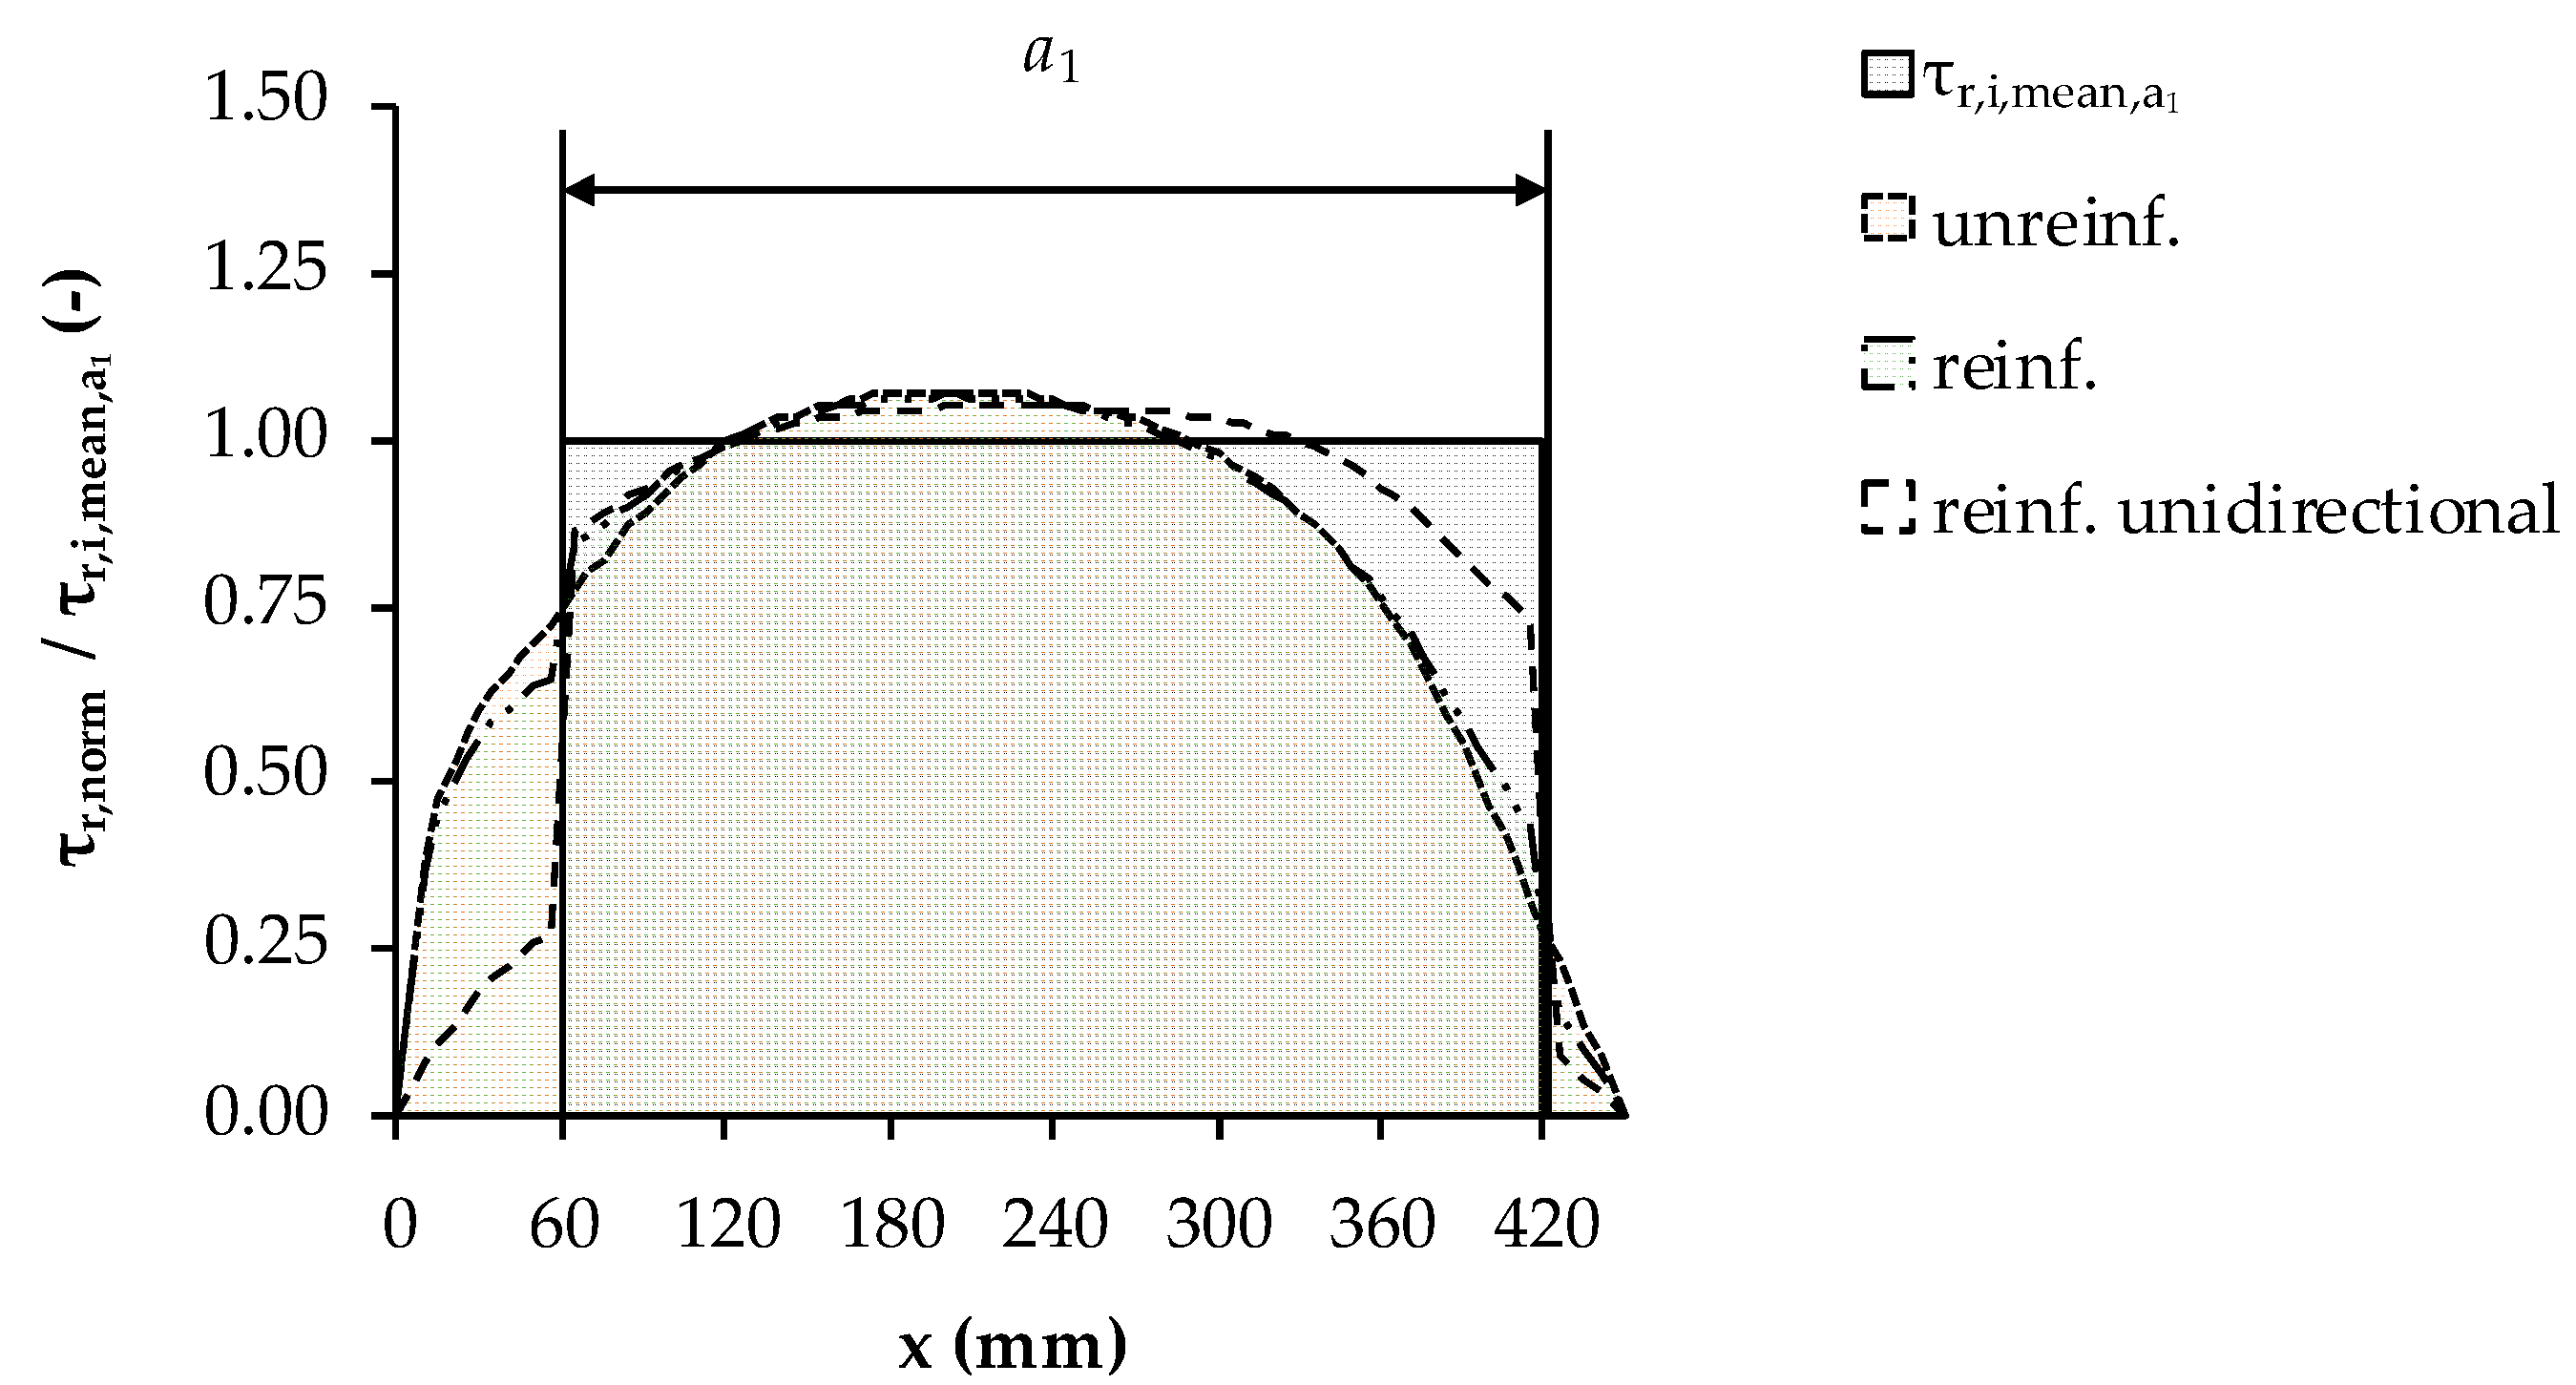
Figure 10, Figure 11 and Figure 12 show the normalized rolling shear flows, meaning that the areas under the respective rolling shear stress distributions are identical. In addition, all rolling shear stress distributions are considered relative to τr,i,mean,a1 according to Equation (1).
In Figure 10, it can be seen that for the IS test setup, two stress peaks are present that exceed the average stress by 25%, whereas, for the 4PB test setups, the maximum rolling shear stress is considerably lower, with negligible differences between the two 4PB variants. This is a result of the rolling shear stresses not being confined within a1 but rather being distributed to the surrounding timber. In other words, depending on the test setup, the same rolling shear force leads to different maximum rolling shear stresses. The ratios between the stress peaks of the different test setups are provided in Table 4.
The comparison of reinforced and unreinforced slabs in Figure 11 shows a negligible effect of the reinforcement on the shear distribution if cross layers are present. In contrast, for unidirectional layering like glulam, the reinforcement leads to a more homogeneous shear stress field within a1, as observed in [6]. The effect on the maximum stresses, however, is negligible.
The shear distribution for an IS test on a specimen with unidirectional layering is compared to those for the layup, including a cross layer in Figure 12. It shows that, again, the effect on the stress peaks of the unidirectional layering is negligible (~3%).
3.2. Experimental Program
The main results of the additional experimental test program are provided in Table 5, and the results of the EAD test database are summarized in Table 6. With the assumptions made in Section 2.3.3, fr,12,Mestek and fr,12,SIA obviously yield comparable results, while the values of fr,12,Hoffman are overall higher, as the interaction between rolling shear compression stresses perpendicular to the grain is rated significantly lower. Regardless, the following considerations are based on fr,12,SIA according to Equation (2), which was chosen because it is based on a stress interaction criterion that is already anchored in a design standard.
3.2.1. Reinforcement against Compression Perpendicular to the Grain
The comparisons of series PS-120-500-360 with PS-120-500-360-V and of series PS-120-500-450 with PS-120-500-450-V show no differences in fr,12,SIA,mean between reinforced and unreinforced test series. This is well in line with the results of the numerical investigation given in Section 3.1.2 and confirms that reinforcement against the stresses perpendicular to the grain does not affect the rolling shear strength.
3.2.2. Specimen Width w
The influence of the specimen width, i.e., the width of the CLT slab, on fr,12 was statistically investigated by means of unpaired two-sample t-tests on the ln(fr,12) values of test series PS-100-300-360-V vs. PS-100-500-360-V; PS-120-300-360 vs. PS-120-500-360 and vs. PS-120-800-360; and PS-200-300-450-V vs. PS-200-500-450-V. The smallest observed p-value, as a measure of the realized significance level, was 0.101. Considering the common significance level of α = 0.05, no statistically significant influence of the specimen width on fr,12,mean could be found—at least not within the tested range of w = 300–800 mm. This means, with respect to rolling shear and aiming at a reduced test volume, that the testing of small specimens would lead to similar results as long as the specimen width is still representative of CLT as the structural timber product. This seems to be the case as long as at least a specimen width similar to two times the board/lamella width is given.
3.2.3. Test Configuration
According to the results, the IS test setup leads to, on average, 15–20% lower rolling shear strength values fr,mean and higher CoV values than the 3PB tests. The difference between the mean values is actually well in line with the difference between the maximum rolling shear stresses from the numerical investigations, as discussed in Section 3.1.2 where a difference of 17% between IS test and 3PB test was found. Consequently, the factors provided in Table 7 and the underlying approach seem adequate to adapt the test results of different test setups to a common reference test setup. Additionally, the presented methodology could be extended for test setups and geometries that were not yet considered.
3.2.4. Shear Length a1 and the Thickness of the Cross Layer tCL
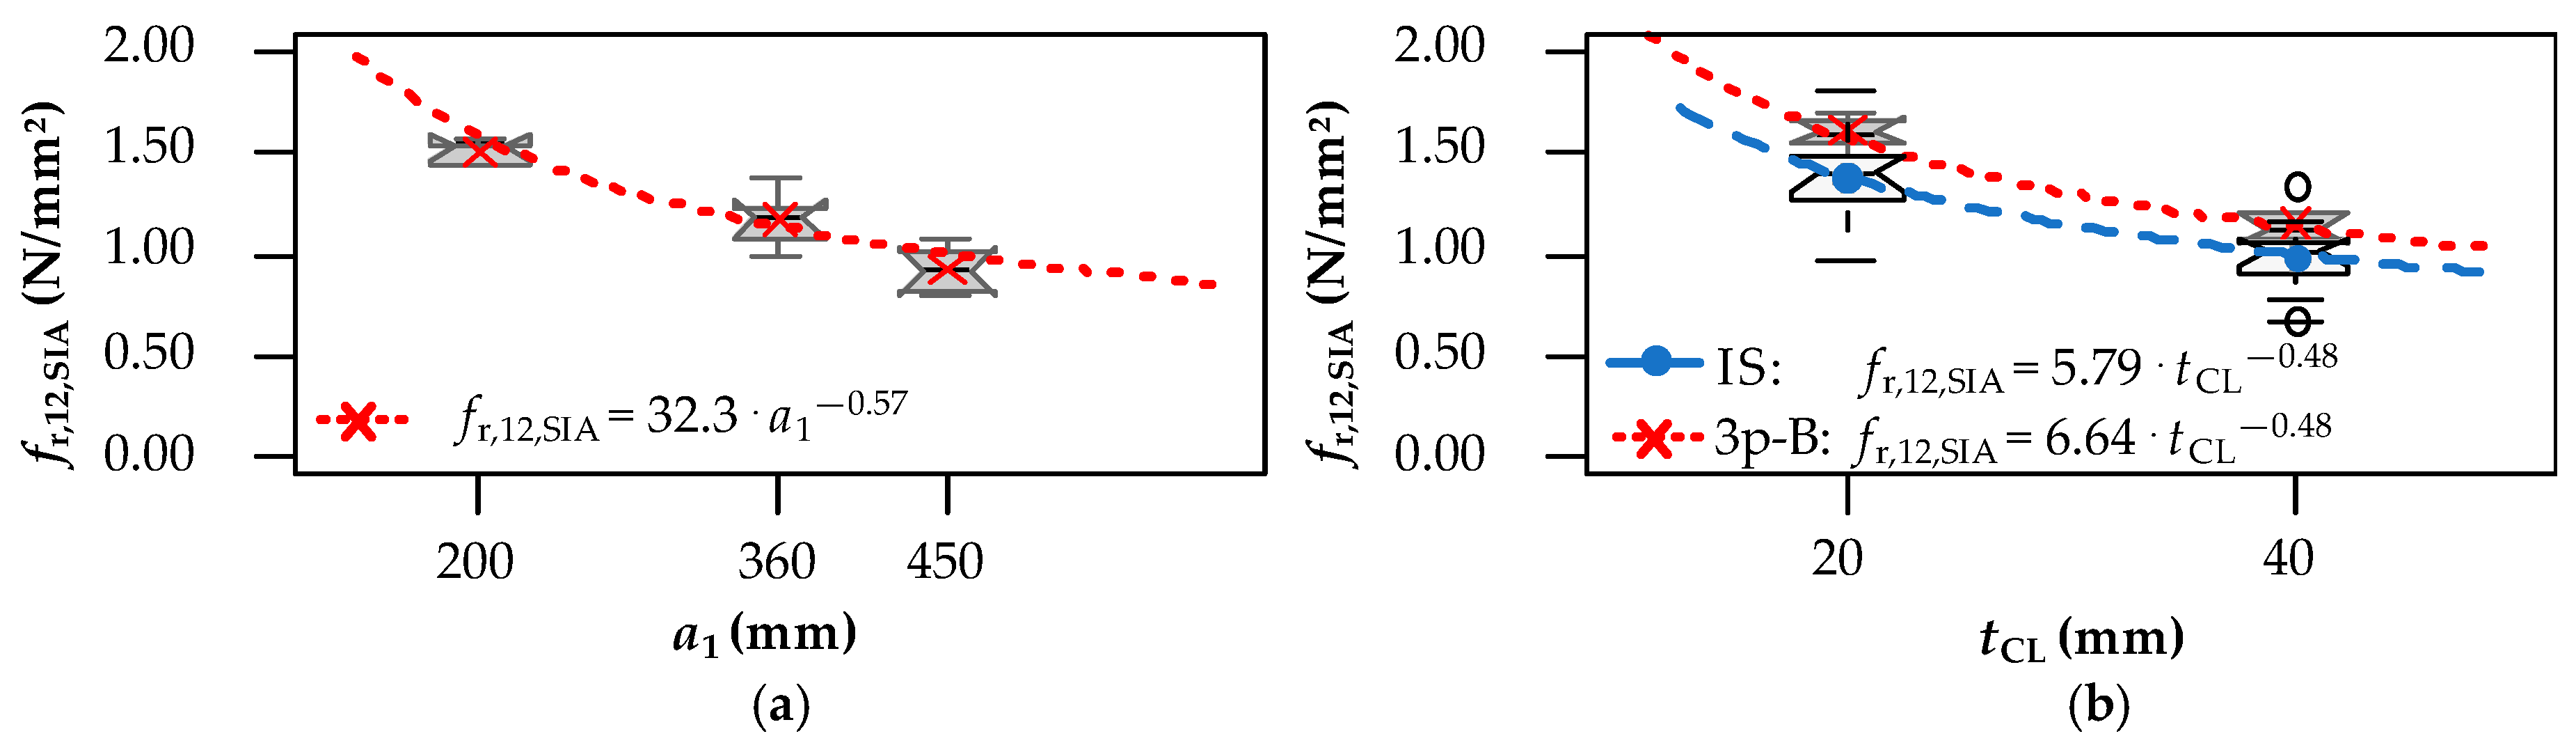
The influence of the shear length a1 on fr can be seen in Figure 13a, which includes the results from test series PS-120-500-200, PS-120-500-360, and PS-120-500-450. A significant decrease in fr with the increasing a1 can be seen. Two possible reasons have been identified for this behavior: (i) a size effect and (ii) the increased interaction of compression perpendicular to the grain and rolling shear stresses in specimens featuring a lower a1 (and thus lower a1/tCLT), which, if not accounted for, increases the rolling shear resistance, see Section 1.3. Since the data in the diagram was already corrected for the stress interaction, as presented in Section 2.3.3, only a hypothesized size effect remains as a possible explanation for the observed reduction.
Figure 13b shows the effect of varying tCL on fr based on test series IS-100-500-360, IS-120-500-360, PS-100-500-360-V, and PS-120-500-360-V. For an increasing tCL, a similar decrease trend in fr, as that for a1, is found. A power regression analysis on fr,12,SIA vs. tCL gives a power coefficient of −0.48 for both test setups 3PB and IS. This is not largely different from the power coefficient −0.57 which was found for fr,12,SIA vs. a1. On a side note, the ratios between the constants of the power regression models fr,12,SIA vs. tCL, which correspond to two different test configurations, result in 6.64/5.79 = 1.15, which is very close to the ratio of 1.17 found in the numerical comparison as presented in Table 7.
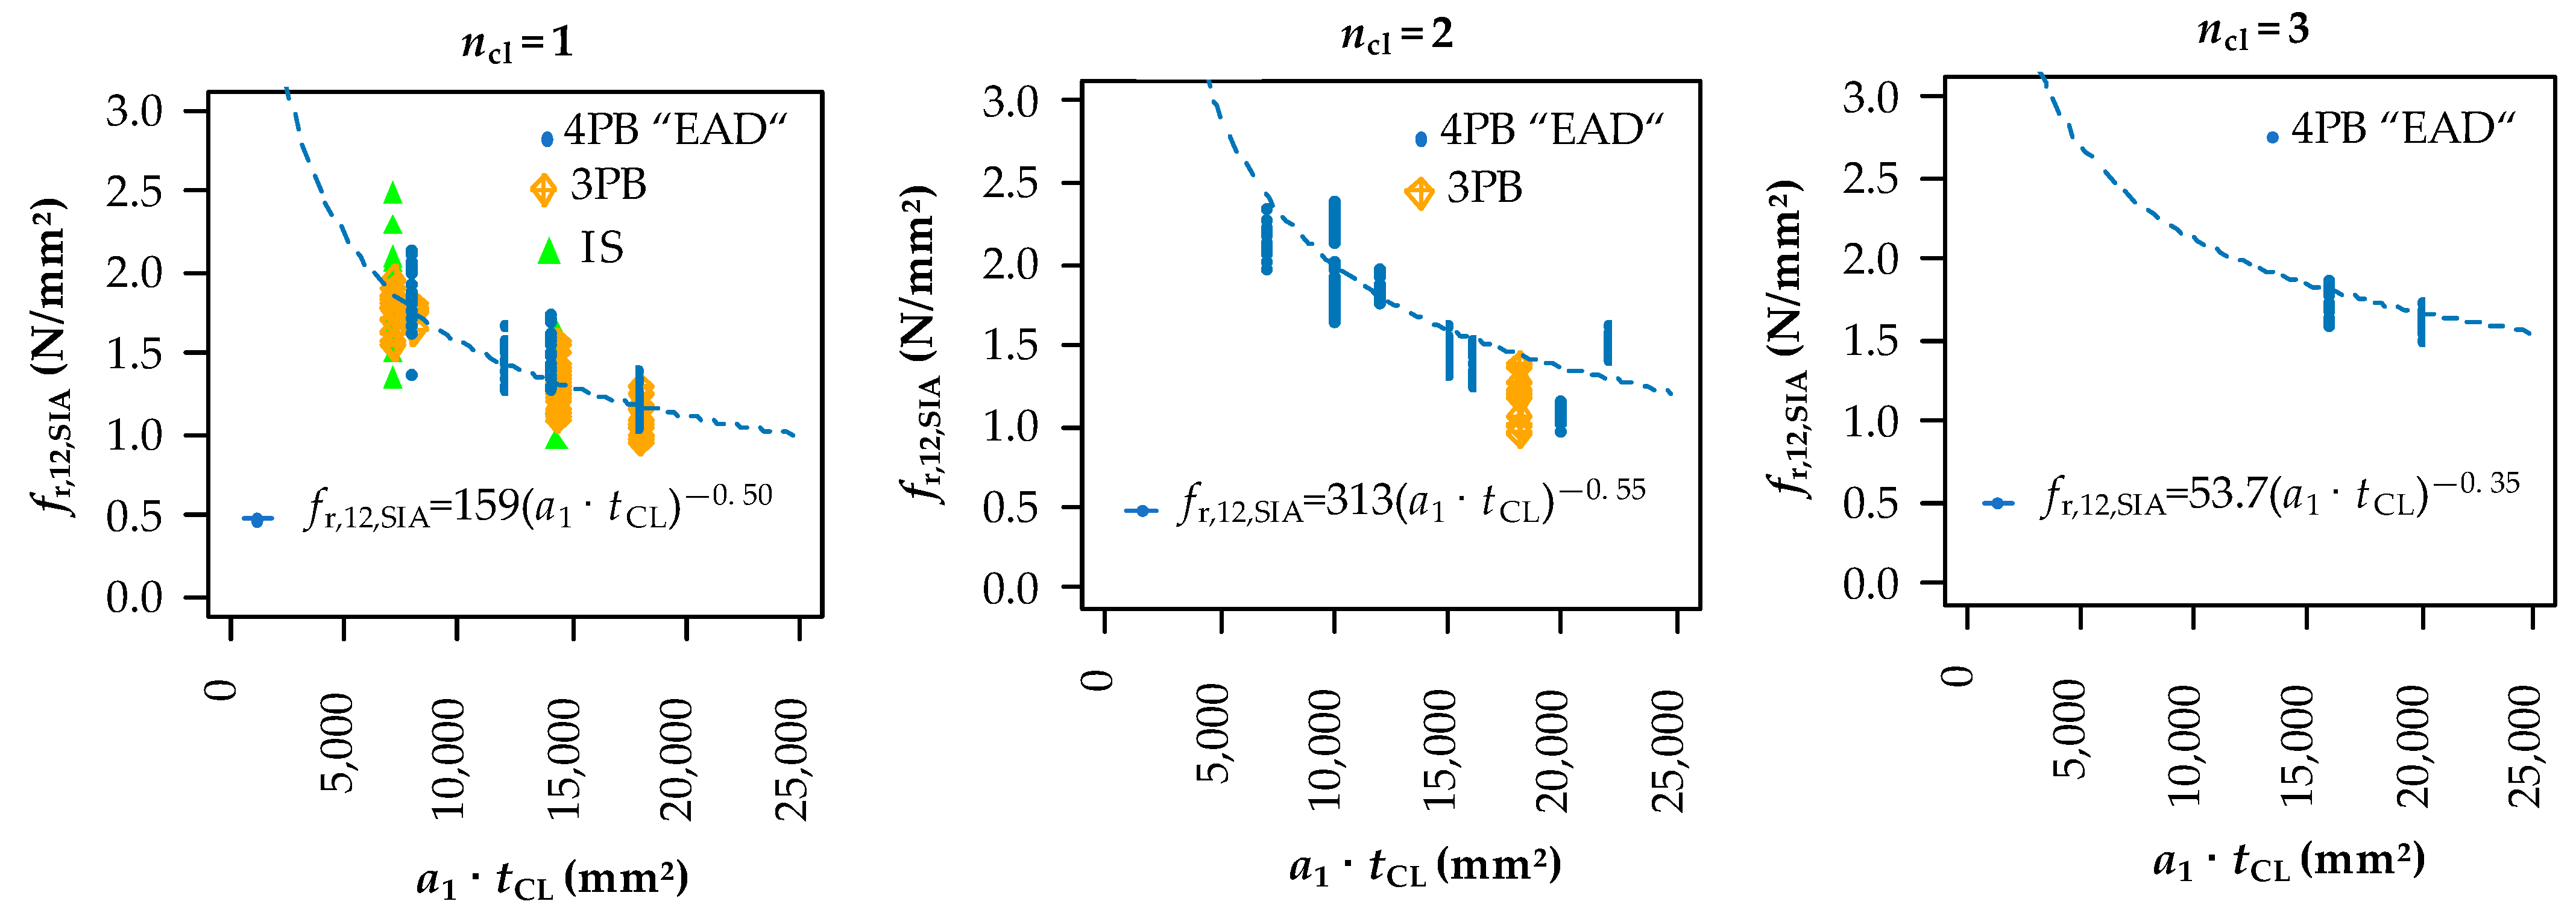
The power regression analyses on the relationship between fr and the nominal rolling shear area per cross layer within the shear field, given by the product (a1 · tCL), executed for the EAD database and grouped according to the number of cross layers nCL, give power coefficients between −0.35 and −0.55, see Figure 14. The lower power coefficient of −0.35 for the test series with nCL = 3 most likely results from the relatively low variation of (a1 · tCL) and the limited number of test series within this group. Apart from this group, the two other groups with nCL = 1 and 2 confirm the power coefficient of approx. −0.5, as observed for the relationships between fr and a1 and between fr and tCL in Figure 13.
Figure 14 also includes the results of the 3PB and IS tests of the additionally conducted experimental program, multiplied by the conversion factors of 1.16, respectively, 1.35 according to Table 7, to convert these results to the 4PB tests. These additional data sets were not included in the previously discussed power regression analyses. Nevertheless, the additional data sets fit very well into the results of the EAD database; this again confirms the general suitability of these conversion factors.
The observed decrease in fr with the increasing tCL agrees with the work by Zare [23], where the same trend was reported for all tested wb/tb ratios, although the reduction in herein presented results is slightly lower. A power regression analysis for the fr,mean vs. (a1 · tCL) relationship applied on the test data of the three-layered CLT by O’Ceallaigh et al. [24] gives again a power coefficient of approx. −0.5, which additionally supports the hereby presented outcomes. The decrease is suspected in the size effect inherent to brittle and quasi-brittle materials such as timber (cf. e.g., [38,39]).
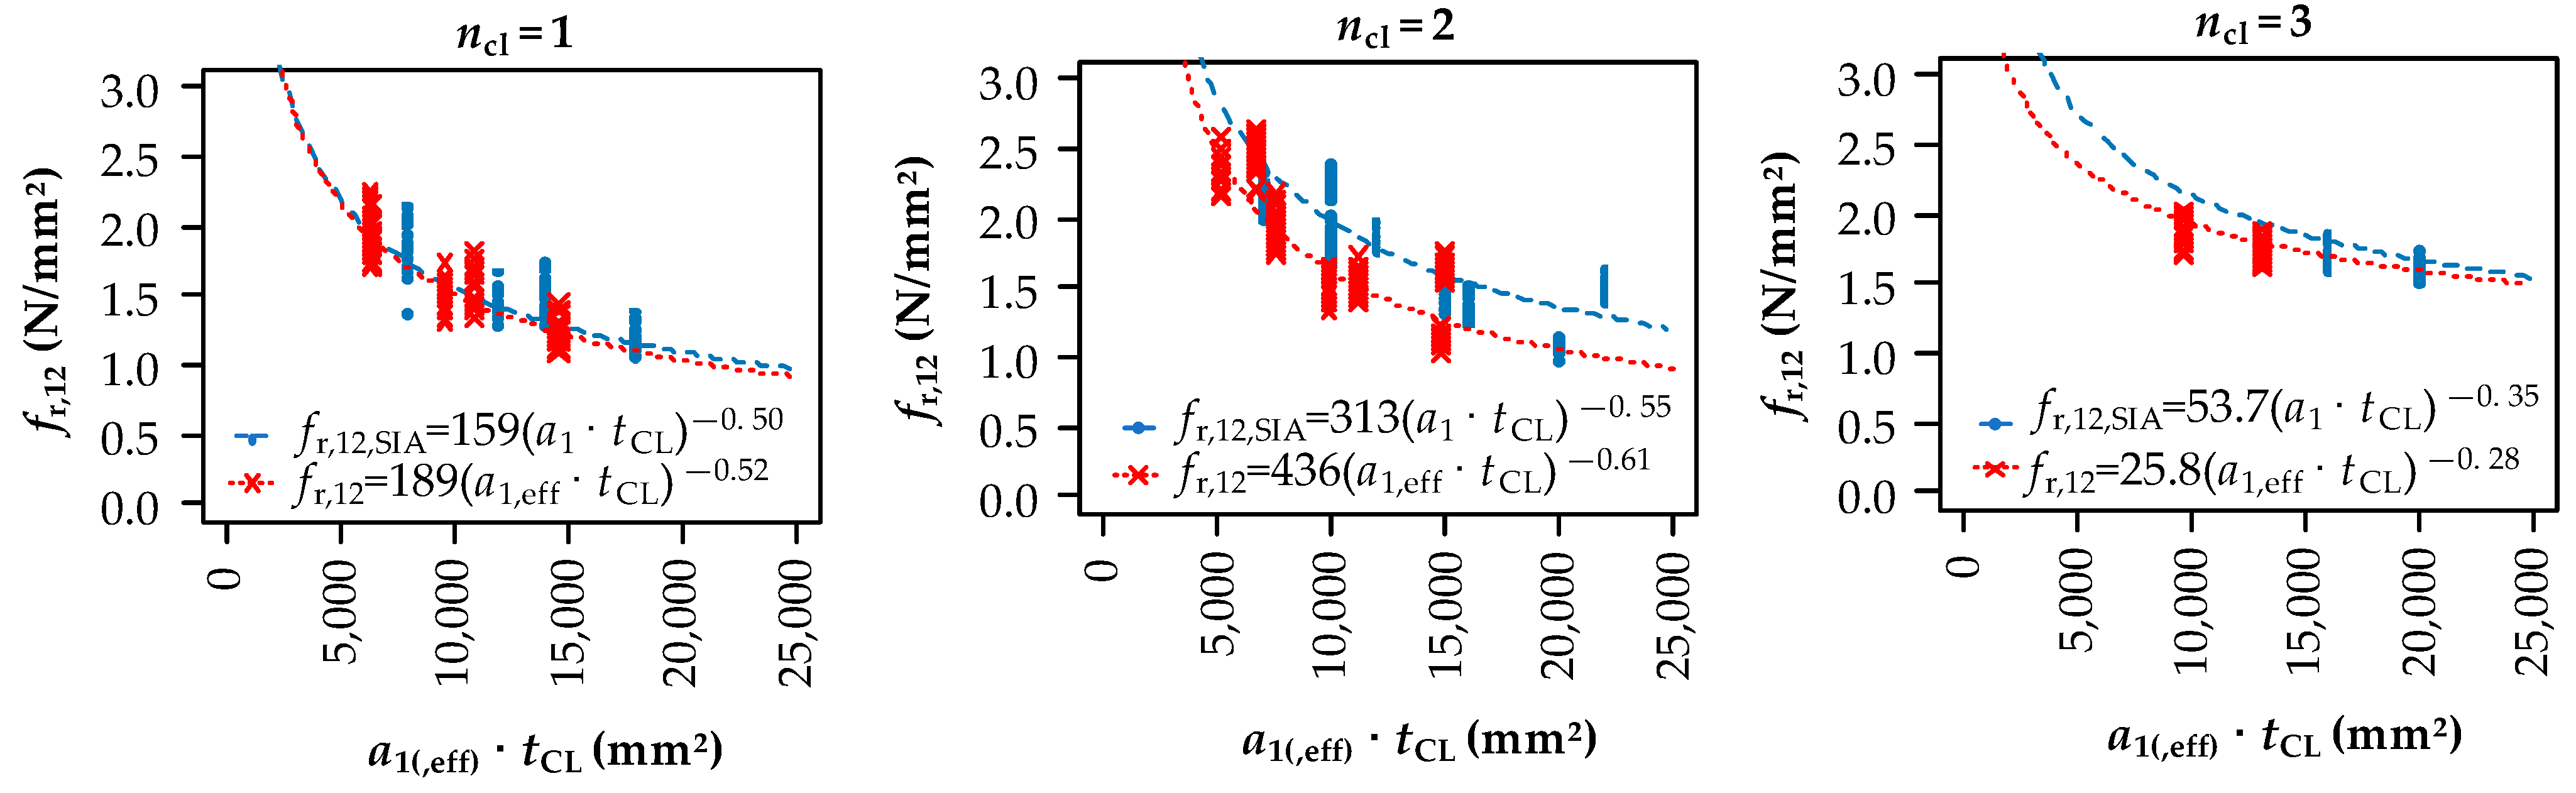
As the continuous interaction between the stresses perpendicular to the grain and rolling shear stress—as applied within this paper—is relatively laborious due to the need of FE models for each specific combination of CLT layup, test setup, and geometry, a simpler and more practical approach was investigated. Within this approach, the rolling shear stresses are simply evaluated by means of the Timoshenko beam theory. The interaction with stresses perpendicular to the grain is carried out indirectly by reducing the referencing rolling shear length to a1,eff according to Equation (5) (c.f. Figure 5), represents the rolling shear length that is quasi-free of stresses perpendicular to the grain. The Equation is derived from the proposal for kc,90 by Brandner [36], which assumes a load dispersion angle of 45° for longitudinal layers and 15° for cross layers.
The results of this indirect approach (i.e., the simplified approach) are compared to the approach of the direct stress interaction (via SIA failure criterion) in Figure 15. It is shown that the adjustments concerning the influence of transversal stresses of both approaches lead to comparable and slightly conservative results in the case of the simplified approach.
3.2.5. Layup
For analyzing a possible influence of the layup, the test series PS-120-500-450-V and PS-200-500-450-V were compared. An unpaired two-sample t-test could not confirm a statistically significant difference (p = 0.137). However, looking at Figure 14, there is a clear increase in fr with the increasing nCL. One possible reason for this is seen in the increasing potential for stress redistribution due to the cracking behavior in conjunction with the transformation of the rigid composite to a flexible composite, see Section 2.1. In contrast, the tests reported by O’Ceallaigh et al. [24] indicate an inverse effect in conjunction with the number of cross layers, as fr,mean also decreases for multiple nCL. It is possible that the EAD test setup with its constant geometry, which is affected by higher stresses in compression perpendicular to the grain for thicker (i.e., multi-layered) CLT slabs, activates additional load transfer through friction and dilation. Still, for the derivation of the rolling shear strength model in the following Section 4, it is assumed that this is not the case and that an effect caused by the number of cross layers is indeed generally present in CLT slabs and not restricted to the EAD test setup.
4. Rolling Shear Strength Model
4.1. Derivation of a Basic Model to Predict the Test Data
The model presented in the following is based on the results of fr,12,SIA of the EAD database given in Table 6. To summarize the findings of Section 3.2, the main influencing factors on the rolling shear strength determined in a 4PB test setup were the shear length a1, the cross layer thickness tCL, and the number of cross layers nCL, while fr was not affected by the width of the specimen w, and a potential reinforcement against the stresses perpendicular to the grain. Although the current state of knowledge also attributes an influence on fr from the aspect ratio wb/tb (c.f. Section 1.3), this parameter was excluded from the model as all the considered test series were either narrow-face bonded or had wb/tb > 3.6; hence, no conclusions could be drawn regarding this parameter. Thus, a1, tCL, and nCL are used in the following model approach as indicating parameters for the rolling shear strength of CLT slabs, and c0 and c1 act as calibration parameters, i.e., as regression coefficients of the model:
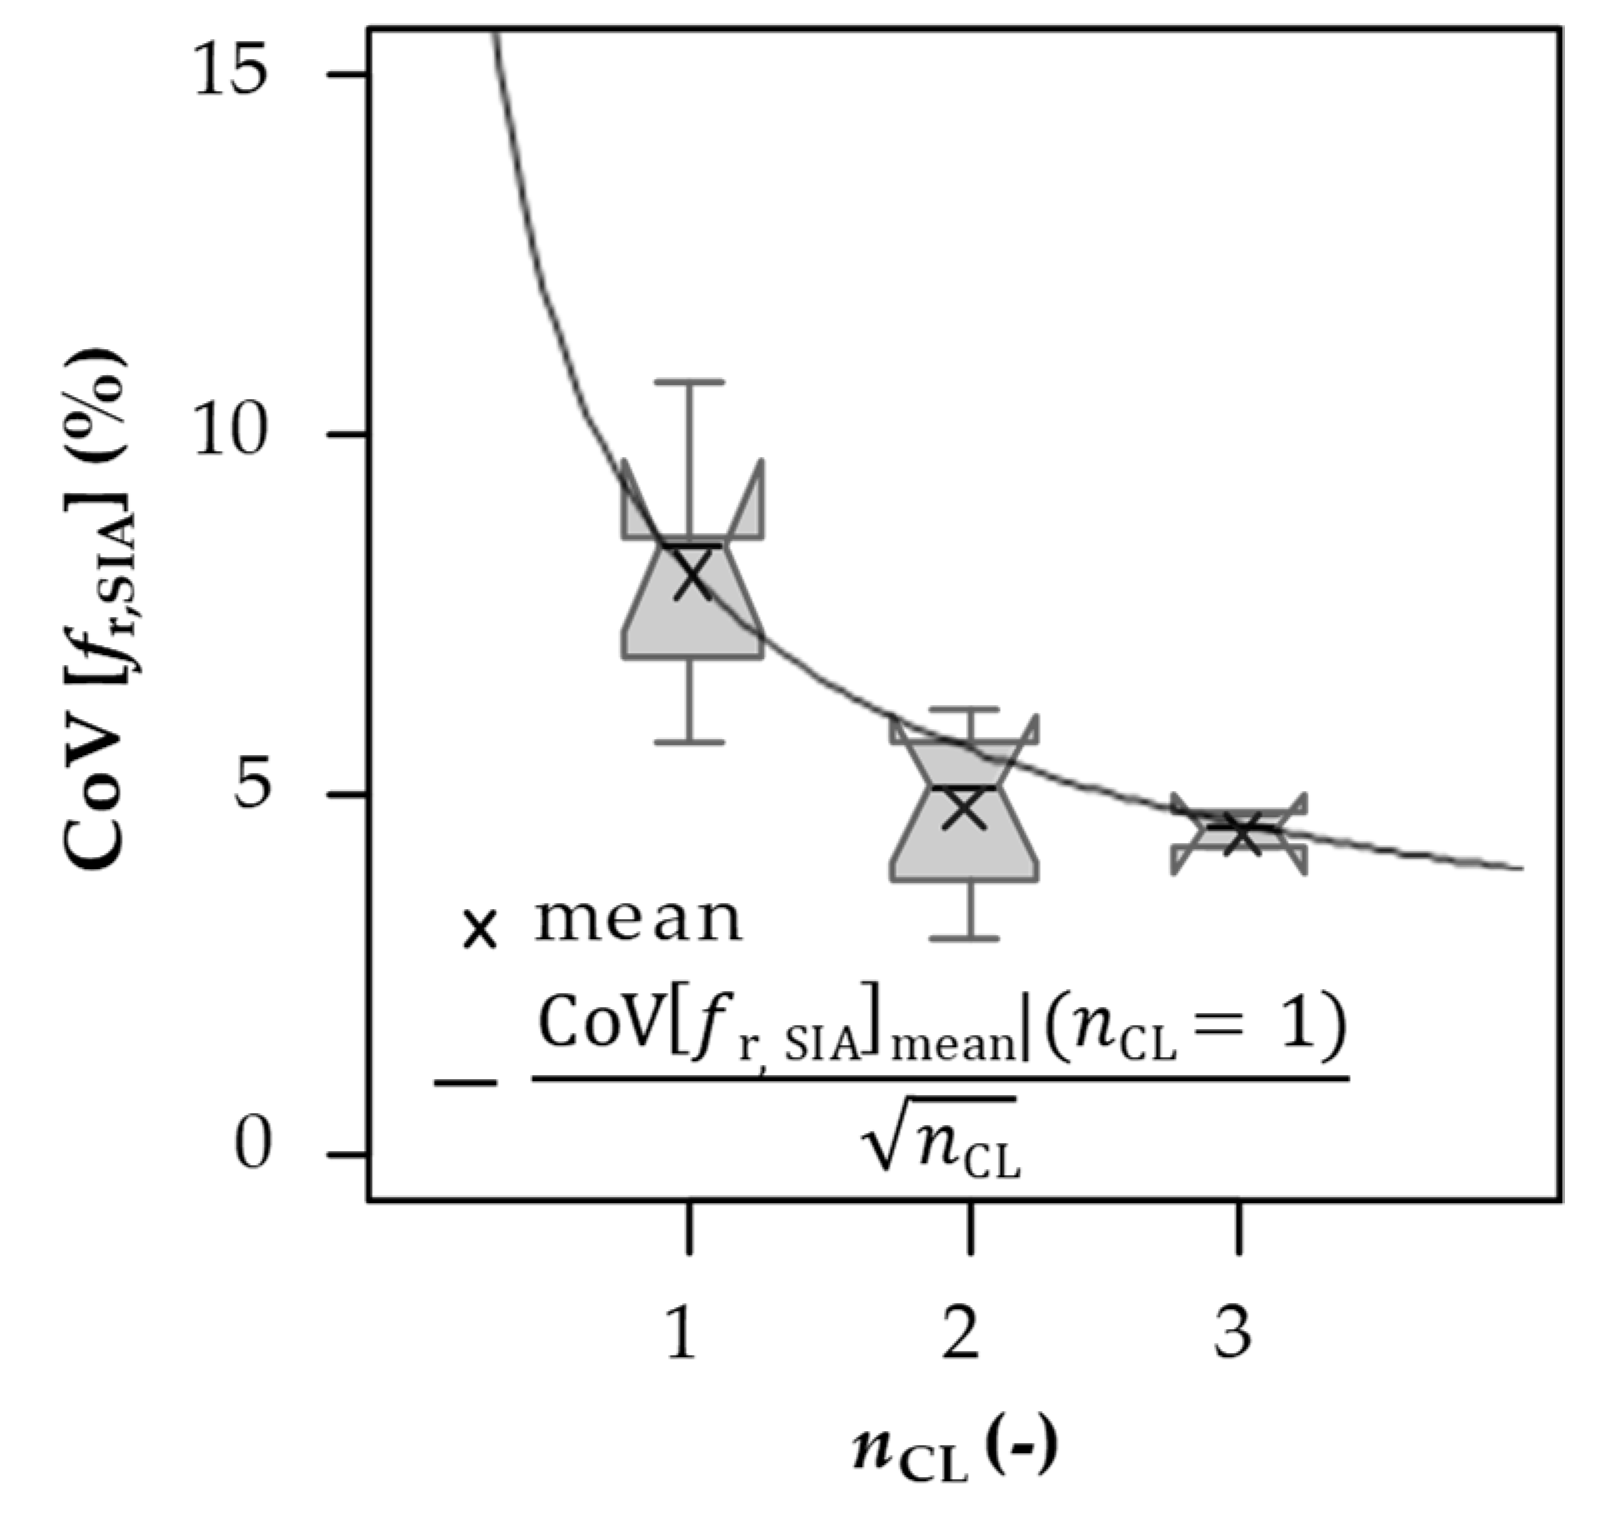
A reference rolling shear area Aref of 900 mm2 seemed adequate and was taken as a basis for the further calibration of the reference strength fr,ref using the test data of three-layer CLT specimens featuring one single cross layer nCL = 1, whereby (c0 + c1 · nCL) was set to 1 to account for no effect caused by the number of cross layers given nCL = 1. Then, the constants c0 and c1 that depict the effect caused by the number of cross layers were calculated by linear regression analysis on the complete dataset with nCL = {1; 2; 3}. The experimental results for the mean rolling shear strength fr,mean, and the empirical 5%-quantiles fr,0.05,emp are given in Table 7. Based on the coefficients c0 and c1, the effect caused by the number of cross layers for fr,0.05,emp is higher than that for fr,mean, which is because of the decreasing CoV[fr] for an increasing number of cross layers nCL (c.f. Figure 16).
4.2. Model Verification and Validation
Within this Section, the model verification and validation are made. For the validation, two additional test series were executed. These test series, PS-100-600-300 and PS-280-300-840, were narrow-face bonded and had a wb/tb of ~9, respectively, 3. The geometric parameters, which were chosen according to EN 16351 [3], can be found in Table 8. The remaining test procedure and data evaluation were made according to the methods already used for the main experimental program of this paper. The main statistics of the validation test series are given in Table 9.
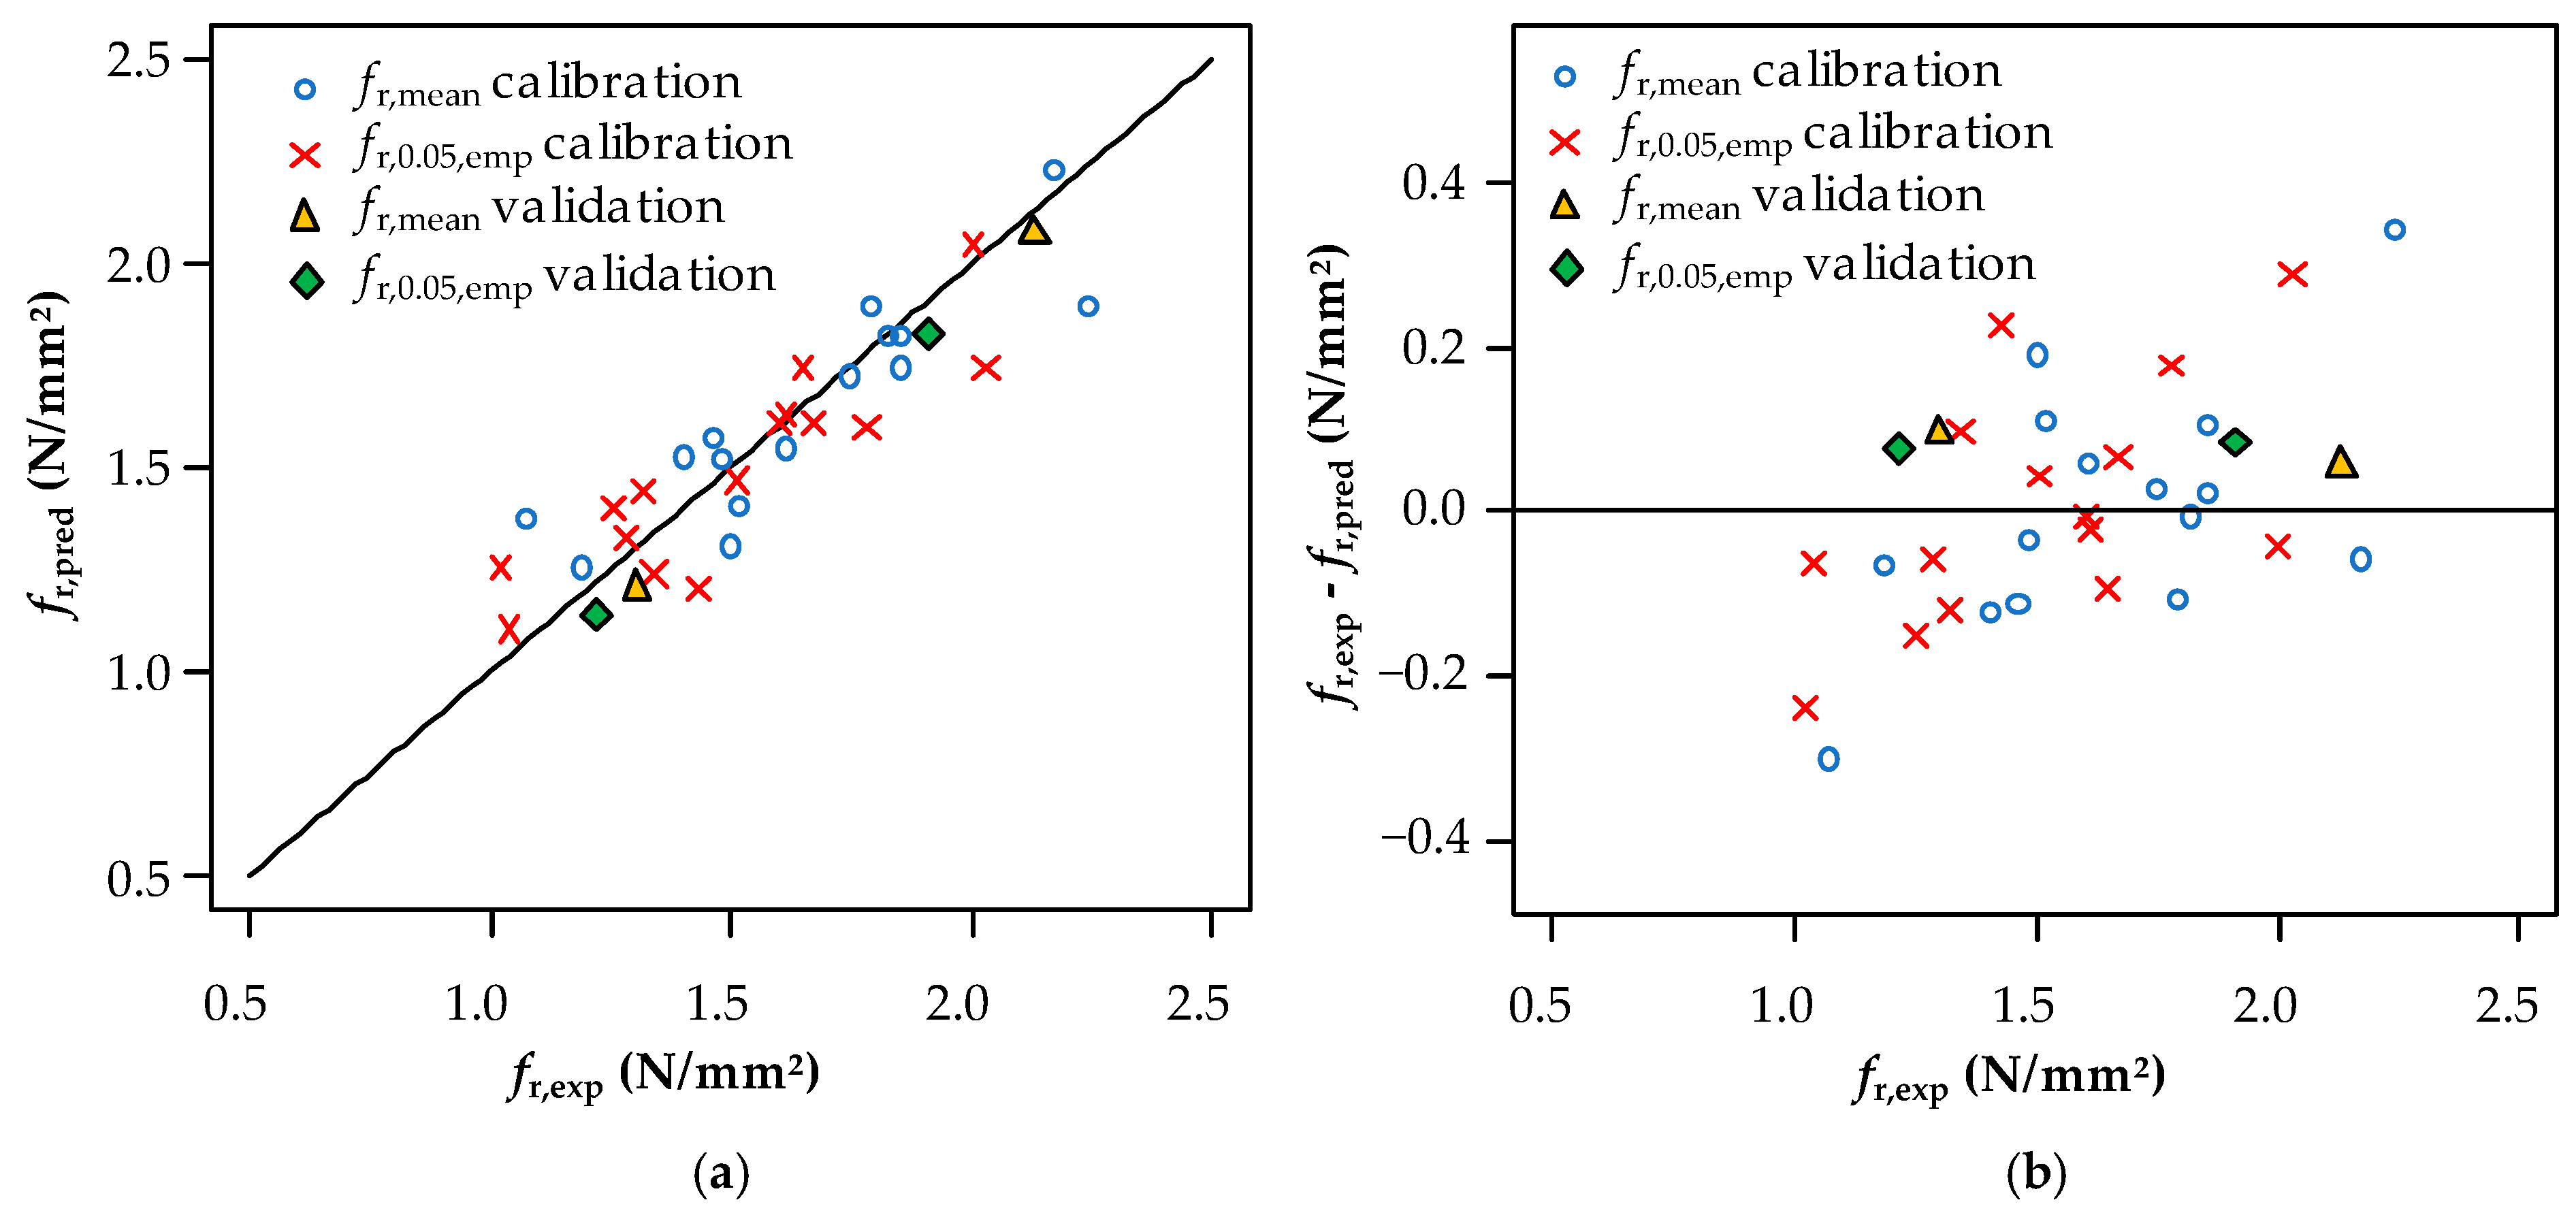
Figure 17a shows the model verification and validation plot for the rolling shear strength model for the mean values of fr,mean, and the empirical 5%-quantile values of fr,0.05,emp. The predicted values agree very well with the statistical analyses on the experimental results along the whole tested spectrum, which is also shown in the residual plot in Figure 17b. Also included in the plots are the results of the two series (PS 100 600 300 and PS-280-300-840), which are used for the validation of the rolling shear strength model. It can be concluded that the statistical analyses on both series agree well with the presented model, even if the estimated values are slightly on the more conservative side. Furthermore, based on the results of PS-280-300-840, which was tested with a1 = 3 tCLT, the existence of the effect caused by the number of cross layers can be confirmed. The mean values and coefficients of variation for the model uncertainties calculated from the ratio fr,pred/fr,exp are 1.06 (CoV = 2.57%) for fr,mean and 1.05 (CoV = 0.41%) for fr,0.05,emp, indicating only a minor bias, i.e., a minor underestimation of the experimental results, and a very small uncertainty, however, based on only two data points (i.e., test series) each.
4.3. Proposal for a Normative Rolling Shear Strength Model
With the intention that the normative rolling shear strength model should be consistent with the specifications for the 4PB tests provided in EN 16351 [3], it was decided that the reference rolling shear length a1 of the model should also be equal to 3 tCLT. Based on the mean reference strength fr,ref,mean = 5.74 N/mm2 of the basic rolling shear strength model (cf. Section 4.1, Table 7) and by assuming the lognormal distribution as a representative model for the rolling shear strength together with a CoV[fr,12] of 11% (≙ maximum observed CoV), the resulting 5%-quantile reference rolling shear strength, which, due to the large sample size totaling ~ 300 specimens, can also be seen as the characteristic reference rolling shear strength, is calculated to fr,ref,k = 4.78 N/mm2. fr,k then results to:
For test data of the 4PB tests with a1 ≠ 3 tCLT, the following adjustment shall be made:
Equation (8) can also be used to account for the stresses perpendicular to the grain via the indirect method (c.f. Section 3.2.4) by simply inserting a1,eff according to Equation (5) instead of a1.
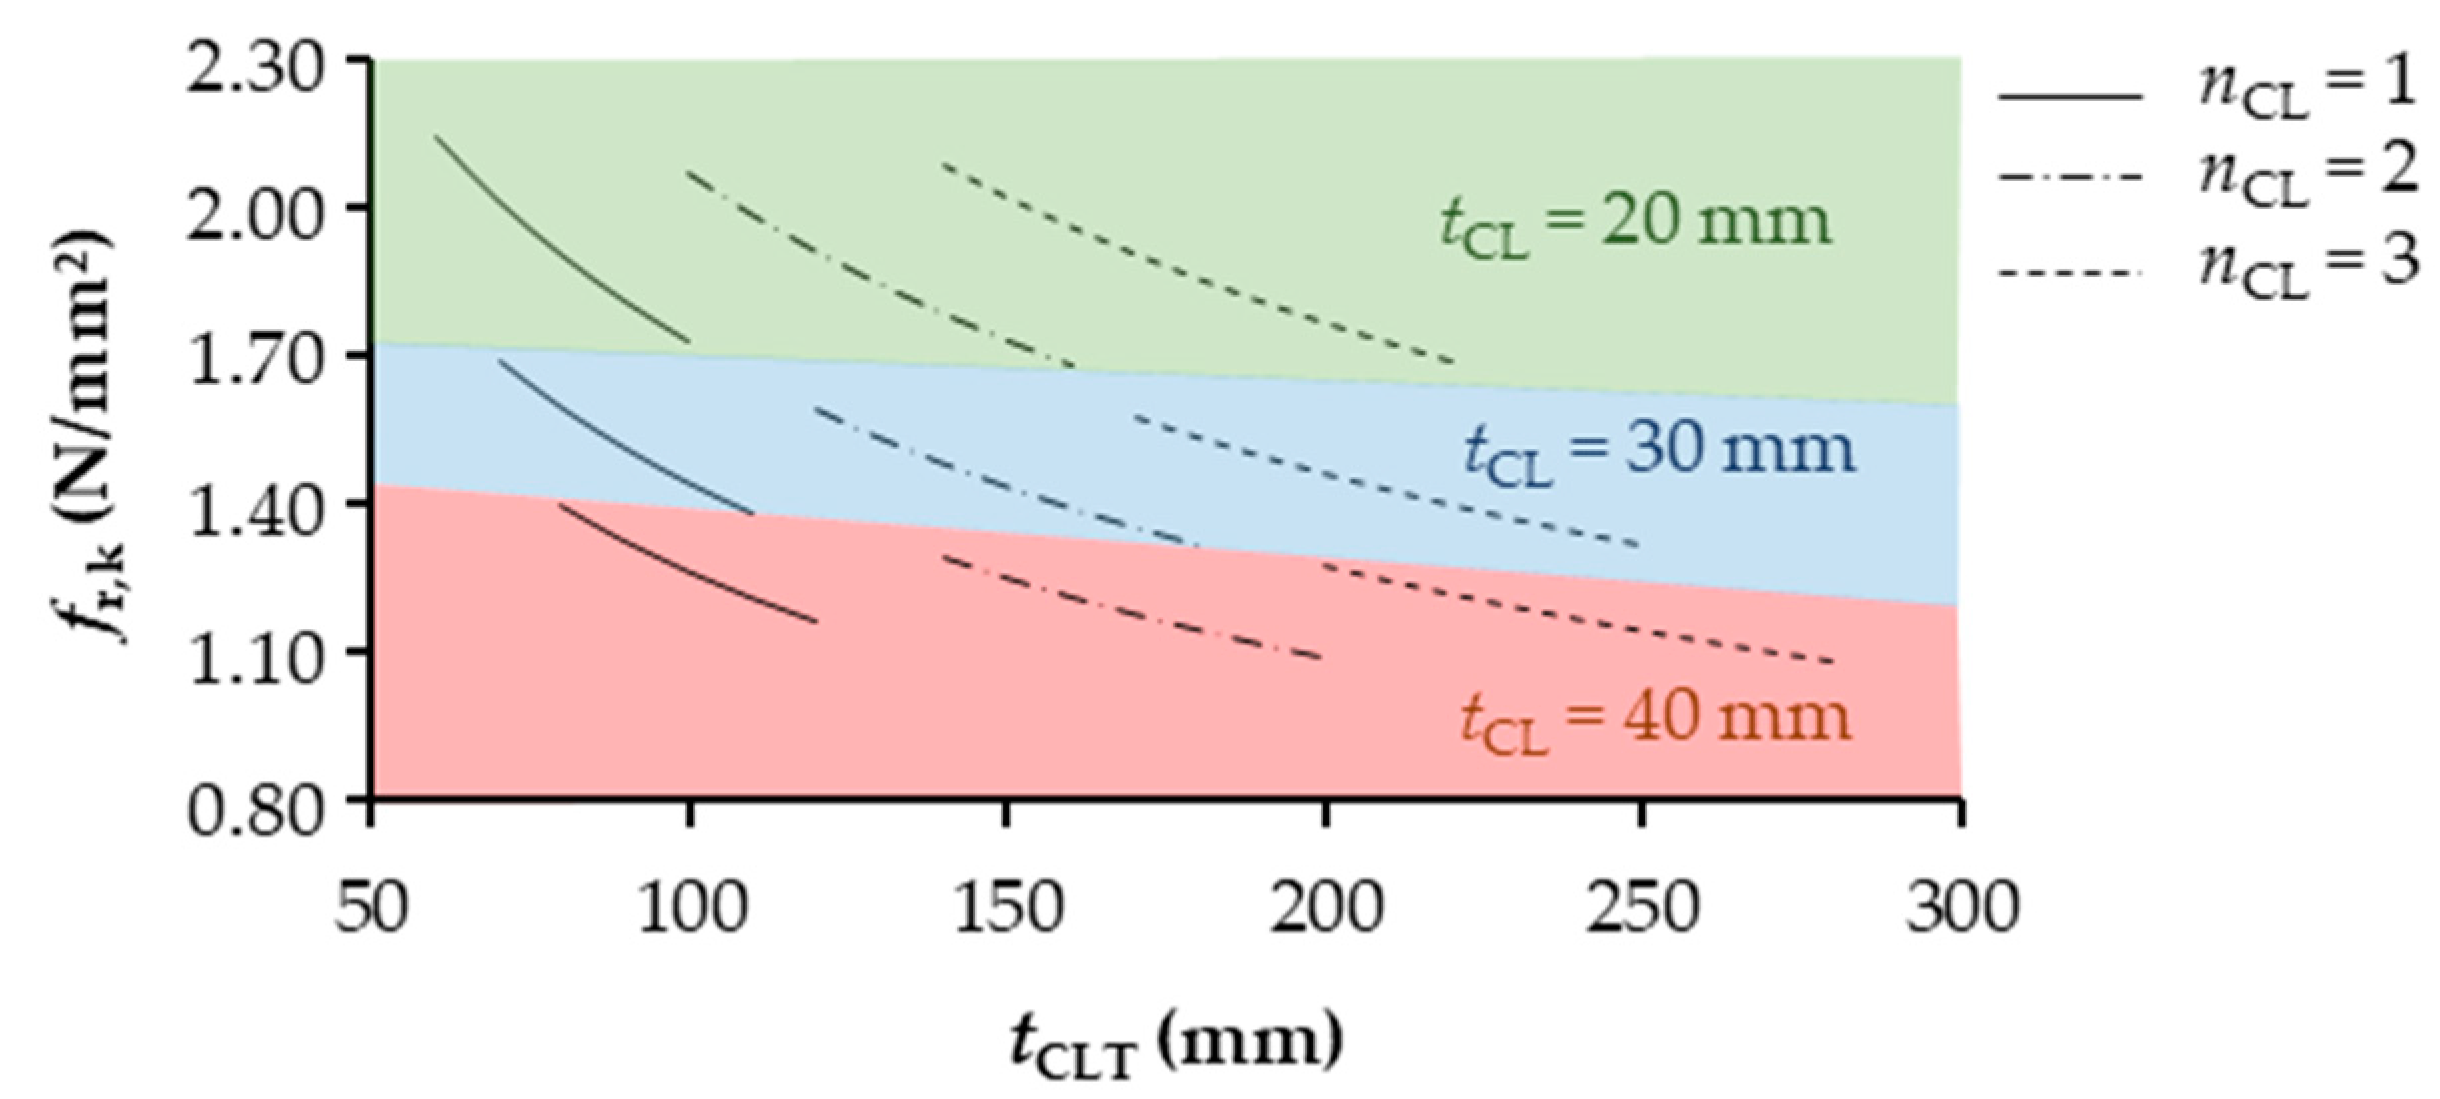
The model presented in Equation (7) was evaluated for the most common CLT layups, with the outcome of this analysis presented in Figure 18. It can be seen that the most relevant CLT layups form groups with a similar fr,k that only depend on tCL due to the effect of nCL, which partly counteracts the decrease of fr,k with the increasing tCLT. As a consequence, further simplification for the design practice seems adequate.
This simplification and the final proposal for the regulation of the characteristic rolling shear strength for CLT of strength class CL 24 without gaps and relief grooves thus results to:
On a side note, a similar but more conservative approach to Equation (9) is already included in some European Technical Assessments (e.g., Ref. [40]). However, a background document for this regulation is not available to the authors.
5. Summary and Conclusions
The motivation for this paper was based on the experience gained from several EAD test programs conducted at the LTC, which showed that the EAD test setup is inadequate for a reliable determination of the rolling shear strength of CLT slabs. The reason is that even after cracking, attributed to rolling shear failure, further load increase and ultimate failure in bending are possible. As a consequence, at the beginning of this paper, a stiffness-based definition was proposed to objectively determine the rolling shear strength from out-of-plane bending tests.
Based on this objective definition, a comprehensive study on parameters potentially influencing the rolling shear strength of CLT was presented. This study was done by means of numerical and experimental investigations and by varying the following parameters: specimen width, number, and thickness of cross layer(s), optional reinforcement against the stresses perpendicular to the grain, and the shear length. Furthermore, differences between shear stress distributions of different test setups were analyzed, and a comparison of widely used calculation methods to determine the shear stresses in out-of-plane bending was made. The following conclusions can be drawn:
- there is an effect of the used test setup on the rolling shear strength. This is (beside a possible difference in tested volumes) attributed to the different resulting rolling shear stress distributions. Although material use is higher for out-of-plane bending tests as compared to shear tests, it is recommended to use 4PB tests according to EN 16351 [3] with a1 = 3 tCLT (cf. Figure 19), as this setup best approximates the shear stress distribution in common practical and relevant exposure scenarios;
- the comparison of the maximum resulting rolling shear stresses from different test setups showed differences of up to 35%, as illustrated in Table 4. This table provides a set of configuration factors to convert the results from different test setups. It would be worth expanding this set of factors also for other test setups;
- between the used stress calculation methods, no significant differences were found for the rolling shear stresses averaged over the shear length. Due to its simplicity, the Timoshenko beam theory is recommended;
- the rolling shear strength is affected by the stresses perpendicular to the grain. As a consequence, the results of rolling shear from out-of-plane bending tests have to be corrected for this influence. It is proposed to do this either directly, with the method outlined in Section 2.3.3, or indirectly, by means of Equations (5) and (8);
- within the tested range, the rolling shear strength was not affected by the width w of the CLT slab, i.e., the number of lamellas in longitudinal layers. Consequently, a reduction of w to max {2 wb,LL; 300} mm is possible and recommended;
- the application of reinforcements against the stresses perpendicular to the grain at the load introductions and supports is not suited to provide a more homogeneous rolling shear stress field, as it was found for testing longitudinal shear in solid timber and structural timber products with unidirectional layups;
- for CLT without gaps or relief grooves, the parameters a1, tCL and nCL have been identified as the main influencing parameters on the rolling shear strength subjected to out-of-plane bending. The frequently discussed parameter wb/tb with a simultaneous occurrence of gaps and/or relief grooves could not be evaluated due to the lack of an adequate parameter range. However, this parameter could still be implemented in the form of reduction factors. This strength model could also be adapted for cross layers made of other timber products (e.g., veneers, split boards, recycled CLT, etc.) and different wood species (especially hardwood);
- a strength model under consideration of a1, tCL, and nCL was derived, based on approximately 300 4PB test results, and successfully validated by means of two recently and additionally conducted test series. For design practice, a simplified model was presented with Equation (9) based on the evaluation of the strength model for the most commonly used layups;
- the presented model is seen as a valuable candidate to substitute the current practice of extensive testing. According to the current EAD procedure, only for rolling shear is an amount of 25% of, in total, 40–160 m3 CLT needed to be destroyed to obtain an updated or new ETA. In contrast, the current regulations for glulam clearly point out the potential for significantly reduced test efforts by means of a set of load bearing models based on the properties of the base material, cf. EN 14080:2013 [41]. Using a similar approach to introduce a strength class system for CLT, combined with the harmonization of EN 16351 [3], would be a major step forward. The herein aimed load bearing model for the rolling shear of CLT is seen as an important contribution to this desirable evolution.
Author Contributions
Conceptualization, D.G., A.R., R.B. and G.S.; methodology, D.G.; software, D.G.; validation, D.G., A.R. and R.B.; formal analysis, D.G.; investigation, D.G.; resources, G.S. and A.R.; data curation, D.G.; writing—original draft preparation, D.G.; writing—review and editing, A.R., R.B. and G.S.; visualization, D.G.; supervision, A.R., R.B. and G.S.; project administration, G.S.; funding acquisition, G.S. All authors have read and agreed to the published version of the manuscript.
Funding
The presented research was generated in the scope of the research project “Rollschub BSP” and was funded by holz.bau forschungs gmbh. Their support is gratefully acknowledged.
Data Availability Statement
Some or all data are available from the corresponding author upon reasonable request. The data are not publicly available due to confidentiality reasons of the manufacturers.
Acknowledgments
The authors wish to gratefully acknowledge the permission of the CLT manufacturers to publish the anonymized test results of their CLT products.
Conflicts of Interest
The authors declare no conflict of interest.
References
- Ehrhart, T.; Brandner, R. Test configurations for determining rolling shear properties with focus on cross laminated timber: A critical review. In Properties, Testing and Design of Cross Laminated Timber: COST Action FP1402/WG 2; Brandner, R., Tomasi, R., Moosbrugger, T., Serrano, E., Dietsch, P., Eds.; Shaker: Aachen, Germany, 2018; pp. 151–169. ISBN 978-3-8440-6143-7. [Google Scholar]
- EAD 130005-00-0304; Solid Wood Slab Element to Be Used as a Structural Element in Buildings. EOTA: Brussels, Belgium, 2015.
- EN 16351; Timber Structures—Cross Laminated Timber—Requirements. CEN: Brussels, Belgium, 2021.
- Aicher, S.; Reinhardt, H.W. Einfluss der Bauteilgrößer in der linearen und nichtlinearen (Holz-) Bruchmechanik. Holz Als Roh-Und Werkst. 1993, 51, 215–220. [Google Scholar] [CrossRef]
- Brandner, R.; Bogensperger, T.; Schickhofer, G. In-plane shear strength of cross laminated timber (CLT): Test configuration, quantification and influencing parameters. In Proceedings of the CIB-W18 Proceedings, Meeting 46, Vancouver, BC, Canada, 26–29 August 2013; Görlacher, R., Ed.; Timber Scientific Publishing KIT Holzbau und Baukonstruktionen: Karlsruhe, Germany, 2013; pp. 227–242. [Google Scholar]
- Brandner, R.; Gatternig, W.; Schickhofer, G. Determination of shear strength of structural and glued laminated timber. In Proceedings of the CIB-W18 Proceedings, Meeting 45, Växjö, Sweden, 27–30 August 2012; Görlacher, R., Ed.; Ingenieurholzbau und Baukonstruktionen: Karlsruhe, Germany, 2012. [Google Scholar]
- Brandner, R.; Jantscher, L. Out-of-plane tensile properties of cross laminated timber (CLT). Buildings 2022, 12, 135. [Google Scholar] [CrossRef]
- Colling, F. Influence of volume and stress distribution on the shear strength and tensile strength perpendicular to grain. In Proceedings of the CIB-W18 Proceedings Volume II, Meeting 19, Florence, Italy, 1–5 September 1986. [Google Scholar]
- Kreuzinger, H. Platten, Scheiben und Schalen: Ein Berechnungsmodell für gängige Statikprogramme. Bau. Mit Holz 1999, 1, 34–39. (In German) [Google Scholar]
- Mestek, P.; Kreuzinger, H.; Winter, S. Design concept for CLT—Reinforced with selftapping screws. In Proceedings of the CIB-W18 Proceedings, Meeting 44, Alghero, Italy, 29 August–1 September 2011; Görlacher, R., Ed.; Ingenieurholzbau und Baukonstruktionen: Karlsruhe, Germany, 2011. [Google Scholar]
- Mestek, P. Punktgestützte Flächentragwerke aus Brettsperrholz (BSP): Schubbemessung unter Berücksichtigung von Schubverstärkungen. Doctoral Thesis, Technische Universität München, München, Germany, 2011. (In German). [Google Scholar]
- Ehrhart, T.; Brandner, R. Rolling shear: Test configurations and properties of some European soft- and hardwood species. Eng. Struct. 2018, 172, 554–572. [Google Scholar] [CrossRef]
- EN 408; Structural Timber—Structural Timber and Glued Laminated Timber—Determination of Some Physical and Mechanical Properties. CEN: Brussels, Belgium, 2012.
- EN 789; Timber Structures—Test Methods—Determination of Mechanical Properties of Wood Based Panels. CEN: Brussels, Belgium, 2005.
- Aicher, S.; Hirsch, M.; Christian, Z. Hybrid cross laminated timber plates with beech wood cross layers. Constr. Build. Mater. 2016, 124, 1007–1018. [Google Scholar] [CrossRef]
- Silly, G. Auslotung und Aufbereitung der Möglichkeiten zu Einer Ressourcenschonenderen Produktion von BSP-Elementen–Rollschubeigenschaften; TU Graz University of Technology: Graz, Austria, 2013. (In German) [Google Scholar]
- CEN/TC 250/SC 5 T1. prEN 1995-1-1; SC5.T1 Working Draft of Design of Cross Laminated Timber in a Revised Eurocode 5-1-1. CEN: Brussels, Belgium, 2018.
- CEN/TC 250/SC 5 N 1488. prEN 1995-1-1; Consolidated Draft of prEN 1995-1-1. CEN: Brussels, Belgium, 2021.
- Li, M.; Dong, W.; Lim, H. Influence of lamination aspect ratios and test methods on rolling shear strength evaluation of cross laminated timber. J. Mater. Civ. Eng. 2019, 31, 4019310. [Google Scholar] [CrossRef]
- Nero, R.; Christopher, P.; Ngo, T. Investigation of rolling shear properties of cross laminated timber (CLT) and comparison of experimental approaches. Constr. Build. Mater. 2022, 316, 125897. [Google Scholar] [CrossRef]
- Wang, Z.; Zhou, J.; Dong, W.; Yao, Y.; Gong, M. Influence of technical characteristics on the rolling shear properties of cross laminated timber by modified planar shear tests. Maderas Cienc. Tecnol. 2018, 20, 469–478. [Google Scholar] [CrossRef]
- Gardner, C.; Davids, W.G.; Lopez-Anido, R.; Herzog, B.; Edgar, R.; Nagy, E.; Berube, K.; Shaler, S. The effect of edge gaps on shear strength and rolling shear modulus of cross laminated timber panels. Constr. Build. Mater. 2020, 259, 119710. [Google Scholar] [CrossRef]
- Zare, A. Influence of Cross layer Lamella Edge-Bonding/Adhesive-Type on Rolling Shear Properties of Different Cross laminated-Timber Lay-Ups. Master Thesis, University of Applied Sciences, Bern, Switzerland, 2022. [Google Scholar]
- O’Ceallaigh, C.; Sikora, K.; Harte, A. The influence of panel lay-up on the characteristic bending and rolling shear strength of CLT. Buildings 2018, 8, 114. [Google Scholar] [CrossRef]
- Akter, S.T.; Bader, T.K. Experimental assessment of failure criteria for the interaction of normal stress perpendicular to the grain with rolling shear stress in Norway spruce clear wood. Holz Als Roh-Und Werkst. 2020, 78, 1105–1123. [Google Scholar] [CrossRef]
- Hill, R. The Mathematical Theory of Plasticity, 1st ed.; Oxford University Press: Oxford, UK, 1950; ISBN 99-0013542-3. [Google Scholar]
- Hoffman, O. The brittle strength of orthotropic materials. J. Compos. Mater. 1967, 1, 200–206. [Google Scholar] [CrossRef]
- Steiger, R.; Gehri, E. Interaction of shear stresses and stresses perpendicular to the grain. In Proceedings of the CIB-W18 Proceedings, Meeting 44, Alghero, Italy, 29 August–1 September 2011; Görlacher, R., Ed.; Ingenieurholzbau und Baukonstruktionen: Karlsruhe, Germany, 2011. [Google Scholar]
- SIA 265; 2021 Timber Structures: Timber Structures. SIA: Zürich, Switzerland, 2021.
- Akter, S.T.; Binder, E.; Bader, T.K. Moisture and short-term time-dependent behavior of Norway spruce clear wood under compression perpendicular to the grain and rolling shear. Wood Mater. Sci. Eng. 2022, 18, 580–593. [Google Scholar] [CrossRef]
- Glasner, D.; Ringhofer, A.; Brandner, R.; Schickhofer, G. Contribution to the testing, evaluation and design of cross laminated timber (CLT) in respect to rolling shear. In Proceedings of the International Network on Timber Engineering Research, Meeting 55. INTER, Bad Aibling, Germany, 22–25 August 2022; Görlacher, R., Ed.; Timber Scientific Publishing KIT Holzbau und Baukonstruktionen: Karlsruhe, Germany, 2022; pp. 455–473. [Google Scholar]
- EN 338; Structural Timber—Strength Classes. CEN: Brussels, Belgium, 2016; 79.040 (EN 338:2016-06-01).
- Dlubal Software GmbH. RFEM, version 5.17; Dlubal Software GmbH: Tiefenbach, Germany, 2020. [Google Scholar]
- Dvorkin, E.N.; Bathe, K.-N. A continuum mechanics based four-node shell element for general non-linear analysis. Eng. Comput. 1984, 1, 77–88. [Google Scholar] [CrossRef]
- Fink, G.; Kohler, J.; Brandner, R. Application of European design principles to cross laminated timber. Eng. Struct. 2018, 171, 934–943. [Google Scholar] [CrossRef]
- Brandner, R. Cross laminated timber (CLT) in compression perpendicular to plane: Testing, properties, design and recommendations for harmonizing design provisions for structural timber products. Eng. Struct. 2018, 171, 944–960. [Google Scholar] [CrossRef]
- EN 14358; Timber Structures—Calculation and Verification of Characteristic Values. CEN: Brussels, Belgium, 2016.
- Bažant, Z.P. Size effect in blunt fracture: Concrete, rock, metal. J. Eng. Mech. 1984, 110, 518–535. [Google Scholar] [CrossRef]
- Weibull, W. A Statistical Theory of the Strength of Materials; Generalstabens Litografiska Anstalts Förlag: Stockholm, Sweden, 1939; ISBN 991-428078-1. [Google Scholar]
- ETA-14/0349 CLT – Cross Laminated Timber Massive plattenförmige Holzbauelemente für tragende Bauteile in Bauwerken; Stora Enso Wood Products OY Ltd, OIB: Vienna, Austria, 2020.
- EN 14080; Timber Structures—Glued Laminated Timber and Glued Solid Timber—Requirements. CEN: Brussels, Belgium, 2013.
Figure 1.
Examples of applications of CLT where rolling shear stresses may govern the ULS design.

Figure 2.
Typical partial and ultimate failure modes in the 3PB tests featuring shear fields similar to the EAD [2] test setups, with the left figures as the force–displacement curves and the right figures as corresponding failure patterns. The red dots in the force–displacement curves indicate the present load level of the corresponding failure pattern: (a) initial state; (b) development of first rolling shear cracks; (c) opening and propagation of cracks as well as short-term load drops prior to the maximum force; (d) tensile bending failure at the maximum force in the bending-tension zone followed by successive tensile bending failures in all longitudinal layers (highlighted by the red circles).

Figure 3.
Typical normalized force–displacement curves from 4PB rolling shear tests according to the EAD [2] test setup on CLT featuring different numbers of cross layers nCL = {1; 2; 3}.
Figure 3.
Typical normalized force–displacement curves from 4PB rolling shear tests according to the EAD [2] test setup on CLT featuring different numbers of cross layers nCL = {1; 2; 3}.

Figure 4.
Rolling shear stresses τRT in the cylindrical LRT-CS and τYZ in the cartesian XYZ-CS.

Figure 5.
Four-point bending test setups according to EAD [2] (1a,1b) and EN 16351 [3] (2a,2b) for CLT with three respective seven layers. Marked in red is the assumed distribution of stresses in compression perpendicular to the grain, which is simplified by an angle of 45° in laminations with fibers running parallel to the span direction and 15° in transversally oriented laminations. The resulting a1,eff indicates the portion of the shear length a1, which is quasi-free of stresses perpendicular to the grain (cf. Section 3.2.4; values in (mm)).

Figure 7.
Visual representation of the proposed method for determining fr.

Figure 8.
Methodology for the interaction of rolling shear stresses and stresses perpendicular to the grain shown exemplarily for a three-layered CLT element with tCLT = 120 mm (40-40-40 mm); (a) stress distributions along section A-A in a pseudo 3PB test; (b) applied failure criteria.
Figure 8.
Methodology for the interaction of rolling shear stresses and stresses perpendicular to the grain shown exemplarily for a three-layered CLT element with tCLT = 120 mm (40-40-40 mm); (a) stress distributions along section A-A in a pseudo 3PB test; (b) applied failure criteria.

Figure 9.
Comparison of rolling shear stresses from different calculation methods relative to the maximum rolling shear stresses from FE-analysis.
Figure 9.
Comparison of rolling shear stresses from different calculation methods relative to the maximum rolling shear stresses from FE-analysis.

Figure 10.
Normalized shear flows of the different test setups calculated for a 3-layered CLT slab with tCLT = 120 mm (40-40-40 mm).
Figure 10.
Normalized shear flows of the different test setups calculated for a 3-layered CLT slab with tCLT = 120 mm (40-40-40 mm).

Figure 11.
Comparison of the normalized shear flows for 3PB tests with and without reinforcement.

Figure 12.
Normalized shear flows for unidirectional layering versus cross layering.

Figure 13.
Comparisons of (a) fr,12,SIA vs. a1; (b) fr,12,SIA vs. tCL.

Figure 14.
Relationships between fr,12,SIA and (a1 · tCL) for the 4PB test data of the EAD database separated by the number of cross layers nCL and supplemented by power regression models, and in addition, the results of the supplementary conducted 3PB and IS tests, multiplied by the respective conversion factors according to Table 4, are included.

Figure 15.
Power regressions on the 4PB test data of the EAD database separated by the number of cross layers nCL: fr,12,SIA vs. (a1 · tCL) and fr,12 vs. (a1,eff · tCL).
Figure 15.
Power regressions on the 4PB test data of the EAD database separated by the number of cross layers nCL: fr,12,SIA vs. (a1 · tCL) and fr,12 vs. (a1,eff · tCL).

Figure 16.
Relationship between the coefficient of variation CoV[fr,SIA] and nCL.

Figure 17.
(a) Model verification and validation; (b) residual plot.

Figure 18.
Evaluation of the characteristic rolling shear strength model for a number of common CLT layups.
Figure 18.
Evaluation of the characteristic rolling shear strength model for a number of common CLT layups.

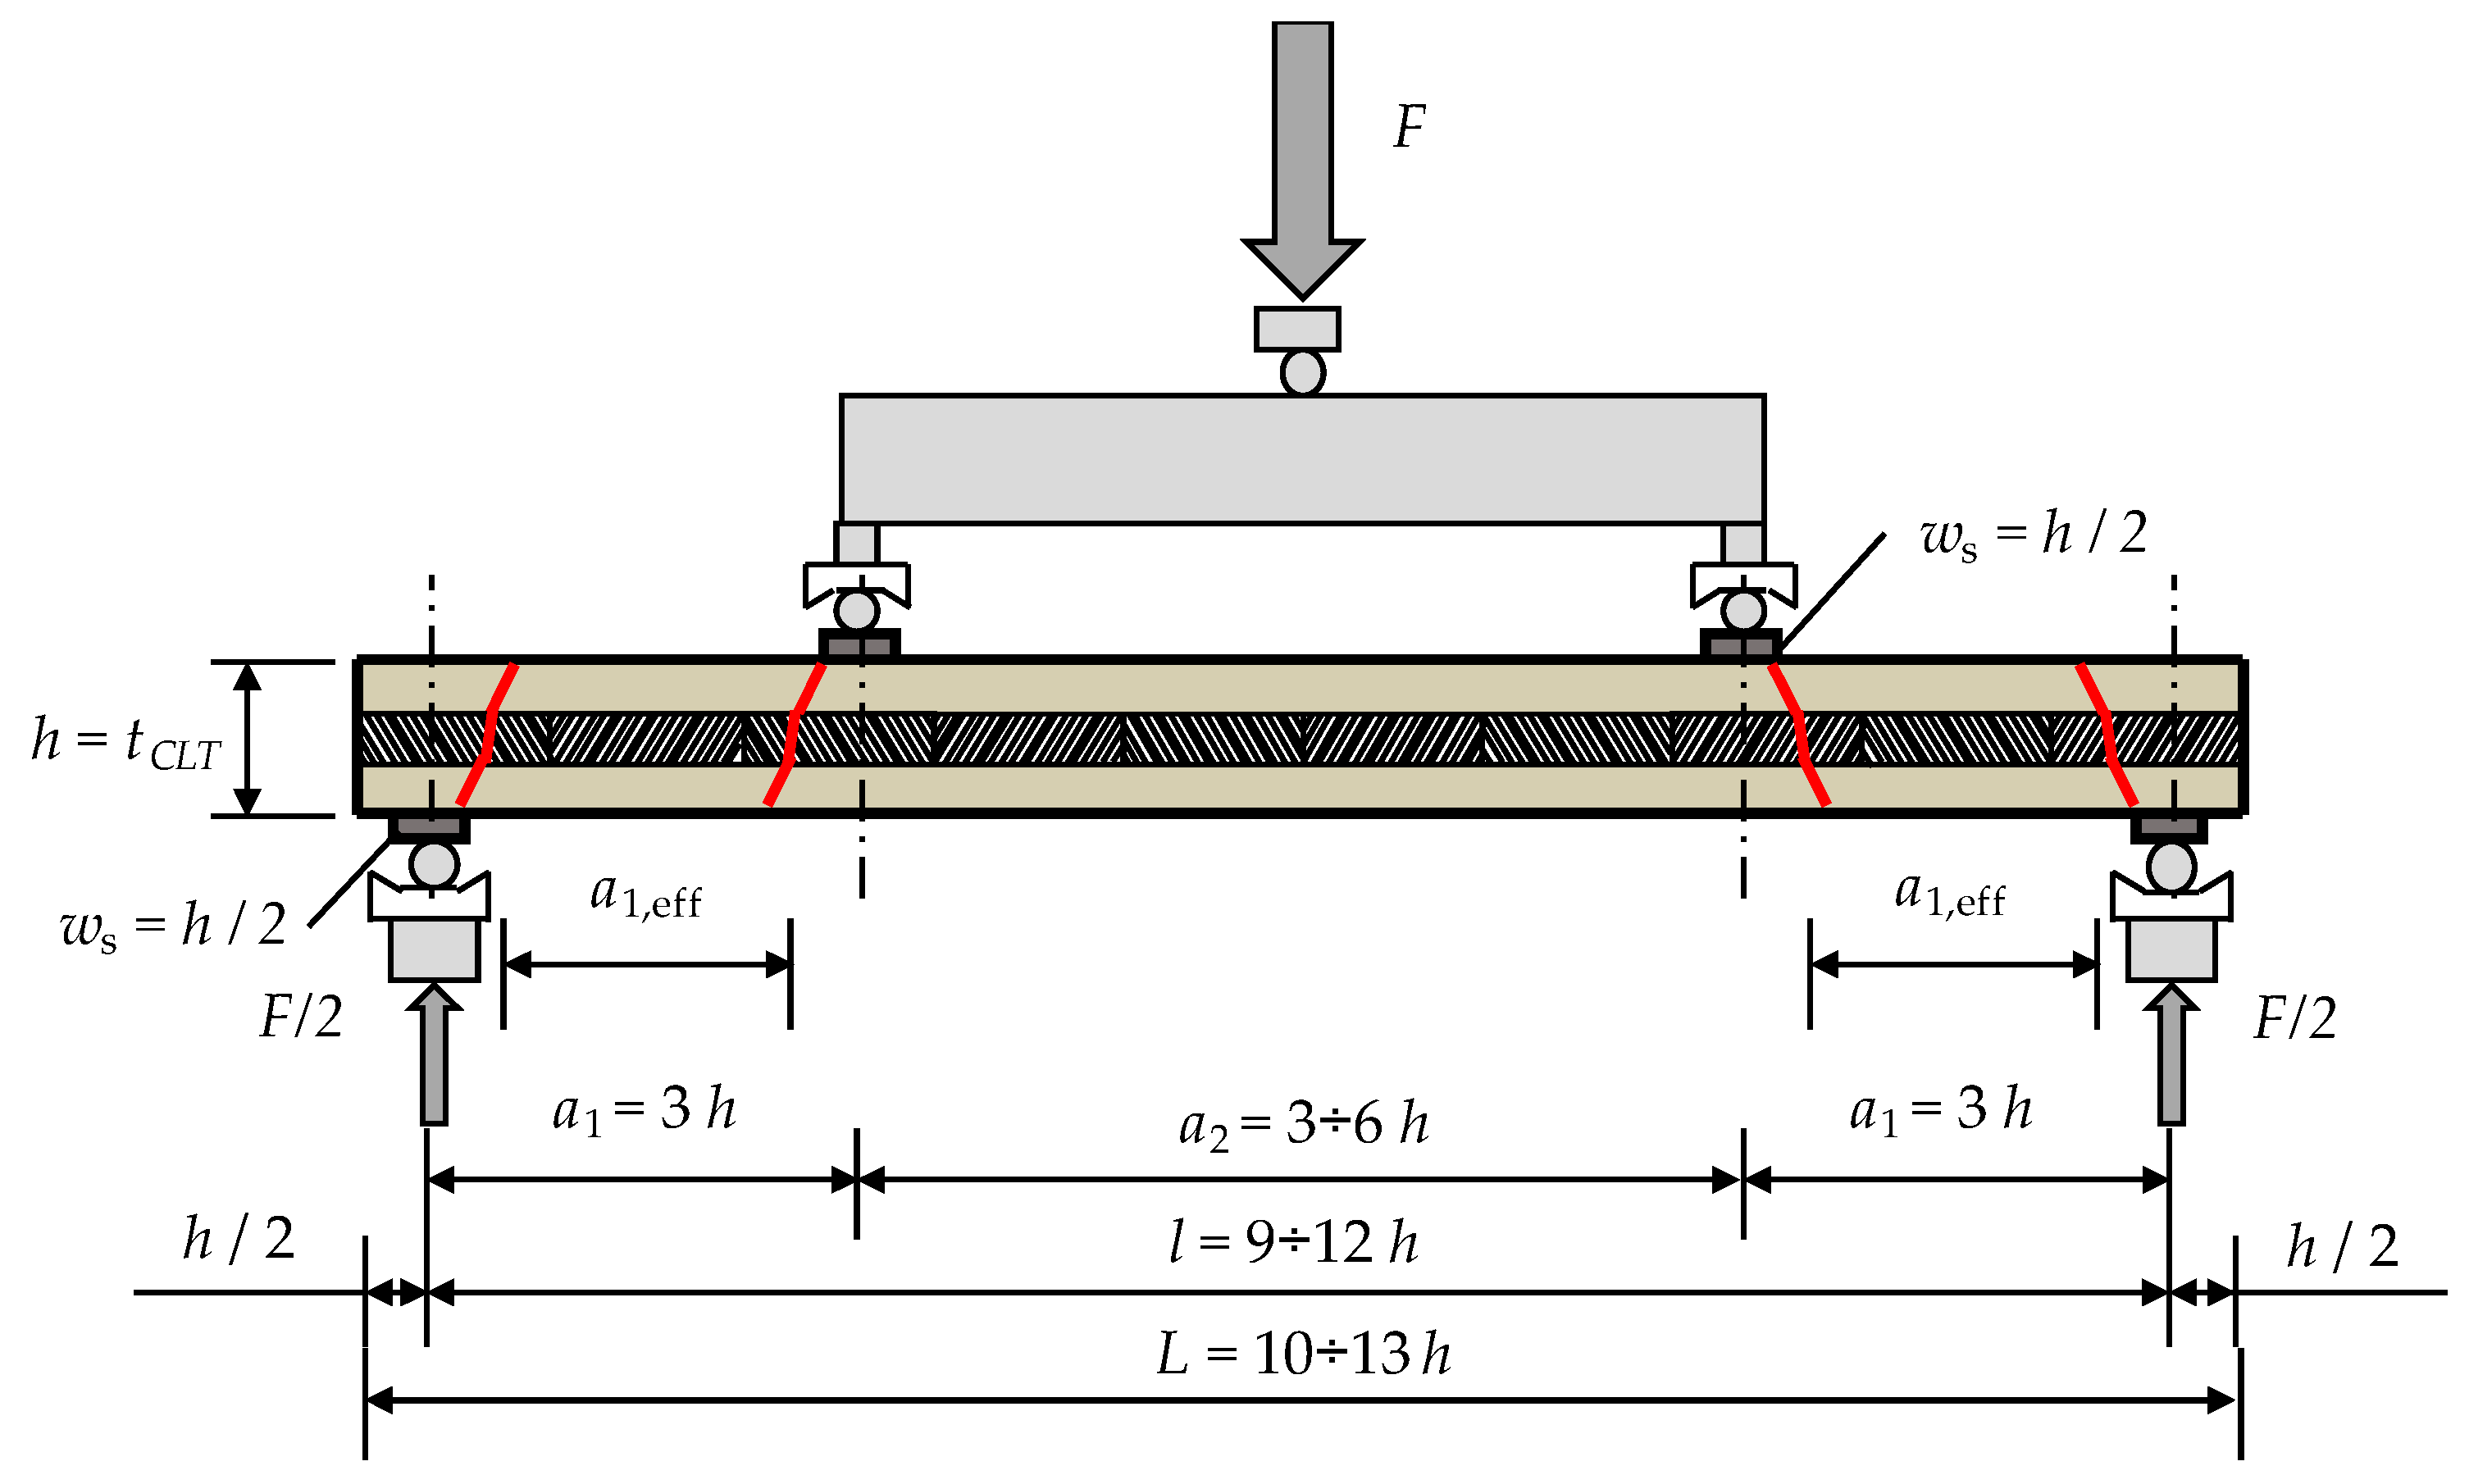
Figure 19.
Proposed test setup for determining the rolling shear strength.


Table 1.
Dimensions of 4PB tests for rolling shear testing according to EN 16351 [3] and EAD 130005-00-0304 [2], with values in (mm).
| Geometric Property | Variable | EAD | EN 16351 |
|---|---|---|---|
| Span | l | ~3000 | 12h + (9h *) |
| Measuring length for the modulus of elasticity (MoE) | l1 | 5h | 5h + (– *) |
| Distance between load application and support | a1 | 450 | 3h |
| Distance between load applications | a2 | l − 2a1 | 6h + (3h *) |
| Nominal width | w | ~800 | ≥600 |
| Nominal slab thickness | h | tCLT | tCLT |
| Overlap at supports | – | ≥100 | h/2 |
+ With measurement of local MoE; * Without measurement of local MoE.
Table 2.
Test series and geometric parameters of the 4PB tests conducted at the LTC (the thicknesses of cross layers are underlined in the layup).
Table 2.
Test series and geometric parameters of the 4PB tests conducted at the LTC (the thicknesses of cross layers are underlined in the layup).
| Test Series No. | Manufacturer No. | Layup | tCLT | a1 | a2 | Overlap | l | ws |
|---|---|---|---|---|---|---|---|---|
| (-) | (mm) | (mm) | (mm) | (mm) | (mm) | (mm) | (mm) | |
| 01 | 01 | 40-40-40-40-40-40-40 | 280 | 500 | 2000 | 100 | 3000 | 100 |
| 02 | 01 | 40-40-20-20-20-40-40 | 220 | 500 | 2000 | 100 | 3000 | 100 |
| 03 | 01 | 40-20-40-20-40 | 160 | 350 | 2200 | 150 | 2900 | 50 |
| 04 | 01 | 40-20-40 | 100 | 400 | 2200 | 100 | 3000 | 50 |
| 05 | 02 | 30-40-30 | 100 | 350 | 2300 | 100 | 3000 | 50 |
| 06 | 02 | 40-30-40-30-40 | 180 | 400 | 2200 | 100 | 3000 | 100 |
| 07 | 02 | 30-40-30-40-30-40-30 | 240 | 400 | 2200 | 100 | 3000 | 100 |
| 08 | 03 | 40-20-40 | 100 | 400 | 2200 | 200 | 3000 | 45 |
| 09 | 03 | 40-30-40-30-40 | 180 | 500 | 2000 | 200 | 3000 | 80 |
| 10 | 03 | 40-40-40-40-40-40-40 | 280 | 550 | 1900 | 200 | 3000 | 100 |
| 11 | 04 | 30-30-30 | 90 | 400 | 2200 | 100 | 3000 | 50 |
| 12 | 04 | 40-20-40-20-40 | 160 | 500 | 2000 | 100 | 3000 | 80 |
| 13 | 04 | 40-40-40 | 120 | 450 | 2100 | 100 | 3000 | 50 |
| 14 | 04 | 40-40-40-40-40 | 200 | 500 | 2000 | 100 | 3000 | 80 |
| 15 | 05 | 40-40-40-40-40 | 200 | 400 | 1800 | 300 | 2600 | 100 |
Table 3.
Geometric and execution parameters of the additional test program.
| Test Series | Layup | tCLT | w | a1 | Reinforced Perp. to Grain | Overlap | l | ws | |
| (-) | (mm) | (mm) | (mm) | (mm) | (-) | (mm) | (mm) | (mm) | |
| 3PB | PS-100-300-360-V | 40-20-40 | 100 | 300 | 360 | yes | 60 | 780 | 60 |
| PS-200-300-450-V | 40-40-40-40-40 | 200 | 300 | 450 | yes | 100 | 1000 | 60 | |
| PS-120-300-360 | 40-40-40 | 120 | 300 | 360 | no | 60 | 780 | 60 | |
| PS-120-800-360 | 40-40-40 | 120 | 800 | 360 | no | 60 | 780 | 60 | |
| PS-120-500-200 | 40-40-40 | 120 | 500 | 200 | no | 60 | 460 | 60 | |
| PS-120-500-360 | 40-40-40 | 120 | 500 | 360 | no | 60 | 780 | 60 | |
| PS-120-500-450 | 40-40-40 | 120 | 800 | 450 | no | 60 | 960 | 60 | |
| PS-100-500-360-V | 40-20-40 | 100 | 500 | 360 | yes | 60 | 780 | 60 | |
| PS-120-500-360-V | 40-40-40 | 120 | 500 | 360 | yes | 60 | 780 | 60 | |
| PS-120-500-450-V | 40-40-40 | 120 | 500 | 450 | yes | 60 | 960 | 60 | |
| PS-200-500-450-V | 40-40-40-40-40 | 200 | 500 | 450 | yes | 100 | 1000 | 60 | |
| Test Series | Layup | tCLT | w | a1 | α | - | l | - | |
| (-) | (mm) | (mm) | (mm) | (mm) | (°) | (-) | (mm) | (-) | |
| IS | IS-100-500-360 | 40-20-40 | 100 | 500 | 360 | 10 | - | 360 | - |
| IS-120-500-360 | 40-40-40 | 120 | 500 | 360 | 10 | - | 360 | - |
Table 4.
Ratios of the rolling shear stress peaks for the normalized rolling shear flows for different test setups.
Table 4.
Ratios of the rolling shear stress peaks for the normalized rolling shear flows for different test setups.
| max(τr,norm,m)/ max(τr,norm,n) | m | τr,i,mean,a1 | IS | 3PB | 4PB 6 tCLT | 4PB 3 tCLT | |
|---|---|---|---|---|---|---|---|
| n | |||||||
| τr,i,mean,a1 | 1.00 | 1.25 | 1.08 | 0.93 | 0.95 | ||
| IS | 0.80 | 1.00 | 0.86 | 0.74 | 0.76 | ||
| 3PB | 0.93 | 1.17 | 1.00 | 0.86 | 0.88 | ||
| 4PB|a2 = 6 tCLT | 1.08 | 1.35 | 1.16 | 1.00 | 1.02 | ||
| 4PB|a2 = 3 tCLT | 1.06 | 1.32 | 1.14 | 0.98 | 1.00 | ||
Table 5.
Summary of the main statistical analyses from the additional test series.
| 3PB | IS | |||||||||||||
|---|---|---|---|---|---|---|---|---|---|---|---|---|---|---|
| Test Series | PS-100-300-360-V | PS-200-300-450-V | PS-120-300-360 | PS-120-800-360 | PS-120-500-200 | PS-120-500-360 | PS-120-500-450 | PS-100-500-360-V | PS-120-500-360-V | PS-120-500-450-V | PS-200-500-450-V | IS-100-500-360 | IS-120-500-360 | |
| No. of Specimens | 6 | 6 | 6 | 6 | 6(5) 1 | 6 | 6 | 6 | 6 | 6 | 6 | 15 | 12 | |
| u (%) | Mean | 10.9 | 10.9 | 11.0 | 10.9 | 11.0 | 10.9 | 10.3 | 10.9 | 11.0 | 10.6 | 11.2 | 11.3 | 11.5 |
| CoV (%) | 2.52 | 1.98 | 5.42 | 1.71 | 4.75 | 3.41 | 2.62 | 5.13 | 3.74 | 2.52 | 2.18 | 1.64 | 2.93 | |
| ρ12 (kg/m3) | Mean | 478 | 434 | 433 | 445 | 459 | 438 | 446 | 478 | 452 | 446 | 454 | 460 | 432 |
| Median | 478 | 432 | 432 | 447 | 461 | 432 | 446 | 482 | 456 | 452 | 457 | 460 | 433 | |
| CoV (%) | 3.60 | 2.98 | 1.63 | 2.83 | 1.14 | 3.20 | 1.42 | 4.01 | 2.46 | 5.12 | 2.67 | 1.58 | 3.39 | |
| fr,12 (N/mm2) | Mean | 1.53 | 1.02 | 1.21 | 1.09 | 1.72 | 1.22 | 0.96 | 1.64 | 1.18 | 0.99 | 1.09 | 1.43 | 1.00 |
| CoV (%) | 8.98 | 10.3 | 9.61 | 11.9 | 4.37 | 12.1 | 12.7 | 4.96 | 10.1 | 8.60 | 11.8 | 16.1 | 15.4 | |
| LN0.05 2 | 1.32 | 0.85 | 1.03 | 0.89 | 1.60 | 0.99 | 0.77 | 1.51 | 1.00 | 0.86 | 0.89 | 1.08 | 0.75 | |
| charEN14358 3 | 1.24 | 0.79 | 0.97 | 0.82 | 1.52 | 0.91 | 0.71 | 1.46 | 0.94 | 0.81 | 0.82 | 1.02 | 0.70 | |
| fr,12,SIA (N/mm2) | Mean | 1.50 | 1.00 | 1.16 | 1.04 | 1.51 | 1.17 | 0.93 | 1.60 | 1.16 | 0.98 | 1.07 | 1.37 | 0.98 |
| CoV (%) | 8.81 | 10.1 | 9.22 | 11.5 | 3.92 | 11.7 | 12.4 | 4.86 | 9.90 | 8.49 | 11.6 | 15.7 | 15.3 | |
| LN0.05 2 | 1.29 | 0.83 | 0.99 | 0.86 | 1.41 | 0.96 | 0.75 | 1.48 | 0.99 | 0.85 | 0.87 | 10.4 | 0.74 | |
| charEN14358 3 | 1.22 | 0.78 | 0.93 | 0.80 | 1.33 | 0.88 | 0.69 | 1.42 | 0.92 | 0.80 | 0.80 | 0.98 | 0.69 | |
| fr,12,Hoffman (N/mm2) | Mean | 1.51 | 1.00 | 1.18 | 1.06 | 1.60 | 1.19 | 0.94 | 1.61 | 1.16 | 0.98 | 1.08 | 1.41 | 0.99 |
| CoV (%) | 8.88 | 10.2 | 9.42 | 11.7 | 4.23 | 11.9 | 12.5 | 4.90 | 10.0 | 8.53 | 11.6 | 16.6 | 15.6 | |
| LN0.05 2 | 1.30 | 0.84 | 1.01 | 0.87 | 1.49 | 0.97 | 0.76 | 1.49 | 0.99 | 0.85 | 0.88 | 1.05 | 0.74 | |
| charEN14358 3 | 1.22 | 0.78 | 0.95 | 0.81 | 1.42 | 0.89 | 0.70 | 1.43 | 0.93 | 0.80 | 0.81 | 0.99 | 0.70 | |
| fr,12,Mestek (N/mm2) | Mean | 1.49 | 0.99 | 1.13 | 1.02 | 1.47 | 1.14 | 0.92 | 1.59 | 1.15 | 0.97 | 1.06 | 1.36 | 0.95 |
| CoV (%) | 8.75 | 10.0 | 9.13 | 11.3 | 4.12 | 11.6 | 12.2 | 4.82 | 9.82 | 8.45 | 11.5 | 15.7 | 15.1 | |
| LN0.05 2 | 1.29 | 0.83 | 0.98 | 0.85 | 1.37 | 0.94 | 0.75 | 1.47 | 0.98 | 0.85 | 0.87 | 1.03 | 0.72 | |
| charEN14358 3 | 1.21 | 0.77 | 0.92 | 0.79 | 1.30 | 0.87 | 0.69 | 1.41 | 0.92 | 0.80 | 0.80 | 0.97 | 0.67 | |
1 A data malfunction occurred for one specimen, and subsequently, values were excluded from further data processing. 2 5%-quantile, assuming lognormally distributed data. 3 Characteristic value calculated according to EN 14358 [37].
Table 6.
Summary of the main statistical analyses from the EAD test series.
| Test Series | 01 | 02 | 03 | 04 | 05 | 06 | 07 | 08 | 09 | 10 | 11 | 12 | 13 | 14 | 15 | |
|---|---|---|---|---|---|---|---|---|---|---|---|---|---|---|---|---|
| No. of Specimens | 20 | 20 | 16 | 19 | 20 | 19 | 20 | 17 | 20 | 19 | 21 | 20 | 21 | 21 | 19 | |
| u (%) | Mean | 13.2 | 13.4 | 12.8 | 13.4 | 11.4 | 11.0 | 11.1 | 12.3 | 13.3 | 12.9 | 9.94 | 11.9 | 7.87 | 8.68 | 13.1 |
| CoV (%) | 1.78 | 3.43 | 3.06 | 2.47 | 2.46 | 2.27 | 2.01 | 5.22 | 2.44 | 3.64 | 12.2 1 | 3.22 | 9.34 | 3.28 | 5.23 | |
| ρ12 (kg/m3) | Mean | 445 | 442 | 437 | 444 | 446 | 445 | 446 | 444 | 446 | 444 | 472 | 465 | 457 | 461 | 456 |
| Median | 446 | 442 | 435 | 443 | 446 | 442 | 448 | 443 | 448 | 444 | 464 | 471 | 458 | 460 | 459 | |
| CoV (%) | 1.31 | 1.06 | 2.34 | 1.88 | 1.77 | 1.22 | 1.68 | 2.53 | 1.85 | 1.59 | 3.64 | 3.79 | 1.72 | 1.10 | 1.67 | |
| fr,12 (N/mm2) | Mean | 1.76 | 2.42 | 2.36 | 1.92 | 1.58 | 2.00 | 1.92 | 1.89 | 1.53 | 1.62 | 1.52 | 1.88 | 1.22 | 1.12 | 1.49 |
| CoV (%) | 4.53 | 5.45 | 5.39 | 11.0 | 8.84 | 3.18 | 5.09 | 5.89 | 6.12 | 3.66 | 7.04 | 5.69 | 8.66 | 4.31 | 6.54 | |
| LN0.05 | 1.63 | 2.21 | 2.16 | 1.58 | 1.36 | 1.90 | 1.77 | 1.71 | 1.38 | 1.52 | 1.35 | 1.71 | 1.06 | 1.04 | 1.34 | |
| charEN14358 | 1.59 | 2.17 | 2.11 | 1.53 | 1.33 | 1.81 | 1.74 | 1.68 | 1.36 | 1.47 | 1.32 | 1.68 | 1.03 | 1.09 | 1.31 | |
| fr,12,SIA (N/mm2) | Mean | 1.61 | 2.24 | 2.17 | 1.85 | 1.52 | 1.85 | 1.75 | 1.82 | 1.46 | 1.50 | 1.48 | 1.79 | 1.19 | 1.07 | 1.40 |
| CoV (%) | 4.22 | 5.08 | 5.08 | 10.7 | 8.55 | 2.99 | 4.71 | 5.71 | 5.89 | 3.43 | 6.87 | 5.46 | 8.44 | 4.16 | 6.20 | |
| LN0.05 | 1.50 | 2.05 | 1.99 | 1.53 | 1.31 | 1.76 | 1.61 | 1.66 | 1.32 | 1.42 | 1.31 | 1.63 | 1.03 | 1.00 | 1.26 | |
| charEN14358 | 1.46 | 2.02 | 1.95 | 1.48 | 1.28 | 1.67 | 1.59 | 1.63 | 1.30 | 1.36 | 1.29 | 1.61 | 1.01 | 0.97 | 1.23 | |
| fr,12,Hoffmann (N/mm2) | Mean | 1.67 | 2.33 | 2.27 | 1.88 | 1.54 | 1.92 | 1.82 | 1.85 | 1.49 | 1.55 | 1.49 | 1.83 | 1.20 | 1.09 | 1.44 |
| CoV (%) | 4.40 | 5.32 | 5.35 | 10.8 | 8.69 | 3.13 | 4.95 | 5.80 | 6.03 | 3.55 | 6.94 | 5.61 | 8.53 | 4.24 | 6.40 | |
| LN0.05 | 1.55 | 2.13 | 2.07 | 1.55 | 1.33 | 1.82 | 1.68 | 1.68 | 1.35 | 1.46 | 1.33 | 1.67 | 1.04 | 1.02 | 1.29 | |
| charEN14358 | 1.52 | 2.09 | 2.03 | 1.50 | 1.30 | 1.74 | 1.65 | 1.65 | 1.32 | 1.40 | 1.30 | 1.64 | 1.01 | 0.99 | 1.26 | |
| fr,12,Mestek (N/mm2) | Mean | 1.58 | 2.17 | 2.14 | 1.82 | 1.49 | 1.83 | 1.71 | 1.79 | 1.44 | 1.47 | 1.46 | 1.77 | 1.17 | 1.06 | 1.38 |
| CoV (%) | 4.30 | 5.16 | 5.10 | 10.6 | 8.42 | 3.03 | 4.84 | 5.64 | 5.92 | 3.43 | 6.78 | 5.50 | 8.33 | 4.19 | 6.25 | |
| LN0.05 | 1.47 | 1.99 | 1.97 | 1.51 | 1.30 | 1.74 | 1.57 | 1.63 | 1.31 | 1.39 | 1.30 | 1.61 | 1.02 | 0.99 | 1.24 | |
| charEN14358 | 1.43 | 1.96 | 1.93 | 1.46 | 1.26 | 1.65 | 1.55 | 1.61 | 1.28 | 1.33 | 1.27 | 1.59 | 1.00 | 0.96 | 1.21 | |
1 The comparably high CoV results from two batches that were delivered and tested separately but analyzed together.
Table 7.
Coefficients of the basic rolling shear strength model for estimation of rolling shear strengths at the mean and 5%-quantile levels.
Table 7.
Coefficients of the basic rolling shear strength model for estimation of rolling shear strengths at the mean and 5%-quantile levels.
| fr,ref (N/mm2) | c0 (-) | c1 (-) | |
|---|---|---|---|
| fr,mean | 5.74 | 0.85 | 0.15 |
| fr,0.05,emp | 5.05 | 0.80 | 0.20 |
Table 8.
Geometric and execution parameters of the validation test series.
| 4PB ”Validation” | Test Series | Manufacturer No. | Layup | tCLT | w | a1 | a2 | Overlap | ws |
| (-) | (mm) | (mm) | (mm) | (mm) | (mm) | (mm) | (mm) | ||
| PS-100-600-300 | 04 | 40-20-40 | 100 | 600 | 300 | 600 | 100 | 50 | |
| PS-280-300-840 | 06 | 40-40-40-40-40-40-40 | 280 | 300 | 840 | 840 | 140 | 100 |
Table 9.
Summary of the main statistical analyses from the validation test series.
| Test Series | No. of Specimens | u (%) | ρ12 (kg/m3) | fr,12 (N/mm2) | fr,12,SIA (N/mm2) | |||||||||
| Mean | CoV (%) | Mean | Median | CoV (%) | Mean | CoV (%) | LN0.05 | charEN14358 | Mean | CoV (%) | LN0.05 | charEN14358 | ||
| PS-100-600-300 | 19 | 10.7 | 7.53 | 456 | 460 | 5.52 | 2.27 | 6.93 | 2.01 | 1.97 | 2.13 | 6.76 | 1.90 | 1.87 |
| PS-280-300-840 | 8 | 10.9 | 4.98 | 444 | 443 | 2.98 | 1.35 | 4.52 | 1.25 | 1.21 | 1.30 | 4.67 | 1.20 | 1.16 |
Disclaimer/Publisher’s Note: The statements, opinions and data contained in all publications are solely those of the individual author(s) and contributor(s) and not of MDPI and/or the editor(s). MDPI and/or the editor(s) disclaim responsibility for any injury to people or property resulting from any ideas, methods, instructions or products referred to in the content. |
© 2023 by the authors. Licensee MDPI, Basel, Switzerland. This article is an open access article distributed under the terms and conditions of the Creative Commons Attribution (CC BY) license (https://creativecommons.org/licenses/by/4.0/).
Share and Cite
MDPI and ACS Style
Glasner, D.; Ringhofer, A.; Brandner, R.; Schickhofer, G. Rolling Shear Strength of Cross Laminated Timber (CLT)—Testing, Evaluation, and Design. Buildings 2023, 13, 2831. https://doi.org/10.3390/buildings13112831
AMA Style
Glasner D, Ringhofer A, Brandner R, Schickhofer G. Rolling Shear Strength of Cross Laminated Timber (CLT)—Testing, Evaluation, and Design. Buildings. 2023; 13(11):2831. https://doi.org/10.3390/buildings13112831
Chicago/Turabian StyleGlasner, David, Andreas Ringhofer, Reinhard Brandner, and Gerhard Schickhofer. 2023. "Rolling Shear Strength of Cross Laminated Timber (CLT)—Testing, Evaluation, and Design" Buildings 13, no. 11: 2831. https://doi.org/10.3390/buildings13112831
Note that from the first issue of 2016, this journal uses article numbers instead of page numbers. See further details here.