
Prediction and Interpretation of Residual Bearing Capacity of Cfst Columns under Impact Loads Based Interpretable Stacking Fusion Modeling
1
School of Civil Engineering, Qingdao University of Technology, Qingdao 266033, China
2
School of Mechanical and Automotive Engineering, Qingdao University of Technology, Qingdao 266520, China
3
College of Transportation, Shandong University of Science and Technology, Qingdao 266590, China
*
Author to whom correspondence should be addressed.
Buildings 2023, 13(11), 2783; https://doi.org/10.3390/buildings13112783
Submission received: 16 September 2023
/
Revised: 29 October 2023
/
Accepted: 2 November 2023
/
Published: 6 November 2023
(This article belongs to the Topic Artificial Intelligence (AI) Applied in Civil Engineering, 2nd Volume)
Abstract
:The utilization of Concrete-filled steel Tubular (CFST) columns is increasingly widespread. However, the assessment of the residual bearing capacity of CFST columns currently relies mainly on costly and time-consuming experiments and numerical simulations. In this study, we propose a machine learning-based model for rapidly identifying the residual bearing capacity of CFST columns. The results demonstrate that the predictions of the proposed Stacking-KRXL model align well with the actual values, with most prediction errors falling within ±10%. The RSquared value of 0.97 significantly surpasses that of other methods. The stability and robustness of the model are analyzed. Additionally, the Shapley additive explanations method is applied for global and local interpretations, revealing positive or negative correlations between different parameters and the residual bearing capacity of CFST columns, mainly influenced by the concrete area in the core region.
1. Introduction
Concrete-filled Steel Tubular (CFST) columns have received extensive attention in the field of civil engineering in recent years [1,2,3] and have been widely applied in structures such as bridges, marine constructions, and mountain constructions. However, in practical engineering, structural elements may be subjected to various impact loads in addition to design loads [4,5,6], such as explosions, vehicle collisions, wave impacts, and rock fall impacts. The damage caused by these impacts can severely compromise the structural integrity and lead to loss of bearing capacity, posing a serious threat to human life and property safety. When structures are subjected to short-duration sustained impact loads, they undergo significant deformations primarily due to material, geometric, and contact nonlinearity, making the mechanical and dynamic response analysis of the structures highly complex [7]. Therefore, predicting the residual bearing capacity of CFST structures after being subjected to lateral impact loads has become extremely challenging, despite its potential to provide valuable insights for the design of CFST structures with resistance to impacts.
Currently, the assessment of the residual bearing capacity of CFST columns subjected to impact loads primarily relies on extensive testing and numerical simulations. For instance, Zhang et al. [8,9] conducted lateral impact tests and investigated the residual bearing capacity of damaged specimens, revealing that lateral impacts significantly reduced the initial stiffness, residual bearing capacity, and ductility of CFST columns. Hou et al. [10] numerically studied the entire lifecycle of CFST columns and found that impact loads significantly influenced the residual deformation and bearing capacity of CFST columns. Wang et al. [11] investigated square recycled aggregate concrete-filled steel tubular (RACFST) columns through close-range explosion tests and evaluated the residual axial bearing capacity. The results indicated that the steel tube thickness and core concrete strength were the main factors affecting the residual bearing capacity of CFST columns. Chen et al. [12] experimentally studied the residual bearing capacity of 45 circular CFST columns under impact loads. They found that impact energy, core concrete strength, and impact location had significant influences on the residual bearing capacity. Wang et al. [13] analyzed the residual bearing capacity of CFST columns under lateral impact using numerical simulations and proposed different damage assessment levels and assessment curves based on the parametric analysis results. Kang et al. [14] numerically investigated the effect of axial pressure on the residual bearing capacity of CFST columns under impact loads. The results showed that when the axial compression ratio was less than 0.7, the axial force enhanced the impact resistance of CFST columns.
In recent years, machine learning (ML) has been widely applied in civil engineering due to the availability of data and its powerful capabilities in addressing complex nonlinear problems [15,16]. ML methods offer high accuracy and strong generalization abilities, enabling the prediction of complex problems without the need for an in-depth understanding of their physical principles, thus greatly reducing the application barriers for engineers [17]. Currently, many researchers have applied ML methods to study the impact resistance of reinforced concrete (RC) structures. For example, Almustafa et al. [18,19] utilized ML methods to analyze the feasibility of predicting the maximum displacement of RC columns and FRP-strengthened RC panels under blast loads. Thai et al. [20] employed a gradient-boosting machine learning (GBML) approach to predict local damage in RC panels under impact loads. Doan et al. [21] classified the damage patterns of RC panels under impact loads using artificial neural networks (ANN) and optimized the ANN model using genetic algorithms (GA) and particle swarm optimization (PSO). Cao et al. [22] investigated the impact of influential parameters on the impact resistance of fiber-reinforced concrete using an adaptive neuro-fuzzy inference system. Haruna et al. [23] developed a support vector machine (SVM) model that accurately predicted the impact resistance of U-shaped polyurethane-based polymer concrete. Al-shawafi et al. [24] predicted the energy absorption capacity of Ultra High-Performance Reinforced Concrete (UHPFRC) in the failure cracking stage using ANN and multiple linear regression (MLR) methods. Although ML methods have shown certain advantages in analyzing the impact resistance of concrete structures, the “black-box” nature of ML methods often obscures the relationship between input variables and output parameters. Users can only observe the final results without understanding the internal decision-making process of the model. This lack of transparency in the ML methods leads to a lack of confidence in their application among users, thereby limiting their application and development in the field of engineering to some extent [25]. To address this, Strumbelj et al. [26] proposed a game-theoretic Shapley Additive Explanations (SHAP) approach for quantifying the contributions of input parameters to output parameters, which has been widely utilized [17].
In summary, the research on the residual bearing capacity of CFST components after experiencing lateral impact is currently very limited, mainly focusing on experiments and numerical simulations, which are costly and time-consuming traditional methods. There has been no systematic study on the residual bearing capacity of CFST columns under the impact load using ML methods. Therefore, there is an urgent need to develop a low-cost, efficient, and comprehensive approach that considers multiple influencing factors to explore the residual bearing capacity of CFST columns after impact load.
Based on the aforementioned background, this paper proposes an interpretable Stacking-KRXL fusion model for predicting and interpreting the residual bearing capacity of CFST columns. The innovations of this study are as follows:
- (1)
- Building a CFST column residual bearing capacity database containing 221 data samples based on existing research reports.
- (2)
- This paper proposes a multi-model fusion model based on the Stacking framework for rapid prediction of the residual bearing capacity of CFST columns under impact loads. The stability and robustness of the proposed model are evaluated and compared comprehensively with existing prediction methods.
- (3)
- Applying the Shapley Additive Explanations (SHAP) method to provide global and local interpretations of the Stacking-KRXL fusion model. The important feature ranking of CFST column residual bearing capacity under impact load, the influence relationship between input features and output, and the effects of local samples on CFST column residual bearing capacity are analyzed.
2. CFST Columns Database and Feature Selection
2.1. CFST Columns Database Establishment
This study aims to rapidly predict the residual bearing capacity of CFST columns after impact loads and develop corresponding models. To establish the ML model, we constructed a CFST column database containing 221 data points, based on previous studies on the impact resistance of CFST columns [12,13,27,28]. It is important to note that the data used in this database were sourced from the aforementioned four references. This database includes data on various cross-sectional forms, geometric parameters, material strength, boundary constraint conditions, and impact energy, which can effectively reflect the dynamic characteristics of CFST columns under impact loads. It is worth noting that this study disregards the structural form of filled materials in CFST columns, such as steel skeleton fillers. This is because fillers exhibit diverse types and significantly differ from non-filled CFST columns.
2.2. Features Selection
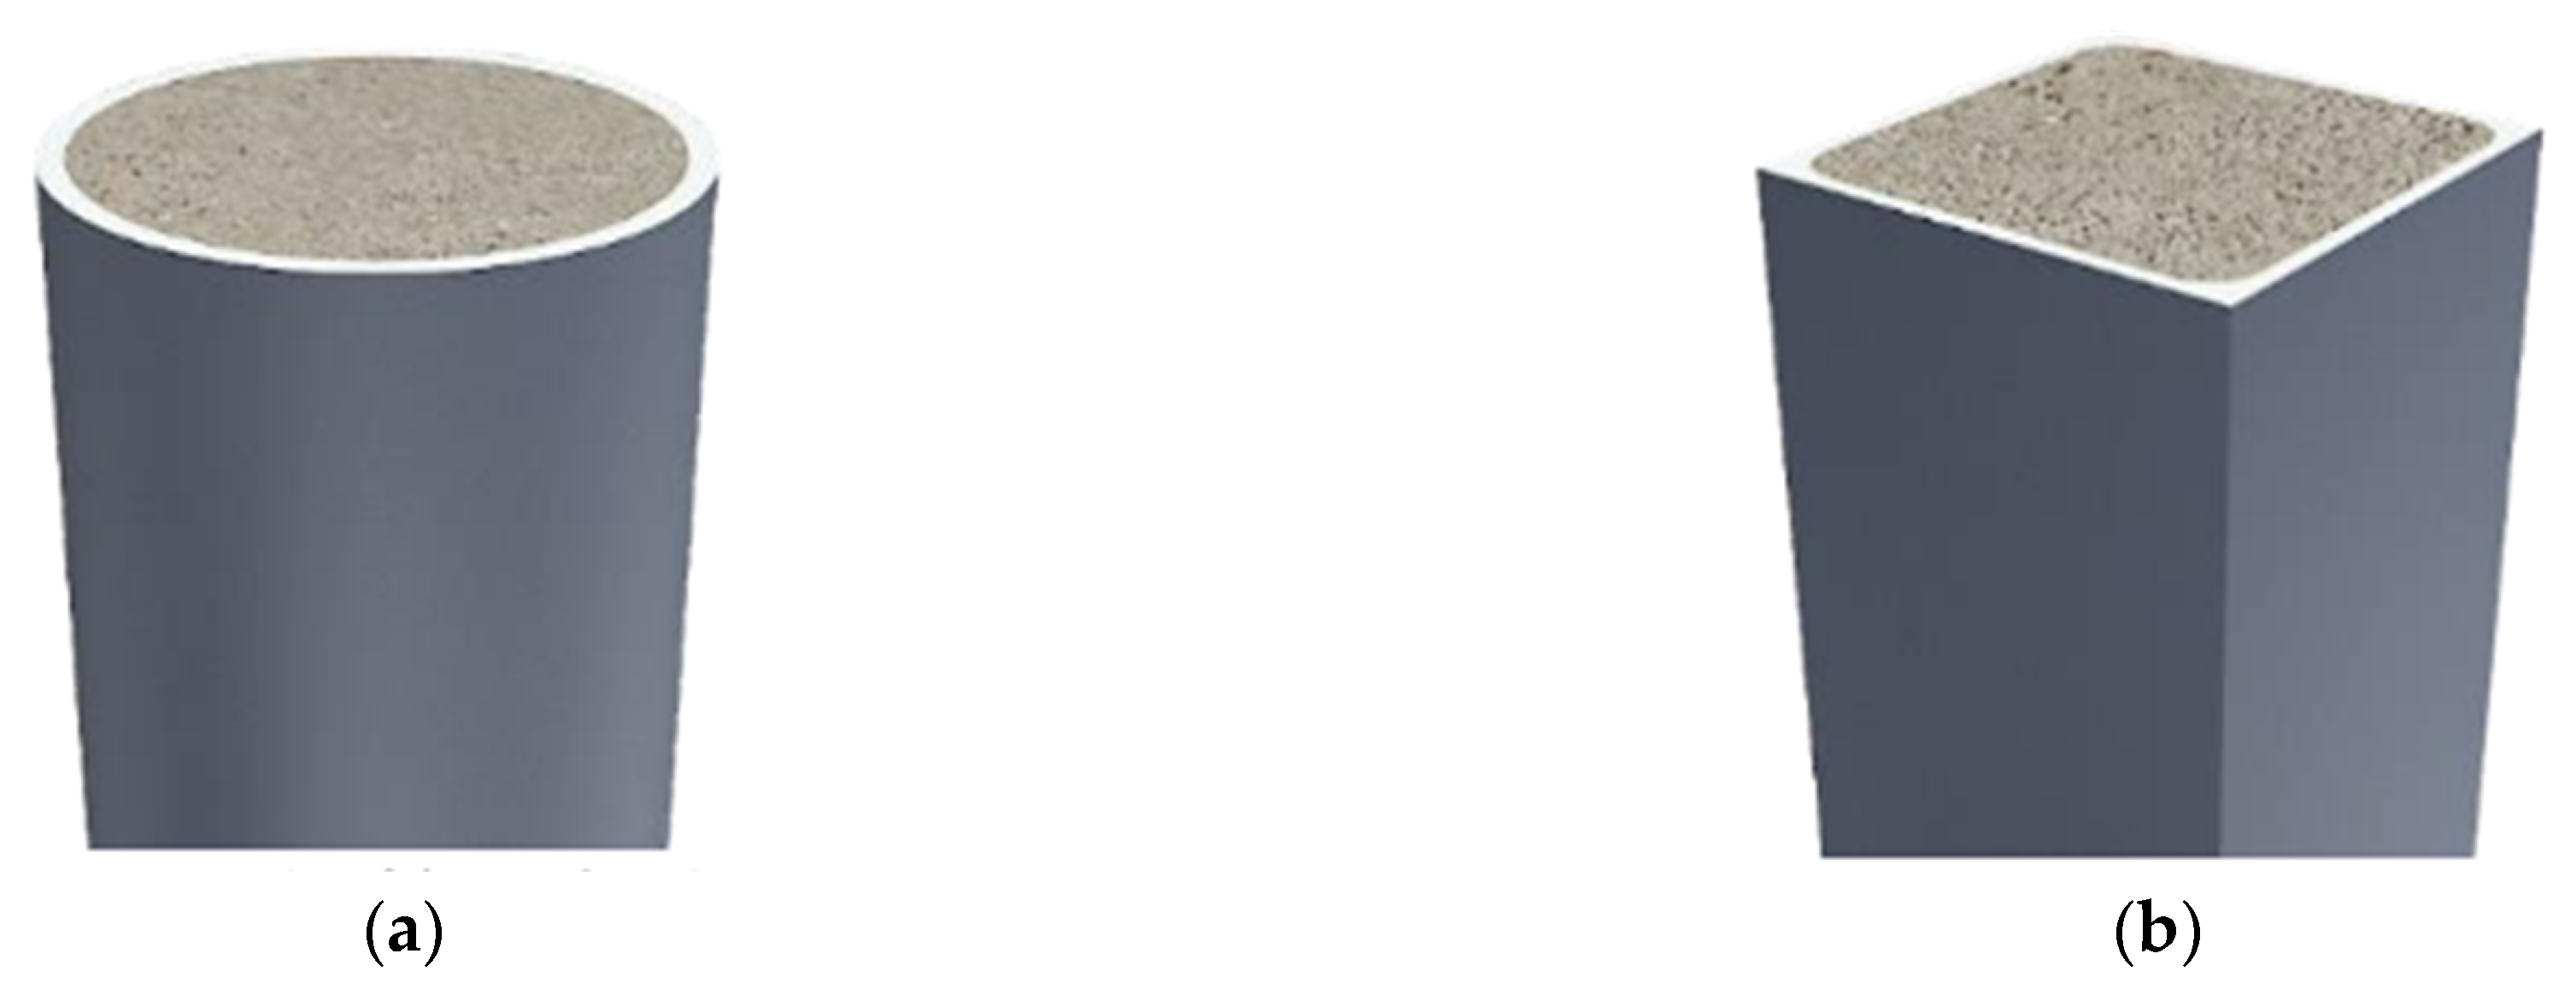
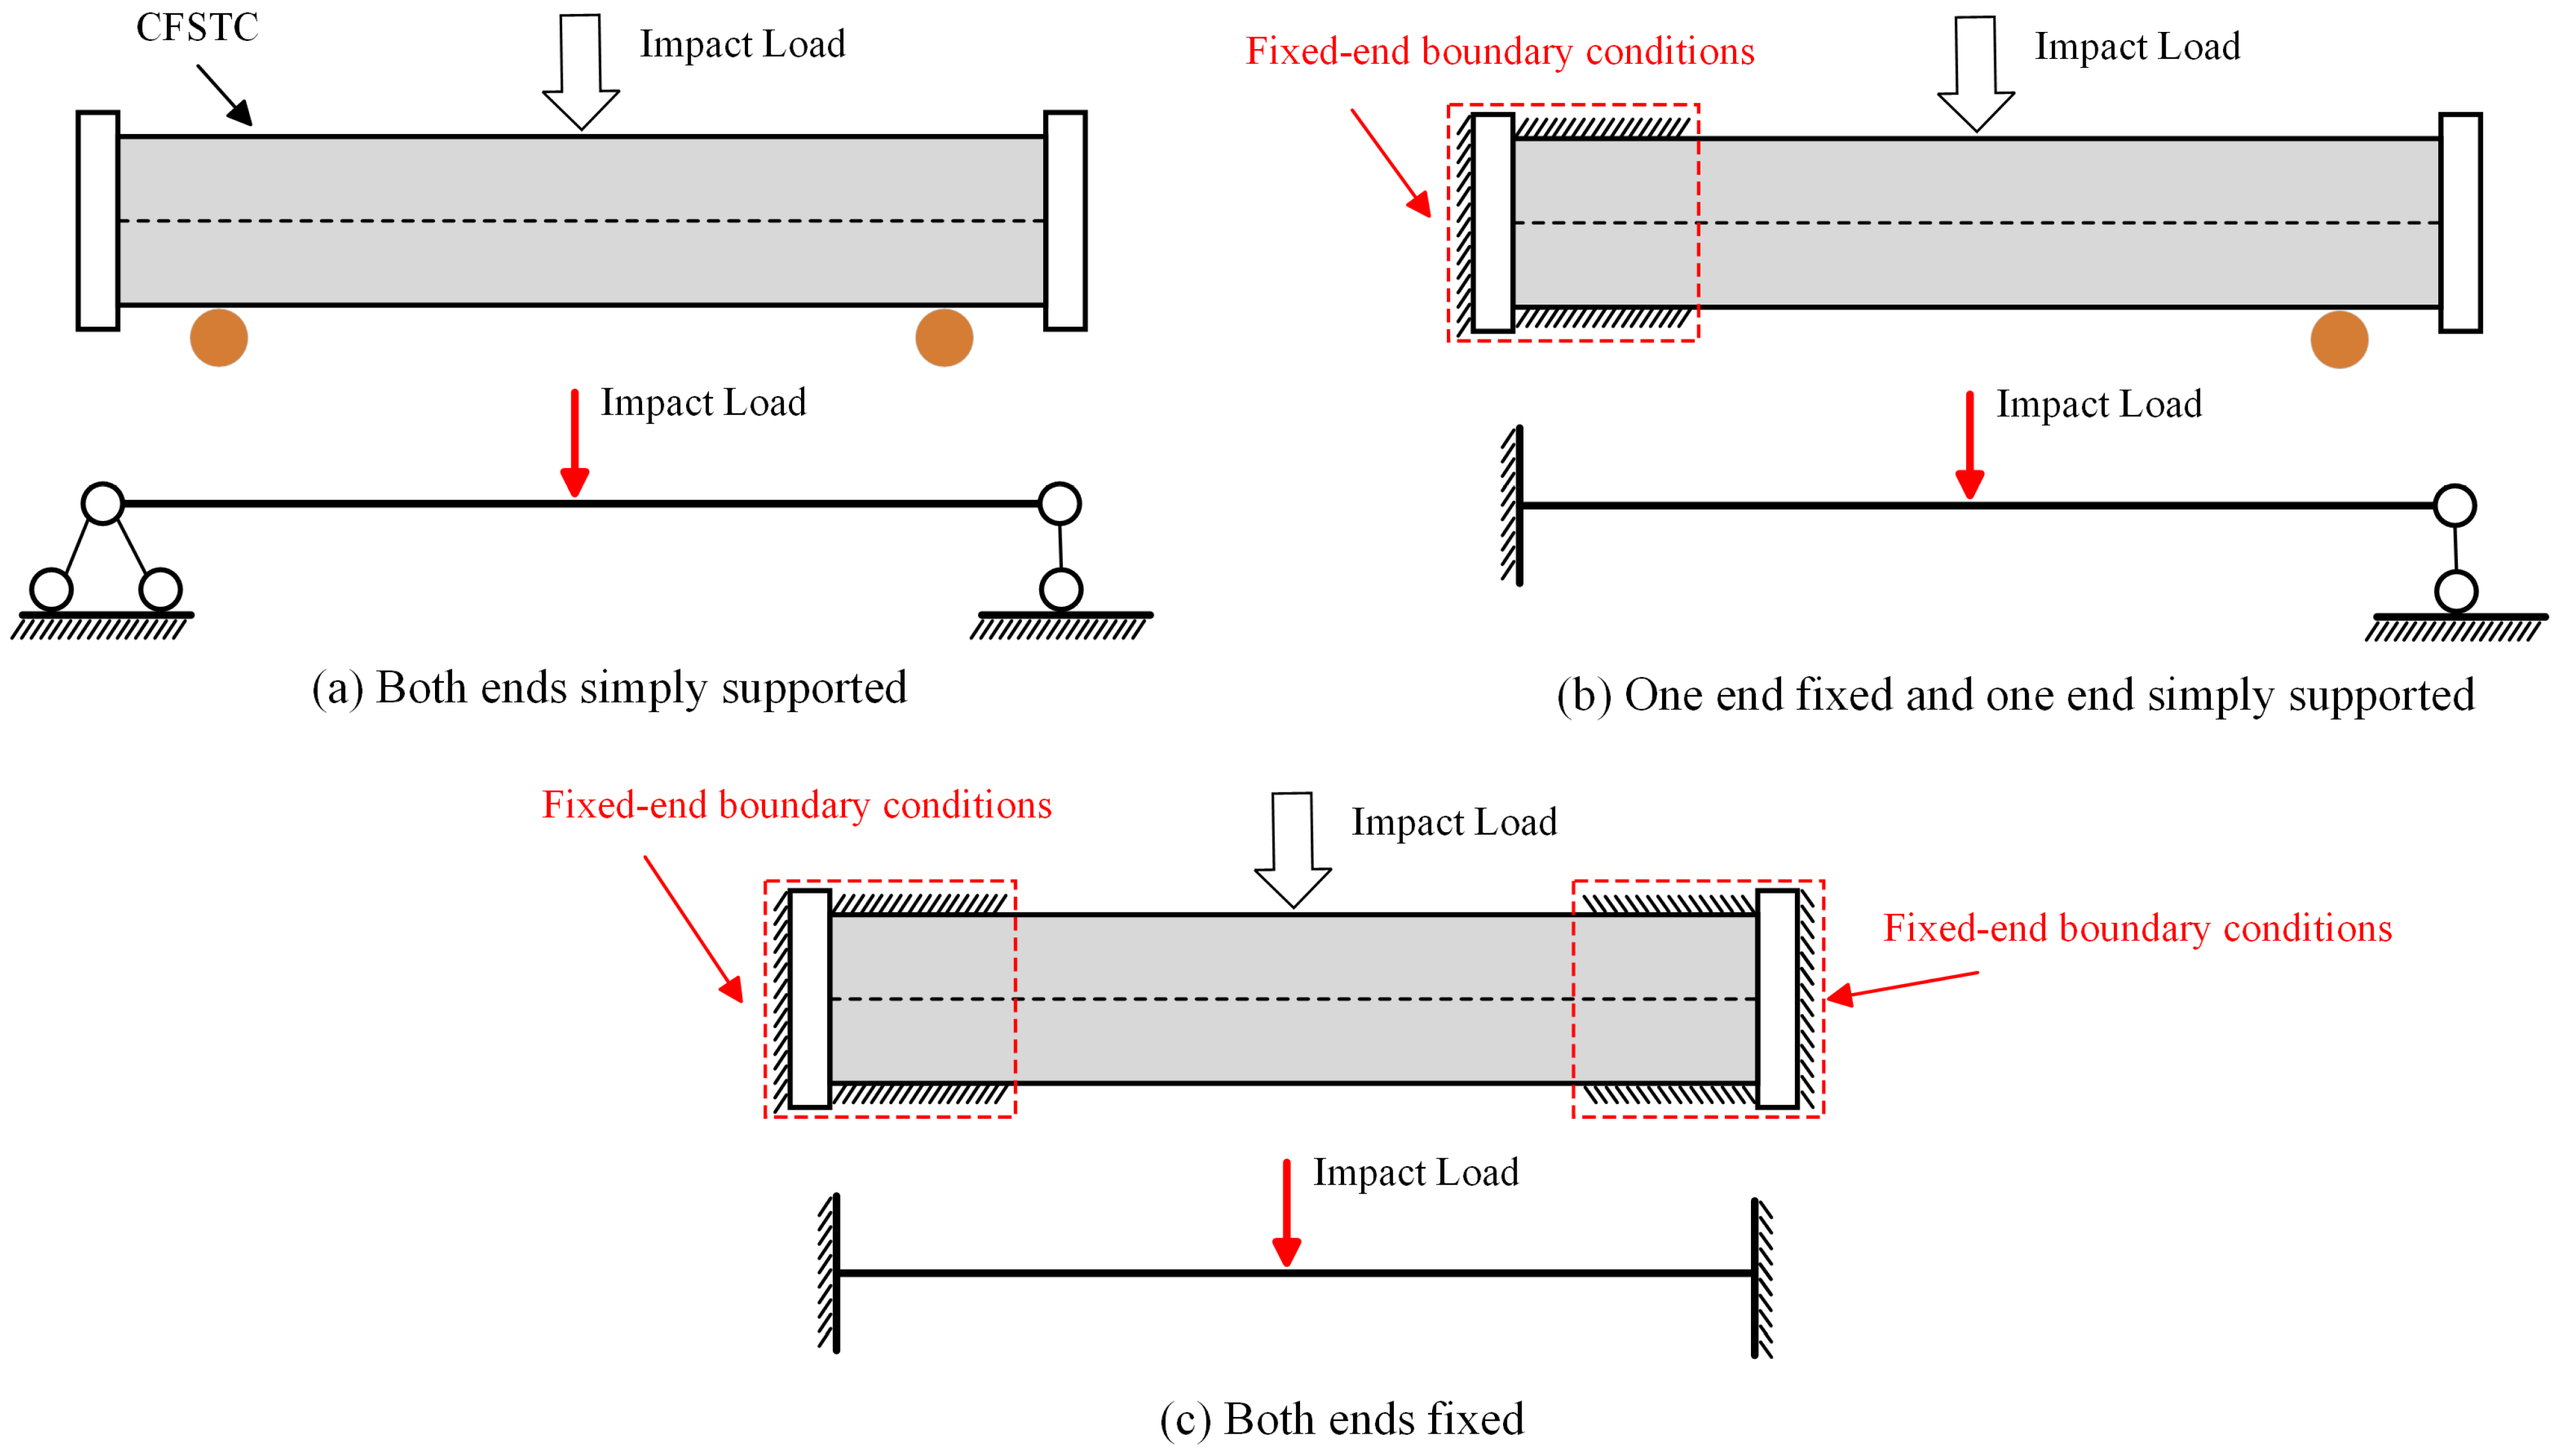
After being subjected to impact loads, CFST columns do not completely lose their load-bearing capacity and do not collapse immediately. However, impact loads can significantly change the mechanical properties of CFST columns, and the magnitude of the remaining load-bearing capacity will affect the seismic performance and safety of the structure. Appropriate input features need to be selected to establish a predictive model for the remaining load-bearing capacity of CFST columns after impact loading. Previous studies have shown that the remaining load-bearing capacity of damaged CFST columns is mainly affected by factors such as cross-sectional form, geometric parameters, material properties, boundary constraints, impact energy, and impact location [12,13,27,28]. Experimental research results indicate that the remaining load-bearing capacity of CFST columns under lateral impact loads is negatively correlated with impact energy, and positively correlated with core concrete strength and impact location, with the impact location having the most significant influence. In addition, specimens with higher impact energy, impact location closer to the end, and higher concrete strength experience greater initial stiffness and more severe deterioration in ductility after being subjected to impact loads, resulting in a more significant reduction in remaining load-bearing capacity, with these three factors having a cumulative effect. Therefore, this study selected 13 features as input for the ML model, covering geometric parameters, material parameters, boundary constraints, and impact parameters. Detailed definitions and descriptive statistics of each feature can be found in Table 1. The cross-sectional forms of CFST columns mainly include circular and square shapes, as shown in Figure 1 [29]. The boundary constraint conditions include both ends fixed, one end fixed and one end simply supported, and both ends simply supported, as shown in Figure 2. The target feature is the residual bearing capacity (F) of CFST columns after impact loading.
3. Methodology
3.1. Proposed Framework
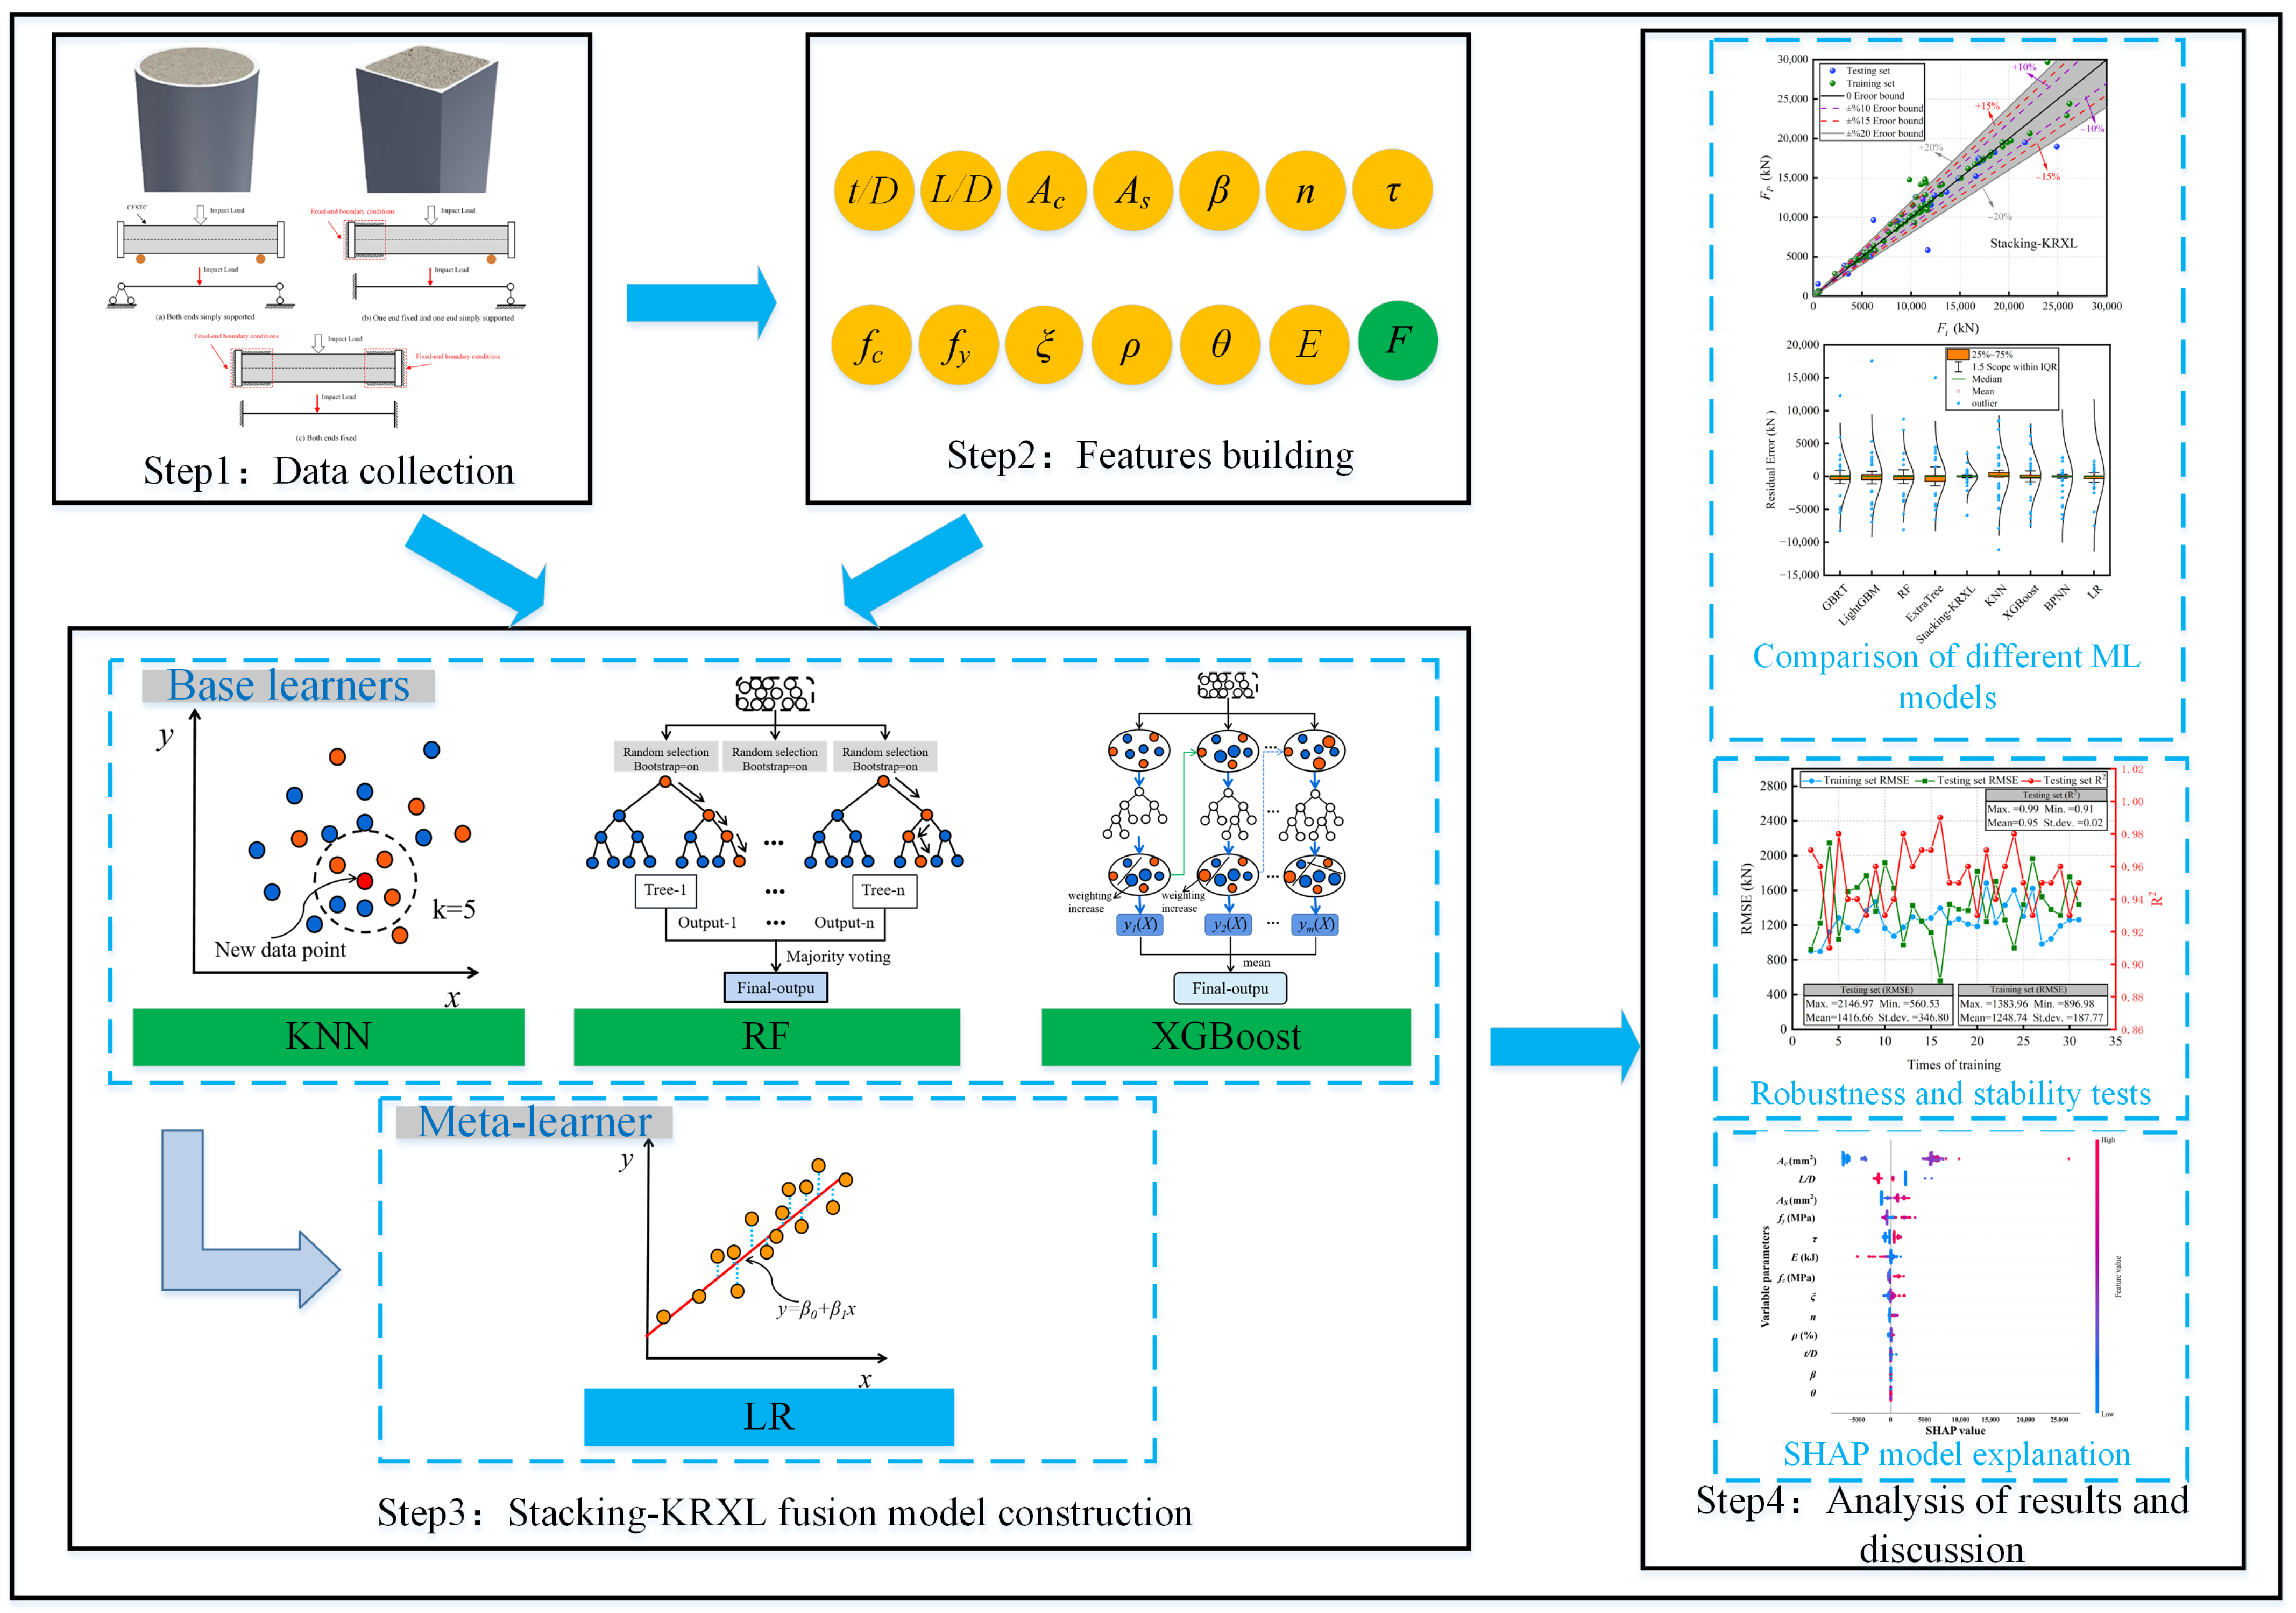
The overall implementation process for predicting and interpreting the residual bearing capacity of CFST columns under impact load using the Stacking-KRXL fusion model is shown in Figure 3. It consists of four stages: establishment of the CFST column residual bearing capacity database, feature selection, construction of the Stacking-KRXL fusion model, and analysis and discussion of the results. The specific process is as follows:
- (1)
- (2)
- In the second stage, the residual bearing capacity of CFST columns after impact load is influenced by factors such as cross-section shape, geometric parameters, material properties, boundary constraints, impact energy, and impact position [12,13,27,28]. Therefore, this study selected 13 input features, including geometric parameters (t/D, L/D, Ac, As, β), material parameters (n, fc, fy, ξ, ρ), boundary constraints (θ), and impact parameters (E, τ), as well as the output feature, residual bearing capacity (F).
- (3)
- The Stacking-KRXL fusion model was built with KNN, RF, and XGBoost as the base learners, and LR as the meta-learner.
- (4)
- The predictive performance of the Stacking-KRXL fusion model was compared with that of traditional ML models, Bagging ensemble learning, and Boosting ensemble learning models, and the robustness and stability of the model were tested. The SHAP method was used to provide global and local explanations for the model.
3.2. Overview of Machine Learning Models
3.2.1. Linear Regression
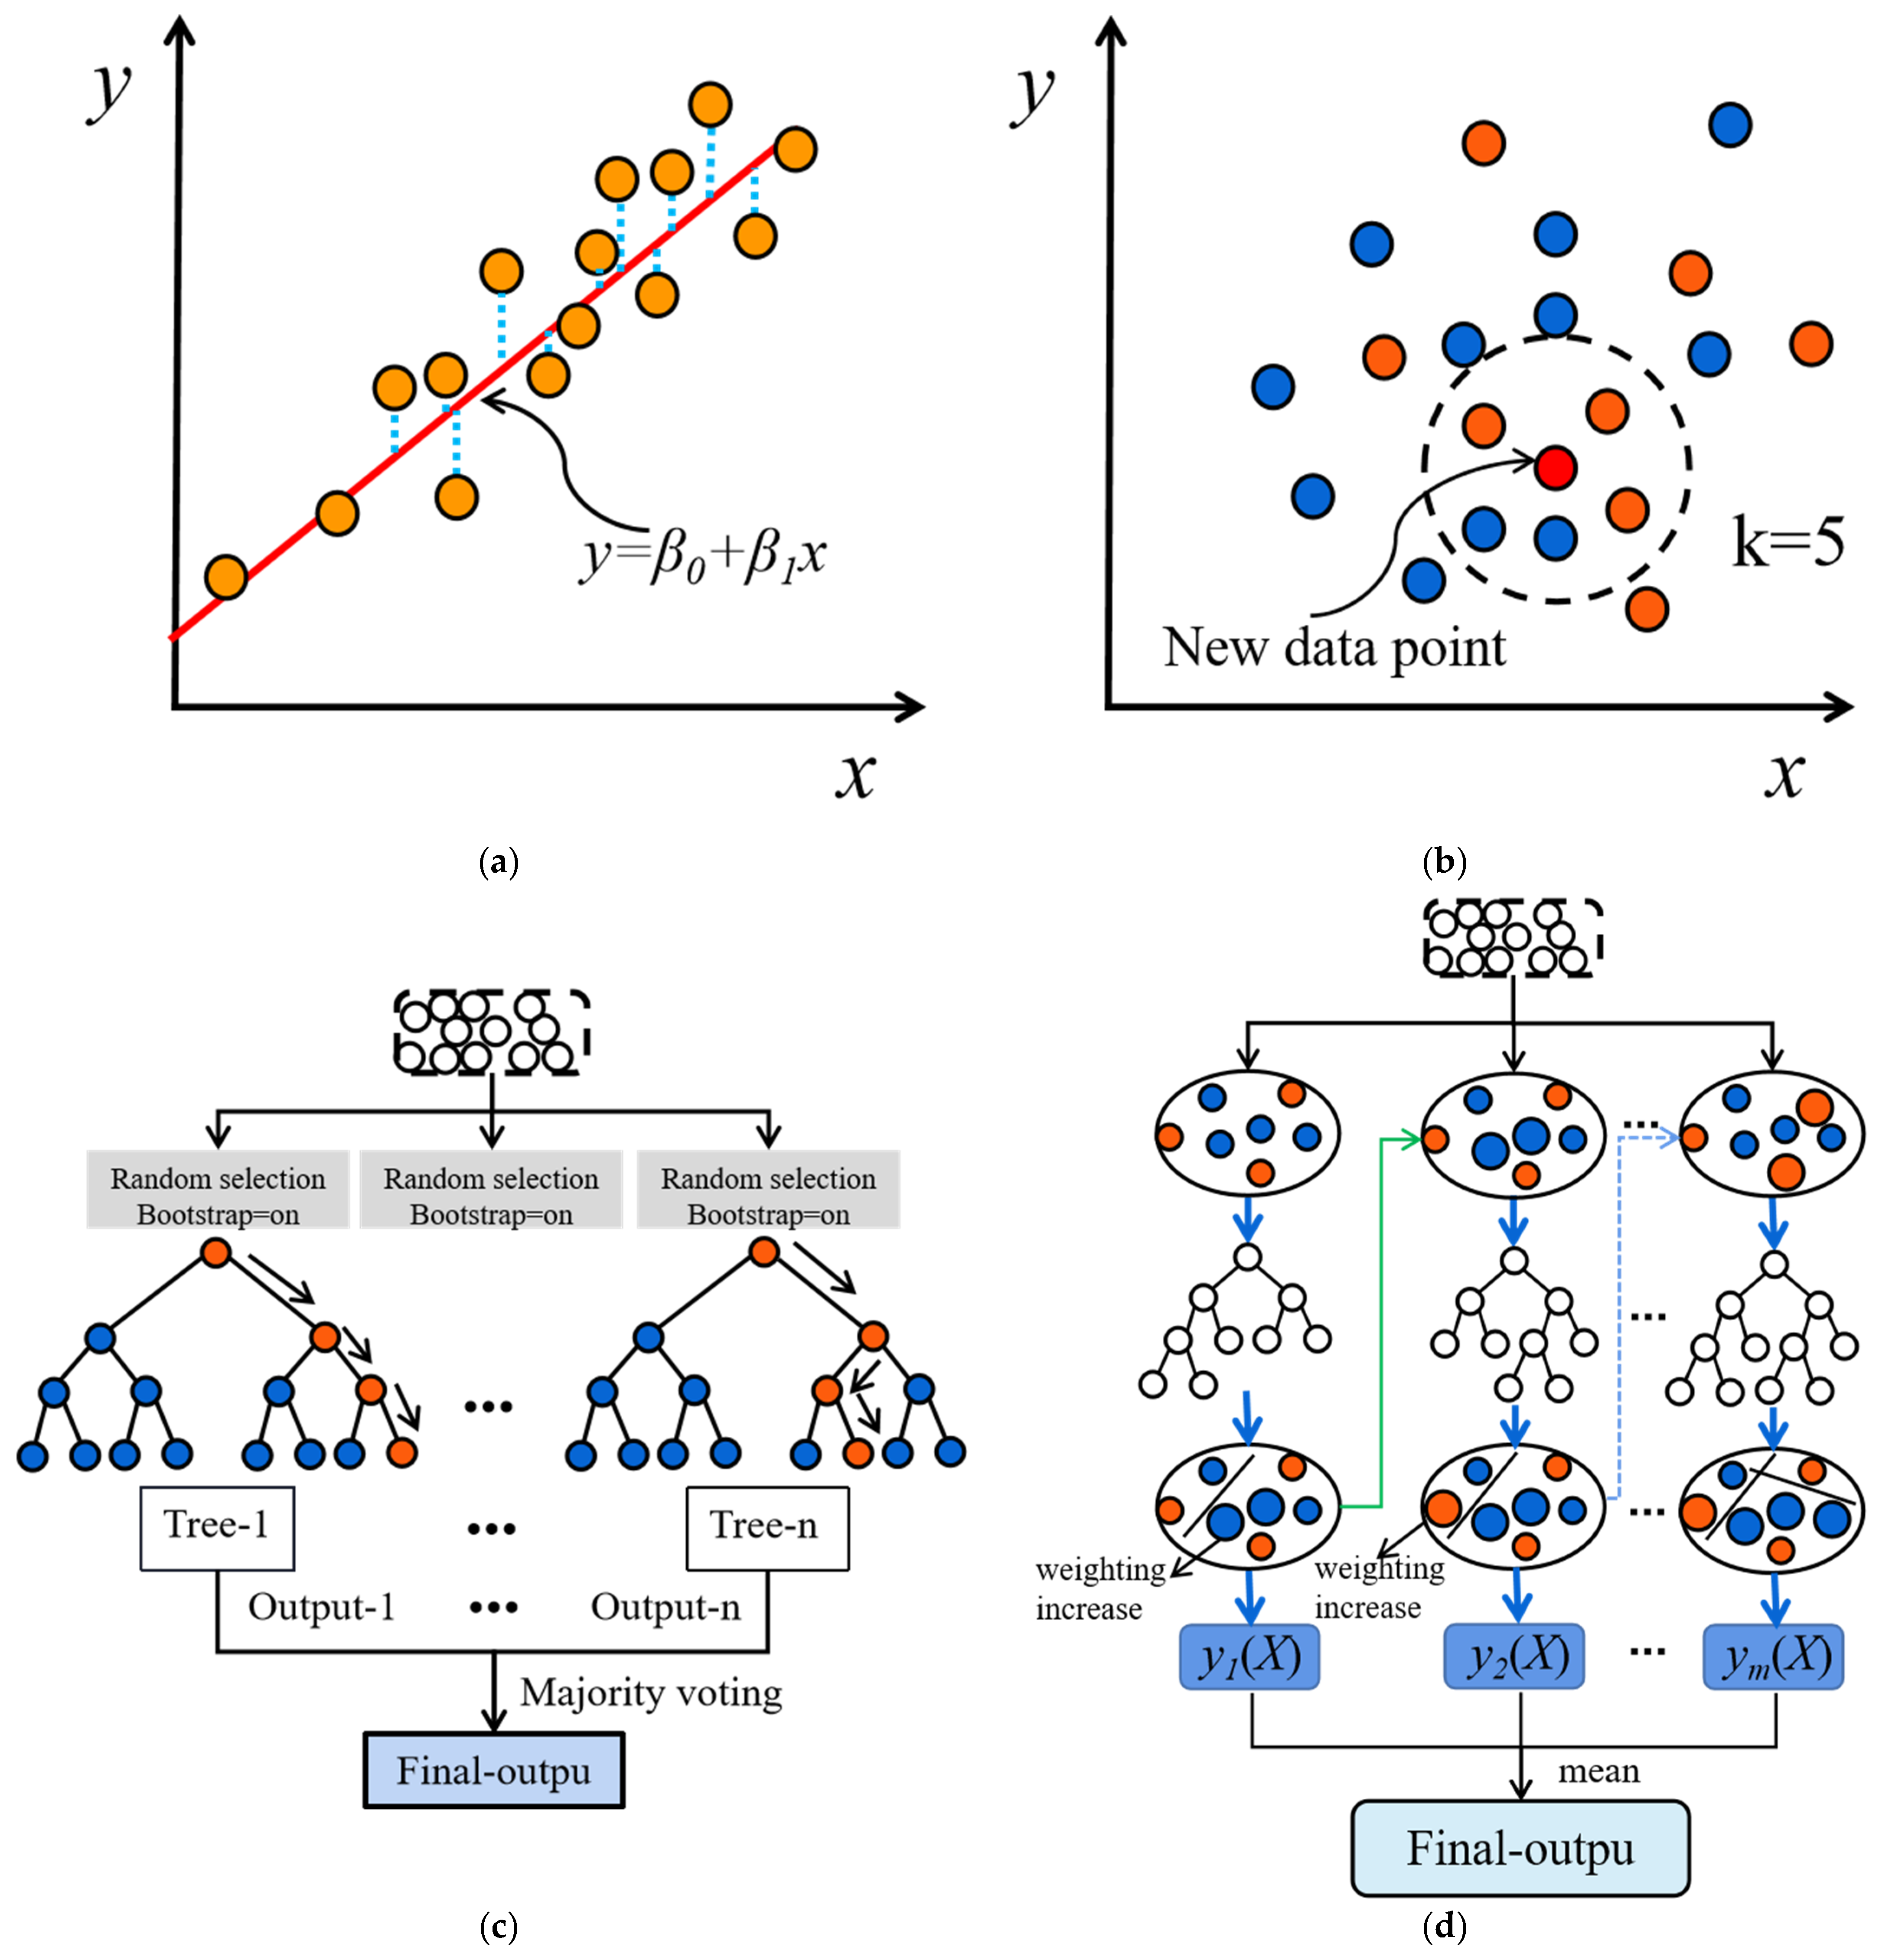
Linear regression (LR) is a common ML model used to demonstrate the linear relationship between a predictive target and multiple independent variables. Figure 4a illustrates the principle of LR. Due to its straightforward linear relationship, LR is widely applied in regression tasks and is relatively easy to interpret in terms of its parameter explanations [30]. The calculation formula for LR is as follows:
where P represents the predicted result, Xi (I = 1, 2, …, n) represents the independent variables, and βi represents the coefficients of the logistic regression.
3.2.2. K-Nearest Neighbors
The basic idea of the K-nearest neighbors (KNN) algorithm is to find the K-nearest samples in a given training set based on their distances to the target sample, and then classify the target sample based on the majority class of those K samples [31]. Figure 4b illustrates the working principle of this algorithm. KNN can be used for both classification and regression tasks, with the main difference lying in the decision criterion. In general, the decision rules of the KNN model can be classified into two types: Majority Voting and Weighted Voting. Majority Voting selects the class that appears most frequently among the K nearest neighbors as the predicted class for the sample, which is applicable to classification problems. On the other hand, Weighted Voting calculates the weighted sum of distances to the neighboring samples and makes decisions based on the weights. The closer neighbors have higher weights, indicating a greater influence on the prediction. Weighted Voting is suitable for regression problems, and the weights can be calculated using methods such as reciprocal distance and Gaussian kernel function. In regression tasks, the calculation of distance plays a vital role as it reflects the similarity between samples in the feature space. Commonly used distance calculation formulas include the Euclidean distance, defined as
and the Manhattan distance, defined as
3.2.3. Random Forest
The Random Forest (RF) algorithm is an improved decision tree algorithm [32]. Its core idea is to construct multiple random training datasets by using the bootstrap method to randomly sample the original training data with replacement. Each random training dataset independently builds a decision tree, which partitions the dataset based on attribute splits to minimize prediction errors at each leaf node. To increase the diversity between decision trees, a mechanism of random feature selection is introduced. During each node split, a random subset of features is considered from all available features. This randomness enhances the robustness and generalization ability of the model. When predictions are needed, each decision tree in the Random Forest independently predicts the samples. For classification problems, the final prediction result is determined by majority voting. For regression problems, the final prediction value is obtained by averaging the predictions of each decision tree. Figure 4c illustrates the principle of the Random Forest. During the training phase, the decision trees use the prediction error metric Gσ as the evaluation criterion. When Gσ is small, it indicates that using a specific attribute for data splitting can reduce the dissimilarity between subsets, thereby making it a good choice as a node attribute.
For a sample set S, the calculation formula for the total variance σ(S) is:
where μs is the average of the predicted results in the sample set S, and yi is the predicted result of the ith sample. Based on the ith attribute value of attribute A, partition the dataset S into S1 and S2. The calculation formula for Gσ is:
The optimal binary split for attribute A is:
For a sample set S, calculate the optimal binary split for all attributes and select the one with the minimum value as the split scheme for the decision tree at this node, where Z is the set of all attributes. The calculation formula for the minimum value is:
3.2.4. XGBoost
XGBoost is a distributed gradient-boosting library that optimizes the gradient-boosting decision tree (GBDT). Its fundamental idea is to combine multiple weak learners to build a powerful model. These weak learners are designed to collaborate with each other, with each learner focusing on improving the errors of the previous learner. During the training process, XGBoost iteratively optimizes the model’s performance. In each iteration, it adjusts the weights of the subsequent models based on the errors of the previous model, aiming to reduce the overall error. As a result, the model becomes increasingly accurate after each iteration. The model principles of XGBoost are illustrated in Figure 4d. It starts with the combination of weak learners and then continuously refines them through iterative optimization to achieve a more accurate and powerful model [33,34].
3.3. CFST Columns Residual Bearing Capacity Prediction Model Based on Stacking
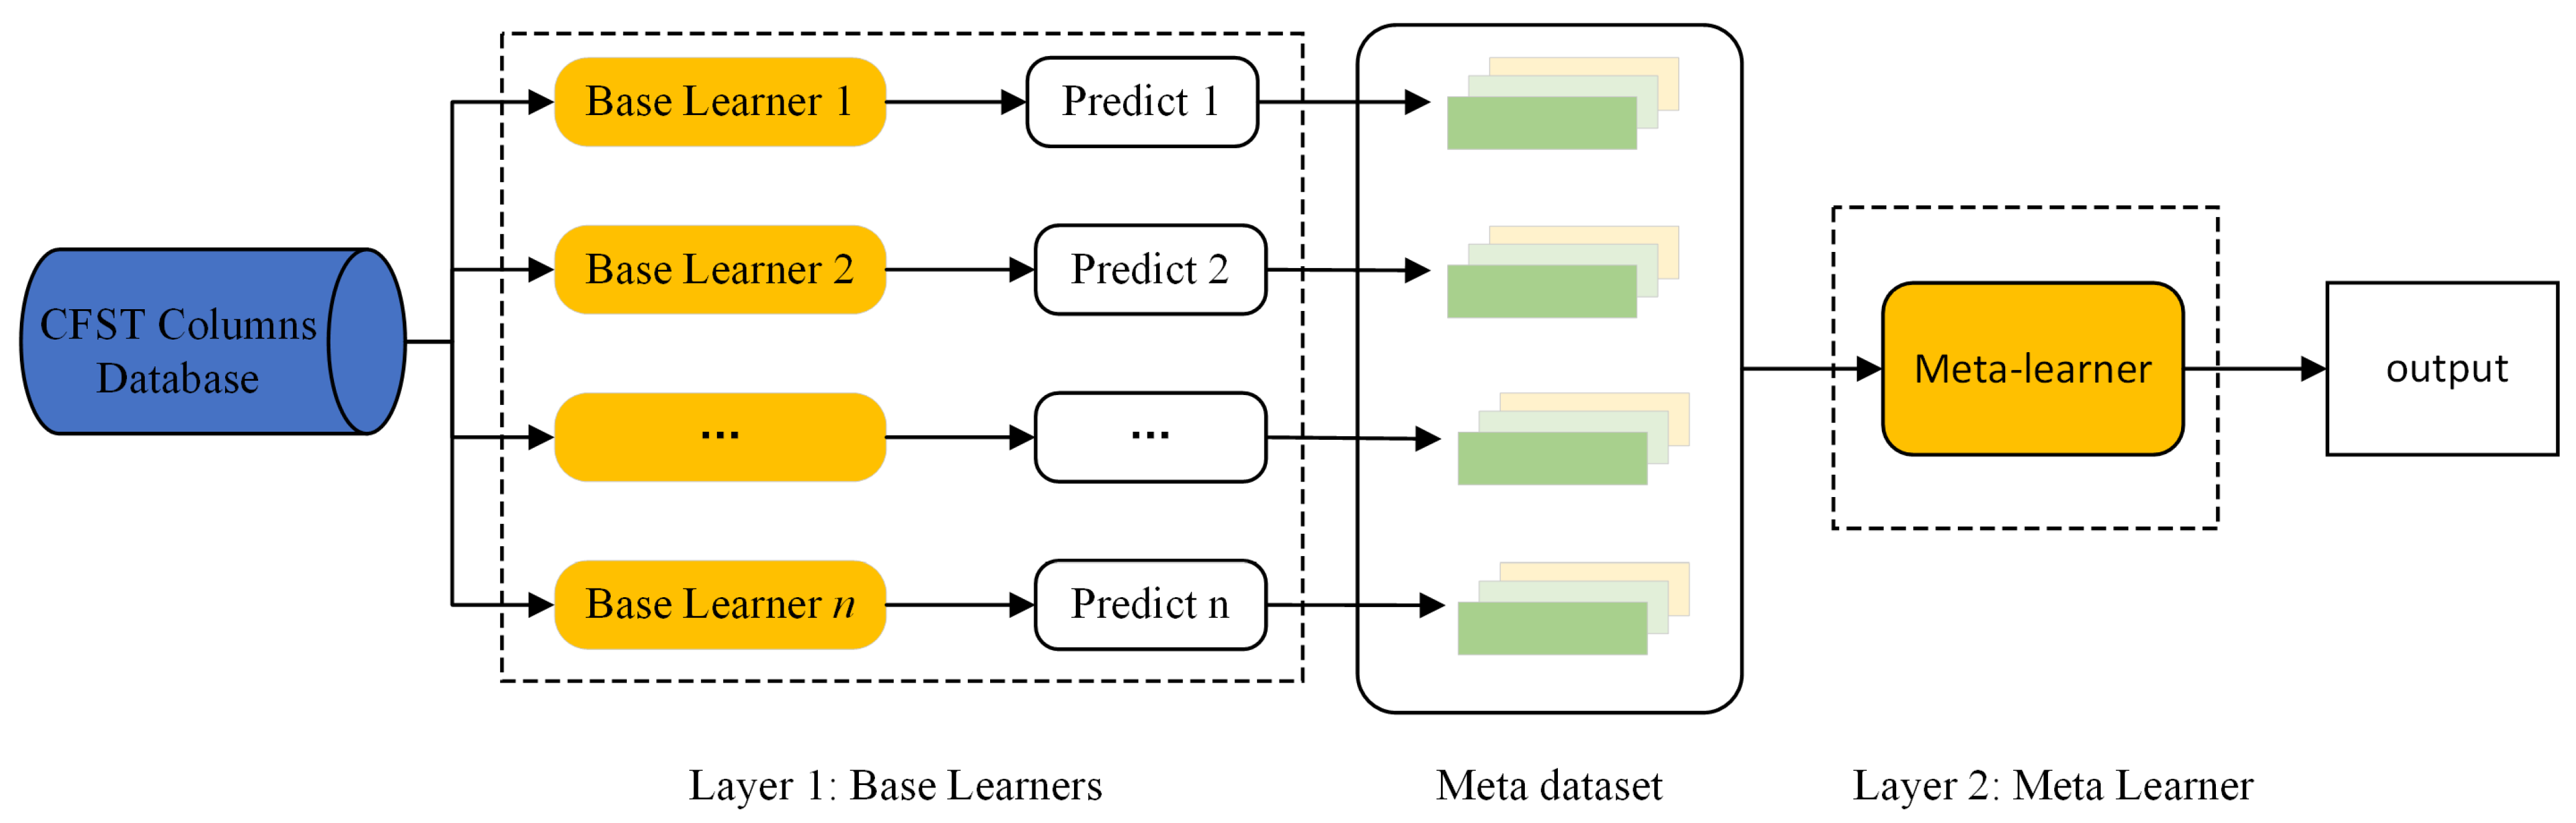
Stacking ensemble learning aims to combine multiple weak supervised models to obtain a strong supervised model, fully leveraging the strengths of individual ML models to improve the overall prediction accuracy [35]. The stacking strategy can be based on either homogeneous or heterogeneous learners. Different ML models are learned in batches, and meta-learning is used for model fusion. The common stacking ensemble framework consists of two layers, with the base learners in the first layer and the meta-learner in the second layer. The principle of the stacking algorithm is illustrated in Figure 5.
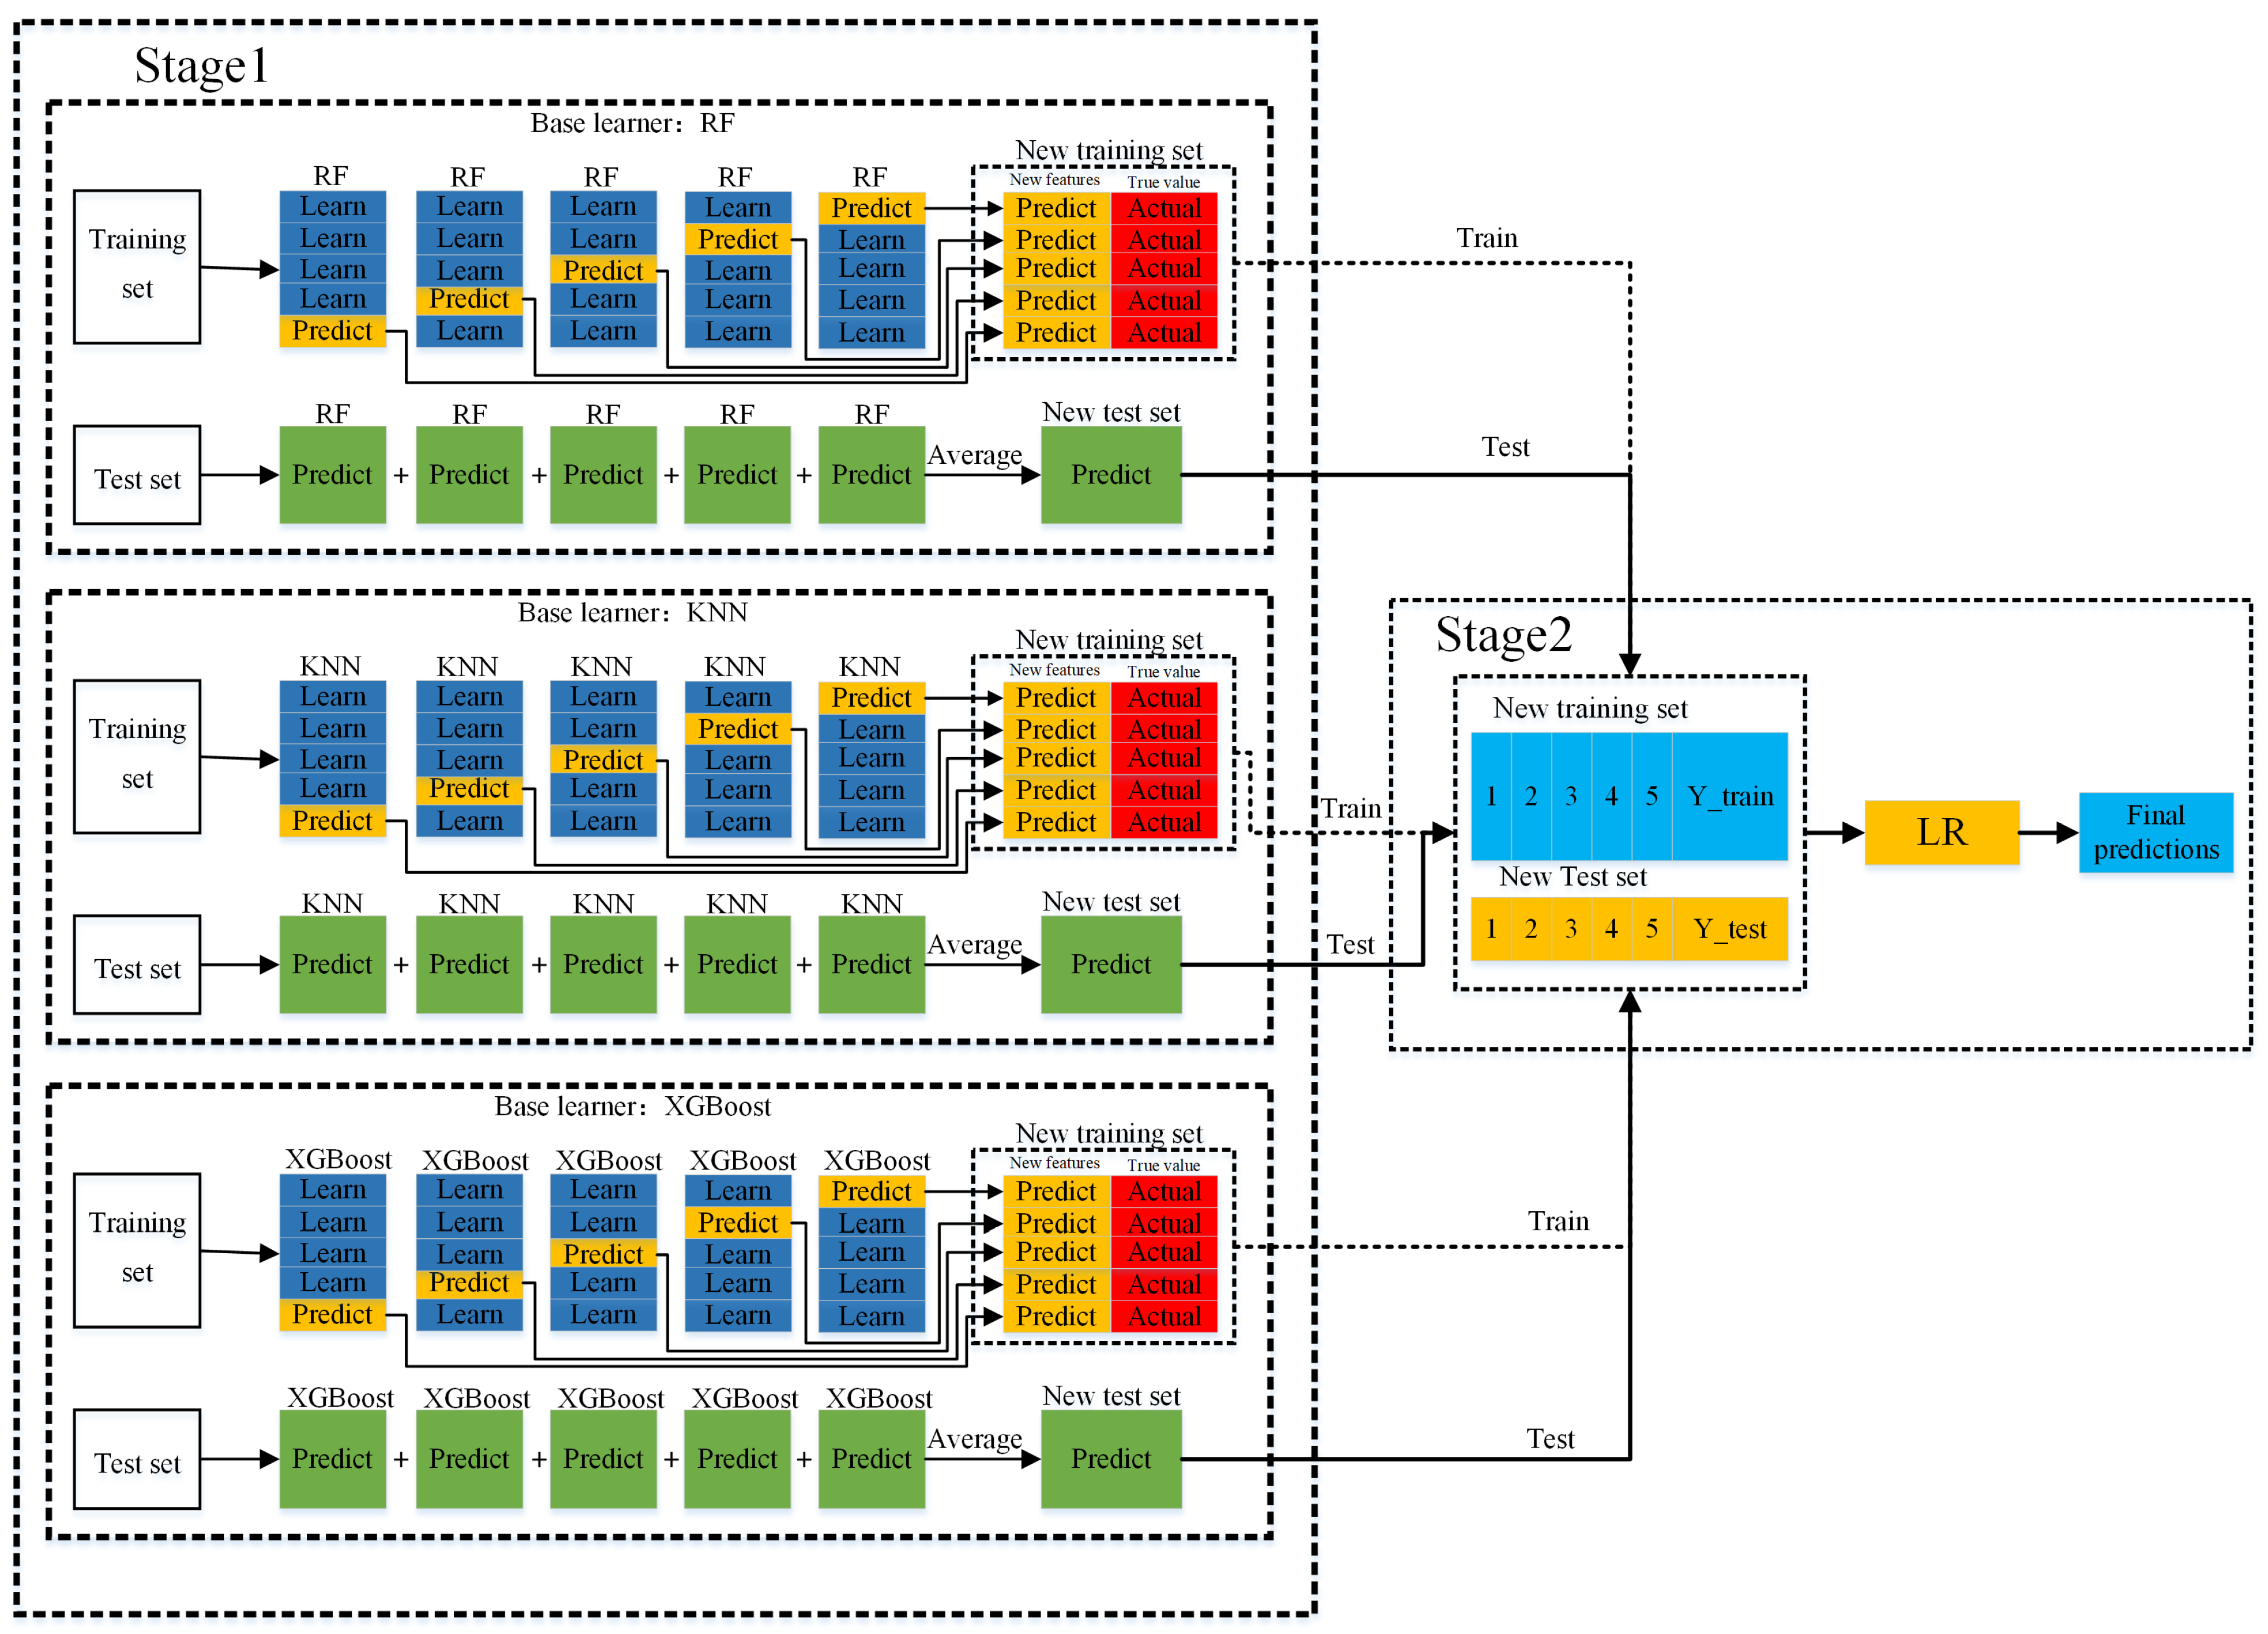
The base learning models in stacking-based ensemble learning should satisfy both diversity and prediction accuracy. Each learner should not only have good predictive accuracy but also exhibit certain differences, enabling them to complement each other and achieve better prediction results [36,37]. In this study, the predictive performance of three categories of single models, including traditional machine learning models (BPNN, LR, KNN), Boosting ensemble learning (LightGBM, GBRT, XGBoost), and Bagging ensemble learning (ExtraTree, RF), were compared, as shown in Section 4.1. It can be observed that the KNN model in traditional machine learning models, the XGBoost model in Boosting ensemble learning, and the RF model in Bagging ensemble learning demonstrated the best predictive performance within their respective categories. Therefore, these three models, namely KNN, XGBoost, and RF, which performed the best within their respective categories, were selected as the base learners, ensuring both diversity and good predictive performance. Specifically, KNN performs well in predicting nonlinear small samples, while RF and XGBoost are ensemble learning algorithms based on the bagging and boosting ideas, respectively, using decision trees as a foundation. They have excellent generalization ability and are less prone to overfitting. As for the meta-learner, LR is chosen as it is a simple and stable model that can effectively improve prediction accuracy and avoid the risk of overfitting. Finally, the KNN, RF, XGBoost, and LR fusion model (Stacking-KRXL) based on the Stacking framework was established. The framework of the damaged CFST column residual bearing capacity prediction model based on stacking ensemble learning is shown in Figure 6. The specific steps are as follows:
- (1)
- Divide the 221 data in the CFST columns database randomly into training and testing sets with a ratio of 7:3, respectively.
- (2)
- Training the base learners. The KNN, RF, and XGBoost base learners are trained using 5-fold cross-validation. Taking the KNN base learner as an example, first, the original training dataset is divided into five equal-sized subsets: A, B, C, D, E. In the first round, A is used as the test set, and B, C, D, E are used as the training sets. The KNN base learner is trained using the data from the training sets B, C, D, E, and the trained KNN model is used to make predictions for A. The same process is repeated with B, C, D, E as the test set and the remaining four subsets as the training set. The predictions obtained from the 5-fold cross-validation are combined to obtain the training dataset for the second layer of the meta-learner. The RF and XGBoost base learners follow the same process. The final averages of RSquared, MAE, and RMSE for the 5-fold cross-validation model are 0.97, 466.23, and 1205.22, respectively.
- (3)
- Training the meta-learner. Generate a new training dataset for the second-layer LR meta-learner by using the predictions from the first-layer base learners using CFST columns. These predictions serve as inputs for training the second-layer LR meta-learner. The final predictions from the second-layer LR meta-learner are used as the output values of the Stacking fusion model.
3.4. Model Evaluation Criteria
To comprehensively evaluate the predictive performance of ML models on the residual bearing capacity of CFST columns after impact loads, this study selected the Mean Absolute Error (MAE), Root Mean Squared Error (RMSE), and Coefficient of Determination (RSquared) as evaluation metrics for regression models. The specific expressions are as follows:
where n is the total number of samples, yi is the observed value of the ith sample, ŷi is the predicted value of the ith sample, and ȳ is the mean value of all observed values. These evaluation metrics provide quantitative measures of the accuracy and goodness of fit of the regression models, helping to assess their performance in predicting the residual bearing capacity of CFST columns accurately.
4. Analysis of Results and Discussion
4.1. Comparison of Predictive Performance of Various ML Models
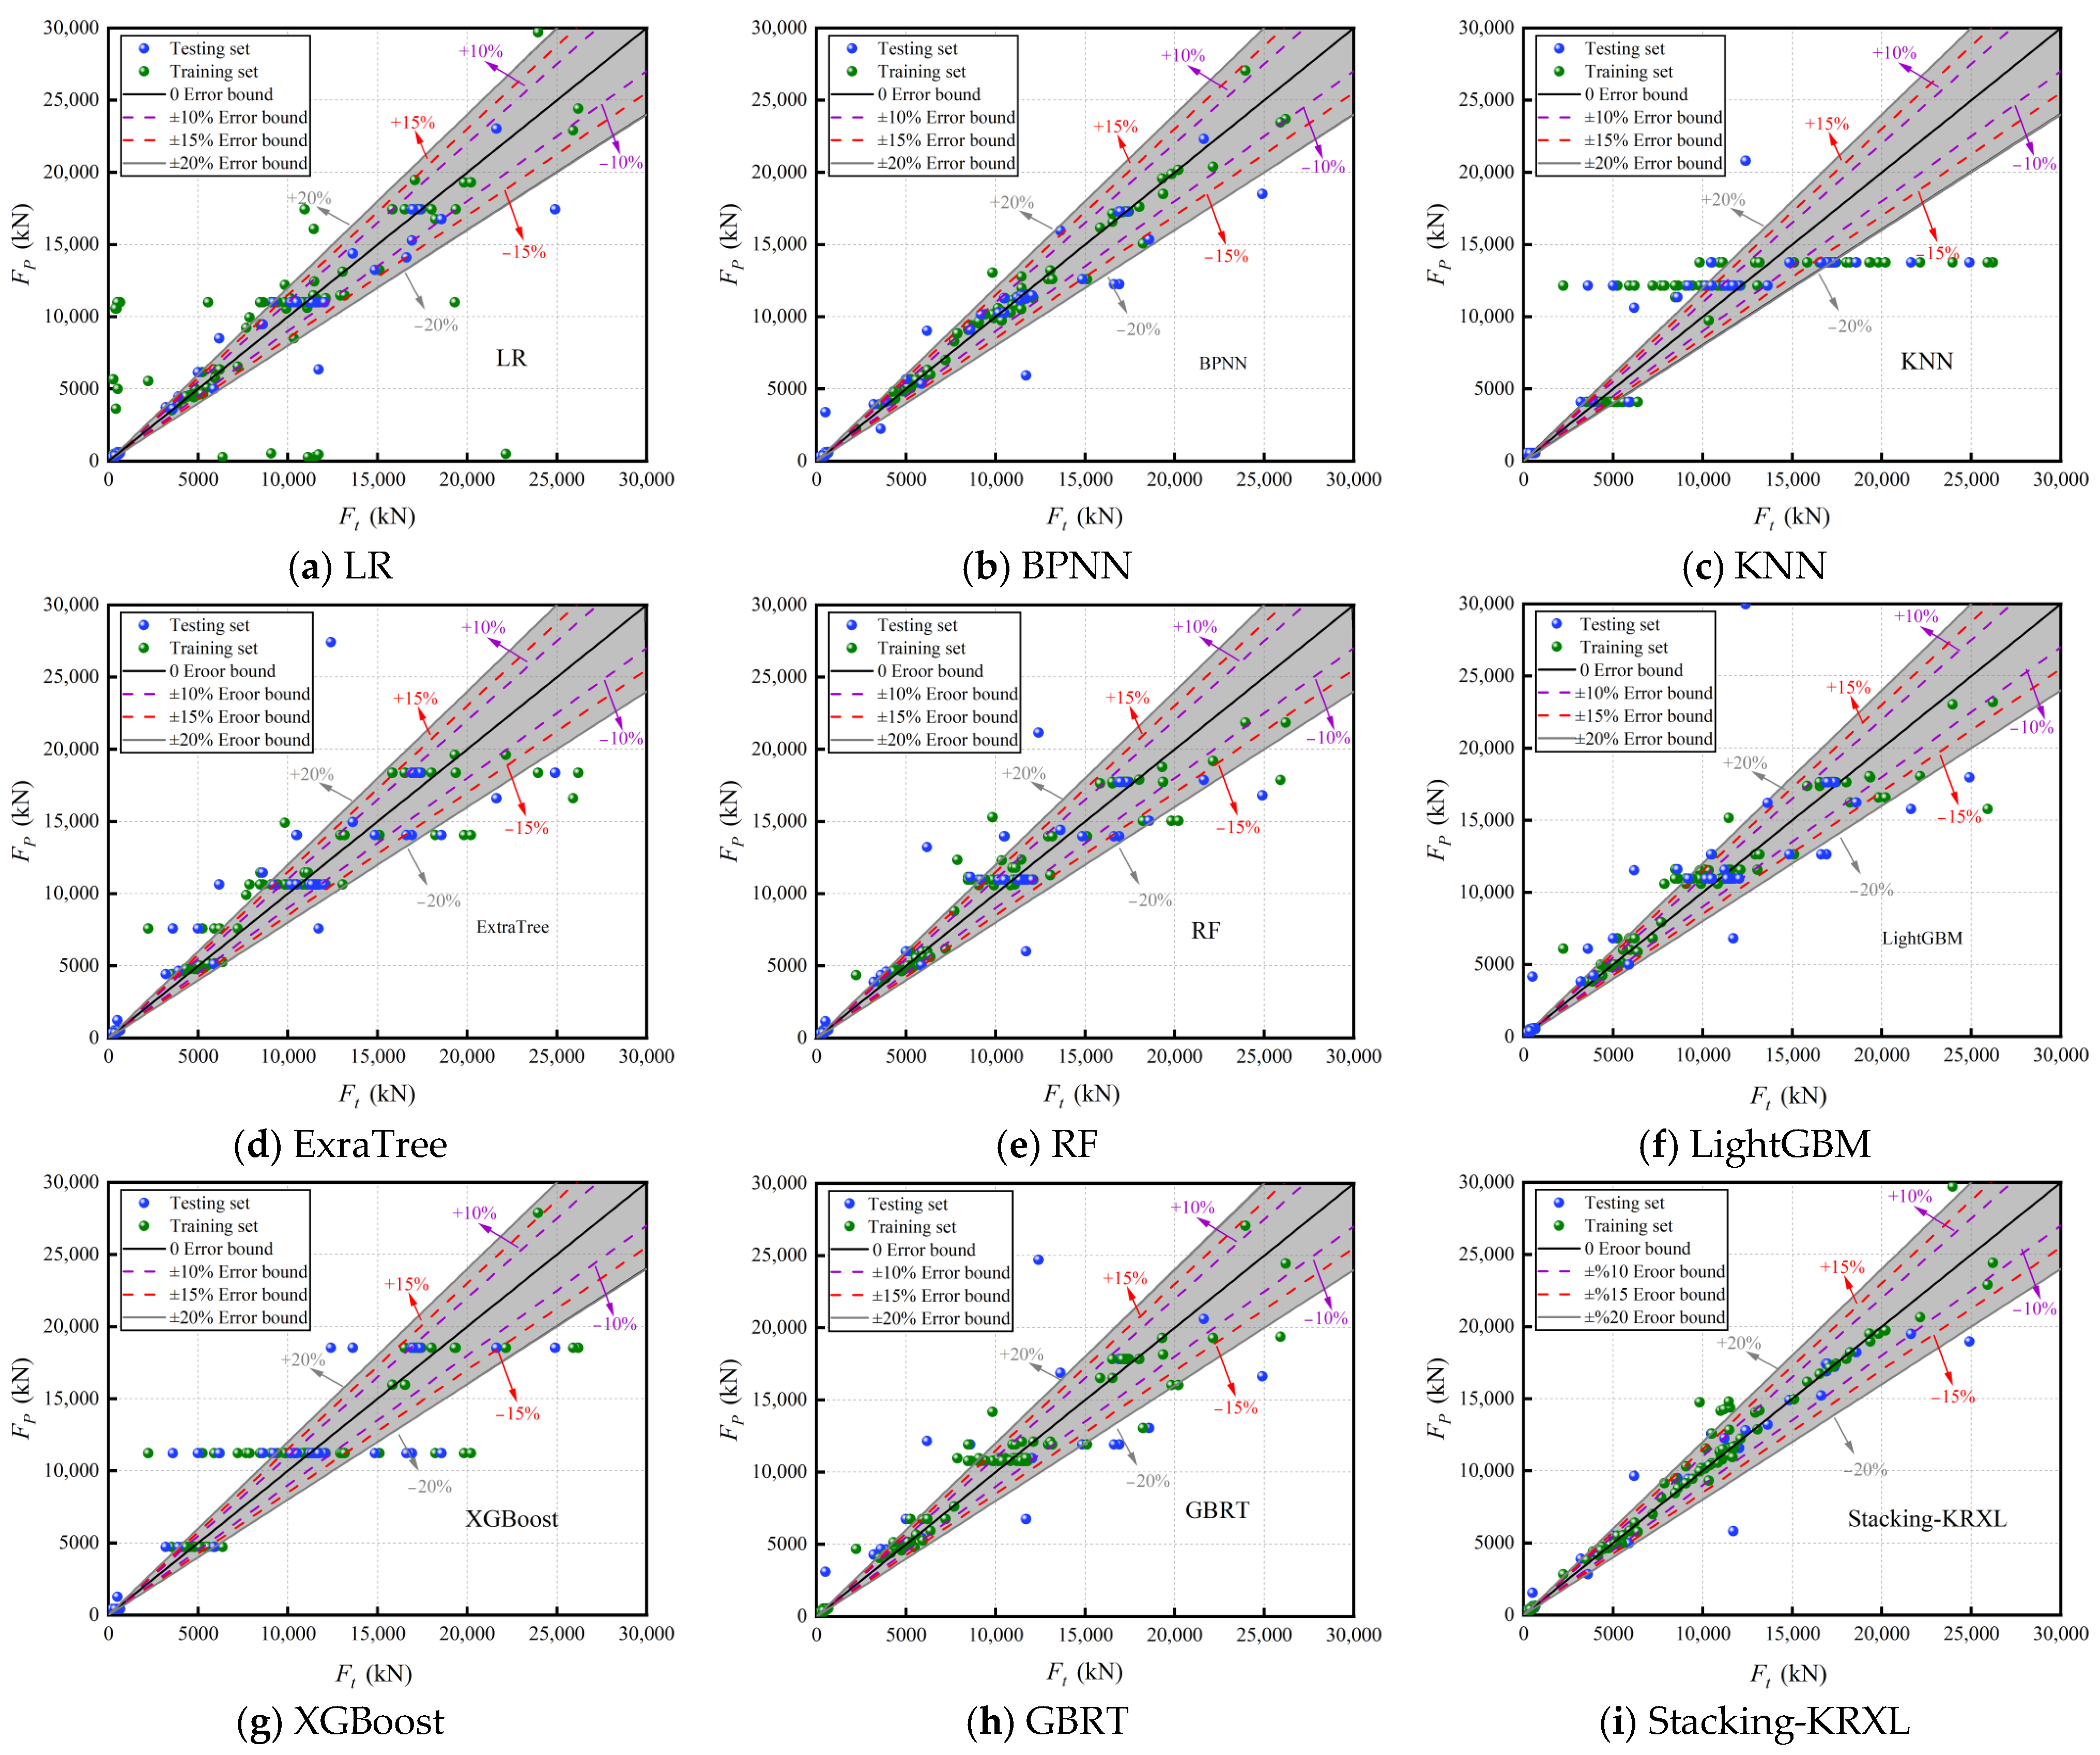
To evaluate the performance of the Stacking-KRXL fusion model in predicting the residual bearing capacity of CFST columns, this study compared it with traditional ML models (LR, BPNN, KNN), Boosting ensemble learning models (LightGBM, GBRT, XGBoost), and Bagging ensemble learning models (ExtraTree, RF). Please note that all models in this paper were developed using Python and open-source software packages such as sklearn, shap, xgboost, lightgbm, and mlxtend. The models were implemented with default parameter settings. Figure 7 shows the scatter distribution of the predicted values (Fp) and the actual values (Ft) of the residual bearing capacity of CFST columns by the nine ML models on the training and testing datasets. The black line in the middle of the scatter distribution represents the complete consistency between the predicted values (Fp) and the actual values (Ft) of the model, with zero error, and the error ranges of ±10%, ±15%, and ±20% are indicated. From Figure 7, it can be seen that among the traditional ML models, the LR model has a large prediction error for the CFST column bearing capacity below 15,000 kN, especially in the training set. Many scatter points are distributed outside the ±20% error range, further demonstrating the significant nonlinear relationship between the residual bearing capacity of CFST columns under impact load and various input features. The scatter points of the KNN model show a distinct layered distribution, and the prediction error is also large when the residual bearing capacity is large. The scatter distribution of the BPNN model is relatively concentrated, with most scatter points in the training set falling within the ±20% error range, but there are still many scatter points distributed outside the ±20% error range in the testing set, indicating the existence of a certain degree of overfitting. Compared with these three traditional ML models, the scatter distribution of the six ensemble learning models is more concentrated. Among them, the scatter distribution of the ExtraTree, XGBoost, GBRT, and LightGBM models is relatively scattered as a whole, and the scatter distribution of the RF model is relatively concentrated except for the scatter points near CFST column residual bearing capacity of 10,000 kN. The Stacking-KRXL fusion model proposed in this study has a relatively concentrated scatter distribution in both the training and testing sets, with most scatter points concentrated around zero error. Only for the scatter points near the CFST column residual bearing capacity of 12,000 kN in the training set, the scatter distribution is more scattered, indicating a small prediction error of the model. Compared with the other eight individual ML models, this model has higher prediction accuracy for the residual bearing capacity of CFST columns.
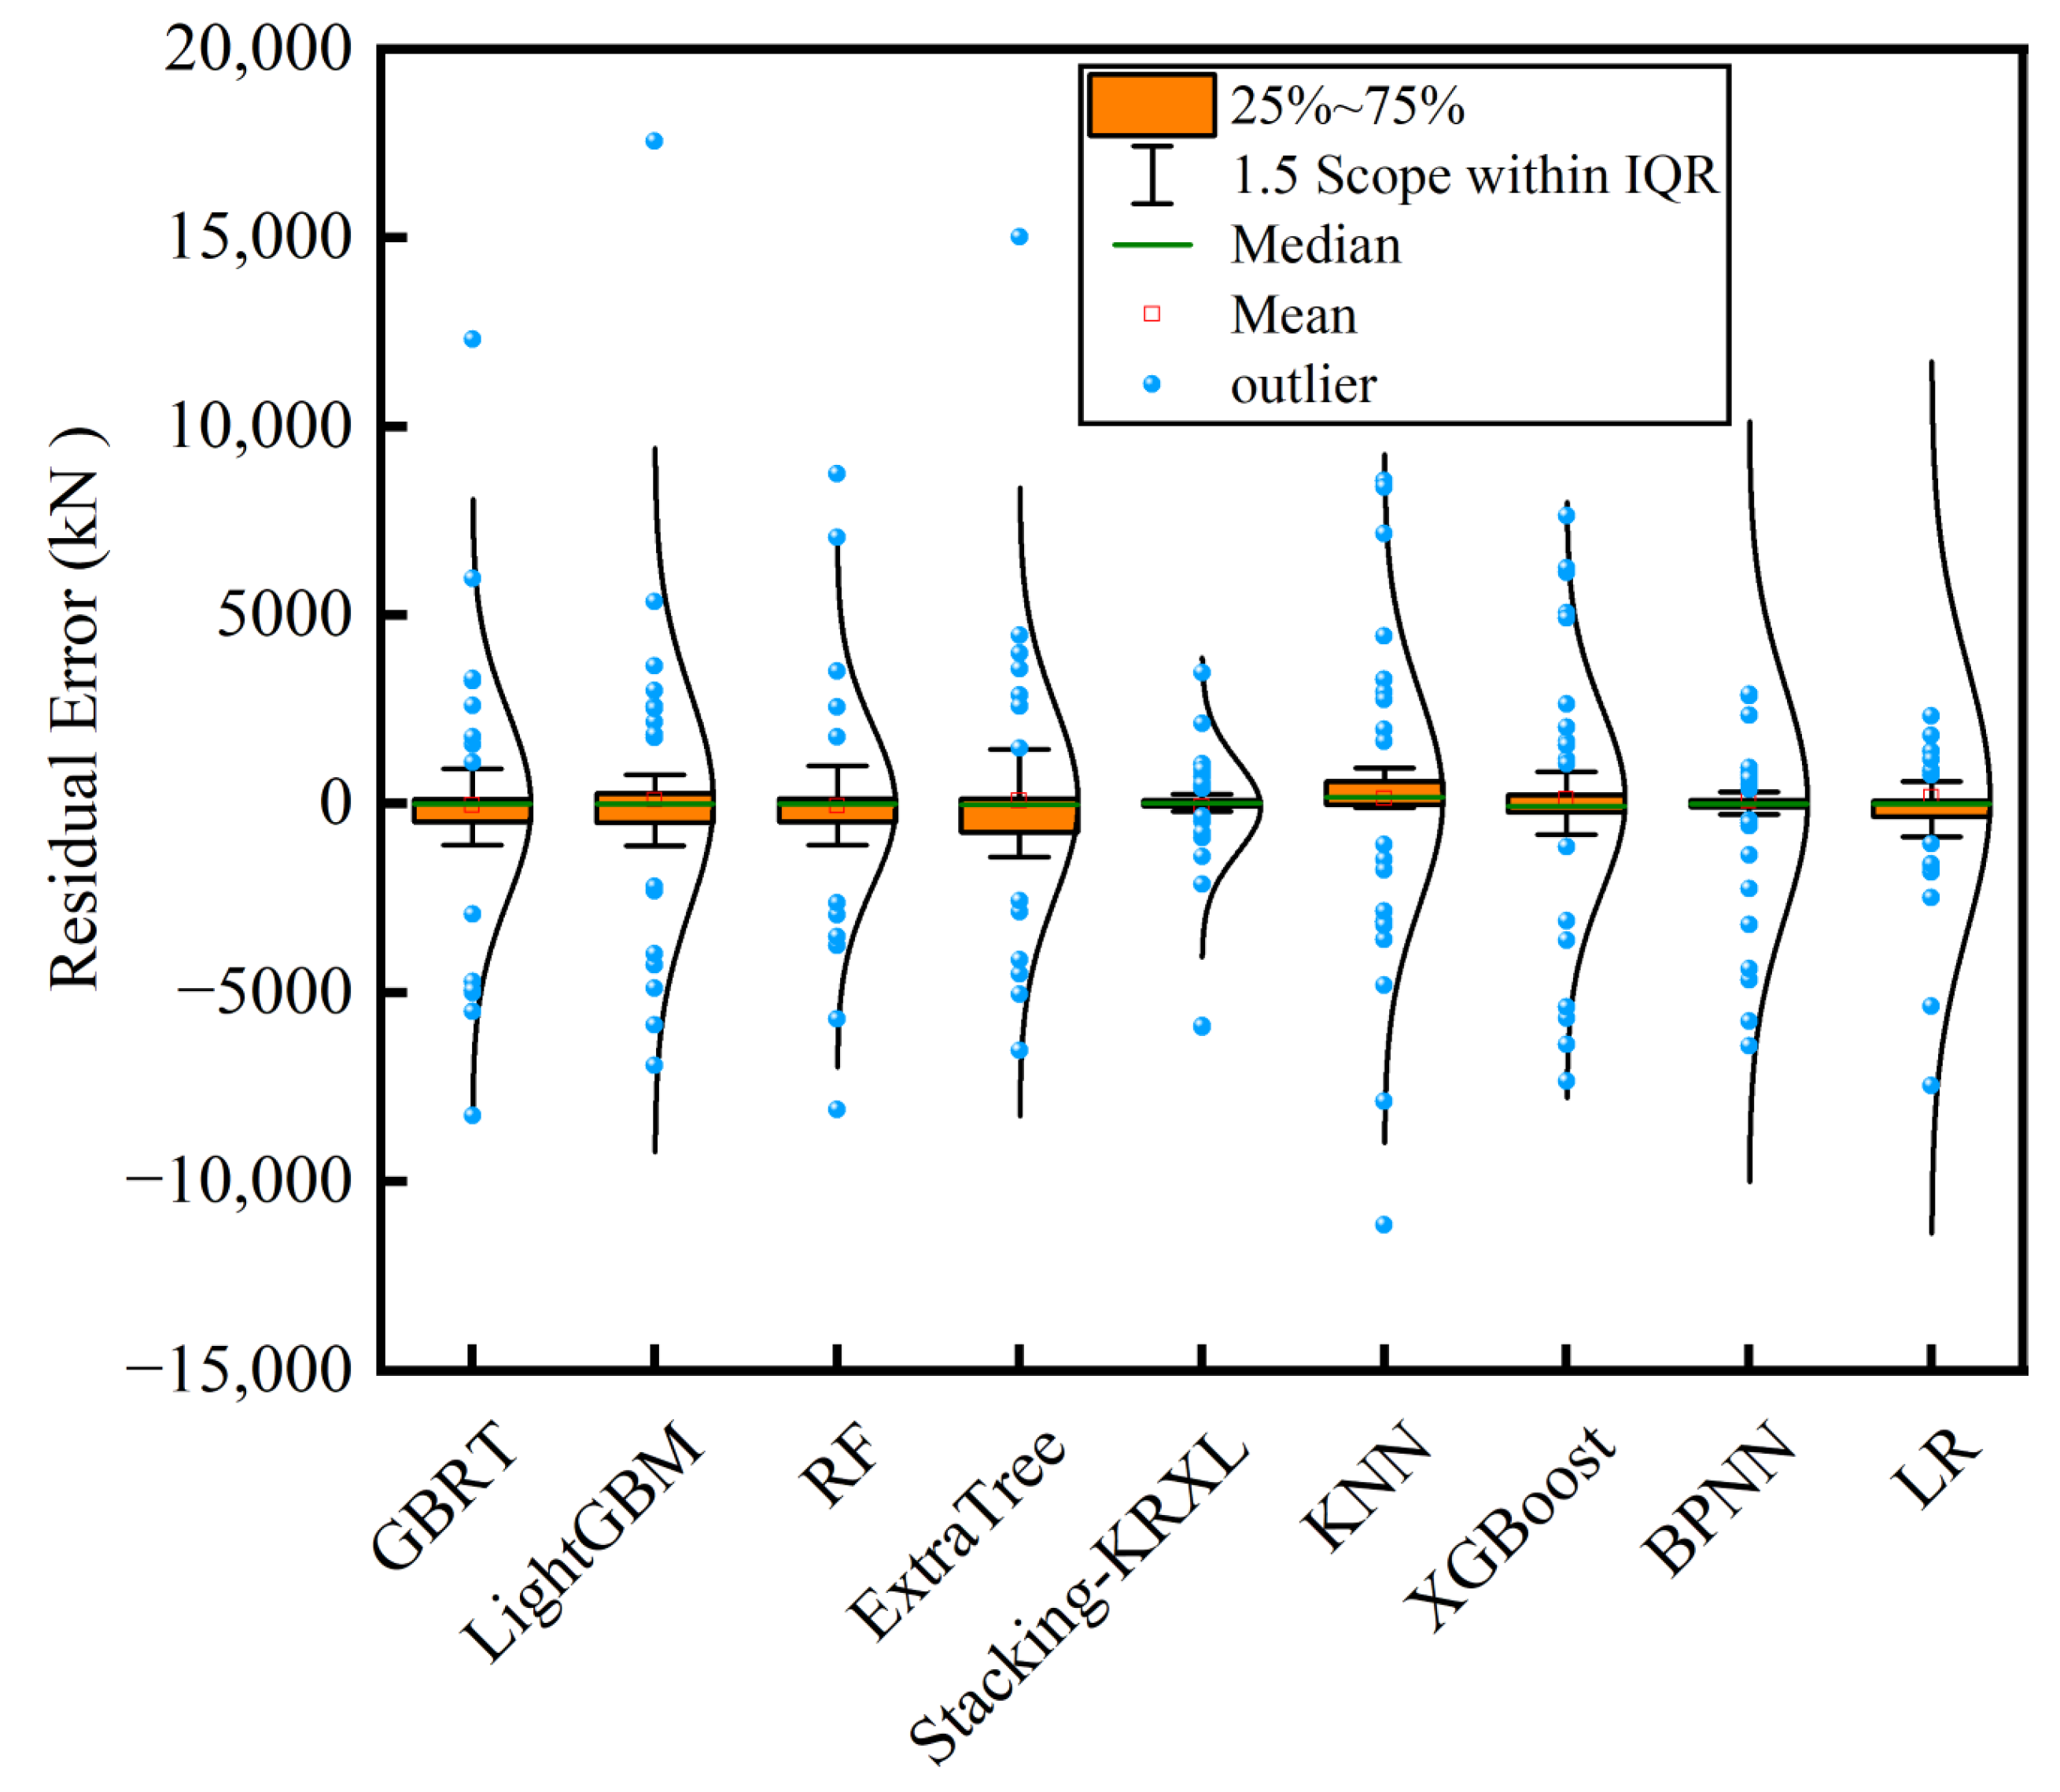
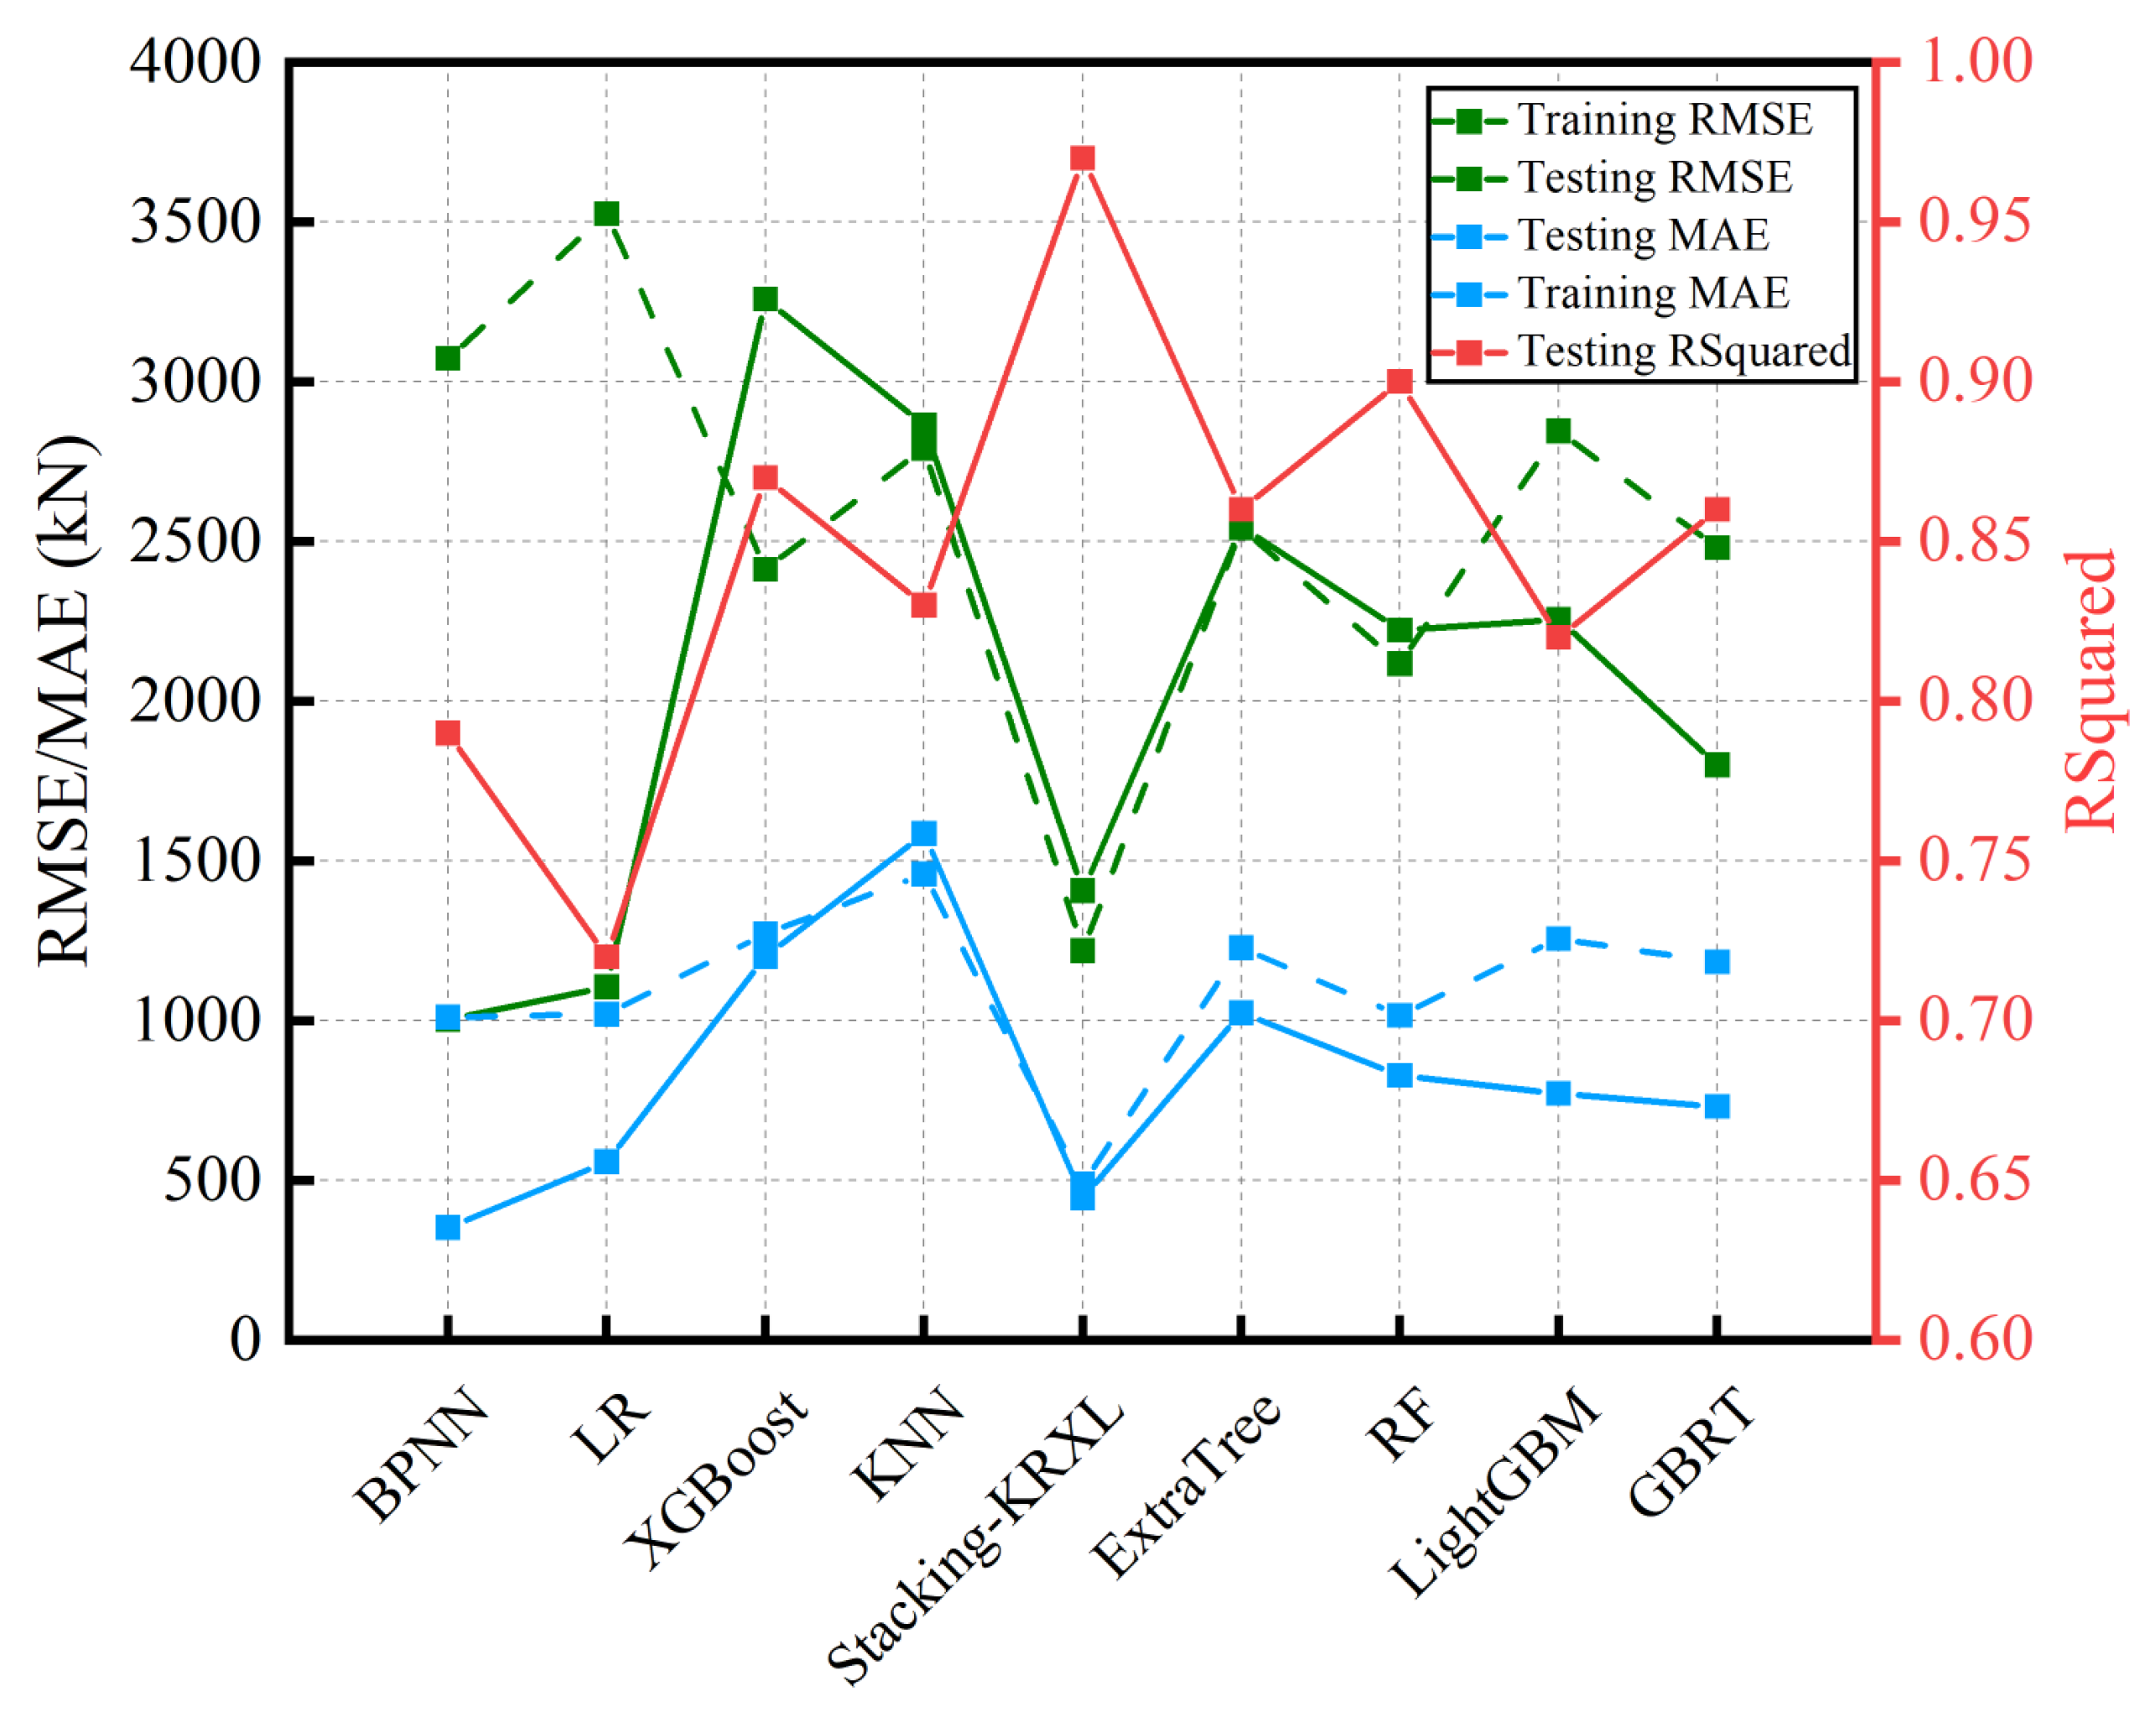
Figure 8 displays the error distribution of the nine ML models. The yellow boxes represent the interquartile range, the green lines represent the median, the red boxes represent the mean, and the blue dots represent outliers. From Figure 8, it can be observed that the error distribution of the nine ML models follows a normal distribution, with the median of the errors close to zero. Specifically, the outlier distribution is wider for the GBRT, LightGBM, and ExtraTree models, and the error normal distribution range is wider for the LightGBM, BPNN, and LR models. The Stacking-KRXL model has the smallest ranges for error normal distribution, outlier distribution, and interquartile range. This indicates that compared to the other eight individual ML models, the Stacking-KRXL model has significant advantages. Table 2 and Figure 9 show the training time, RMSE, MAE, and RSquared metrics of the nine ML models on the training and testing sets. From Table 2, it can be seen that the R-squared values of the LR and BPNN models are both less than 0.8, and they have the highest RMSE and MAE values on the testing set. The RSquared values for the XGBoost, KNN, ExtraTree, RF, LightGBM, and GBRT models range from 0.8 to 0.9, while the Stacking-KRXL model achieves an RSquared value of 0.97. Compared to the four individual models of KNN, RF, XGBoost, and LR, the RSquared values are improved by 16.9%, 7.8%, 11.5%, and 34.8%, respectively. However, due to the high complexity of the Stacking-KRXL model, it has the longest running time.
4.2. Checking of Robustness and Reliability for Stacking-KRXL Model
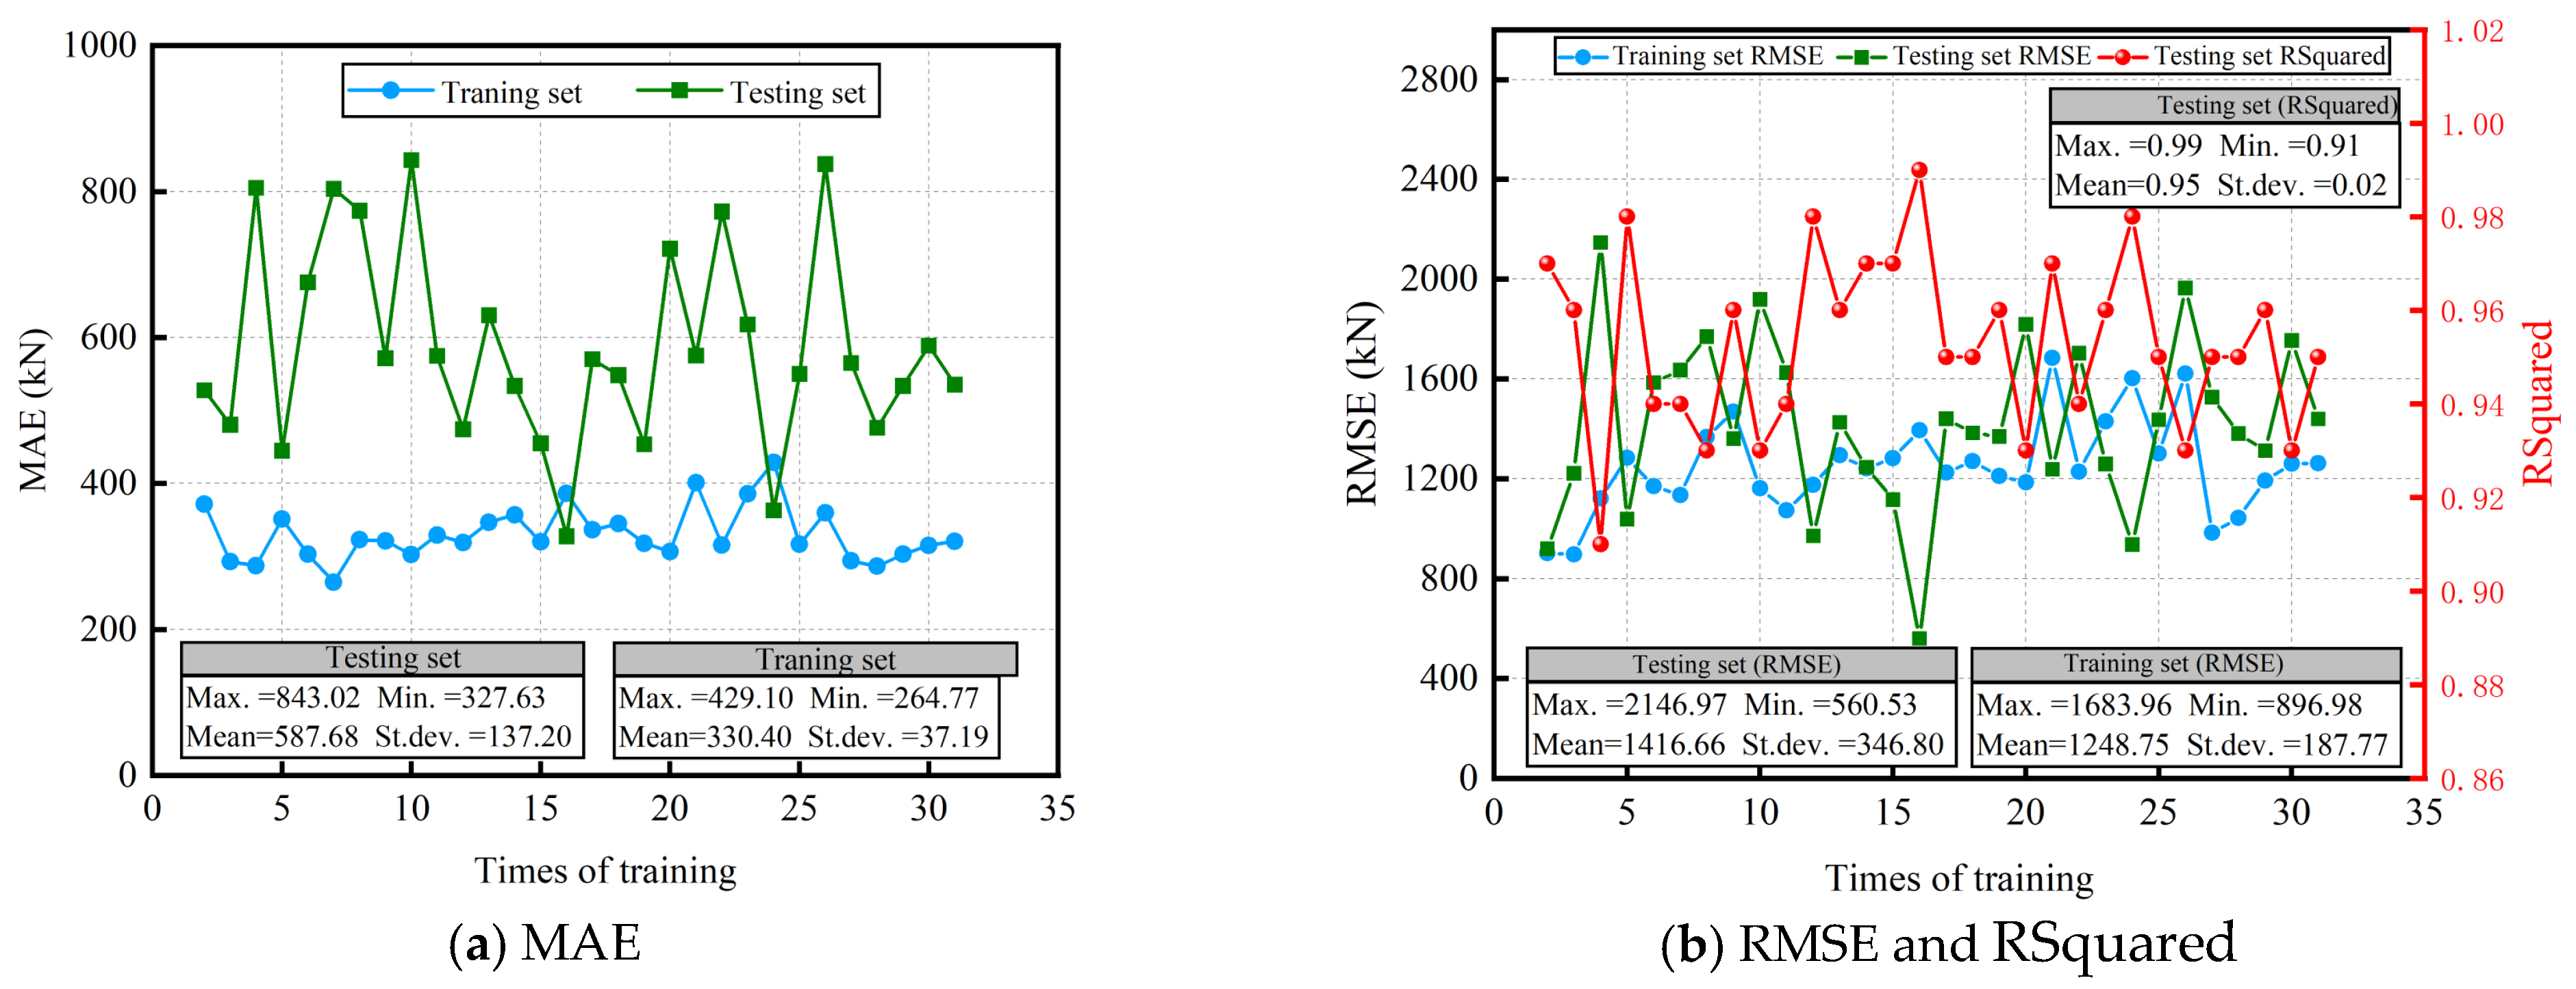
The robustness of the ML model refers to its ability to handle outlier samples and noise data while maintaining its predictive ability in exceptional conditions. On the other hand, stability refers to the model’s consistency in performance across different datasets or environments, indicating its generalization capability. To assess the performance of the Stacking-KRXL model in terms of robustness and stability, the original dataset of CFST columns was randomly divided into 30 different training and test sets, following a 7:3 ratio. Each of these training and test sets comprised distinct data samples, requiring the model to be retrained and tested each time. The MAE, RMSE, and RSquared metrics were tested under different combination datasets of the Stacking-KRXL model. Based on the 30 training results shown in Figure 10, it can be observed that the predictive performance of the Stacking-KRXL model exhibits some fluctuations, but overall, it demonstrates high accuracy. Specifically, in the training set, the MAE of the Stacking-KRXL model remains stable, fluctuating around 330kN with a standard deviation (St.dev.) of 37.19 kN. In the testing set, the MAE fluctuates around 600kN, with a St.dev. of 137.20 kN. The RMSE fluctuates around 1200 kN in the training set, with a St.dev. of 187.77 kN, while in the testing set, it fluctuates around 1400 kN, with a St.dev. of 346.80 kN. The mean RSquared value in the testing set is 0.95, with a significantly low St.dev. of 0.02, indicating good stability of the model, and the maximum RSquared value reached 0.99.
In conclusion, the results obtained from this study demonstrate that the constructed Stacking-KRXL model possesses good robustness and stability. These results are of significant importance in evaluating the reliability and robustness of the model in practical applications.
4.3. Interpretation of SHAP-Based Residual Load Capacity Model for CFST Columns
ML models are capable of establishing non-linear relationships between input features and output results. However, the internal workings of these models are often uninterpretable, presenting a “black box” characteristic. This significantly reduces the transparency and reliability of the models, limiting their generalizability and application. However, understanding the influence of each feature on the predicted results can help us adjust feature weights or take appropriate actions to enhance the predictive performance of the model. To address this issue, Štrumbelj et al. proposed a model explanation method called Shapley Additive Explanations (SHAP) based on game theory [26]. The SHAP-based analysis can analyse and quantify the relative influence of the individual input parameters. In this study, we applied the SHAP method to provide both global and local explanations for the proposed Stacking-KRXL model, aiming to better analyze the relationships between input features and output features.
4.3.1. Global Interpretation
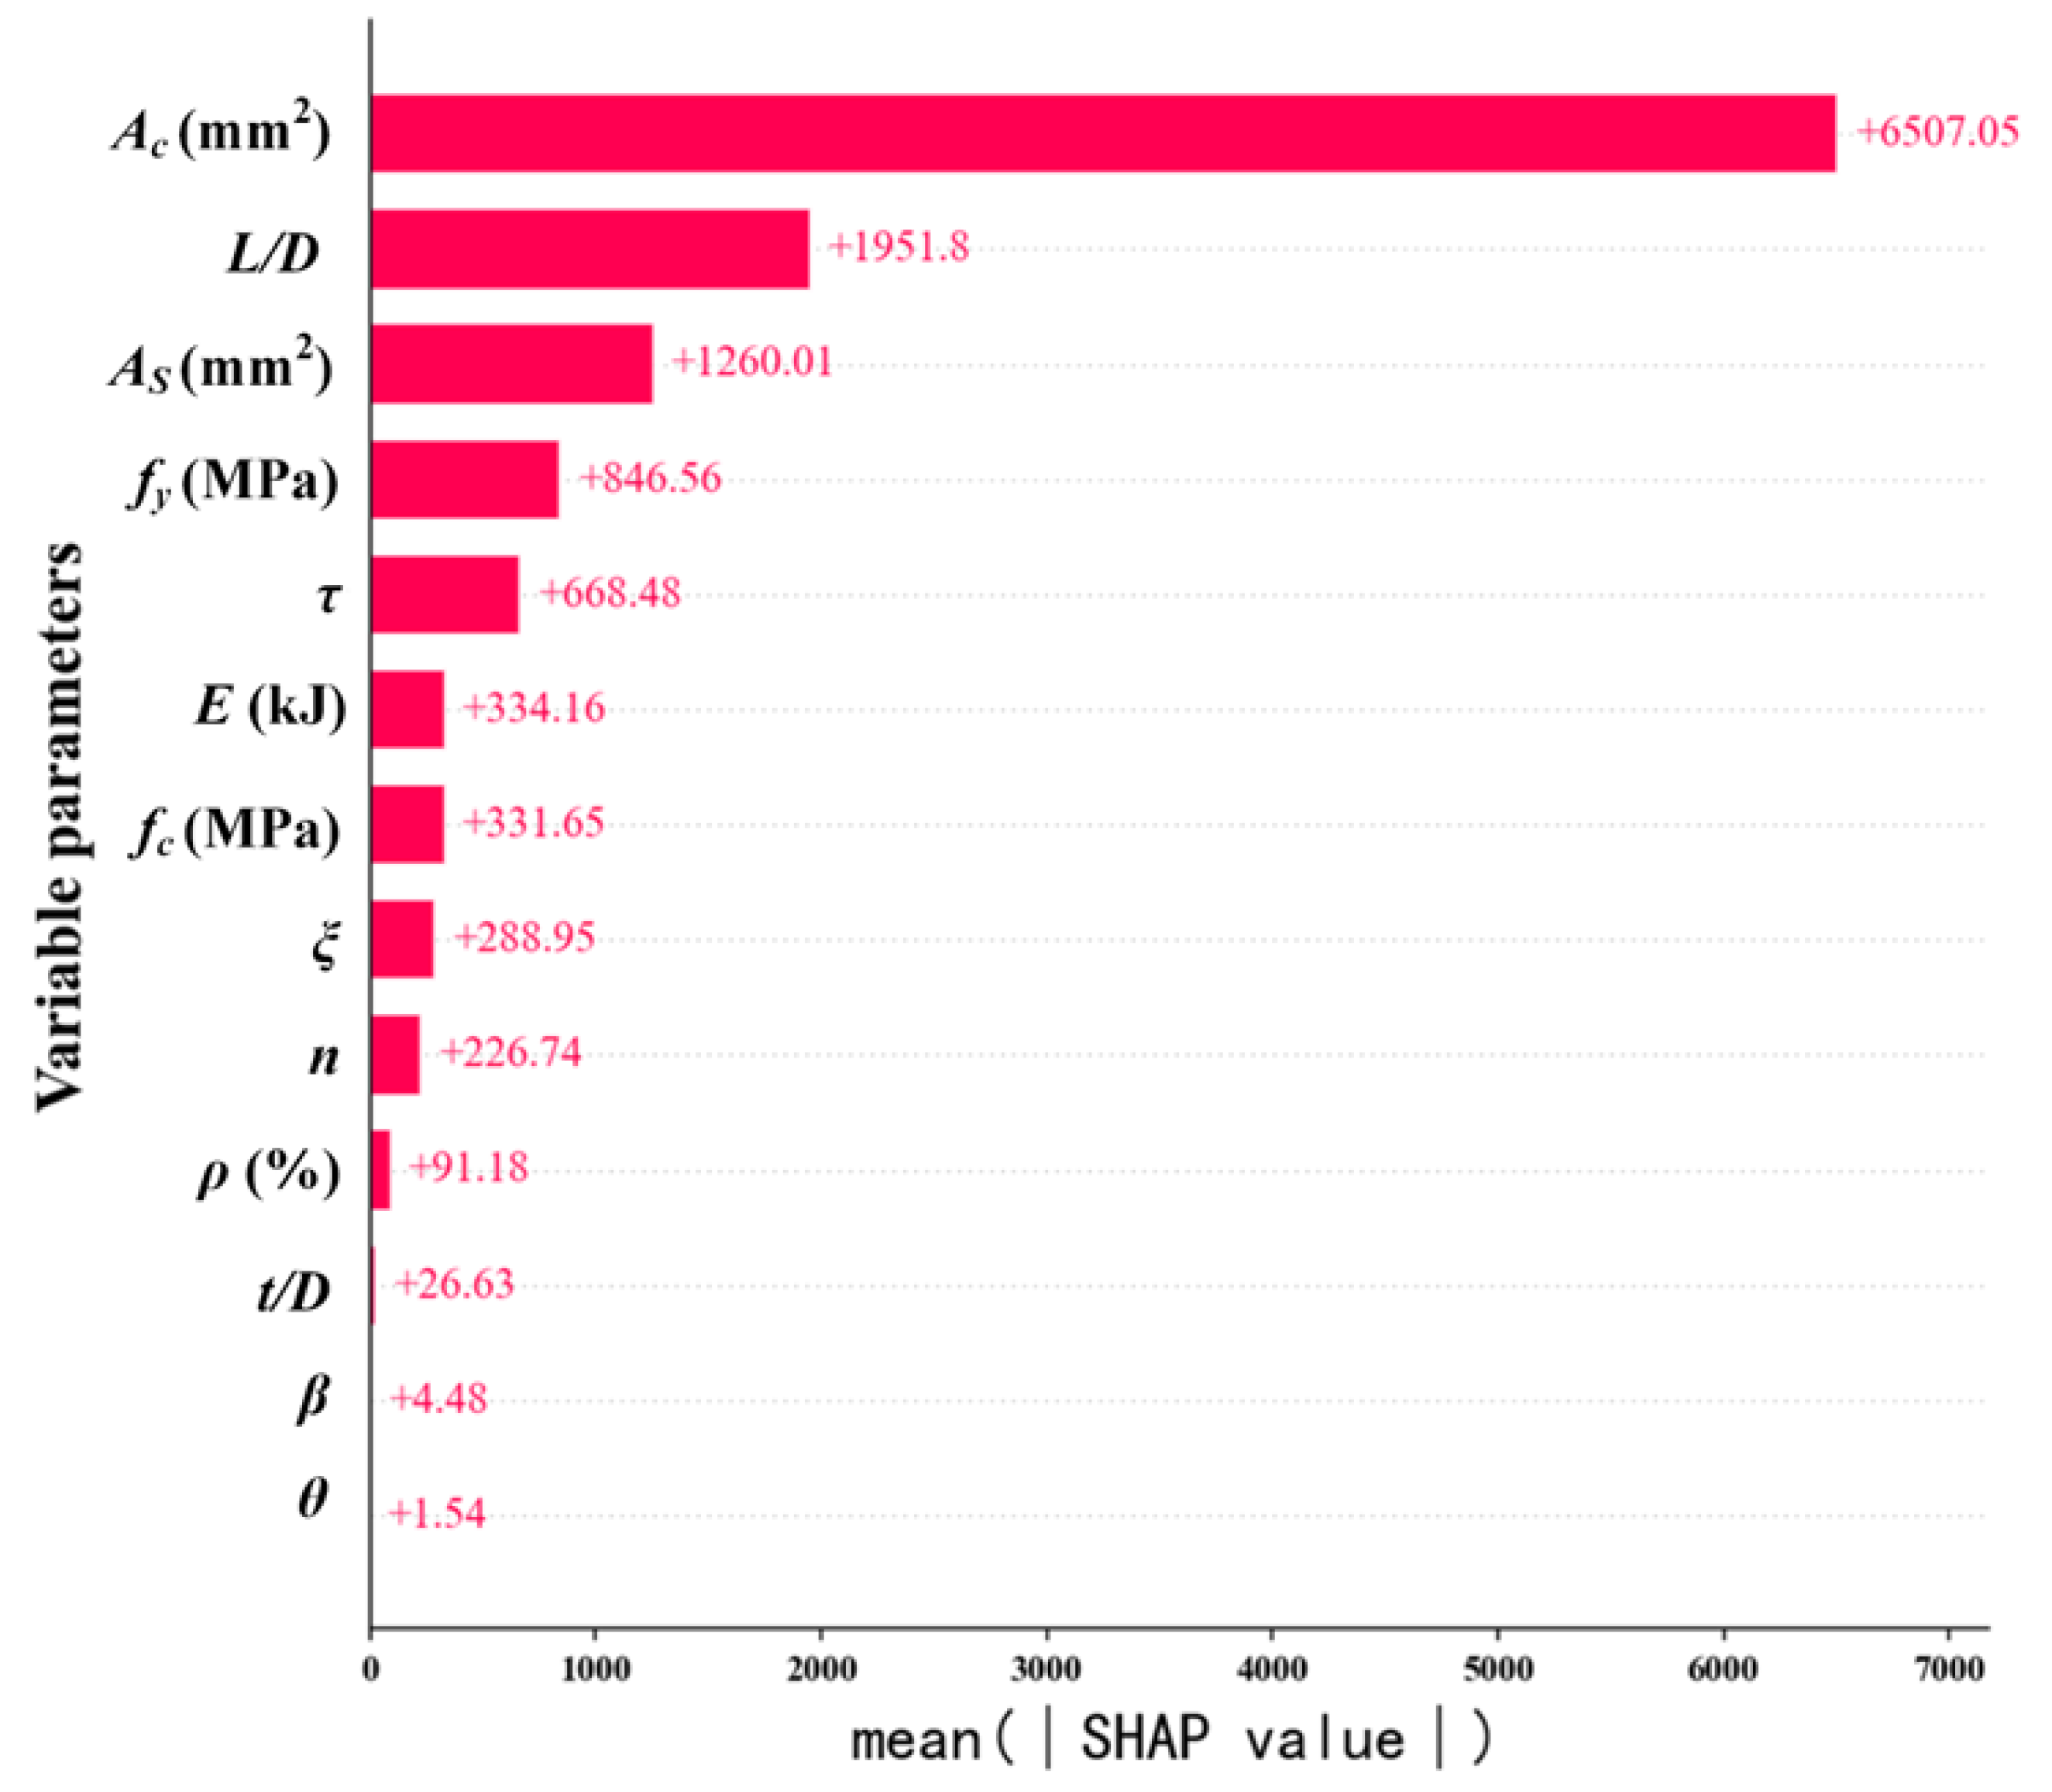
The global interpretation based on SHAP is to use the SHAP model interpretation method to explain the importance of features and their impact on the prediction results of the model. Figure 11 shows the feature importance ranking of the Stacking-KRXL model based on SHAP values. Among them, a larger SHAP value indicates a greater impact on the residual bearing capacity of the CFST column. According to Figure 11, we can observe that the Concrete area of the core area (Ac) has the greatest impact on the residual bearing capacity of the CFST column, with a SHAP value of 6507.05. Next are the CFST column’s slenderness ratio (L/D), Cross-sectional area of steel tubular (As), Yield strength of steel tubes (fy), and impact location (τ). The SHAP values of Boundary constraints (θ), Section type (β), and diameter-to-thickness ratio (t/D) are relatively small, indicating a smaller impact on the residual bearing capacity of the CFST column.
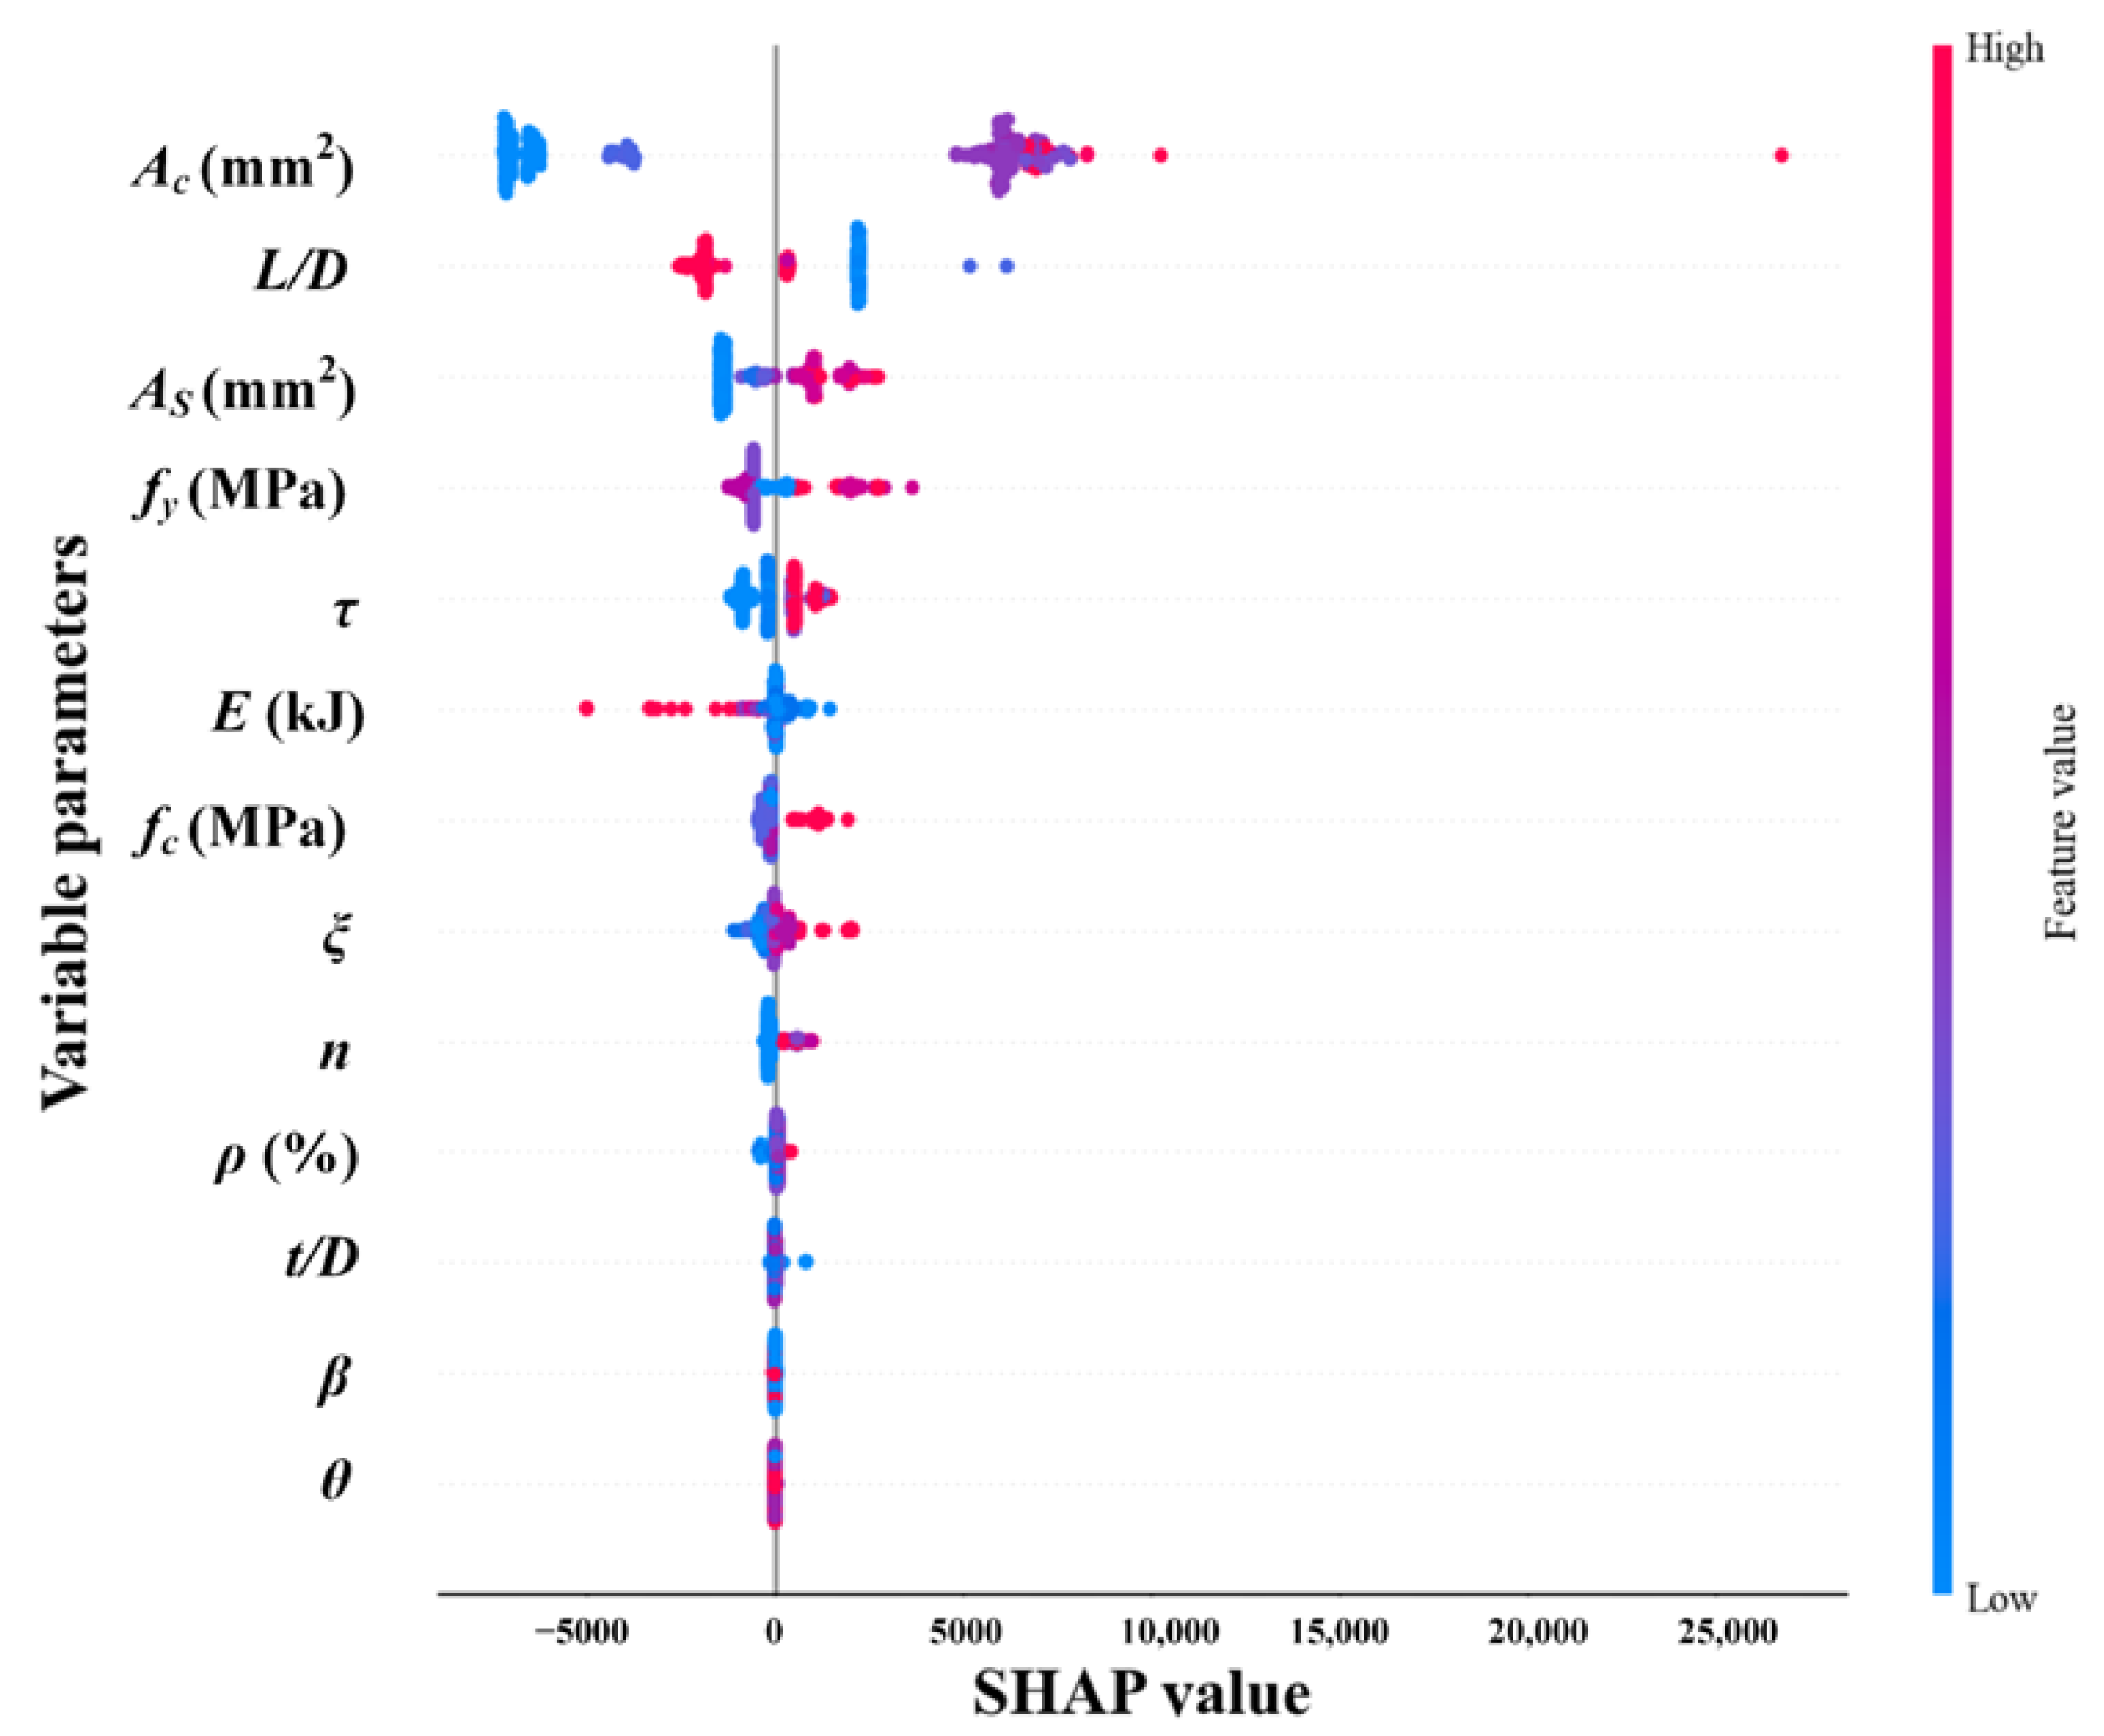
In addition, Figure 12 shows the summary plot of input features. The vertical axis represents the feature importance ranking, and the span of the scatter plot represents the magnitude of its impact on the residual bearing capacity of the CFST column. The color gradient from blue to red represents the change in feature values from small to large. From Figure 12, it can be seen that SHAP increases with the increasing values of Concrete area of core area (Ac), Cross-sectional area of steel tubular (As), Yield strength of steel tubes (fy), impact location (τ), Cubic compressive strength of concrete (fc), Constraint effect coefficient (ξ), axial pressure ratio (n), and Steel tube steel content ratio (ρ), indicating a positive correlation between these feature values and the residual bearing capacity of the CFST column. On the other hand, SHAP decreases with the increasing values of slenderness ratio (L/D) and Impact energy (E), indicating a negative correlation between these feature values and the residual bearing capacity of the CFST column.
4.3.2. Local Interpretation
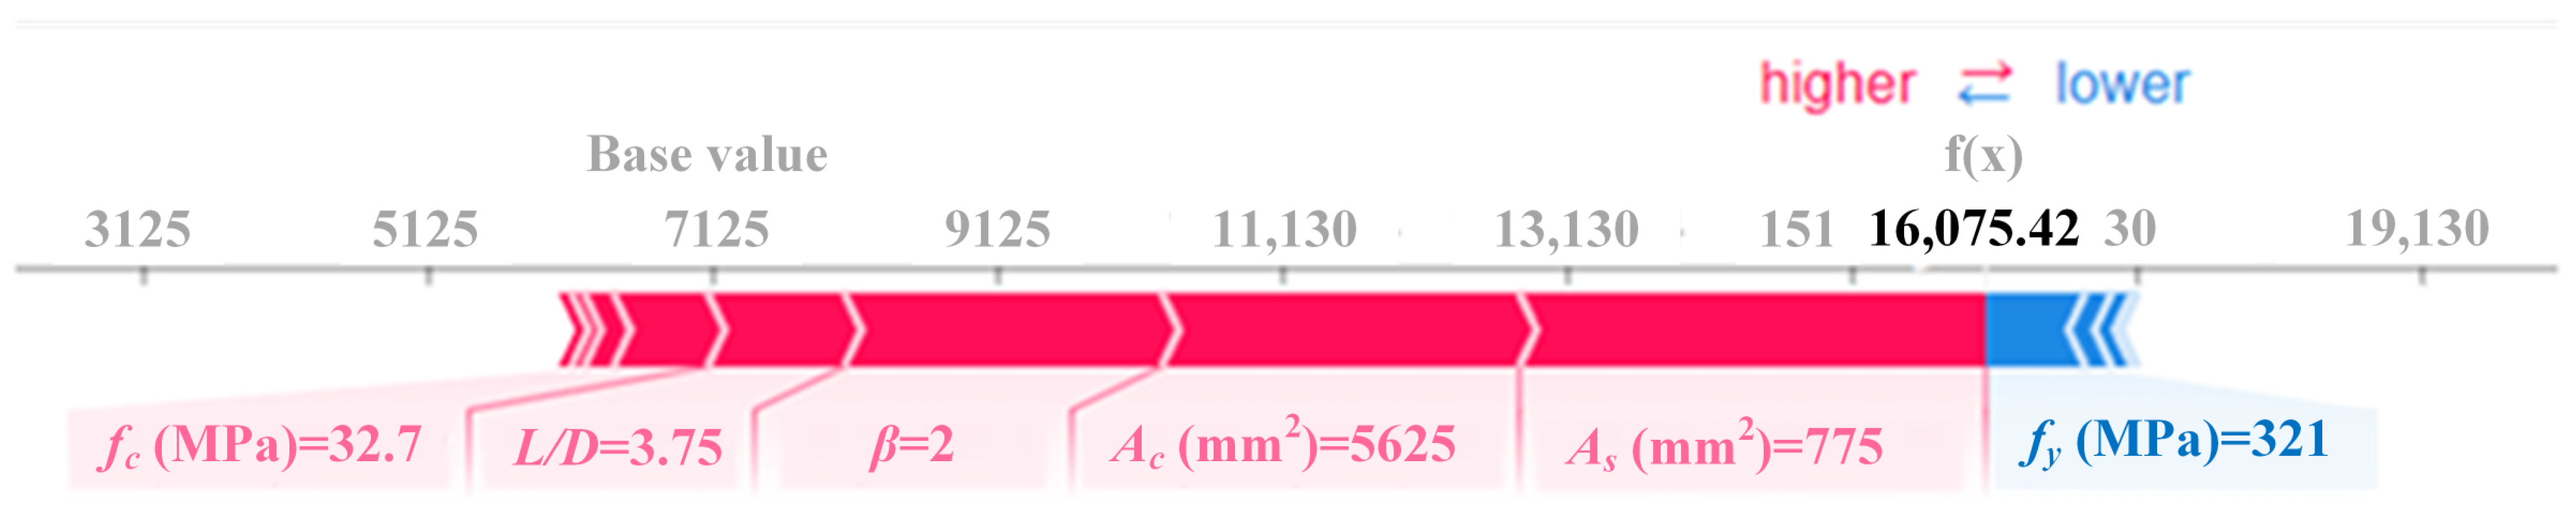
By analyzing local explanations, we can gain a deeper understanding of how the model utilizes different features to make predictions and interpret the predicted results of specific samples. To further study the importance of individual sample features and their impact on the residual bearing capacity of CFST columns, this study randomly selected a sample for SHAP-based local interpretability analysis. Figure 13 shows the graphical representation of the SHAP values of this sample as the features change, with a baseline value of 7125. Here, f(x) represents the SHAP value for the current sample’s CFST column residual bearing capacity. A red arrow pointing to the right indicates a positive influence of the feature on the CFST column residual bearing capacity, while a blue arrow pointing to the left indicates a negative influence on the CFST column bearing capacity, with the length of the arrow representing the extent of the impact. Observing Figure 13, we can conclude that after the combined effects of various features, the final SHAP value for this sample is 16,075.42. Specifically, when the Yield strength of steel tubes (fy) is 321 MPa, the residual bearing capacity of this sample decreases. However, when the Cubic compressive strength of concrete (fc) is 32.7 MPa, the slenderness ratio (L/D) is 3.75, the Section type (β) is 2, the Concrete area of the core area (Ac) is 5625 mm2, and the cross-sectional area of steel tubular (As) is 775 mm2, the residual bearing capacity of this sample increases, with Cross-sectional area of steel tubular (As) having the greatest impact.
4.3.3. Limitations of SHAP Model Interpretation
SHAP is a widely used method in the field of interpretable machine learning for explaining model predictions. However, the SHAP model interpretation also has some limitations, including the following:
- (1)
- Computational Complexity: The SHAP interpretation method requires computing the Shapley values for each feature, which involves calculating the number of combinations of feature subsets. This results in high computational complexity, making it challenging to apply on large-scale datasets or complex models.
- (2)
- Potential Conflicting Explanations: In certain situations, the SHAP interpretation may produce conflicting results. Since the Shapley values are calculated based on the weighted average of feature subsets, different feature subsets can lead to different Shapley value rankings. This can result in conflicting interpretations, making the explanations inconsistent or difficult to interpret.
- (3)
- Limitations in Interpretation: When there are correlations between features, some approximation algorithms may yield poorer performance. For example, the Kernel SHAP’s approximation algorithm requires features to be mutually independent, which is often not satisfied in most cases. This can lead to less accurate “explanatory results” for black-box models.
- (4)
- Dependency on Model Assumptions: The SHAP interpretation method depends on the assumptions and preferences of the model. Different model assumptions or preferences can lead to different interpretation results. Therefore, when using the SHAP interpretation method, it is crucial to ensure reasonable model settings and understand the limitations and assumptions of the model.
Hence, when utilizing the SHAP interpretation method, it is important to ensure appropriate model settings and comprehend the limitations and assumptions of the model. Despite these limitations, the SHAP interpretation method remains a valuable tool that can assist in better understanding and explaining model predictions.
5. Conclusions
To predict the residual bearing capacity of CFST columns under impact loading, this study proposes an interpretable Stacking-KRXL fusion model. The model combines the advantages of KNN, RF, XGBoost, and LR four individual models, thus improving the prediction accuracy of residual bearing capacity. Additionally, the SHAP method is used for model interpretability analysis, including global and local explanations. The main conclusions are as follows:
- (1)
- This paper proposes the Stacking-KRXL fusion model, which overcomes the limitations of individual ML models. Experimental results demonstrate that the fusion model achieves small prediction errors, with the majority of samples having errors within ±10%. It achieves an RSquared value of 0.97, showing improvements of 16.9%, 7.8%, 11.5%, and 34.8% compared to the constituent KNN, RF, XGBoost, and LR models, respectively. These findings demonstrate that the Stacking-KRXL fusion model effectively integrates multiple models, improving accuracy and prediction precision.
- (2)
- In the 30 repeated random training sets and testing set experiments, the predictive performance of the Stacking-KRXL fusion model showed slight fluctuation but overall maintained high accuracy. Among these 30 tests, the average RSquared value was 0.95, with a St. dev. of only 0.02, and the optimal RSquared value reached 0.99. This indicates that the Stacking-KRXL model possesses good robustness and stability.
- (3)
- The interpretability analysis results based on the SHAP method reveal that the Concrete area of the core area (Ac) has the greatest impact on the residual bearing capacity of CFST columns. The next influential factors are the CFST column’s slenderness ratio (L/D), Cross-sectional area of steel tubular (As), Yield strength of steel tubes (fy), and impact location (τ). On the other hand, Boundary constraints (θ), Section type (β), and diameter-to-thickness ratio (t/D) have relatively minor effects on the residual bearing capacity of CFST columns.
- (4)
- Additionally, All parameters used in the study were found positively correlated with the residual bearing capacity of CFST, but for slenderness ratio (t/D) and Impact energy (E).
- (5)
- The Stacking-KRXL model developed in this study enables rapid prediction of the residual bearing capacity of circular and rectangular cross-section CFST columns under various constraint conditions subjected to impact loading. To optimize the model further, future research can explore increasing the sample size in the database, incorporating additional relevant feature variables, and validating the predictions of the Stacking-KRXL model through engineering practice.
Author Contributions
Conceptualization, G.Y. and R.Y.; methodology, G.Y.; software, G.Y.; validation, G.Y.; formal analysis, G.Y. and R.Y.; investigation, J.Z.; resources, J.Z.; data curation, G.Y.; writing—original draft preparation, G.Y.; writing—review and editing, R.Y.; visualization, G.Y.; supervision, R.Y. and J.Z.; project administration, R.Y. and J.Z.; funding acquisition, R.Y. and J.Z. All authors have read and agreed to the published version of the manuscript.
Funding
This research received no external funding.
Data Availability Statement
Data are contained within the article.
Conflicts of Interest
The authors declare no conflict of interest.
References
- Debnath, P.P.; Xu, F.; Chan, T.M. Load transfer mechanism in concrete-filled steel tubular columns: Developments, challenges and opportunities. J. Constr. Steel Res. 2023, 203, 107781. [Google Scholar] [CrossRef]
- Miao, K.; Wei, Y.; Zhang, S.; Zheng, K.; Ding, M. Eccentric compression behavior of concrete-filled steel tube columns strengthened by CFRP/steel strip. Eng. Struct. 2023, 287, 116191. [Google Scholar] [CrossRef]
- Liu, W.H.; Guo, Y.L.; Tian, Z.H.; Yang, X.; Li, J.Y. Experimental and numerical study of T-shaped irregularly concrete-filled steel tube columns under combined axial loads and moments. J. Build. Eng. 2023, 65, 105796. [Google Scholar] [CrossRef]
- Wang, W.; Chouw, N. The behavior of coconut fibre reinforced concrete (CFRC) under impact loading. Constr. Build. Mater. 2017, 134, 452–461. [Google Scholar] [CrossRef]
- Nili, M.; Afroughsabet, V. Combined effect of silica fume and steel fibers on the impact resistance and mechanical properties of concrete. Int. J. Impact Eng. 2010, 37, 879–886. [Google Scholar] [CrossRef]
- Murali, G.; Ramprasad, K. A feasibility of enhancing the impact strength of novel layered two stage fibrous concrete slabs. Eng. Struct. 2018, 175, 41–49. [Google Scholar] [CrossRef]
- Cai, S.H. Calculation and Application of Steel Tube Concrete Structures; Beijing China Construction Industry Press: Beijing, China, 1989. [Google Scholar]
- Zhang, X.; Chen, Y.; Wan, J.; Wang, K.; He, K.; Chen, X.; Wei, J.; Jiang, G. Tests on residual ultimate bearing capacity of square FST columns after impact. J. Constr. Steel Res. 2018, 147, 27–42. [Google Scholar] [CrossRef]
- Zhang, X.; Chen, Y.; Shen, X.; Zhu, Y. Behavior of Circular CFST Columns Subjected to different Lateral Impact Energy. Appl. Sci. 2019, 9, 1134. [Google Scholar] [CrossRef]
- Hou, C.C.; Han, L.H. Life-cycle performance of deteriorated concrete-filled steel tubular CFST) structures subject to lateral impact. Thin Walled Struct. 2018, 132, 362–374. [Google Scholar] [CrossRef]
- Wang, X.; Zhang, Z. Residual axial capacity of square recycled aggregate concrete-filled steel tube columns after blast loads. J. Build. Eng. 2022, 47, 103865. [Google Scholar] [CrossRef]
- Chen, Q. Experimental Investigation on the Residual Strength of Concrete-Filled Steel Tube Column after Subjected to Lateral Impact; Yangtze University: Jingzhou, China, 2017. (In Chinese) [Google Scholar]
- Wang, Z.H. Study on Residual Bearing Capacity and Damage of Concrete-Filled Circular Steel Tube Columns under Lateral Impact; Fujian University of Technology: Fuzhou, China, 2021. (In Chinese) [Google Scholar]
- Kang, C.M. The Influence of Axial Compression Ratio on the Lateral Impact Performance of Concrete Filled Steel Tube Columns; Taiyuan University of Technology: Taiyuan, China, 2020. (In Chinese) [Google Scholar]
- Reich, Y. Machine learning techniques for civil engineering problems. Comput. Aided Civ. Infrastruct. Eng. 1997, 12, 295–310. [Google Scholar] [CrossRef]
- Quaranta, G.; Lacarbonara, W.; Masri, S.F. A review on computational intelligence for identification of nonlinear dynamical systems. Nonlinear Dyn. 2020, 99, 1709–1761. [Google Scholar] [CrossRef]
- Lai, D.; Demartino, C.; Xiao, Y. Interpretable machine-learning models for maximum displacements of RC beams under impact loading predictions. Eng. Struct. 2023, 281, 115723. [Google Scholar] [CrossRef]
- Almustafa, M.K.; Nehdi, M.L. Machine learning model for predicting structural response of RC columns subjected to blast loading. Int. J. Impact Eng. 2022, 162, 104145. [Google Scholar] [CrossRef]
- Almustafa, M.K.; Nehdi, M.L. Machine learning prediction of structural response for FRP retrofitted RC slabs subjected to blast loading. Eng. Struct. 2021, 244, 112752. [Google Scholar] [CrossRef]
- Thai, D.K.; Tu, T.M.; Bui, T.Q.; Bui, T.T. Gradient tree boosting machine learning on predicting the failure modes of the RC panels under impact loads. Eng. Comput. 2021, 37, 597–608. [Google Scholar] [CrossRef]
- Doan, Q.H.; Le, T.; Thai, D.K. Optimization strategies of neural networks for impact damage classification of RC panels in a small dataset. Appl. Soft Comput. 2021, 102, 107100. [Google Scholar] [CrossRef]
- Cao, Y.; Zandi, Y.; Rahimi, A.; Petković, D.; Denić, N.; Stojanović, J.; Spasić, B.; Vujović, V.; Khadimallah, M.A.; Assilzadeh, H. Evaluation and monitoring of impact resistance of fiber reinforced concrete by adaptive neuro fuzzy algorithm. Structures 2021, 34, 3750–3756. [Google Scholar] [CrossRef]
- Haruna, S.I.; Zhu, H.; Jiang, W.; Shao, J. Evaluation of impact resistance properties of polyurethane-based polymer concrete for the repair of runway subjected to repeated drop-weight impact test. Constr. Build. Mater. 2021, 309, 125152. [Google Scholar] [CrossRef]
- Al-shawafi, A.; Zhu, H.; Haruna, S.I.; Bo, Z.; Laqsum, S.A. Experimental study and machine learning algorithms for evaluating the performance of U-shaped ultra-high performance reinforced fiber concrete under static and impact loads. J. Build. Eng. 2023, 70, 106389. [Google Scholar] [CrossRef]
- Zhang, J.G.; Yang, G.C.; Ma, Z.H.; Zhao, G.L.; Song, H.Y. A stacking-CRRL fusion model for predicting the bearing capacity of a steel-reinforced concrete column constrained by carbon fiber-reinforced polymer. Structures 2023, 55, 1793–1804. [Google Scholar] [CrossRef]
- Štrumbelj, E.; Kononenko, I. Explaining prediction models and individual predictions with feature contributions. Knowl. Inf. Syst. 2014, 41, 647–665. [Google Scholar] [CrossRef]
- Xu, Y.C. Behaviour of Concrete Filled Steel Tubes with Square Cross-Section under Repeated Impacts; Xijing University: Xian, China, 2022. (In Chinese) [Google Scholar]
- Li, C.; Yan, Q.S.; Li, L.; Sun, B.W. Study on mechanical properties of concrete-filled stainless steel tubular column under lateral impact load. Prot. Eng. 2019, 41, 7–14. (In Chinese) [Google Scholar]
- Yang, X.Q. Dynamic Constitutive Models of Structural Steels and Transverse Impact Resistance of High-Strength Concrete Filled Steel Tubes with Square Cross-Section; Harbin Institute of Technology: Harbin, China, 2023. (In Chinese) [Google Scholar]
- Su, X.; Yan, X.; Tsai, C.L. Linear regression. Wiley Interdiscip. Rev. Comput. Stat. 2012, 4, 275–294. [Google Scholar] [CrossRef]
- Kramer, O. K-nearest neighbors. In Dimensionality Reduction with Unsupervised Nearest Neighbors; Springer: Berlin/Heidelberg, Germany, 2013; pp. 13–23. [Google Scholar]
- Rigatti, S.J. Random forest. J. Insur. Med. 2017, 47, 31–39. [Google Scholar] [CrossRef]
- Chen, T.; Guestrin, C. Xgboost: A scalable tree boosting system. In Proceedings of the 22nd ACM SIGKDD International Conference on Knowledge Discovery and Data Mining, San Francisco, CA, USA, 13–16 August 2016; pp. 785–794. [Google Scholar]
- Chen, M.; Liu, Q.; Chen, S.; Liu, Y.; Zhang, C.H.; Liu, R. XGBoost-based algorithm interpretation and application on post-fault transient stability status prediction of power system. IEEE Access 2019, 7, 13149–13158. [Google Scholar] [CrossRef]
- Qu, Z.; Xu, J.; Wang, Z.; Chi, R.; Liu, H. Prediction of electricity generation from a combined cycle power plant based on a stacking ensemble and its hyperparameter optimization with a grid-search method. Energy 2021, 227, 120309. [Google Scholar] [CrossRef]
- da Silva, R.G.; Ribeiro, M.H.D.M.; Moreno, S.R.; Mariani, V.C.; dos Santos Coelho, L. A novel decomposition-ensemble learning framework for multi-step ahead wind energy forecasting. Energy 2021, 216, 119174. [Google Scholar] [CrossRef]
- Ribeiro MH, D.M.; dos Santos Coelho, L. Ensemble approach based on bagging, boosting and stacking for short-term prediction in agribusiness time series. Appl. Soft Comput. 2020, 86, 105837. [Google Scholar] [CrossRef]
Figure 1.
Typical CFST column cross-sectional forms: (a) circular section, (b) square section [29].
Figure 1.
Typical CFST column cross-sectional forms: (a) circular section, (b) square section [29].

Figure 2.
Boundary constraints and corresponding simplified models of CFST columns with different constraints.
Figure 2.
Boundary constraints and corresponding simplified models of CFST columns with different constraints.

Figure 3.
Interpretable Stacking-KRXL Fusion Based Implementation Framework for Predicting Residual Bearing Capacity of CFST Columns.
Figure 3.
Interpretable Stacking-KRXL Fusion Based Implementation Framework for Predicting Residual Bearing Capacity of CFST Columns.

Figure 4.
Schematic diagram of the principles of ML models: (a) LR, (b) KNN, (c) RF, (d) XGBoost.

Figure 5.
Schematic diagram of the Stacking model.

Figure 6.
Prediction process of residual bearing capacity of CFST columns based on Stacking-KRXL modeling.
Figure 6.
Prediction process of residual bearing capacity of CFST columns based on Stacking-KRXL modeling.

Figure 7.
Comparison of predicted and true values of various ML models.

Figure 8.
Error distribution of various ML models.

Figure 9.
Comparison of different ML model prediction performance metrics.

Figure 10.
Stacking-KRXL Model Stability and Robustness Tests.

Figure 11.
SHAP-based ranking of important features.

Figure 12.
SHAP-based summary map of important features.

Figure 13.
SHAP-based localized sample interpretation.


Table 1.
List of the modeling features extracted from the references in the literature, and statistical analysis of the values used in the database of this study.
Table 1.
List of the modeling features extracted from the references in the literature, and statistical analysis of the values used in the database of this study.
| Category | Features | Unit | Features Description | Mean | Standard Deviation | Minimum | Median | Maximum |
|---|---|---|---|---|---|---|---|---|
| geometric parameters | t/D | (-) | diameter-to-thickness ratio | 0.04 | 0.01 | 0.01 | 0.04 | 0.10 |
| L/D | (-) | slenderness ratio | 7.10 | 3.18 | 3.37 | 9.00 | 15.00 | |
| Ac | (mm2) | Concrete area of the core area | 72,589.11 | 84,662.13 | 5150.39 | 63,314.96 | 767,376.00 | |
| As | (mm2) | The cross-sectional area of steel tubular | 13,413.44 | 12,702.26 | 775.00 | 10,851.84 | 45,216.00 | |
| β | (-) | Section type | 1.33 | 0.47 | 1.00 | 1.00 | 2.00 | |
| material parameters | n | (-) | axial pressure ratio | 0.07 | 0.16 | 0.00 | 0.00 | 0.80 |
| fc | (MPa) | Cubic compressive strength of concrete | 37.16 | 12.31 | 20.10 | 32.40 | 75.10 | |
| fy | (MPa) | Yield strength of steel tubes | 332.22 | 42.63 | 235.00 | 321.00 | 690.00 | |
| ξ | (-) | Constraint effect coefficient | 1.99 | 1.12 | 0.30 | 2.00 | 7.29 | |
| ρ | (-) | Steel tube steel content ratio | 19.65 | 8.51 | 5.00 | 20.73 | 56.25 | |
| boundary constraints | θ | (-) | Boundary constraints | 2.45 | 0.65 | 1.00 | 3.00 | 3.00 |
| impact parameters | E | (kJ) | Impact energy | 339.94 | 702.83 | 0.00 | 138.89 | 5555.56 |
| τ | (-) | impact location | 0.33 | 0.13 | 0.00 | 0.25 | 0.66 | |
| Output feature | F | (kN) | the residual bearing capacity of CFST | 6920 | 7539.38 | 199.8 | 5209 | 59188 |
Note: β: 1 represents circular CFST column, 2 represents square CFST column; θ: 1 represents both ends fixed, 2 represents one end fixed and one end simply supported, 3 represents both ends simply supported; τ: represents the ratio of impact location to the length of the CFST column.
Table 2.
Predictive performance metrics of different ML models in training and test sets.
| Models | Training Time (s) | Training Set | Testing Set | |||
|---|---|---|---|---|---|---|
| RMSE (kN) | MAE (kN) | RMSE (kN) | MAE (kN) | RSquared | ||
| BPNN | 2.11 | 1003.22 | 352.96 | 3072.62 | 1010.93 | 0.79 |
| LR | 1.56 | 1106.52 | 558.44 | 3525.52 | 1020.19 | 0.72 |
| XGBoost | 7.55 | 3258.65 | 1200.58 | 2412.73 | 1271.81 | 0.87 |
| KNN | 3.31 | 2863.98 | 1585.74 | 2790.61 | 1459.30 | 0.83 |
| Stacking-KRXL | 12.11 | 1407.29 | 444.54 | 1219.56 | 489.82 | 0.97 |
| ExtraTree | 5.21 | 2545.23 | 1024.82 | 2541.66 | 1228.58 | 0.86 |
| RF | 2.21 | 2221.72 | 829.03 | 2117.54 | 1016.72 | 0.90 |
| LightGBM | 7.23 | 2255.89 | 772.35 | 2845.08 | 1256.87 | 0.82 |
| GBRT | 5.58 | 1800.87 | 731.16 | 2480.16 | 1183.79 | 0.86 |
Disclaimer/Publisher’s Note: The statements, opinions and data contained in all publications are solely those of the individual author(s) and contributor(s) and not of MDPI and/or the editor(s). MDPI and/or the editor(s) disclaim responsibility for any injury to people or property resulting from any ideas, methods, instructions or products referred to in the content. |
© 2023 by the authors. Licensee MDPI, Basel, Switzerland. This article is an open access article distributed under the terms and conditions of the Creative Commons Attribution (CC BY) license (https://creativecommons.org/licenses/by/4.0/).
Share and Cite
MDPI and ACS Style
Yang, G.; Yang, R.; Zhang, J. Prediction and Interpretation of Residual Bearing Capacity of Cfst Columns under Impact Loads Based Interpretable Stacking Fusion Modeling. Buildings 2023, 13, 2783. https://doi.org/10.3390/buildings13112783
AMA Style
Yang G, Yang R, Zhang J. Prediction and Interpretation of Residual Bearing Capacity of Cfst Columns under Impact Loads Based Interpretable Stacking Fusion Modeling. Buildings. 2023; 13(11):2783. https://doi.org/10.3390/buildings13112783
Chicago/Turabian StyleYang, Guangchao, Ran Yang, and Jian Zhang. 2023. "Prediction and Interpretation of Residual Bearing Capacity of Cfst Columns under Impact Loads Based Interpretable Stacking Fusion Modeling" Buildings 13, no. 11: 2783. https://doi.org/10.3390/buildings13112783
Note that from the first issue of 2016, this journal uses article numbers instead of page numbers. See further details here.