
The Effectiveness of Spraying nTiO2 on Coating Mortars in Historical Buildings Aimed at Reducing Fungal Growth
Abstract
:1. Introduction
2. Materials and Methods
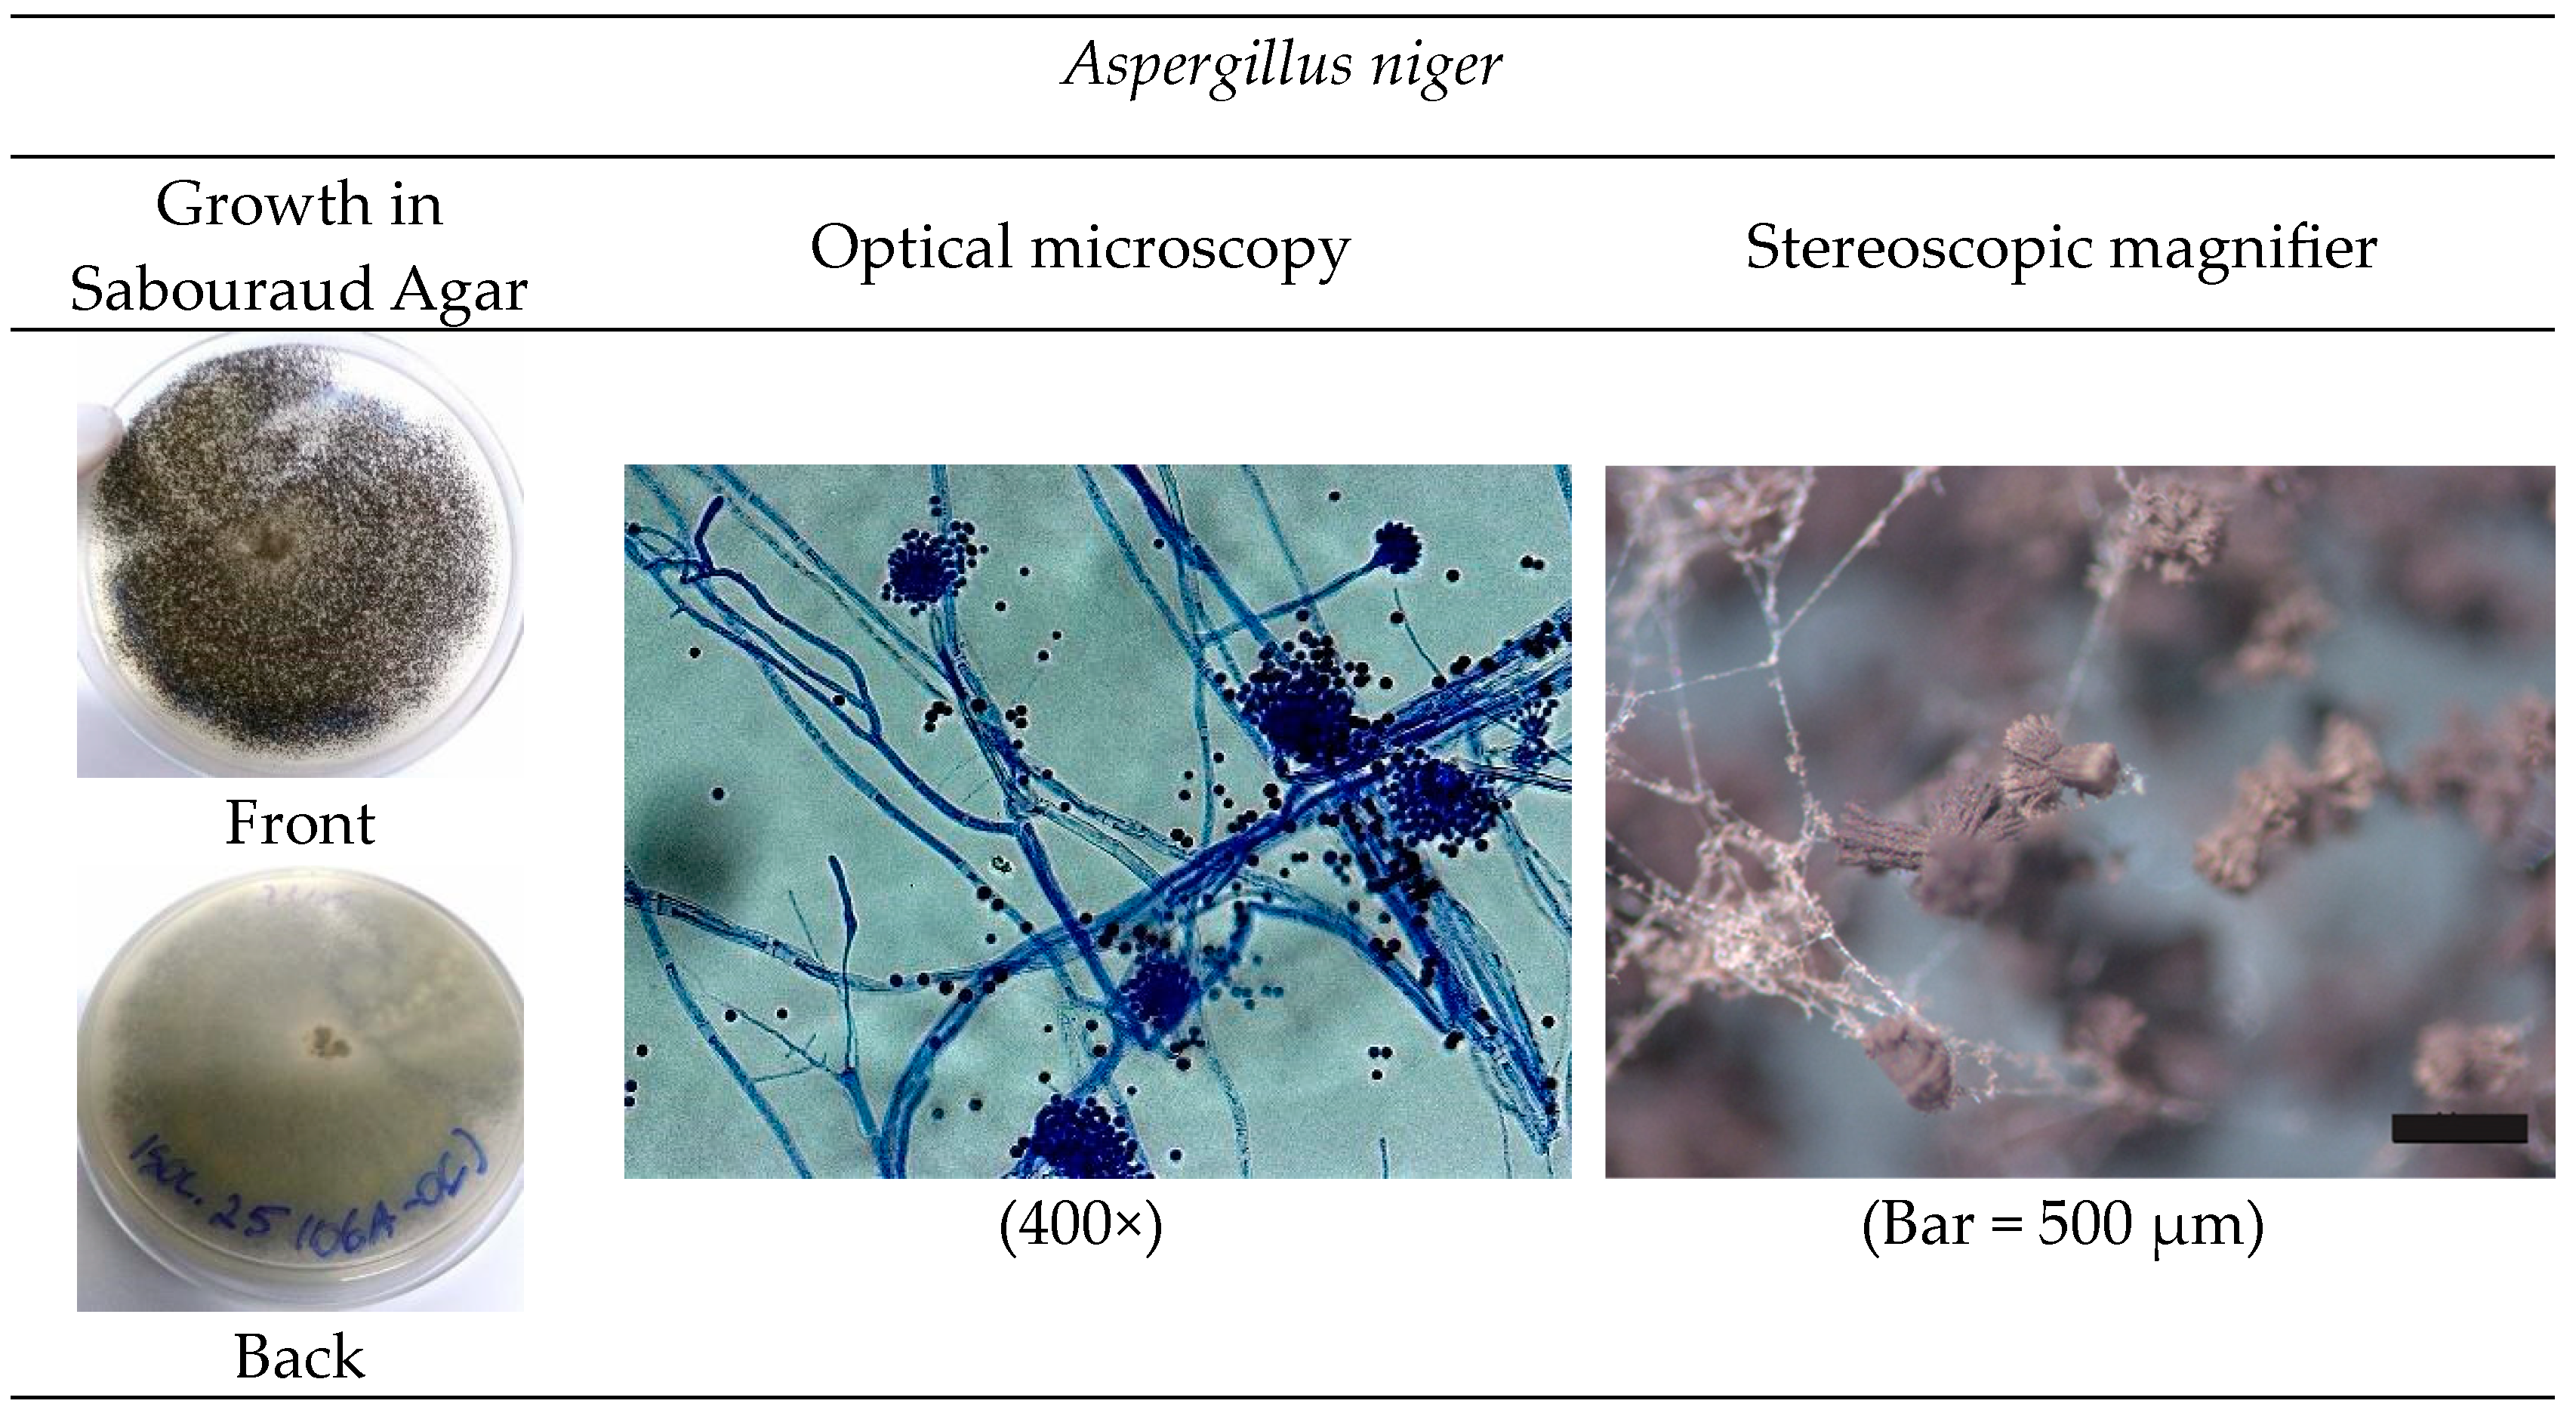
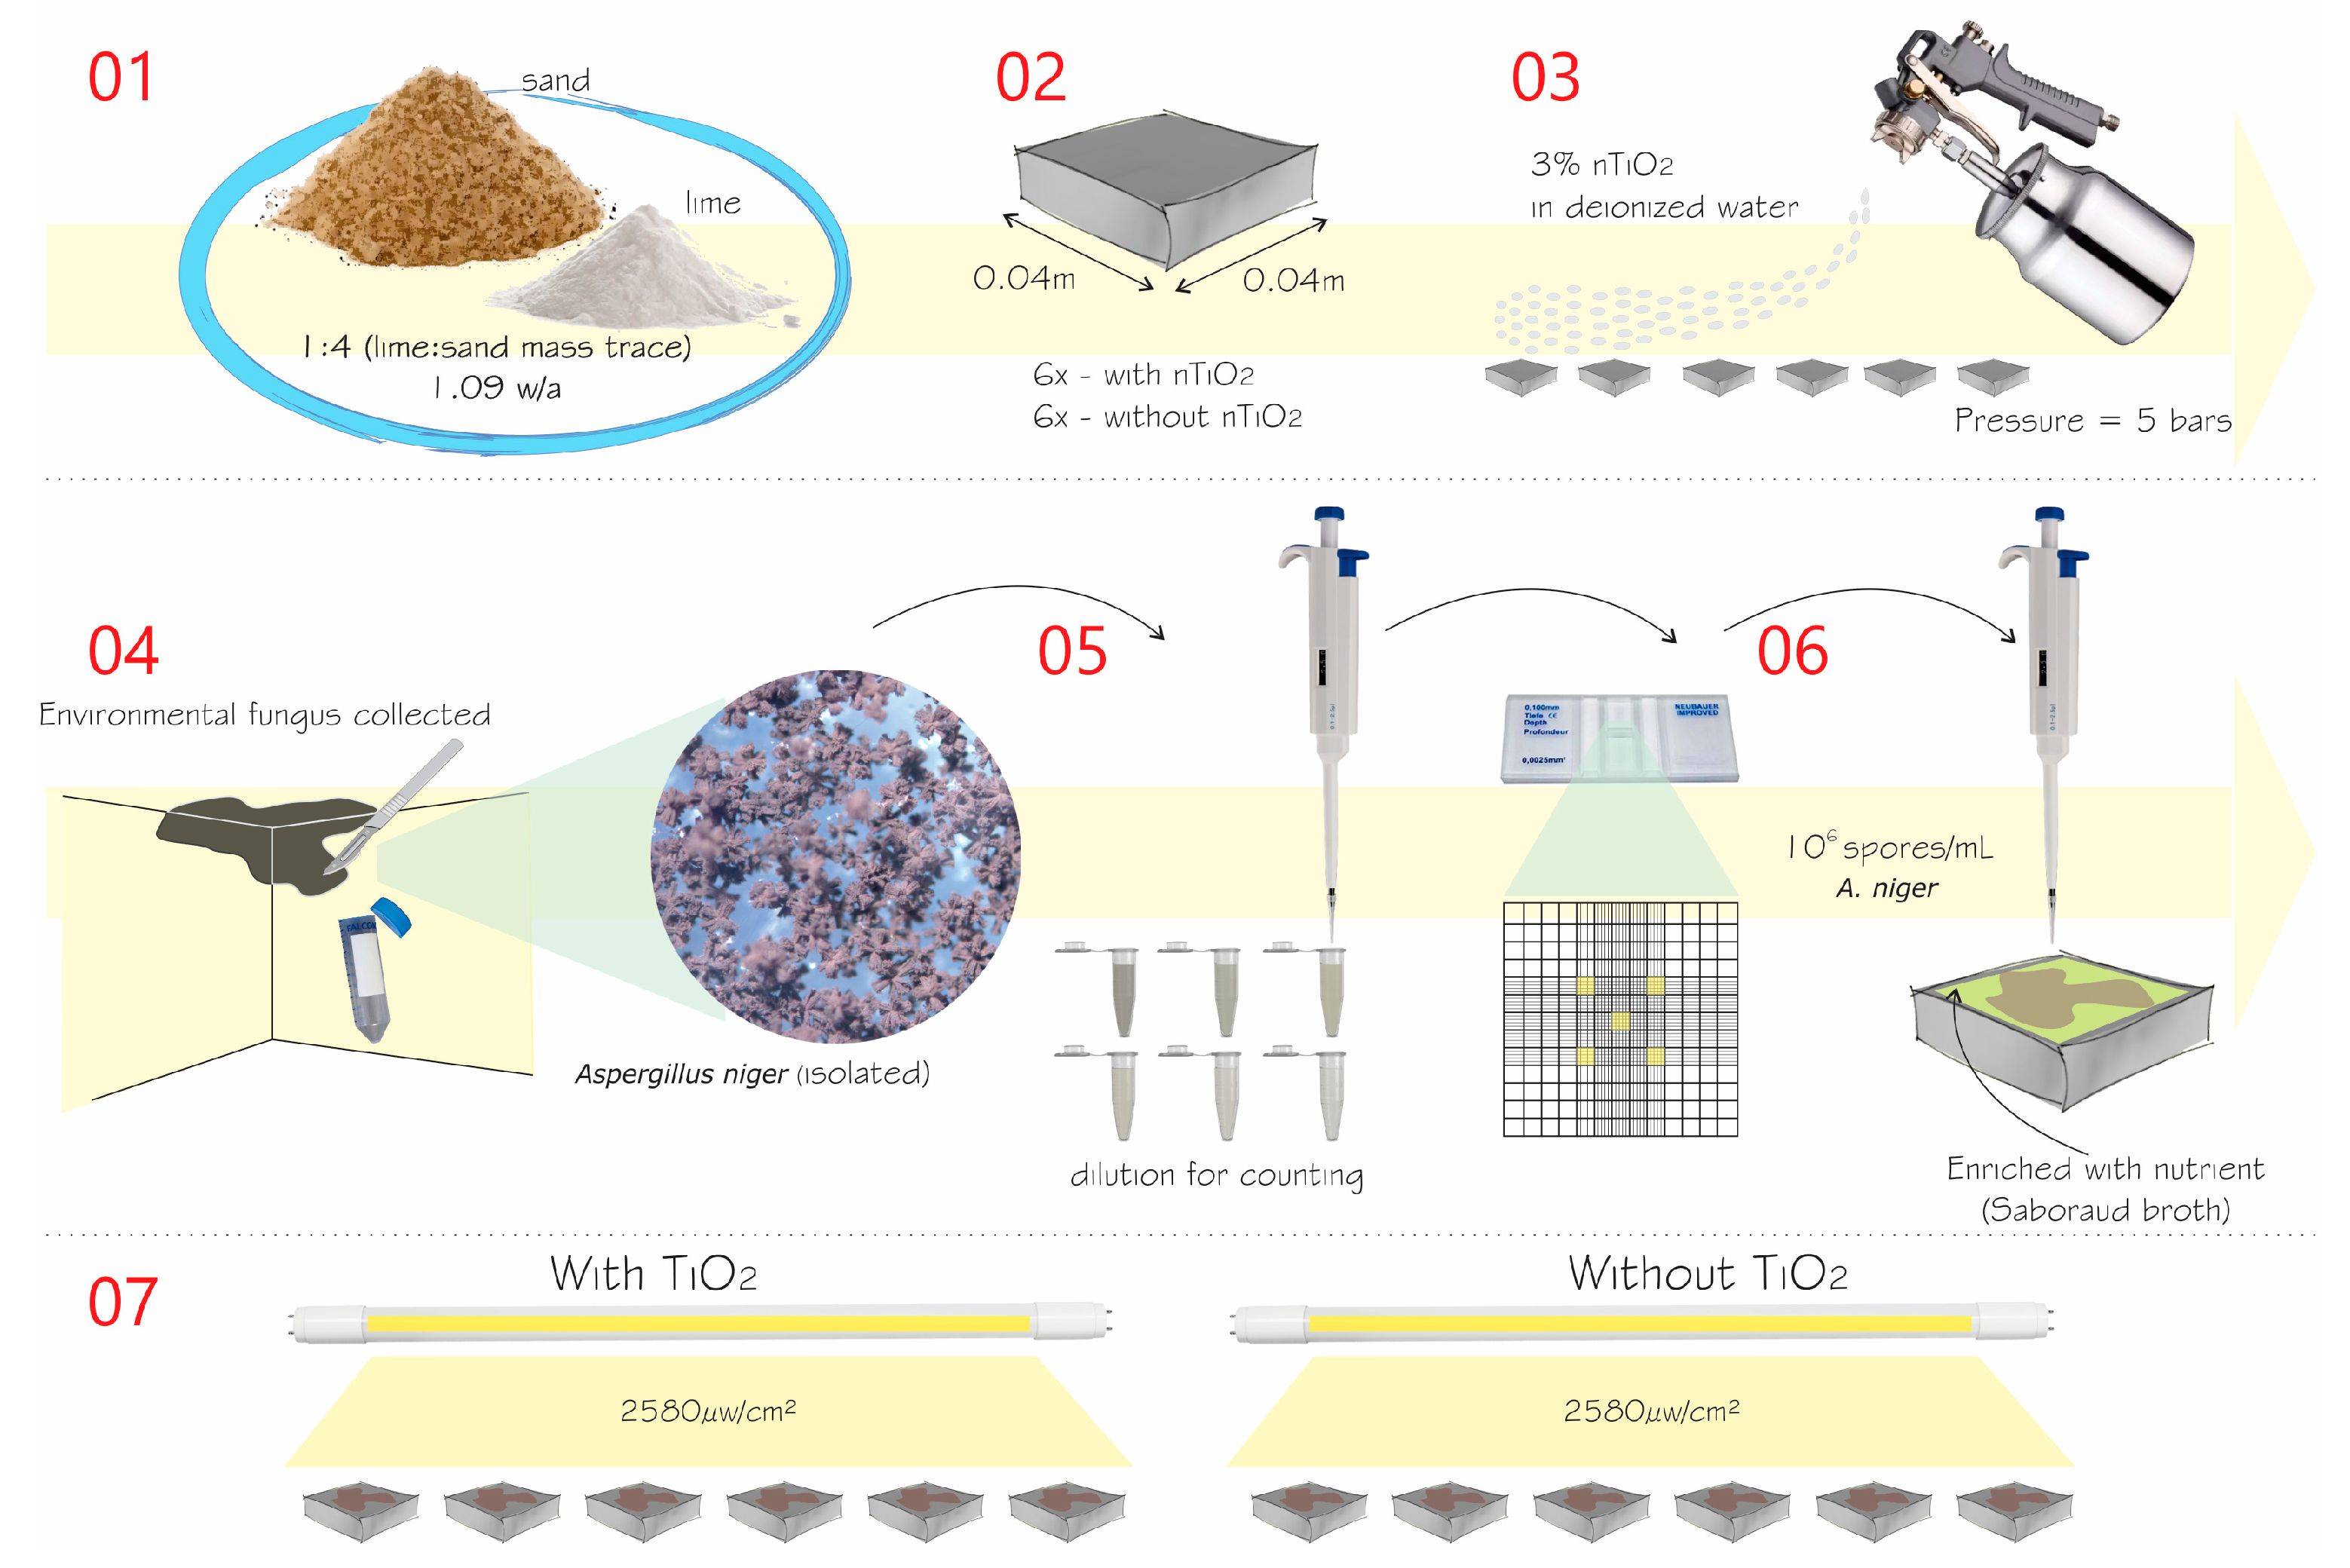
2.1. Fungi and Preparation of the Spore Suspension
2.2. Experimental Design
2.3. Molding and Curing the Mortar Samples, and Application of nTiO2
2.4. Instrumentation of the Biochemical Oxygen Demand (BOD) Incubator and Disposition of the Samples
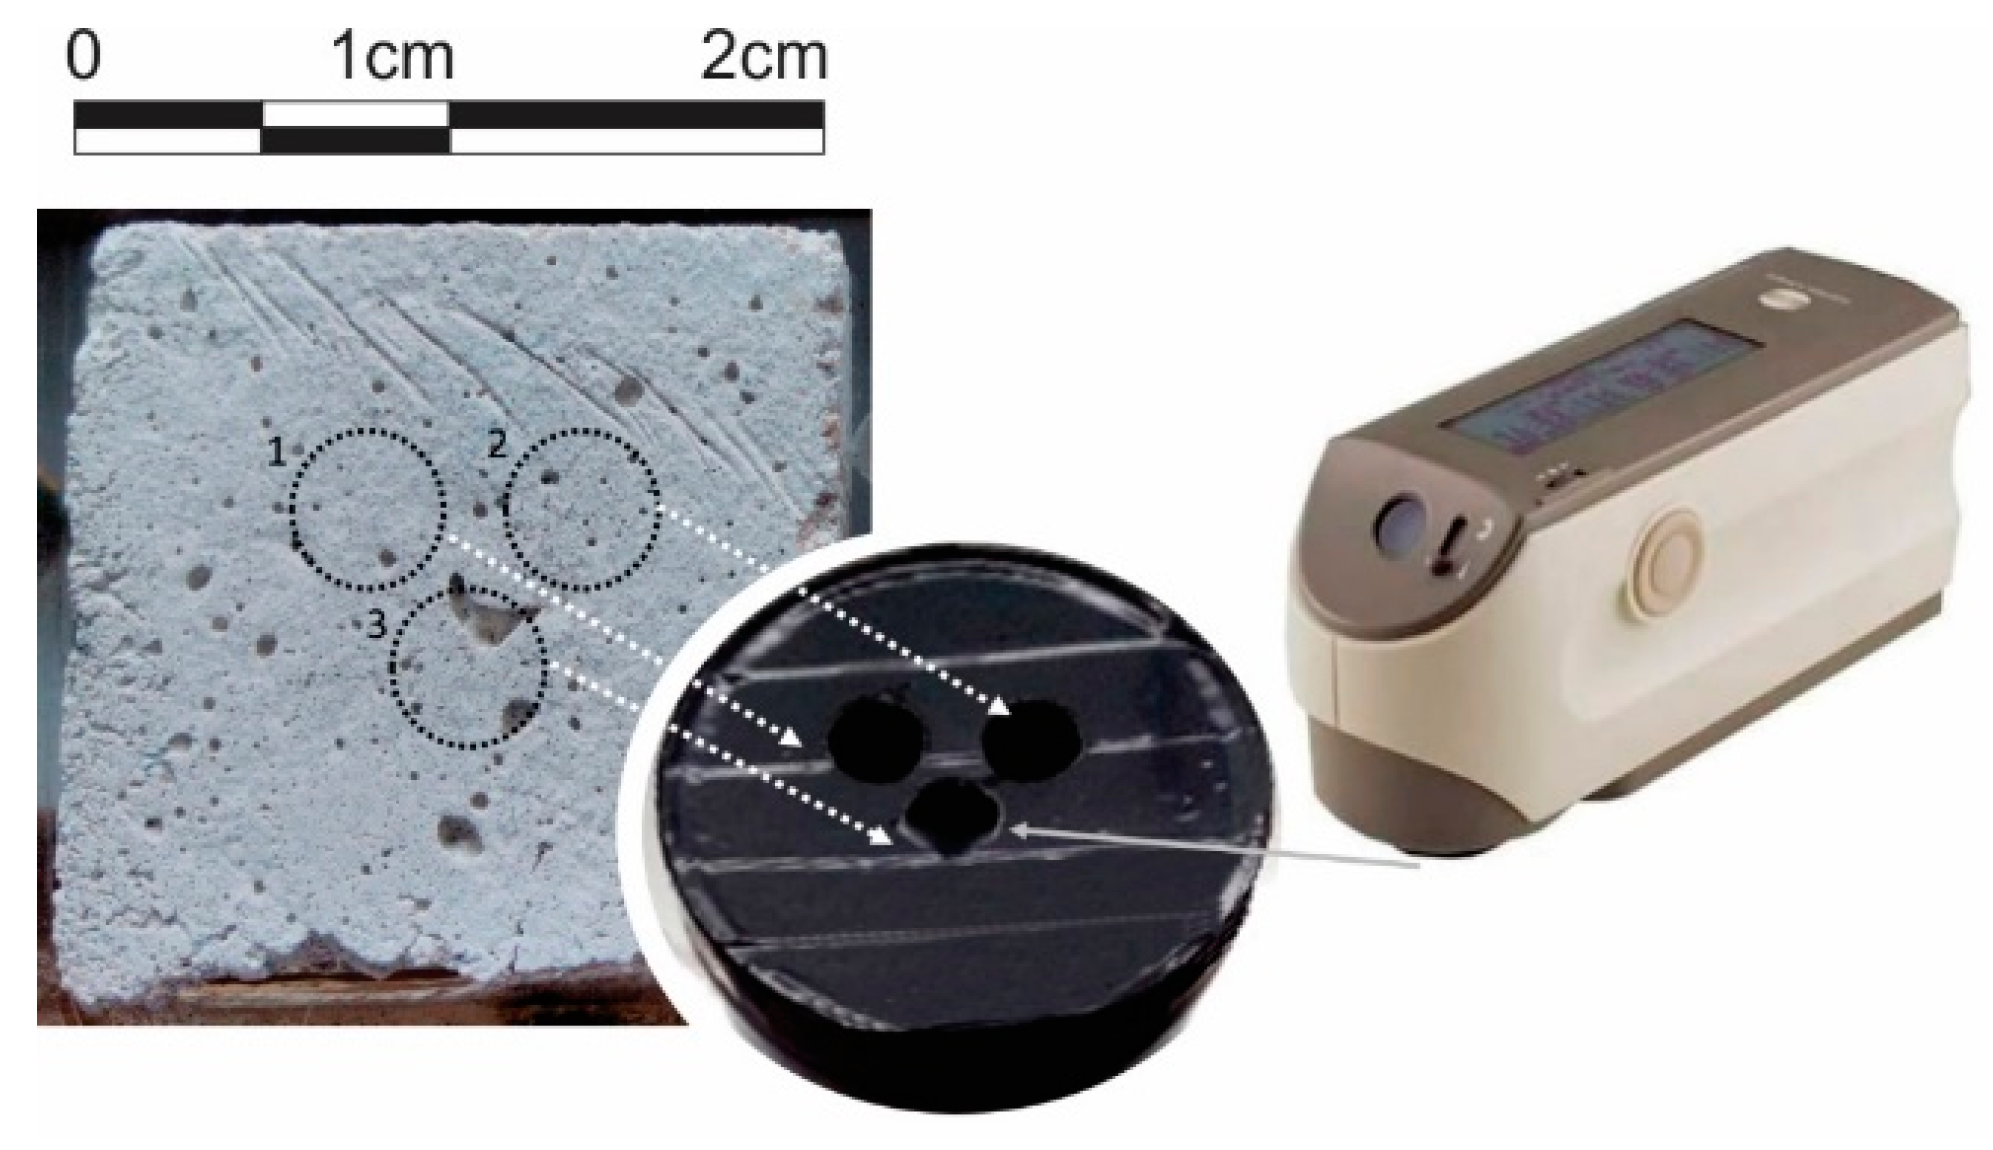
2.5. Analysis of the Samples’ Light Coordinates with a Spectrophotometer
- L* corresponds to luminosity;
- a* corresponds to the coordinates of the colors red/green, with “+a” indicating red and “-a” indicating green;
- b* corresponds to the coordinates of the colors yellow/blue, with “+b” indicating yellow and “-b” indicating blue.
- ΔE = color variation over time
- ΔL* = Lt* − L0*
- Δa* = at* − a0*
- Δb* = bt* − b0*
- t = final time
- 0 = initial time.
2.6. Analysis of the Photographic Images
2.7. Analysis on Stereoscopic Magnifier
3. Results and Discussion
3.1. Microclimate Monitoring in the BOD
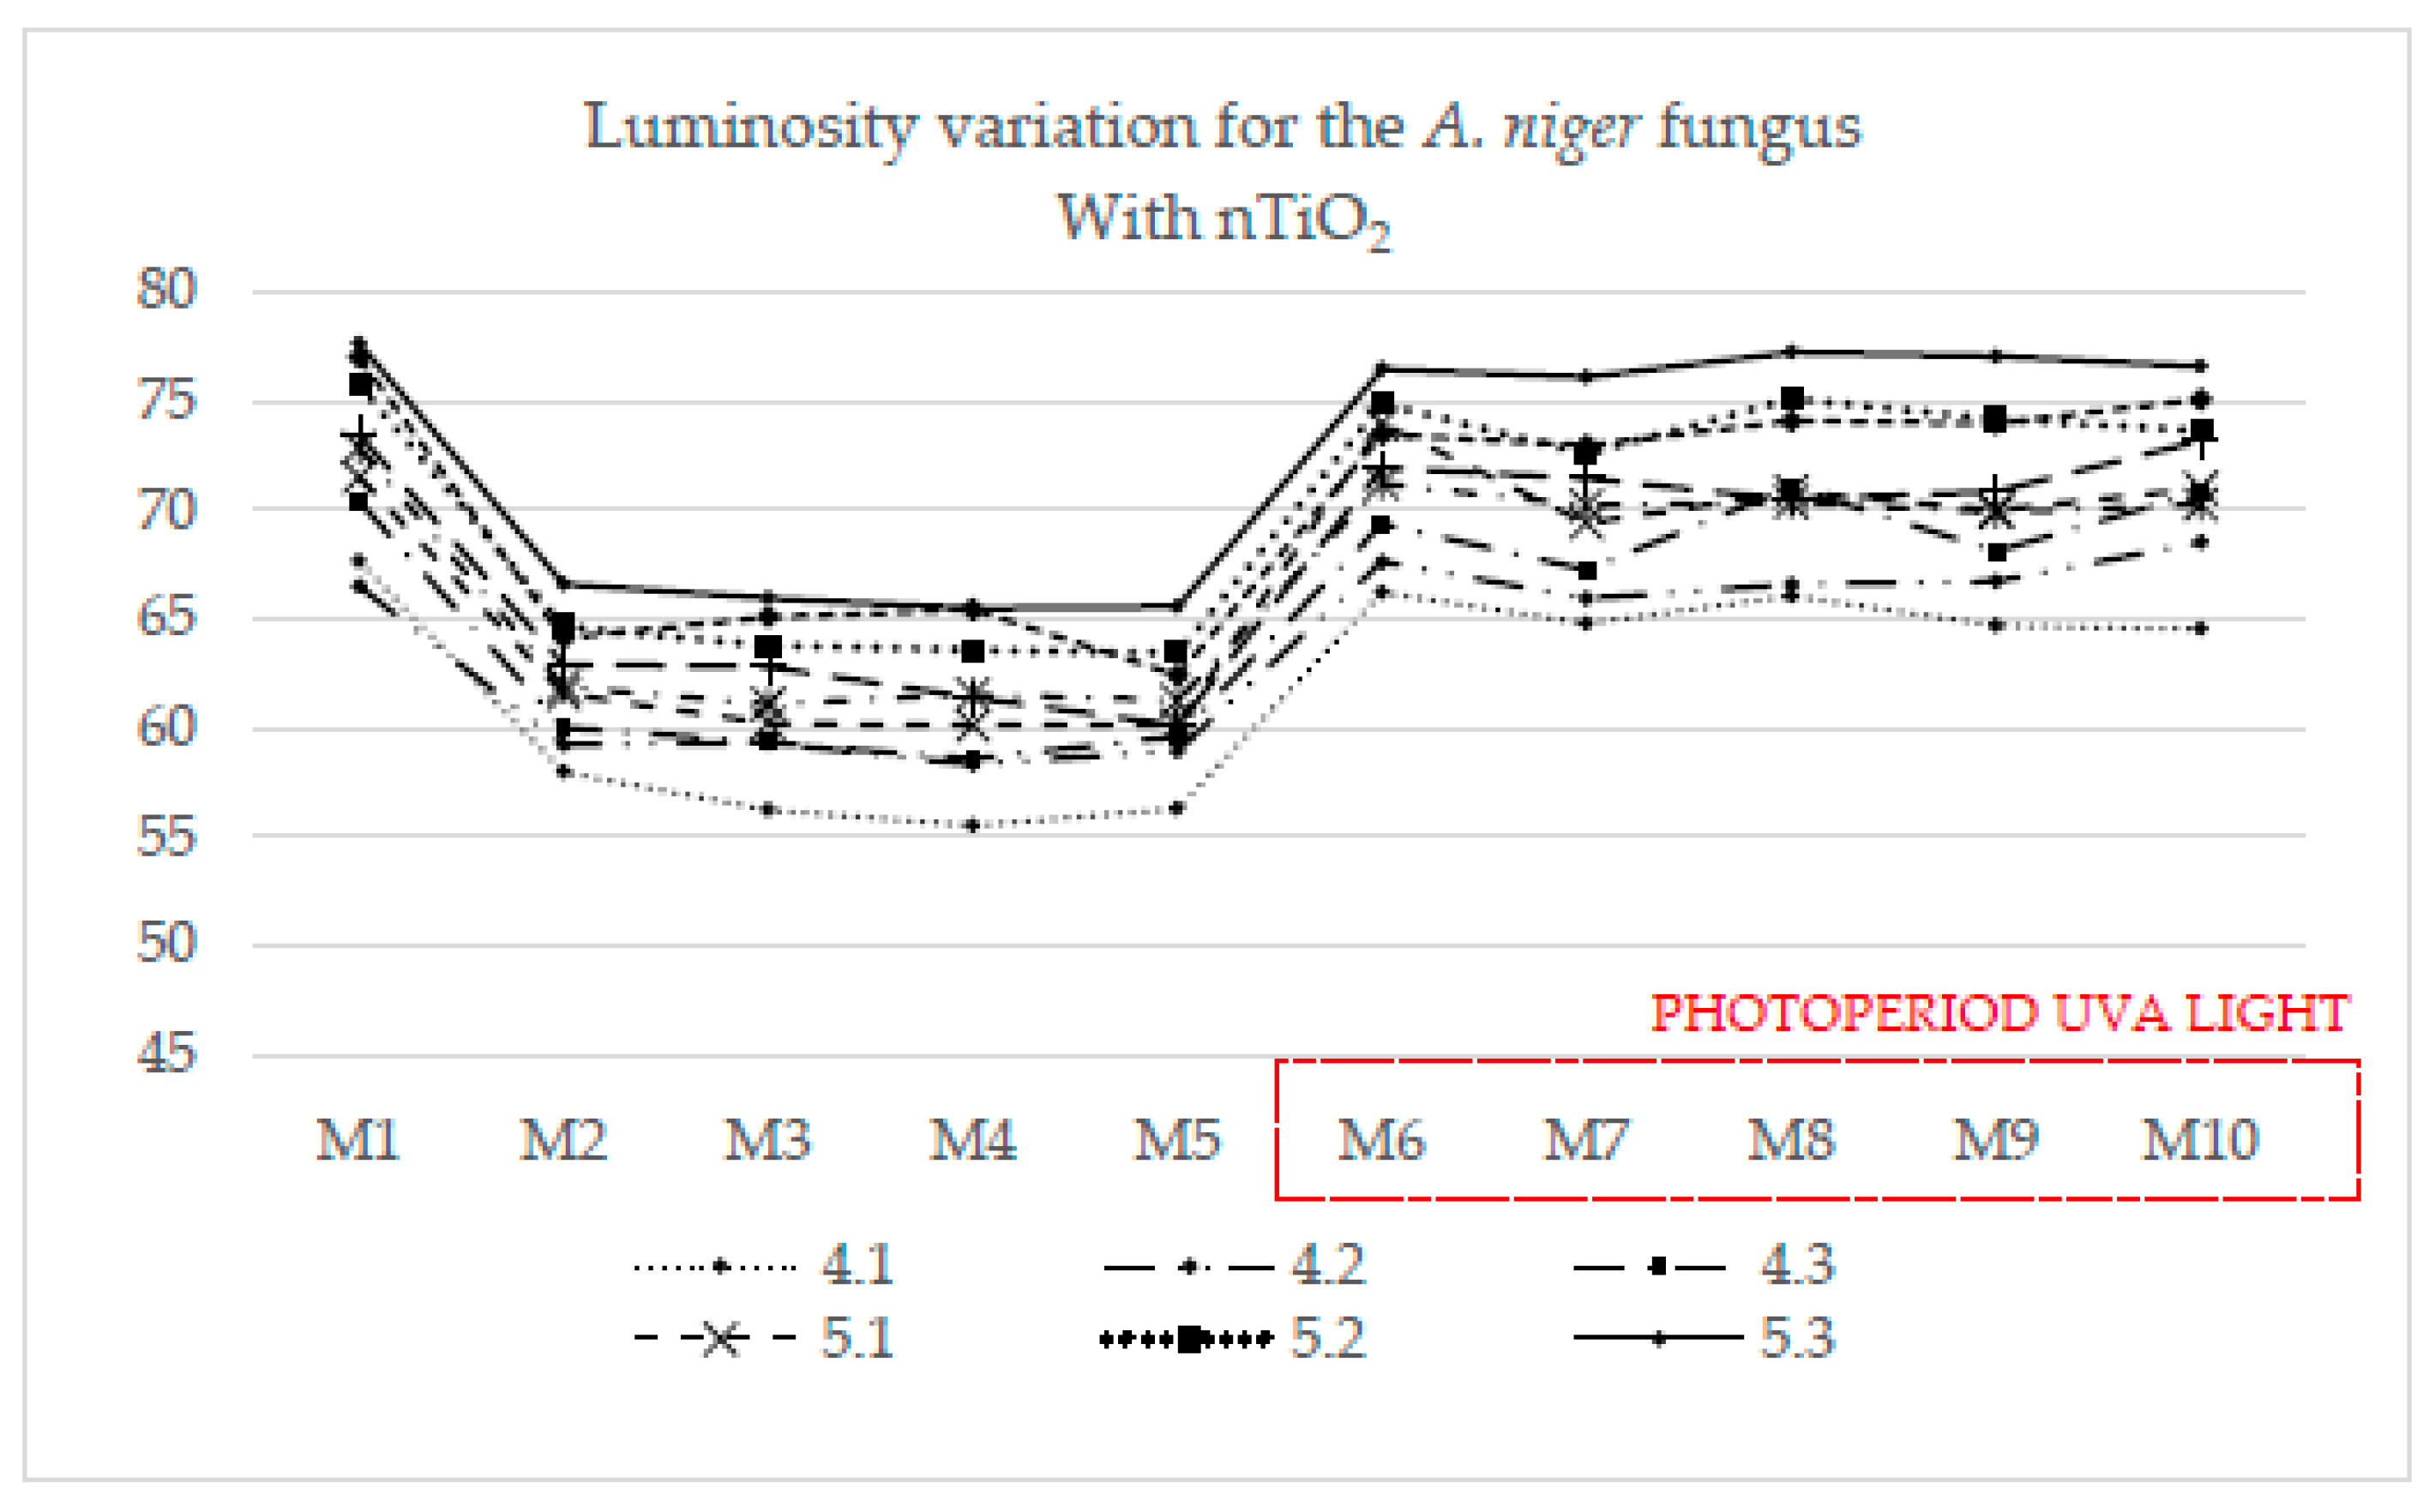
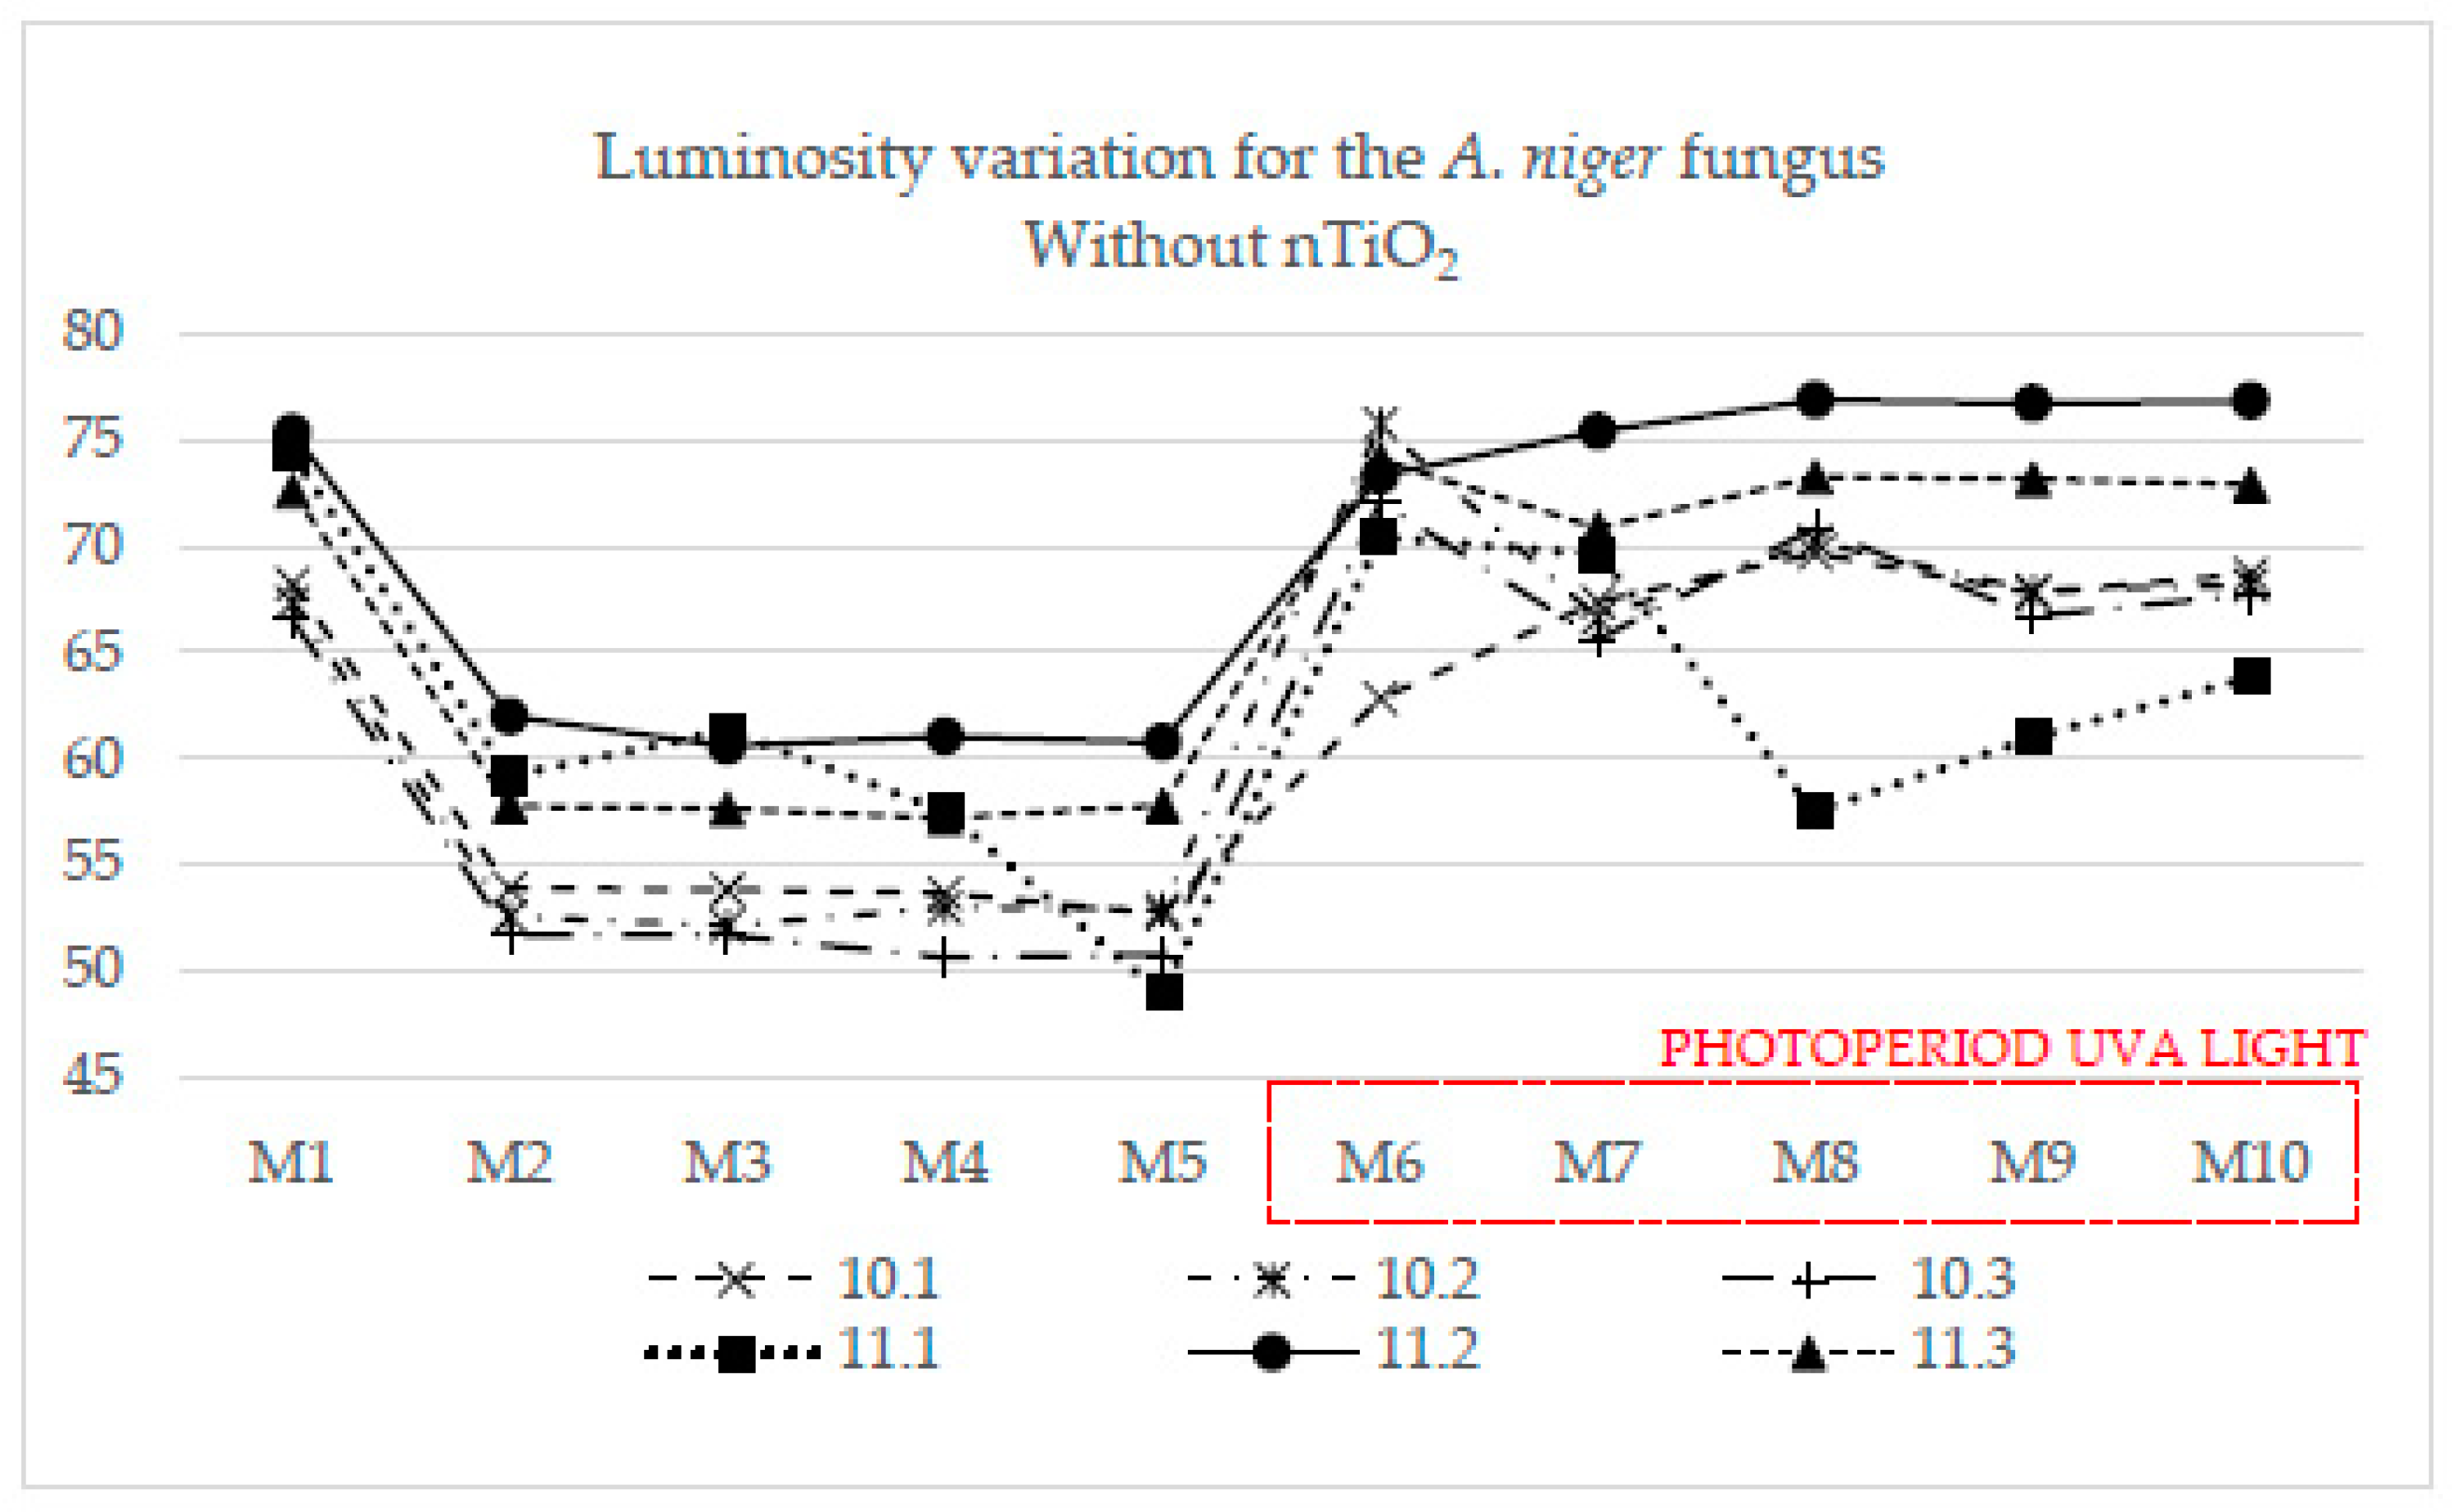
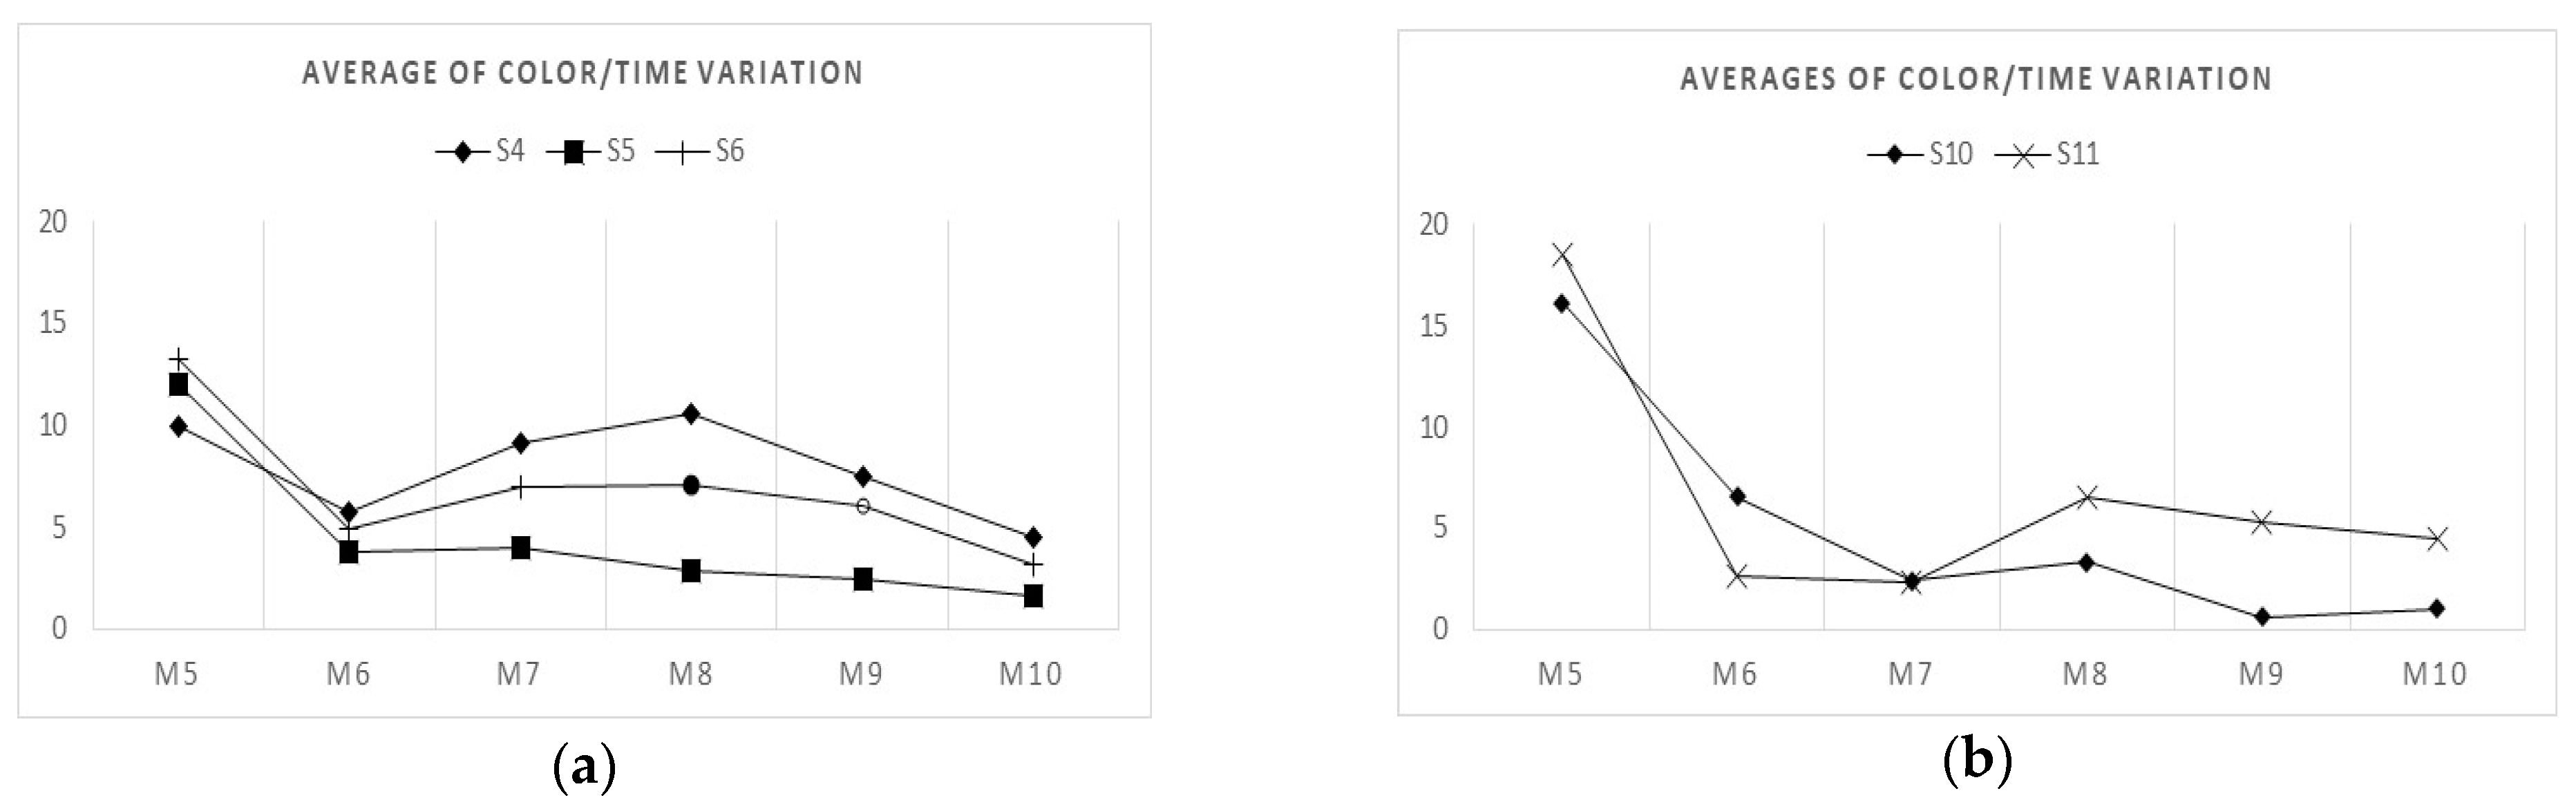
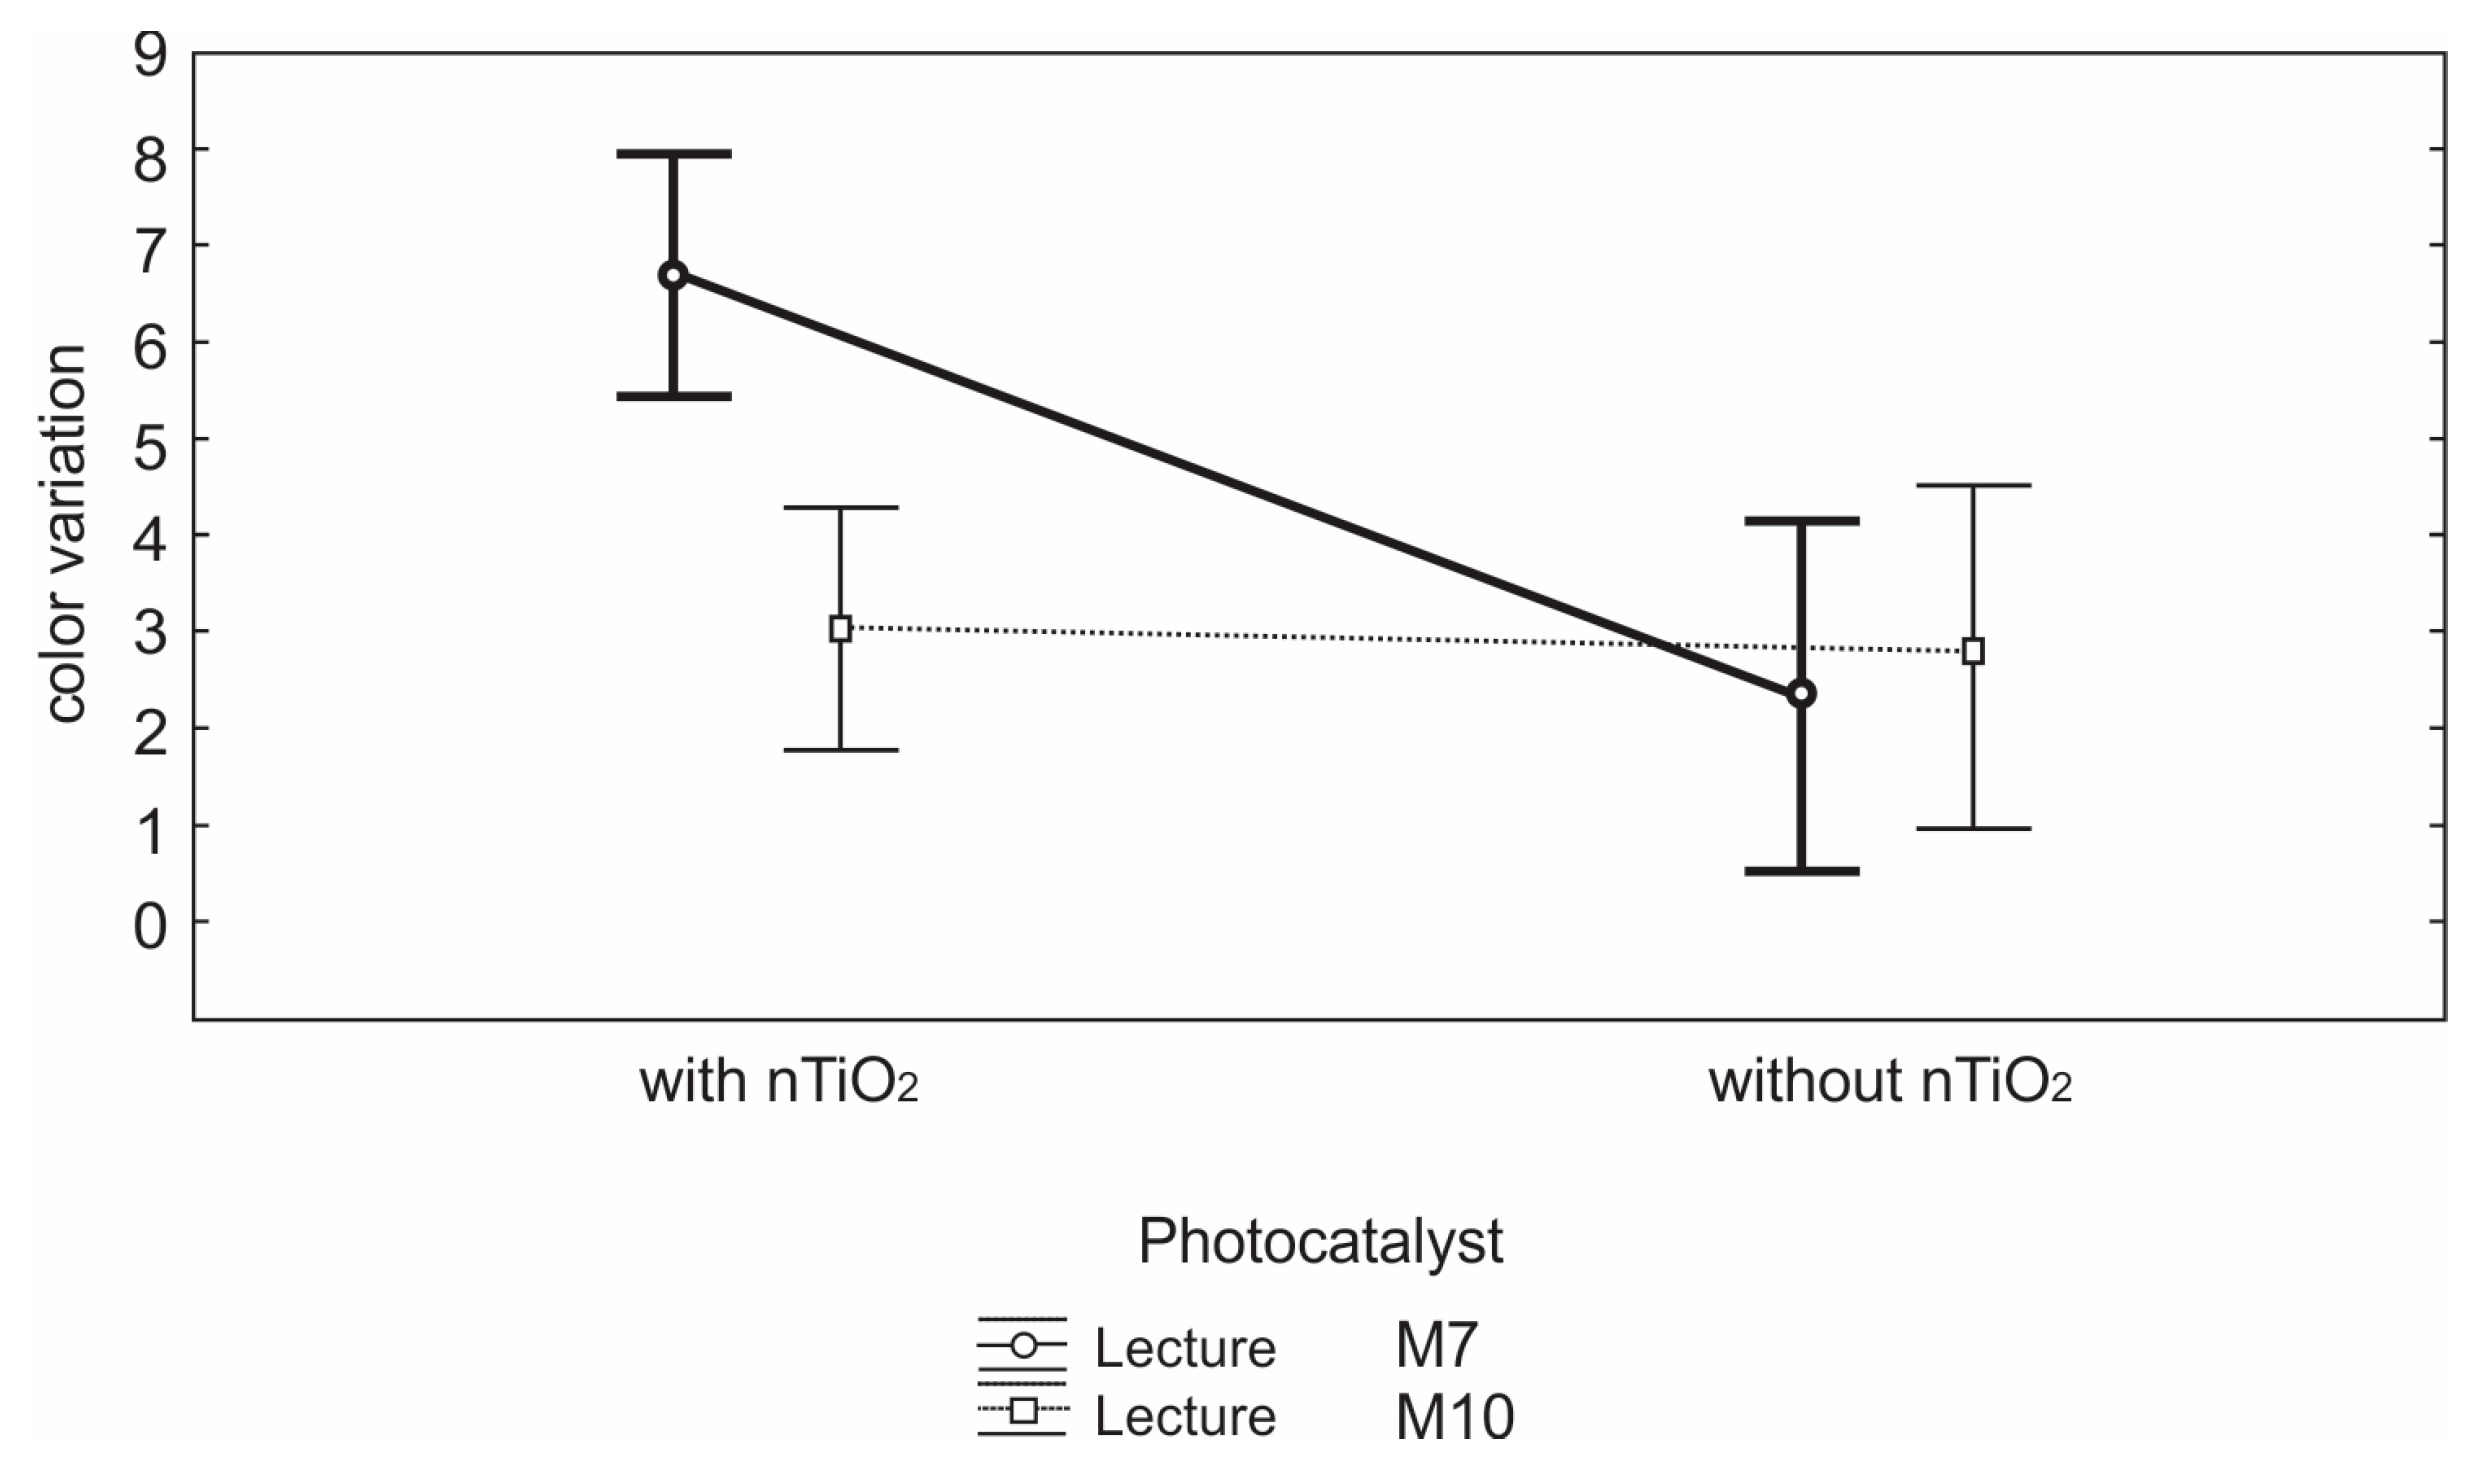
3.2. Color Variation in the Samples Inoculated with A. niger
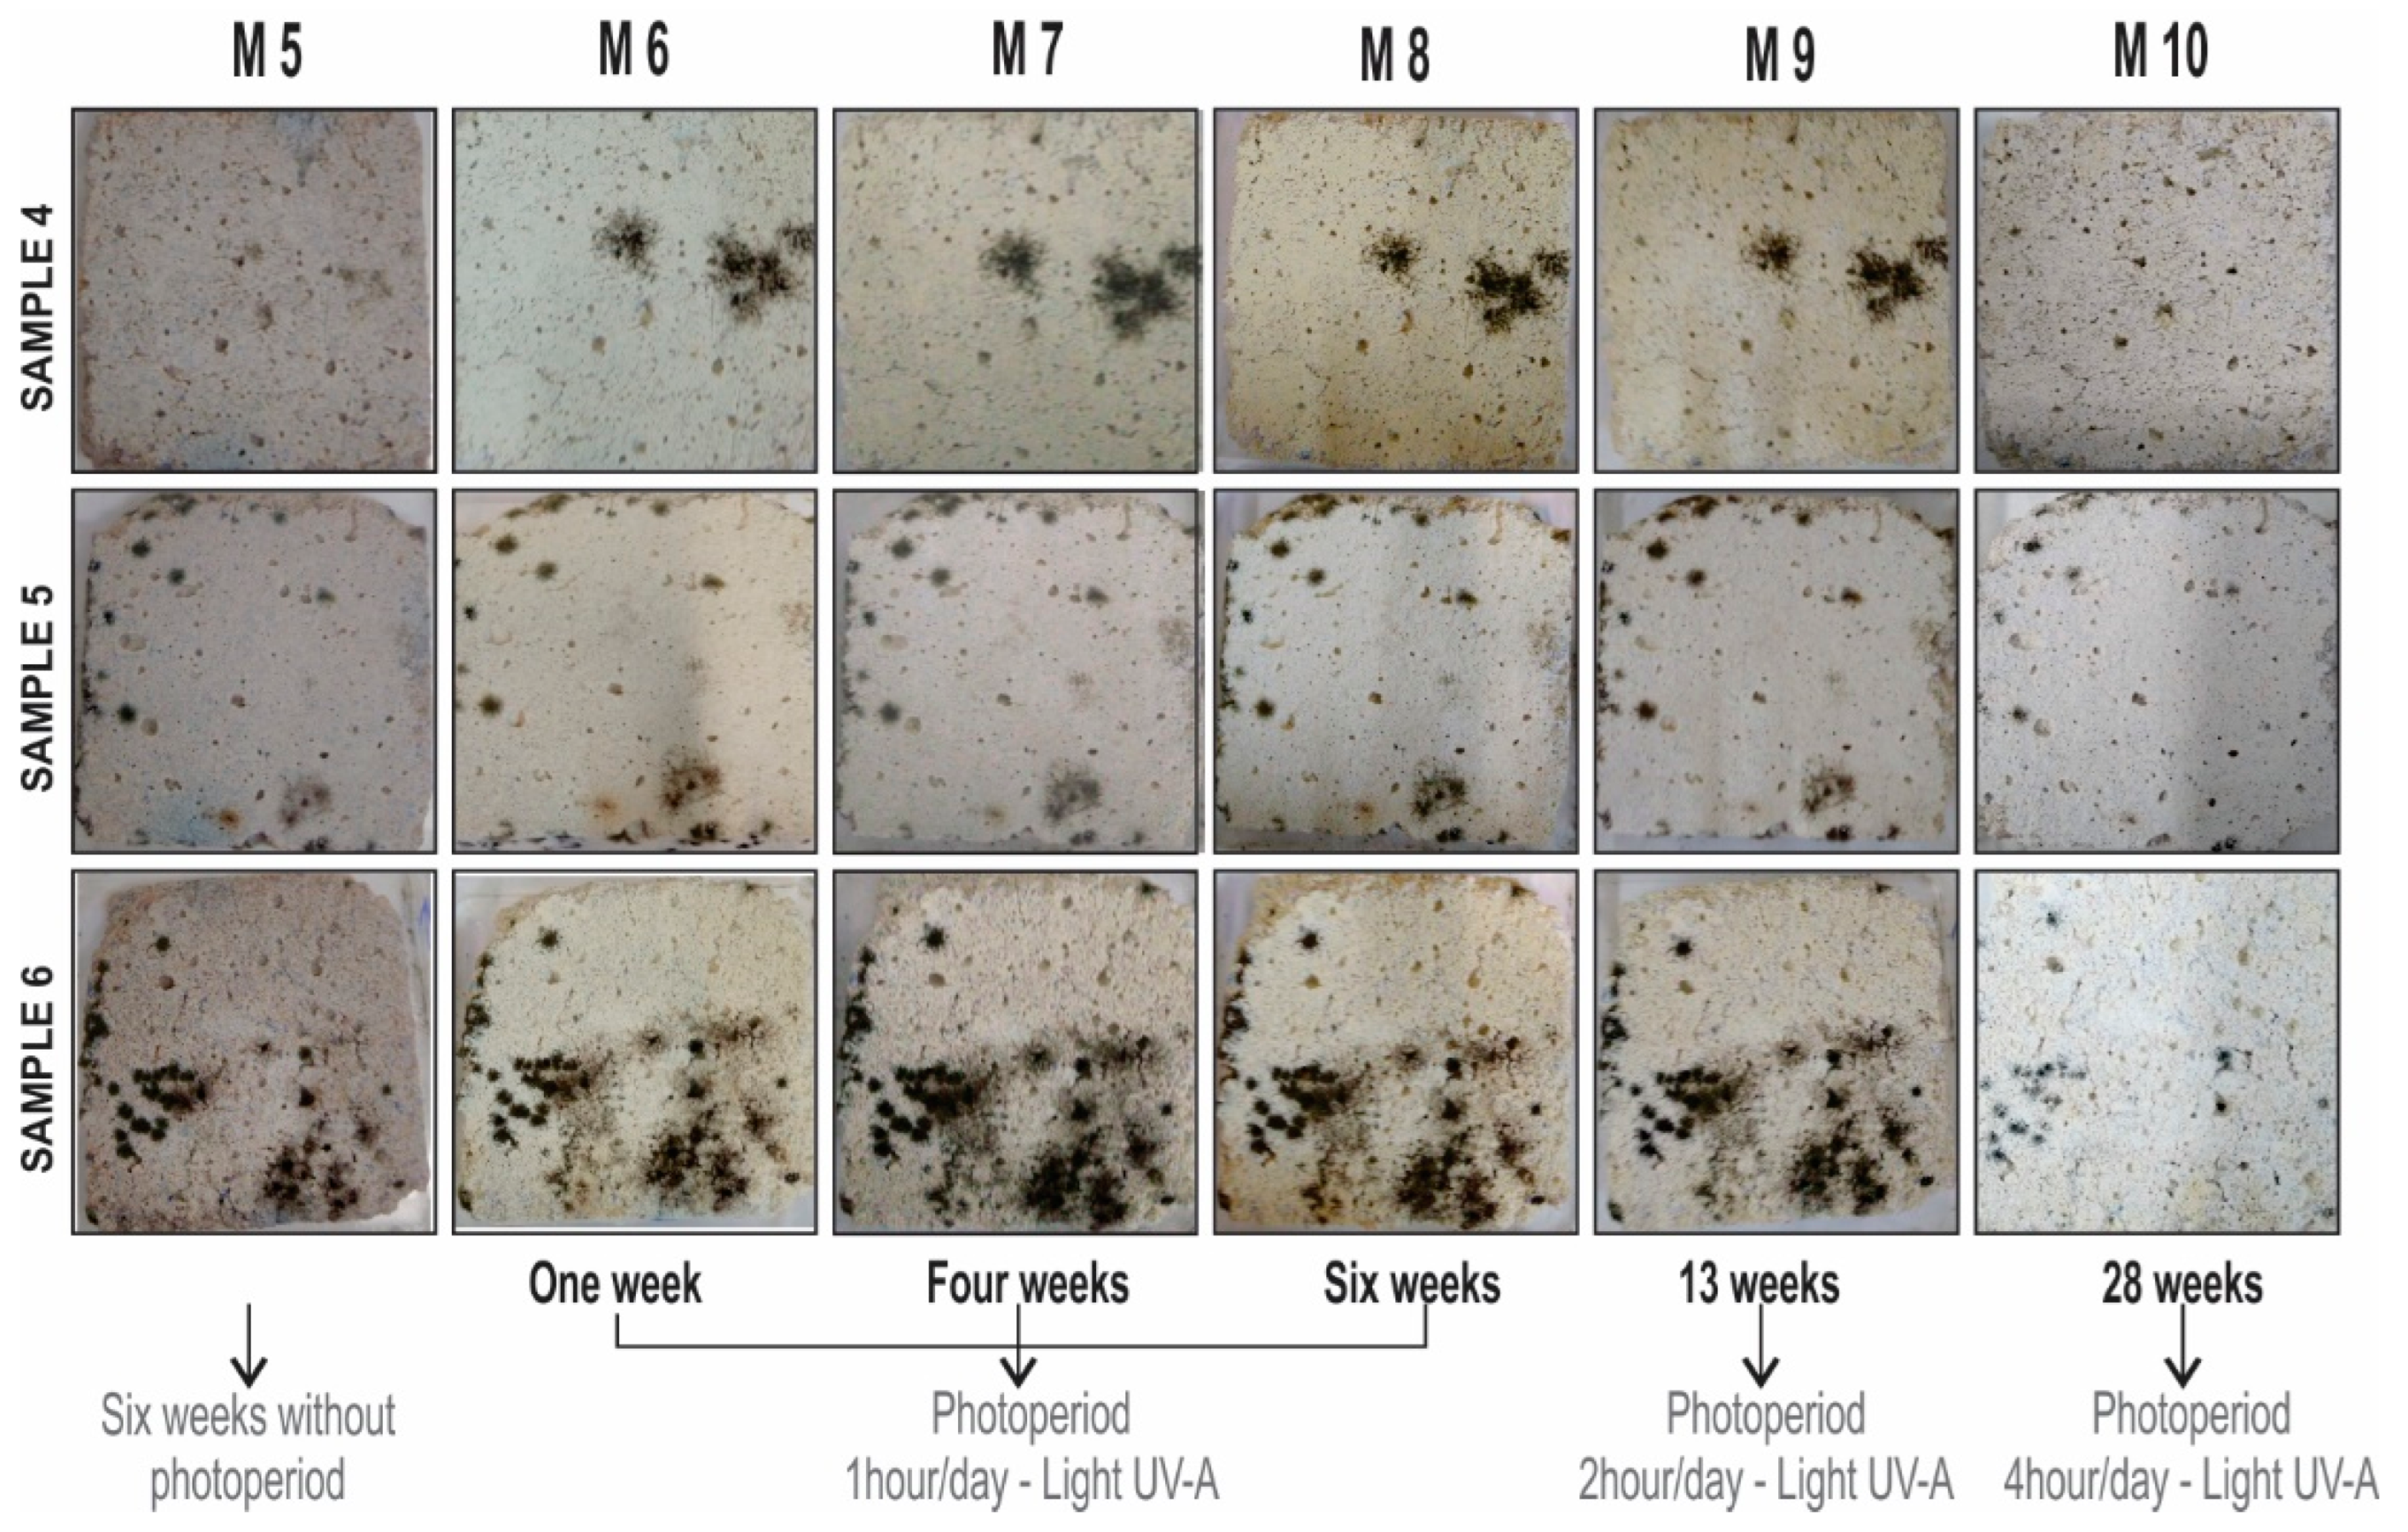
3.3. Image Analyses
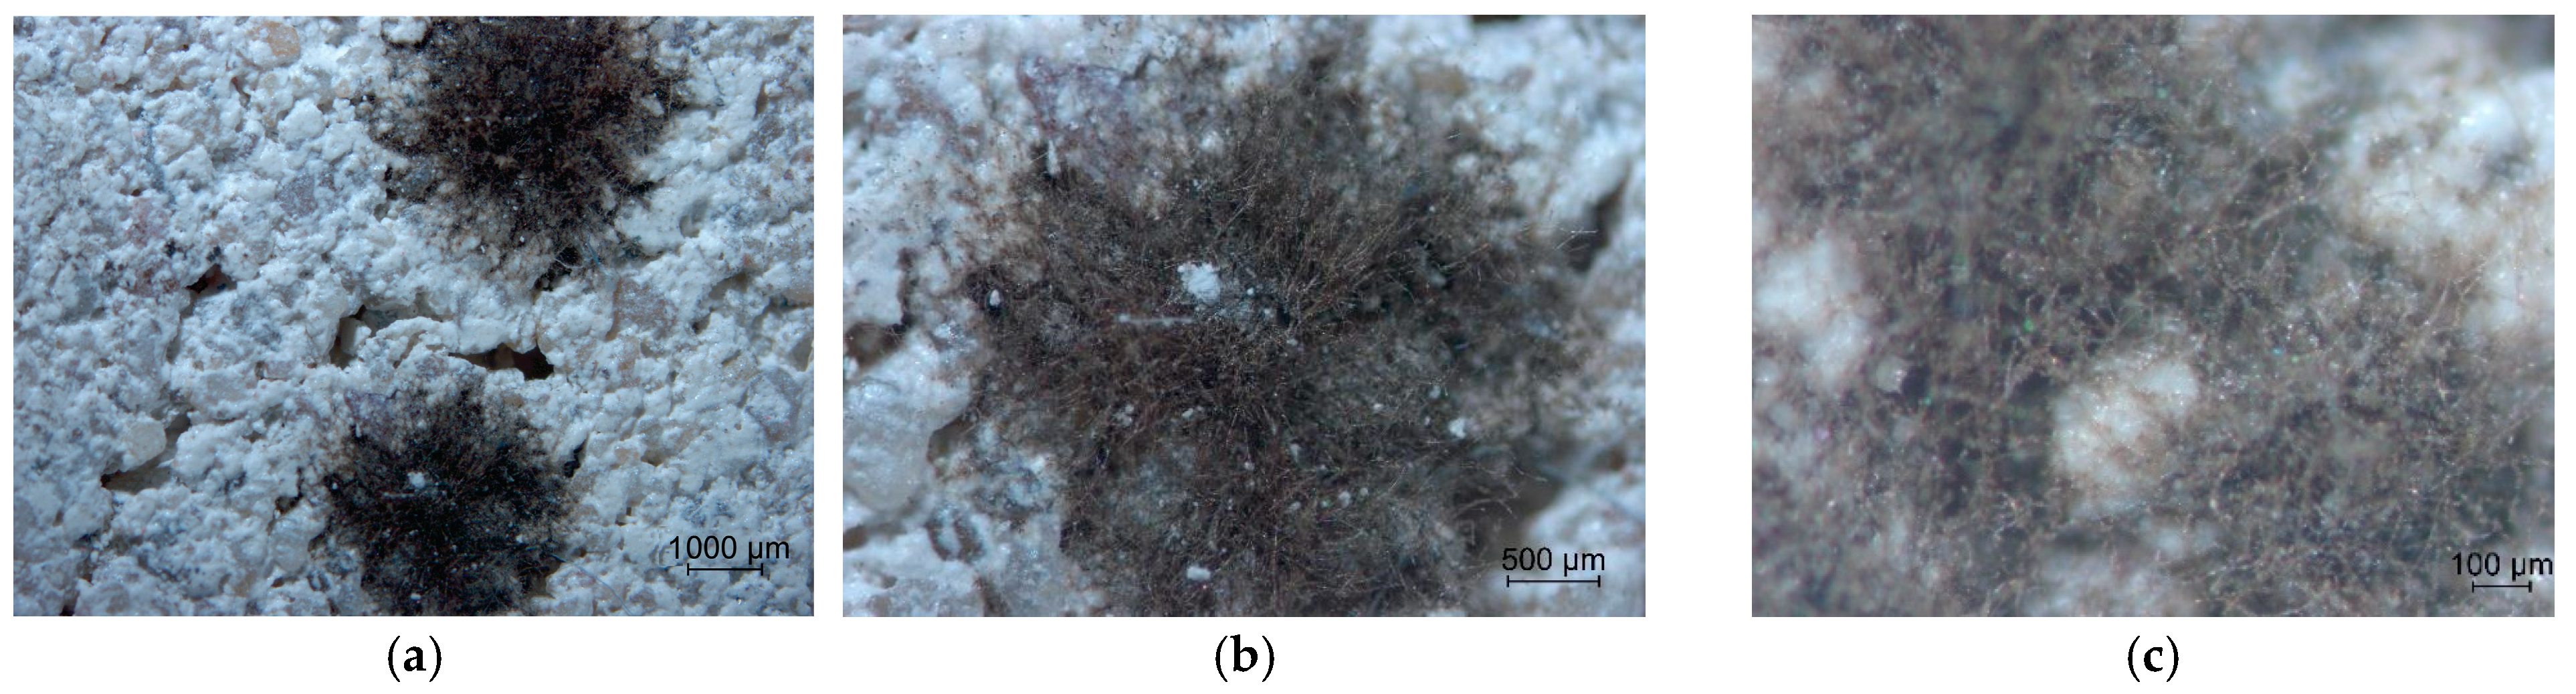
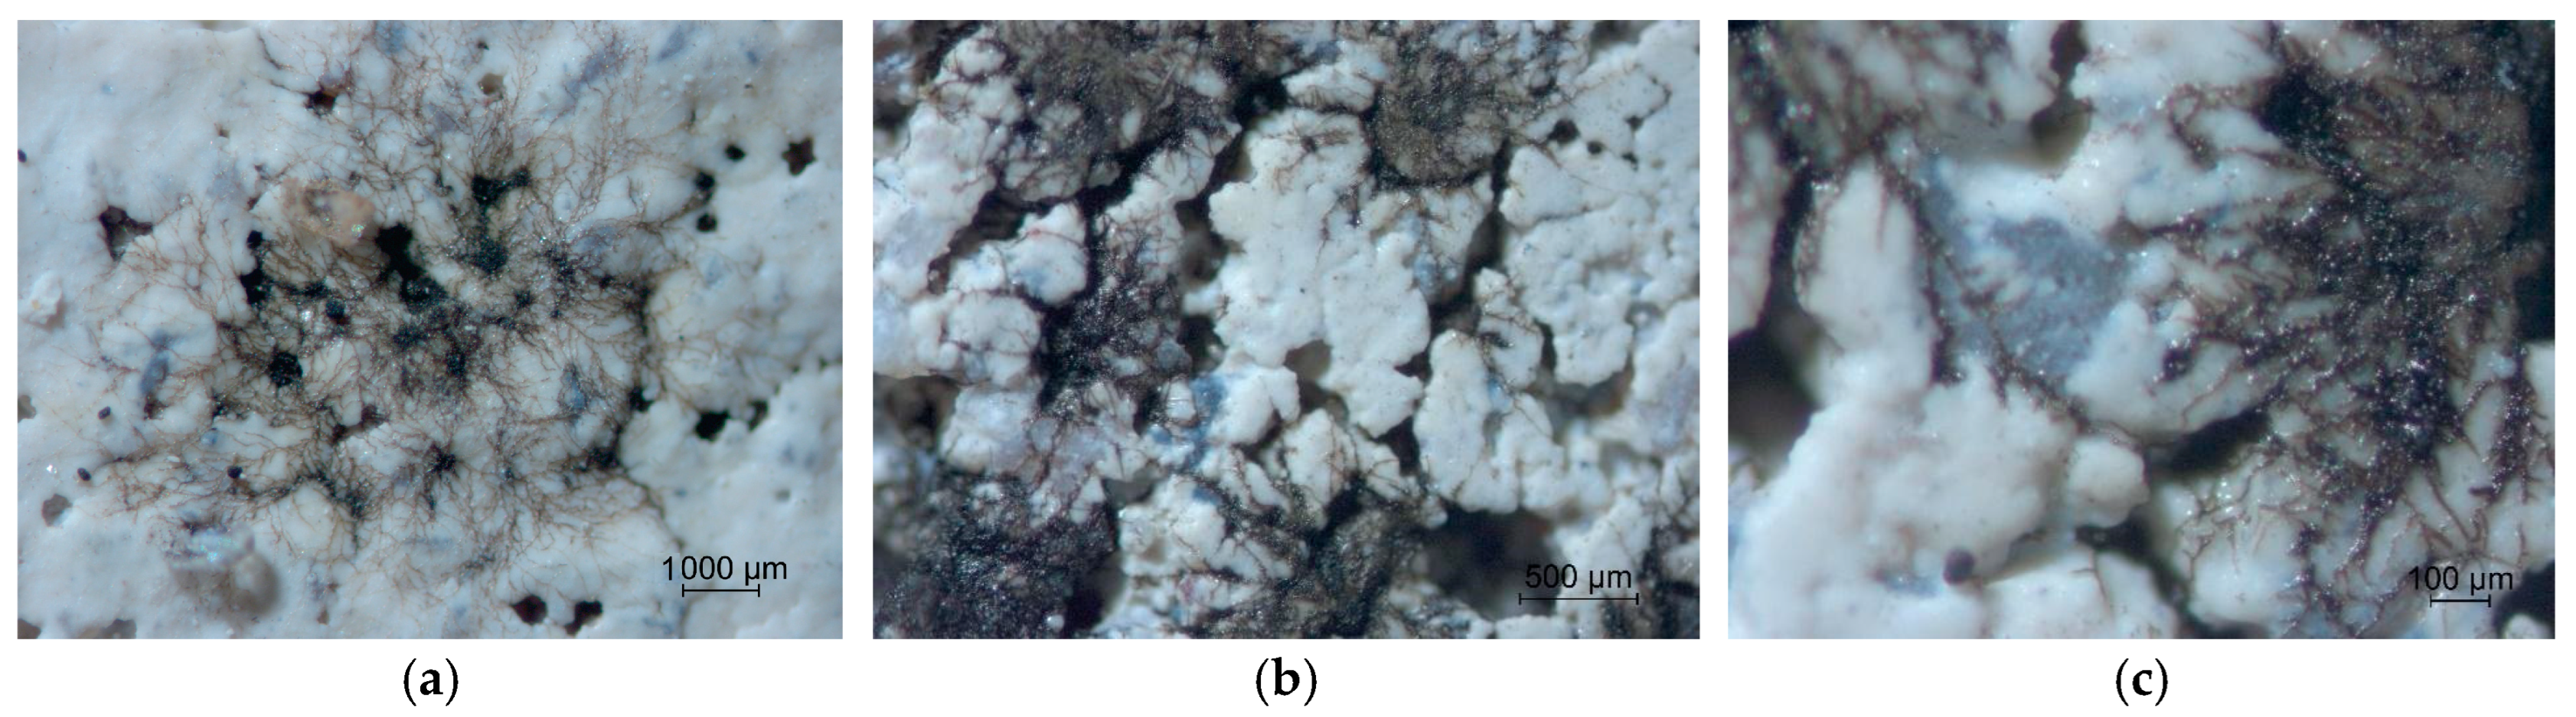
3.4. Images in the Stereoscopic Magnifier
4. Conclusions
- When performing controlled tests in Biological Oxygen Demand (BOD), it is crucially important to control the RH and the temperature as to minimum, medium, and maximum values for spore germination and growth of the mycelium of the fungal isolate under investigation, so as to allow its adequate growth and the subsequent evaluation of the effectiveness of the photocatalyst under study;
- Although the spectrophotometer readings are efficient at quantitatively determining the color variation and luminosity of the samples over time, they are still limited when it is necessary to predetermine the reading points, since fungal growth occurs in a non-uniform/heterogenous manner, according to the samples’ surface features;
- The readings performed with the spectrophotometer allowed the verification of effectiveness of nTiO2 against the A. niger fungus regarding reduction of growth and clearing the staining on mortar samples exposed to UVA light with a daily photoperiod of 4 h during seven months, after the colonies’ growth had been established; however, considering the reduced number of samples, more studies may help confirm the behavior;
- The quantification of the reduction in the staining area through counting the number of pixels in the samples’ images showed there was a reduction of up to 100% in the staining in the samples sprayed with nTiO2;
- It was observed that the previous application of nTiO2 on the mortar samples may have been responsible for alterations in the morphology of the A. niger fungus structures, evidence of a disturbance in the growth of the colonies or even their reduction over time.
Supplementary Materials
Author Contributions
Funding
Data Availability Statement
Acknowledgments
Conflicts of Interest
References
- Arıoglu, N.; Acun, S.Ã. A Research about a Method for Restoration of Traditional Lime Mortars and Plasters: A Staging System Approach. Build. Environ. 2006, 41, 1223–1230. [Google Scholar] [CrossRef]
- Veniale, F.; Setti, M.; Lodola, S. Diagnosing Stone Decay in Built Heritage. Facts and Perspectives. Mater. Constr. 2008, 58, 11–32. [Google Scholar] [CrossRef]
- Loureiro, A.M.S.; da Paz, S.P.A.; do Rosário Veiga, M.; Angélica, R.S. Investigation of Historical Mortars from Belém Do Pará, Northern Brazil. Constr. Build. Mater. 2020, 233, 117284. [Google Scholar] [CrossRef]
- Sena da Fonseca, B.; Ferreira Pinto, A.P.; Vaz Silva, D. Compositional and Textural Characterization of Historical Bedding Mortars from Rubble Stone Masonries: Contribution for the Design of Compatible Repair Mortars. Constr. Build. Mater. 2020, 247, 118627. [Google Scholar] [CrossRef]
- Ponce-Antón, G.; Arizzi, A.; Zuluaga, M.C.; Cultrone, G.; Ortega, L.A.; Mauleon, J.A. Mineralogical, Textural and Physical Characterisation to Determine Deterioration Susceptibility of Irulegi Castle Lime Mortars (Navarre, Spain). Materials 2019, 12, 584. [Google Scholar] [CrossRef] [PubMed]
- Garg, K.L.; Jain, K.K.; Mishra, A.K. Role of Fungi in the Deterioration of Wall Paintings. Sci. Total Environ. 1995, 167, 255–271. [Google Scholar] [CrossRef]
- Rodríguez-González, V.; Obregón, S.; Patrón-Soberano, O.A.; Terashima, C.; Fujishima, A. An Approach to the Photocatalytic Mechanism in the TiO2-Nanomaterials Microorganism Interface for the Control of Infectious Processes. Int. Biodeterior. Biodegrad. 2020, 270, 118853. [Google Scholar] [CrossRef]
- Kirthika, S.K.; Goel, G.; Matthews, A.; Goel, S. Review of the Untapped Potentials of Antimicrobial Materials in the Construction Sector. Prog. Mater. Sci. 2023, 133, 101065. [Google Scholar] [CrossRef]
- Jiang, L.; Pettitt, T.R.; Buenfeld, N.; Smith, S.R. A Critical Review of the Physiological, Ecological, Physical and Chemical Factors Influencing the Microbial Degradation of Concrete by Fungi. Build. Environ. 2022, 214, 108925. [Google Scholar] [CrossRef]
- Beimforde, C. Biodeterioration (of Stone). In Encyclopedia of Geobiology; Reitner, J., Thiel, V., Eds.; Springer: Dordrecht, The Netherland, 2011; pp. 112–117. [Google Scholar] [CrossRef]
- Harding, M.W.; Marques, L.L.R.; Howard, R.J.; Olson, M.E. Can Filamentous Fungi Form Biofilms? Trends Microbiol. 2009, 17, 475–480. [Google Scholar] [CrossRef]
- Burford, E.P.; Fomina, M.; Gadd, G.M. Fungal Involvement in Bioweathering and Biotransformation of Rocks and Minerals. Mineral. Mag. 2003, 67, 1127–1155. [Google Scholar] [CrossRef]
- Verrecchia, E. Pedogenic Carbonates. In Encyclopedia of Geobiology; Reitner, J., Thiel, V., Eds.; Springer: Dordrecht, The Netherland, 2011; pp. 721–725. [Google Scholar] [CrossRef]
- Borrego, S.; Guiamet, P.; Gómez, S.; Saravia, D.; Batistini, P.; Garcia, M.; Lavin, P.; Perdomo, I. The Quality of Air at Archives and the Biodeterioration of Photographs. Int. Biodeterior. Biodegrad. 2010, 64, 139–145. [Google Scholar] [CrossRef]
- Wei, S.; Jiang, Z.; Liu, H.; Zhou, D.; Sanchez-Silva, M. Microbiologically Induced Deterioration of Concrete: A Review. Braz. J. Microbiol. 2013, 44, 1001–1007. [Google Scholar] [CrossRef] [PubMed]
- Coffin, M.; Lent, T.; Sabella, S.; Vallette, J.; Walsh, B.; Dickinson, M.; Drake, S.; Guenther, R.; Richter, M. Understanding Antimicrobial Ingredients in Building Materials. 2017. Available online: https://healthybuilding.net/reports/4-healthy-environments-understanding-antimicrobial-ingredients-in-building-materials (accessed on 30 October 2023).
- Liu, G.; Li, G.; Qiu, X.; Li, L. Synthesis of ZnO/Titanate Nanocomposites with Highly Photocatalytic Activity under Visible Light Irradiation. J. Alloys Compd. 2009, 481, 492–497. [Google Scholar] [CrossRef]
- Dei, L.; Salvadori, B. Nanotechnology in Cultural Heritage Conservation: Nanometric Slaked Lime Saves Architectonic and Artistic Surfaces from Decay. J. Cult. Herit. 2006, 7, 110–115. [Google Scholar] [CrossRef]
- Paramés, J.R.R. Nanotecnologias Na Indústria Da Construção. Master’s Thesis, Universidade Técnica de Lisboa, Lisboa, Portugal, 2008. [Google Scholar]
- Ruffolo, S.A.; La Russa, M.F.; Malagodi, M.; Oliviero Rossi, C.; Palermo, A.M.; Crisci, G.M. ZnO and ZnTiO3 Nanopowders for Antimicrobial Stone Coating. Appl. Phys. A Mater. Sci. Process. 2010, 100, 829–834. [Google Scholar] [CrossRef]
- Di Simoni, I. Nanomateriali per Il Restauro Arqchitettonico: Stato Dell’arte e Prospettive. Bachelor’s Thesis, Università di Bologna, Bologna, Italia, 2012. [Google Scholar]
- Gutarowska, B.; Skora, J.; Zduniak, K.; Rembisz, D. Analysis of the Sensitivity of Microorganisms Contaminating Museums and Archives to Silver Nanoparticles. Int. Biodeterior. Biodegrad. 2012, 68, 7–17. [Google Scholar] [CrossRef]
- Lucas, S.S.; Ferreira, V.M.; De Aguiar, J.L.B. Incorporation of Titanium Dioxide Nanoparticles in Mortars—Influence of Microstructure in the Hardened State Properties and Photocatalytic Activity. Cem. Concr. Res. 2013, 43, 112–120. [Google Scholar] [CrossRef]
- Shirakawa, M.A.; Werle, A.P.; Gaylarde, C.C.; Loh, K.; John, V. Effect of Microbial Growth on Reflectance of Roofing Tiles. In Proceedings of the Biodeterioration & Biodegradation in Latin America LABS 8; Bento, F.M., Hidalgo, G.E.N., Gaylarde, C.C., Shirakawa, M.A., Camargo, F.A.O., Eds.; Editora Evangraf Ltda.: Porto Alegre, Brazil, 2014; pp. 10–13. [Google Scholar]
- Munafò, P.; Quagliarini, E.; Goffredo, G.B.; Bondioli, F.; Licciulli, A. Durability of Nano-Engineered TiO2 Self-Cleaning Treatments on Limestone. Constr. Build. Mater. 2014, 65, 218–231. [Google Scholar] [CrossRef]
- Calia, A.; Lettieri, M.; Masieri, M. Durability Assessment of Nanostructured TiO2 Coatings Applied on Limestones to Enhance Building Surface with Self-Cleaning Ability. Build. Environ. 2016, 110, 1–10. [Google Scholar] [CrossRef]
- Fujishima, A.; Zhang, X.; Tryk, D.A. TiO2 Photocatalysis and Related Surface Phenomena. Surf. Sci. Rep. 2008, 63, 515–582. [Google Scholar] [CrossRef]
- Pozo-Antonio, J.S.; Dionísio, A. Physical-Mechanical Properties of Mortars with Addition of TiO2 Nanoparticles. Constr. Build. Mater. 2017, 148, 261–272. [Google Scholar] [CrossRef]
- La Russa, M.F.; Macchia, A.; Ruffolo, S.A.; De Leo, F.; Barberio, M.; Barone, P.; Crisci, G.M.; Urzì, C. Testing the Antibacterial Activity of Doped TiO2 for Preventing Biodeterioration of Cultural Heritage Building Materials. Int. Biodeterior. Biodegrad. 2014, 96, 87–96. [Google Scholar] [CrossRef]
- Janczarek, M.; Klapiszewski, Ł.; Jędrzejczak, P.; Klapiszewska, I.; Ślosarczyk, A.; Jesionowski, T. Progress of Functionalized TiO2-Based Nanomaterials in the Construction Industry: A Comprehensive Review. Chem. Eng. J. 2022, 430, 132062. [Google Scholar] [CrossRef]
- Casarin, R.P.; Bersch, J.D.; Maia, J.; Masuero, A.B.; Dal Molin, D.C.C. Assessment of Photocatalytic Nano-TiO2 Mortars’ Behavior When Exposed to Simulated Indoor Conditions of Glazed Buildings. Buildings 2023, 13, 2250. [Google Scholar] [CrossRef]
- Jędrzejczak, P.; Janczarek, M.; Parus, A.; Gapiński, B.; Hotěk, P.; Fiala, L.; Jesionowski, T.; Ślosarczyk, A.; Černý, R.; Klapiszewski, Ł. Carbon-Modified TiO2 as a Promising and Efficient Admixture for Cementitious Composites: A Comprehensive Study of Photocatalytic, Mechanical and Structural Properties. J. Build. Eng. 2023, 78, 107747. [Google Scholar] [CrossRef]
- Castro-Hoyos, A.M.; Rojas Manzano, M.A.; Maury-Ramírez, A. Challenges and Opportunities of Using Titanium Dioxide Photocatalysis on Cement-Based Materials. Coatings 2022, 12, 968. [Google Scholar] [CrossRef]
- Guerra, F.L.; Lopes, W.; Cazarolli, J.C.; Lobato, M.; Masuero, A.B.; Dal Molin, D.C.C.; Bento, F.M.; Schrank, A.; Vainstein, M.H. Biodeterioration of Mortar Coating in Historical Buildings: Microclimatic Characterization, Material, and Fungal Community. Build. Environ. 2019, 155, 195–209. [Google Scholar] [CrossRef]
- Kaur, S.; Singh, S. Biofilm Formation by Aspergillus Fumigatus. Med. Mycol. 2014, 52, 2–9. [Google Scholar] [CrossRef] [PubMed]
- NBR 13276; Argamassa Para Assentamento e Revestimento de Paredes e Tetos―Determinação Do Índice de Consistência. Associação Brasileira de Normas Técnicas: Rio de Janeiro, Brazil, 2016.
- NBR 13278; Argamassa Para Assentamento e Revestimento de Paredes e Tetos Determinação da Densidade de Massa e Do Teor de Ar Incorporado. Associação Brasileira de Normas Técnicas: Rio de Janeiro, Brazil, 2005.
- NBR 13279; Argamassa Para Assentamento e Revestimento de Paredes e Tetos Determinação Da Resistência à Tração Na Flexão e à Compressão. Associação Brasileira de Normas Técnicas: Rio de Janeiro, Brazil, 2005.
- NBR 15259; Argamassa Para Assentamento e Revestimento de Paredes e Tetos Determinação da Absorção de Água Por Capilaridade e Do Coeficiente de Capilaridade. Associação Brasileira de Normas Técnicas: Rio de Janeiro, Brazil, 2005.
- NBR 15630; Argamassa Para Assentamento e Revestimento de Paredes e Tetos—Determinação Do Módulo de Elasticidade Dinâmico Através da Propagação de Onda Ultra-Sônica. Associação Brasileira de Normas Técnicas: Rio de Janeiro, Brazil, 2008.
- NBR 13280; Argamassa Para Assentamento e Revestimento de Paredes e Tetos Determinação da Densidade de Massa Aparente No Estado Endurecido. Associação Brasileira de Normas Técnicas: Rio de Janeiro, Brazil, 2005.
- Shirakawa, M.A.; Cincotto, M.A.; Gambale, W. Padronização de Teste Acelerado Para a Avaliação Da Resistência de Argamassas de Revestimento de Interiores Ao Crescimento de Fungos. In Proceedings of the III Simpósio Brasileiro de Tecnologia das Argamassas, Vitória, Brazil, 22–23 April 1999. [Google Scholar]
- Shirakawa, M.A.; Beech, I.B.; Tapper, R.; Cincotto, M.A.; Gambale, W. The Development of a Method to Evaluate Bioreceptivity of Indoor Mortar Plastering to Fungal Growth. Int. Biodeterior. Biodegrad. 2003, 51, 83–92. [Google Scholar] [CrossRef]
- Austria, G. Argamassa Autolimpante Para Revestimento de Fachadas: O Efeito Das Propriedades Fotocatalíticas Do Dióxido de Titânio (TiO2). Master’s Thesis, Universidade Federal do Rio Grande do Sul (UFRGS), Porto Alegre, Brazil, 2015. [Google Scholar]
- Gherardi, F.; Colombo, A.; Goidanich, S.; Simonutti, R.; Toniolo, L. Innovative Nano-TiO2 Particles for Self-Cleaning Treatments of Historic Architecture and Sculptures. In Proceedings of the Hydrophobe VII: 7th International Conference on Water Repellent Treatement and Protective Surface Technology for Building Materials, Lisboa, Portugal, 11–12 September 2014; Charola, A.E., Rodrigues, J.D., Eds.; pp. 205–214. [Google Scholar]
- Goffredo, G.B.; Accoroni, S.; Totti, C.; Romagnoli, T.; Valentini, L.; Munafò, P. Titanium Dioxide Based Nanotreatments to Inhibit Microalgal Fouling on Building Stones Surfaces. Build. Environ. 2016, 112, 209–222. [Google Scholar] [CrossRef]
- Treviso, J.P. Avaliação Da Eficiência de Autolimpeza Em Argamassas e Pastas Contendo TiO2 Expostas Ao Microclima Urbano. Master’s Thesis, Universidade Federal do Rio Grande do Sul (UFRGS), Porto Alegre, Brazil, 2016. [Google Scholar]
- Vázquez-Nion, D.; Silva, B.; Prieto, B. Influence of the Properties of Granitic Rocks on Their Bioreceptivity to Subaerial Phototrophic Biofilms. Sci. Total Environ. 2018, 610–611, 44–54. [Google Scholar] [CrossRef] [PubMed]
- Ruot, B.; Plassais, A.; Olive, F.; Guillot, L.; Bonafous, L. TiO2-Containing Cement Pastes and Mortars: Measurements of the Photocatalytic Efficiency Using a Rhodamine B-Based Colourimetric Test. Sol. Energy 2009, 83, 1794–1801. [Google Scholar] [CrossRef]
- Schneider, C.A.; Rasband, W.S.; Eliceiri, K.W. NIH Image to ImageJ: 25 Years of Image Analysis. Nat. Methods 2012, 9, 671–675. [Google Scholar] [CrossRef]
- Sedlbauer, K. Prediction of Mould Growth by Hygrothermal Calculation. J. Therm. Envel. Build. Sci. 2002, 25, 321–336. [Google Scholar] [CrossRef]
- StatSoft, Inc. Statistica (Data Analysis Software System), 8th ed.; Statsoft Inc.: Tulsa, OK, USA, 2007. [Google Scholar]
- Op De Beeck, M.; Persson, P.; Tunlid, A. Fungal Extracellular Polymeric Substance Matrices—Highly Specialized Microenvironments That Allow Fungi to Control Soil Organic Matter Decomposition Reactions. Soil. Biol. Biochem. 2021, 159, 108304. [Google Scholar] [CrossRef]
- Flemming, H.C.; Wingender, J. The Biofilm Matrix. Nat. Rev. Microbiol. 2010, 8, 623–633. [Google Scholar] [CrossRef]
- Sun, W.; Yu, Y.; Chen, J.; Yu, B.; Chen, T.; Ying, H.; Zhou, S.; Ouyang, P.; Liu, D.; Chen, Y. Light Signaling Regulates Aspergillus Niger Biofilm Formation by Affecting Melanin and Extracellular Polysaccharide Biosynthesis. mBio 2021, 12, e03434-20. [Google Scholar] [CrossRef]
- Najibi Ilkhechi, N.; Mozammel, M.; Yari Khosroushahi, A. Antifungal Effects of ZnO, TiO2 and ZnO-TiO2 Nanostructures on Aspergillus Flavus. Pestic. Biochem. Physiol. 2021, 176, 104869. [Google Scholar] [CrossRef]
- Mitoraj, D.; Jańczyk, A.; Strus, M.; Kisch, H.; Stochel, G.; Heczko, P.B.; Macyk, W. Visible Light Inactivation of Bacteria and Fungi by Modified Titanium Dioxide. Photochem. Photobiol. Sci. 2007, 6, 642–648. [Google Scholar] [CrossRef]


| Interval | Description | Time of UVA Light (Days) | |
|---|---|---|---|
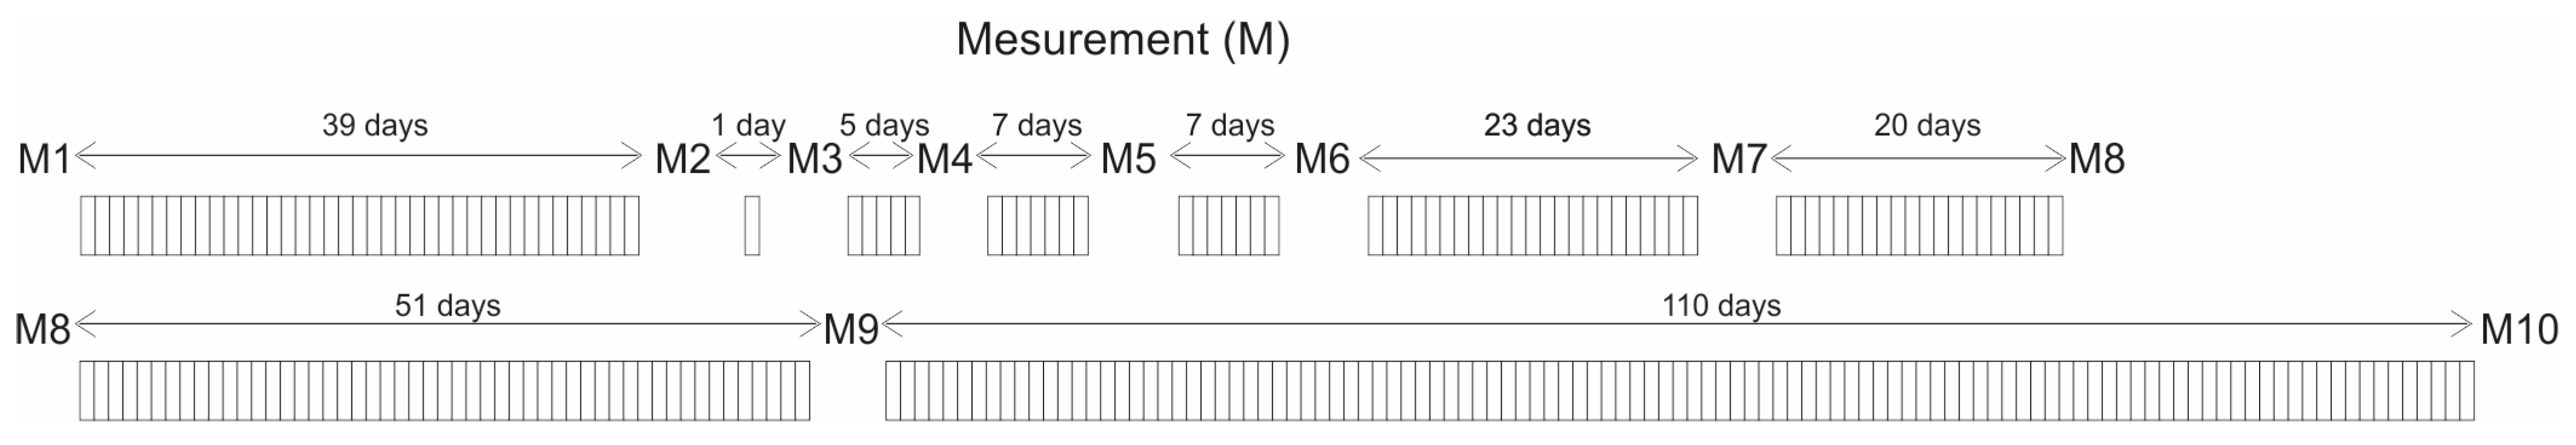
| Measurement 1 (M1) | 52 days | Carbonated samples (with and without nTiO2), before nutritional enrichment. Date of application of the nutrient. Sabouraud Broth (4 mL per sample) and placement in BOD for acclimatization. | Zero |
| Measurement 2 (M2) | Samples with nutrient (acclimatized in the BOD), before inoculation with the isolates. | Zero | |
| Measurement 3 (M3) | Immediately after inoculation (fresh samples). | Zero | |
| Measurement 4 (M4) | Placement in the BOD (without turning on the lamp). | Zero | |
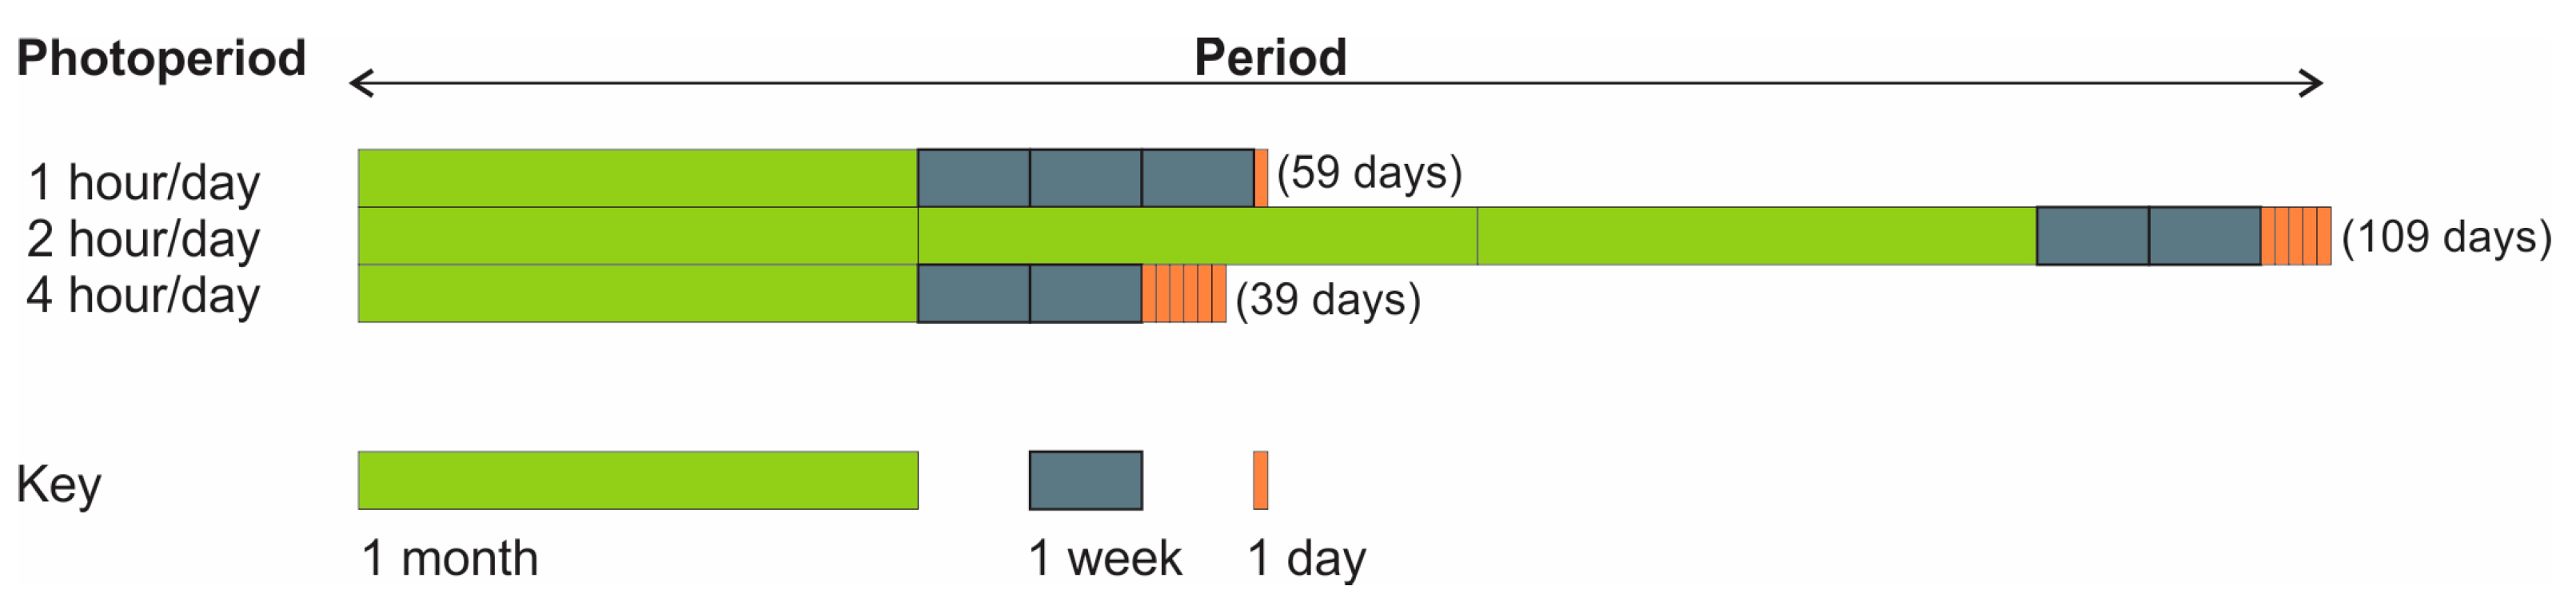
| Measurement 5 (M5) | Before turning on the lamp. Date of light activation (photoperiod 1 h/day). | Zero | |
| Measurement 6 (M6) | 211 days | 7 days after light activation (photoperiod 1 h/day). | 7 |
| Measurement 7 (M7) | 30 days after light activation (photoperiod 1 h/day). | 30 | |
| Measurement 8 (M8) | 50 days after light activation (photoperiod 1 h/day). Date of the increase of the photoperiod to 2 h/day. | 50 | |
| Measurement 9 (M9) | 101 days after light activation (photoperiod 2 h/day). Date of the increase of the photoperiod to 4 h/day. | 101 | |
| Measurement 10 (M10) | 211 days after light activation (photoperiod 4 h/day). | 211 |
| Relative Humidity (RH) | |||||
| <60% | Between 60–70% | Between 70–80% | Between 80–90% | >90% | |
| Occurrence (%) | 9.8 | 8.5 | 26 | 52.7 | 3 |
| Temperature (°C) | |||||
| Between 22–25 | Between 25–30 | Between 30–35 | >35 | ||
| Occurrence (%) | 33.74 | 60.63 | 5.55 | 0.08 | |
| ∆E* | |||||||||||
|---|---|---|---|---|---|---|---|---|---|---|---|
| Sample | (M2-M1) | (M3-M1) | (M4-M1) | (M5-M1) | (M6-M1) | (M7-M1) | (M8-M1) | (M9-M1) | (M10-M1) | ||
| With n TiO2 | S4 | 4.1 | 9.805 | 11.554 | 12.236 | 11.469 | 5.772 | 9.170 | 10.675 | 8.001 | 6.024 |
| 4.2 | 7.459 | 7.413 | 8.236 | 7.683 | 5.855 | 8.803 | 10.737 | 7.653 | 5.107 | ||
| 4.3 | 10.497 | 11.178 | 11.892 | 10.872 | 5.653 | 9.413 | 10.455 | 6.860 | 2.470 | ||
| S5 | 5.1 | 10.108 | 11.419 | 11.495 | 11.465 | 3.940 | 3.824 | 2.785 | 2.548 | 1.174 | |
| 5.2 | 11.179 | 12.050 | 12.203 | 12.373 | 4.156 | 4.924 | 3.481 | 2.968 | 2.540 | ||
| 5.3 | 11.221 | 11.889 | 12.238 | 12.173 | 3.336 | 3.286 | 2.480 | 1.791 | 1.357 | ||
| S6 | 6.1 | 11.032 | 11.821 | 11.375 | 11.639 | 4.641 | 7.134 | 7.942 | 7.192 | 3.878 | |
| 6.2 | 10.610 | 10.679 | 12.078 | 13.352 | 5.040 | 7.884 | 8.043 | 6.391 | 3.114 | ||
| 6.3 | 12.960 | 11.989 | 11.615 | 14.625 | 4.982 | 5.870 | 5.427 | 4.533 | 2.445 | ||
| Without n TiO2 | S10 | 10.1 | 15.324 | 15.290 | 15.325 | 16.314 | 5.585 | 2.672 | 2.299 | 0.763 | 0.589 |
| 10.2 | 15.928 | 16.198 | 15.446 | 15.384 | 8.446 | 2.237 | 3.148 | 0.669 | 1.060 | ||
| 10.3 | 15.837 | 16.011 | 16.961 | 16.668 | 5.547 | 2.238 | 4.569 | 0.337 | 1.322 | ||
| S11 | 11.1 | 15.437 | 13.382 | 17.464 | 25.551 | 3.976 | 4.735 | 16.991 | 13.425 | 10.571 | |
| 11.2 | 13.881 | 15.122 | 14.693 | 14.923 | 2.293 | 0.226 | 1.556 | 1.494 | 1.699 | ||
| 11.3 | 15.389 | 15.459 | 15.932 | 15.168 | 1.712 | 1.907 | 0.968 | 1.080 | 1.227 | ||
| Sample | ∆L* | ∆a* | ∆b* | |||||
|---|---|---|---|---|---|---|---|---|
| With n TiO2 | Sample | (M7-M1) | (M10-M1) | (M7-M1) | (M10-M1) | (M7-M1) | (M10-M1) | |
| S4 | 4.1 | −2.859 | −3.109 | −0.637 | 0.210 | −1.380 | 5.156 | |
| 4.2 | −0.587 | 2.002 | −0.695 | 0.276 | −1.100 | 4.691 | ||
| 4.3 | −3.153 | 0.430 | −0.460 | 0.077 | −1.308 | 2.431 | ||
| S5 | 5.1 | −2.114 | −0.505 | −0.004 | 0.190 | −1.054 | 1.042 | |
| 5.2 | −3.177 | −2.113 | 0.046 | 0.186 | −0.834 | 1.398 | ||
| 5.3 | −1.552 | −1.057 | −0.027 | 0.159 | −0.962 | 0.836 | ||
| S6 | 6.1 | −2.655 | −2.593 | −0.614 | 0.075 | −1.568 | 2.883 | |
| 6.2 | −2.008 | −0.260 | −0.442 | 0.074 | −1.167 | 3.102 | ||
| 6.3 | −4.027 | −1.916 | −0.235 | 0.068 | −1.181 | 1.517 | ||
| Without n TiO2 | S10 | 10.1 | −0.842 | 0.457 | 0.063 | −0.192 | −3.844 | −0.319 |
| 10.2 | −0.743 | 0.814 | 0.069 | −0.241 | −3.821 | −0.636 | ||
| 10.3 | −0.928 | 1.187 | 0.182 | −0.104 | −3.817 | −0.574 | ||
| S11 | 11.1 | −4.697 | −10,503 | −0.546 | −0.378 | −4.259 | 1.134 | |
| 11.2 | 0.062 | 1.492 | −0.086 | −0.232 | −4.215 | −0.779 | ||
| 11.3 | −1.756 | 0.285 | −0.272 | −0.259 | −4.354 | −1.165 | ||
Disclaimer/Publisher’s Note: The statements, opinions and data contained in all publications are solely those of the individual author(s) and contributor(s) and not of MDPI and/or the editor(s). MDPI and/or the editor(s) disclaim responsibility for any injury to people or property resulting from any ideas, methods, instructions or products referred to in the content. |
© 2023 by the authors. Licensee MDPI, Basel, Switzerland. This article is an open access article distributed under the terms and conditions of the Creative Commons Attribution (CC BY) license (https://creativecommons.org/licenses/by/4.0/).
Share and Cite
Guerra, F.L.; Giordani, C.; Zucchetti, L.; Ribas, R.; Masuero, A.B.; Dal Molin, D.C.C.; Bento, F.M. The Effectiveness of Spraying nTiO2 on Coating Mortars in Historical Buildings Aimed at Reducing Fungal Growth. Buildings 2023, 13, 2751. https://doi.org/10.3390/buildings13112751
Guerra FL, Giordani C, Zucchetti L, Ribas R, Masuero AB, Dal Molin DCC, Bento FM. The Effectiveness of Spraying nTiO2 on Coating Mortars in Historical Buildings Aimed at Reducing Fungal Growth. Buildings. 2023; 13(11):2751. https://doi.org/10.3390/buildings13112751
Chicago/Turabian StyleGuerra, Fernanda Lamego, Caroline Giordani, Lais Zucchetti, Rodolfo Ribas, Angela Borges Masuero, Denise Carpena Coitinho Dal Molin, and Fatima Menezes Bento. 2023. "The Effectiveness of Spraying nTiO2 on Coating Mortars in Historical Buildings Aimed at Reducing Fungal Growth" Buildings 13, no. 11: 2751. https://doi.org/10.3390/buildings13112751