Article

Investigation of the Crack Behavior of CRC Using 4D Computed Tomography, Photogrammetry, and Fiber Optic Sensing

1
Institute of Concrete Structures, TUD Dresden University of Technology, 01062 Dresden, Germany
2
Institute of Photogrammetry and Remote Sensing, TUD Dresden University of Technology, 01062 Dresden, Germany
3
Department of Civil Engineering, RPTU Kaiserslautern-Landau, 67663 Kaiserslautern, Germany
*
Author to whom correspondence should be addressed.
These authors contributed equally to this work.
Buildings 2023, 13(10), 2595; https://doi.org/10.3390/buildings13102595
Submission received: 4 September 2023 / Revised: 26 September 2023 / Accepted: 12 October 2023 / Published: 14 October 2023
(This article belongs to the Special Issue Research on the Performance of Non-metallic Reinforced Concrete)

Abstract

:
The highly irregular crack pattern of reinforced concrete has been studied primarily at the surface. The ability to extend image correlation into the interior of structures by using X-ray computed tomography (CT) opens up new possibilities for analyzing the internal mechanics of concrete. In order to enable a complete material characterization, it is necessary to study the crack geometry at the micro level in 3D images over time, i.e., 4D data. This paper presents the results of in situ CT tests that were carried out on carbon-reinforced concrete (CRC) beams subjected to bending load. The main objective of the tests was the experimental analysis of the evolution of individual cracks at different stages of their formation by applying digital volume correlation (DVC) to the 4D image data from the computed tomography. The results obtained from the CT were compared with other measurement techniques, such as distributed fiber optic sensing, clip gauges, and digital image correlation (DIC).

1. Introduction

Concrete is the world’s most produced man-made material [1]. As such, it is an important factor regarding developments towards greater sustainability, which are urgently needed to contribute to the reduction in CO2 emissions. One way to increase resource efficiency in concrete construction is the use of non-metallic reinforcements, which enable the design of thin, load-bearing structures [2].
In order to exploit the sustainability potential and ensure the safety as well as durability of structural members made of this composite material, it is crucial to understand its mechanical properties. This includes gaining insight into concrete crack development and the associated fracture energy mechanisms [3]. Cracking of concrete is an inherent process in the structural behavior of reinforced concrete structures, that allows efficient use of the reinforcement. However, it also affects the load-bearing behavior, as forces are distributed differently in the cracked state compared to the uncracked state. Hence, experimental characterization of concrete’s behavior and damage mechanisms is an ongoing subject of research in civil engineering. Currently, investigations of crack formation and stress or strain evolution under load are often limited to the visual examination of the concrete’s surface.
The most common and traditionally applied measurement solutions used for the assessment of concrete deformation involve the utilization of displacement transducers and strain gauges [4]. Although highly accurate and reliable for scientific and industrial applications, these measurement techniques are typically limited to measuring strain or deformation at specific locations on a test specimen, with each sensor essentially measuring relative displacements between two points on the sample, which have to be selected prior to initiation of the loading procedure. These types of sensors also require the use of additional accessories and/or adhesives for proper installation, which can negatively affect the measurement accuracy. Clip gauges are a variant of this sensor typology and are commonly recommended by standards for crack growth measurement at a specific point (0D) [5].
In order to deepen the knowledge on the damage mechanisms of concrete and the bond behavior between the concrete matrix and reinforcement elements, a variety of more advanced techniques are used to characterize the crack development and propagation from micro-crack initiation. For this purpose, and due to its ability to measure strain quasi-continuously with high spatial resolution, fiber optic sensing techniques based on Rayleigh scattering can be used [6]. The use of distributed fiber optic sensors (DFOSs) on different reinforcement materials provides insights into the component (1D) and material behavior [7,8]. By integrating DFOSs into the specimen, knowledge about the bond mechanisms [9,10,11] or crack behavior [12,13,14] can be gained. Thus, existing mechanical models can be critically reviewed. However, the choice of the DFOS type and its application method has a decisive influence on the measurement quality [15,16,17]. If a DFOS with a soft coating is used and attached to the host material with a soft adhesive, the strain curve is strongly attenuated. This bears the risk that cracks may not be detected at all or only at a very late stage [18]. At the same time, it must be considered that robust DFOSs with large diameters or thick adhesive layers can strongly influence the local bond behavior.
A further method for the analysis of crack development is digital image correlation (DIC) [19]. For this measurement technique, the surface of the concrete and its deformations are recorded using a stereo camera system [20]. The displacement field of the concrete surface can then be calculated by juxtaposing detailed images of test samples at different load levels. Changes can be determined with high accuracy between 0.01 and 0.10 pixel [21]. When the DIC method (2D) is extended to volume sequence data (3D), it is referred to as digital volume correlation (DVC) [22,23]. The deformation analysis in the DIC and DVC approaches is usually achieved by computing strain fields [24]. In this study, another method is used that allows the automatic derivation of crack widths for DIC [25] and DVC [26].
Three-dimensional data sets can be obtained by using computed tomography (CT). This measurement technique distinguishes itself from the previously mentioned methods as it provides spatially resolved information about the internal structure [27] and enables a full 3D characterization of the crack geometry [28,29,30]. Over the last few decades, CT has become an increasingly relevant tool in the construction industry, especially for composite materials, yielding studies that were previously unimaginable by generating high quality 3D representations of the internal structure of the material, as covered in comprehensive reviews by Brisard et al. [31], Vicente et al. [32], and du Plessis and Boshoff [33]. CT technology has also evolved to the point where X-ray scans can be performed while subjecting the specimen to external loading conditions, known as in situ CT tests [28,34]. These tests provide 4D data sets, where three dimensions are associated with the resulting images and the fourth dimension is time (3D images captured at different loading/time intervals). Recently, numerous papers have been published reporting investigations involving the emerging in situ CT approach [30,35,36,37].
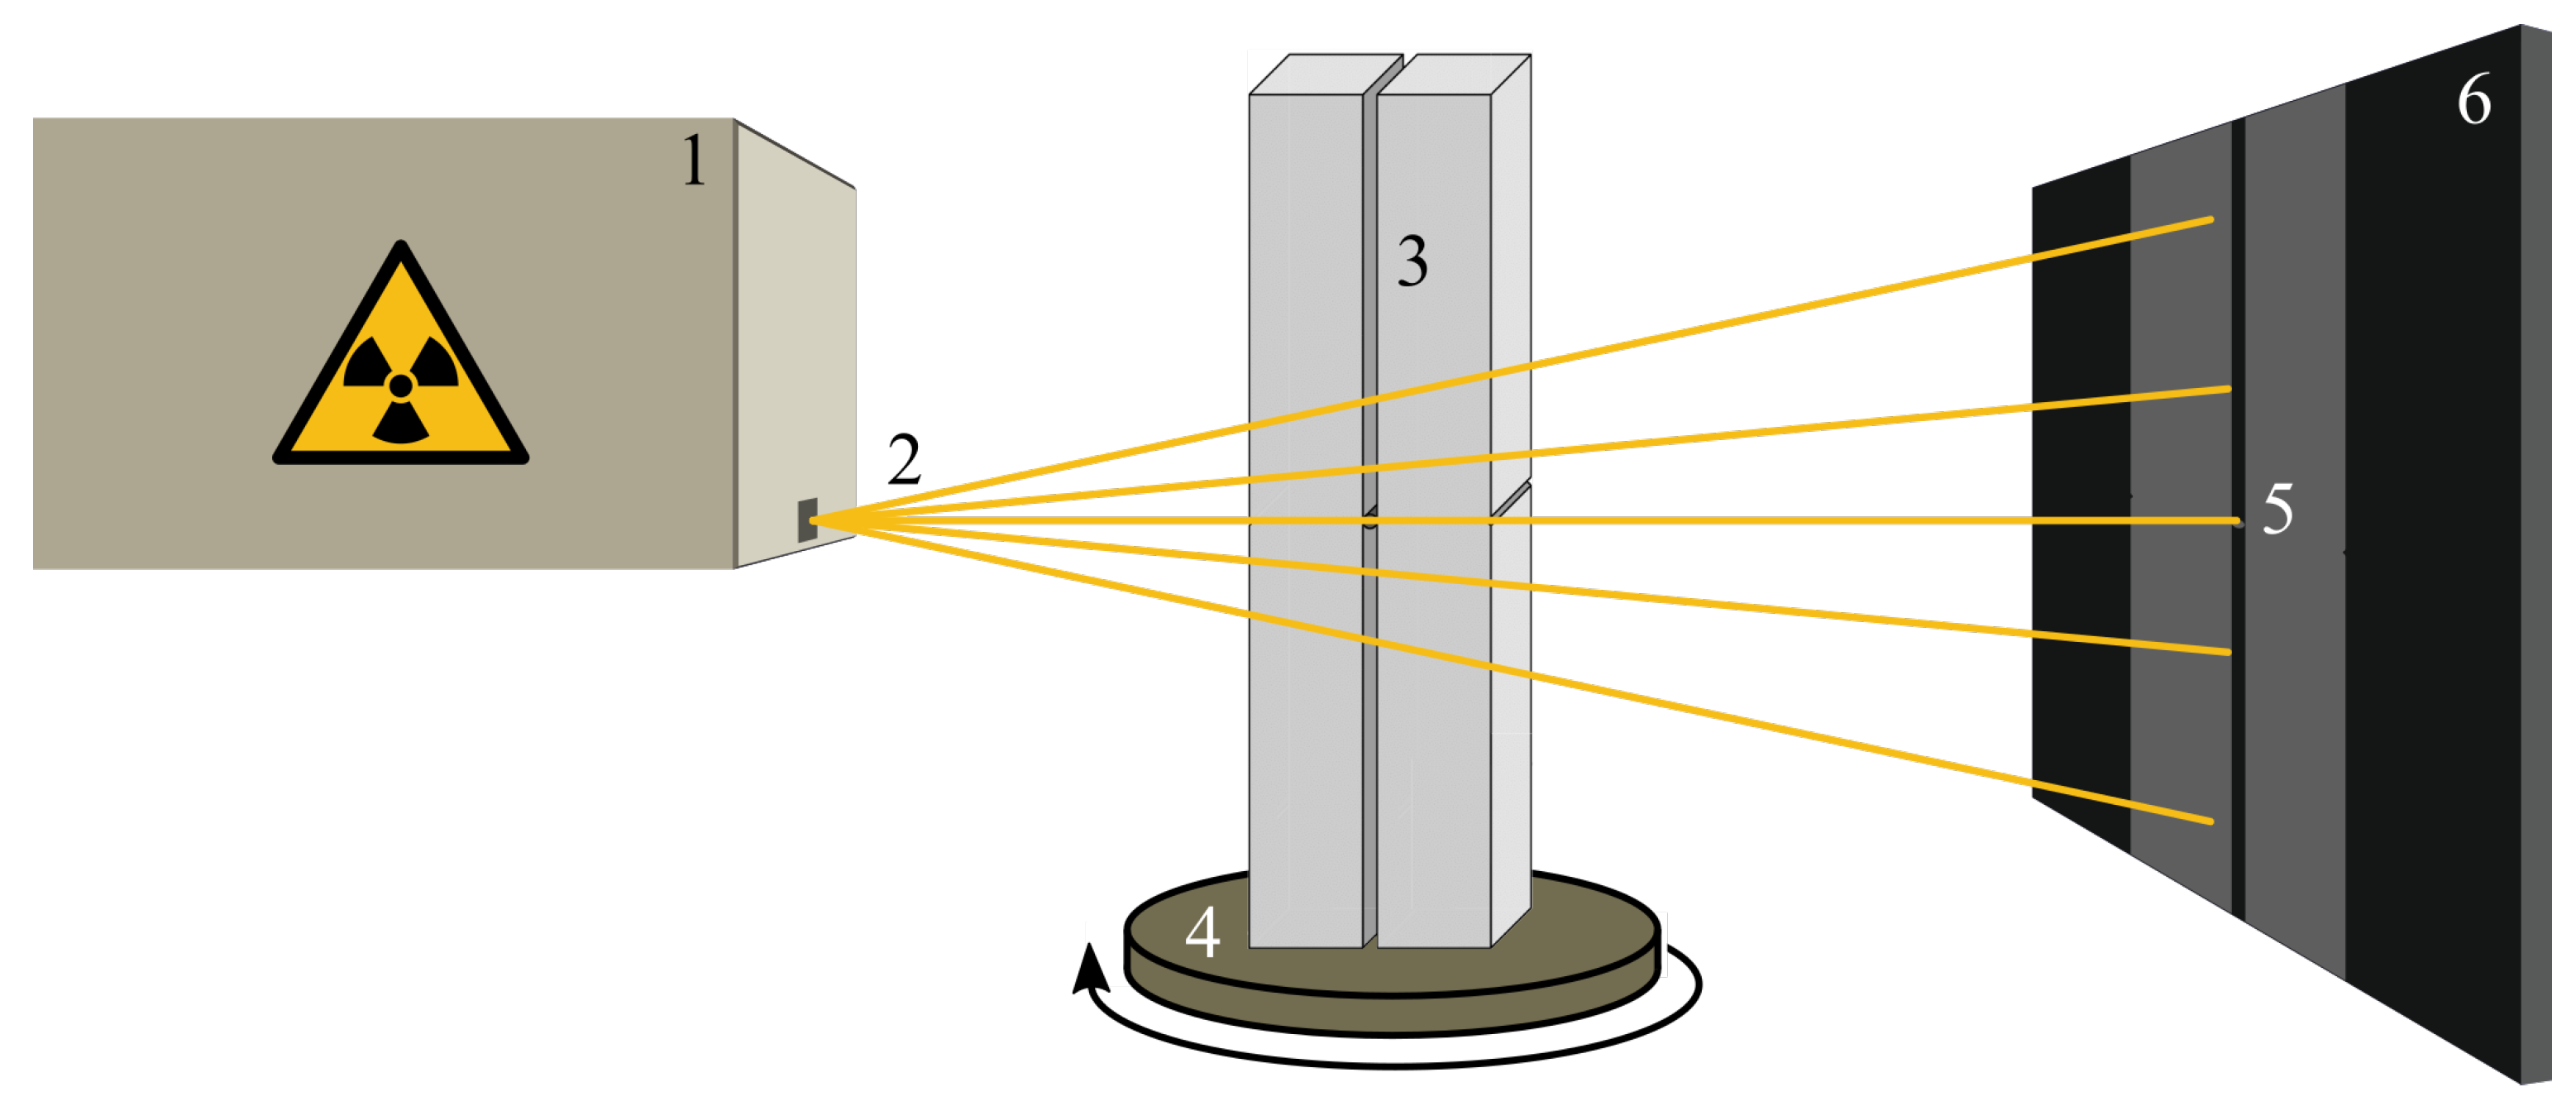
The tomography portal Gulliver—a unique large-scale CT device, capable of generating X-rays with an energy level of up to 9 MeV, which is currently set up at Rheinland-Pfälzische Technische Universität Kaiserslautern-Landau (RPTU)—is designed to enable scans of large concrete specimens of up to 6 m in length and nearly 1 m in diameter during bending tests [28]. Once operational, time-resolved measurements inside real-scale carbon-reinforced concrete (CRC) components will be performed under various loading conditions at Gulliver in the context of the collaborative research center/transregio CRC/TRR280 “Design strategies for material-minimized carbon reinforced concrete structures” [38]. The collected data can be used to derive physically based damage models tailored specifically to CRC.
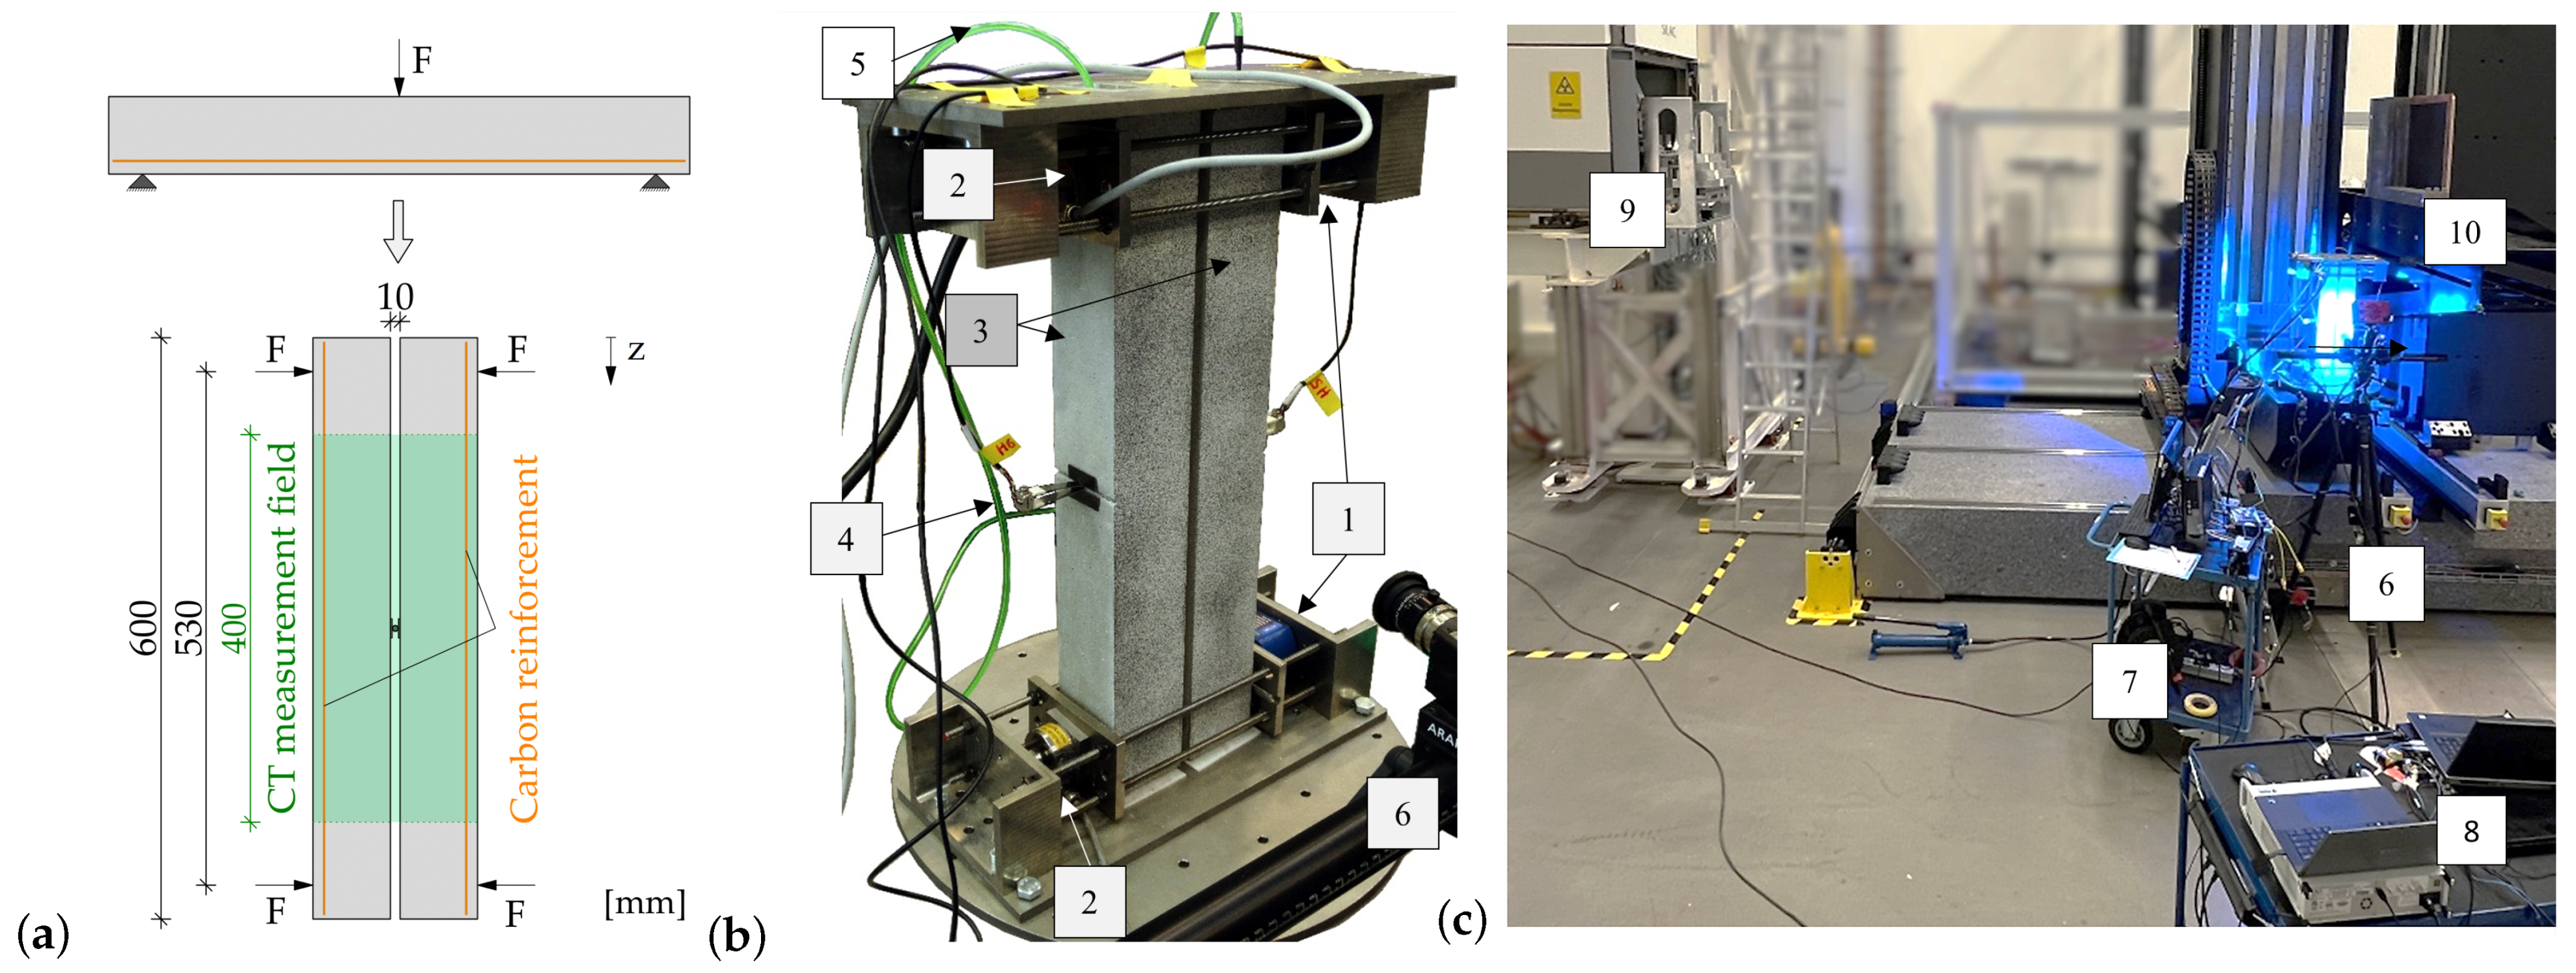
This paper presents the first preliminary in situ CT bending tests on CRC beams. The experiments were performed at the Fraunhofer Development Center X-ray Technology (EZRT) in Fürth, Germany, using the X-ray detector that will later be incorporated into the Gulliver setup. The primary objective of these tests was to visualize and analyze the evolution of load-induced cracks on the CRC beams. Therefore, the crack propagation was examined at various load levels using CT during the bending tests. In addition, clip gauges, DIC, and DFOSs were employed to verify the results from the CT scans.
An enhanced elaboration of the methods for 3D crack width measurement as well as for quality control based on the CT data obtained from this study can be found in Liebold et al. [39].

2. Materials and Methods

2.1. Test Setup

Figure 1 shows the test setup that was used for the three-point bending tests. In contrast to the conventional test setup, where one single beam is placed in a horizontal position, supported at the ends, and the load applied at the top, the tests in this study were performed on a beam pair (experiment 1) and a beam quartet (experiment 2) in an upright position (see Figure 1a). A rod between two metal plates that were attached to the beams formed the central support, resulting in a total gap of 10 mm between the samples. The load was applied by two hydraulic cylinders at the ends of the beams and measured by two load cells on opposite sides (see Figure 1b), each with a load capacity of 10 kN.
Due to the size of the CT device used (see Section 2.5.1), the height of the measurement field was limited to 400 mm, as displayed in Figure 1a (green area). In order to complement the CT data, the experiments were recorded with a stereo camera system for photogrammetric measurements on the surface of the samples. Moreover, DFOSs were applied to the reinforcement for internal strain measurements and additional clip gauges were installed in notches at the mid-height of two beams. The whole test setup is shown in Figure 1c.

2.2. Specimen Geometry and Reinforcement Configuration

Two bending tests were carried out on a pair/quartet of CRC beams with a length of 600 mm. Out of a total of six specimens, two samples had a square cross-section of 80 × 80 mm2 (see experiment 1 in Figure 2), while the remaining four samples were halved in thickness, resulting in a rectangular cross-section of 80 × 40 mm2 (see experiment 2 in Figure 2). The two samples of experiment 1 feature an additional notch of 3 mm in the center of the specimen on the side where the reinforcement was placed.
In order to test the limits of the applied measurement techniques, the beams were provided with varying reinforcement configurations, provoking the development of either a few wide cracks (experiment 1) or many small cracks (experiment 2). Figure 2 shows the two different reinforcement layouts. The specimens with a square cross-section (experiment 1) were reinforced with only one layer of a textile grid that was placed in the tension zone of the beam with six warp threads in a longitudinal direction, resulting in a reinforcement ratio of 1.7‰. For the beams of experiment 2, the same textile grid was formed into a reinforcement cage as shear reinforcement and used in combination with a carbon rebar, resulting in a much higher reinforcement ratio of 26.8‰. The concrete cover was 5 mm.

2.3. Experimental Program and Test Procedure

In the course of the tests, the loads applied by the two cylinders were recorded and summed to obtain the current load level. CT scans of the samples from each experiment were performed for several load steps (see Table 1). These were previously defined based on preliminary experiments, aiming at capturing different stages of the crack formation. Before the start of the load application, one CT scan of the beams in their initial state (load step 0) was taken. For experiment 1, three more CT scans were executed at 2, 4, and 6 kN. Since the load-bearing capacity of the samples in experiment 2 was higher due to the increased reinforcement ratio, larger increments were chosen for the load steps, resulting in four scans, at 2, 6, 12, and 18 kN. The load level was maintained while scanning. Fiber optic measurements and photogrammetry (as well as clip-type displacement transducers on the notches of the beams in experiment 1) captured the behavior of the samples during the periods of successive load increase until the next load step was reached.

2.4. Materials and Sample Preparation

2.4.1. Textile Reinforcement

As for the planar 2D textile reinforcement, a bidirectional warp-knitted grid made of carbon fiber yarns with a polyacrylate coating was used. The reinforcement area in the warp (longitudinal) direction was 141 mm2/m and, therefore, a lot higher than in the weft (transverse) direction, where the reinforcement area was only 28 mm2/m due to different fiber strand spacing and cross-sectional areas of the yarns (see Figure 3a).
The bar-shaped reinforcement shown in Figure 3b was a rebar made of carbon fibers and an epoxy resin impregnation with a fiber volume ratio of 60%. The grooved profiling was realized by a circumferential milling of the cured bar. The outer diameter of the rebar was 10 mm. The core diameter, which also corresponds to the design-relevant diameter, was 8.5 mm. This resulted in a reinforcement area of 57 mm2. Further information regarding the material properties of the carbon reinforcement is listed in Table 2.

2.4.2. Fine-Grained Concrete

The cementitious matrix used for these investigations was self-compacting and of high strength. The concrete mix design was developed within the scope of the C3 research project [42] specifically for the application of carbon-reinforced concrete structures [43]. Due to the small mesh size of the textile grid, a matrix variation with a maximum aggregate size of 2 mm was used. A mixture with a grain size that small is usually classified as mortar according to DIN EN 206 [44]. However, its mechanical properties correspond to those of a high-strength concrete, which is why it is referred to as a fine-grained concrete in the context of textile-reinforced concrete. The matrix is composed of a binder concept (based on Portland cement, slag, and limestone flour), fine silica sand, sand 0–2 mm, a high-performance superplasticizer, and water. The concrete mix design is listed in Table 3.
For each concrete batch, the compressive strength as well as the bending tensile strength were determined on three prisms (160 × 40 × 40 mm3) according to the standard test method for mortar [45] on the day of testing. The values are listed in Table 4.
The mean modulus of elasticity of the cementitious matrix has been investigated in previous studies [46] on cylindrical specimens (h/d = 300 mm/150 mm) and determined to be about 44,000 MPa.

2.4.3. Production and Curing of the Samples

The textile-reinforced beams were produced at the Otto-Mohr-Laboratorium (OML) of TU Dresden. The carbon reinforcement (grid and rebar) was cut to the required dimensions. Since the polyacrylate coating of the carbon grid is a thermoplastic material, the reinforcement basket could be formed by heating the grid with a hot-air gun.
Figure 4a shows the prepared textile reinforcement for the samples of experiment 2 (left) and experiment 1 (right) with the attached DFOSs and associated plastic tubes. Spacers made of plastic were used to secure the position of the reinforcement during the casting process and guarantee the concrete cover of 5 mm. The notches (Figure 4c) of samples 1A and 1B were realized by adding a corresponding counterpart to the formwork.
The beams were cast in a vertical formwork made of sealed timber (Figure 4b) and remained in there for two days. After stripping the formwork, the specimens were stored in a climatic chamber at 20 °C and 65% relative humidity until the testing day (32 days after casting).

2.5. Measurement Methods

2.5.1. In Situ Computed Tomography

As described in [39], X-ray tomography can be applied to study the inner structure of specimens. Figure 5 shows a schematic illustration of a CT device consisting of an X-ray source (1), a sample (3), and a detector (6). At each rotation step, a projection image (5) is recorded by the detector, which collects the radiation (2) transmitted through the object. After recording all projections, the images are reconstructed to a 3D voxel data set represented by a 2D image stack.
For the in situ CT tests of this study, the flat-panel detector of the tomography portal Gulliver from RPTU Kaiserslautern and a radiation source with a high voltage of 8.0 MeV were used. Limited-angle computed tomography [47] with 1300 projections in a rotation range of 200° was employed to limit the scanning time to about 20 minutes and reduce undesired creep effects as a result of the sustained loading during the scan. More detailed information on the CT measurements used in this study are given in [39].

2.5.2. Photogrammetry

Photogrammetry is a visual, non-contact measurement method that allows the gradual observation of crack development on the surface. A commercially available stereo camera system from the company Carl Zeiss GOM Metrology GmbH, consisting of two cameras with the focal length of the lenses being 12 mm, was employed to observe the front surface of the specimens with a high spatial and temporal resolution as well as a high accuracy. The cameras were mounted on a rigid bar at a distance of 98 mm and with an angle of 25° between them. The operating distance to the beams was adjusted to 30 cm. The inner and relative orientation of the stereo system was calibrated with a calibration plate of 25 × 20 cm at constant room temperature and constant blue LED light. The calibration was followed by acquisition of the stereo image sequences with a frame rate of 1 Hz. During the CT scans, the recordings were paused. The dimensions of the observed surface were approximately 17 cm × 30 cm, thus covering the monitoring of the central part of the samples [39].

2.5.3. Distributed Fiber Optic Sensing

For the strain measurements on the carbon reinforcement, a filigree DFOS with a stiff ORMOCER coating with a diameter of only 0.195 mm was used. This coating material behaves similarly to polyimide in terms of stiffness, but is advantageous in terms of durability in alkaline environments [48,49,50]. Thus, the onset of cracking can be detected at a very early stage. However, this filigree DFOS must be handled with great care, especially during the installation. If the bending radii are too small or the shear forces become too high, DFOSs may break quickly. For each specimen, one DFOS was continuously attached to the carbon reinforcement (yarn in experiment 1 and rebar in experiment 2) in the tension zone with a stiff epoxy-based two-component adhesive (see Figure 2 for exact location). The influence on the bond zone was minimized due to the thin adhesive layer. To protect the pigtails from mechanical impact during concreting and transportation, they were encased in robust plastic tubes (no. 5 in Figure 1b).
For the fiber optical strain measurements, an optical distributed sensor interrogator (ODiSI) 6100 was used as a data acquisition unit. Strains were measured during loading at a frequency of 5 Hz, with the finest gauge pitch chosen at 0.65 mm. This allowed cracks to be detected at a very early stage, even before they became visible to the human eye [51]. Prior to loading, initial strains due to temperature effects or shrinkage of the concrete were tared out. Due to the rotation of the specimens during the CT scans, the measurements were briefly stopped when each load plateau was reached.

2.5.4. Clip Gauges

In the particular case of experiment 1, where notched specimens were used to force crack development on specific locations, it was possible to use an additional measurement system to assess the crack width. For these specimens, two clip gauges (clip-type displacement transducers with 5 mm measuring capacity) were used during the increase in force by load actuators to measure the crack opening width in the central part of the samples (at a notch level). The position where this measurement technique was installed in the test setup is presented in Figure 1 (see detail 4). In order to properly fix the clip gauge sensors in the center of the beam span, two small steel mounting plates were glued on each specimen, one at each side of the notch (visible in Figure 1).

2.6. Crack Width Calculation

2.6.1. Crack Width Calculation from DIC and DVC

DIC and DVC techniques were applied to analyze the stereo image data as well as the CT data to compute strains, deformations, and crack widths. For the image sequences, the algorithm of Liebold et al. [25] was used to compute the crack widths, whereas the CT data was analyzed with the method of Liebold and Maas [26]. For the voxel data, the crack widths were derived by the analysis of profiles through the deformation field. Further details regarding the evaluation methods are given in [39]. A prerequisite for the application of the DIC and the DVC methods is a suitable texture for the image matching techniques. In the case of DIC, the measurement surface could be prepared with an artificial pattern. In these experiments, this was performed on the investigated front surfaces of the specimens by creating stochastic black-and-white speckle patterns (see Figure 1b). Ideally, a proper texture for the application of the DVC method on the CT image data results from the aggregates and pores within the concrete structure.

2.6.2. Crack Width Calculation from DFOS Measurements

For the post-processing of the DFOS data (e.g., data cleaning and noise reduction), a free software framework called fosanalysis was used [52]. Cracks are identified by a peak-finding algorithm and their crack widths are determined by integrating the strain curve within the transfer lengths. The general procedure is presented in [12], using a reinforced concrete beam as an example. To improve the quality of the data, a time median over a period of 5 s at constant load was determined for the strain curves instead of considering only a single time step. As a result, at a frequency of 5 Hz, the median is calculated from 25 values per gauge.
To determine whether a strain peak is considered as a crack, the required prominence was set to 1000 µm/m for the beams reinforced with a carbon grid. The specimens with carbon rebars showed a much finer crack pattern, so the prominence was reduced to 500 µm/m. However, if the prominence is set too low for measurements with stiff DFOSs, individual peaks in the strain curve may be misidentified as cracks. The integration limits between the strain peaks were set at the minima, with a maximum transfer length of 5 cm. In general, the crack widths result from the strain differences between reinforcement and concrete multiplied by the crack spacing. In the present calculations, the portion from tension stiffening was neglected for simplicity. This results in a minor overestimation of the crack widths (<0.01 mm).

3. Results

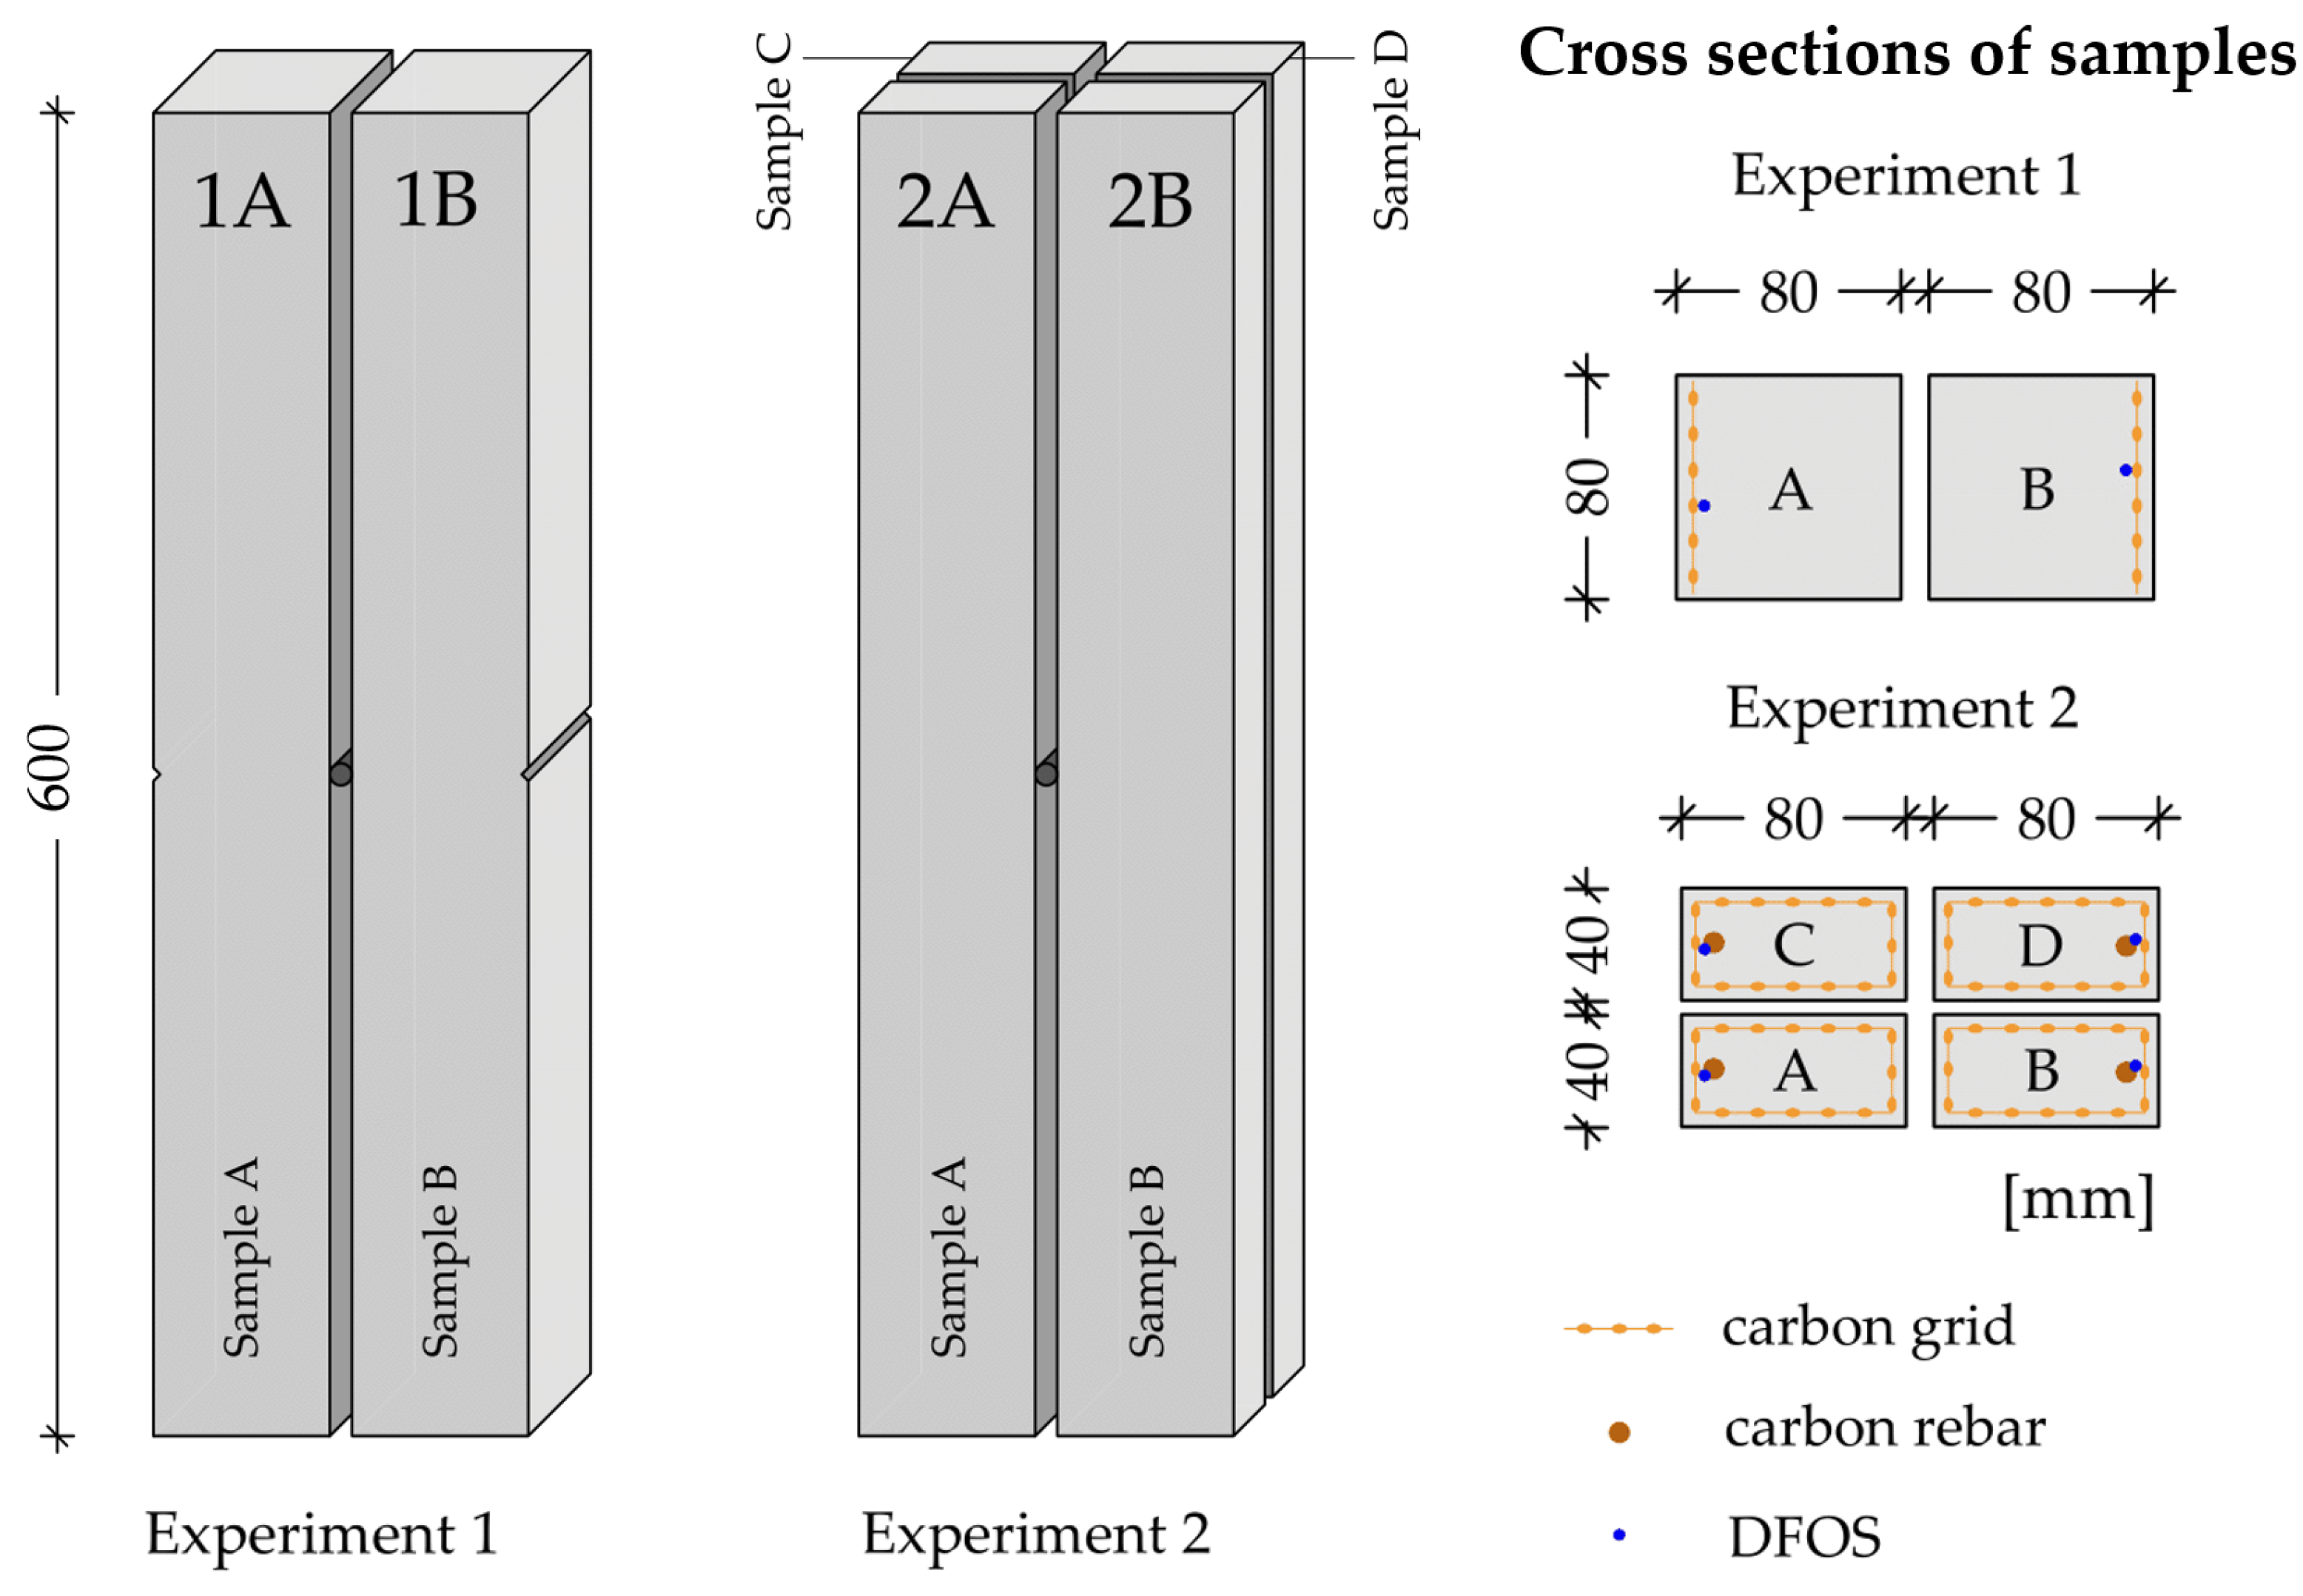
As a result of the different cross-sectional areas as well as reinforcement ratios, the beams of experiments 1 and 2 presented different behavior in terms of their structural performance. 
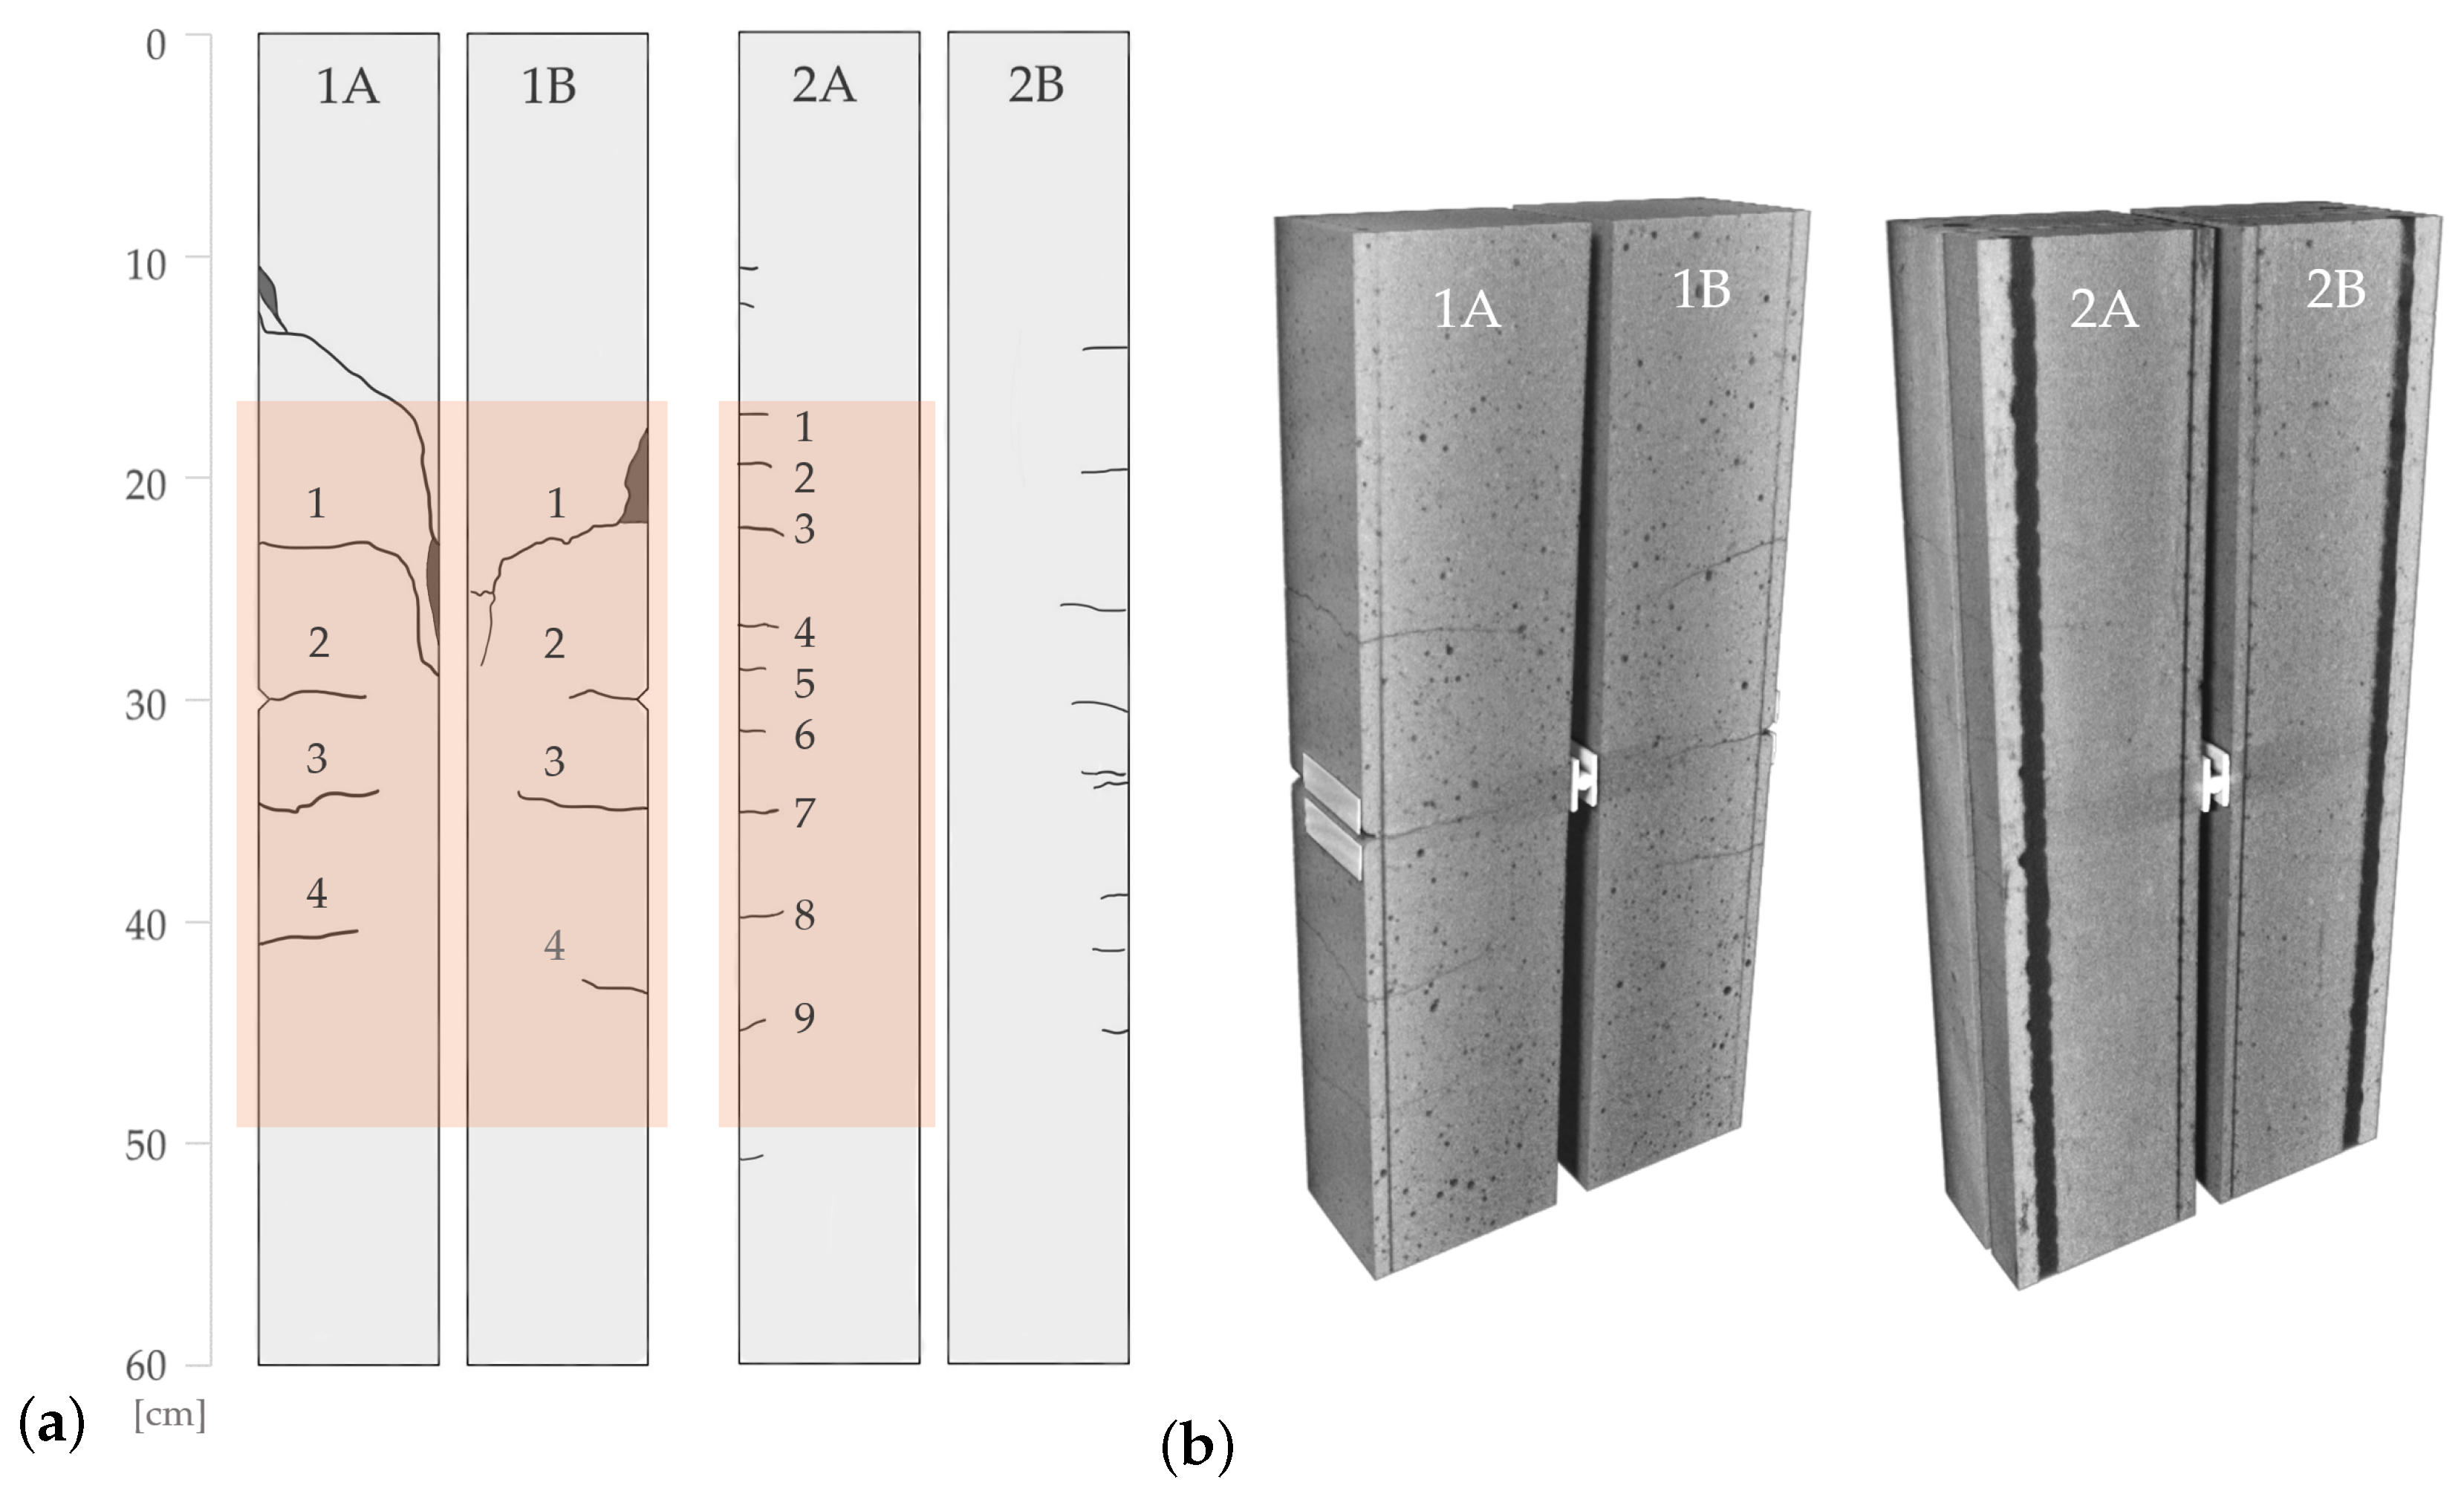
Figure 6a shows the crack map of the beams, created based on visual observations, at the end of the tests, i.e., for experiment 1 at a load level of 9.6 kN when the samples failed due to bending shear, and for experiment 2 at the maximum load of 20 kN.
For samples 1A and 1B, which did not feature shear reinforcement, the first cracks initiated at the notches at mid-height on the beams. Subsequent bending cracks formed as the load was increased until inclined cracks suddenly propagated into the compression zone up to the area of the central support, ultimately leading to an abrupt loss in the load-bearing capacity (bending shear failure) in both specimens. The zones marked in dark gray in Figure 6a indicate concrete spalling that occurred in both the tension and compression zones.
The samples of experiment 2 were expected to collapse due to shear failure under a load of about 27 kN. Since the applicable load was limited to 20 kN because of the maximum capacity of the hydraulic cylinders of 10 kN each, failure did not occur. Instead, at the end of the test, multiple uniformly distributed bending cracks were observed in the tension zone. Due to the significantly higher reinforcement area, they were much smaller (hardly visible without optical instruments) than the ones in samples 1A and 1B.
This is also illustrated by Figure 6b, where CT reconstructions for each experiment are displayed by vertically sliced 3D volumes at the last scanned load step, i.e., at 6 kN for experiment 1 and at 18 kN for experiment 2. While the cracks are clearly visible for samples 1A and 1B, they are barely identifiable for the samples of experiment 2.
Figure 6b reveals several further interesting aspects regarding the CT image data: The exposed carbon reinforcement can distinctly be perceived in both reconstructions. Moreover, all dark spots correspond to air voids in the beams. In this context, it can be noticed that there appear to be significantly more pores in the samples of experiment 1. This phenomenon may potentially be due to some vibrational compaction that was used for the beams of experiment 2 during the casting process to ensure full penetration of the close-meshed reinforcement cage. Further detailed information with respect to quality control (assessment of the concrete cover and porosity of the manufactured beams) is given in [39]. It is also important to note that the aggregate of the concrete is not visible in either of the volumes, which can be attributed to the high energy employed for imaging in this study, as the use of high radiation energy tends to introduce remarkable noise into the reconstructions. Although it was necessary for the X-rays to be able to traverse the specimens, in turn it leads to a considerable loss in structural detail and concurrently a significant reduction in texture necessary for feasibly using the DVC method.
The following sections focus on the comparison of the applied measurement techniques in order to assess the capacity of the CT scans to provide meaningful quantitative information on crack locations and widths. Therefore, samples 1A and 1B as well as sample 2A are examined in detail. Note that the crack indicated with no. 4 in sample 1B occurred at a load level above 6 kN (last load step with CT scan) and, therefore, does not appear in the further analysis. The orange areas in Figure 6a represent the regions where data were available for all methods used. Sample 2B is not taken into consideration since the strain signal was strongly smeared, probably due to a delamination of the DFOS from the reinforcement.

3.1. Crack Detection
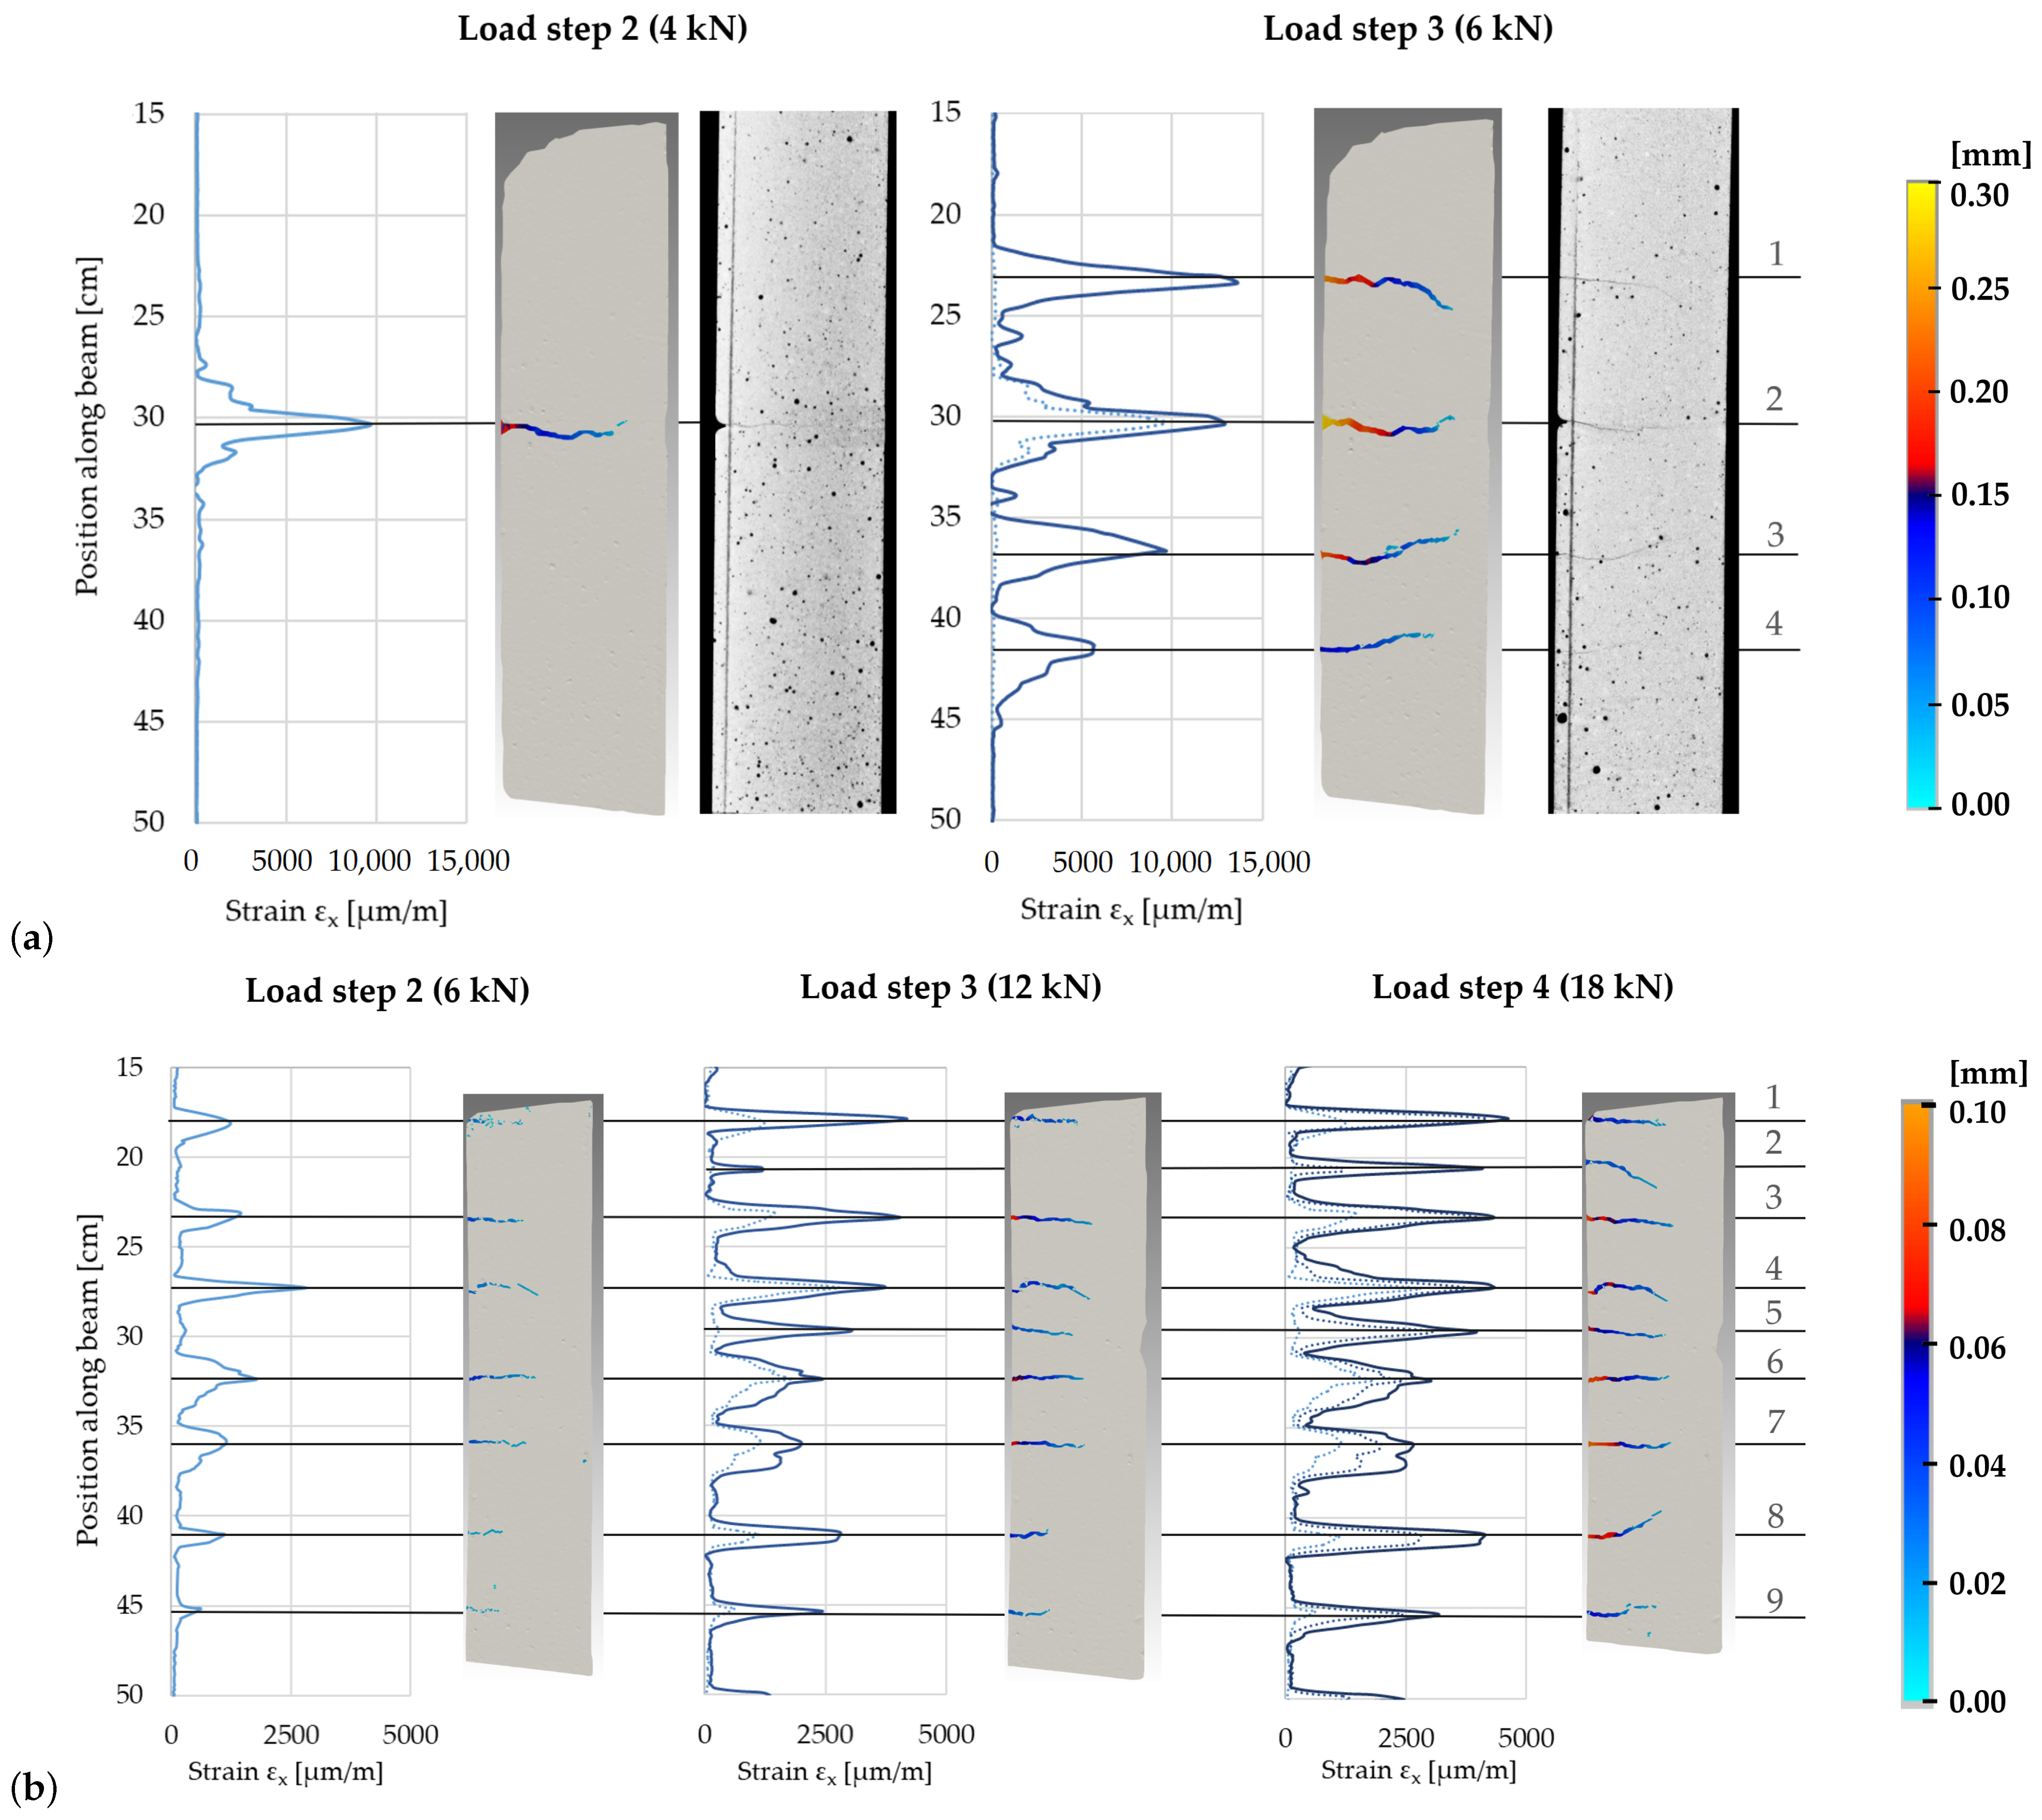
In Figure 7, the locations of the cracks detected by the applied measurement methods at different load levels are compared for sample A of the two experiments. Since no cracks were detected at 2 kN, load step 1 is not considered. For the remaining load steps, the DFOS strain profiles are displayed for the center section of the beams. The crack locations can be clearly identified as local maxima. However, the peak values for sample 2A only amount to approximately one-third compared to the strain peaks for sample 1A. This is also reflected in the adjacent illustrations, where the cracks obtained from the DIC measurements on the front surface are shown as a color-coded visualization corresponding to the crack widths (scales on the right side). Since the resolution of the CT scans was not high enough to unequivocally detect the small cracks in sample 2A, longitudinal slices of the CT reconstructions are only given for sample 1A.
For this beam, all measurement techniques show an excellent agreement regarding the amount and spacing of the detected cracks for load steps 2 and 3 (Figure 7a). The cracks detected by the DFOS and DIC in sample 2A (Figure 7b) are generally in very good accordance as well. In the third load step, a crack is detected by the DFOS at x ≈ 25 cm, which is not yet visible in the DIC measurement. A look at the last load step proves that this is not an erroneously detected crack, as the DFOS strain peak increases and the corresponding crack (no. 2) also emerges in the DIC images. This illustrates the high sensitivity of the employed ORMOCER DFOS.

3.2. Crack Widths

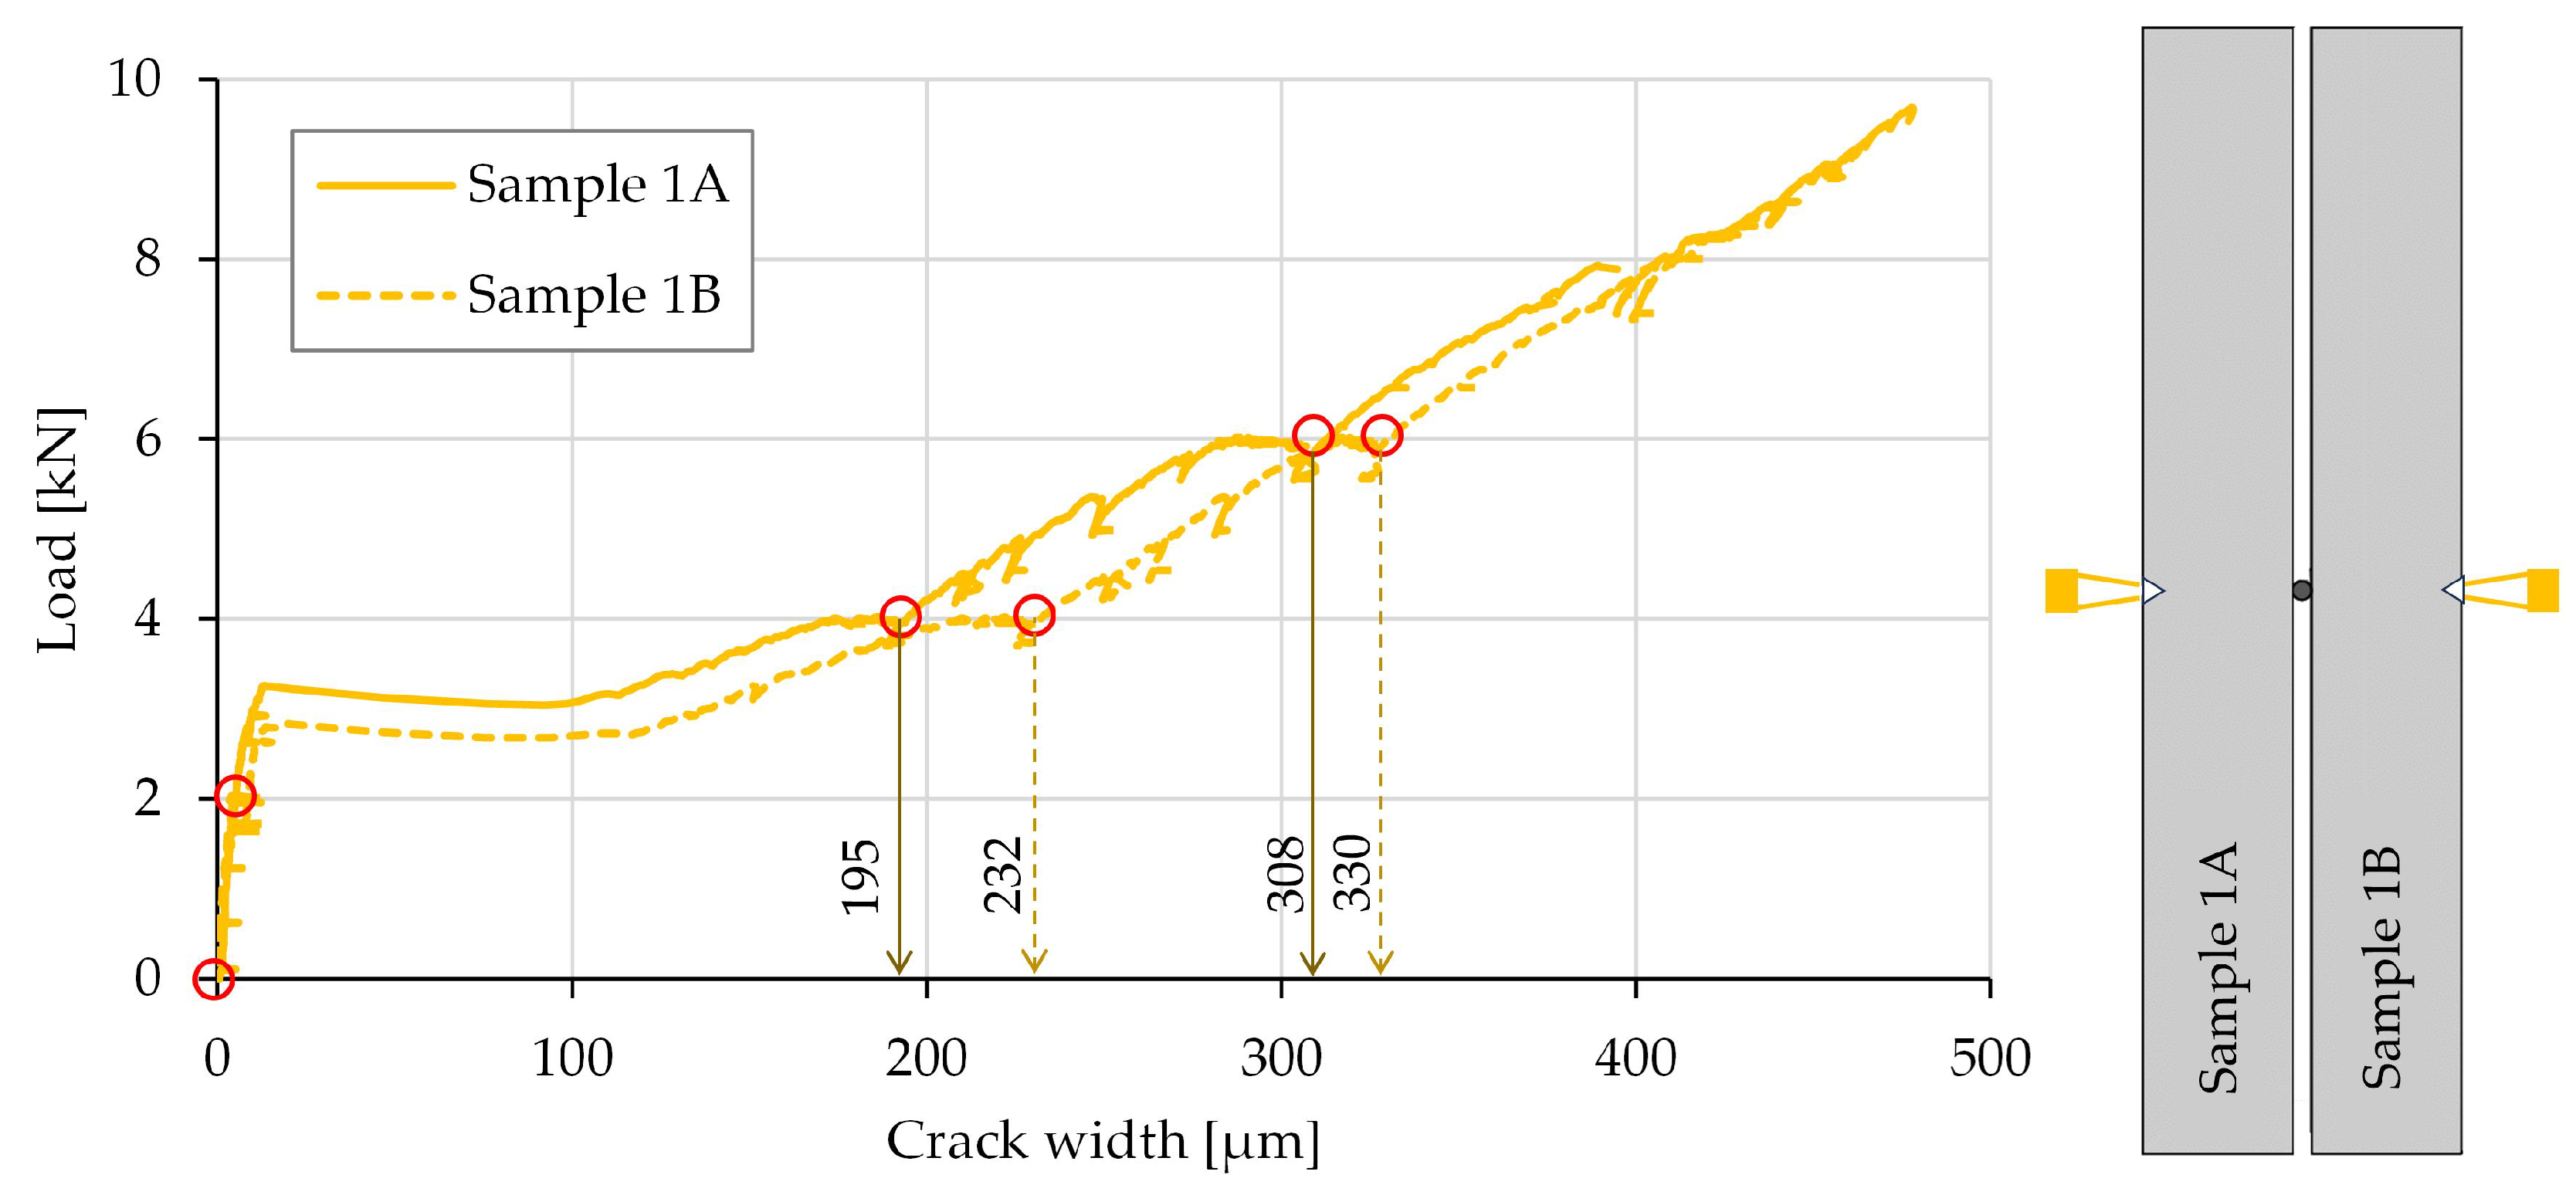
Figure 8 shows the crack evolution during loading for the cracks at the notches in experiment 1 measured with clip gauges. The load levels at which CT scans were performed (0, 2, 4, and 6 kN) are marked in red and complemented with indication of the crack widths corresponding to load steps 2 and 3. A small load decrease can be observed at these points, which is due to load relaxation during the CT scanning process.
Clip gauges can generally serve as a good reference because of their high accuracy, which does not require further evaluation, since displacement transducers are a long established technology and well known. Yet, due to the test setup, measurement data are only available for the two cracks at the notches. In addition, the crack opening distance is not suitable for a comparison with the crack widths determined by the DFOS, since the ladder provides information about in-depth crack openings. Thus, the local crack width measurements from the clip gauges are at first compared with the corresponding crack width values obtained from DIC at the outer edge of the sample surfaces for load steps 2 and 3 in Table 5.
The comparison shows that DIC delivers slightly lower results, but since an average deviation from the clip gauges of only 0.01 mm (maximum 0.02 mm) is revealed, the DIC measurements proved their great accuracy and will be considered as the reference method in the following discussion.
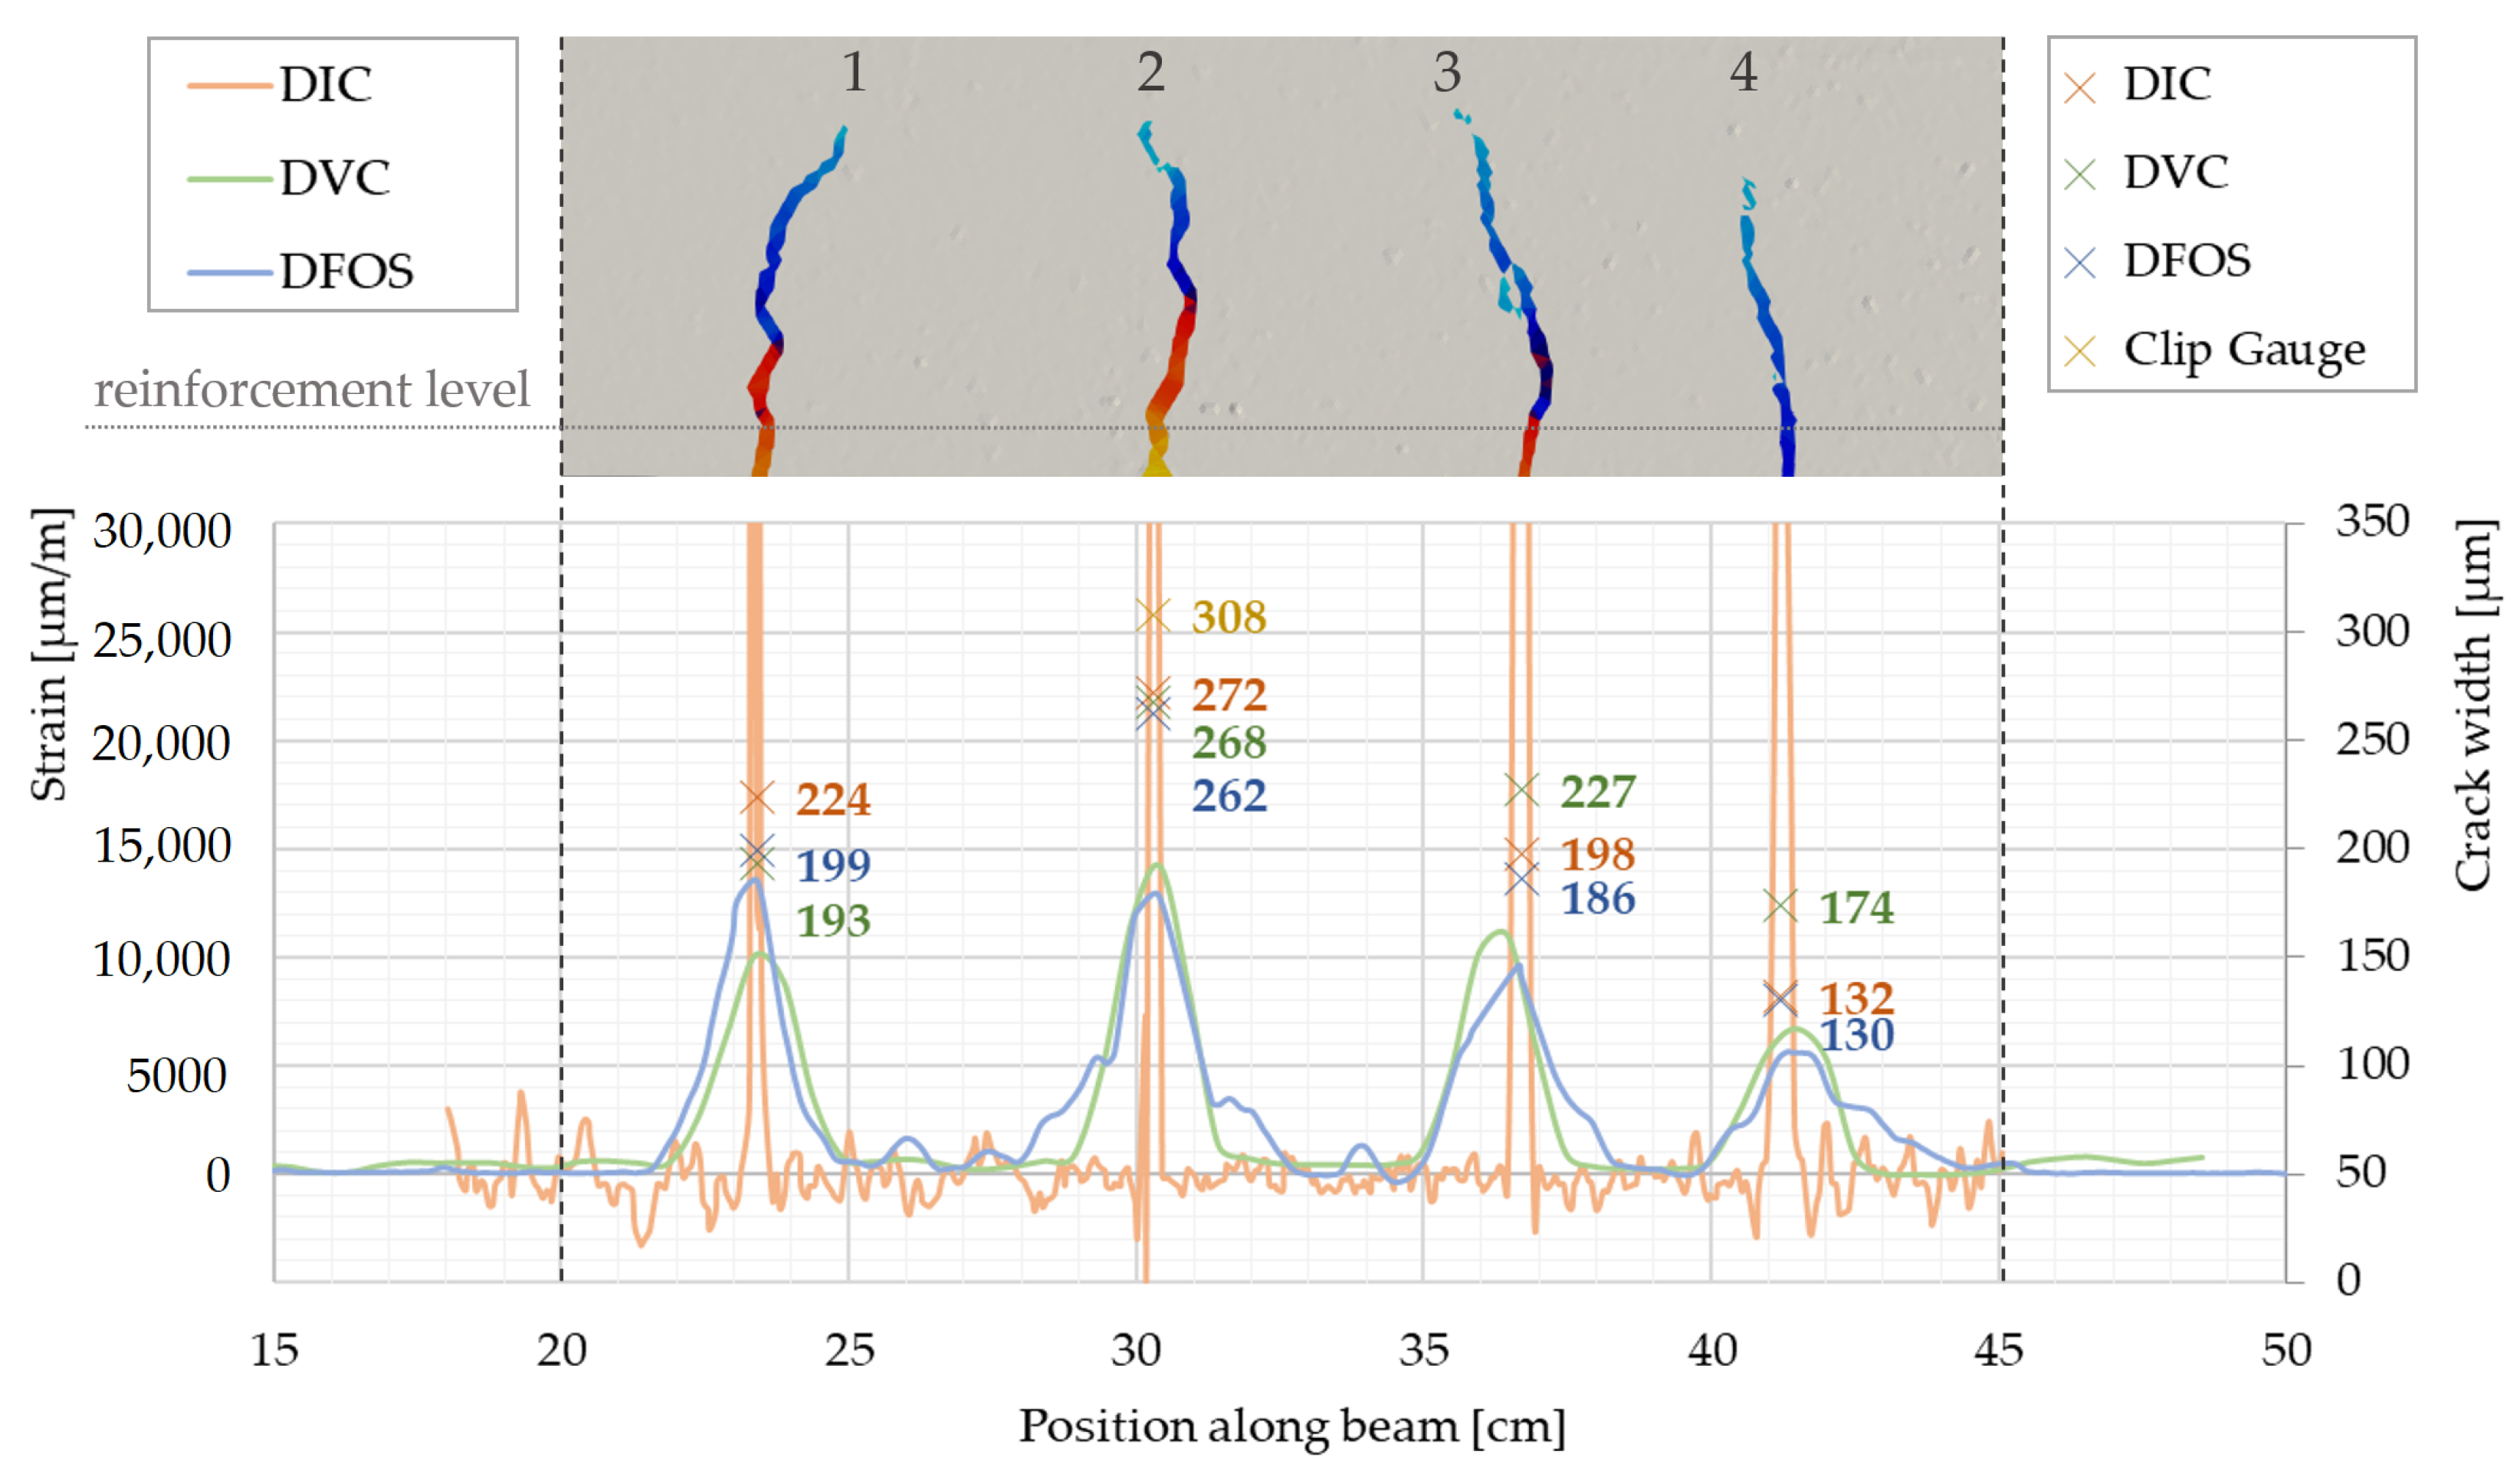
In Figure 9, the crack widths obtained from all measurement methods used are indicated by crosses using the examples of the four cracks that formed in sample 1A at a load stage of 6 kN. In order to facilitate the comparison of the crack locations, an illustration of the actual crack pattern on the concrete surface computed by DIC at the same load step has been added. Furthermore, the surface and internal strain profiles along a horizontal line at the level of the reinforcement are drawn as an overlay. All strain curves provide an appropriate way to identify the location of the individual cracks, which appear as pronounced peaks. While the strains measured by DVC are very similar to the DFOS measurements, the DIC strains in the cracked cross-sections approach infinity. The local maxima vary in width and amplitude due to the different spatial resolution (sampling rate) of the displacement points used for the strain computation. With respect to the crack widths, an overall fair agreement between the methods can be observed. Note that the crack openings were also calculated at the height of the reinforcement, since the DFOS was attached to the carbon grid. The result from the clip gauge was added to the plot for completeness. Since this measurement was performed at a greater distance from the neutral axis of the beam, it is plausible that a larger value was obtained.
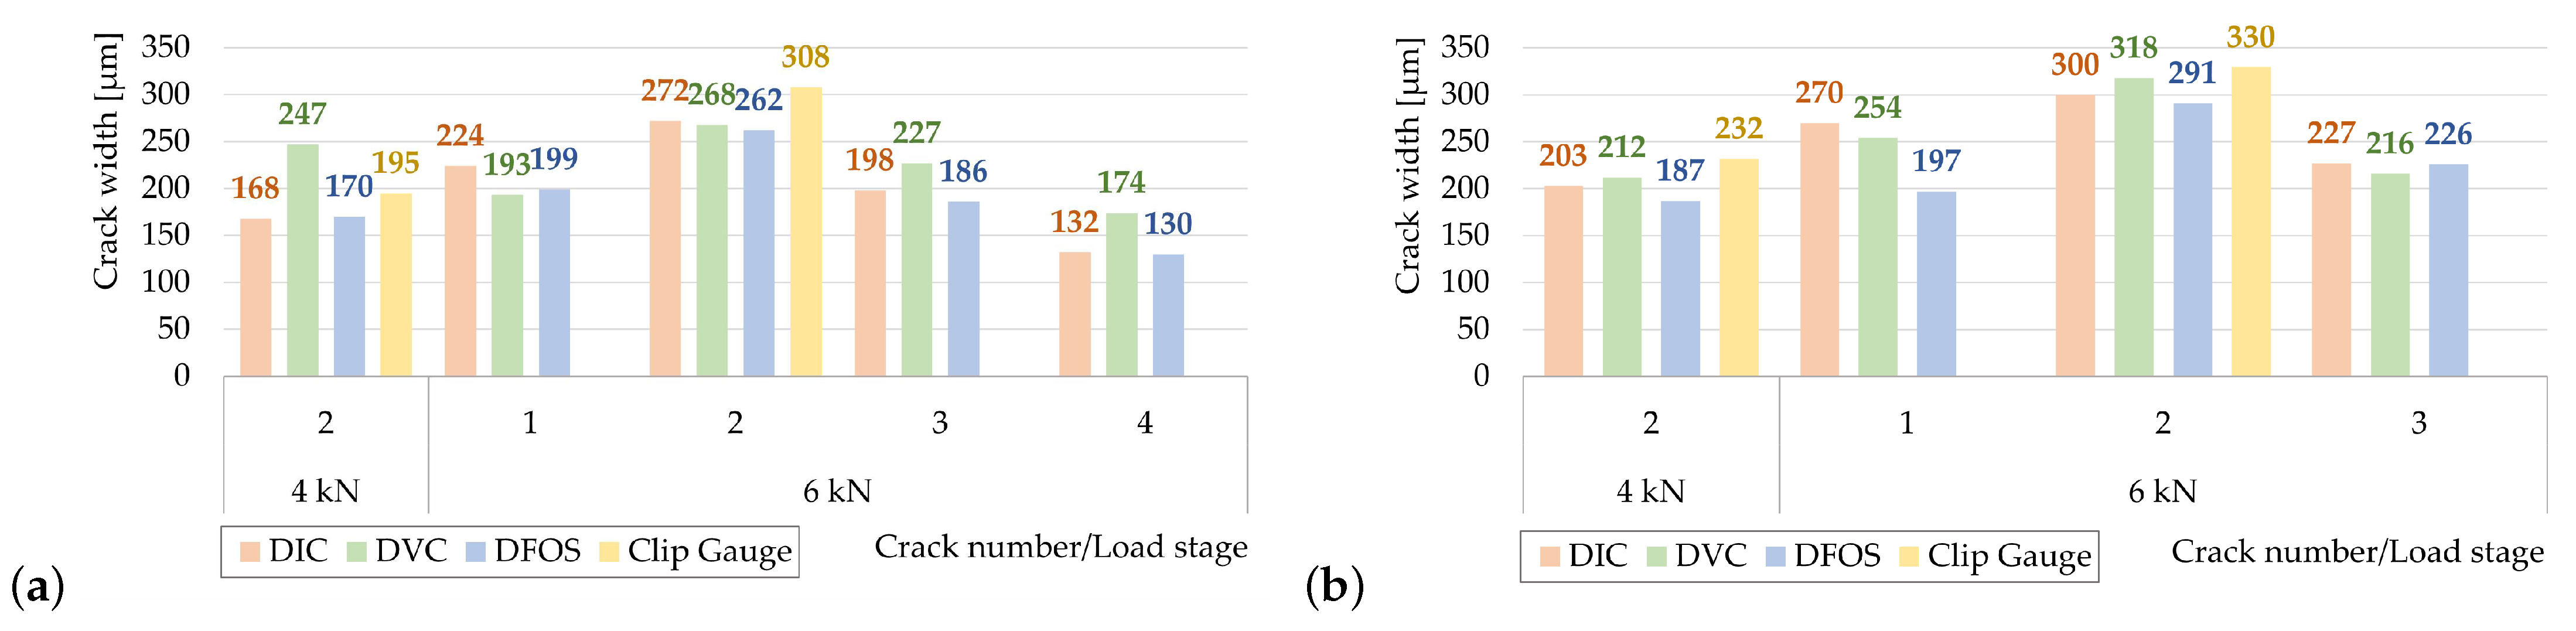
The bar charts in Figure 10 present the crack widths estimated by the different measurement techniques for samples 1A and 1B at load steps 2 and 3. The results from the clip gauge measurements at crack no. 2 of each beam are again listed for completeness.
It can be observed that the crack width calculations generally correlate well. In order to evaluate the accuracy of the measurement techniques with regard to the crack width calculation, the crack openings on the surface obtained by means of DIC are used as reference values. The error difference between the crack width estimations is listed for each of the individual cracks in Table 6. It is defined as
e = w cr , DVC / DFOS w cr , DIC
with
e= error (measurement deviation);
w cr , DVC = crack width from DVC;
w cr , DFOS = crack width from DFOS (calculated by integration of strain profile);
w cr , DIC = reference crack width from DIC.
It can be seen that almost all of the crack widths obtained from the DFOS underestimate the DIC values. However, the errors are smaller than 0.03 mm with the exception of one outlier (crack no. 1 of sample 1B), which shows a rather large deviation of about 0.07 mm. The fact that the calculation is based on measurements that were taken with an actual difference in crack depth may account in part for the observed deviations, since the crack width at the surface may be potentially larger than at the reinforcement level (crack closing in the direction of the reinforcement). Even though the crack opening analysis of the CT scan was performed at the same location as the DFOS, no consistent underestimation can be determined for the values calculated by DVC, since positive and negative errors are approximately equally distributed in this case. Except for crack no. 1 in sample 1A at load step 2 (4 kN), where the result underestimated the DIC crack width by 0.08 mm, the errors were within the range of ±0.04 mm.
Neglecting the mentioned outliers, the crack width calculation by DVC shows an absolute mean deviation of ±0.02 mm, while the mean error in the DFOS estimation is only ±0.01 mm.
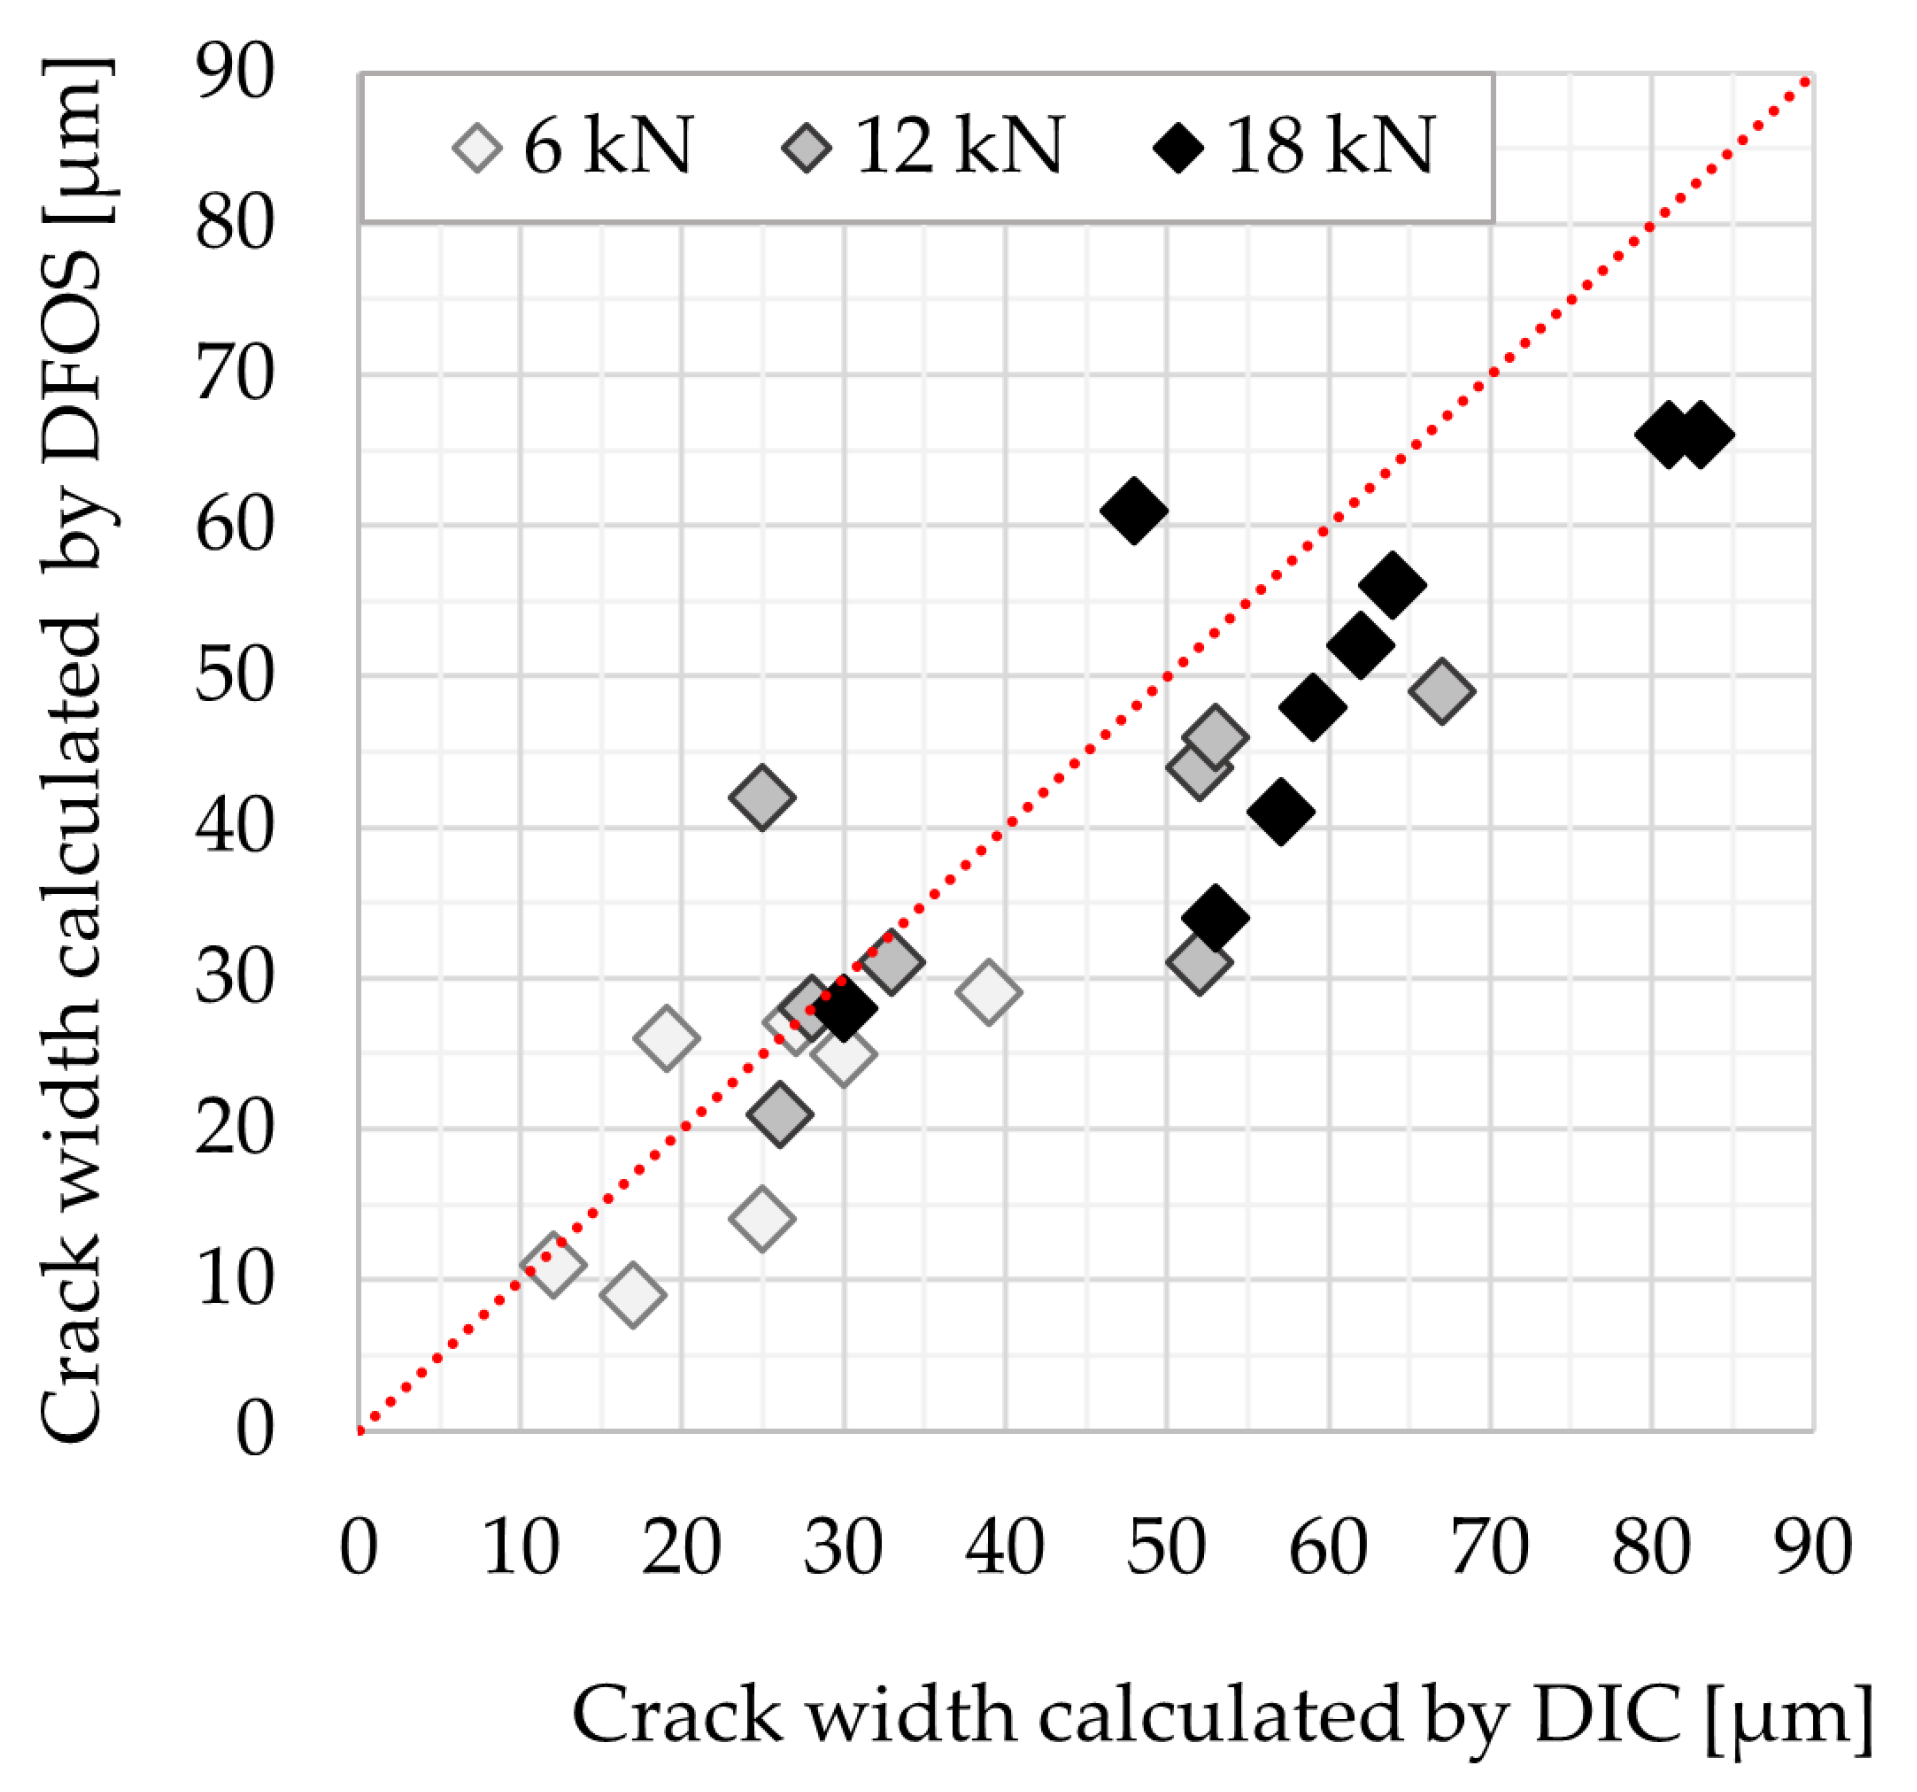
For experiment 2, the quality of the CT data was not suitable for estimating the significantly smaller crack widths with the DVC method due to the lack of texture, with the achieved resolution resulting in a large voxel size of about 126 µm as well as unfavorable noise. With the DIC and DFOS measurements, crack widths between 0.01 mm (imperceptible to the naked eye) and 0.08 mm were detected. The diagram in Figure 11 compares the crack widths in sample 2A determined from both techniques for the load steps 2, 3, and 4. The red angle bisector marks a perfect accordance of the results. The tendency of underestimating the crack widths calculated by DFOS is apparent as well. But overall, only very small discrepancies are observed, as the mean absolute deviation is merely ±0.01 mm (maximum absolute error of 0.02 mm). It can be concluded that the DFOS crack widths showed a high agreement with the DIC measurements.
Comparing the crack widths of this beam with the samples of experiment 1, the positive influence of the higher reinforcement ratio on the mechanical crack behavior is clearly visible. This is particularly evident when looking at samples 1A and 2A at the same load level of 6 kN (see Figure 7): While beam 1A is in the final crack state, showing four cracks with a mean crack width of about 0.2 mm, beam 2A had just reached the state of initial crack formation. However, seven cracks could already be detected, but with an average crack width of approximately only 0.02 mm. Due to its larger circumferential surface area, the reinforcement of sample 2A has a better bond effect with the surrounding concrete matrix, resulting in significantly smaller transfer lengths and, thus, crack spacing. The average crack spacing for beam 2A is only about 3.5 cm in the final crack stage (see load step 4), whereas the mean spacing of the cracks of beam 1A is about 6.5 cm (load step 3). For a critical discussion of existing crack width models for CRC components, e.g., [53], further dedicated investigations are required in which either the bond area is varied for the same reinforcement ratio or the reinforcement ratio is varied for the same bond area.

4. Discussion

Different measurements were used for the verification of the CT measurements: stereo image sequences for the surface observation, and DFOS bonded to the reinforcement and additional clip gauges were applied at the notches in the first experiment. There are advantages and disadvantages to all of the applied methods, which are summarized in Table 7 based on the experimental results.
CT emerges as a powerful tool for crack analysis in concrete structures because of its high spatial resolution, which allows a comprehensive and detailed 3D view of the entire structure. Data sets can be extended to 4D when in situ CT is used. Its capability to peer inside the concrete offers invaluable insight into the evolution of cracks, contributing to an accurate understanding of their nature. However, some limitations of CT need to be considered. Due to the low temporal resolution, rapid crack propagation in real-time scenarios cannot be captured. In addition, the extensive data acquisition process and the management of very large data sets can be logistically challenging in terms of time and computational resources. Moreover, the DVC analysis method, which was applied in this study, requires a suitable texture within the concrete, potentially limiting its applicability in uniform structures. Despite these drawbacks, CT remains a pivotal tool in concrete crack analysis, particularly when in-depth, non-destructive investigations are paramount to ensuring structural integrity.
The choice of the measurement technique for crack analysis in reinforced concrete structures depends on factors such as the specific objectives of the investigation, the desired spatial resolution, the required precision, the range of interest (surface or interior), and the available resources. In general, the installation effort increases significantly when measurement techniques with a greater number of dimensions are used. At the same time, higher information density and spatial resolution can be achieved. However, the application of some traditional measurement devices (e.g., inductive displacement transducers or strain gauges) as a reference is highly recommended to enable the evaluation of the measurement accuracy.
Within the scope of this study, damage detection and quantification inside the specimen was enabled by 1D quasi-continuous strain measurements with DFOSs attached to the reinforcement, whereas DIC was able to capture cracks at the surface only, yet, providing information for an entire area (2D crack maps). Regarding the crack openings, the values obtained by the DIC method exhibited an accuracy equivalent to those provided by conventional clip gauges, which are considered the most accurate measuring device, but with the lowest spatial resolution (0D). Therefore, the DIC results were used as reference to assess the accuracy of the DFOS and DVC method in determining the crack widths. Due to the different dimensions of the measurement fields, a comparison was made for cracks appearing in the central half of the beams. The following conclusions can be drawn from this study:
  • The projections obtained from the in situ CT scans could successfully be reconstructed into 3D volumes, allowing a view into the interior of the beams, exposing the embedded carbon reinforcement and contained air voids as well as structural changes as a result of the external bending loads.
  • In experiment 1, all measurement techniques were able to identify multiple cracks in the center section of the beams with well-correlating crack localization. Despite the rather poor resolution as well as noise of the CT data, the evolution of the crack widths could be determined with the DVC method, owing to the high quantity of air voids inside the beams providing the necessary texture. The comparison with the corresponding values obtained by DIC revealed an overall good agreement, with most errors being less than ±30 µm.
  • In addition to the poor structural quality of the reconstruction in combination with the noise present, the lack of texture due to a reduced amount of air voids additionally impeded the detection of cracks in the specimens of experiment 2, where indeed more, but significantly smaller, cracks developed. In this case, the DVC method could not be employed due to the lack of sufficient texture in the voxel data. To enable DVC analysis in future studies, CT system settings, such as appropriate energies, should be adjusted to reduce noise and artifacts. Furthermore, sample-side adjustments, e.g., intentional air voids or small additives with a distinguishable density compared to the cementitious matrix, may be useful to create texture in the CT image data.
  • For sample 2A, both DIC and DFOS were able to precisely localize several cracks. The use of both methods enabled a successful detection of crack formation at an early stage, i.e., for cracks as small as 10 µm. In general, the utilized DFOS adhesive combination proved very suitable for strain measurements at textile reinforcement. An accurate crack distribution in the concrete structure could be derived from the well-defined peaks in the strain profiles due to the stiff bond behavior between the optical fiber and the textile reinforcement. The present, small transfer lengths (distance between maximum and adjacent minimum), allowed a reliable differentiation of the cracks, even with the very fine crack patterns.
  • Increased caution should be taken when installing the filigree DFOSs to prevent them from breaking and to ensure a continuous proper bond to the reinforcement, since a poor quality of the adhesive layer may lead to a smeared strain signal. For the well-functioning DFOSs, the integration of the strain curves allowed the precise determination of the crack openings at the reinforcement level. By neglecting one outlier, the calculated crack widths showed a mean absolute error of only ±0.01 mm compared to the DIC measurements. Continuous strain curves were obtained particularly for crack widths <0.20 mm. For larger crack widths, the risk of signal loss (measuring sections without strain values) increases because the technical limits (maximum strain differences, maximum absolute strains) of the interrogator are exceeded. In addition, the risk of sensor breakage due to excessive strain increases. The DFOS of sample 1A was still functional after the shear crack occurred. However, the signal quality was severely degraded due to high strain.

5. Conclusions

In situ CT can serve as an insightful approach to gain a better understanding of the load-bearing and deformation behavior of structures under damage progression. The focus of this study was on the application of the DVC method to 4D computed tomography data and its feasibility to provide quantitative information on the cracking process (crack detection, localization, and crack width calculation) in CRC beams by examining samples with two different geometries and reinforcement configurations in three-point bending tests. Similar to the surface analysis with DIC, the DVC method requires a suitable texture in the obtained voxel data in order to perform successfully. For the beams with crack openings >0.1 mm up to 0.3 mm, the crack width calculation delivered satisfactory results. While DIC and DFOS measurements were able to detect crack formation at an early stage (<0.1 mm), the DVC method failed in this regard due to high noise and a lack of texture in the CT data.
Future studies will be conducted on real-scale CRC specimens in the CT device at RPTU in Kaiserslautern (tomography portal Gulliver) aiming at the 3D mapping of crack development in large beams subjected to bending load. They should focus on other reinforcement designs and properties as well as beam geometries in order to further investigate, for example, the complex load-bearing mechanisms in the shear behavior of CRC components.

Author Contributions

Conceptualization, J.G., M.H., F.L., F.W., S.G., C.d.S. and B.B.; methodology, J.G., M.H., F.L., F.W., S.G. and C.d.S.; software, F.L., F.W. and M.H.; validation, J.G., M.H., F.L., F.W., S.G. and C.d.S.; formal analysis, J.G., M.H., F.L., F.W., S.G. and C.d.S.; investigation, J.G., F.L., F.W., S.G. and C.d.S.; resources, M.P., H.-G.M. and S.M.; data curation, J.G., M.H., F.L., F.W., S.G. and C.d.S.; writing—original draft preparation, J.G., M.H., F.L., F.W., S.G. and C.d.S.; writing—review and editing, B.B., M.P., H.-G.M., S.M. and M.C.; visualization, J.G., F.L., F.W., S.G. and C.d.S.; supervision, B.B., M.P., H.-G.M., S.M. and M.C.; project administration, B.B., M.P., H.-G.M., S.M. and M.C.; funding acquisition, M.P., H.-G.M., S.M. and M.C. All authors have read and agreed to the published version of the manuscript.

Funding

The research work presented in the publication has been funded by the Deutsche Forschungsgemeinschaft (DFG, German Research Foundation)—CRC/TRR 280; Projekt-ID: 417002380 and the German Federal Ministry for Digital and Transport; funding reference: 19FS2013A. The article processing charges (APC) were funded by the joint publication funds of the TU Dresden, including Carl Gustav Carus Faculty of Medicine, and the SLUB Dresden as well as the Open Access Publication Funding of the DFG.

Data Availability Statement

The data presented in this study are available on request from the corresponding authors. The data are not publicly available due to ongoing study.

Acknowledgments

The project is funded by the Deutsche Forschungsgemeinschaft (DFG, German Research Foundation)—CRC/TRR 280 (project ID 417002380). The authors would like to thank the funding authority for their financial support and the staff of the Civil Engineering Department of RPTU Kaiserslautern-Landau, TU Dresden and Fraunhofer EZRT institute in Fürth for their support extended during the experimental works carried out in the laboratory. This paper also presents some of the results of the research project IDA-KI (Automated assessment of monitoring data for infrastructure constructions using AI and IoT) funded by the Federal Ministry for Digital and Transport, Germany, within the innovation program mFUND (funding reference: 19FS2013A).

Conflicts of Interest

The authors declare no conflict of interest. The funders had no role in the design of the study; in the collection, analyses, or interpretation of data; in the writing of the manuscript; or in the decision to publish the results.

Abbreviations

The following abbreviations are used in this manuscript:
CRCCarbon-reinforced concrete
CTComputed tomography
DICDigital image correlation
DVCDigital volume correlation
DFOSDistributed fiber optic sensor

References

  1. Krausmann, F.; Lauk, C.; Haas, W.; Wiedenhofer, D. From resource extraction to outflows of wastes and emissions: The socioeconomic metabolism of the global economy, 1900–2015. Glob. Environ. Chang. 2018, 52, 131–140. [Google Scholar] [CrossRef] [PubMed]
  2. Reichenbach, S.; Preinstorfer, P.; Hammerl, M.; Kromoser, B. A review on embedded fibre-reinforced polymer reinforcement in structural concrete in Europe. Constr. Build. Mater. 2021, 307, 124946. [Google Scholar] [CrossRef]
  3. Khalilpour, S.; BaniAsad, E.; Dehestani, M. A review on concrete fracture energy and effective parameters. Cem. Concr. Res. 2019, 120, 294–321. [Google Scholar] [CrossRef]
  4. Ajovalasit, A. Advances in Strain Gauge Measurement on Composite Materials. Strain 2011, 47, 313–325. [Google Scholar] [CrossRef]
  5. Xu, S.; Li, Q.; Wu, Y.; Dong, L.; Lyu, Y.; Reinhardt, H.W.; Leung, C.K.Y.; Ruiz, G.; Kumar, S.; Hu, S. RILEM Standard: Testing methods for determination of the double-K criterion for crack propagation in concrete using wedge-splitting tests and three-point bending beam tests, recommendation of RILEM TC265-TDK. Mater. Struct. 2021, 54, 220. [Google Scholar] [CrossRef]
  6. Bado, M.F.; Casas, J.R. A Review of Recent Distributed Optical Fiber Sensors Applications for Civil Engineering Structural Health Monitoring. Sensors 2021, 21, 1818. [Google Scholar] [CrossRef]
  7. Bado, M.F.; Casas, J.R.; Barrias, A. Performance of Rayleigh-Based Distributed Optical Fiber Sensors Bonded to Reinforcing Bars in Bending. Sensors 2018, 18, 3125. [Google Scholar] [CrossRef]
  8. Becks, H.; Bielak, J.; Camps, B.; Hegger, J. Application of fiber optic measurement in textile–reinforced concrete testing. Struct. Concr. 2021, 23, 2600–2614. [Google Scholar] [CrossRef]
  9. Koschemann, M.; Curbach, M.; Marx, S. Investigation of local bond behavior using distributed optical fiber sensing. In Proceedings of the 5th nternational Conference Bond in Concrete, Stuttgart, Germany, 25–27 July 2022; Hofmann, J., Plizzari, G., Eds.; Universität Stuttgart: Stuttgart, Germany, 2022; pp. 133–145. [Google Scholar]
  10. Lemcherreq, Y.; Galkovski, T.; Mata-Falcón, J.; Kaufmann, W. Application of Distributed Fibre Optical Sensing in Reinforced Concrete Elements Subjected to Monotonic and Cyclic Loading. Sensors 2022, 22, 2023. [Google Scholar] [CrossRef]
  11. Grzesiak, S.; Schultz-Cornelius, M.; Pahn, M. Experimental and analytical evaluation of externally bonded BFRP and CFRP strips on the load-bearing behaviour of reinforced concrete structures using distributed fibre optic sensing. Constr. Build. Mater. 2023, 400, 132452. [Google Scholar] [CrossRef]
  12. Herbers, M.; Richter, B.; Gebauer, D.; Classen, M.; Marx, S. Crack monitoring on concrete structures: Comparison of various distributed fiber optic sensors with digital image correlation method. Struct. Concr. 2023, 1464–4177. [Google Scholar] [CrossRef]
  13. Berrocal, C.G.; Fernandez, I.; Rempling, R. Crack monitoring in reinforced concrete beams by distributed optical fiber sensors. Struct. Infrastruct. Eng. 2020, 17, 124–139. [Google Scholar] [CrossRef]
  14. Fischer, O.; Thoma, S.; Crepaz, S. Distributed fiber optic sensing for crack detection in concrete structures. Civ. Eng. Des. 2019, 1, 97–105. [Google Scholar] [CrossRef]
  15. Zdanowicz, K.; Gebauer, D.; Koschemann, M.; Speck, K.; Steinbock, O.; Beckmann, B.; Marx, S. Distributed fiber optic sensors for measuring strains of concrete, steel, and textile reinforcement: Possible fields of application. Struct. Concr. 2022, 23, 3367–3382. [Google Scholar] [CrossRef]
  16. Weisbrich, M.; Holschemacher, K. Comparison between different fiber coatings and adhesives on steel surfaces for distributed optical strain measurements based on Rayleigh backscattering. J. Sensors Sens. Syst. 2018, 7, 601–608. [Google Scholar] [CrossRef]
  17. Howiacki, T.; Sieńko, R.; Bednarski, Ł.; Zuziak, K. Crack Shape Coefficient: Comparison between Different DFOS Tools Embedded for Crack Monitoring in Concrete. Sensors 2023, 23, 566. [Google Scholar] [CrossRef]
  18. Zhang, S.; Liu, H.; Govindjee, S.; DeJong, M.J. Strain Transfer Mechanisms and Mechanical Properties of Optical Fiber Cables. Sensors 2022, 22, 9966. [Google Scholar] [CrossRef]
  19. Sutton, M.A.; Orteu, J.J.; Schreier, H. Image Correlation for Shape, Motion and Deformation Measurements: Basic Concepts, Theory and Applications, 1st ed.; Springer: New York, NY, USA, 2009. [Google Scholar] [CrossRef]
  20. Helfrick, M.N.; Niezrecki, C.; Avitabile, P.; Schmidt, T. 3D digital image correlation methods for full-field vibration measurement. Mech. Syst. Signal Process. 2011, 25, 917–927. [Google Scholar] [CrossRef]
  21. Czaderski-Forchmann, C. Strengthening of Reinforced Concrete Members by Prestressed, Externally Bonded Reinforcement with Gradient Anchorage. Ph.D. Thesis, ETH Zurich, Zürich, Switzerland, 2012. [Google Scholar] [CrossRef]
  22. Bay, B.K.; Smith, T.S.; Fyhrie, D.P.; Saad, M. Digital Volume Correlation: Three-dimensional Strain Mapping Using X-ray Tomography. Exp. Mech. 1999, 39, 217–226. [Google Scholar] [CrossRef]
  23. Yang, J.; Hazlett, L.; Landauer, A.K.; Franck, C. Augmented Lagrangian Digital Volume Correlation (ALDVC). Exp. Mech. 2020, 60, 1205–1223. [Google Scholar] [CrossRef]
  24. Geers, M.G.D.; De Borst, R.; Brekelmans, W.A.M. Computing strain fields from discrete displacement fields in 2D-solids. Int. J. Solids Struct. 1996, 33, 4293–4307. [Google Scholar] [CrossRef]
  25. Liebold, F.; Maas, H.G.; Deutsch, J. Photogrammetric determination of 3D crack opening vectors from 3D displacement fields. ISPRS J. Photogramm. Remote. Sens. 2020, 164, 1–10. [Google Scholar] [CrossRef]
  26. Liebold, F.; Maas, H.G. 3D-Deformationsanalyse und Rissdetektion in multitemporalen Voxeldaten von Röntgentomographen. In Proceedings of the Dreiländertagung der DGPF, OVG und SGPF Photogrammetrie—Fernerkundung—Geoinformation, Dresden, Germany, 5–6 October 2022; Kersten, T.P., Tilly, N., Eds.; 2022; Volume 30, pp. 105–116. [Google Scholar] [CrossRef]
  27. Jung, C.; Nowacka, A.; Barisin, T.; Meinel, D.; Paetsch, O.; Grzesiak, S.; Salamon, M.; Schladitz, K.; Redenbach, C.; Pahn, M. 3d imaging and analysis of cracks in loaded concrete samples. In Proceedings of the 12th Conference on Industrial Computed Tomography (iCT 2023), Fürth, Germany, 27 February–2 March 2023. [Google Scholar] [CrossRef]
  28. Grzesiak, S.; Pahn, M.; Basters, R.; de Sousa, C. Application of the Computed Tomography in Structural Engineering. In Lecture Notes in Civil Engineering. Proceedings of the International Symposium of the International Federation for Structural Concrete; Springer: Cham, Switzerland, 2023; pp. 1903–1912. [Google Scholar] [CrossRef]
  29. Sidiq, A.; Gravina, R.J.; Setunge, S.; Giustozzi, F. High-efficiency techniques and micro-structural parameters to evaluate concrete self-healing using X-ray tomography and Mercury Intrusion Porosimetry: A review. Constr. Build. Mater. 2020, 252, 119030. [Google Scholar] [CrossRef]
  30. Skarźyński, Ł.; Suchorzewski, J. Mechanical and fracture properties of concrete reinforced with recycled and industrial steel fibers using Digital Image Correlation technique and X-ray micro computed tomography. Constr. Build. Mater. 2018, 183, 283–299. [Google Scholar] [CrossRef]
  31. Brisard, S.; Serdar, M.; Monteiro, P.J. Multiscale X-ray tomography of cementitious materials: A review. Cem. Concr. Res. 2020, 128, 105824. [Google Scholar] [CrossRef]
  32. Vicente, M.A.; González, D.C.; Mínguez, J. Recent advances in the use of computed tomography in concrete technology and other engineering fields. Micron 2019, 118, 22–34. [Google Scholar] [CrossRef]
  33. du Plessis, A.; Boshoff, W.P. A review of X-ray computed tomography of concrete and asphalt construction materials. Constr. Build. Mater. 2019, 199, 637–651. [Google Scholar] [CrossRef]
  34. Landis, E.N.; Zhang, T.; Nagy, E.; Nagy, G.; Franklin, W.R. Cracking, damage and fracture in four dimensions. Mater. Struct. 2007, 40, 357–364. [Google Scholar] [CrossRef]
  35. Yang, Z.; Ren, W.; Sharma, R.; McDonald, S.; Mostafavi, M.; Vertyagina, Y.; Marrow, T. In-situ X-ray computed tomography characterisation of 3D fracture evolution and image-based numerical homogenisation of concrete. Cem. Concr. Compos. 2017, 75, 74–83. [Google Scholar] [CrossRef]
  36. Koudelka, P.; Fila, T.; Rada, V.; Zlamal, P.; Sleichrt, J.; Vopalensky, M.; Kumpova, I.; Benes, P.; Vavrik, D.; Vavro, L.; et al. In-situ X-ray Differential Micro-tomography for Investigation of Water-weakening in Quasi-brittle Materials Subjected to Four-point Bending. Materials 2020, 13, 1405. [Google Scholar] [CrossRef]
  37. Li, N.; Zhao, Y.; Xing, Y.; He, X.; Li, H. Meso-damage analysis of concrete based on X-ray CT in-situ compression and using deep learning method. Case Stud. Constr. Mater. 2023, 18, e02118. [Google Scholar] [CrossRef]
  38. Beckmann, B.; Bielak, J.; Bosbach, S.; Scheerer, S.; Schmidt, C.; Hegger, J.; Curbach, M. Collaborative research on carbon reinforced concrete structures in the CRC/TRR 280 project. Civ. Eng. Des. 2021, 3, 99–109. [Google Scholar] [CrossRef]
  39. Liebold, F.; Wagner, F.; Giese, J.; Grzesiak, S.; de Sousa, C.; Beckmann, B.; Pahn, M.; Marx, S.; Curbach, M.; Maas, H.G. Damage Analysis and Quality Control of Carbon Reinforced-Concrete Beams based on In Situ Computed Tomography Tests. Buildings, 2023; under review. [Google Scholar]
  40. Wilhelm Kneitz Solutions in Textile. Data Sheet of SITgrid040. 2020. Available online: https://solutions-in-textile.com/ (accessed on 4 September 2023).
  41. Action Composites. Data Sheet of Carbon4ReBAR (C4R). 2020. Available online: https://www.action-composites.com/carbon4rebar/ (accessed on 4 September 2023).
  42. Lieboldt, M.; Tietze, M.; Schladitz, F. C3-Projekt—Erfolgreiche Partnerschaft für Innovation im Bauwesen. Bauingenieur 2018, 93, 265–273. [Google Scholar] [CrossRef]
  43. Schneider, K.; Butler, M.; Mechtcherine, V. Carbon Concrete Composites C3—Nachhaltige Bindemittel und Betone für die Zukunft. Beton-Und Stahlbetonbau 2017, 112, 784–794. [Google Scholar] [CrossRef]
  44. DIN EN 206:2021-06; Concrete—Specification, Performance, Production and Conformit. German Version EN 206:2013+A2:2021. British Standards Institution, Her Majesty Stationery Office: London, UK, 2013.
  45. DIN EN 196-1:2016-11; Methods of Testing Cement—Part 1: Determination of Strength. German Version EN 196-1:2016. Turkish Standards Institute: Ankara, Turkey, 2016.
  46. Giese, J.; Spartali, H.; Beckmann, B.; Schladitz, F.; Chudoba, R. Experimental Investigation on the Buckling Behavior of Slender TRC Structures. In Proceedings of the Fib Symposium 2023, Building for the Future: Durable, Sustainable, Resilient, Istanbul, Turkey, 5–7 June 2023; Ilki, A., Çavunt, D., Çavunt, Y.S., Eds.; Springer: Cham, Switzerland, 2023; pp. 1398–1407. [Google Scholar] [CrossRef]
  47. Noo, F.; Defrise, M.; Clackdoyle, R.; Kudo, H. Image reconstruction from fan-beam projections on less than a short scan. Phys. Med. Biol. 2002, 47, 2525. [Google Scholar] [CrossRef]
  48. Weisbrich, M.; Holschemacher, K.; Bier, T. Comparison of different fiber coatings for distributed strain measurement in cementitious matrices. J. Sensors Sens. Syst. 2020, 9, 189–197. [Google Scholar] [CrossRef]
  49. Bremer, K.; Alwis, L.S.M.; Zheng, Y.; Weigand, F.; Kuhne, M.; Helbig, R.; Roth, B. Durability of Functionalized Carbon Structures with Optical Fiber Sensors in a Highly Alkaline Concrete Environment. Appl. Sci. 2019, 9, 2476. [Google Scholar] [CrossRef]
  50. Habel, W. Faseroptische Sensoren für Hochaufgelöste Verformungsmessungen in der Zementsteinmatrix: Forschungsbericht 246; Wirtschaftsverlag NW: Bremerhaven, Germany, 2003. [Google Scholar]
  51. Henault, J.M.; Quiertant, M.; Delepine-Lesoille, S.; Salin, J.; Moreau, G.; Taillade, F.; Benzarti, K. Quantitative strain measurement and crack detection in RC structures using a truly distributed fiber optic sensing system. Constr. Build. Mater. 2012, 37, 916–923. [Google Scholar] [CrossRef]
  52. Richter, B.; Herbers, M.; Marx, S. Crack Monitoring on Concrete Structures with Distributed Fiber Optic Sensors—Towards Automated Data Evaluation and Assessment. Struct. Concr. 2023; in press. [Google Scholar] [CrossRef]
  53. Hansl, M.; Feix, J. Untersuchung der Rissbreiten in textilbewehrten Betonen. Beton-Und Stahlbetonbau 2015, 110, 410–418. [Google Scholar] [CrossRef]
Figure 1. Test setup: (a) Scheme of the three-point bending test setup. (b) Test rig (experiment 1). 1: hydraulic cylinder; 2: load cell; 3: CRC samples; 4: clip gauge; 5: protective tube for the pigtail of the DFOS. (c) Illustration of whole setup. 6: stereo camera system; 7: data acquisition station; 8: fiber optic measurement system; 9: X-ray source; 10: X-ray detector.
Buildings 13 02595 g001
Figure 2. Geometry and reinforcement layout of the samples for the experiments.
Buildings 13 02595 g002
Figure 3. Textile reinforcement used in the study: (a) carbon grid; (b) carbon rebar.
Buildings 13 02595 g003
Figure 4. Sample preparation: (a) textile reinforcement with DFOS and spacers; (b) casting process; (c) notch in beam for experiment 1.
Buildings 13 02595 g004
Figure 5. Scheme of CT device: 1: X-ray source; 2: X-rays; 3: samples; 4: rotating sample plate; 5: projection; on 6: X-ray detector. Reprinted with permission from Ref. [39]. 2023, F. Wagner.
Buildings 13 02595 g005
Figure 6. Crack patterns: (a) crack map of the samples’ front side at the end of the experiments (experiment 1 with bending shear failure at 9.6 kN and experiment 2 with bending cracks at 20 kN). (b) CT reconstructions for last load step scanned (experiment 1 at 6 kN and experiment 2 at 18 kN). Illustration (b) adapted with permission from Ref. [39]. 2023, F. Wagner.
Buildings 13 02595 g006
Figure 7. Comparison of locations of detected cracks with the applied measurement techniques at different load steps: (a) sample 1A—DFOS, photogrammetry, CT; (b) sample 2A—DFOS, photogrammetry. Illustrations for color-coded cracks reprinted with permission from Ref. [39]. 2023, F. Liebold.
Buildings 13 02595 g007
Figure 8. Load vs. crack width curves for experiment 1, measured with clip gauges.
Buildings 13 02595 g008
Figure 9. Strain profiles and crack widths obtained with DVC, DIC, and DFOS for sample 1A at load step 3 (6 kN). Illustration for color-coded crack widths reprinted with permission from Ref. [39]. 2023, F. Liebold.
Buildings 13 02595 g009
Figure 10. Comparison of the crack widths at load step 2 (4 kN) and load step 3 (6 kN) obtained using the different measurement methods: (a) sample 1A; (b) sample 1B.
Buildings 13 02595 g010
Figure 11. Comparison of crack widths obtained from DFOS and DIC measurements for sample 2A at three load levels.
Buildings 13 02595 g011
Table 1. Loadsteps for the in situ CT scans.
Load Step01234
Experiment 10 kN2 kN4 kN6 kN-
Experiment 20 kN2 kN6 kN12 kN18 kN
Table 2. Material properties of the carbon reinforcement.
CharacteristicUnitCarbon Grid [40]Carbon Rebar [41]
Tensile strengthMPa22001650
Modulus of elasticityMPa195,000151,000
Ultimate strain11.311.0
Table 3. Composition of the concrete mix.
SubstanceContent in kg m 3
Binder concept815
Fine silica sand340
Sand 0–2 mm965
Superplasticizer17
Water190
Table 4. Material properties of concrete batches.
CharacteristicUnitExperiment 1Experiment 2
Compressive strengthMPa113.3101.5
Bending tensile strengthMPa12.510.2
Table 5. Crack widths at the notches in experiment 1 obtained from clip gauges and DIC.
Sample 1ASample 1B
4 kN6 kN4 kN6 kN
Clip gauges(µm)195308232330
DIC(µm)181286220329
Table 6. Error difference (µm) between the calculated widths of the cracks in samples 1A and 1B at load steps 2 and 3 based on DVC/DFOS and DIC measurements.
Crack No.1234Absolute Mean Error
MethodDVCDFOSDVCDFOSDVCDFOSDVCDFOSDVCDFOS
1A4 kN +79+2 3710
6 kN−31−25−4−10+29−12 +42−2
1B4 kN +9−16 1425
6 kN−16−73+18−9−11−1
Table 7. Comparison of measurement methods.
Spatial ResolutionMethodAdvantageDisadvantage
0DClip gauges
+
fast mounting and calibration process
+
crack width can be tracked live and recorded over time
+
high accuracy (<1 µm)
+
low amounts of data
-
limited measuring range
-
not contactless
-
crack position has to be known
1DDFOS
+
view inside
+
quasi-continuous strain measurement
+
high accuracy (gauge pitch 0.65 mm)
+
low amounts of data
-
only one strain profile along DFOS
-
not contactless and less robust
-
measurement quality depends on the choice of sensor type and installation
2DDIC
+
contactless
+
high spatial and temporal resolution
+
crack path over height of component visible
+
high accuracy (0.01–0.10 px)
-
no view inside
-
suitable texture required
-
extensive calibration process
-
large amounts of data
3DDVC
+
contactless
+
high spatial resolution
+
view inside
+
good accuracy (0.2 vx) *
-
low temporal resolution
-
suitable texture required
-
data available after extensive acquisition process
-
very large amounts of data
* when suitable texture is present, not achieved in this study due to poor data quality.
Disclaimer/Publisher’s Note: The statements, opinions and data contained in all publications are solely those of the individual author(s) and contributor(s) and not of MDPI and/or the editor(s). MDPI and/or the editor(s) disclaim responsibility for any injury to people or property resulting from any ideas, methods, instructions or products referred to in the content.

