Article

20th Century Mortars: Physical and Mechanical Properties from Awarded Buildings in Lisbon (Portugal)—Studies towards Their Conservation and Repair

1
Geosciences Department and HERCULES Laboratory, University of Évora, 7000-671 Évora, Portugal
2
Materials Department, Nacional Laboratory for Civil Engineering (LNEC), 1700-066 Lisbon, Portugal
3
Buildings Department, Nacional Laboratory for Civil Engineering (LNEC), 1700-066 Lisbon, Portugal
*
Author to whom correspondence should be addressed.
Buildings 2023, 13(10), 2468; https://doi.org/10.3390/buildings13102468
Submission received: 11 September 2023 / Revised: 22 September 2023 / Accepted: 26 September 2023 / Published: 28 September 2023
(This article belongs to the Section Building Materials, and Repair & Renovation)

Abstract

:
This paper addresses the study of renders and plasters’ physical and mechanical characteristics from selected buildings awarded during the 20th century with a renowned architectural prize in Lisbon, Portugal. The characterisation was done to understand mortars’ physical and mechanical properties and their evolution during the 20th century. These characteristics will also help determine compatibility requirements for future conservation and restoration interventions. Since these buildings have a heritage great interest status, the need to preserve them is a paramount issue. Fifty-three samples from nine case studies were studied via capillary water absorption, drying rates, open porosity, dynamic modulus of elasticity, and compressive strength. There were limitations in sample collection due to the buildings being in service and technical constraints regarding sample quantity for testing and separating layers of the multi-layer mortar system. Nevertheless, the results showed different ranges of quantitative values for these tests, whether the mortars were lime, gypsum, cement-based or had lime–cement blended formulations.

1. Introduction

The 20th century Valmor Prize for Architecture award-winning buildings are testimonies of Lisbon’s cultural, architectural, and constructive heritage [1,2] that should be studied and understood to be better preserved and valued. The knowledge of the characteristics of the building materials in their historical context enables a more effective response to the conservation and restoration issues that arise from ageing or lack of maintenance. Designing mortars for restoration is critical in any conservation project [3,4]. Composite materials, in particular mortars, are complex materials that depend on (i) the raw materials used and (ii) the design parameters. In the case of monument protection and historical buildings, it is essential to design mortars with the characteristics required to ensure their compatibility with existing materials and their effectiveness in physical and mechanical performance [3,5]. Although the rendering mortars and plasters of most of the studied buildings have generally shown a reasonable to good state of conservation, as reported previously by Almeida et al. [6], it is helpful for an in-depth study of their characteristics to choose which materials should be used in case the original materials have to be replaced so that they can be compatible with the substrate and with the background pre-existent materials. Any intervention that requires a partial replacement of the renders should consider several requirements to be taken into account. These requirements mainly concern water resistance and chemical and mechanical behaviour, besides aesthetic compatibility [7].
The mechanical compatibility of the mortar means essentially that the flexural and compressive strengths, as well as the elastic parameters, should be similar, or lower, in order not to transmit tensions to the old ones over a level that can contribute thoughtfully to their cracking, delamination, or rupture [7,8]. Thus, the modulus of elasticity of the compatible materials must not be higher than that of the existing materials [9].
The hardening of the mortar, whether by hydration, carbonation, or other reactions, its shrinkage and relaxation capacity, which is not characterised by the modulus of elasticity or by instantaneous measurements of other characteristics, will influence the transmission of stresses that occur over a certain period. Insofar as concerns physical characteristics, namely water capillary absorption, adsorption, and diffusion, all these interactions with liquid and vapour of water phases should also be identical (or higher), i.e., the compatible mortar materials for restoration should not impair the water transport in vapour or liquid state thus forcing it to circulate via the historic materials preferentially. This compatibility should be verified to prevent the exposure of wall components to excess and/or long-term humidification periods [10].
Besides physical and mechanical compatibility of new materials to pre-existing ones, chemical compatibility is acceptable to meet the requirements set out above and prevent the formation and/or contamination with non-desirable substances (e.g., soluble salts) [11].
The selection of raw materials used according to functional requirements has led, in the past, to the application of techniques that allowed the differentiated use of aggregates and binders mixed in different proportions. The use of successive layers (multi-layer system), with different thicknesses and with the reduction of the average size of aggregates and layer thickness towards the surface, particularly in lime mortars, was beneficial to avoid the ingress of moisture into the structure [12] to minimise the shrinkage tendency and to optimise the carbonation of lime [13]. Coating systems replaced these traditional systems with artificial hydraulic lime of higher performance and, later, in the 20th century, with Portland cement [13,14,15], optimised by single-layer systems, with pre-dosed mixtures ready to be applied.
This paper presents the results of the physical and mechanical characterisation of mortars and plasters from a set of nine Valmor Prize for Architecture award-winning buildings in Lisbon constructed between 1903 and 2002. The Valmor Prize still has today, since its first attribution in 1902, an annual base for its attribution to promote and encourage architectural quality, which has invariably been reflected in the quality and constructive solutions adopted. Its regulations were remodelled several times, and the Valmor Prize was merged with the Municipal Prize for Architecture in 1982 after its establishment in the 1940s [1,2]. The construction of all the studied buildings began in the 20th century, and they represent a sample of the best construction practices and features, highly relevant for the study of the state of the art of 20th century construction in the city and the same time in the country. For this reason, this work does not intend to study ordinary buildings. Legal frameworks protect some of these buildings, which are generally recognised for their architectural and aesthetic excellence. Studying them offers insights into what is considered a high standard in design and urban planning. These buildings often feature a careful selection of materials, according to the higher patterns of their lifetime, aligning with the architectural design and technical requirements.
Many award-winning projects incorporate innovative and sustainable materials, contributing to advances in the construction industry. Analysing the materials used in these buildings provides valuable information on the performance of the materials and their long-term durability in different environmental conditions. In order to gain a deeper understanding of the evolution of the materials used over a century, it was decided to choose at least one award-winning building from each decade of the 20th century. However, not all decades have award-winning buildings, and this study was not permitted in some cases.
The mineralogical, chemical, and microstructural characterisation, fundamental for the knowledge of the binders and aggregates’ nature and other crucial aspects to determine their state of conservation was already performed [16].
The results will generate a significant set of critical elements for understanding the evolution of mortar typologies and applications throughout the 20th century in Portugal. The consistent data set should also be considered in the design of repair mortars compatible with the original and still preserved ones. The information generated will also allow future comparisons with similar materials from other countries/regions.

2. Materials and Methods

2.1. Materials

The physical and mechanical characterisation results of fifty-three samples of renders and plasters from nine case studies will now be presented. Samples were mainly collected by hammer and chisel, although some were collected by core drilling during a concrete sampling campaign, whose study is not addressed in this paper. Table 1 refers to the collected samples’ location, constructive element, and application technique. A sample’s short description is presented in the same table.
The samples, mainly multi-layered (Figure 1), are often finished with smooth, white, thin plasters (Figure 2) when it comes to indoor walls and stone-imitating mortars (Figure 3). However, in several cases, the finishing layer is a painting coating. An alphanumeric sample code identifies the layer position towards the surface (Table 1), which means the letter A stands for the outermost layer.
Mineralogical and microstructural characterisation [16] showed that the studied mortars have different types of binders, from air lime and gypsum to Portland cement, as well as blended binders, that is, air lime mixed with Portland cement (Table 2).

2.2. Limitations of the Study

The sample program was designed considering the preservation of the building’s aesthetic meaning and value. Mortars were collected aiming to have enough material for testing, which was only sometimes possible as most buildings were in service. Most of the samples were collected indoors for several reasons, such as the building’s inaccessibility, forbidden areas, or external façades having no rendering mortars.
In the multi-layered samples, attempts were made to carefully separate each layer from the other mechanically, sometimes without success. Nevertheless, due to the inability to preserve the integrity of the detached thin layers (e.g., thin, smooth layers) from the whole set, it was decided to test the entire set when it was not possible to separate each layer or when it was foreseeable that the layers would not have enough dimension to be tested alone. When a limited number of samples was available, a methodology was adopted that included phased testing of the same sample, starting with non-destructive tests, such as ultrasound pulse velocity to evaluate the dynamic modulus of elasticity, and ending with compressive strength. Some samples were fragmented or cut into several specimens, one for each test; when an abundant sample was available, several specimens were tested. As the samples have non-standard and irregular shapes, the laboratory characterisation required adapted test methods that were developed and validated in previous works [17,18,19].

2.3. Experimental Work

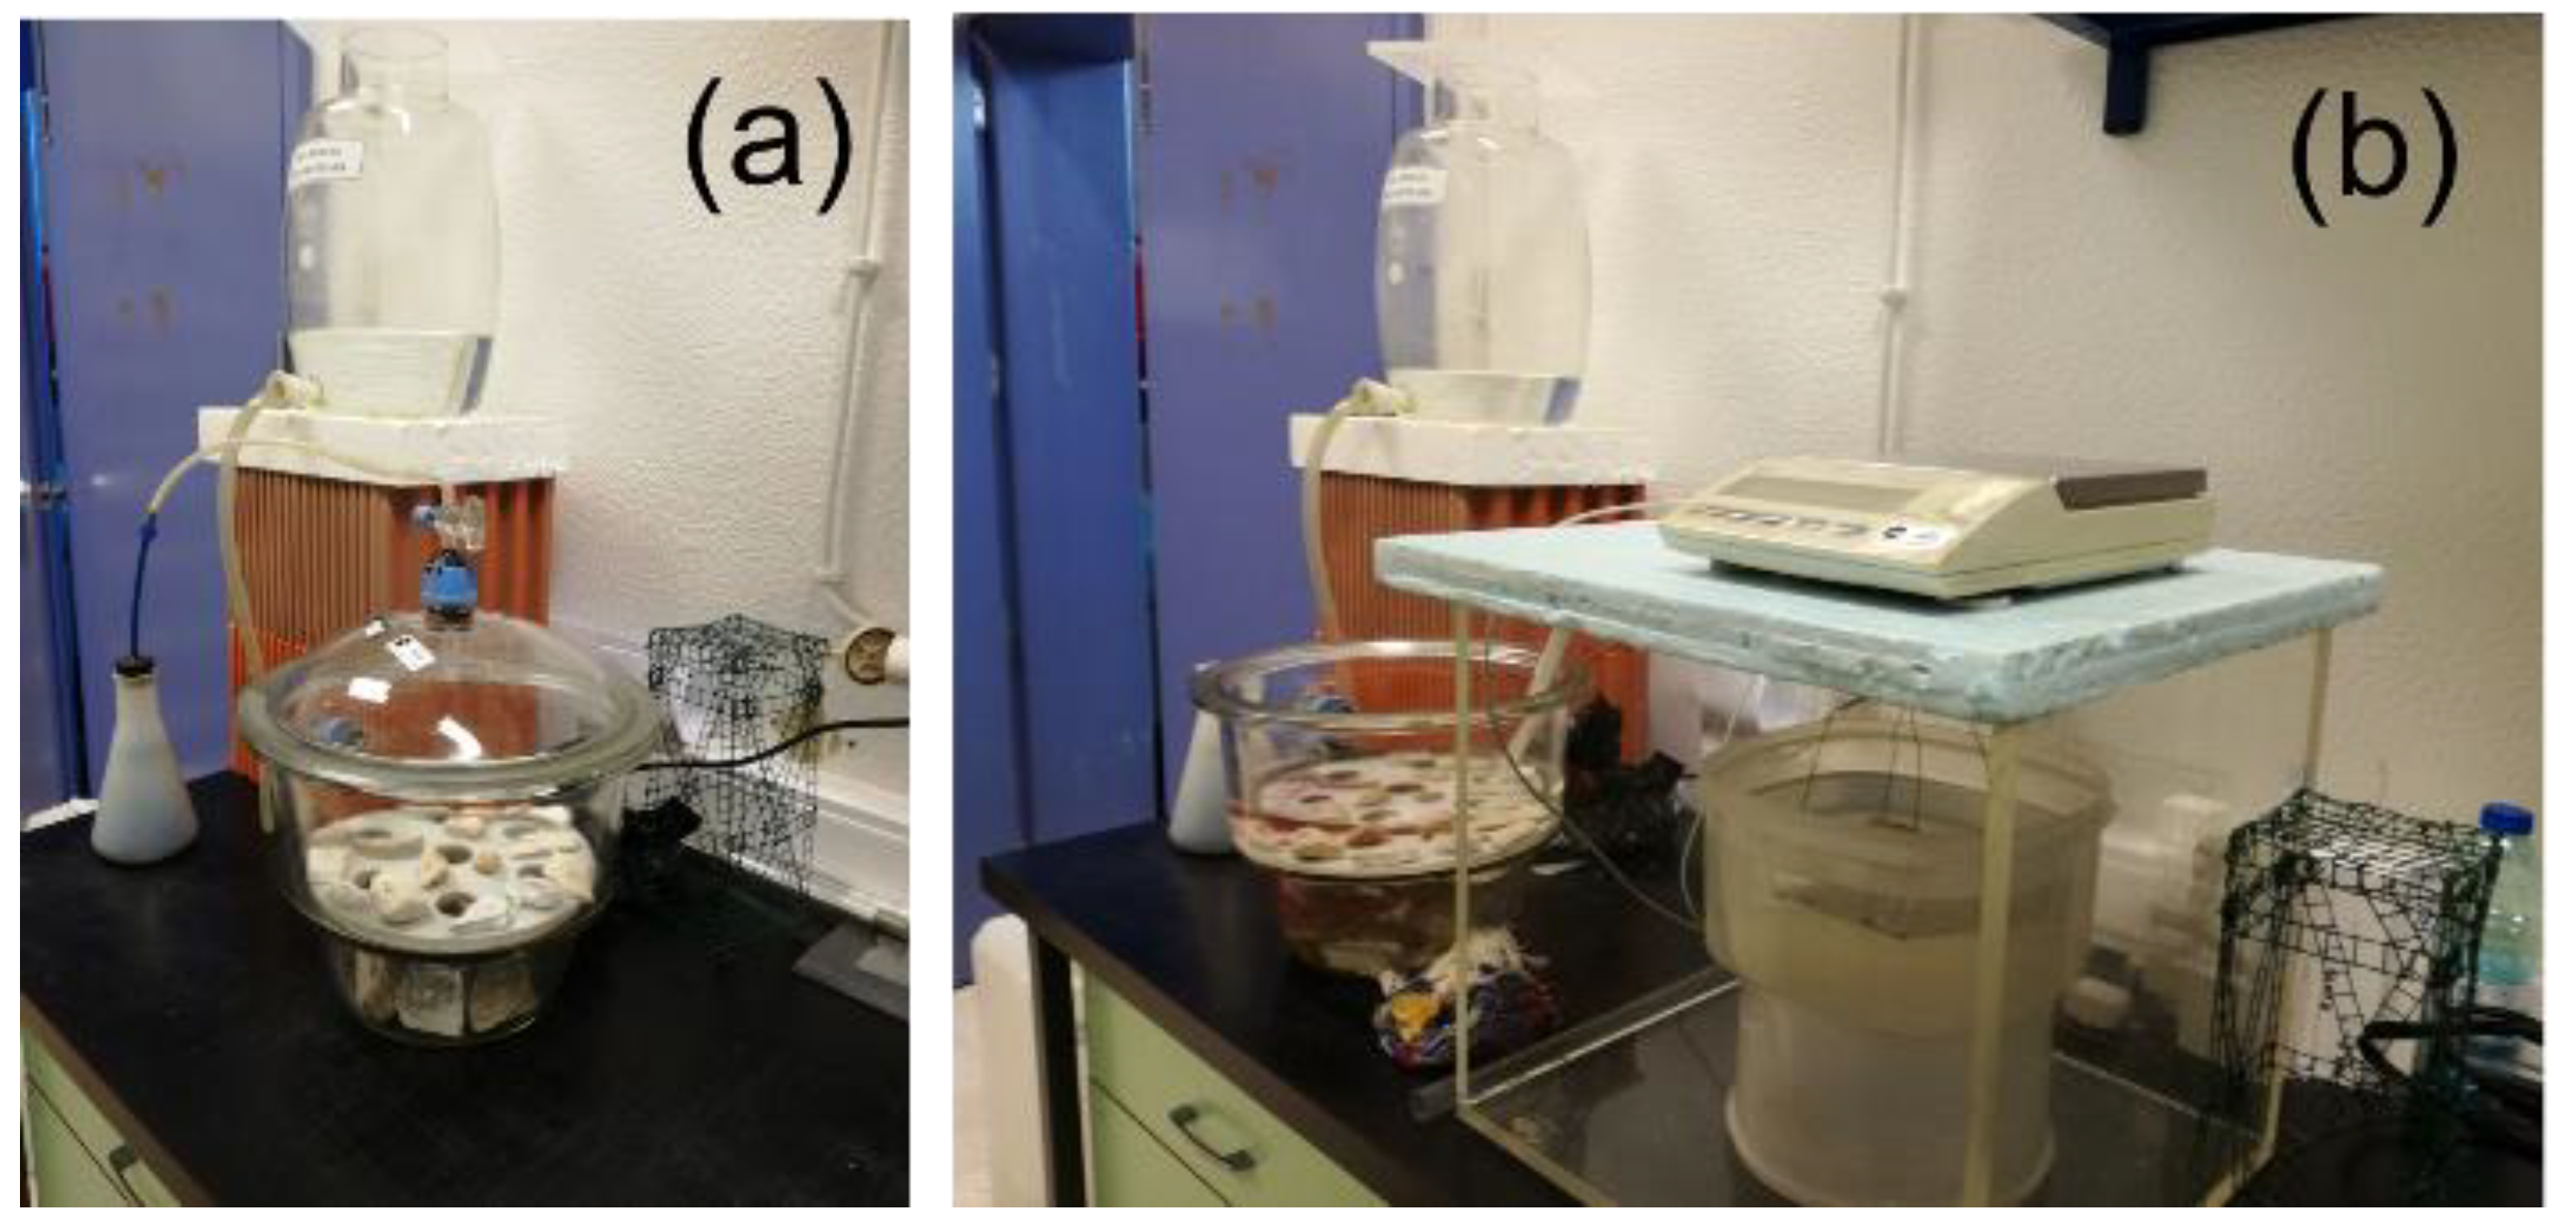
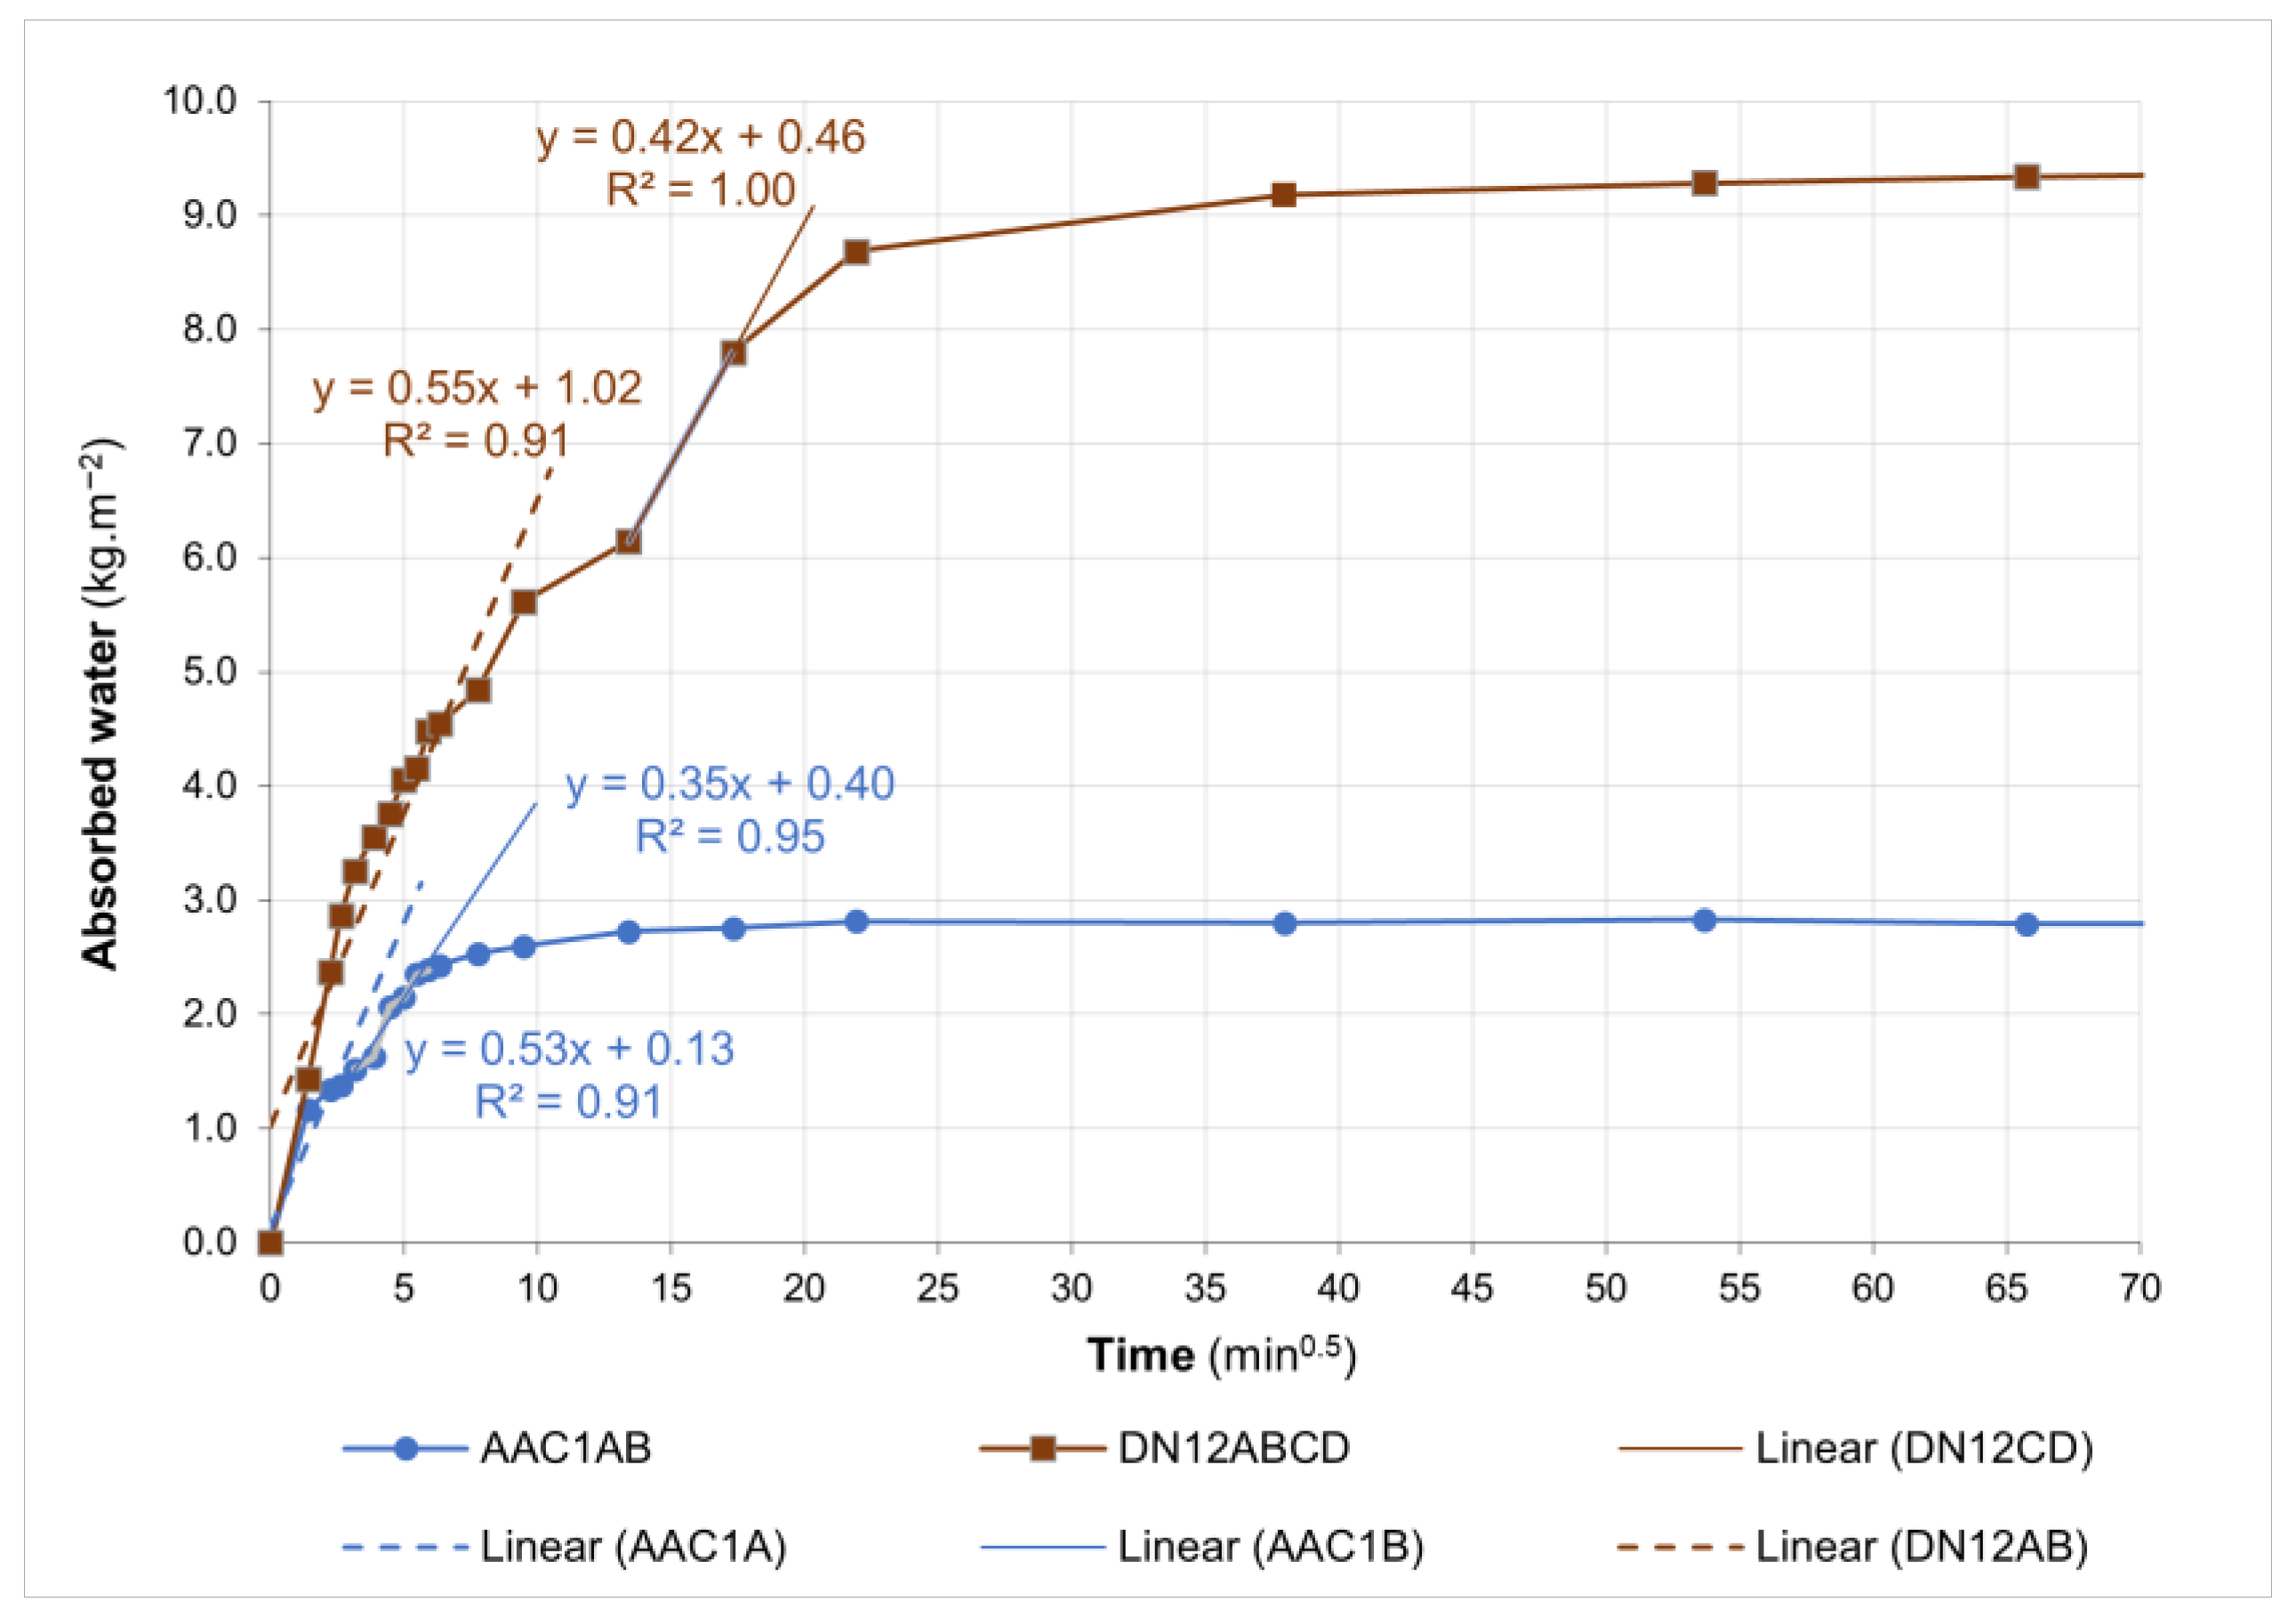
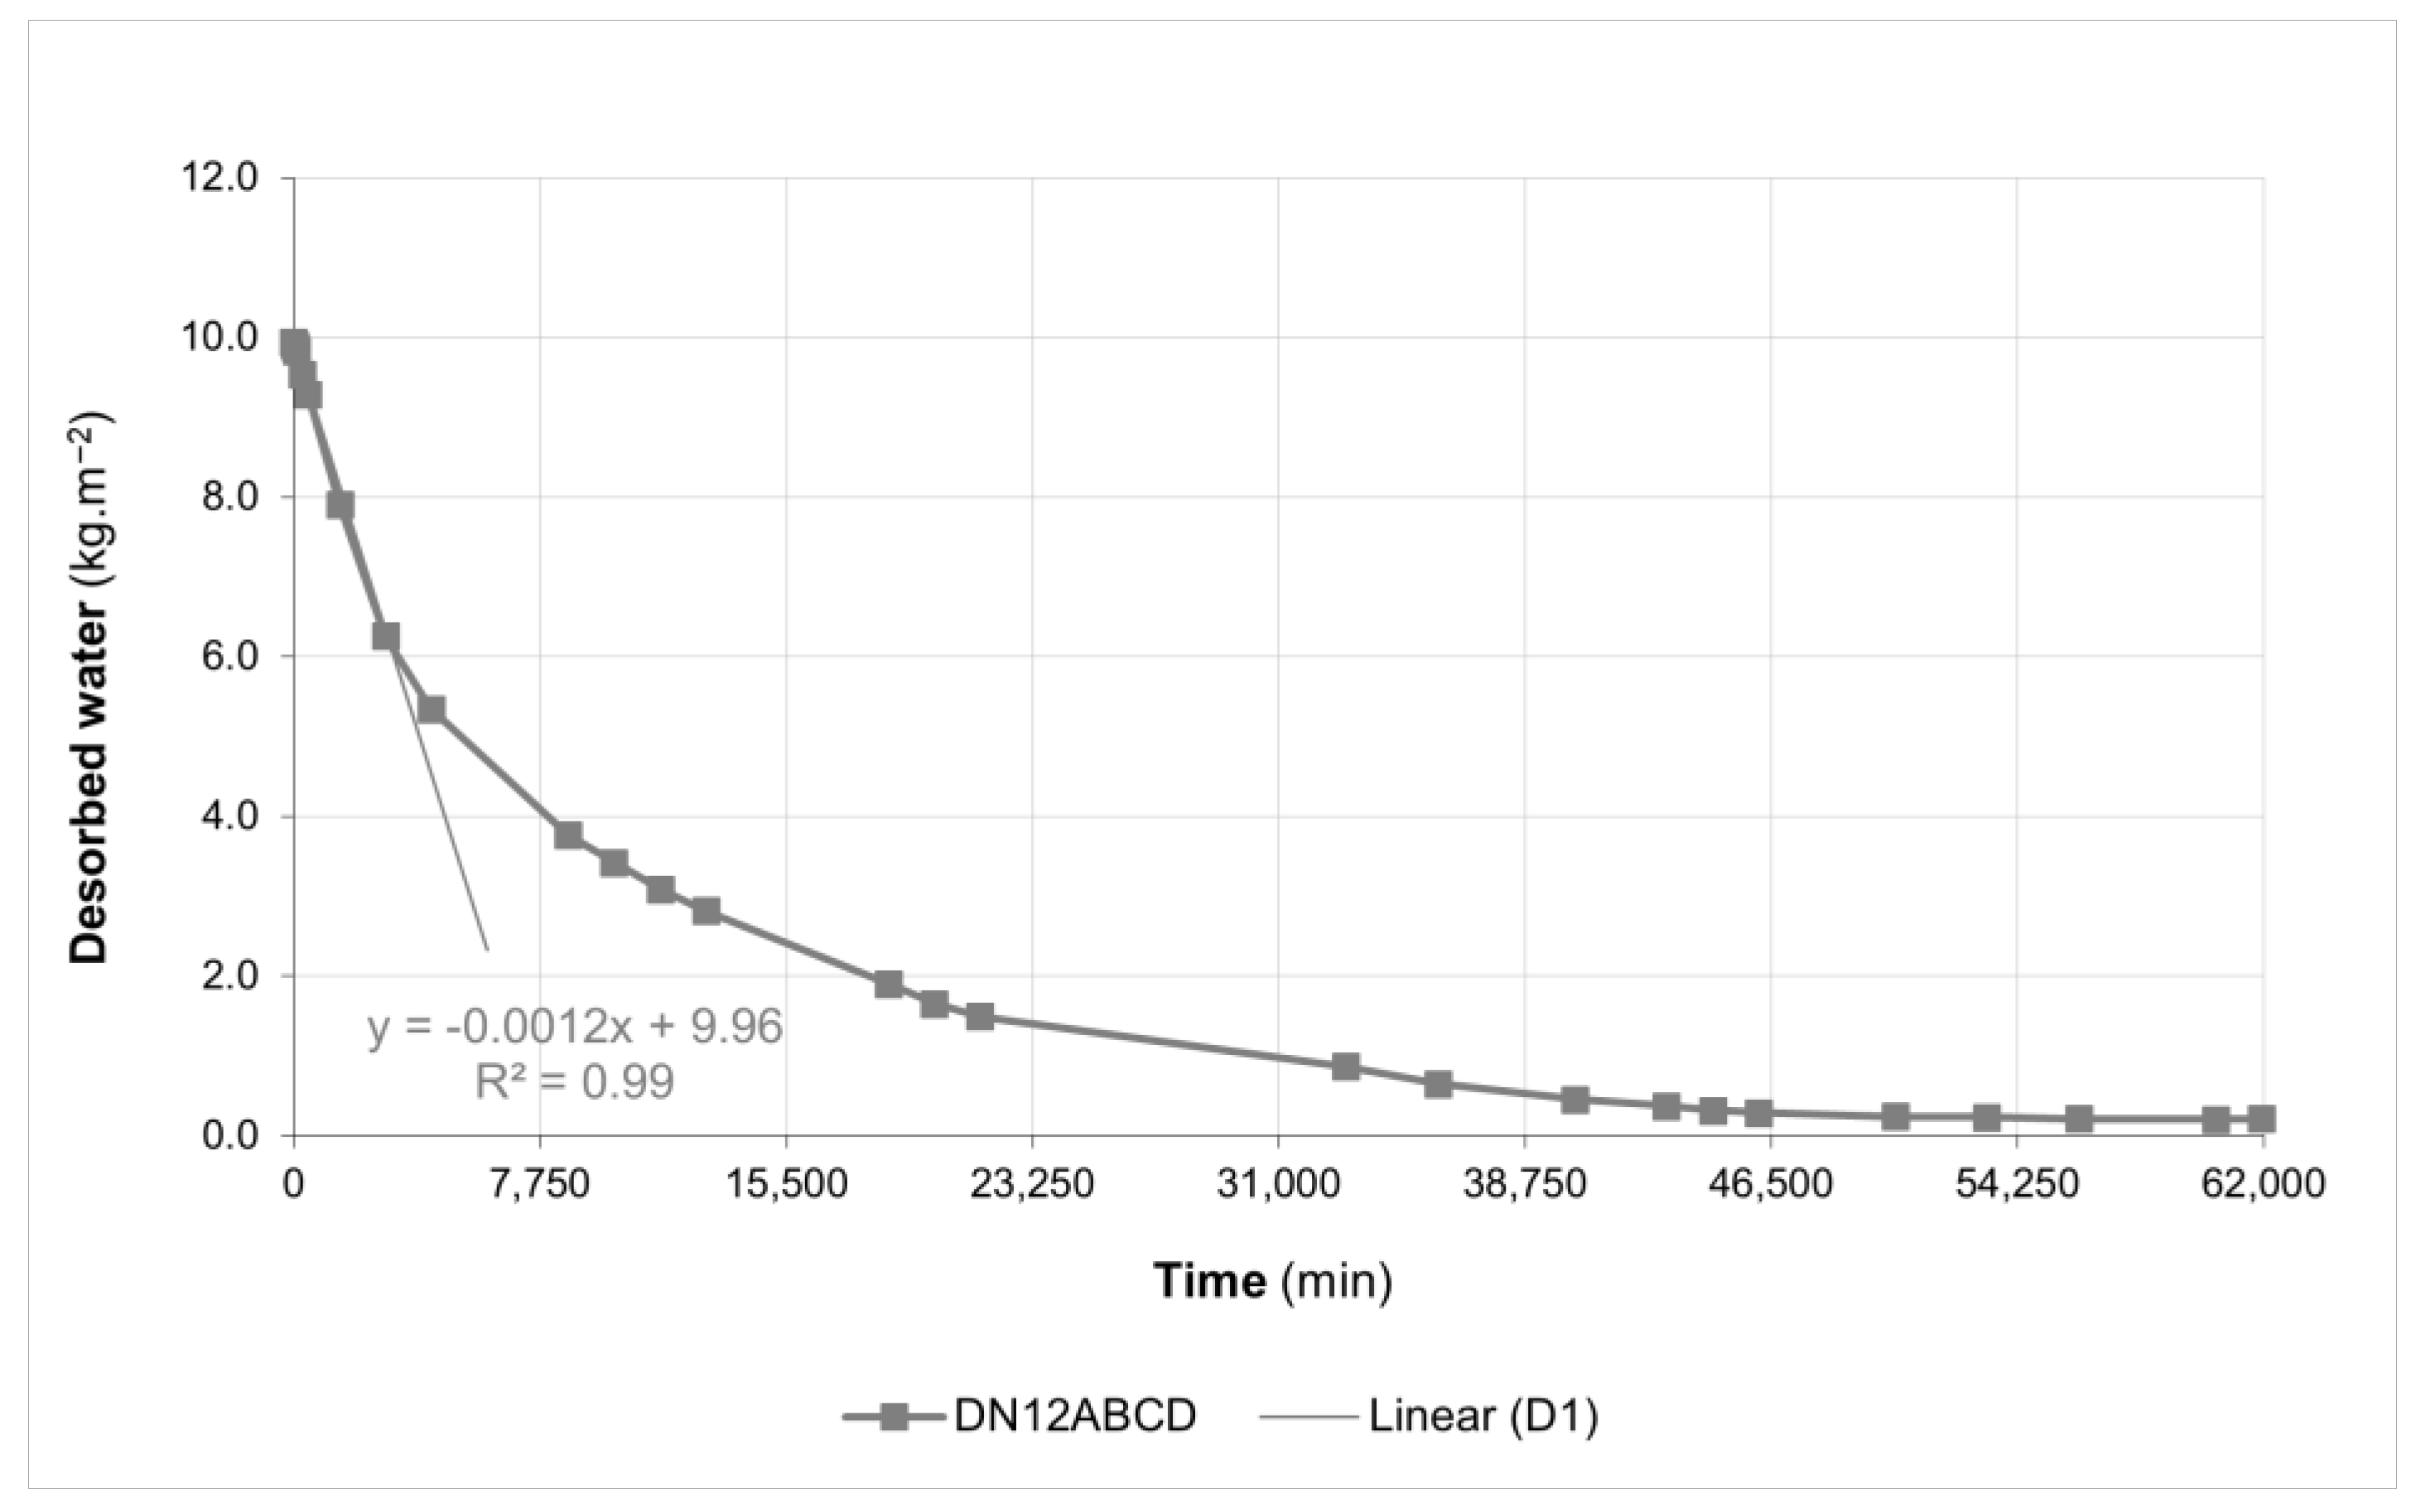
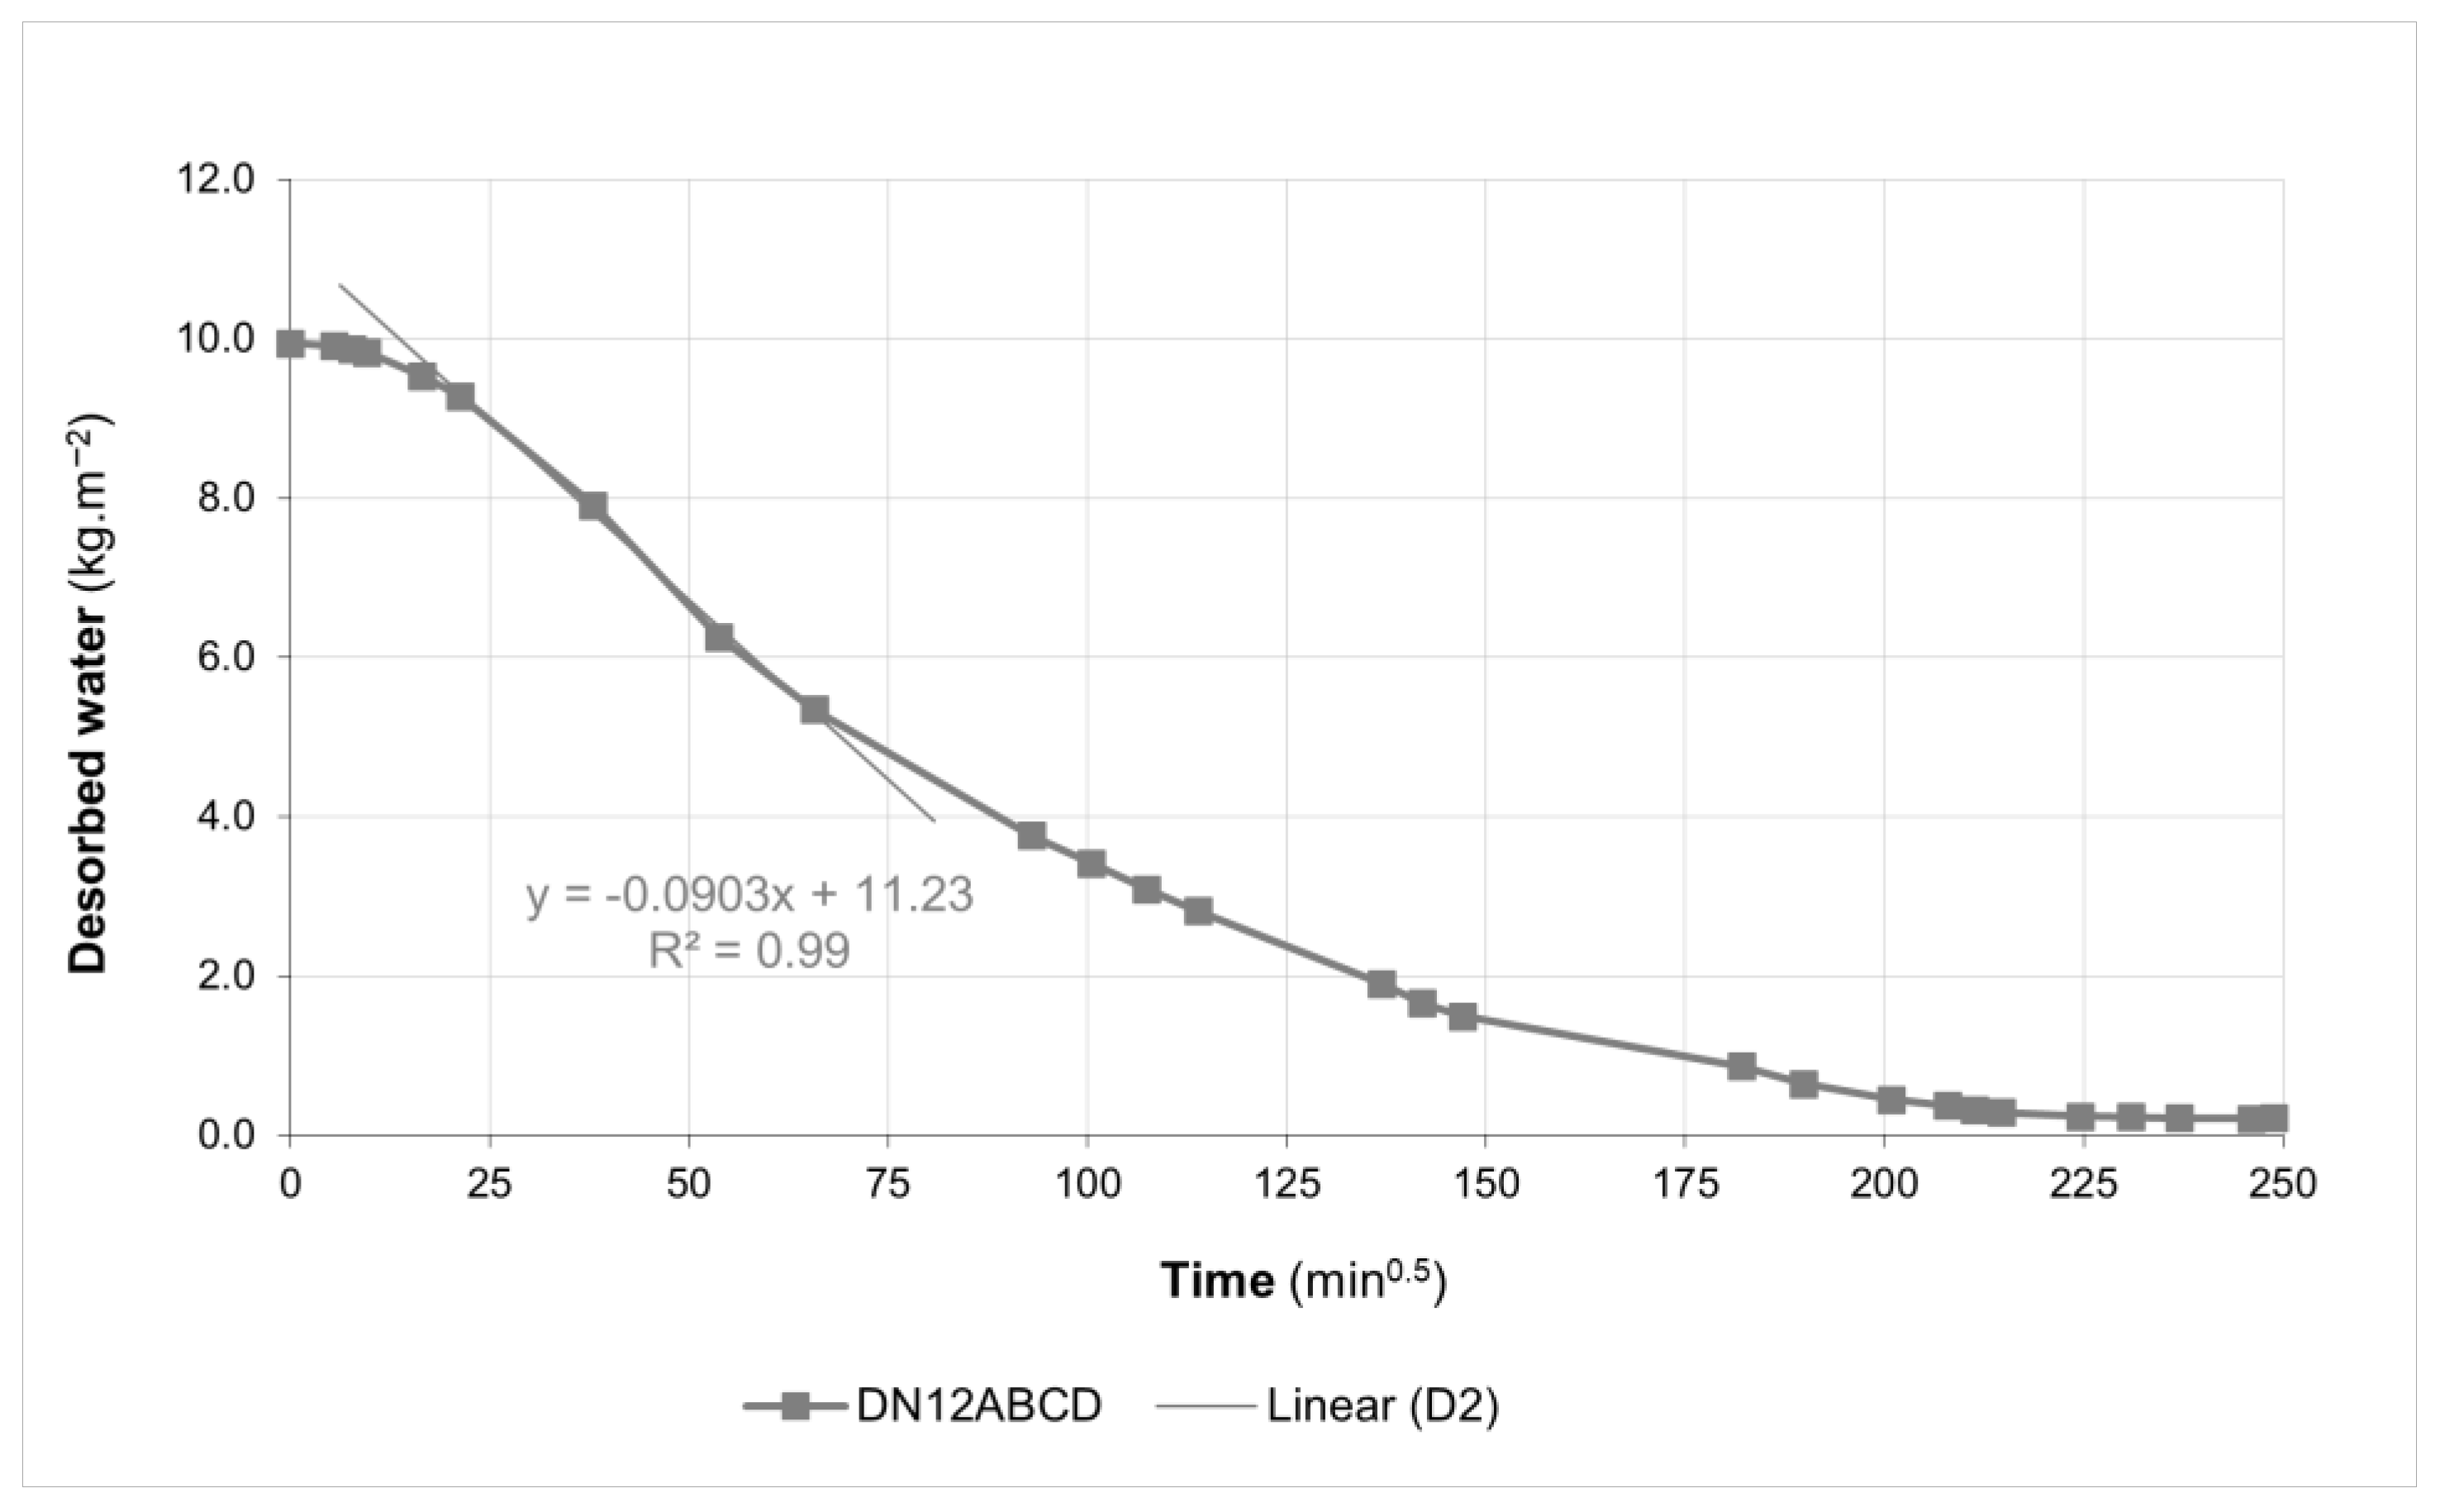
2.3.1. Capillary Water Absorption and Drying Capacity Test

It is essential to ensure that after an intervention, the wall will have a similar hygric behaviour as the wall with its original materials to achieve compatibility between the old and the replacement mortar. The previous hygrometric characteristics should be maintained or slightly modified, i.e., similar capillary and water vapour coefficients or higher [5].
Capillary water absorption was determined using a test procedure developed for historic mortars [17]. All the capillary water absorption tests were performed in a controlled environment (T = 20 ± 2 °C and RH = 65 ± 5%) and using the capillary absorption by contact technique (Figure 4a,b). For friable samples, this technique consists of placing the samples in baskets with a bottom lined with a geotextile sheet to avoid material loss during the test. In contrast, non-friable samples were placed directly in contact with water (Figure 4a). Non-friable samples and the sets consisting of sample, basket, and geotextile sheet were held on two narrow acrylic strips in a tub with enough water to keep the contact samples’ surface or the geotextile sheets wet. The samples were weighed at 0, 2, 5, 7, 10, 15, 20, 25, 30, 35, 40, 60, 90, 180, 300, 480, and 1440 min (24 h) and then every 24 h until saturation. The capillary absorption coefficient by contact (Ccc in kg.m−2.min−0.5), which refers to the initial rate of water absorption is measured by the slope of the initial phase of the curve based on linear regression as determined by EN 15801 [20]. The baskets with the samples were taken out of the tub after the samples reached saturation and were placed in the same environment to dry on acrylic strips to prevent contact with any other surface (Figure 4c). The drying rates (corresponding to the first drying phase D1 and the second drying phase D2) were evaluated via the weighing procedure at 30, 60, 90, 270, 480, and 1440 min and every 24 h until the test specimens achieved constant weight, as determined by EN 16322 [21].

2.3.2. Open Porosity and Bulk Density

The study of open porosity deepens the understanding of the pore structure, namely the continuous network of pores that allows liquid and gas circulation inside the material [22]. The determination of the open porosity and the bulk density by hydrostatic weighing followed the EN 1936 standard [23]. This method consists of eliminating the air in the pores, followed by filling them with water using a desiccator coupled to a vacuum pump (Figure 5a), ending with the hydrostatic weighing (Figure 5b) and the determination of the immersed and still saturated samples’ mass. The ratio between the volume of open pores and the apparent volume of the sample obtains open porosity. It is calculated by Equation (1), while bulk density is obtained by the ratio between the mass of the dry sample and its apparent volume (Equation (2)).
P 0 = m s m d m s m h × 100
ρ b = m d m s m h × ρ r h
where
  • P 0 —open porosity [%];
  • m s —mass of the saturated sample [g];
  • m d —mass of the dry sample [g];
  • m h —mass of the immersed sample [g];
  • ρ b —bulk density [kg.m−3];
  • ρ r h —real density of water [kg.m−3].
Figure 5. Determination of the open porosity and the bulk density: (a) air-to-water replacement procedure and (b) hydrostatic weighing.
Buildings 13 02468 g005
Due to the small number of specimens available to perform all the programmed experimental campaigns, the open porosity test was performed in most cases on unaltered and unaffected fragments provided after the compression test. Separating the multi-layer samples into single layers made it unfeasible to test each layer, as it could crush or significantly reduce the size during the procedure; in such cases, it was decided to perform the test on the whole set.

2.3.3. Dynamic Modulus of Elasticity

When old mortars, especially the lime-based ones, are subjected to conservation interventions, the dynamic modulus of elasticity (Ed) should be considered as the experimental values obtained in characterisation must be respected to assure stiffness compatibility between the old and the new substitution mortars.
The Ed was determined according to Equation (3), which is based on the measurement of the ultrasonic pulse velocity (UPV—velocity of high-frequency sound waves) via the material [24] and is expressed in Pa. Two measurement methods, namely direct and indirect transmission methods were applied. In the direct transmission method, the transducers with pointed ends are placed on opposite sides of the sample (Figure 6b). In contrast, the transducers are placed on the same specimen surface in the indirect method. In this case, the acquisition is made by fixing the transmitter transducer at a specific point. At the same time, the receptor moves over a marked row at the surface of the specimen (Figure 6a,c) and at different distances (with a 1 cm increment for each acquisition). To perform this test, based on measuring the speed of propagation of longitudinal ultrasonic waves in microseconds, an Ultrasonic Tester Steinkamp BP-7 model was used. Equation (3) was applied.
E d = ν 2 ρ K
where
  • ν —velocity of the ultrasound waves via the material or ultrasound pulse velocity (UPV);
  • ρ —bulk density;
  • K—constant depending on the coefficient of Poisson (φ).
Figure 6. Determination of the dynamic modulus of elasticity: (a) apparatus for the determination by the indirect method; (b) direct method—the transducers are placed in sample’s opposite surfaces; and (c) indirect method—sample marked with a line segment for the indirect method.
Buildings 13 02468 g006
Bulk density ( ρ ) was obtained by Equation (2) for samples subjected to open porosity and bulk density tests. For those where this property could not be obtained, a simple mathematical approach was used to find the bulk density by dividing the mass of the specimen by the product of the average dimension of the three directions: width, length, and depth, measured with a calliper.
The value of 0.2 was assumed for the coefficient of Poisson (φ) of mortars since it has yet to be precisely known. The constant K was calculated by Equation (4) as follows:
K = 1 + φ ( 1 2 φ ) ( 1 φ )
The indirect method was used on the multi-layer samples, which are supposed to express the UPV of the whole set and applied at the largest possible dimension over the specimen’s surface. The direct method used the largest distance between the transducers to characterise the single layers.
For calculating the dynamic modulus of elasticity considering the indirect method, removing the influence of the remaining layers from the outermost one is impossible as it is directly related to the bulk density. Despite being determined by adapted methods, which proved to be adequate and reliable, the remaining layers contribute to the rise in the overall bulk density of these types of samples and, consequently, the calculated values of the modulus [8]. Thus, UPV could be a more reliable result in multi-layer samples since it does not involve calculations using the bulk density.

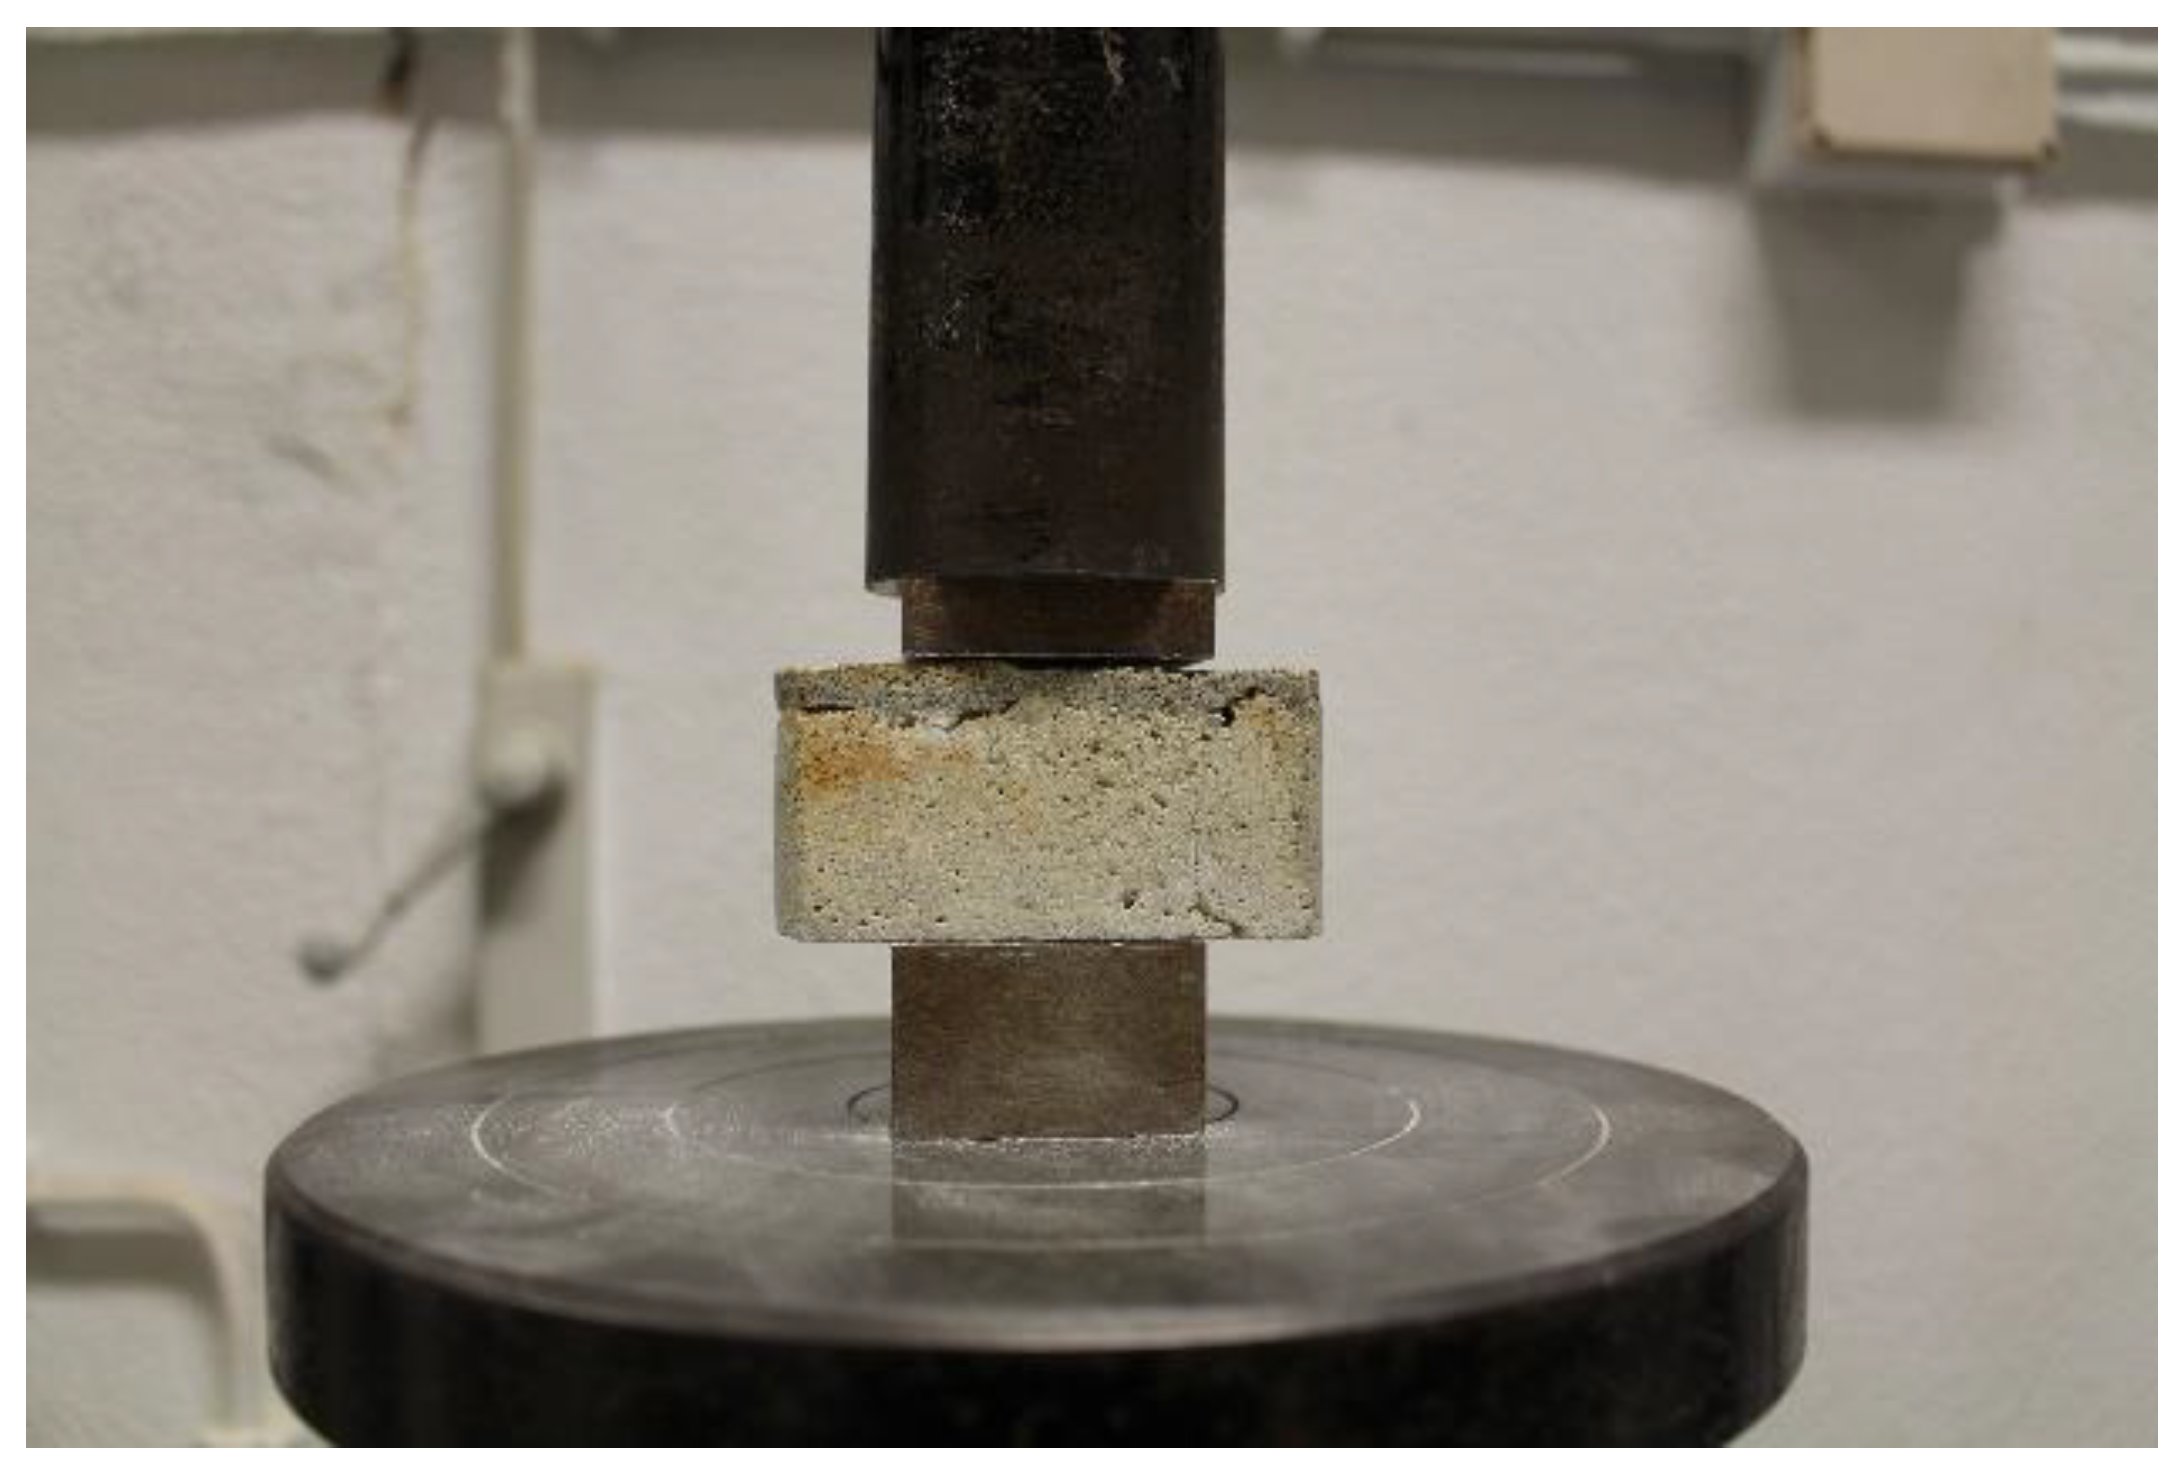
2.3.4. Compressive Strength

The compressive strength (CS) test was carried out to establish the limits of strength that must be respected to ensure compatibility between the old and the replacement mortars.
After the complete drying, the samples’ surfaces were regularised with a high-performance rotary tool, so they were entirely in contact with the load cell during the test. A direct compression test was carried out (Figure 7), giving compressive strength values by dividing the compressive force that produces rupture of the sample by a 40 mm × 40 mm area of force application [18,19]. No samples that were less than 20 mm thick were tested. An electromechanical testing device compliant with EN 1015-11: 1999 [25], ETI, model HM-S with a load cell of 200 kN, was used. The load rate was adjusted so that failure occurred within no longer than 90 s, varying between 50 N.s−1 and 100 N.s−1 and, in a few cases, with a value of 200 N.s−1.

3. Results and Discussion

This section presents and discusses the results of the physical and mechanical characterisation. Table 2 summarises the results of the characterisation performed.
The results obtained for the whole sets should be analysed as indicative since the layers have different binder/aggregate ratios and, in some cases, different binders [16], which influences the results [26]. It should be noted that most of the mortars analysed were collected in interior walls, where it was common to find in buildings constructed until the 1940s fragile finishing layers based on lime–gypsum whose separation was challenging to perform per se.

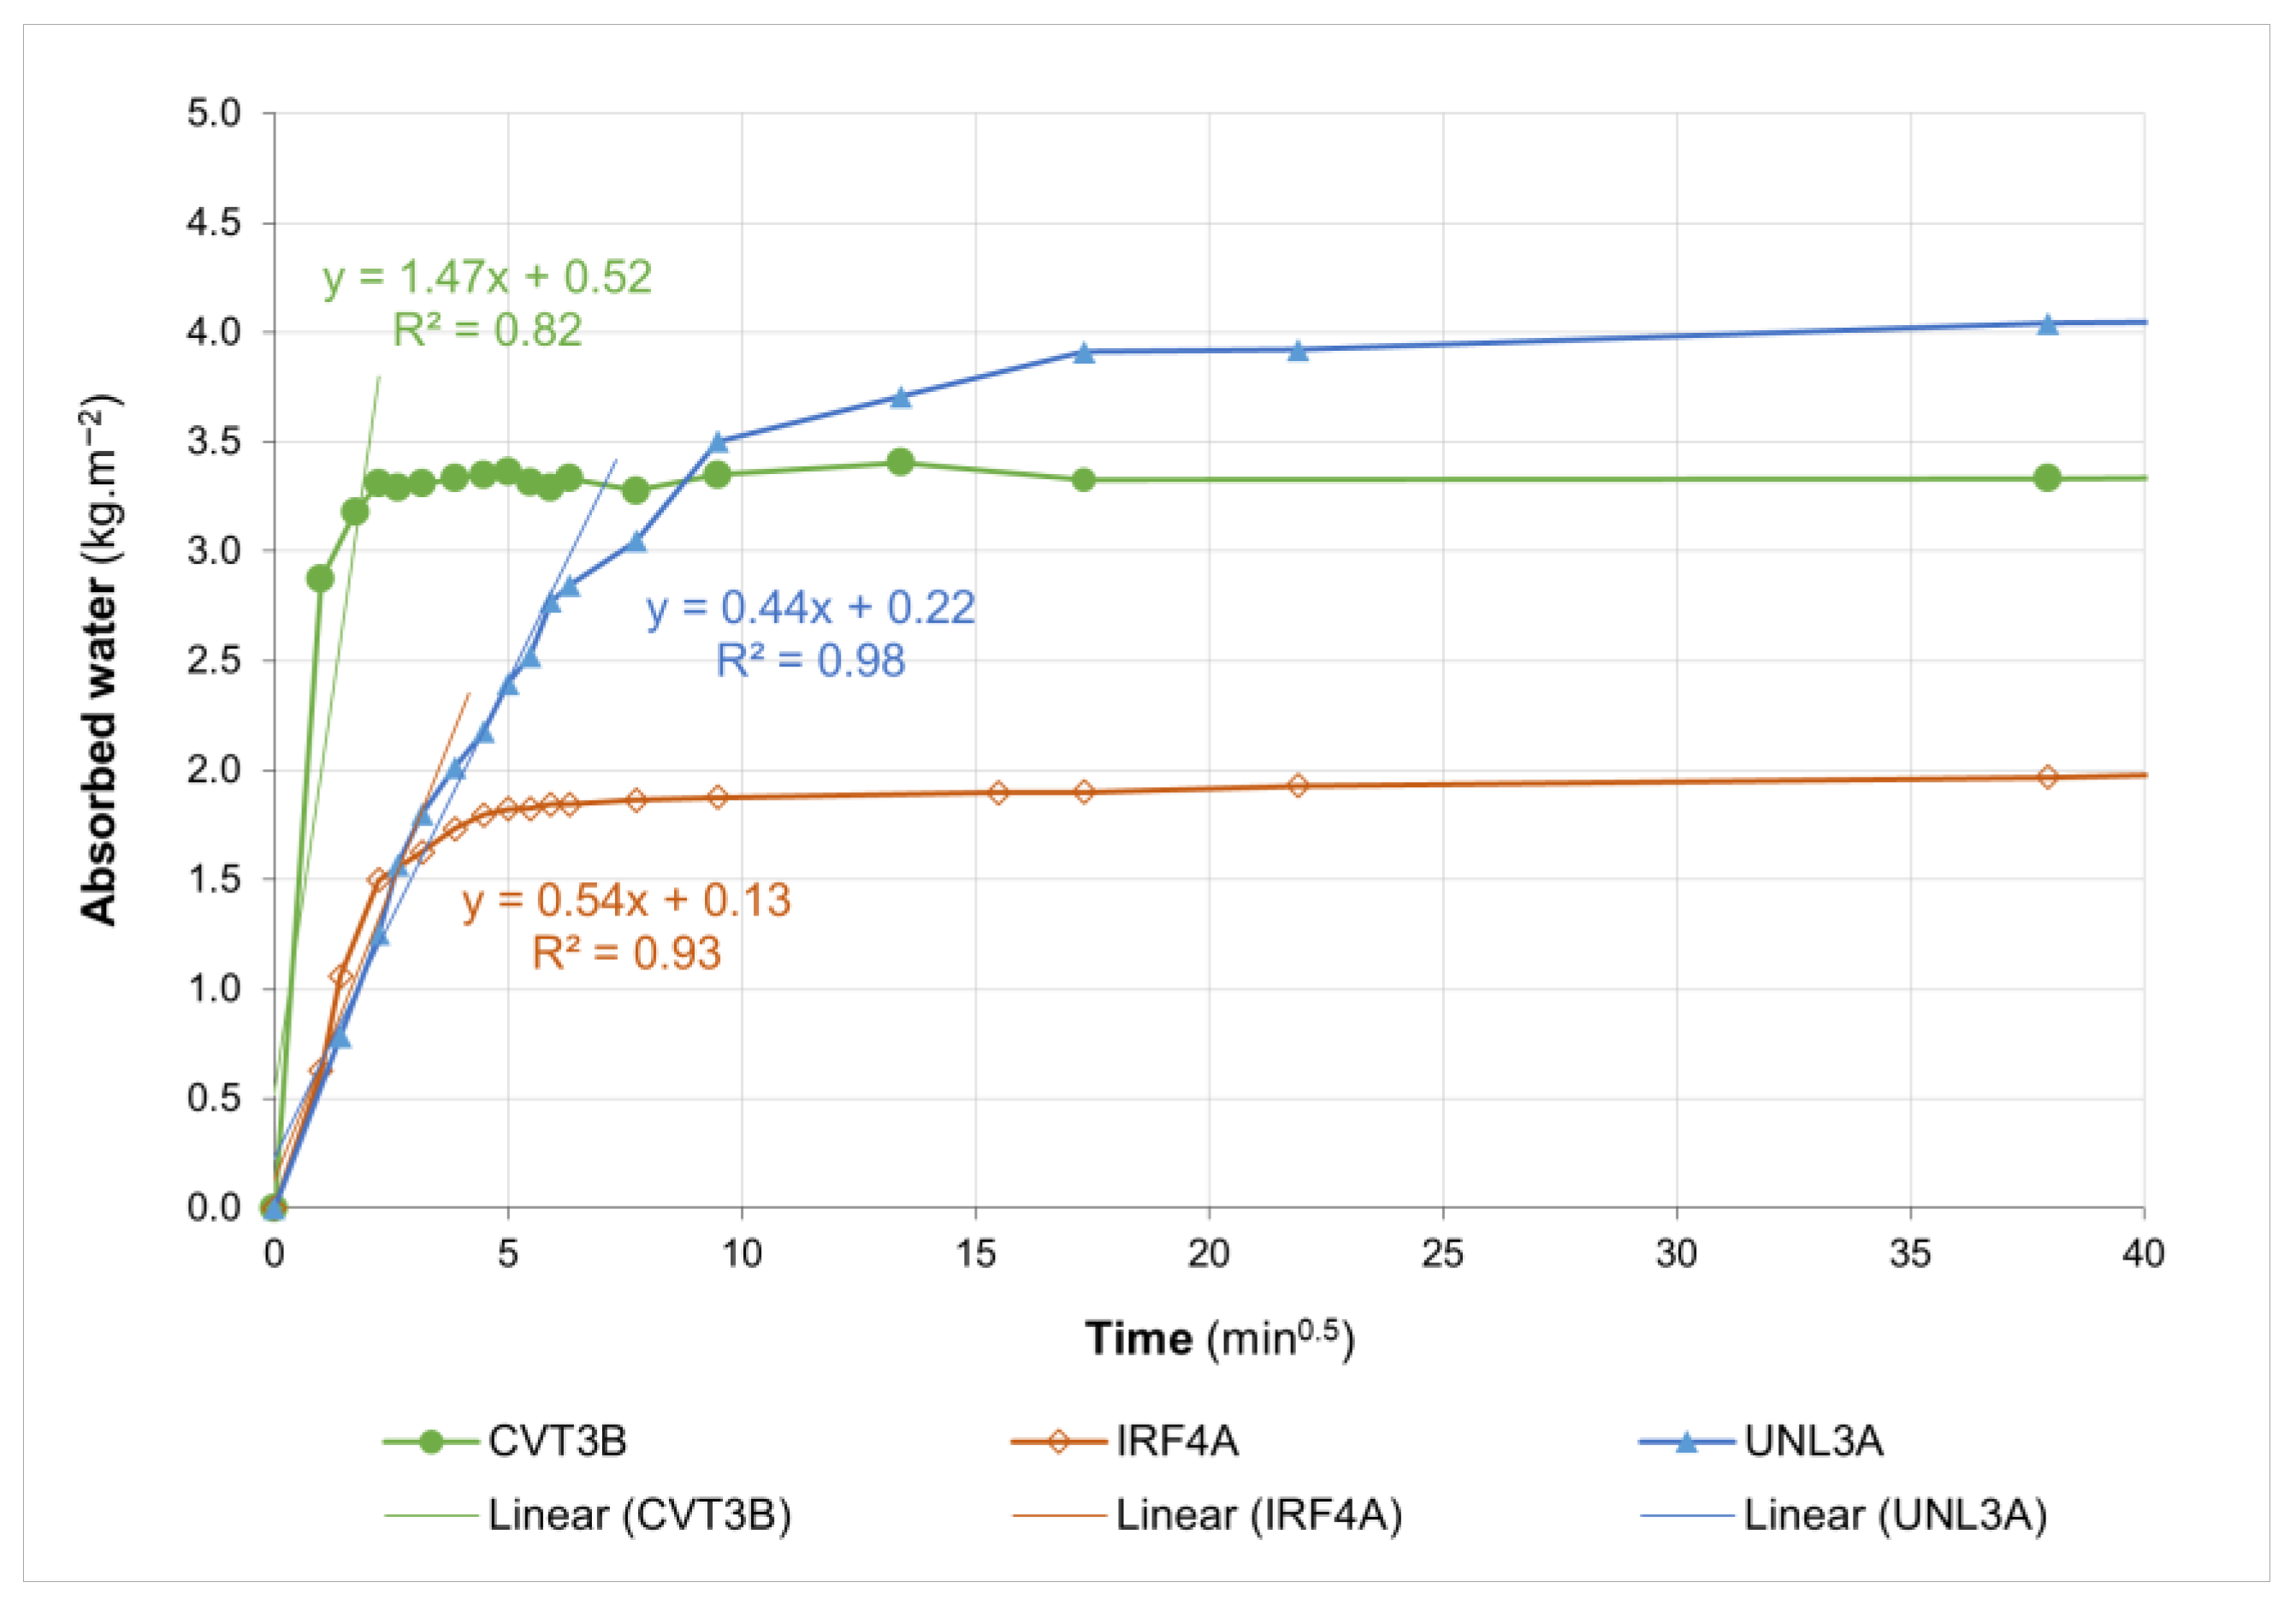
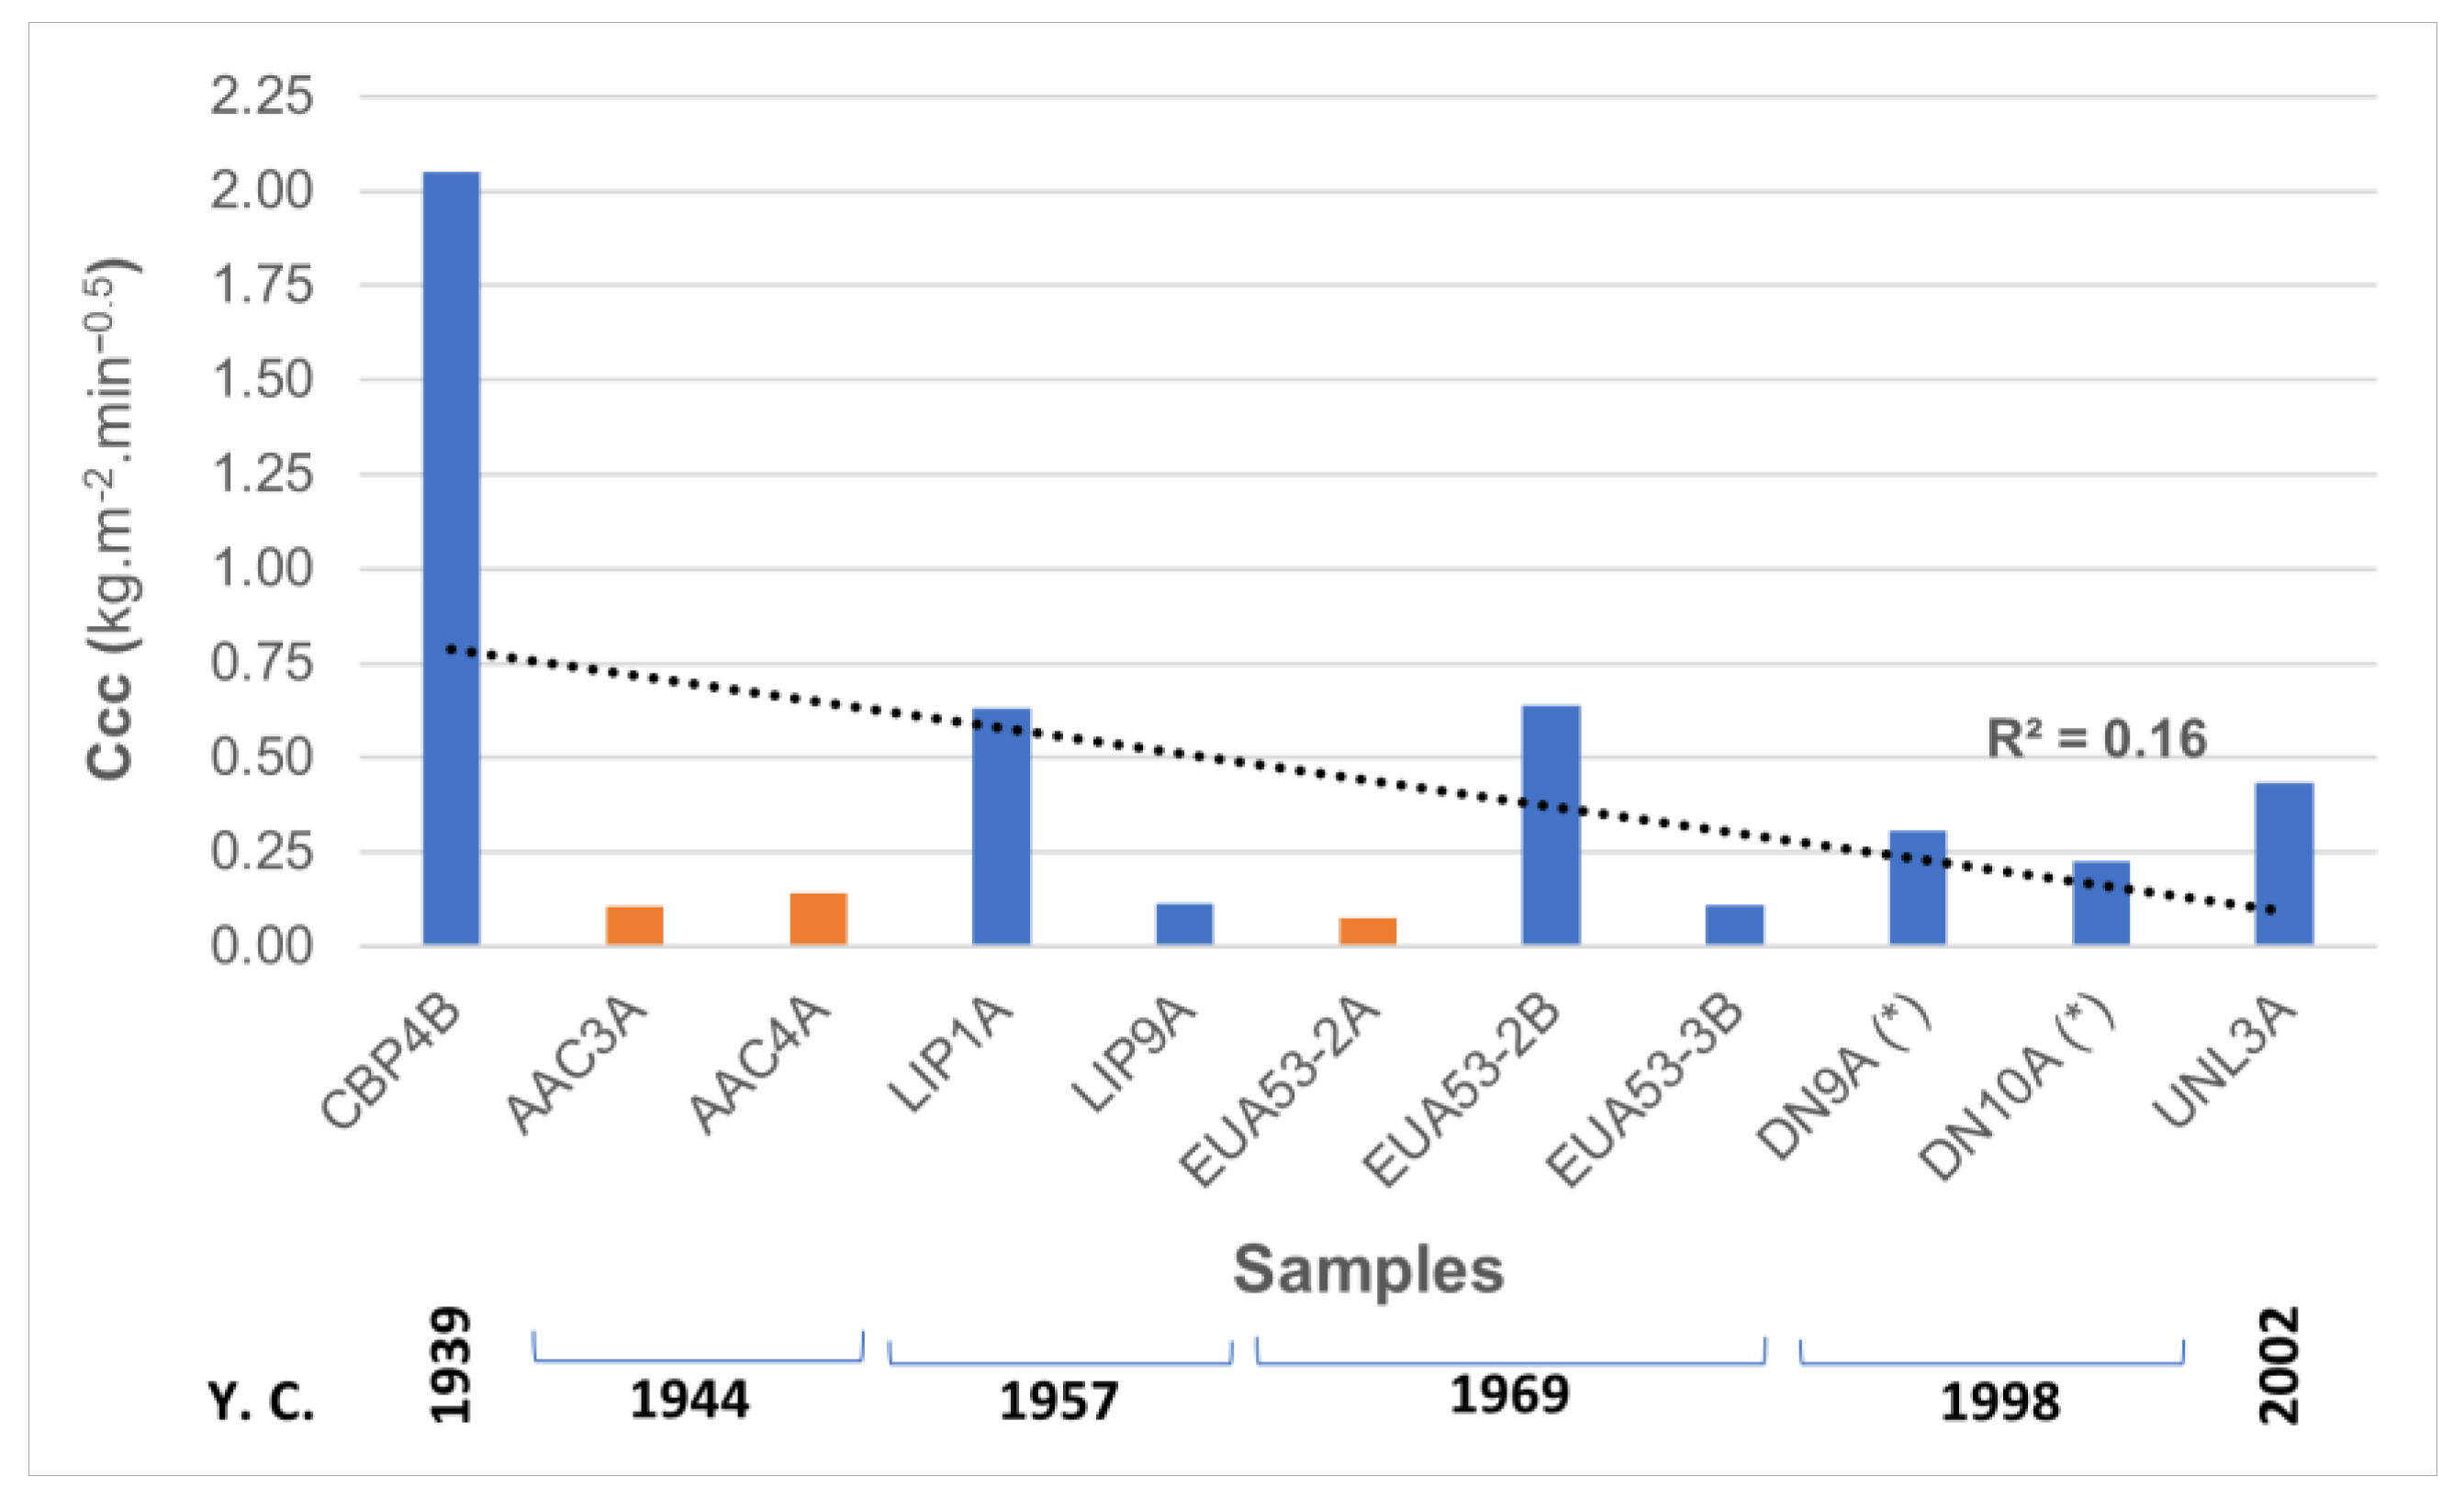
3.1. Capillary Absorption and Drying of Absorbed Water

The pore system of old lime mortars is composed of a high proportion of wide pores [27], which, associated with the reduced thickness of the samples (see Table 1), leads to maximum absorption in the first few minutes. In general, and in most cases, saturation is quick and takes place within the first 24 h (1440 min or 37.95 min0.5), but a substantial slope reduction can be observed between 6 min and 2 h, depending on the sample (see Figure 8). To be meaningful as a rate of water absorption, the range of points considered in the calculation of the Ccc must be in the straight part of the plot, as settled in EN 16322 [21]; thus, it was adjusted on a case-by-case basis, considering that this is the most significant stage of absorption. In the case of samples with hydraulic binders, the Ccc are necessarily different from those of air lime mortars, theoretically lower due to the slower absorption. The slower absorption is related to the volume and pore size of the capillary porosity and its connectivity. The capillary pores that most affect the capillary water absorption coefficient range between 0.1 μm and 5 μm [28], while in lime mortars, there is an essential range of pores which are coarser than the capillary range, with a larger diameter, up to 10 μm or more [29].
Figure 8 shows the capillary absorption plots of three selected monolayer samples, each with a different binder (CVT3B: air lime; IRF4A: air lime and Portland cement; UNL3A: Portland cement) demonstrating typical water absorptions for that kind of binder. In the case of the air lime sample, it is evident the fast water absorption until saturation materialised by the highest Ccc (1.47 kg.m−2.min−0.5), which corresponds to maximum absorption and consequent saturation after the first 5 min, unlike what happens with the air lime–Portland cement and cement mortar samples, which, in turn, show lower absorption values than expected. In the case of the two air lime–Portland cement monolayer mortars, Ccc values vary between 0.35 kg.m−2.min−0.5 (AAC1B) and 0.59 kg.m−2.min−0.5 (IRF4A). However, the higher proportion of cement in IRF4A did not contribute to reducing Ccc, as other factors related to the aggregate and the w/b ratio may have a decisive influence. In the case of Portland cement mortars, despite the poor correlation, the trend of Ccc reduction over the analysed period is noticeable (Figure 9), probably due to the adjustment of the water/cement ratio in the mix design and the increase of cement fineness that led to the development of a less sorbing pore structure and eventually to the optimisation of the particle size distribution of aggregates that influences compactness [28]. Although these characteristics were not thoroughly investigated, it should be noted that in the case of the stone-imitating mortar EUA53-2A, which presents the lowest Ccc (0.08 kg.m−2.min−0.5), the contribution of a limestone filler, as reported by Almeida et al. [16] may have contributed to the low absorption, which is also corroborated by the lowest value of the open porosity (13.2%). These properties may also be related to another factor: the construction technique. The technique of application of these mortars, also known by the Portuguese term Marmorite, foresaw the tightening with metallic rollers still in the fresh state [30], which might have produced a porosity reduction.
Sample CBP4B shows the highest Ccc amongst the Portland cement mortars (2.05 kg.m−2.min−0.5) (Figure 9), which is a value more typical of lime mortars. It also presents a high open porosity of approximately 26%, which suggests a high water-to-cement ratio or can be justified by the meagre binder-to-aggregate ratio as shown in Table 2, which also has influenced the mechanical performance, as demonstrated by the low compressive strength. Although the result refers to the CBP4AB set, we can consider the influence of the white, smooth, thin outermost layer as negligible for this parameter due to its reduced thickness.
Figure 10 shows the plot of two selected multi-layer samples in which the phased development of absorption is observed. It allowed separating the graphical events corresponding to water absorption in distinct layers of the same set. In the case of the DN12ABCD set, it was possible to separate the two absorption events by the inflexion zone. This zone corresponds to the physical separation of the half assemblies (DN12AB plus DN12CD) that were not fully bonded. The visual observation of the water rises during the test also verified the resumption of the absorption event.
The multi-layer samples were tested with the exterior face of the outermost layer in contact with water; still, only in some capillary water absorption tests was it possible to verify the differentiated effect of the absorption. However, it was found that the layers subjected individually to the test present higher Ccc values than the sample set to which the respective layer belongs. Using as an example the sample CBP4AB, it was found that layer A, a smooth lime–gypsum-based plaster, lowered the Ccc due to being in contact with water. Its physical characteristics, namely the pore structure contributed to a delay in water absorption, as expected for these thin layers [8]. The effect of the interface zones that introduces some discontinuity may also contribute to reducing the absorption rate.
Among the air lime mortars, sample IRF3A has the lowest Ccc value. Still, it has a high open porosity value (33.04%). These results do not match because this sample, which has a low thickness, has a paint layer that was impossible to remove before the test. The paint layer may have delayed the water percolation.
Excluding the previously mentioned sample because it is an isolated case, and once the binder of the mortars is known, it is possible to establish ranges of Ccc values for each type of mortars. Hence, based on the results for individual samples and monolayers, we can group them as follows:
  • White smooth thin layers (gypsum–lime-based): 0.16 < Ccc < 0.70 (kg.m−2.min−0.5);
  • Air lime mortars: 0.69 < Ccc < 2.22 (kg.m−2.min−0.5);
  • Air lime–Portland cement mortars: 0.35 < Ccc < 0.59 (kg.m−2.min−0.5);
  • Portland cement mortars:
    (a)
    Cementitious stone-imitating mortars—referred to as Marmorite: 0.08 < Ccc < 0.14 (kg.m−2.min−0.5);
    (b)
    Remaining mortars (excluding CBP4B): 0.11 < Ccc < 0.64 (kg.m−2.min−0.5).
Figure 11 shows the typical drying curve from which it was possible to compute the D1 rate, in this case, for the DN12ABCD set. For the same set, Figure 12 shows the curve as a function of the square root of time from which the value for D2 was estimated.
Figure 13 shows the distribution of the drying rate by liquid water transport D1 and the drying rate of the second phase by mixed liquid water and water vapour transport, D2, in monolayer samples and samples’ individualised layers.
Lower D1 values were generally observed in Portland cement mortars, except for sample EUA53-2B. The air lime mortars show higher D1, denouncing a higher capacity of liquid water transport during the drying process to the surface of the sample followed by evaporation with some variability, as shown by the D2 values, being, in general, higher for air lime mortars which are consistent with their high Ccc and open porosity, possibly related to the predominance of macropores, typical for air lime mortars. Sample AR49-15C presents a low D2 value, which points to a low evaporation rate, producing some retention of vapour inside the pores. As there is no evidence of salts or other contaminants [16], it cannot be said that they have influenced the vapour permeability. Mosquera et al. [31] demonstrated that the porosity does not significantly influence the diffusivity. Instead, the pore radius controls the diffusivity, which, in our case, is unknown and may explain the reduced value of D2.
The same happens in the other air lime mortars built in 1903 and 1923 regarding water vapour diffusion. However, the low thickness of the samples may imply that most water is removed in the liquid phase, and the remaining humidity left for the phase related to water vapour diffusivity is low. The air lime–Portland cement or simply lime–cement (also labelled as AL + PC in some plots) samples analysed in the case study IRF (1938) show a difference in the D1 value. The sample IRF1B presents less cement in the lime-to-cement ratio than the sample IRF4A. Lime–cement mortars reduce both their pore volume and their pore size as cement content in the mix increases [31], as expected in these mortars, which present open porosity values of 31.12% and 22.68% (IRF1B and IRF4A, respectively).
As for the white smooth thin layer samples, they denote a very compact microstructure. In the case of sample CVT3A, the capillary absorption coefficient is low, but the drying rate D1 is high. This fact indicates the presence of some pores larger than the capillary range, which facilitate liquid water drying but do not contribute to absorption.
Finally, Portland cement mortars, applied from the 1930s onwards, show lower D1 rate values for stone-imitating mortars, consistent with the lower Ccc. Between renders and plasters, there are no considerable differences in terms of drying rates, which is also the case for Ccc. Among all the samples with Portland cement binder, CBP4B has the highest D2 ratio, and the sample EUA53-2B has the highest D1 ratio and the lowest D2 ratio. In the first case, the sample shows simultaneously relatively high D1 and very high D2, indicating high transport of liquid water to the sample’s surface, followed by very high evaporation, consistent with their high Ccc and medium open porosity results. In the second case, considering the open porosity result (20.13%) and the low Ccc value (0.64 kg.m−2.min−0.5), the high D1 rate should be related to the pore size and not to its volume.
The drying of the multi-layered samples, as observed in Figure 14, only demonstrates the result for the whole set drying; not possible to individualise the drying effect for each layer in the plot. Still, it is possible to observe that the AR49-8AB set has the highest D1, which is consistent with the type of binder since both layers (A and B) have air lime as a binder. Samples with at least one air lime layer show relatively high D1 values, unlike the AR49-11AB set, as layer A, a lime–gypsum-based, has almost the same thickness as layer B. Layers with gypsum–air lime-based binders seem to produce the effect of lowering the drying rates, particularly the D2 rate, as can be seen in the CBP4AB set by comparison to sample CBP4B (Figure 13).

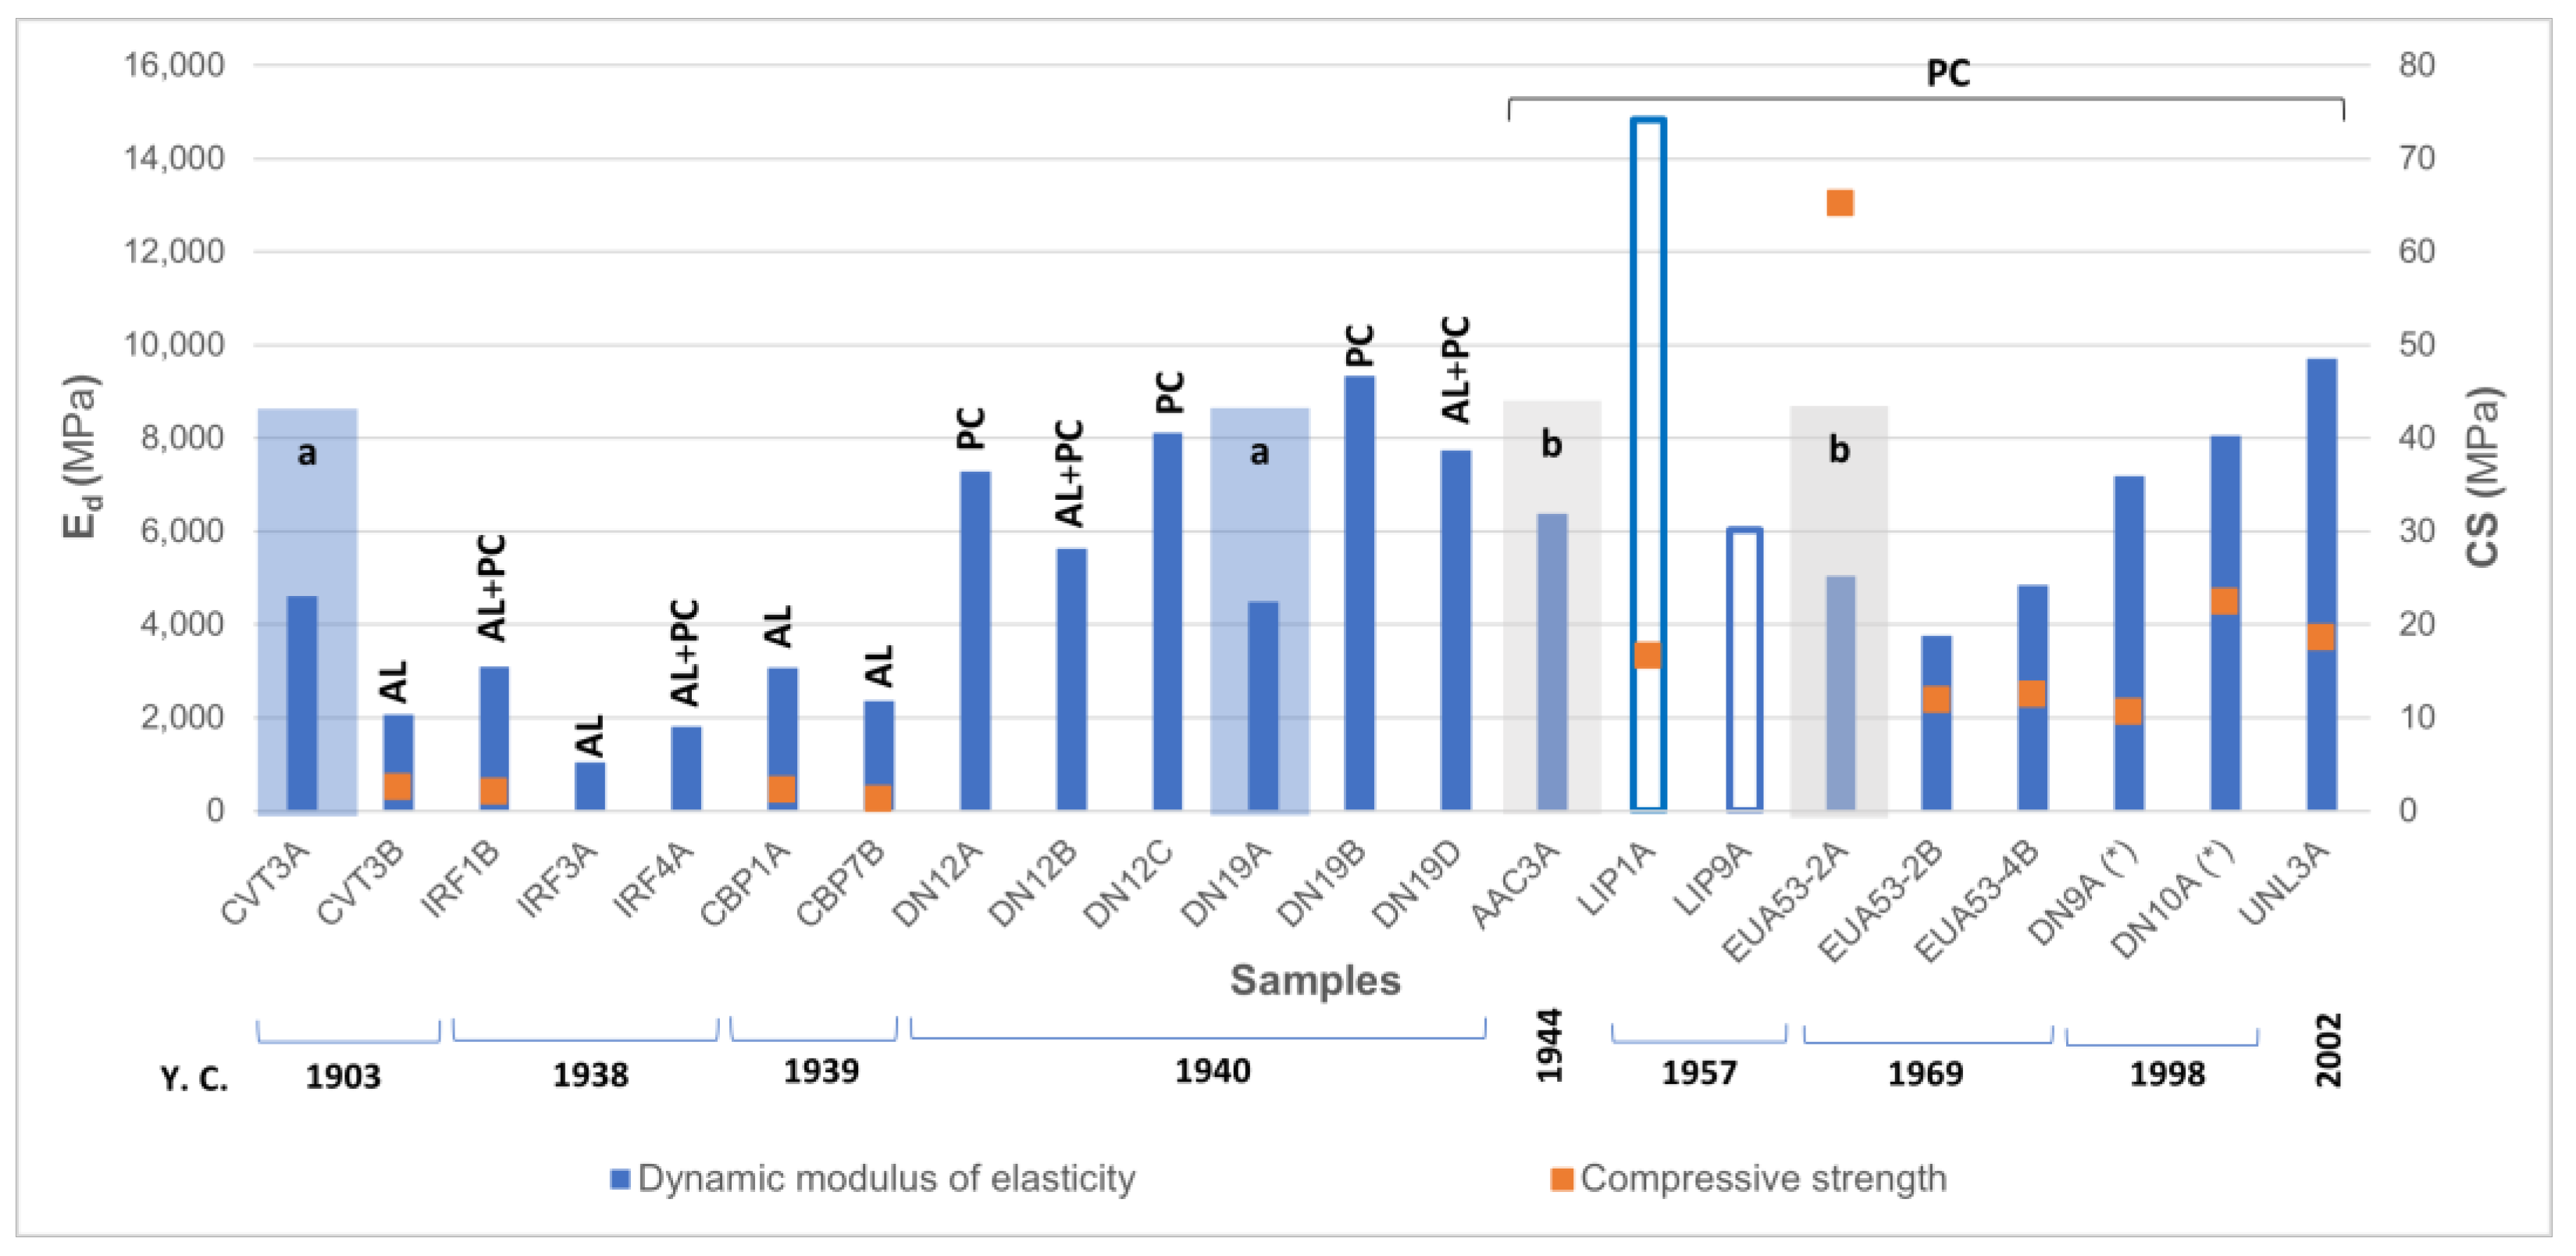
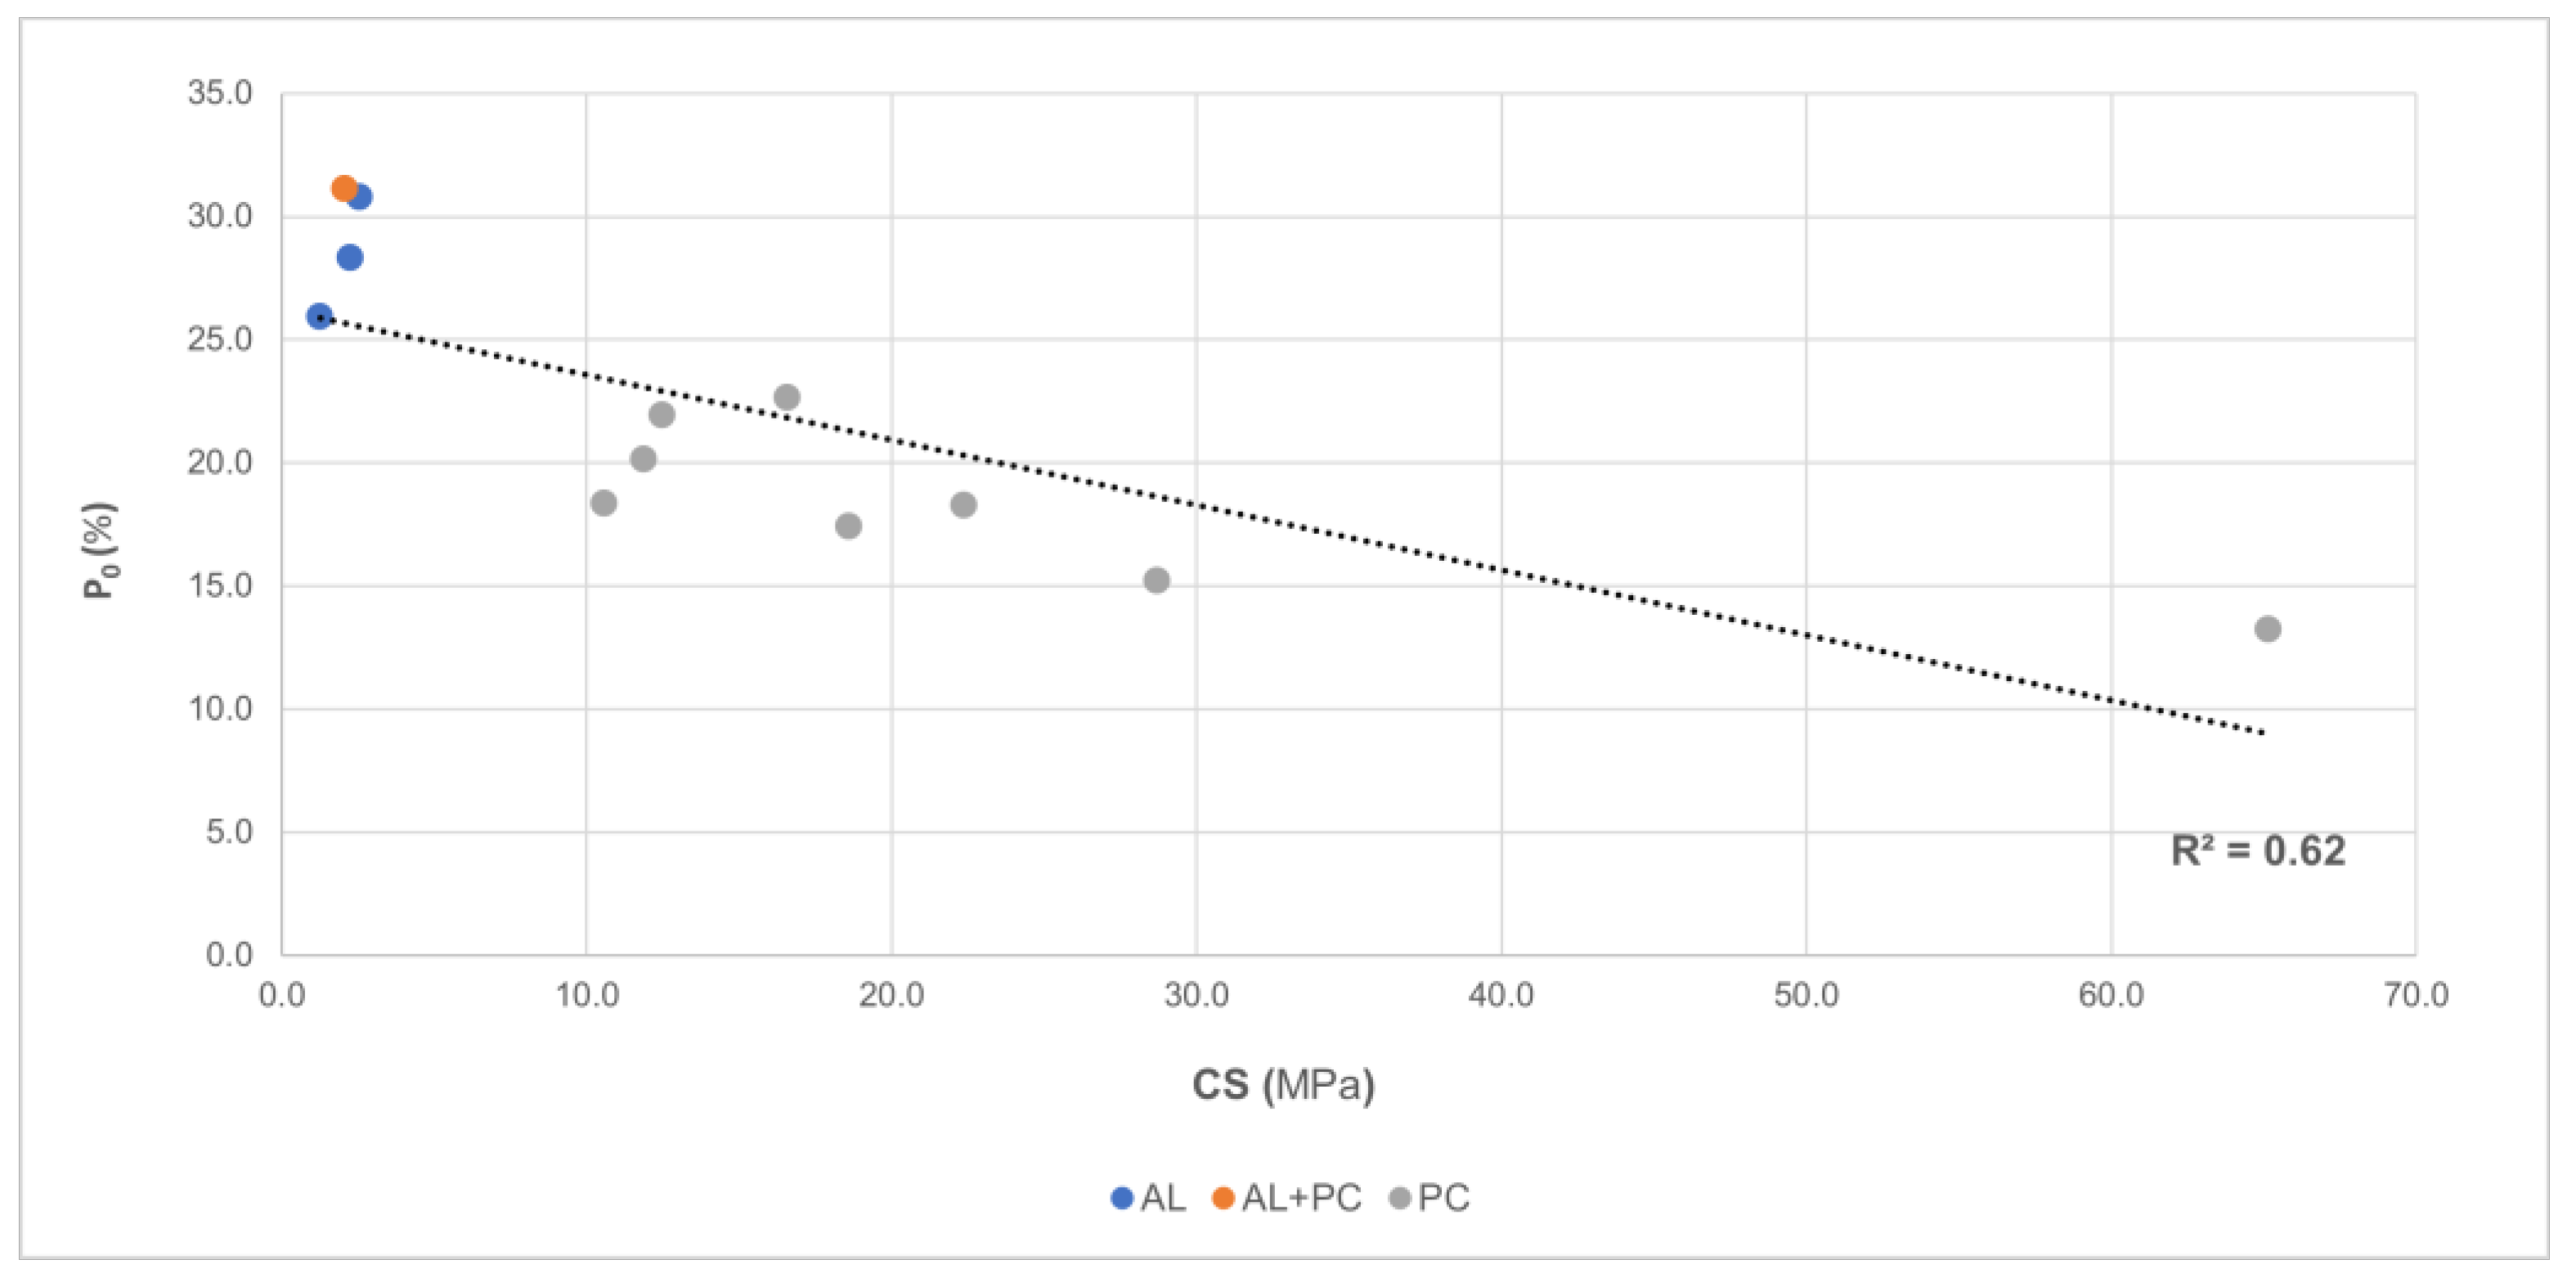
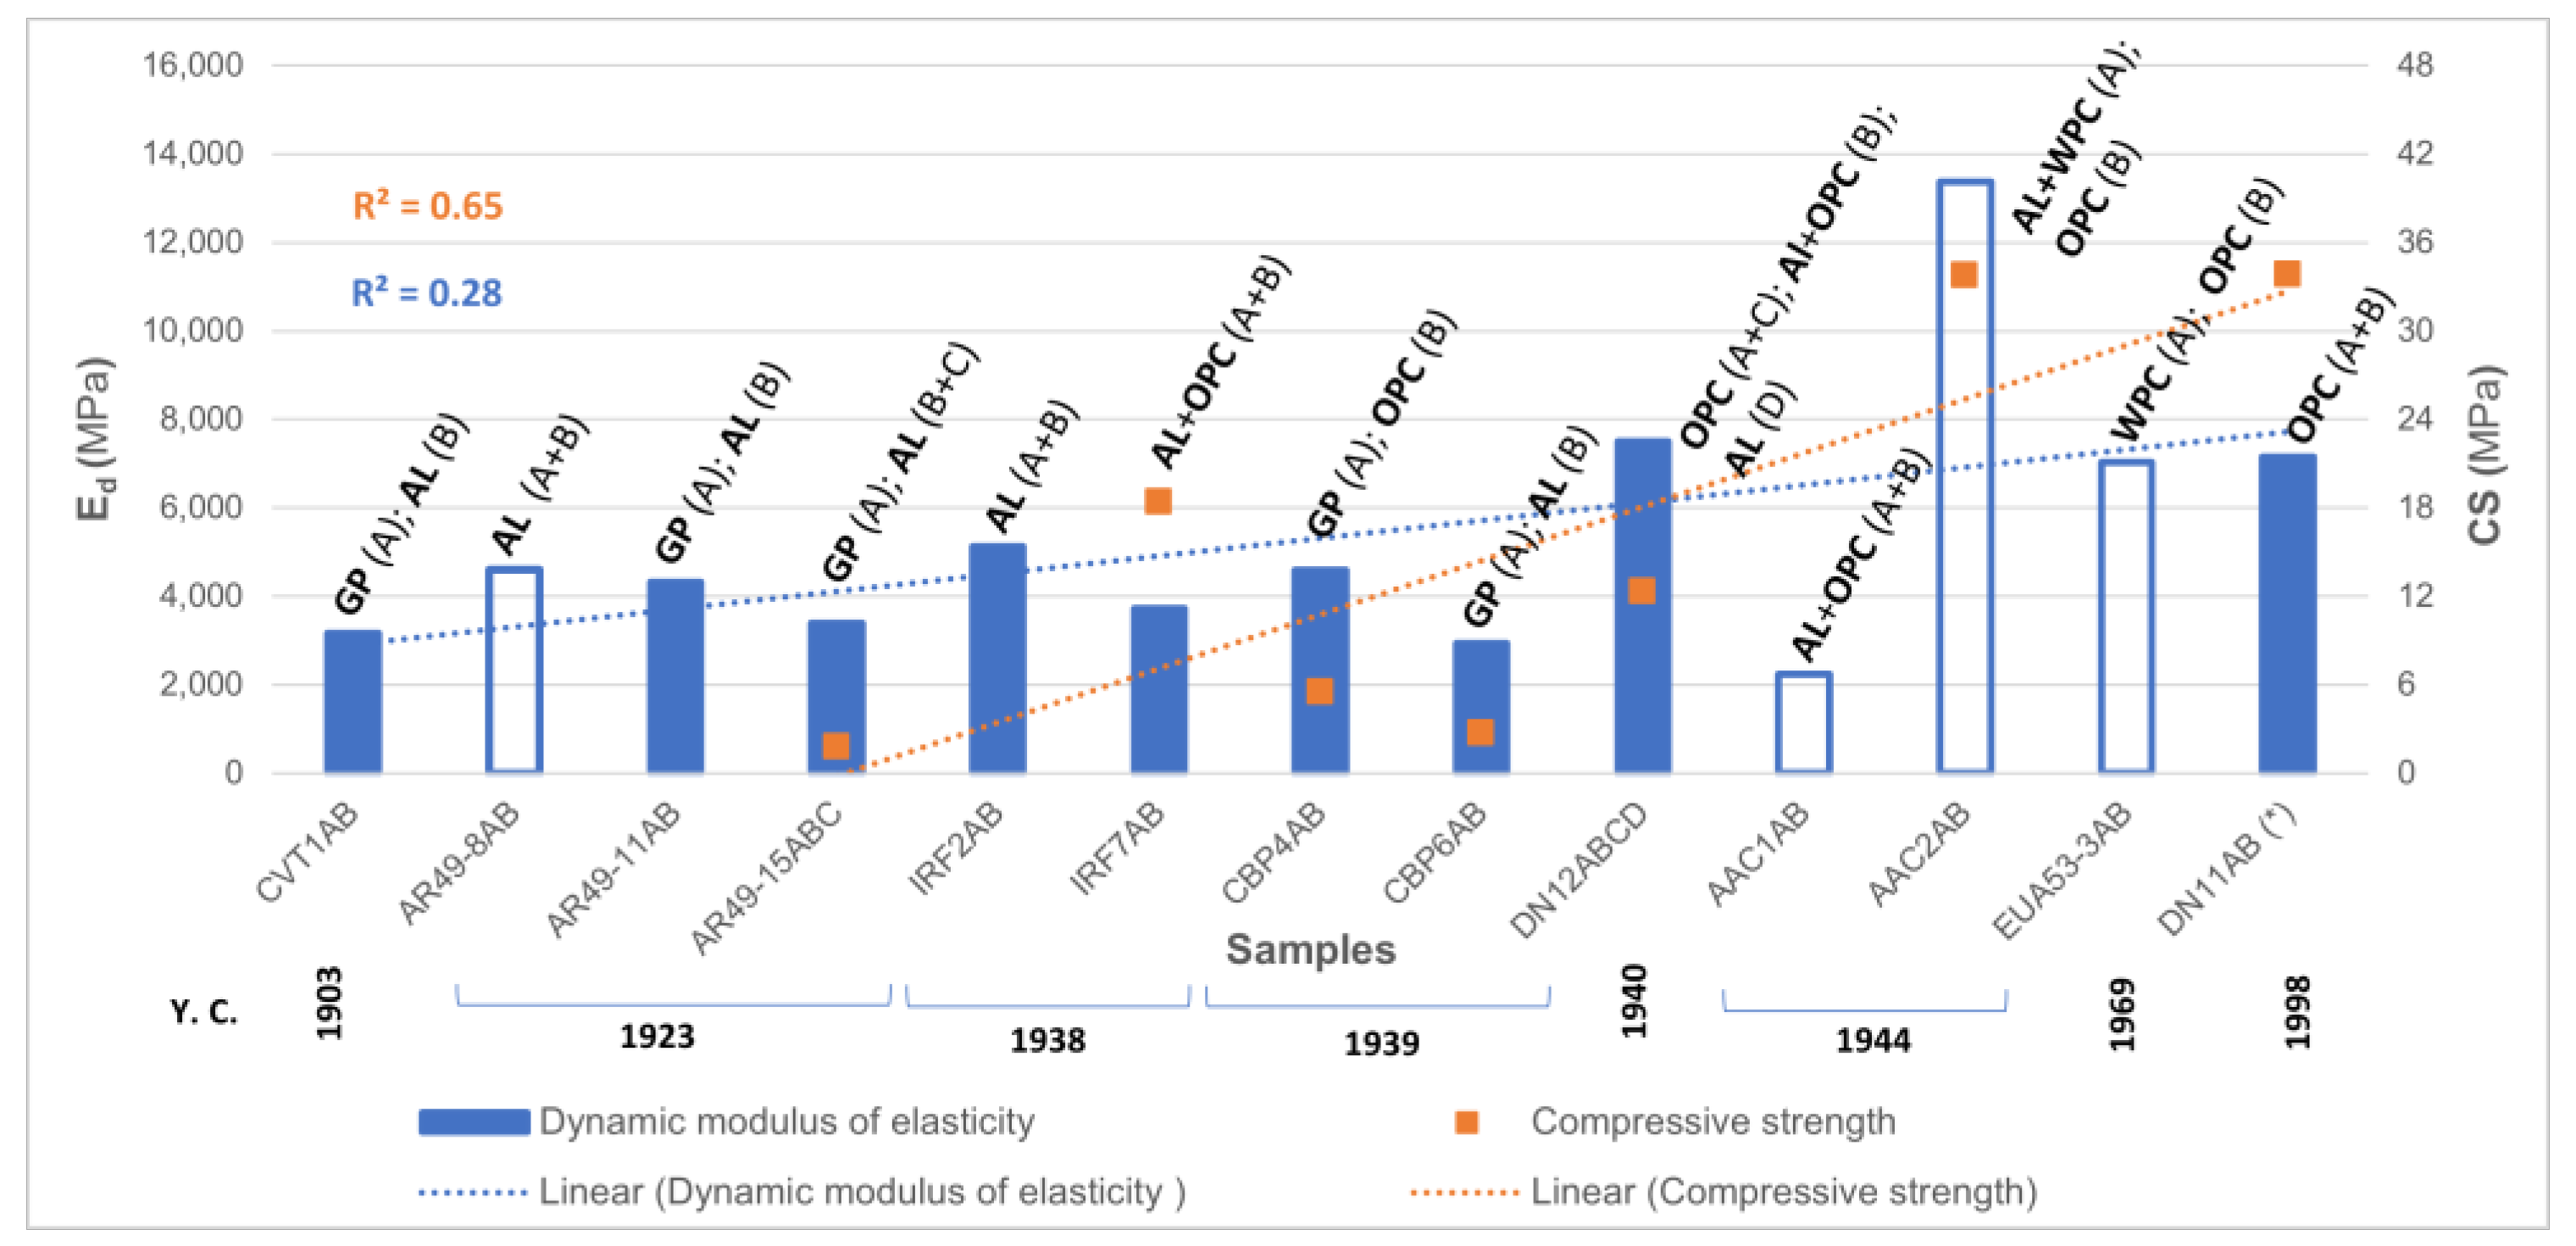
3.2. Mechanical Characterisation

The individualised (single layer) and monolayer dynamic modulus of elasticity results are the lowest for the lime mortars (until the end of the 1930s) since these samples have higher porosity, being more permeable to the fluid circulation, including air and, therefore, with reduced UPV. In opposition, Portland cement mortars exhibit the highest values (Figure 15) since they present higher compactness than air lime mortars. The white smooth thin plasters present Ed values relatively close (ca. 4601 MPa—CVT3A; 4495 MPa—DN19A), which indicates identical porosity values in both samples, although the porosity of sample DN19A is not known. It is also evident that the influence of Portland cement content on the compactness of the air lime-Portland cement mortars, in which the increase of Ed is notorious for a lime-to-cement ratio above 1:1 (samples DN12B and DN19D). Although sample DN12B presents a lower ratio than sample DN19D, i.e., a higher proportion of Portland cement, the velocity of ultrasound wave propagation is lower. Regarding the sample DN19D, which incorporates ground granulated blast furnace slag (GGBFS), as demonstrated in [16], once this kind of addition is finer than the Ordinary Portland cement (OPC) clinker, it led to a less porous structure with fewer capillary pores. Consequently, there would also be a finer distribution of pores [32].
Regarding the Ed, the most significant contrast is verified in sample LIP1A, relative to its Portland cement counterparts by having the highest value. Compared with samples DN19B and UNL3A, whose UPV values are of the same magnitude, LIP1A presents the highest Ed value, which can be influenced by the aggregate content producing higher compactness, as it is the smallest of the three samples. This one and LIP9A are both rendering mortars of the same building. However, this sample shows higher compactness, which is inconsistent with its UPV result.
The bulk density calculation used may explain this discrepancy of values. The calculation of this property should be, whenever possible, performed via tests, avoiding the lack of accuracy that is characteristic of calculations involving the size and mass of the specimen directly, i.e., dividing the mass of the specimen by the product of the average dimension of width, length, and depth. In these cases, the bulk density should only be considered an approximate value to the real one and, consequently, an approximate value of the Ed.
The remaining samples, whose binder is only composed of Portland cement, do not show significant disparities in the Ed values, presenting higher ranges of values than the lime mortars but sometimes lower than the mixed air lime and Portland cement samples.
Regarding the compressive strength results, the difference between lime and Portland cement mortars is clear. As expected, the open porosity (Figure 16) is consistent with the type of mortars, i.e., lime mortars have higher open porosity and consequently lower compressive strength. If the sample EUA53-2A is excepted, the average value of the compressive strength of the Portland cement samples tested is approximately eight times higher than that of the air lime mortars. Sample EUA53-2A is an outlier since its compressive strength value is the highest (65.15 MPa). Besides having an average thickness of 10 mm, which was an a priori condition to exclude it from being tested, it was found that the rupture stress was conditioned by the size and nature of the quartzite aggregates, some with the major axis dimension close to the thickness of the tested sample.
Figure 17 shows the dynamic modulus of elasticity and compressive strength plots for the multi-layer samples. Most sets containing Portland cement have the highest values of the modulus of elasticity. A general tendency is observed for the dynamic modulus of elasticity and compressive strength to increase over the period under analysis, influenced by the introduction of Portland cement as in the case of individualised and monolayer renders and plasters (Figure 15). The sets containing lime mortars maintain the trend observed for the single layers tested, which is that of lower modulus of elasticity values for renders until the 1940s. It must be mentioned that the application of the indirect method to calculate the dynamic modulus of elasticity of each layer is, however, conditioned by the presence of the successive layers, and it is not possible to quantify the influence of each layer on this mechanical property results.
The compressive strength results show that the sets essentially composed of lime as a binder present the lowest values (AR49-15ABC and CBP6AB). The presence of the superficial white smooth thin layer, i.e., the lime–gypsum-based layer (A), should not influence the results that much, as low values of compressive strength are expected for these materials, as demonstrated by Freire et al. [8]. The authors reported average values for compressive strength of 2.26 MPa, which is an intermediate value to those tested on samples AR49-15ABC (1.77 MPa) and CBP6AB (2.69 MPa). The Portland cement mortars show compressive strength values above 30 MPa, except for the CBP4AB set, whose low result directly correlates with the high porosity and the water absorption. The pore structure will necessarily influence that result. A possible explanation for this performance may lie in the water-to-cement ratio employed and either in the hydration or curing conditions of the sample, which are unknown at this point.
The lime–cement sample sets, IRF7AB and DN12ABCD, show compressive strength values between 12 and 19 MPa. These values are closer to Portland cement mortars. However, IRF1B, another lime–cement mortar, shows a value closer to lime mortars (2.09 MPa) (Figure 15 and Table 2). Some authors have concluded that the presence of lime implies variations in compressive strength; that is, the presence of lime in lime–cement mortars reduces compressive strength [26,33], but also the binder-to-aggregate ratio and the type of cement [34] can influence the result of compressive strength. In this case, not only does the binder-to-aggregate ratio vary, but the type of cement used and its physical and mechanical properties still need to be known. It is, however, known that the fineness of older cement is higher than the current ones [35]. However, the combination of all these different parameters makes it difficult to have a more consistent interpretation based on the results obtained for these three samples.

4. Requirements for a Compatible Restoration

The requirements should be considered case-by-case since the plasters and renders analysed are from buildings constructed in different periods throughout the 20th century. The different types of binders, compositions and formulations require such an approach. However, the work already carried out by other authors that established or analysed compatibility parameters [8,11,36], whose application is more relevant in heritage buildings, should be considered. Nevertheless, the parameters investigated in the laboratory should be respected, advising the use of mortars with identical binder characteristics and proportions, similar grain size distribution and aggregate mineralogy. In the case of Portland cement mortars, since the specifications of cement used are not known, the use of OPC (and WPC in the due cases) is proposed in all cases, despite evidence of the use of composite cement [16] in two samples, provided that they do not exceed the quantified values for the physical and mechanical characterisation.
Table 3 shows the ranges of values obtained for the assessed characteristics to be considered in the compatibility requirements. The results are organised by binder and coating type.
Chemical and mineralogical characterisation should be included in the context of compatibility; however, these aspects do not fall within the scope of this manuscript.

5. Conclusions

This paper deals with the physical and mechanical characterisation of fifty-three mortar samples from buildings built in Lisbon in the 20th century and awarded with one of the most significant architectural prizes in Portugal. The results allow compatibility criteria to be established if restoration or conservation actions are required.
The originality and value of this built heritage require developing preservation strategies that involve proactive and routine maintenance, followed by occasional interventions that do not de-characterise the surroundings. To this end, adopting new materials compatible with the originals is essential. Constant monitoring of the state of conservation is also essential to establish the basis for early detection of defects, thus minimising the need for physical interventions.
Via physical and mechanical characterisation, the study made it possible to have a better knowledge of the properties of mortars applied throughout the 20th century, in a period that needs further research. With this study, it was possible to clarify how the techniques evolved, knowing from the start the age of the case studies and, consequently, the age of the samples studied. Despite the difficulty in obtaining samples of sufficient size to perform all the programmed tests, it was still possible to characterise mortars with a high degree of reliability.
The main conclusions are as follows:
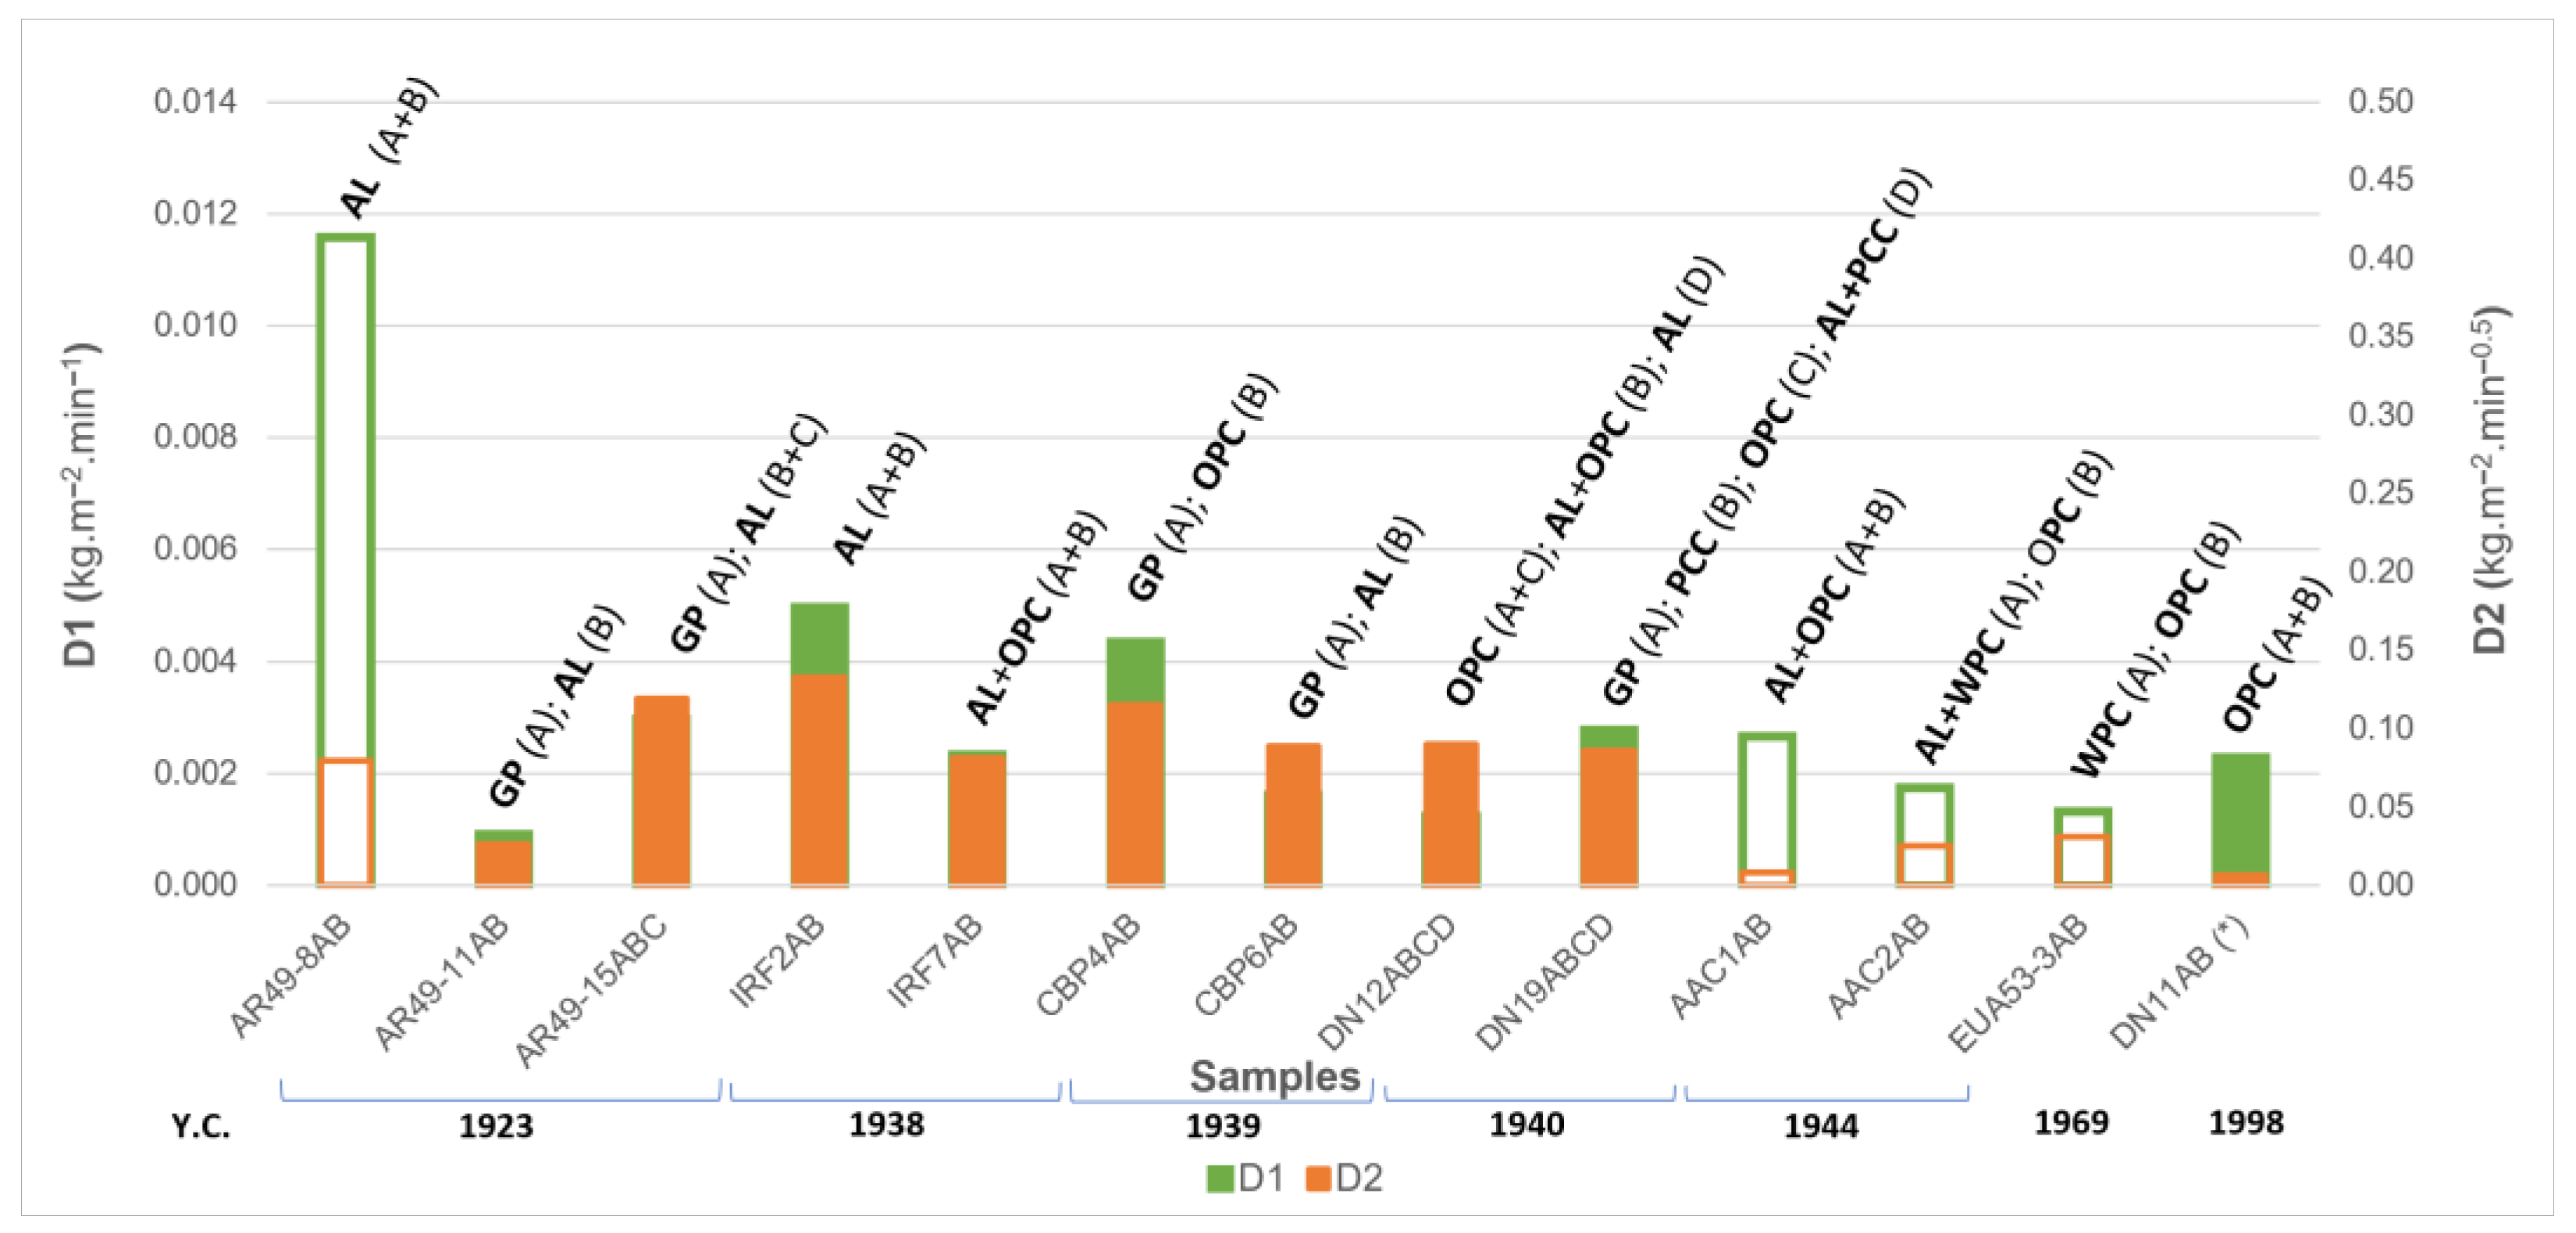
  • The air lime mortars existing in the oldest buildings, between 1903 and 1944, have the highest values of capillary absorption and simultaneously the highest drying rates and present the lowest values of compressive strength and dynamic modulus of elasticity, which is expected for this type of mortars.
  • The blended lime–cement mortars in the buildings constructed between 1938 and 1944 have intermediate capillary absorption and drying rates. Compressive strength values of blended lime–cement mortars and multi-layer mortars with different binders in each layer are variable. In general, an increase in Ed values is due to the introduction of Portland cement.
  • The Portland cement mortars applied in buildings erected after 1939 show the lowest values of capillary absorption and the highest values of mechanical strength.
  • The results of lime–gypsum-based plasters align with those found in the literature for white smooth thin layers applied in Portugal.
  • The stone-imitating mortars (Marmorite type) showed the lowest capillary absorption and, consequently, the lowest open porosities, which points to the governance of the construction technique on reducing these parameters, either by incorporating fillers or by tightening the mortar during their application.
  • No significant differences were found in the physical and mechanical characteristics between the samples of renders and plasters; thus, being intended for internal or external application was not a crucial parameter for the choice of the material.
  • The physical and mechanical values obtained in this study constitute a basis for the definition of compatibility requirements for restoration mortars in the group of buildings studied.
  • For compatibility purposes, the range of values obtained on multi-layer samples, though indicative, should be considered a good approximation of the whole coating properties if there is no possibility of individualising each layer and testing them independently.

6. Future Research

Future research should encompass not only a broader range of mortars within the buildings already under study, where feasible sample collection is possible but also extend to other award-winning structures that remain unexplored, contingent upon the willingness of property owners to grant access and authorisation.
Moreover, the critical importance of including Portuguese standard buildings from other regions in these research endeavours is worth noting. Comparing the mortars and construction techniques employed in award-winning buildings to those found in standard structures from the 20th century can yield valuable insights. This comparative approach will contribute significantly to our understanding of the evolution of construction practices and the materials used throughout this pivotal century in architectural history.
This expanded passage underscores the necessity of ongoing research and the potential benefits of comparing award-winning buildings to standard constructions for a comprehensive understanding of 20th-century mortar properties.

Author Contributions

Conceptualization, L.A.; Investigation, L.A., A.S.S., R.V. and J.M.; Writing—original draft, L.A.; Writing—review & editing, L.A., A.S.S., R.V. and J.M.; Supervision, A.S.S., R.V. and J.M. All authors have read and agreed to the published version of the manuscript.

Funding

This research was funded by the Portuguese Foundation for Science and Technology—Fundação para a Ciência e a Tecnologia—FCT, grant SFRH/BD/112809/2015.

Data Availability Statement

Data sharing is not applicable to this article.

Acknowledgments

The authors would like to acknowledge FCT via PO-CI-01-0145-FEDER-031612 research project: CEMRESTORE: Mortars for early 20th century buildings’ conservation: compatibility and sustainability. The authors also acknowledge the buildings’ owners for study authorisations and the National Laboratory for Civil Engineering for its support via the projects DUR-HERITAGE—Durability and characterisation of historical interest construction materials and PRESERVe—Preservation of renders from built heritage with cultural value: identification of risks and contribution of traditional knowledge and new materials for conservation and protection.

Conflicts of Interest

The authors declare no conflict of interest.

References

  1. CML. Prémio Valmor [Valmor Prize]; Silva, A.P., Ed.; Câmara Municipal de Lisboa: Lisbon, Portugal, 2004. [Google Scholar]
  2. Pedreirinho, J.M. A Critical History of the Valmor Prize. Argumentum 2018, 1–175. [Google Scholar]
  3. Apostolopoulou, M.; Moropoulou, A. Mortars for Restoration: Set-up Parameters and Developing Mortar Design Areas. In Conserving Stone Heritage. Cultural Heritage Science; Gherardi, F., Maravelaki, P.N., Eds.; Springer: Cham, Switzerland, 2022. [Google Scholar] [CrossRef]
  4. Moropoulou, A.; Bakolas, A.; Moundoulas, P.; Aggelakopoulou, E.; Anagnostopoulou, S. Design and evaluation of restoration mortars for historic masonry using traditional materials and production techniques. MRS Online Proc. Libr. 2002, 712, 27. [Google Scholar] [CrossRef]
  5. Veiga, M.R.; Silva, S. Mortars. In Long-Term Performance and Durability of Masonry Structures, Chapter 6. Degradation Mechanisms, Health, Monitoring and Service Life Design, 1st ed.; Ghiassi, B., Lourenço, P.B., Eds.; Elsevier Ltd.: Amsterdam, The Netherlands, 2019; pp. 169–208. [Google Scholar]
  6. Almeida, L.; Silva, A.S.; Veiga, M.d.R.; Mirão, J.; Vieira, M. 20th-Century Award-Winning Buildings in Lisbon (Portugal). Study of Plasters, Rendering, and Concrete Materials Aiming Their Sustainable Preservation. Buildings 2021, 11, 359. [Google Scholar] [CrossRef]
  7. Veiga, M.R.; Velosa, A.; Magalhães, A. Evaluation of mechanical compatibility of renders to apply on old walls based on a restrained shrinkage test. Mater. Struct. 2007, 40, 1115–1126. [Google Scholar] [CrossRef]
  8. Freire, M.T.; Santos Silva, A.; Veiga, M.R.; Brito, J. Studies in ancient gypsum based plasters towards their repair: Physical and mechanical properties. Constr. Build. Mater. 2019, 202, 319–531. [Google Scholar] [CrossRef]
  9. Papayanni, I. Design and manufacture of repair mortars for interventions on monuments and historical buildings. In Workshop “Repair Mortars for Historic Masonry”; RILEM, Ed.; TC RMH: Delft, The Netherlands, 25–28 January 2005. [Google Scholar]
  10. Veiga, M.R. Conservation of historic renders and plasters: From laboratory to site. Historic Mortars: Characterisation, Assessment, Conservation and Repair. In RILEM Bookseries; Válek, J., Groot, C., Hughes, J.J., Eds.; Springer: Berlin/Heidelberg, Germany, 2013; Volume 7, 464p. [Google Scholar] [CrossRef]
  11. Veiga, M.R.; Fragata, A.; Velosa, A.L.; Magalhães, A.C.; Margalha, G. Lime-based mortars: Viability for use as substitution renders in historical buildings. Int. J. Archit. Herit. 2010, 4, 177–195. [Google Scholar] [CrossRef]
  12. Groot, C.; Veiga, R.; Papayianni, I.; Hees, R.V.; Secco, M.; Alvarez, J.I.; Faria, P.; Stefanidou, M. RILEM TC 277-LHS report: Lime-based mortars for restoration–a review on long-term durability aspects and experience from practice. Mater. Struct. 2022, 55, 245. [Google Scholar] [CrossRef]
  13. Nogueira, R.; Pinto, A.P.F.; Gomes, A. Design and behavior of traditional lime-based plasters and renders. Review and critical appraisal of strengths and weaknesses. Cem. Concr. Compos. 2018, 89, 192–204. [Google Scholar] [CrossRef]
  14. Zacharopoulou, G. The Renascence of Lime Based Mortar Technology. An Appraisal of a Bibliographic Study. In Compatible Materials Recommendations for the Preservation of European Cultural Heritage; Technical Chamber of Greece: Athens, Greece, 1998; pp. 89–114. [Google Scholar]
  15. Callebaut, K.; Elsen, J.; Van Balen, K.; Viaene, W. Nineteenth century hydraulic restoration mortars in the Saint Michael’s Church (Leuven, Belgium) Natural hydraulic lime or cement? Cem. Concr. Res. 2001, 31, 397–403. [Google Scholar] [CrossRef]
  16. Almeida, L.; Silva, A.S.; Veiga, R.; Mirão, J. Composition of renders and plasters of award-winning buildings in Lisbon (Portugal): A contribution to the knowledge of binders used in the 20th Century. Int. J. Archit. Herit. 2023. [Google Scholar] [CrossRef]
  17. Veiga, R.; Magalhães, A.; Bosilikov, V. Capillarity tests on historic mortar samples extracted from site. Methodology and compared results. In Proceedings of the 13th International Masonry Conference, Amsterdam, The Netherlands, 4–7 July 2004; Martens, D., Vermeltfoort, A., Eds.; Eindhoven University of Technology: Eindhoven, The Netherlands, 2004. [Google Scholar]
  18. Magalhães, A.; Veiga, R. Physical and mechanical characterisation of ancient mortars. Application to the evaluation of the state of conservation. Mater. Construcción 2008, 59, 61–77. [Google Scholar] [CrossRef]
  19. Válek, J.; Veiga, R. sCharacterisation of mechanical properties of historic mortars—Testing of irregular samples. Adv. Archit. Ser. 2005, 20, 365–374. [Google Scholar]
  20. CEN-EN 15801:2009; Conservation of Cultural Property. Test Methods. Determination of Water Absorption by Capillarity. European Standard: Brussels, Belgium, 2009.
  21. CEN-EN 16322:2013; Conservation of Cultural Heritage—Test, Methods—Determination of Drying Properties. European Standard: Brussels, Belgium, 2013.
  22. Damas, A.L.; Veiga, M.R.; Faria, P.; Santos Silva, A. Characterisation of old azulejos setting mortars: A contribution to the conservation of this type of coatings. Constr. Build. Mater. 2018, 171, 128–139. [Google Scholar] [CrossRef]
  23. CEN-EN 1936:2006; Natural Stone Test Methods—Determination of Real Density and Apparent Density, and of Total and Open Porosity. European Standard: Brussels, Belgium, 2006.
  24. CEN-EN 12504-4:2007; Testing Concrete in Structures—Part 4: Determination of Ultrasonic Pulse Velocity. European Standard: Brussels, Belgium, 2007.
  25. CEN-EN 1015-11:1999; Methods of Test for Mortar for Masonry. Part 11: Determination of Flexural and Compressive Strength. European Standard: Brussels, Belgium, 1999.
  26. Arandigoyen, M.; Alvarez, J.I. Pore structure and mechanical properties of cement-lime mortars. Cem. Concr. Res. 2007, 37, 767–775. [Google Scholar] [CrossRef]
  27. Lanas, J.; Alvarez, J.I. Masonry repair lime-based mortars: Factors affecting the mechanical behavior. Cem. Concr. Res. 2003, 33, 1867–1876. [Google Scholar] [CrossRef]
  28. Santos, A.R.; Veiga, M.R.; Santos Silva, A.; Brito, J. Microstructure as a critical factor of cement mortars’ behaviour: The effect of aggregates’ properties. Cem. Concr. Compos. 2020, 111, 103628. [Google Scholar] [CrossRef]
  29. Santos, A.R.; Veiga, M.R.; Santos Silva, A.; Brito, J.; Álvarez, J.I. Evolution of the microstructure of lime based mortars and influence on the mechanical behaviour: The role of the aggregates. Constr. Build. Mater. 2018, 187, 907–922. [Google Scholar] [CrossRef]
  30. Laboratório Nacional de Engenharia Civil. Execução de Marmorites [Marmorite Execution]; Especificações E 5-1952; LNEC: Lisboa, Portugal, 1952. [Google Scholar]
  31. Mosquera, M.J.; Silva, B.; Prieto, B.; Ruiz-Herrera, E. Addition of cement to lime-based mortars: Effect on pore structure and vapor transport. Cem. Concr. Res. 2006, 36, 1635–1642. [Google Scholar] [CrossRef]
  32. Loke, C.K.; Lehane, B.; Aslani, F.; Majhi, S.; Mukherjee, A. Non-Destructive evaluation of mortar with ground granulated blast furnace slag blended cement using ultrasonic pulse velocity. Materials 2022, 15, 6957. [Google Scholar] [CrossRef]
  33. Haach, V.G.; Vasconcelos, G.; Lourenço, P.B. Assessment of compressive behavior of concrete masonry prisms partially filled by general mortar. J. Mater. Civ. Eng. 2014, 26, 04014068. [Google Scholar] [CrossRef]
  34. Ramesh, M.; Azenha, M.; Lourenço, P.B. Quantification of impact of lime on mechanical behaviour of lime cement blended mortars for bedding joints in masonry systems. Constr. Build. Mater. 2019, 229, 116884. [Google Scholar] [CrossRef]
  35. Vidovszky, I.; Pintér, F. An Investigation of the Application and Material Characteristics of Early 20th-Century Portland Cement-Based Structures from the Historical Campus of the Budapest University of Technology and Economics. Int. J. Archit. Herit. 2018, 14, 358–375. [Google Scholar] [CrossRef]
  36. Pacheco-Torgal, F.; Faria, J.; Jalali, S. Some considerations about the use of lime–cement mortars for building conservation purposes in Portugal: A reprehensible option or a lesser evil? Constr. Build. Mater. 2012, 30, 488–494. [Google Scholar] [CrossRef]
Figure 1. Multi-layer sample set DN12ABCD. A paint finish layer (red arrow) can be seen covering the most superficial layer (A). The sample layers are labelled A–D.
Buildings 13 02468 g001
Figure 2. Multi-layered sample CVT1ABC: (a) sampling on a wall with pre-existing detachment; (b) layers’ specimens A, B and C. The white finishing smooth thin plaster corresponds to layer A. Red dots divide layers B and C.
Buildings 13 02468 g002
Figure 3. Stone-imitating mortar applied on the rear façade of the case study AAC 1944 (a), and a sample render (AAC2A, see Table 1) was collected in the same building (b).
Buildings 13 02468 g003
Figure 4. Determination of the capillary water absorption by contact of non-friable (a) and friable samples (b); and drying procedure (c).
Buildings 13 02468 g004
Figure 7. Compressive strength test.
Buildings 13 02468 g007
Figure 8. Capillary absorption curves of monolayer selected samples and respective slopes (Ccc).
Buildings 13 02468 g008
Figure 9. Evolution of Ccc of Portland cement mortars regardless of the Portland cement type (orange columns—marmorite samples). Y. C.—Building’s year of construction completion; (*) mortars from the 1940 award-winning prize.
Buildings 13 02468 g009
Figure 10. Capillary absorption curves of multi-layer selected samples and respective slopes (Ccc).
Buildings 13 02468 g010
Figure 11. Drying curve and first drying phase D1 representation.
Buildings 13 02468 g011
Figure 12. Drying curve and second drying phase D2 representation.
Buildings 13 02468 g012
Figure 13. Comparison of the two main drying phases (D1 and D2) of individualised and monolayer renders (columns without colour fill) and plasters (coloured columns). Notation: a—white smooth thin plasters (gypsum–air-lime-based plasters); b—stone-imitating mortars; AL—air lime; PC—encompasses all types of Portland cement (ordinary; composite and white Portland cement); Y. C.—Building’s year of construction completion or mortars’ execution year; (*) mortars from the 1940 award-winning prize.
Buildings 13 02468 g013
Figure 14. Comparison of the two main drying phases (D1 and D2) of multi-layer renders (columns without colour fill) and plasters (coloured columns). Notation: Binder types per layer (layers A–D in brackets)—GP: Gypsum–-air lime-based plasters (white smooth thin plasters); AL: Air lime; OPC: Ordinary Portland cement; WPC: White Portland cement; PCC: Portland composite cement; Y. C.—Building’s year of construction completion or mortars’ execution year; (*) mortars from the 1940 award-winning prize.
Buildings 13 02468 g014
Figure 15. Dynamic modulus of elasticity (Ed) and compressive strength (CS) plot of the individualised and monolayer renders (columns without colour fill) and plasters (blue-coloured columns). Notation: a—white smooth thin plasters (gypsum–air-lime-based plasters); b—stone-imitating mortars; Binder types—AL: Air lime; PC: encompasses all types of Portland cements (ordinary; composite and white Portland cements); Y. C.—Building’s year of construction completion or mortars’ execution year; (*) mortars from the 1940 award-winning prize.
Buildings 13 02468 g015
Figure 16. Correlation between open porosity (P0) and compressive strength (CS). AL—air lime; PC—encompasses all types of Portland cement (ordinary; composite and white Portland cement).
Buildings 13 02468 g016
Figure 17. Dynamic modulus of elasticity (Ed) and compressive strength (CS) plot of multi-layer renders (columns without colour fill) and plasters (blue-coloured columns). Notation: Binder types per layer (layers A – D in brackets))—GP: Gypsum–air lime-based plasters (white smooth thin plasters); AL: Air lime; OPC: Ordinary Portland cement; WPC: White Portland cement; Y. C.—Building’s year of construction completion or mortars’ execution year; (*) mortars from the 1940 award-winning prize.
Buildings 13 02468 g017
Table 1. Building location and general characteristics of the samples according to Almeida et al. [16].
Case StudyBuilding Name and Location
(WGS84 Coordinates)
Awa.
Yr.
Comp. Yr.Location of the Samples/Sampled Element/Application TechniqueSamples IDSamples DescriptionTh. (mm)
CVT (1903)Ventura Terra Building
(38.72082, −9.15319)
19031903Basement–entrance hall/Internal wall/Multi-layer plasterCVT1AGypsum-air lime-based plaster. Finishing layer2
CVT1BWhite mortar with siliceous sand5
CVT1CBrownish mortar with lime lumps and siliceous sand20
Ground floor–Adornment arch of the Entrance hall/Internal wall/Multi-layer plaster CVT3AGypsum-air lime-based plaster5
CVT3BOrange-brownish, friable mortar with lime lumps and siliceous sand 20
AR49 (1923)Luiz Rau Building
(38.73872, −9.14668)
19231923Courtyard access. Ground floor. Ceiling/External wall/Multi-layer renderAR49-6COrange-brownish, friable mortar with lime lumps and siliceous sand10 *
Balcony on the 5th floor. East façade/External wall/Multi-layer plasterAR49-8AWhitish mortar with fine siliceous sand4
AR49-8BOrange-brownish, friable mortar with lime lumps and siliceous sand12
West-facing wall between 5th and 6th stair floor landing/Internal wall/Multi-layer plasterAR49-11AGypsum-air lime-based plaster3
AR49-11BWhite mortar with siliceous sand5
Window located on the stairs between the 4th and 5th floor/Internal window-lintel/Multi-layer plasterAR49-15AGypsum-air lime-based plaster3
AR49-15BWhite mortar with siliceous sand5
AR49-15COrange-brownish, friable mortar with lime lumps and siliceous sand25
IRF (1938)Nossa Senhora do Rosário de Fátima Church
(38.74005, −9.15051)
19381938Sacristy/Internal wall/Multi-layer plasterIRF1BBrownish mortar with lime lumps and siliceous sand10
Nossa Senhora da Piedade Chapel/Internal wall/Multilayer plasterIRF2AWhite mortar with fine siliceous sand5
IRF2BOrange-brownish mortar with siliceous sand3 *
Main chapel gallery (roof access)/Internal wall/Multi-layer plasterIRF3AWhite mortar with fine siliceous sand4
IRF3BOrange-brownish mortar with lime lumps and siliceous sand5 *
Interior access to the bell tower/Internal wall/Monolayer plasterIRF4ASingle-layer, grey-brown mortar with lime nodules and siliceous sand10
Interior access to the bell tower/Internal wall/Multi-layer plasterIRF7ABrownish-grey mortars with lime lumps and siliceous sand10
IRF7B8
CBP (1939)Bernardo da Maia House
(38.73867, −9.16181)
19391939Basement. Staff room/Internal wall/Monolayer plasterCBP1ASingle-layer, whitish mortar with lime lumps and siliceous sand15
1st floor activity’s room/Internal wall/Multi-layer plasterCBP4AGypsum-air lime-based plaster3
CBP4BGreyish mortar with siliceous sand15
1st floor. Corridor to the activity’s room/Internal wall/Multi-layer plasterCBP6AGypsum-air lime-based plaster4
CBP6BWhitish mortar with lime lumps and siliceous sand.15
CBP7BWhitish mortar with lime lumps and siliceous sand20 *
DN (1940)Diário de Notícias Building
(38.72376, −9.14810)
19401940Level 2. Technical rooms’ corridor/Internal wall–column/Monolayer plasterDN9A **Greyish mortar with siliceous sand31
DN10A **Greyish mortar with siliceous sand31
Level 2. Technical rooms’ corridor/Internal wall–column/Multi-layer plasterDN11A **Greyish mortar with siliceous sand20
DN11B **Greyish mortar with siliceous sand6
Level 2. Warehouse room/Internal wall–column/Multi-layer plasterDN12AGreyish mortar with siliceous sand20
DN12BBrownish mortar with lime lumps and siliceous sand30
DN12CCompact grey mortar with fine siliceous sand15
DN12DWhitish mortar with lime lumps and siliceous sand15
5th floor. Office room–North wall/Internal wall/Multi-layer plasterDN19AGypsum-air lime-based plaster4
DN19BGreyish mortar with siliceous sand12
DN19CGreyish mortar with siliceous sand5
DN19DLight brownish mortar with lime lumps and siliceous sand20
AAC (1944)Cristino da Silva Building
(38.71676, −9.15777)
19441944Side access to ground floor/External wall/Multi-layer renderAAC1ARough, red-coloured mortar with fine siliceous sand7
AAC1BGreyish mortar with siliceous fine sand7
Ground floor outdoor render/External wall/Multi-layer renderAAC2AStone-imitating mortar with projected limestone aggregates 5
AAC2BGreyish mortar with siliceous sand15
Boiler room/Internal wall/Multi-layer renderAAC3AStone-imitating mortar “Marmorite” with white and blueish limestone aggregates5
Step coating of inside stairs/Internal wall/Multi-layer renderAAC4AStone-imitating mortar “Marmorite” with white limestone aggregates5
LIP (1958)Laboratories of Pasteur Institute of Lisbon
(38.75730, −9.10695)
19581957Chimney render/External wall/Monolayer renderLIP1AGrey mortar with siliceous sand20
Ground floor. South building. west façade/External wall/Monolayer renderLIP9AGrey mortar with siliceous sand7
EUA53 (1970)América Building
(38.74877, −9.13695)
19701969Common interior staircase wall. Third floor/Internal wall/Multi-layer renderEUA53-2AStone-imitating mortar “Marmorite” with quartzite aggregates10
EUA53-2BGrey mortar with siliceous sand15
Chimney render/External wall/Multi-layer renderEUA53-3AYellow stone-imitating mortar “Marmorite” with white limestone aggregates8
EUA53-3BCompact grey mortar with siliceous sand50
Corridor of the technical area/Internal wall/Multi-layer plasterEUA53-4BGrey mortar with siliceous sand20
UNL (2002)New University of Lisbon Rectory
(38.73440, −9.16026)
20022002Air treatment unit room/Internal wall/Monolayer renderUNL3ASingle-layer greyish mortar with siliceous sand15
Notation: Awa. Yr.—Award year; Comp. Yr.—Year of completion of building construction; Th—Average thickness of the sample (mm); * Measurement performed directly on the sample (lower than the total thickness of the corresponding layer); ** Samples of the plasters applied during a refurbishment action in 1998.
Table 2. Summary of results obtained for the analysed samples (by layer or by sets of layers).
Case StudiesSamplesLayers’ SetD1D2CccUPVEdusP0 ρ CSBinder Type (Per Layer) (2)b/a (2)
kg.m−2.min−1kg.m−2.min−0.5m.s−1MPa%kg.m−3MPa
CVT (1903)CVT1A(b)0.00210.05390.39 GP(b)
CVT1ABSet A + B 1670.053155.11 (1) GP (A); AL (B)(b)
CVT1C(b)(a)1.22 33.801664.94 AL1:7.8
CVT3A(b)0.00240.00660.162011.494600.9640.481263.48 GP(b)
CVT3B(b)0.00360.01441.471164.882073.3030.771697.672.57AL1:4.3
CVT3ABWhole set 6.17GP (A); AL (B)(b)
AR49 (1923)AR49-6C(b)0.00130.02250.69 32.051687.79 AL1:5.8
AR49-8B(b) 26.891759.82 AL1:11.2
AR49-8ABWhole set0.01160.07980.831725.334606.0426.831719.26 AL (A); AL (B)(b)
AR49-11A(b) 47.441293.50 GP(b)
AR49-11ABWhole set0.00090.02630.782166.514319.57(1) GP (A); AL (B)(b)
AR49-15C(b)0.01290.02941.68 AL1:7.9
AR49-15ABCWhole set0.00300.11951.351476.893385.2430.761724.461.77GP (A); AL (B); AL (C)(b)
IRF (1938)IRF1B(b)0.00570.12910.591427.563092.0431.121685.822.09AL + OPC1:1:7
IRF2ABWhole set0.00500.13300.761868.215129.75(1) AL(b)
IRF3A(b)0.00190.04590.28830.501054.5733.041698.83 AL1:4.2
IRF3B(b)0.00680.12521.62 31.021706.65 AL1:8
IRF4A(b)0.00160.07490.541022.731814.0122.681926.98 AL + OPC1:5.4
IRF7ABWhole set0.00230.08130.631477.763722.0324.071893.7818.37AL + OPC (A); AL + OPC (B)(b)
CBP (1939)CBP1A(b)0.00330.11761.251418.813077.7128.311698.792.27AL1:8.4
CBP4B(b)0.00410.45902.05 25.971832.76 OPC1:20.3
CBP4ABWhole set0.00430.11531.911726.224579.3233.171602.725.48GP (A); OPC (B)(b)
CBP6ABWhole set0.00160.08921.281437.192942.0129.471707.522.69GP (A); AL (B)(b)
CBP7B(b)0.00310.10992.221207.732359.5825.921797.431.26AL1:11.2
DN9 (1940)DN9A(b)0.00160.07060.311994.657184.4118.342006.4010.59OPC1:6.1
DN10A(b)0.00230.07060.232109.278049.4918.252010.3022.39OPC1:7
DN11ABWhole set0.00230.00650.231984.137150.7918.432018.2433.81OPC(b)
DN12ABCDWhole set0.00120.09030.392173.917502.27 12.34OPC (A); AL + OPC (B); OPC (C); AL (D)(b)
DN12A(b) 2057.607281.2323.661910.91 OPC1:12.9
DN12B(b) 1848.025640.6323.061835.15 AL + OPC1:2.1:15.1
DN12C(b) 2149.778120.5117.581952.35 OPC1:4.2
DN12ABSet A + B(c)0.55 OPC (A); AL + OPC (B)(b)
DN12CDSet C + D(c)0.42 OPC (C); AL (D)(b)
DN19A(b)(c)0.701995.444495.09 (1) GP(b)
DN19B(b)(c)0.502317.209346.0022.241933.82 PCC1:25.2
DN19C(b)(c)0.22 OPC1:8.9
DN19D(b)(c)0.582170.777744.0826.761826.43 AL + PCC1:1:6
DN19ABCDWhole set0.00280.08610.21 9.71GP (A); PCC (B); OPC (C); AL + PCC (D)(b)
AAC (1944)AAC1A(b)(c)0.53 AL + OPC1:0.2:6.1
AAC1B(b)(c)0.35 AL + OPC1:0.2:7
AAC1ABWhole set0.00270.00830.371197.602233.1431.201730.00 AL + OPC (A); AL + OPC (B)(b)
AAC2ABWhole set0.00170.02550.192654.6313369.5214.112107.9733.78AL + WPC (A); OPC (B)(b)
AAC3A(b)0.00080.01510.101863.356383.21 (1) OPC1:3.0
AAC4A(b)0.00150.02110.14 OPC1:1.9
LIP (1958)LIP1A(b)0.00200.03770.632281.7914841.5022.641919.6416.58OPC1:7.6
LIP9A(b)0.00130.02520.111533.746040.63 (1) OPC1:6.6
EUA53 (1970)EUA53-2A(b)0.00130.01970.081580.615050.1313.202246.0065.15WPC1:3.7
EUA53-2B(b)0.00690.00960.641460.563764.4920.131960.7511.90OPC1:6.7
EUA53-3B(b)0.00390.04150.11 15.202066.0028.72OPC1:4.9
EUA53-3ABWhole set0.00130.03100.071916.817024.69 (1) WPC (A); OPC (B)(b)
EUA53-4B(b) 1675.984843.9221.921916.1012.50OPC1:11.5
UNL (2002)UNL3A(b)0.00250.04140.442336.099701.8917.401975.3018.62OPC1:10.2
Notation and remarks: (a) test stopped due to sample breakage; (b) not applicable; (c) layers could not be tested per se, nor partial sets of more than one layer could be tested. Result for the whole set; (1) The bulk density used in the calculation was obtained by dividing the mass of the specimen by the product of the average dimension of width, length and depth; (2) According to [16]; AL—Air lime; GP—Gypsum-air lime-based plaster; OPC—Ordinary Portland cement; PCC—Portland composite cement; WPC—White Portland Cement; b/a—binder to aggregate ratio by mass [hydrated lime (HL)/OPC/aggregate—for air lime with by mixed ordinary Portland cement; HL/aggregate—for air lime mortars; OPC/aggregate and WPC/aggregate—for cement mortars]. Blank fills to non-performed tests.
Table 3. Ranges of values obtained for the assessed physical and mechanical characteristics to be considered in the compatibility requirements.
Type of BinderType of MortarCase StudyQuantitative RangesMortar Mix Design
Physical Characteristics and Water BehaviourMechanical CharacteristicsBinder to Aggregate Ratio
CccD1D2P0UPVEdCS(b/a) (3)
kg.m−2.min−0.5kg.m−2.min−1kg.m−2.min−0.5%m.s−1MPa
gypsum-air limePlasters (w.s.t.l.)CVT (1903)0.16–0.390.0021–0.00240.0066–0.53940.5 (1)2011 (1)4601 (1) n.a.
DN (1940)0.70 (1) 1995 (1)4495 (1) n.a.
Air limePlastersCVT (1903)1.22–1.470.0036 (1)0.0144 (1)30.8 (1)1165 (1)2073 (1)2.6 (1)1:0:4.3–1:0:7.8
AR49 (1923)1.68 (1)0.0129 (1)0.0294 (1)30.8 (1,2)1477 (1,2)3385 (1,2)1.8 (1)1:0:7.9 (1)
DN (1940)0.58 (1) 23.1–26.8 (1)1848–2171 (1)5641–7744 (1) 1:1:6–1:2:15.1
IRF (1938)0.76–1.620.0050–0.00680.1252–0.133031.0–33.0831–1868 (2)1055–5130 (2) 1:0:4.2–1:0:8
CBP (1939)1.25–2.220.0016–0.00330.0892–0.117628.3–29.51208–14192360–30781.3–2.71:0:8.4–1:0:11.2
RendersAR49 (1923)0.69–0.830.0013–0.01160.0225–0.0798 26.9–32.11946 (1,2)4463 (1,2) 1:0:5.8–1:0:11.2
Lime–cementPlastersIRF (1938)0.54–0.630.0016–0.00570.0813–0.129122.7–31.11023–1478 (1,2)1814–3722 (1,2) 2.1–18.41:0.1:7–1:0.4:5.4
RendersAAC (1944)0.35–0.53 0.0027 (1,2)0.0255 (1,2)31.2 (1,2)1198 (1,2)2233 (1,2) 1:0.2:2.7–1:02:6.1
Portland cement (*)PlastersCBP (1939)2.05 (1)0.0041 (1)0.4590 (1)33.17 (1,2)1726 (1,2)4579 (1,2)5.5 (1,2)0:1:20.3 (1,2)
DN (1940)0.22–0.50 17.6–22.21984–23177151–934610.6–33.80:1:4.2–0:1:25.2
EUA (1970)0.64 (1)0.0069 (1)0.0096 (1)20.1–21.91461–16763764–484411.9–12.50:1:6.7–0:1:11.5
UNL (2002)0.44 (1)0.0025 (1)0.0414 (1)17.4 (1)2336 (1)9702 (1)18.6 (1)0:1:10.2 (1)
Plasters (s.i.m.)AAC (1944)0.10–0.140.0008–0.00150.0151–0.0211 1863 (1)6383 (1) 0:1:1.9–0:1:3
Renders (s.i.m.)EUA53 (1970)0.08 (1)0.0013 (1)0.0197 (1)13.2 (1)1581 (1)5050 (1) 0:1:3.7 (1)
Renders AAC (1944)0.19 (1,2)0.0017 (1,2)0.0255 (1,2)14.1 (1,2)2655 (1,2)13370 (1,2)33.8 (1,2)n.a.
LIP (1958)0.11–0.630.0013–0.00200.0252–0.037722.6 (1)1534–22826041–1484216.6 (1)0:1:6.6–0:1:7.6
EUA (1970)0.07 (2)–0.110.0013 (2)–0.00390.0310 (2)–0.041515.2 (1)1917 (1,2)7025 (1,2)28.7 (1)0:1:4.9 (1)
Notation: (1) Range of values not defined because only one sample or specimen was tested; (2) Value obtained in a multi-layer sample set or average value of all sets tested in the same case study. Applicable only when the characteristics of a single layer are not known or when only the sets of layers with the same type of binder were characterised, disregarding the white smooth thin plaster and stone-imitating mortar layers (in this case the layer A from the set AAC2AB); (3) according to [16]; (*) encompasses all types of Portland cement; b/a—binder to aggregate ratio by mass [hydrated lime: Portland cement (regardless the type): aggregate]; n.a.—not applicable.; w.s.t.l.—white smooth thin layers; s.i.m.—stone-imitating mortar. Blank fills to non-determined characteristics.
Disclaimer/Publisher’s Note: The statements, opinions and data contained in all publications are solely those of the individual author(s) and contributor(s) and not of MDPI and/or the editor(s). MDPI and/or the editor(s) disclaim responsibility for any injury to people or property resulting from any ideas, methods, instructions or products referred to in the content.

