Article

Experimental Study of Indoor Air Distribution and Thermal Environment in a Ceiling Cooling Room with Mixing Ventilation, Underfloor Air Distribution and Stratum Ventilation

1
School of Civil Engineering, Dalian University of Technology, Dalian 116024, China
2
China Northwest Architecture Design and Research Institute Co., Ltd., Xi’an 710016, China
3
School of Architecture Engineering, Dalian University, Dalian 116024, China
4
School of Architecture and Planning, Hunan University, Changsha 410012, China
*
Author to whom correspondence should be addressed.
Buildings 2023, 13(9), 2354; https://doi.org/10.3390/buildings13092354
Submission received: 7 August 2023 / Revised: 9 September 2023 / Accepted: 14 September 2023 / Published: 15 September 2023
(This article belongs to the Special Issue Radiant Cooling and Heating Systems in Buildings)

Abstract

:
A ceiling cooling system integrated with a mechanical ventilation system has been widely used in modern buildings with large sensible cooling loads due to the high thermal comfort level and large energy efficiency. However, there is a lack of systematic research on the influence factors such as ceiling surface temperature and cooling load on the indoor air distribution and thermal environment, and the impact of ventilation system type in the ceiling cooling room is still unclear. Therefore, this paper presented an experimental study of indoor air distribution and thermal environment in a ceiling cooling (CC) room with mixing ventilation (MV), underfloor air distribution (UFAD) and stratum ventilation (SV); the ceiling surface temperature was 17 °C–26 °C and the internal or external cooling load was 41.5 W/m2–69.5 W/m2. The results showed that the vertical air temperature difference and contaminant removal effectiveness were 0.2 °C–0.4 °C and 0.53–0.85 with CC + MV, 0 °C–1.2 °C and 0.68–1.25 with CC + UFAD and 0.3 °C–0.9 °C and 0.50–0.83 with CC + SV, and the corresponding heat removal effectiveness and air diffusion performance index were 0.96–1.11 and 96–100%, 0.9–1.5 and 57–100% and 1.11–1.34 and 71–100%, respectively. Moreover, the difference between mean radiant temperature and air temperature and the predicted mean vote of thermal sensation were from 0 °C to 0.9 °C and between 0 and 0.26 with CC + MV, from −0.1 °C to 2.2 °C and between −0.1 and 0.42 with CC + UFAD and from −0.1 °C to 0.9 °C and between −0.2 and 0.13 with CC + SV. Hence, the ventilation system type clearly affected the indoor air distribution and thermal environment in the ceiling cooling room, and the experimental results would be beneficial for the design and control of a ceiling cooling system combined with a mechanical ventilation system in practice.

1. Introduction

In the 21st century, the world’s new building area and energy demand increased dramatically with continuous socioeconomic development. The energy consumption of buildings, in which the percentage of HVAC energy consumption was more than 50%, was huge and accounted for 20–40% of the total energy consumption of society [1,2]. Therefore, how to improve the energy efficiency of HVAC systems has become a hot research topic of scholars over the world [3,4,5]. At present, a radiant cooling system combined with a mechanical ventilation system has been widely used in various residential and non-residential buildings [6,7]. Compared to the traditional air conditioning system, the radiant cooling system can more effectively deal with the external sensible cooling load by using the higher temperature cold source and avoiding the cold air draft [8,9,10], so it can meet the requirements of high thermal comfort level and large energy efficiency [11,12]. In addition, a radiant cooling system combined with a mechanical ventilation system can also effectively avoid the shortcomings of traditional air-conditioning systems, such as bacterial growth and loud noise [13,14,15,16]. Normally, the radiant cooling system is divided into three types according to the installation location: ceiling cooling (CC), floor cooling (FC) and wall cooling (WC) [17,18,19]. The cooling capacity per unit area of CC is up to 100 W/m2, which is more suitable for modern buildings with large, sensible cooling loads compared to FC and WC [20,21,22,23,24]. Therefore, a CC system combined with a mechanical ventilation system has been the main research direction in the radiant cooling field.
Generally, the mechanical ventilation system includes mixing ventilation (MV), displacement ventilation (DV), underfloor air distribution (UFAD), stratum ventilation (SV) and diffuser ceiling ventilation (DCV) [25,26]. The MV dilutes the concentration of indoor pollutants and distributes the temperature uniformly by intensively mixing supply air with indoor air [27]. The UFAD is similar to DV, and they use the principle of density to supply air at the lower part of the room for air exchange [28]. Because UFAD diffusers produce more mixing than the standard DV diffusers, it allows a larger temperature difference between the supply air and the indoor air [29]. The SV delivers cool air to the occupied space through the supply terminal on the side walls about 1.2 m above the floor, and the supplied air directly enters the breathing area of a person [30]. The DCV supplies air to the occupied space at a very low speed through large air supply openings in the ceiling and results in complete air mixing [31].
Until now, many experts have conducted a lot of research on the CC system combined with a mechanical ventilation system [32,33,34]. Zhao et al. [35] found that a further introduction of DCV in a ceiling-cooling micro-environment combined with personalized ventilation could provide both low draught risk and great air quality to occupants. Zhang et al. [36] showed that the MV system intergraded with the ceiling cooling system tended to create a uniform temperature field in the room and that the cooling capacity of CC did not show a significant effect on the temperature gradient. Mustakallio et al. [37] investigated the office thermal environment of CC + MV under different heat source layouts, and it indicated that the load level and distributions had little effect on the indoor air temperature and velocity of CC + MV. Wu et al., experimentally studied indoor air distribution characteristics in a room with CC + MV; they found that the CC surface temperature slightly affected the vertical air temperature difference [38], and the effect of the cooling load on the turbulence intensity was not obvious [39]. Rees et al. [40] conducted experiments in a DV room with CC, and they found that the absolute value of the vertical temperature gradient decreased as the ceiling temperature decreased while other boundary conditions were kept constant. Niu et al. [41] also investigated the CC + DV system by simulation, and they concluded that the CC surface temperature had a significant impact on the indoor contaminant concentration distribution, and the CC + DV gave a good performance in thermal comfort and ventilation effectiveness. Gao et al. [42,43] interestingly found that the maximum turbulence intensity coincided with the minimum contaminant removal effectiveness in a room with CC + UFAD under the condition of a constant sensible cooling load, and the maximum heat removal effectiveness corresponded with the minimum air diffusion performance index. Jeong et al. [44] derived a simplified correlation for the mixed convection heat transfer coefficient for CC, which can easily be adopted in the cooling capacity estimation, and their research found that the total cooling capacity of CC can be enhanced by 5% to 35% in the room with MV. Loveday et al. [45] demonstrated that sinking airflow from the CC in the room with DV inhibited upward buoyant flow, which led to a deterioration in ventilation efficiency. Corgnati et al. [46] found that the installed CC in the mixing ventilation room reduced the risk of cold jets entering the occupied area and thus reduced the draught risk. Lipczynska et al. [15] came to the same conclusion as Corgnati by examining the performance of single MV and CC + MV in terms of the draught risk after removing similar cooling loads. Zhang et al. [47] found that the dissatisfied percentage decreased from 5.86% to 0.01% after the DCV was integrated with the radiant ceiling system, which significantly reduced the thermal discomfort of the room.
Stimulatingly, some scholars evaluated and compared the performance of radiant cooling systems combined with different types of ventilation systems. Behne et al. [48] experimentally measured the concentration of tracer gas that characterized air quality in the occupied area and found that CC + MV had a more uniform contaminant distribution than CC + DV, but CC + DV could provide lower levels of contaminant in the occupied zone. Schiavon et al. [49] developed a model to predict the temperature difference between the head and ankle for the CC + DV, and they also found that CC + DV can provide more stable thermal stratification and higher ventilation efficiency than CC + MV. Wu et al. [50] measured and evaluated the indoor thermal comfort and human thermal comfort in a CC room with MV or UFAD, and they proposed that the ventilation system type had a slight impact on the human thermal sensation in the room with CC and the CC + UFAD had higher thermal sensation votes than CC + MV. Zhu et al. [51] conducted a numerical simulation to study the indoor thermal comfort in the CC room with a new type of ventilation system and found that it could ensure good air quality and have higher comfort and energy saving than that with CC + DV. Zhang et al. [52] verified that CC + UFAD presented a similar indoor environment to CC + DV, but the ventilation efficiency was slightly lower compared to CC + DV but still higher than CC + MV due to higher flow rates in the floor diffusers, which increased the local mixing levels. Moreover, Liu et al. [53] evaluated the thermal comfort performance of FC combined with MV, SV, DV and ductless personalized ventilation (DPV) through numerical simulations, and the results showed that FC + MV and FC + SV could provide better acceptable thermal comfort environments, and especially could maintain the small vertical air temperature differences.
Obviously, the design and control of the integrated system are much more complicated than the single system due to the interactions of two sub systems, which may result in poor air quality and thermal discomfort if the integrated system is not designed properly. Although more and more scholars have studied radiant cooling combined with mechanical ventilation, most of the current research still focuses on traditional MV and DV systems and rarely considers the SV system. The application effect of the integration of stratum ventilation with radiant cooling was still unclear and needed further research. Furthermore, our previous studies [42,43] interestingly found that the maximum heat removal effectiveness coincided with the minimum air diffusion performance index for CC + UFAD, and this phenomenon may also happen for the CC + SV. Therefore, we carried out a full-size experimental study on the effect of ceiling surface temperature and cooling load on indoor air distribution and thermal environment characteristics in a room with CC + MV, CC + UFAD and CC + SV and further conducted a more comprehensive and systematic analysis and discussion of the performance of the three integrated systems. The experimental results may be beneficial for the design and control of a ceiling cooling system combined with a mechanical ventilation system in practice.

2. Experimental Method

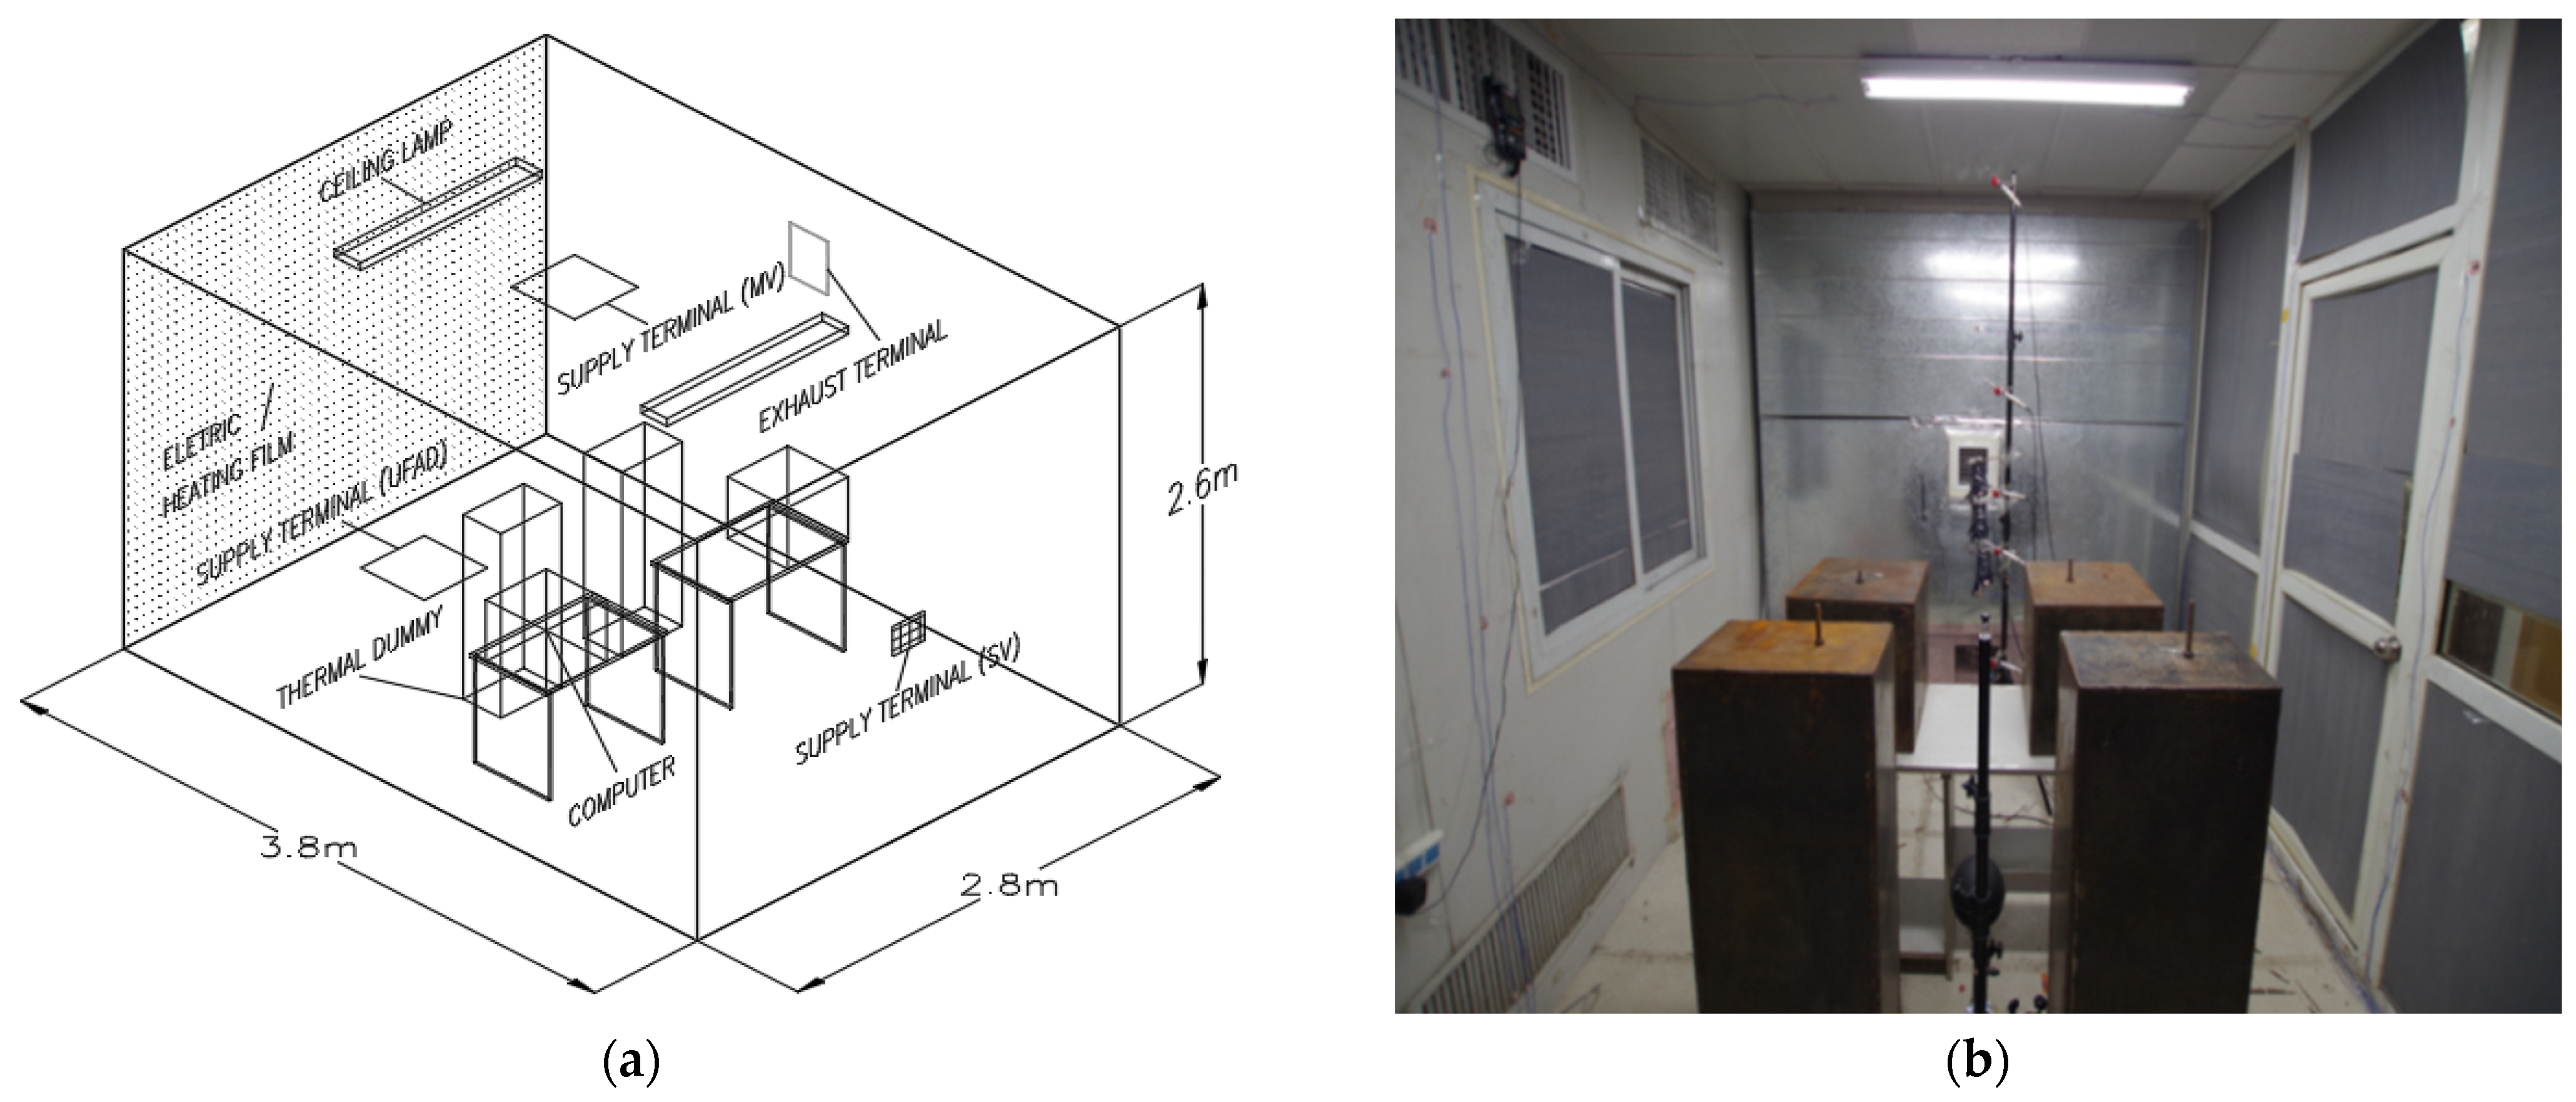
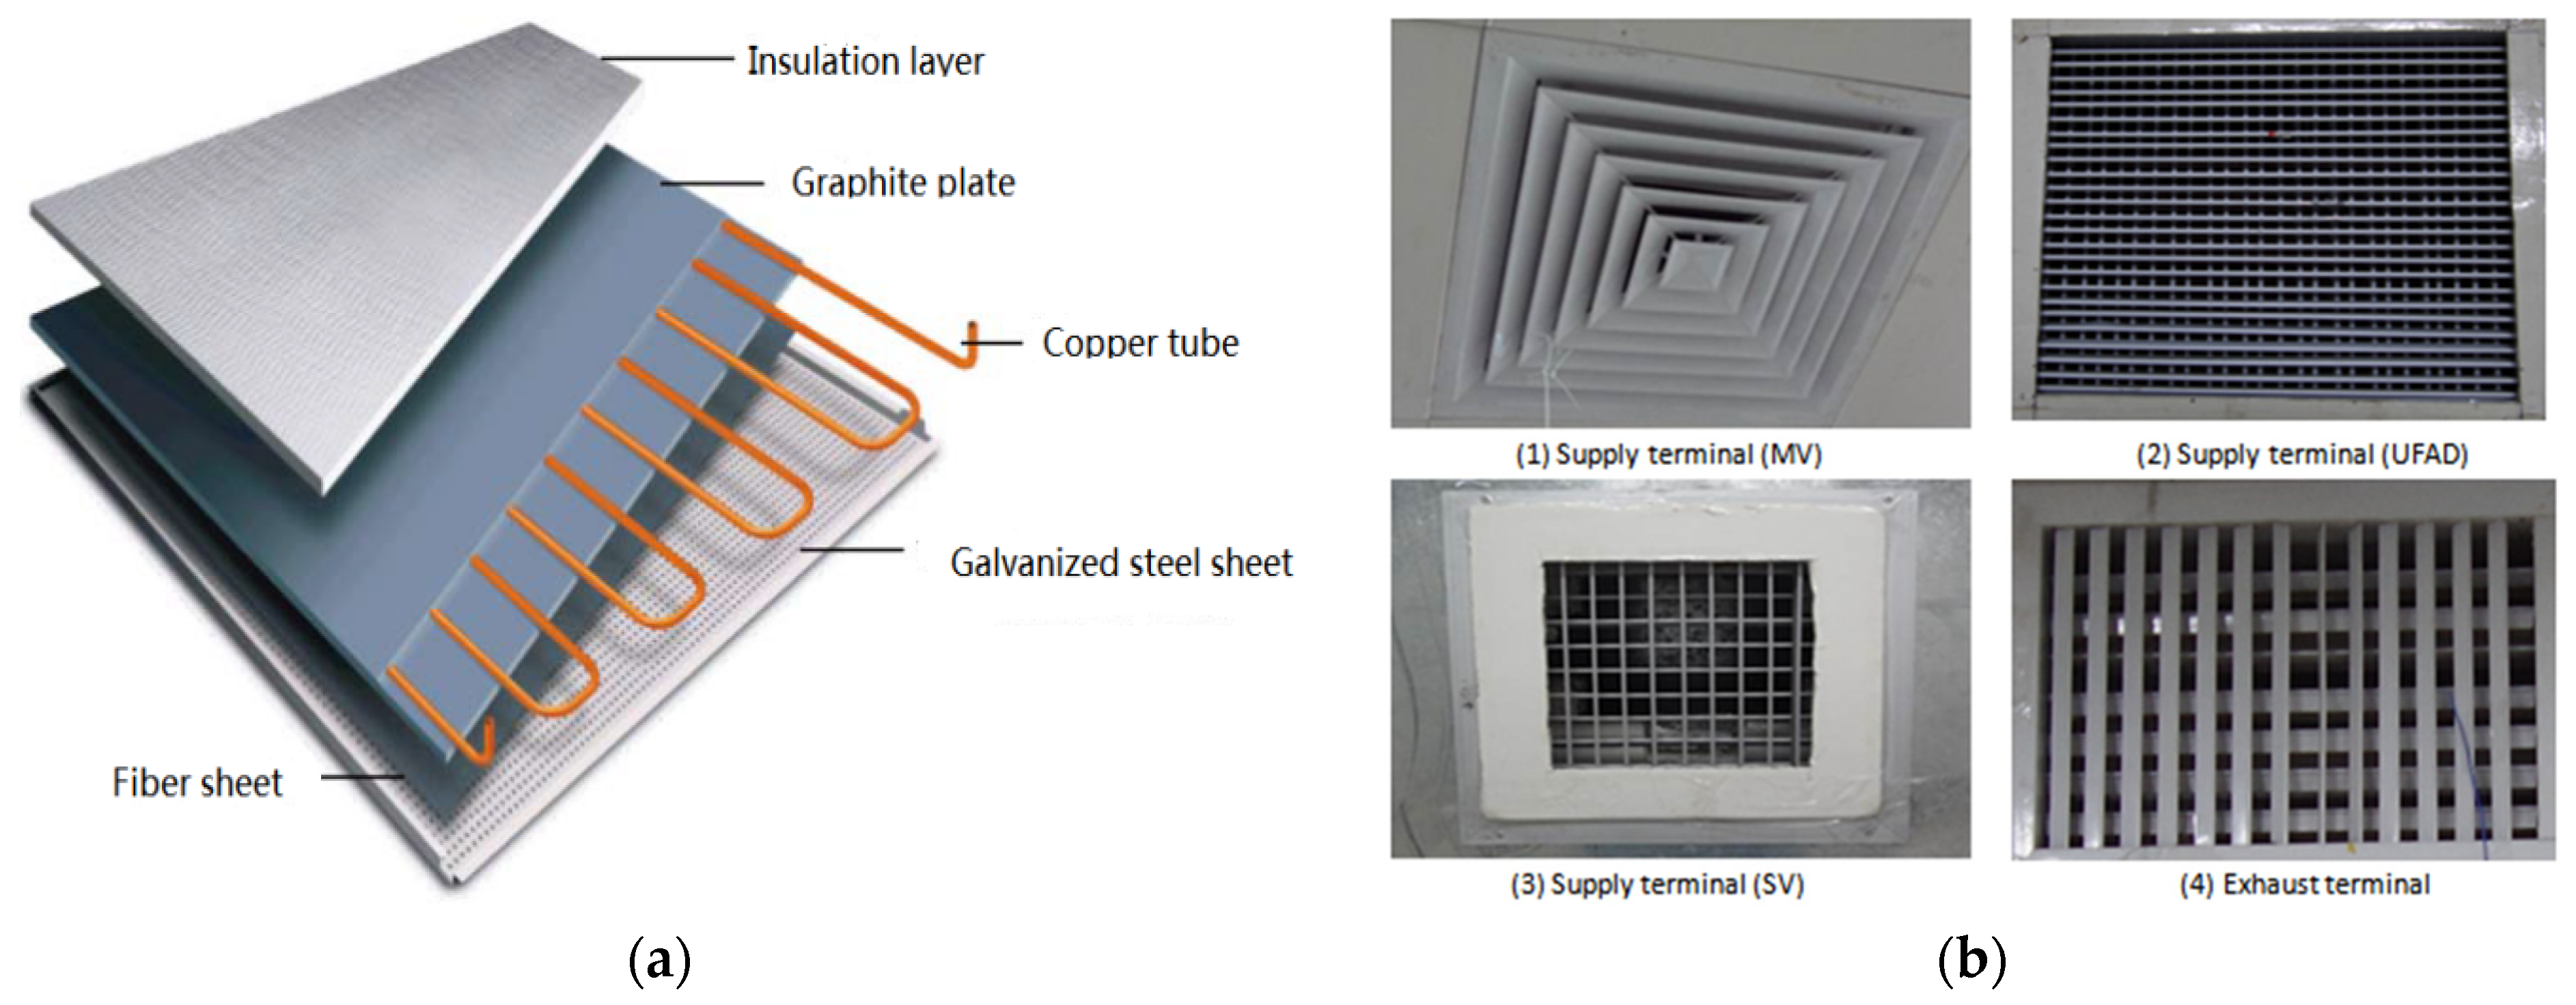
2.1. Test Room and Systems

The test room was located in Xi’an city in China, which belonged to the temperate humid climate zone. The dimensions of the test room shown in Figure 1a were 3.7 m in length, 2.8 m in width and 2.6 m in height. Three walls of the room were composed of 75 mm thick colored steel composite panels with a sandwich of foam insulation material, one of which had a 1.2 m × 1.2 m double-layer plastic steel glass window. The other wall and the door on it consisted almost entirely of double-layer plastic steel glass, and the surface of double-layer plastic steel glass was covered with a layer of 6 mm thick insulation material. The total heat transfer coefficients of colored steel composite panels and double-layer plastic steel glass were approximately 1.2 W/(m2·K) and 2.5 W/(m2·K), respectively. The experiment simulated the internal cooling load and external cooling load of a typical office with computers, thermal dummies, ceiling lamps and an electric heating film, and the power of these heat sources was adjustable, as shown in Table 1.
The chamber was equipped with a ceiling cooling (CC) system and three mechanical ventilation systems, including a mixing ventilation (MV) system, an underfloor air distribution (UFAD) system and a stratum ventilation (SV) system, which can be switched between the different system types by opening or closing the supply terminals. The 11 metal radiant panels with dimensions of 600 mm × 1200 mm formed the CC system, with a coverage of about 76% on the ceiling. The metal radiant panel used consisted of a galvanized steel plate, a fiber plate, a copper tube, a graphite plate and an insulating layer, which can be seen in Figure 2a. Typical air diffusers with dimensions of 600 mm × 600 mm, 250 mm × 250 mm and 180 mm × 180 mm were used as supply terminals for the MV, UFAD and SV systems, respectively. Moreover, the exhaust terminal used a double shutter with dimensions of 840 mm × 240 mm for the three ventilation systems.

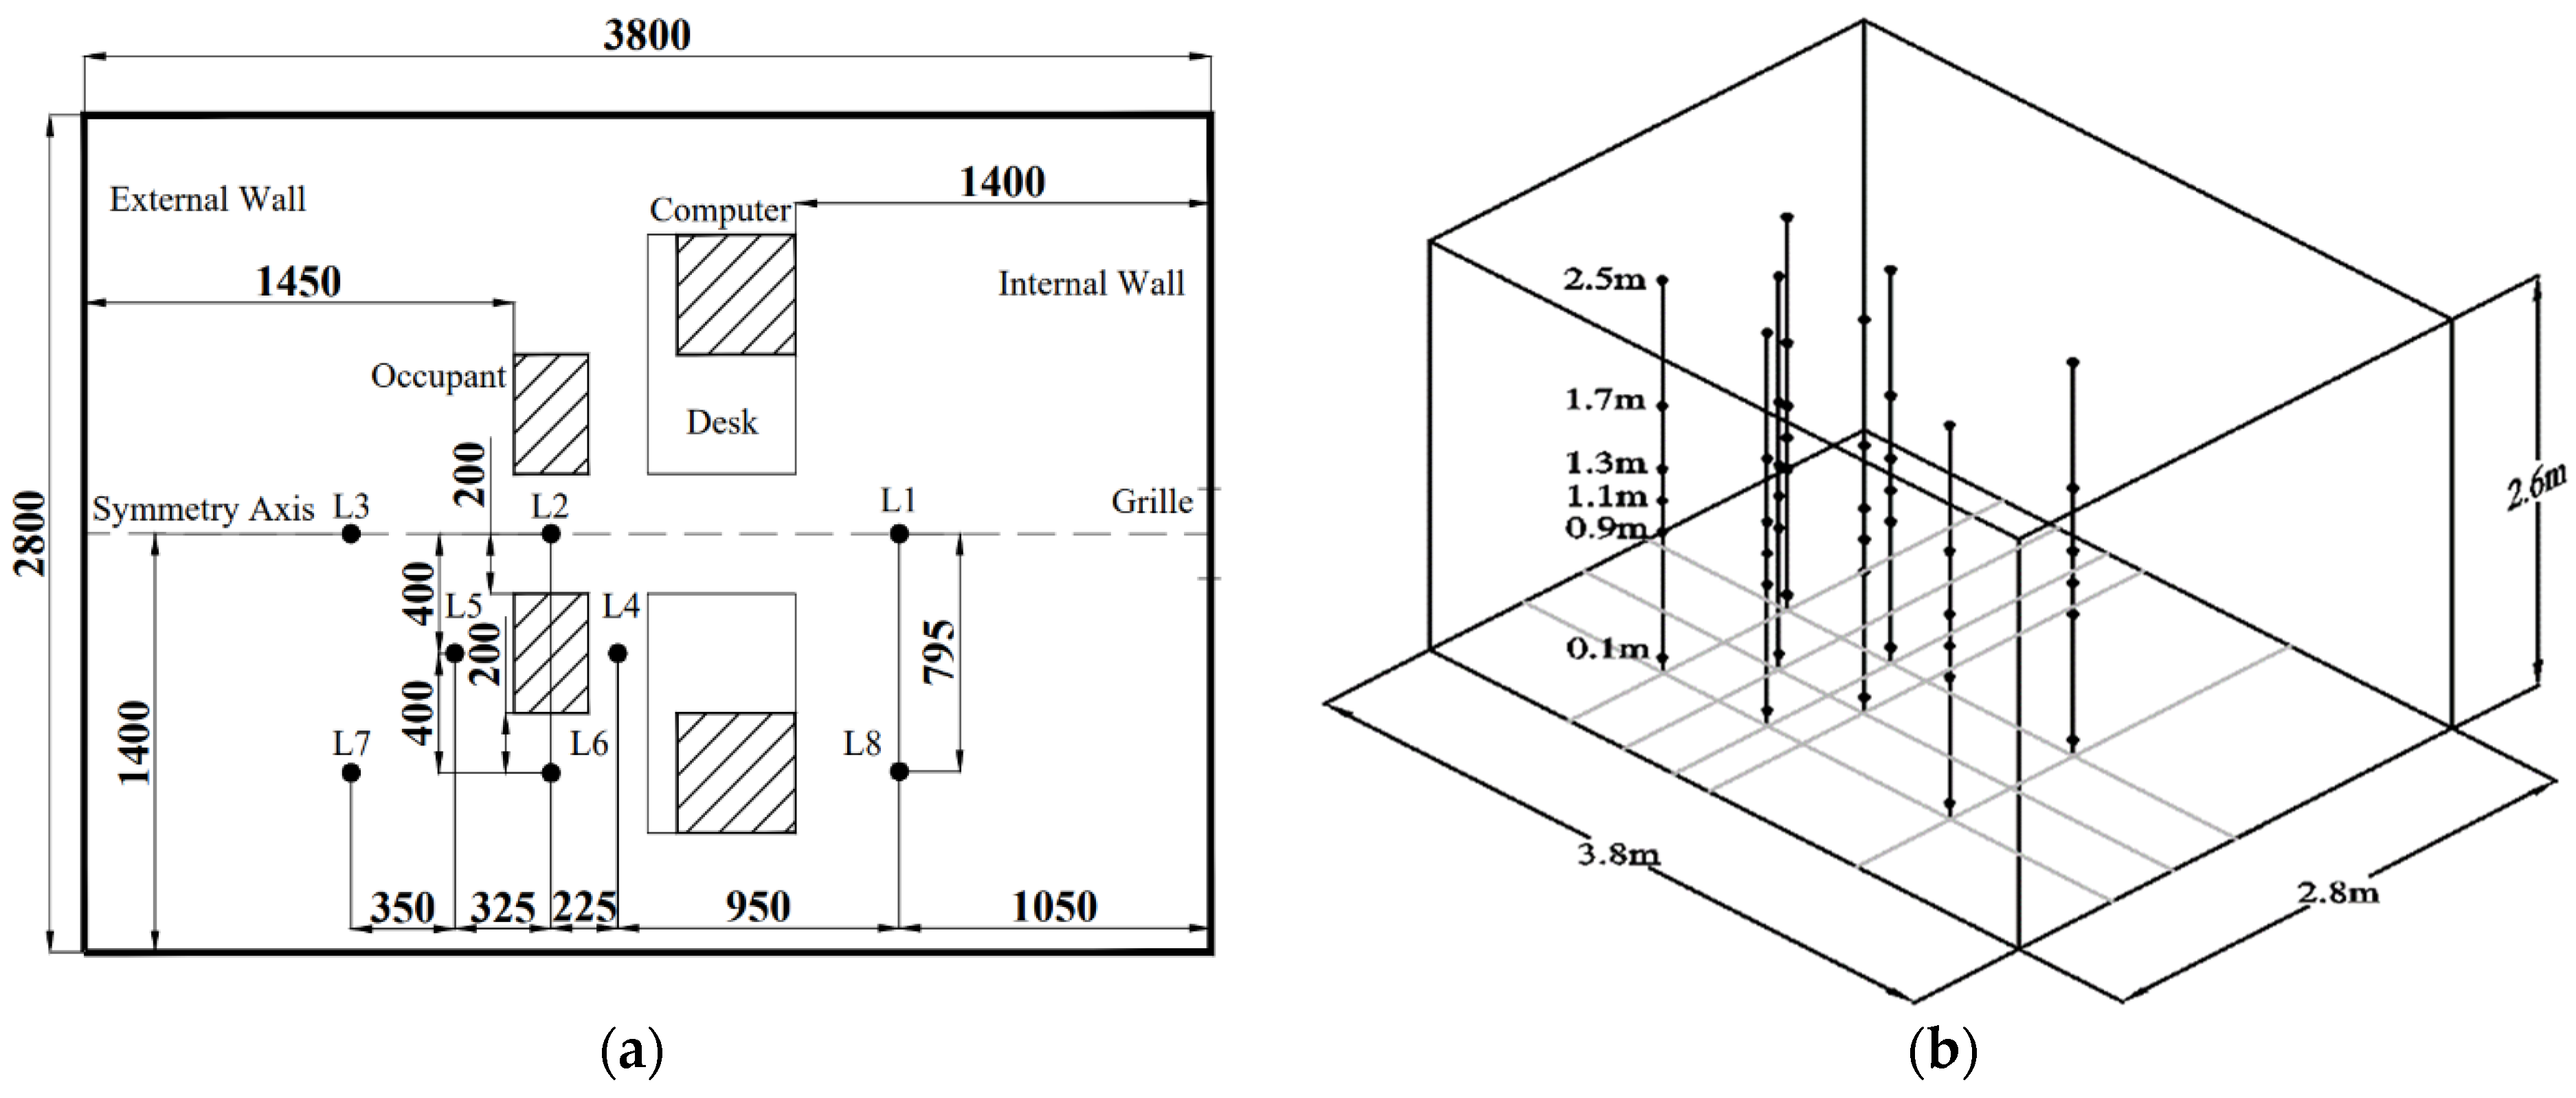
2.2. Measuring Instruments and Test Conditions

The experiment was conducted using Swema 03 unidirectional hot-wire anemometers (accuracy: ±0.1 °C and ±0.04 m/s) to measure air temperature and velocity and the TES 1370 non-dispersive infrared radiation system (accuracy: ±5% ppm or 3% of reading) to measure CO2 concentration. The measuring lines can be seen in Figure 3, where the heights were 0.1 m, 0.6 m, 1.1 m, 1.3 m, 1.7 m and 2.5 m for measuring air temperature and velocity, and 0.9 m, 1.1 m and 1.3 m for measuring CO2 concentration in the breathing zone. The wall surface temperatures were measured by the uniform arrangement of four K-type thermocouples (accuracy: ±0.1 °C) on the external wall and ceiling and two thermocouples on the internal wall and floor, which were collected by AT4320. Furthermore, an 8 mm diameter hole was drilled in front of each dummy at a height of 1.1 m to release CO2 at a rate of 320 mL/min. The specifications of the measuring instruments are shown in Table 2.
It had been found that the cooling load eliminated by a chilled ceiling or the ceiling surface temperature was a key parameter during the design of a ceiling cooling system combined with a mechanical ventilation system [54]. In addition, the effects of internal and external cooling loads caused by the internal heat sources and heat transfer from the external envelope were clearly different on indoor air distribution and thermal environment [43]. Hence, ceiling surface temperature, as well as internal and external cooling load, were selected as the main design parameters in this experiment. Moreover, the indoor reference air temperature (at the height of 0.6 m) was controlled at 26.0 °C by adjusting the supply air temperature and flow rate, which were 16.0 °C–22.0 °C and 5.2 h−1–9.4 h−1 for MV, 18.0 °C–24.0 °C and 7.4 h−1–19.2 h−1 for UFAD and 20.0 °C–25.0 °C and 3.9 h−1–11.4 h−1 for SV. The specific set parameters for all the experimental cases are given in Table 3.

2.3. Evaluation Indices

(1)
Indoor air distribution
Good indoor air distribution is demonstrated by the fact that the air temperature difference in the vertical direction will not be too large, the airflow rate will be kept within a reasonable range, and the waste heat and pollutants generated indoors can be effectively eliminated. Therefore, the vertical air temperature difference [55], turbulence intensity [56], contaminant removal effectiveness [57] and heat removal effectiveness [56] were selected to evaluate the indoor air distribution characteristics and the air diffusion performance index [58] was selected to investigate the proportion of temperature and velocity measuring points that meet the requirements. These evaluation indices can be seen in Equations (1)–(6).
V A T D = t a 1.1 t a 0.1
where VATD is the vertical air temperature difference, t a 1.1 is the air temperature at the height of 1.1 m and t a 0.1 is the air temperature at 0.1 m.
T u = S D v v a ¯ × 100 %
where Tu is the turbulence intensity, S D v is the standard deviation of air velocity at 1.1 m and v a ¯ is the average air velocity at 1.1 m.
C R E = c e c s c p c s
where CRE is the contaminant removal effectiveness, cp is the average pollutant concentration, ce is the pollutant concentration of exhaust air and cs is the pollutant concentration of supply air.
H R E = t e t s t ¯ a t s
where HRE is the heat removal effectiveness, t ¯ a is the average air temperature in the occupied zone, te is the exhaust air temperature and ts is the supply air temperature.
A D P I = N u m b e r ( 1.7 < E D T < 1.1 ) T o t a l   n u m b e r
E D T = ( t a t ¯ a ) 8.0 ( v a 0.15 )
where ADPI is the air diffusion performance index, ta and va are spatial air temperature and velocity in the occupied zone.
(2)
Indoor thermal environment
The predicted mean vote of thermal sensation (PMV) and predicted percentage dissatisfied (PPD) developed by Fanger are objective evaluations of the whole thermal sensation of the human body, and the draught (DR) near the neck can further evaluate the local thermal discomfort of the human body. Therefore, the whole thermal comfort indices PMV [10] and PPD [10] and local thermal discomfort index DR [59] were used to evaluate the indoor thermal environment, and these evaluation indices could be seen in Equations (7)–(10).
PMV = [ 0.303 exp ( 0.036 M ) + 0.0275 ] × { H 3.054 × [ 5.765 0.007 H P a ] 0.42 ( H 58.15 ) 1.73 × 10 2 M ( 5.867 P a ) 0.0014 M ( 34 t a ¯ ) 3.9 × 10 8 f c l [ ( t c l ) 4 ( t r ) 4 ] f c l h c ( t c l t a ¯ ) }
PPD = 100 95 exp [ ( 0.03353 P M V 4 + 0.2179 P M V 2 ) ]
where PMV is the predicted mean vote of thermal sensation, PPD is the predicted percentage dissatisfied, M is the metabolic rate, H is the net gain of heat, pa is the water vapor pressure in the environment air, t c l is the surface temperature of the clothing, I c l is the clothing insulation and f c l is the clothing surface area factor.
t r = t 1 + 273 4 F p 1 + t 2 + 273 4 F p 2 + t N + 273 4 F p N 4 273
where tr is the mean radiant temperature, tN is the surface temperature of surface N, Fp-N is the angle factor between a person and surface N.
D R = ( 34 t a ) ( v a ¯ 0.05 ) 0.62 ( 0.37 v a ¯ T u + 3.14 )
where DR is the draught risk.

3. Results

In this study, indoor air temperature and air velocity, as well as CO2 concentration and wall surface temperature, were measured when the ceiling surface temperature was increased from 17 °C to 26 °C, and the internal or external cooling load was increased from 41.5 W/m2 to 69.5 W/m2. The vertical air temperature difference, turbulence intensity, contaminant removal effectiveness, and mean radiant temperature were used to evaluate the air distribution and thermal environment.

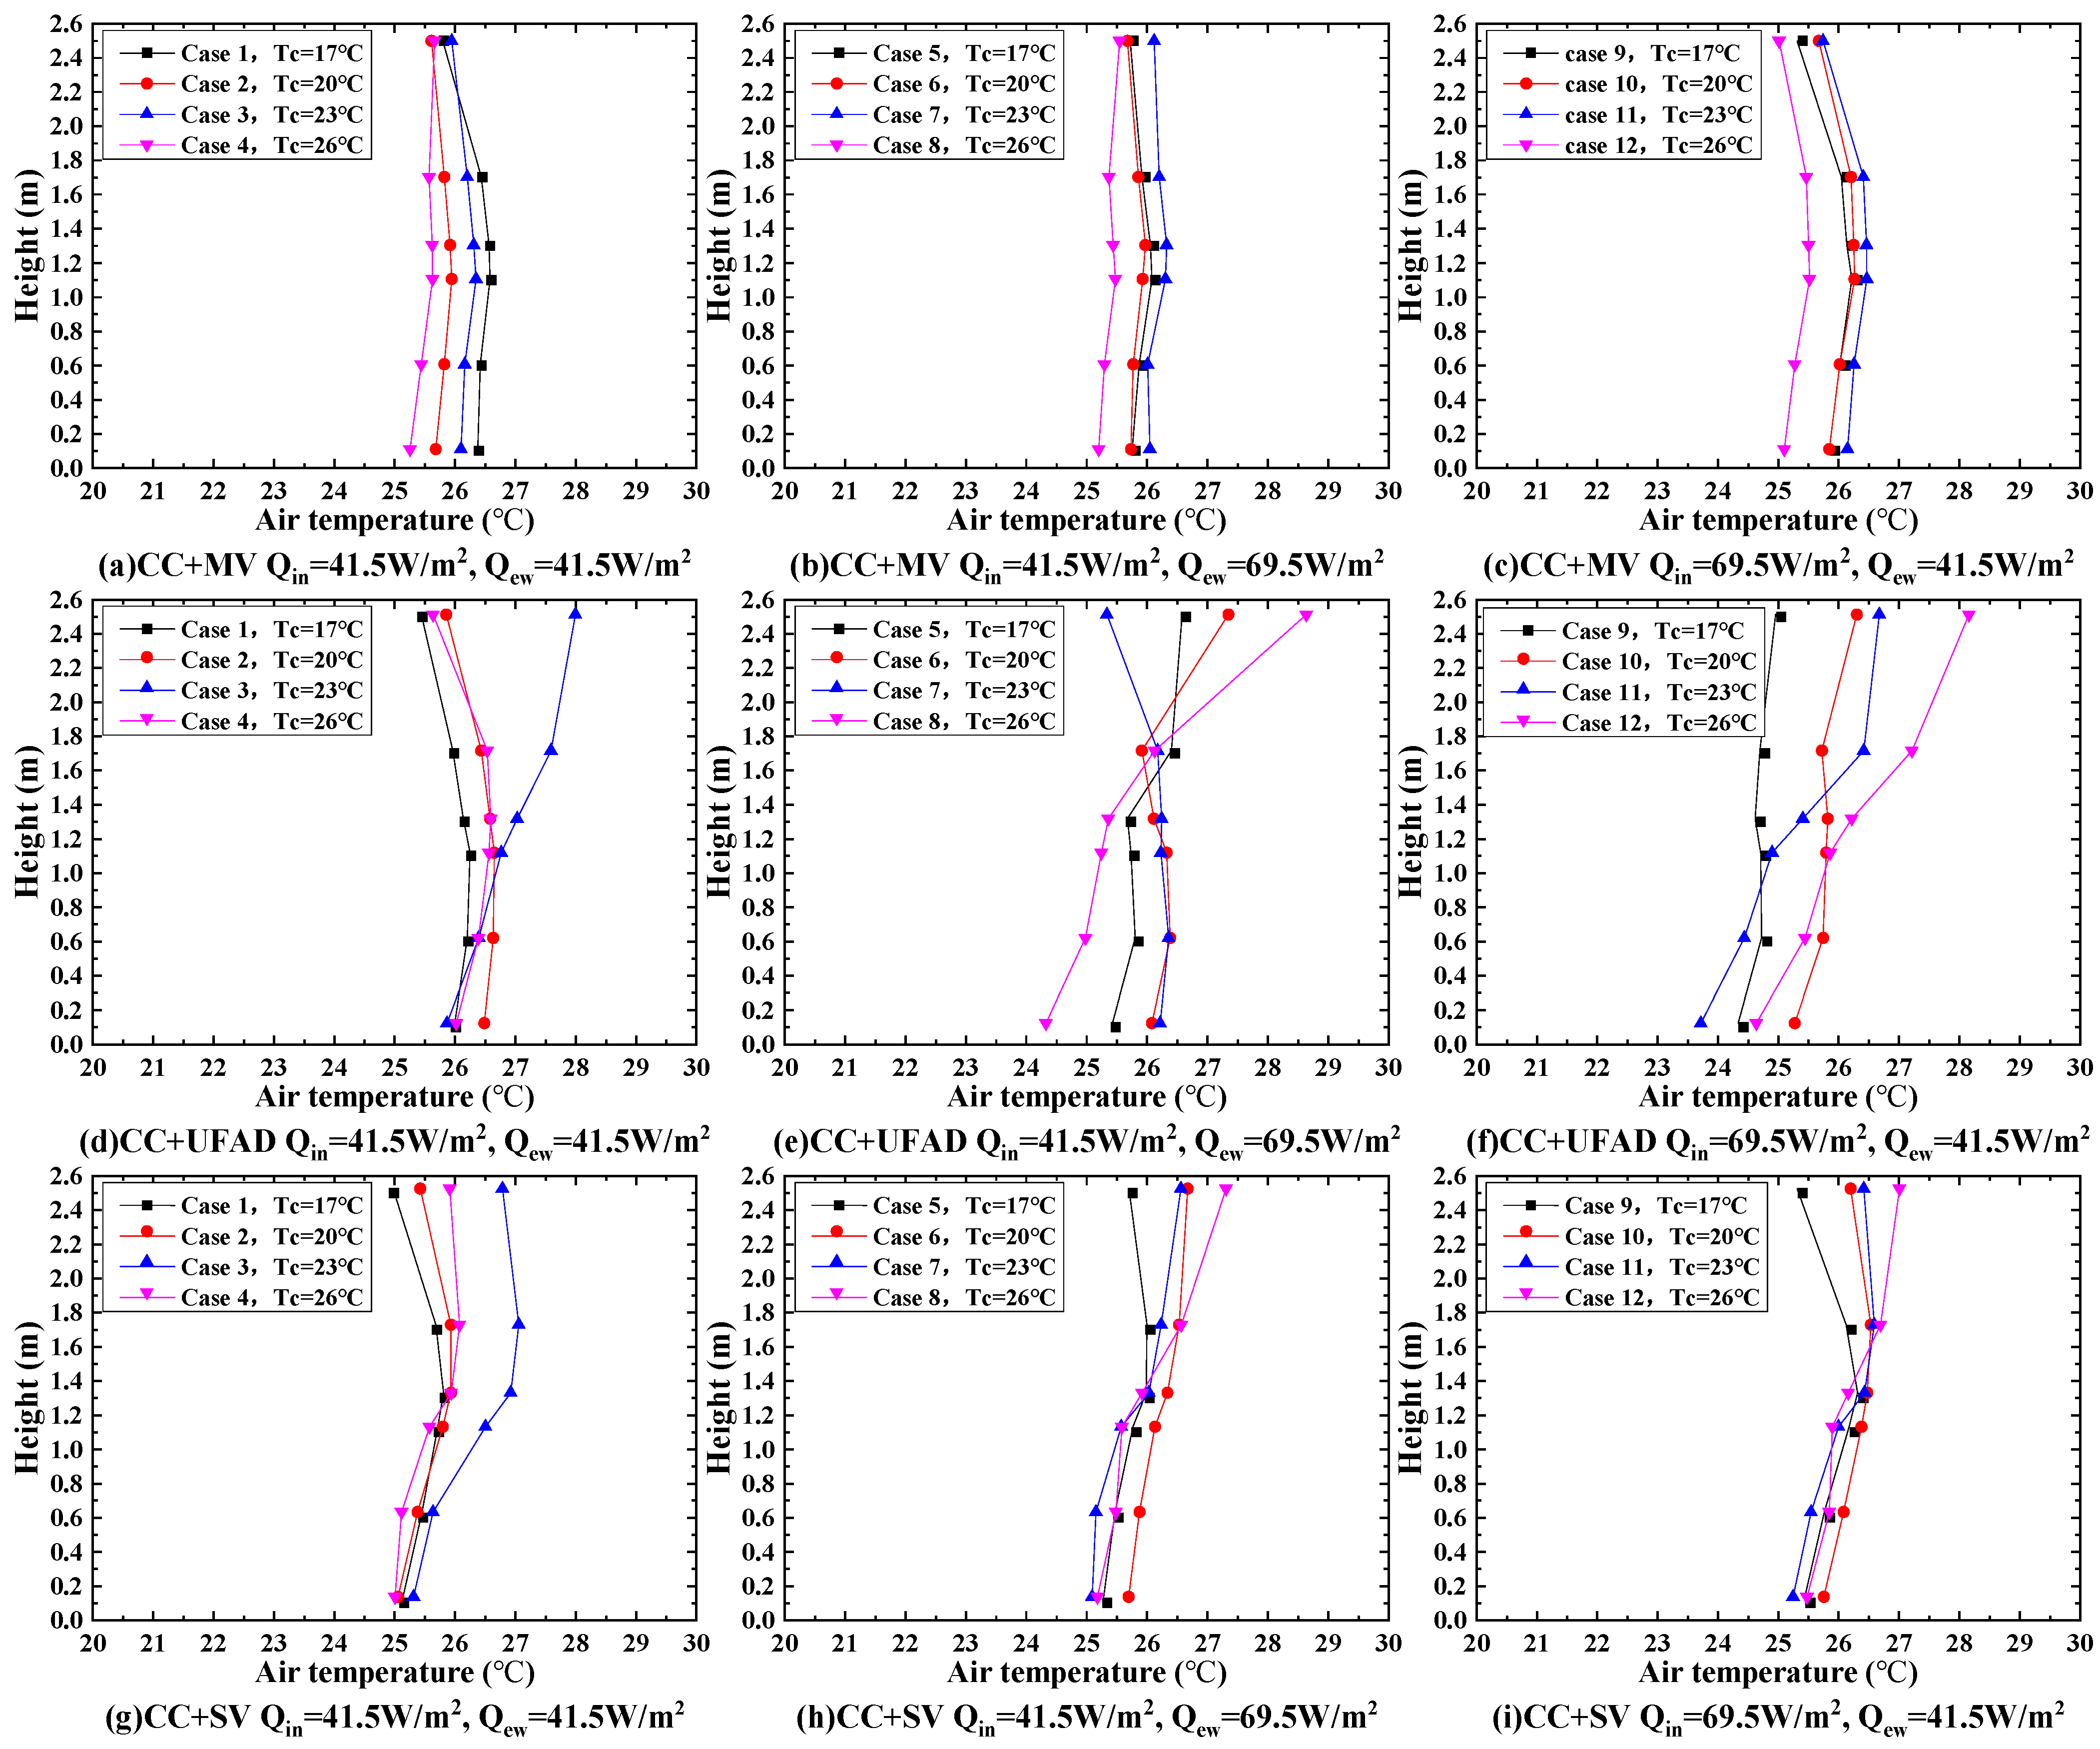
3.1. Indoor Air Temperature Profiles

Vertical distributions of indoor air temperature with different ventilation system types can be seen in Figure 4.
Figure 4a–c shows that the vertical air temperature profiles with CC + MV were nearly not influenced by the ceiling surface temperature as the ceiling surface temperature was increased from 17 °C to 26 °C under the condition of a constant cooling load. The vertical distributions of indoor air temperature were relatively uniform in Cases 5–8 as the external cooling load increased from 41.5 W/m2 to 69.5 W/m2, whereas the vertical air temperature gradients above 1.3 m were clearly negative in Cases 9–12 as the internal cooling load increased from 41.5 W/m2 to 69.5 W/m2.
As shown in Figure 4d–f, the vertical air temperature profiles with CC + UFAD were greatly influenced by the ceiling surface temperature with different internal or external cooling loads, and the vertical distributions of indoor air temperature below 1.3 m were relatively uniform. However, the vertical air temperature gradient above 1.3 m was clearly negative or positive as the ceiling surface temperature increased from 17 °C to 26 °C and the internal or external cooling load increased from 41.5 W/m2 to 69.5 W/m2.
Figure 4g–i shows that the vertical distributions of indoor air temperature above 1.3 m with CC + SV were slightly influenced by the ceiling surface temperature with different internal or external cooling loads, and the vertical air temperature gradient changed from negative to positive as the ceiling surface temperature increased from 17 °C to 26 °C. Moreover, the vertical distributions of indoor air temperature below 1.3 m were nearly not influenced by the ceiling surface temperature under the condition of a constant cooling load, and the vertical air temperature gradients below 1.3 m were positive for all cases.
The calculation results of local vertical air temperature differences with different measuring lines for all cases are shown in Table 4.
For the CC + MV, the mean vertical air temperature differences were 0.2 °C–0.4 °C in Cases 1–4, 0.2 °C–0.3 °C in Cases 5–8 and 0.3 °C–0.4 °C in Cases 9–12 when ceiling surface temperature was increased from 17 °C to 26 °C with different internal or external cooling load. Therefore, the vertical air temperature difference in the room with CC + MV was nearly not influenced by the ceiling surface temperature and cooling load. Moreover, Wu et al., tested the mean vertical air temperature difference in the range of 0.2 °C–0.6 °C when the ceiling surface temperature was increased from 15 °C to 23 °C and also came to the similar conclusion that the ceiling surface temperature had only a slight effect on the vertical air temperature difference in the room with CC + MV [39]. The results of the vertical air temperature difference in the room with CC + MV measured by Lipczynska [15] were also similar to those in this paper, ranging from 0 °C to 0.3 °C, which were all less than 0.5 °C.
For the CC + UFAD, the mean vertical air temperature difference was 0.2 °C–0.9 °C in Cases 1–4 as the ceiling surface temperature increased from 17 °C to 26 °C, so the ceiling surface temperature greatly affected the vertical air temperature difference. Furthermore, the mean vertical air temperature differences were 0.0 °C–0.9 °C in Cases 5–8 with increased external cooling load and 0.4 °C–1.2 °C in Cases 9–12 with increased internal cooling load. Hence, the vertical air temperature difference clearly increased with the increase in internal cooling load in the room with CC + UFAD, while the external cooling load had nearly no impact on the vertical air temperature difference. In addition, the study of Wu found that the mean vertical air temperature difference increased with the increase in ceiling surface temperature under the conditions when the internal cooling load was higher than the external cooling load, which was also in agreement with the result obtained in this paper [43].
For the CC + SV, the mean vertical air temperature difference was 0.6 °C–0.9 °C in Cases 1–4 as the ceiling surface temperature increased from 17 °C to 26 °C, so the ceiling surface temperature slightly affected the vertical air temperature difference. Moreover, the mean vertical air temperature differences were 0.4 °C–0.5 °C in Cases 5–8 with increased external cooling load and 0.3 °C–0.6 °C in Cases 9–12 with increased internal cooling load. Therefore, the vertical air temperature difference slightly decreased with the increase in the internal or external cooling load in the room with CC + SV. Tian et al. [60] tested the vertical air temperature difference in a room with an SV system and found it was −0.7 °C to 0.3 °C, which was also between the tested results in a room with the MV and DV system.

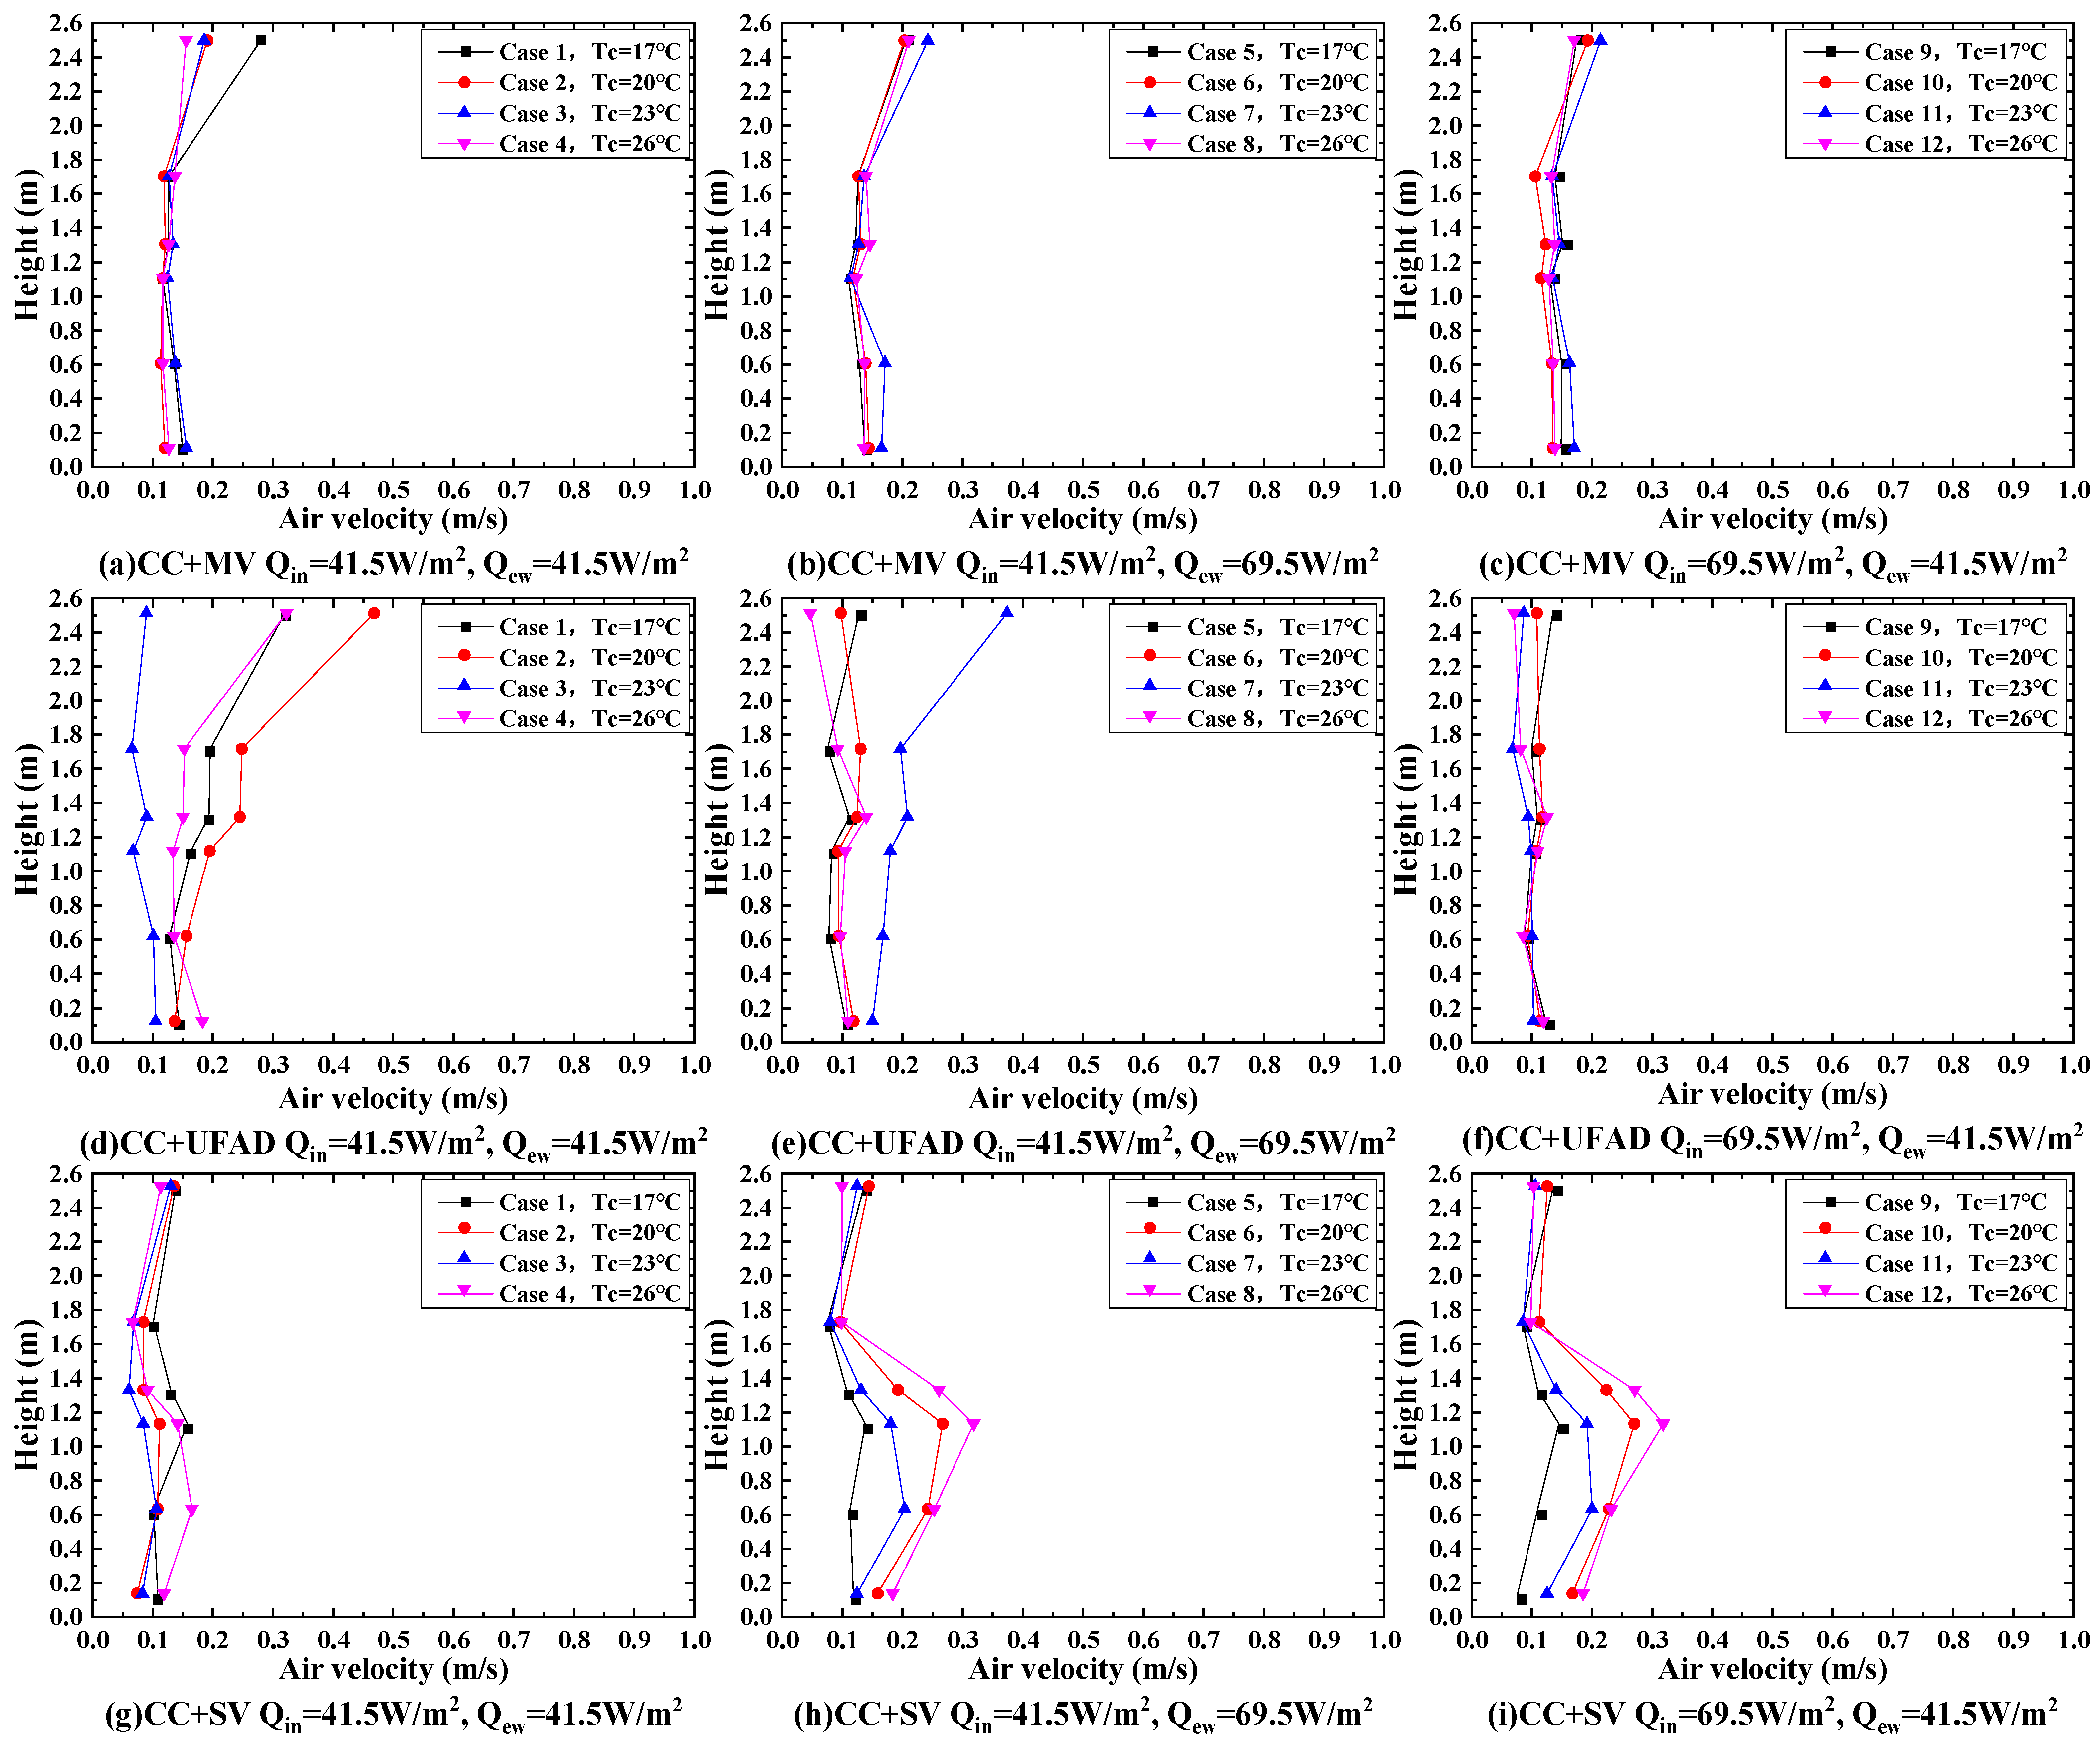
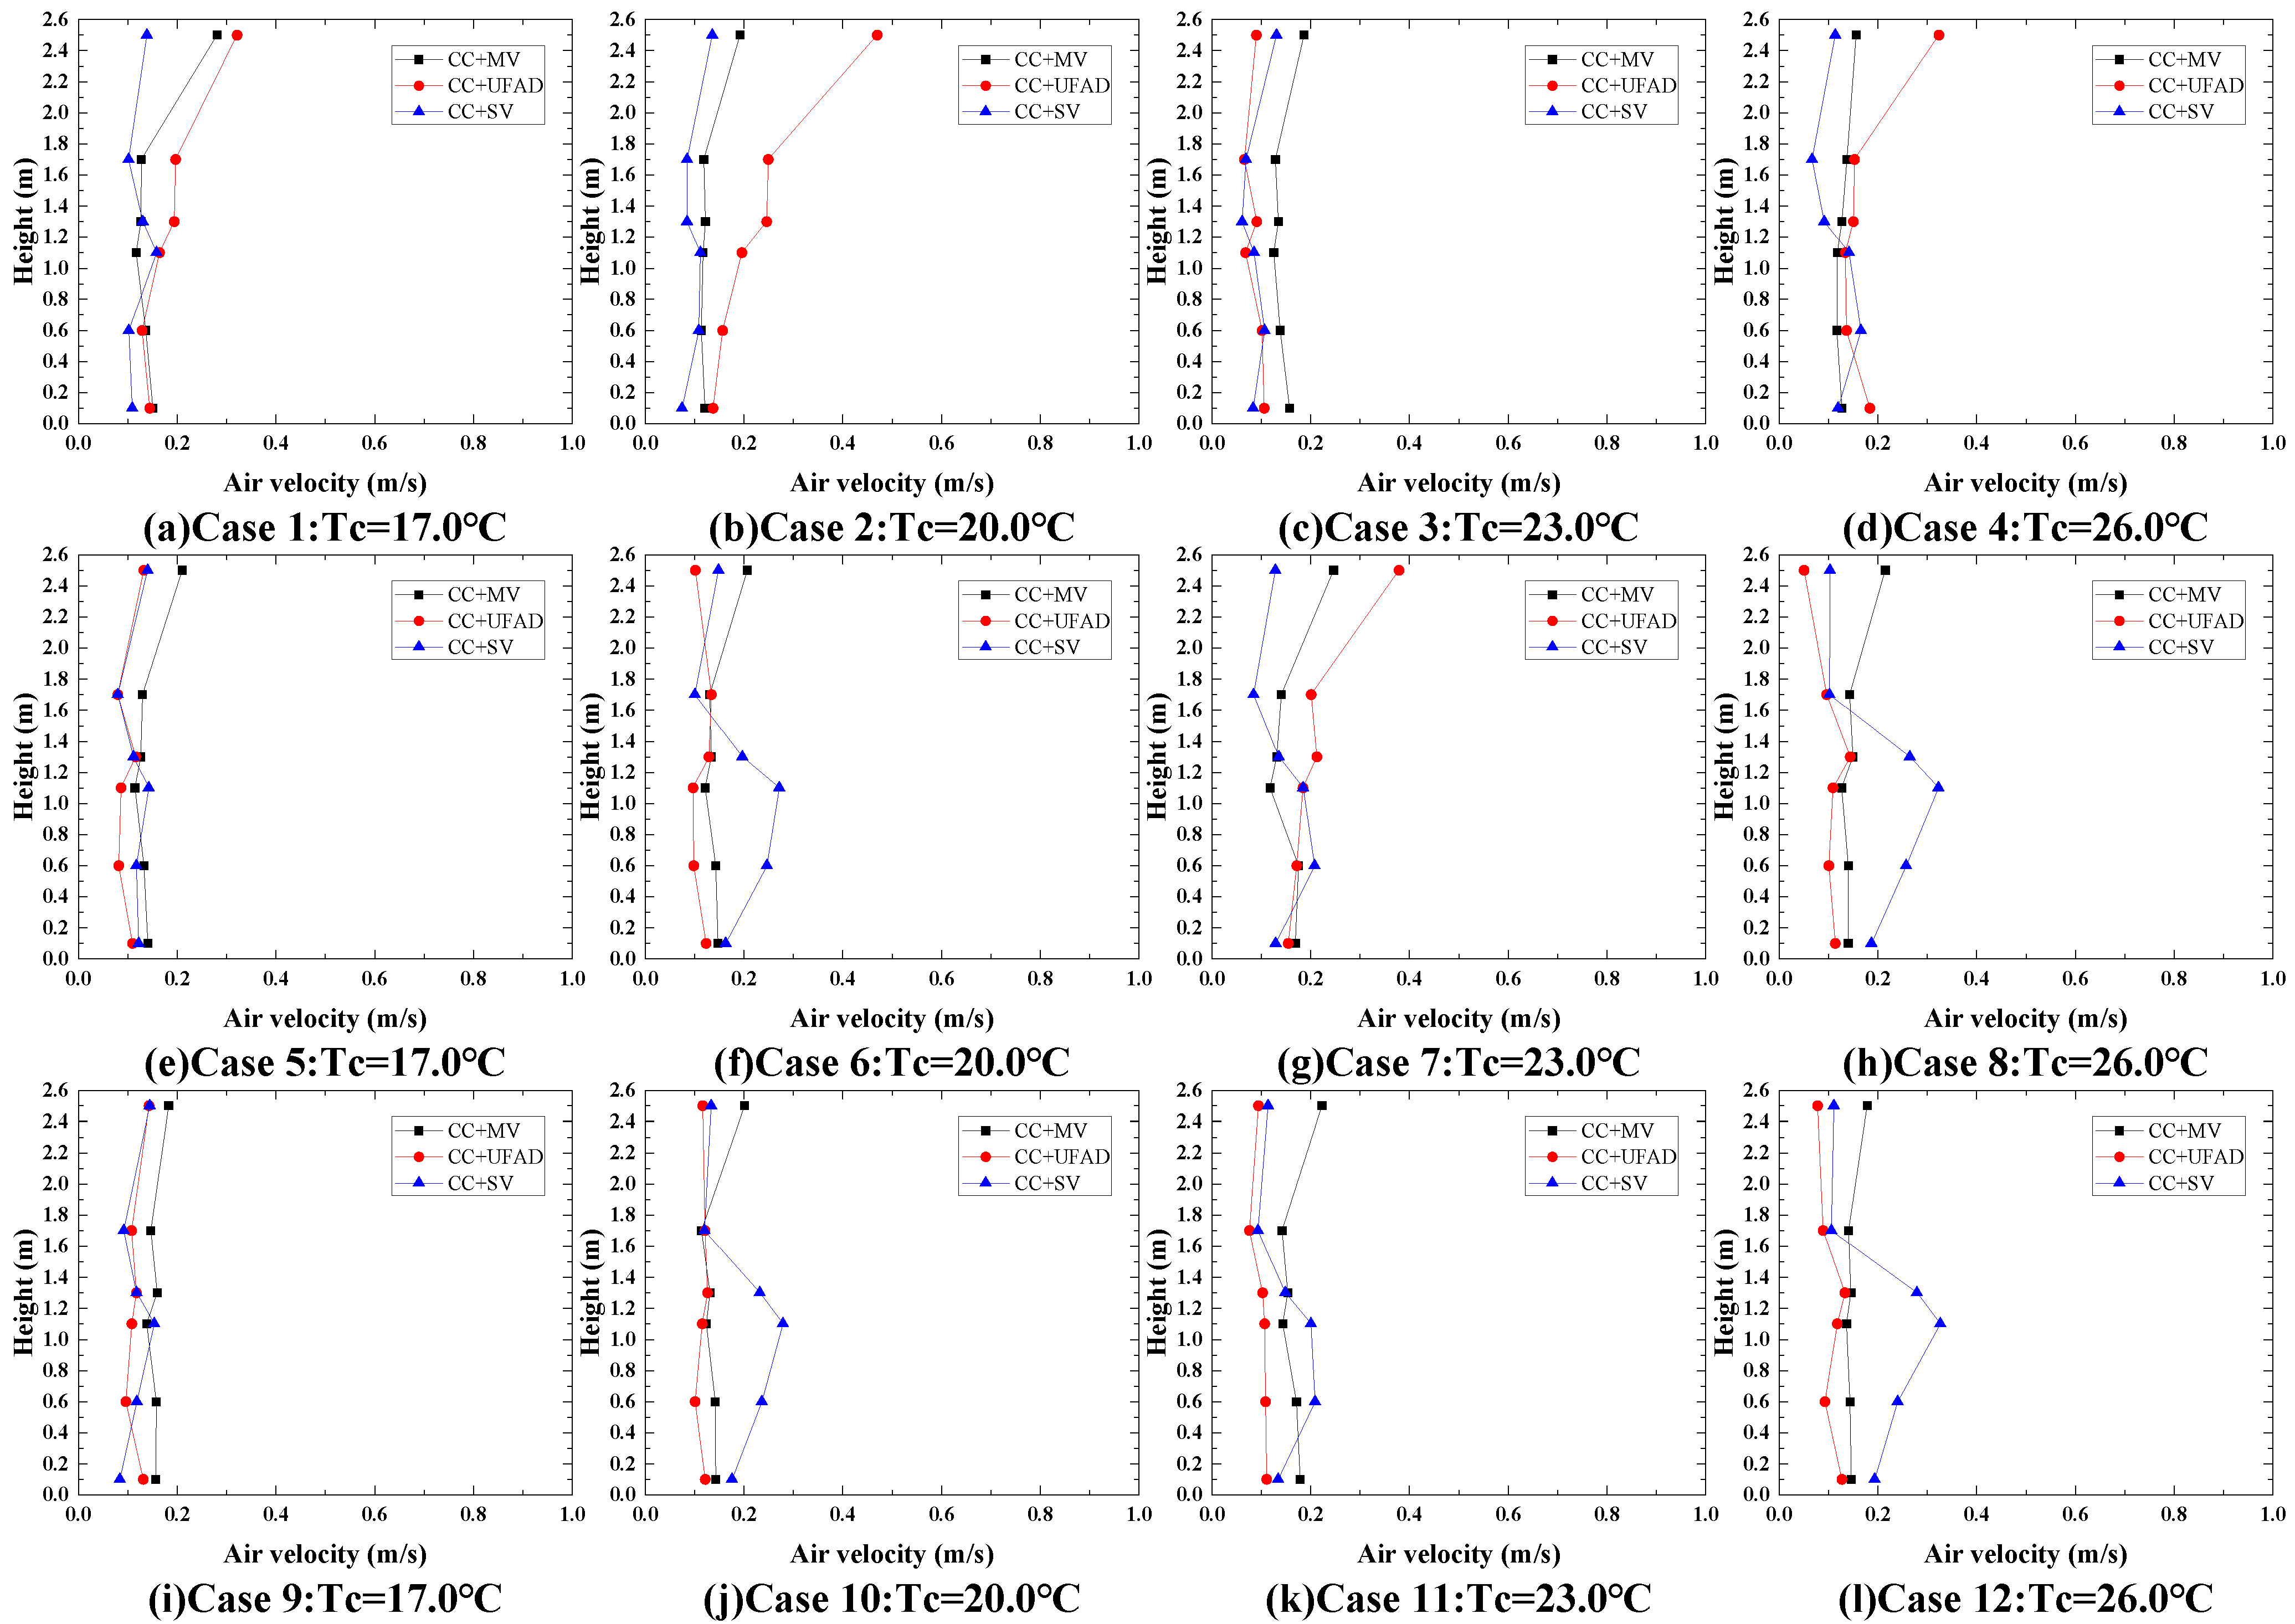
3.2. Indoor Air Velocity Profiles

Vertical distributions of indoor air velocity with different ventilation system types can be seen in Figure 5.
Figure 5a–c shows that the vertical distributions of indoor air velocity below 1.7 m with CC + MV were relatively uniform when the ceiling surface temperature was increased from 17 °C to 26 °C under the condition of a constant cooling load, whereas the air velocities near the ceiling were clearly larger than those below 1.7 m for all cases. Furthermore, both the ceiling surface temperature and internal and external cooling load did not affect the vertical air velocity profiles.
As shown in Figure 5d–f, the vertical air velocity profiles with CC + UFAD were greatly influenced by the ceiling surface temperature in Cases 1–8, as the internal cooling load was equal to 41.5 W/m2. Moreover, the vertical distributions of the air velocity were relatively uniform and nearly not influenced by the ceiling surface temperature as the internal cooling load increased from 41.5 W/m2 to 69.5 W/m2.
Figure 5g–i shows that the vertical air velocity profiles with CC + SV were relatively uniform and nearly not influenced by the ceiling surface temperature in Cases 1–4 as both the internal cooling load and external cooling load were equal to 41.5 W/m2. However, the air velocity below 1.7 m was clearly influenced by the ceiling surface temperature in Cases 5–8 and Cases 9–12, as the internal or external cooling load was increased from 41.5 W/m2 to 69.5 W/m2.
The calculation results of local turbulence intensity with different measuring lines for all cases are shown in Table 5.
For the CC + MV, the mean turbulence intensities were 27–34% in Cases 1–4 as the ceiling surface temperature increased from 17 °C to 26 °C, so they were slightly affected by the ceiling surface temperature. Moreover, the mean turbulence intensity was 31–33% in Cases 5–8 with increased external cooling load and 29–34% in Cases 9–12 with increased internal cooling load. Therefore, both the internal and external cooling load had a slight influence on the turbulence intensity in the room with CC + MV. Wu et al., also experimentally found that the turbulence intensity with CC + MV varied not much with the increase of internal or external cooling load [39].
For the CC + UFAD, the mean turbulence intensities were 34–40% in Cases 1–4 as the ceiling surface temperature increased from 17 °C to 26 °C. Moreover, the mean turbulence intensities were 33–43% in Cases 5–8 with increased external cooling load and 27–36% in Cases 9–12 with increased internal cooling load. Therefore, the turbulence intensity clearly decreased with the increase in the internal cooling load in the room with CC + UFAD, while the external cooling load had a slight influence on the turbulence intensity. This was consistent with the influence of internal and external cooling load on turbulence intensity with CC + UFAD obtained by Wu’s study [43].
For the CC + SV, the mean turbulence intensity was 24–35% in Cases 1–4 as the ceiling surface temperature increased from 17 °C to 26 °C, so the ceiling surface temperature clearly affected the turbulence intensity. Furthermore, the mean turbulence intensities increased to 32–40% in Cases 5–8 with increased external cooling load and 34–38% in Cases 9–12 with increased internal cooling load. Therefore, the turbulence intensity clearly increased with the increase of both internal and external cooling load in the room with CC + SV. The mean turbulence intensity with CC + SV in the classroom was 45–55% in Cheng’s study [61], which was higher than the result of this paper and may be attributed to the multiple thermal manikins in the classroom that led to a stronger interaction between the jet inertial forces and the thermal buoyancy forces induced by thermal manikins.

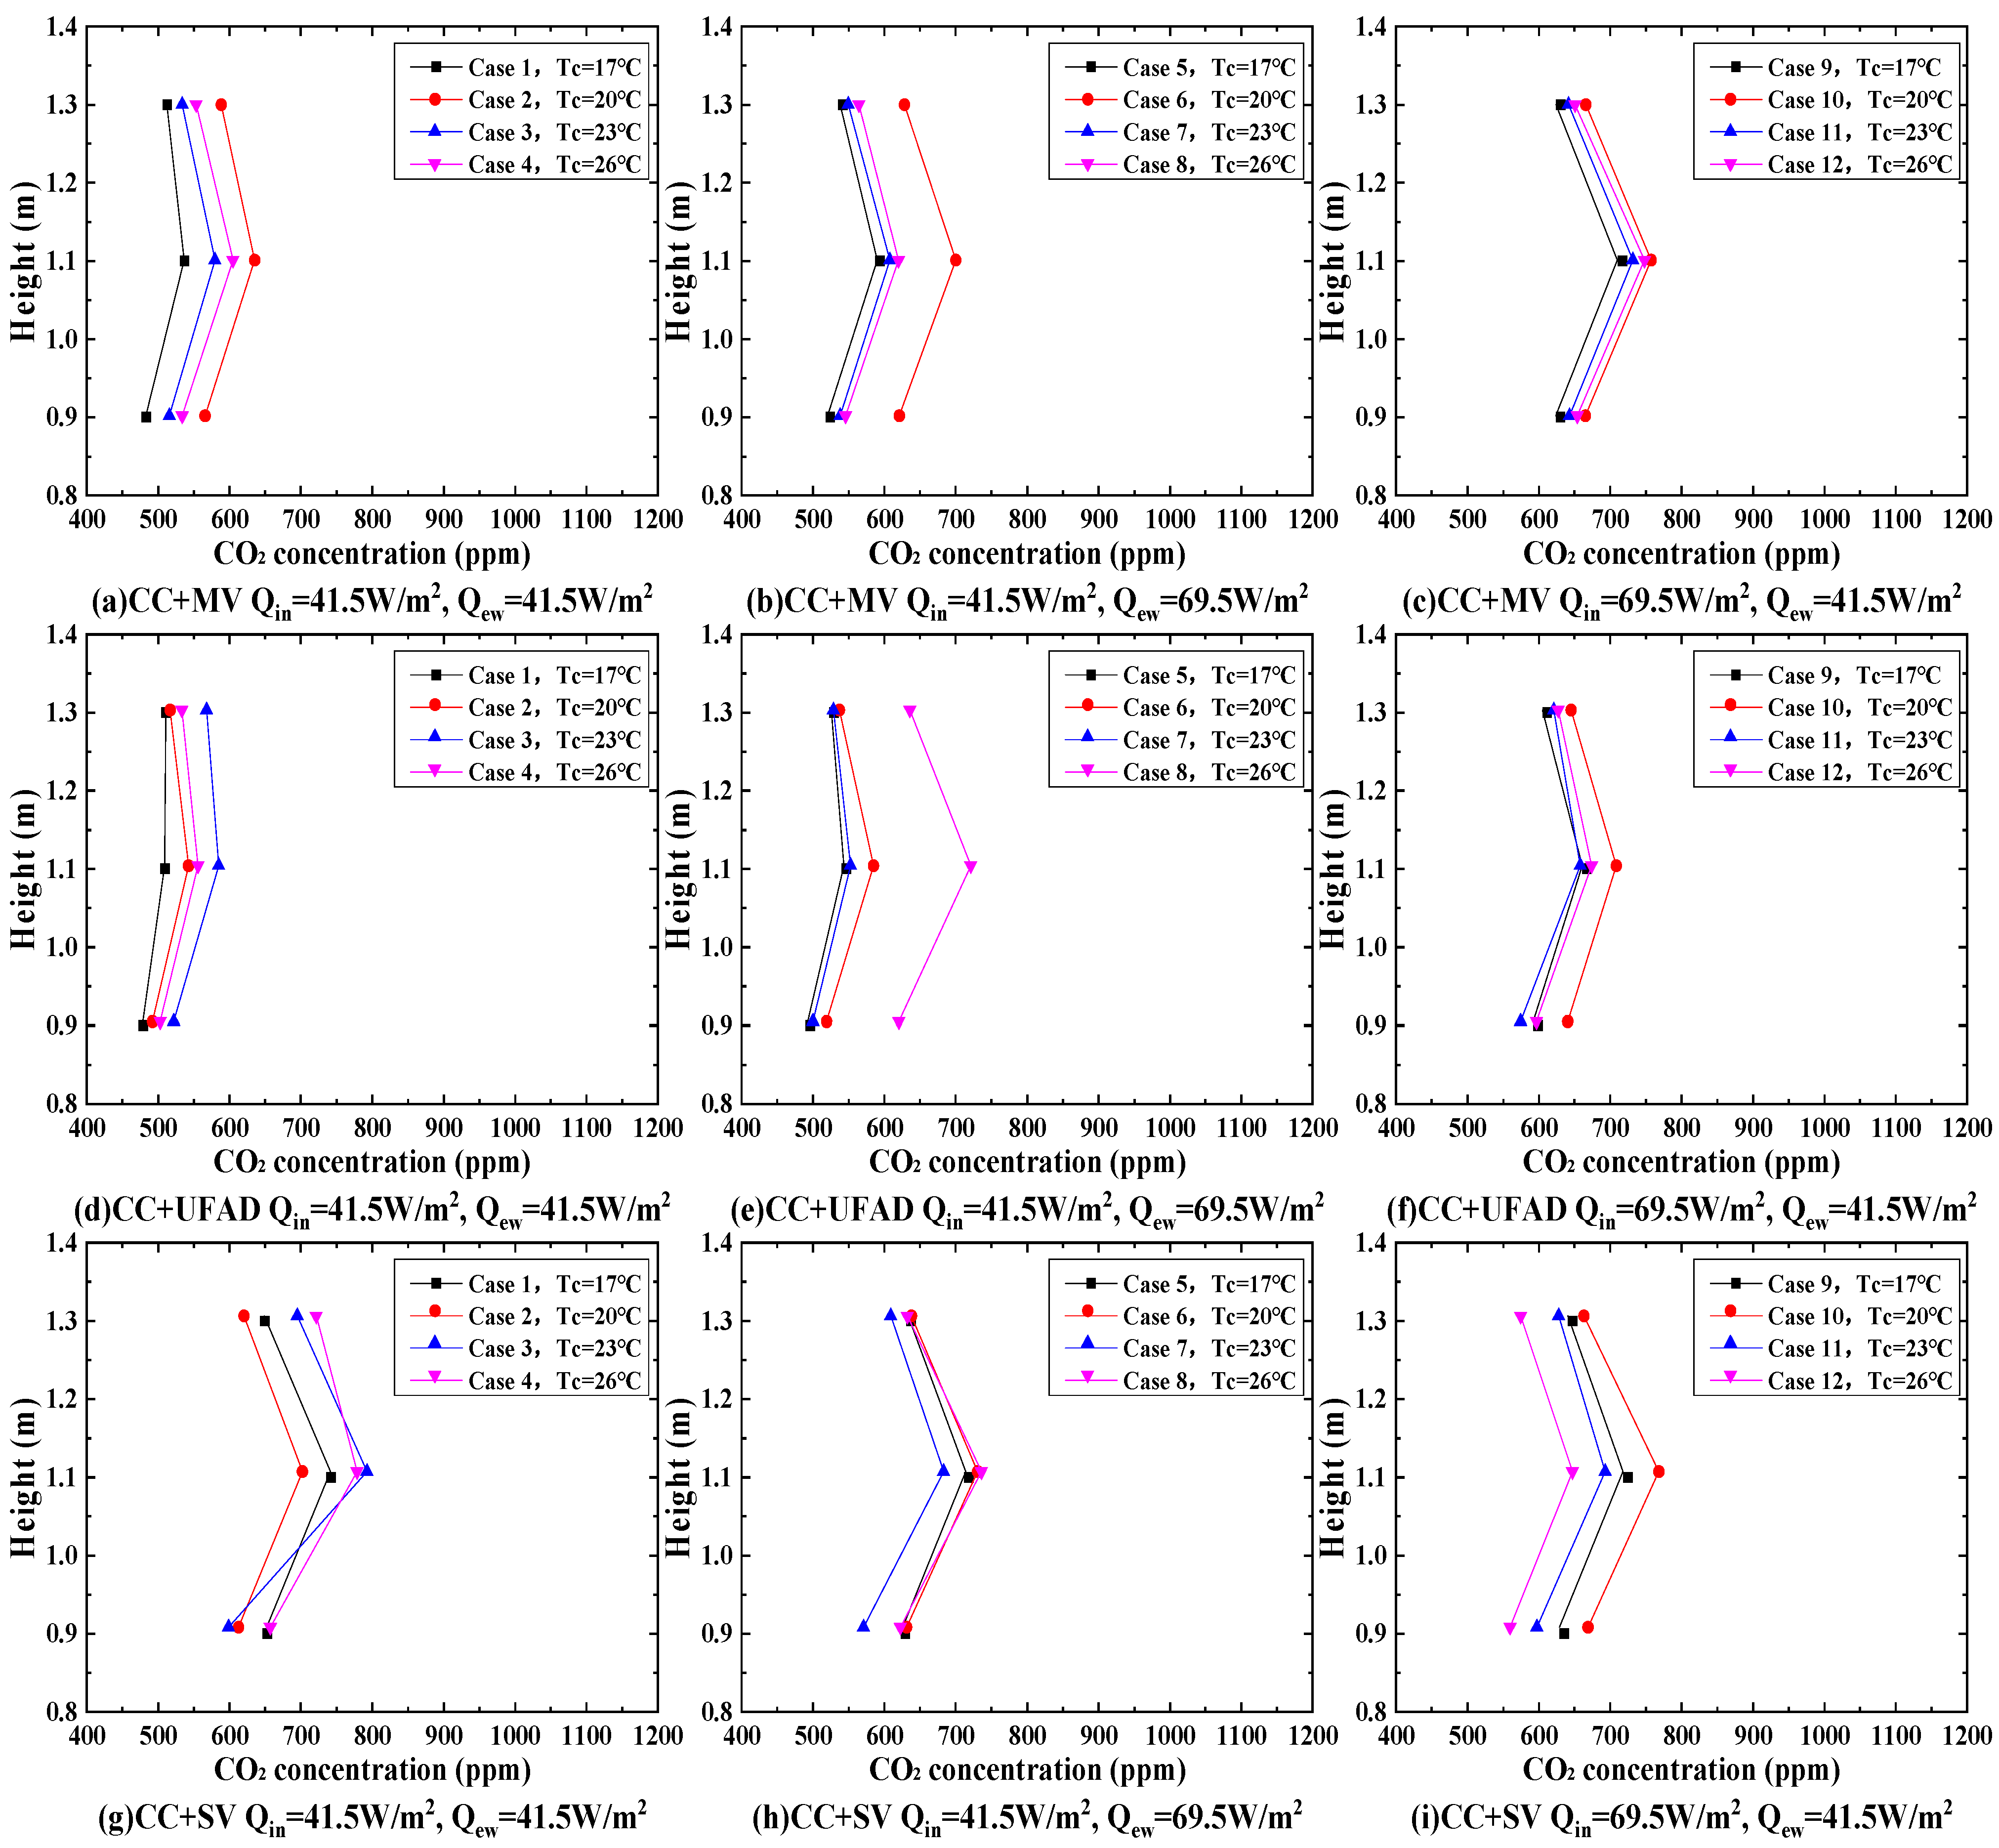
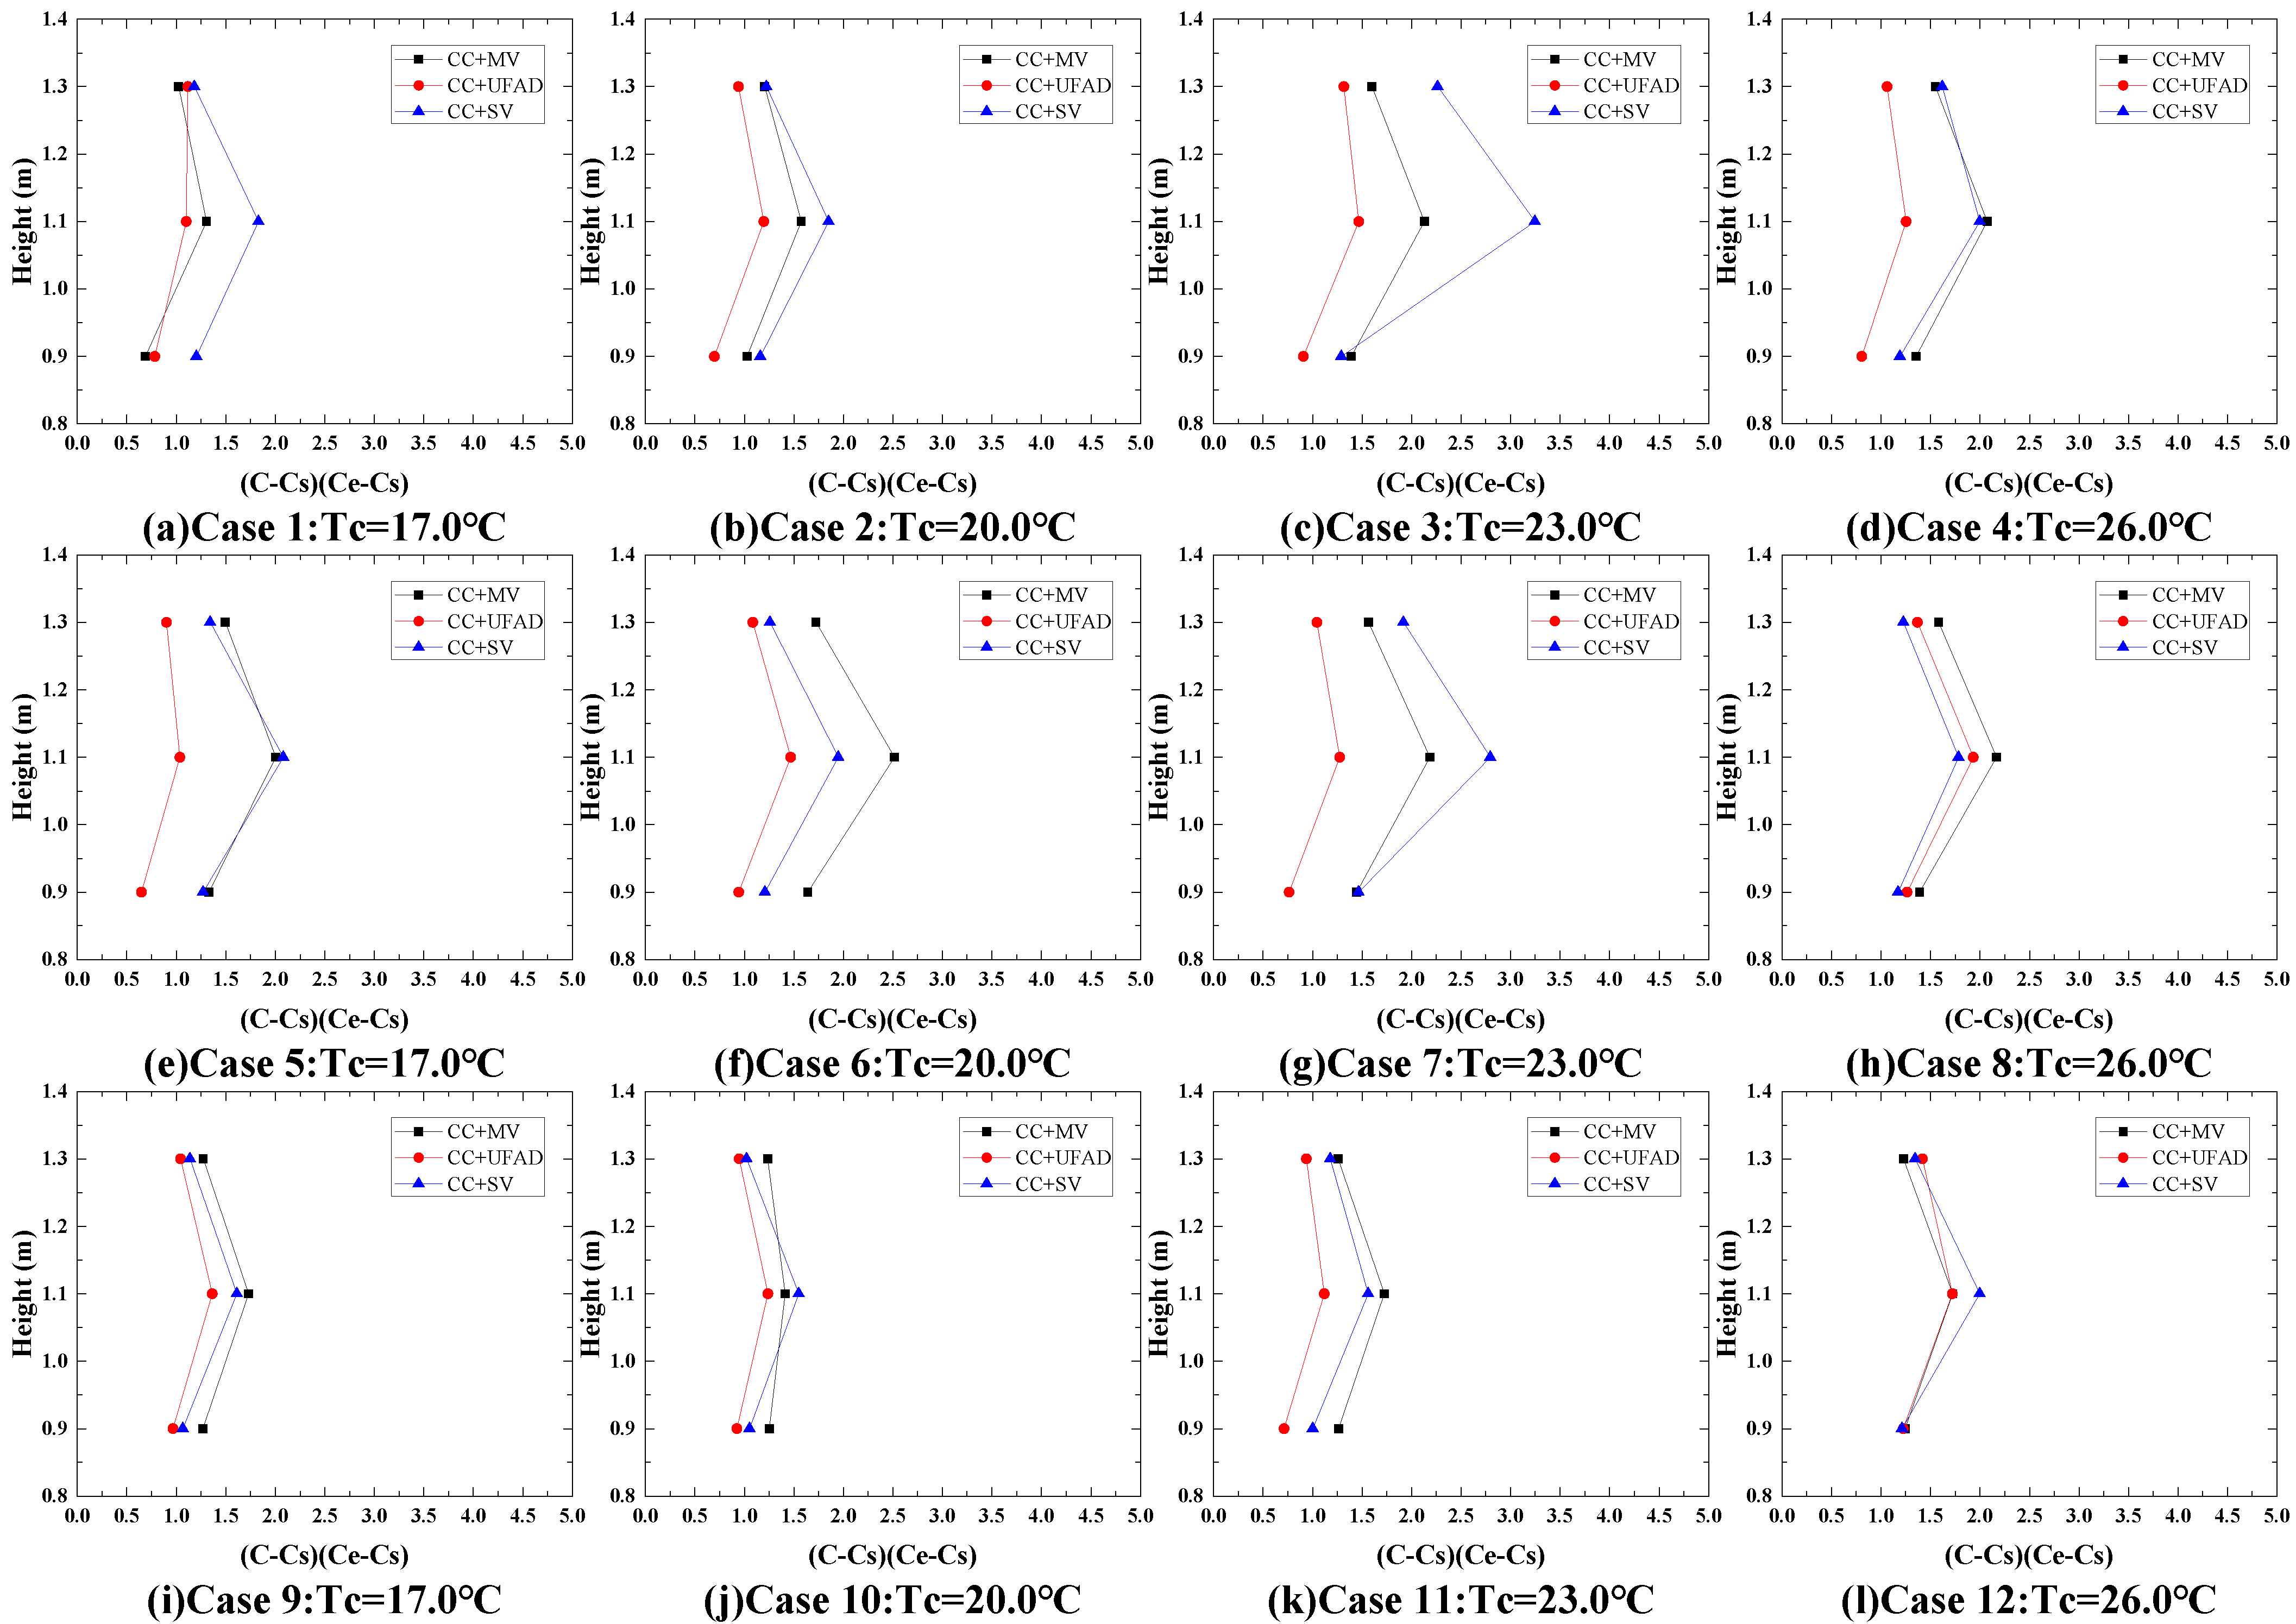
3.3. Indoor CO2 Concentration Profiles

Vertical distributions of indoor CO2 concentration with different ventilation system types can be seen in Figure 6.
Figure 6a–c shows that the vertical CO2 concentration profiles with CC + MV were clearly influenced by the ceiling surface temperature in Cases 1–4 as the ceiling surface temperature increased from 17 °C to 26 °C. However, the vertical distribution of the CO2 concentration was nearly not influenced by the ceiling surface temperature in Cases 9–12, as the internal cooling load increased from 41.5 W/m2 to 69.5 W/m2.
As shown in Figure 6d–f, the vertical CO2 concentration profiles with CC + UFAD were slightly influenced by the ceiling surface temperature in Cases 1–4, whereas they were significantly affected by the ceiling surface temperature in Cases 5–8 as the external cooling load increased from 41.5 W/m2 to 69.5 W/m2. Moreover, the vertical distribution of the CO2 concentration was slightly influenced by the ceiling surface temperature in Cases 9–12 as the internal cooling load increased from 41.5 W/m2 to 69.5 W/m2.
Figure 6g–i shows that the vertical CO2 concentration profiles with CC + SV were clearly influenced by the ceiling surface temperature in Cases 1–4 and Cases 9–12, as the external cooling load was equal to 41.5 W/m2. However, the vertical distribution of the CO2 concentration was nearly not influenced by the ceiling surface temperature in Cases 5–8, as the external cooling load increased from 41.5 W/m2 to 69.5 W/m2.
The calculation results of local contaminant removal effectiveness with different measuring lines for all cases are shown in Table 6.
For the CC + MV, the mean contaminant removal effectiveness (CREs) were 0.61–0.85 in Cases 1–4 as the ceiling surface temperature increased from 17 °C to 26 °C, so they were greatly affected by the ceiling surface temperature. However, the mean CREs were 0.53–0.64 in Cases 5–8 with increased external cooling load and 0.72–0.77 in Cases 9–12 with increased internal cooling load. Therefore, the CRE clearly decreased with the increase in the external cooling load in the room with CC + MV. Lipczynska et al. [15] conducted an experimental test and indicated that the calculated average CRE in the room with CC + MV under different types of pollutants ranged from 0.77 to 0.85, which was similar to the result of this paper, and the CREs were also all less than 1.
For the CC + UFAD, the mean CREs were 0.85–1.19 in Cases 1–4 as the ceiling surface temperature increased from 17 °C to 26 °C, so they were clearly affected by the ceiling surface temperature. Niu et al. [41] found that the radiant ceiling surface temperature had a significant impact on the indoor contaminant concentration distribution with CC + DV, which was similar to our results. Moreover, Loveday et al. [45] also demonstrated through smoke testing that the sinking airflow from the CC inhibited the upward buoyant flow, and the transition zone moved down from 2.0 m to the occupied zone of 1.5 m, which resulted in reduced ventilation efficiency and deterioration of air quality. Moreover, the mean CREs was 0.68–1.25 in Cases 5–8 with increased external cooling load and 0.68–1.13 in Cases 9–12 with increased internal cooling load. Therefore, the CRE varied largely with the increase in internal or external cooling load in the room with CC + UFAD.
For the CC + SV, the mean CREs were 0.60–0.75 in Cases 1–4 as the ceiling surface temperature increased from 17 °C to 26 °C, so they were slightly affected by the ceiling surface temperature. Furthermore, the mean CRE decreased to 0.50–0.71 in Cases 5–8 with increased external cooling load and increased to 0.67–0.83 in Cases 9–12 with increased internal cooling load. Therefore, the CRE slightly decreased with the increase of the external cooling load but slightly increased with the increase of the internal cooling load in the room with CC + SV. Huan et al. [62] obtained a similar conclusion that CRE in the room with SV decreased with the increase in the external cooling load when the supply air temperature was kept constant, and they also suggested that lower supply air temperatures also lead to lower local contaminant removal effectiveness under the same cooling load.

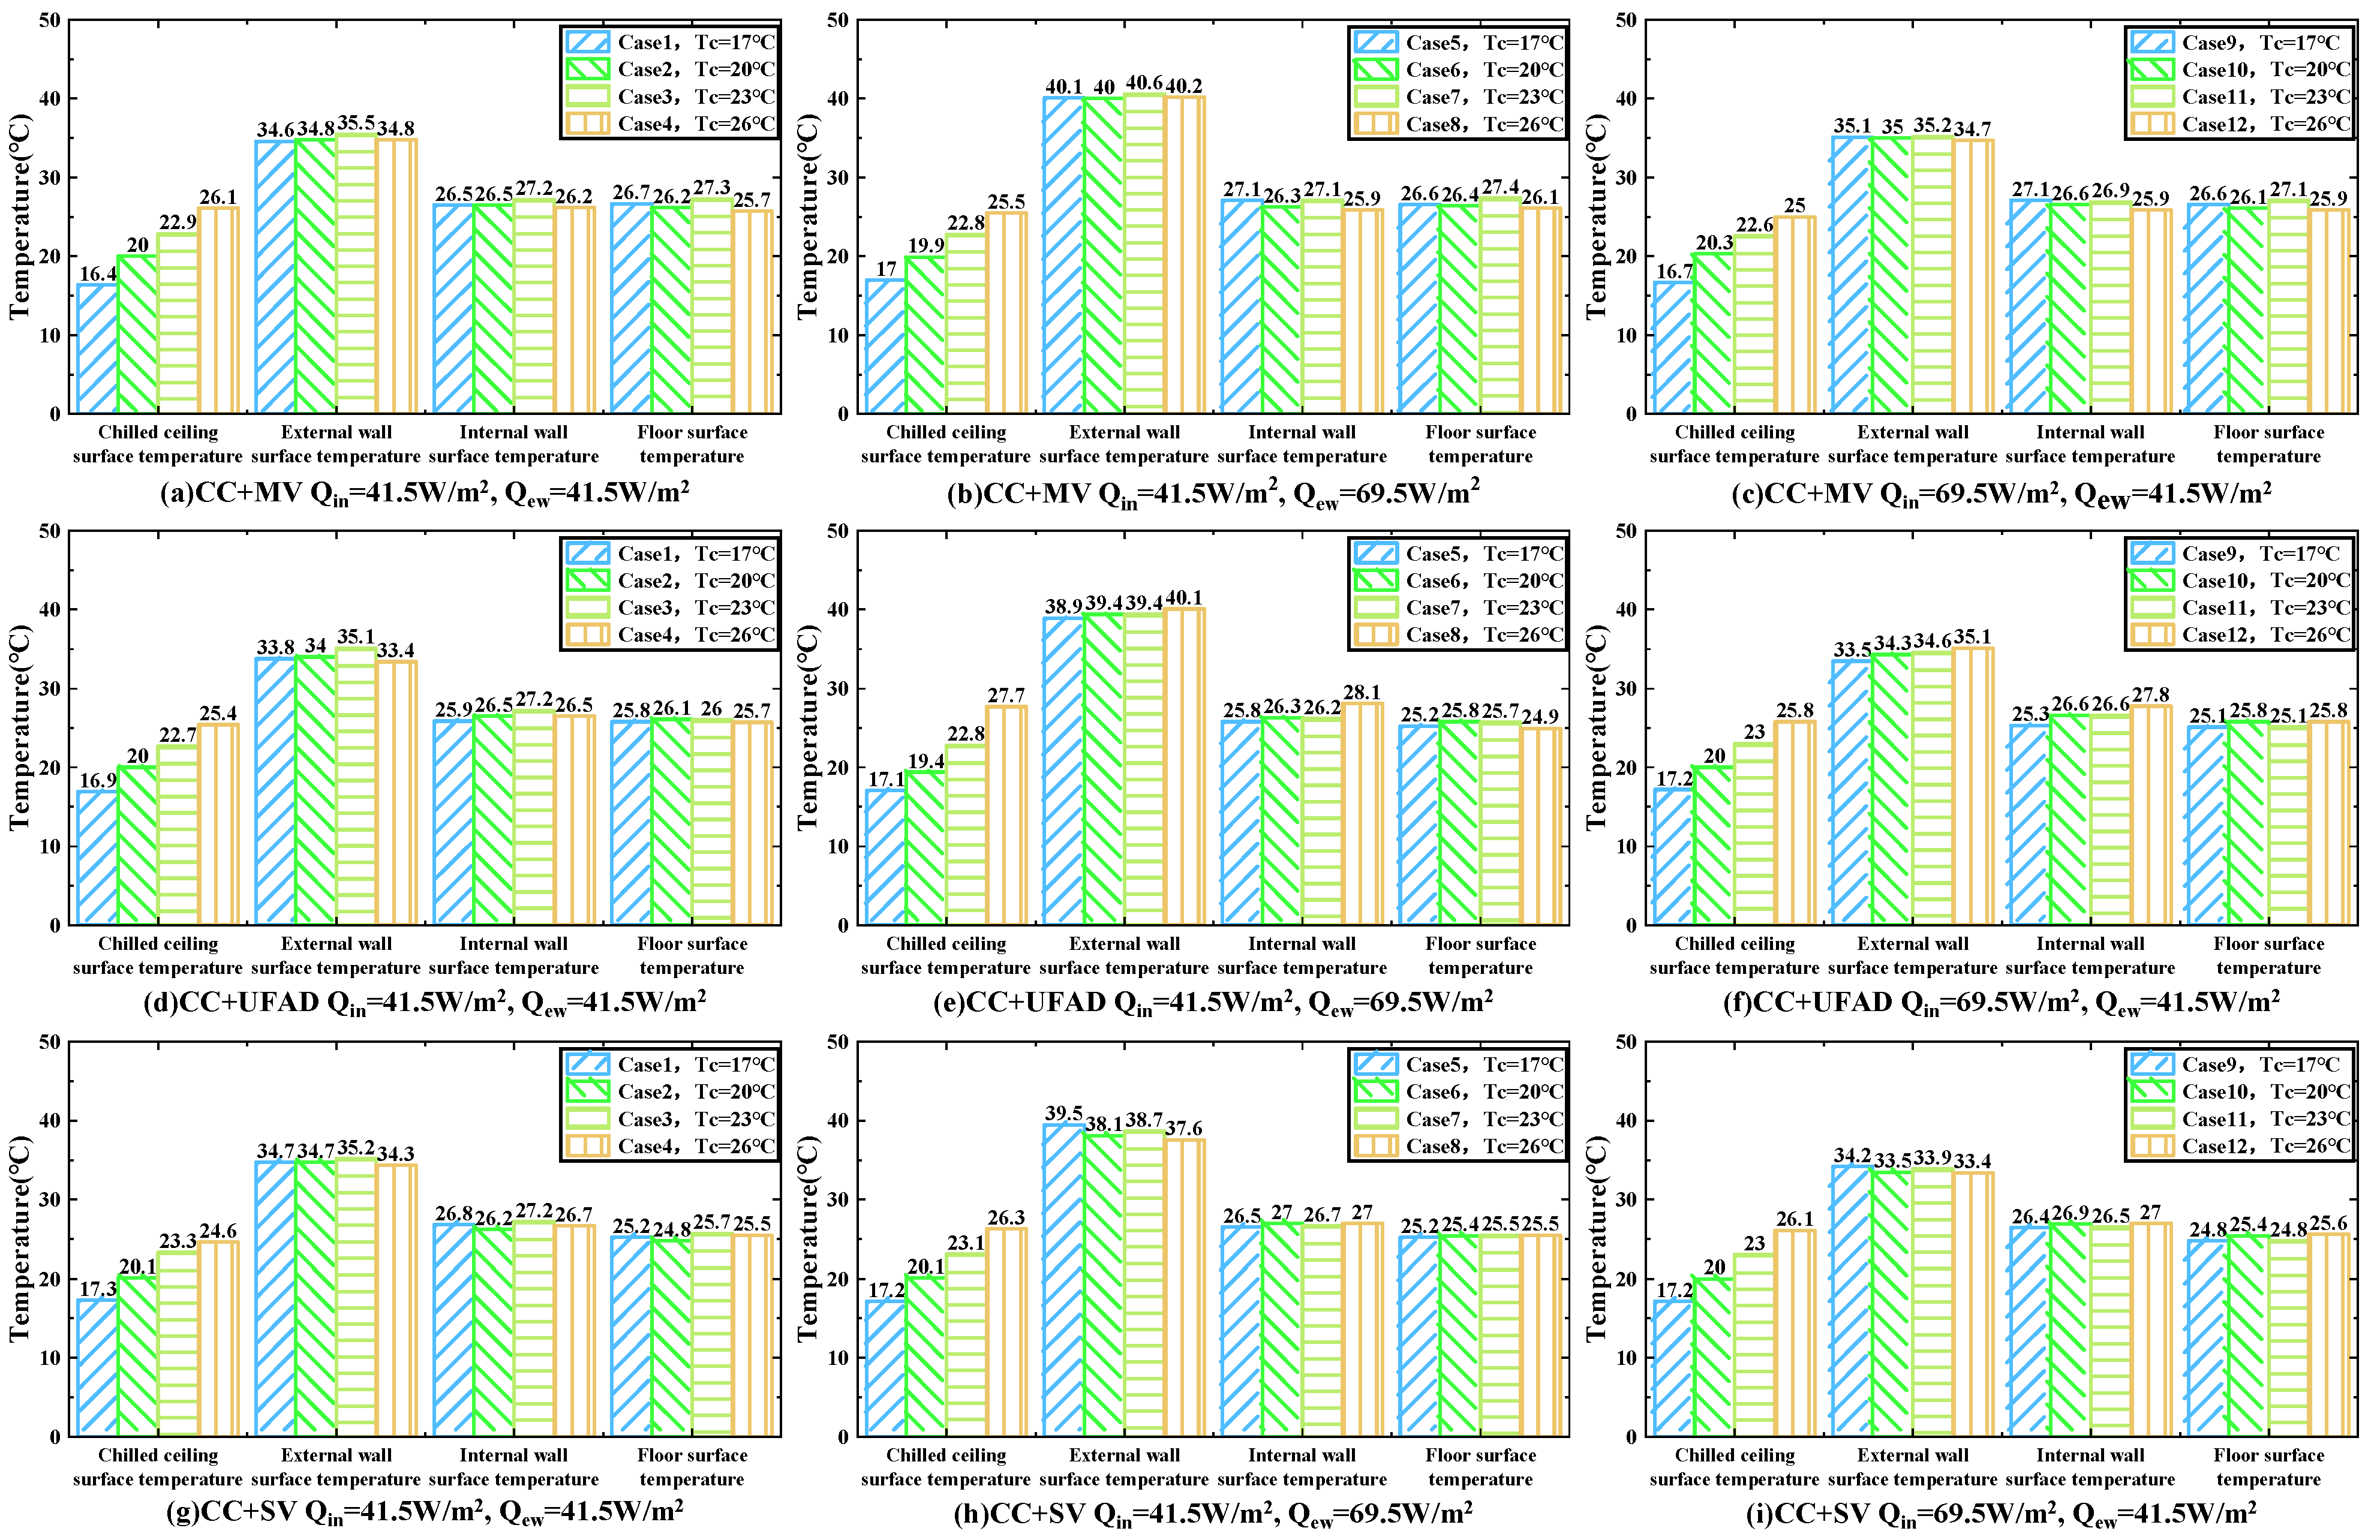
3.4. Indoor Surface Temperatures

The average surface temperature of building envelopes with different ventilation system types can be seen in Figure 7.
Figure 7a–c shows that both the internal wall surface temperature and floor surface temperature were slightly influenced by the ceiling surface temperature in Cases 1–4 as the ceiling surface temperature increased from 17 °C to 26 °C. Moreover, the external wall surface temperatures in Cases 5–8 were significantly larger than those in Cases 1–4 and Cases 9–12, as the external cooling load increased from 41.5 W/m2 to 69.5 W/m2. Hence, the external wall surface temperatures clearly increased with the increase in external cooling load.
As shown in Figure 7d–f, the internal wall surface temperature was slightly influenced by the ceiling surface temperature in Cases 1–4, whereas the floor surface temperature was nearly not influenced by the ceiling surface temperature. The external wall surface temperatures in Cases 5–8 were clearly larger than those in Cases 1–4 and Cases 9–12, as the external cooling load increased from 41.5 W/m2 to 69.5 W/m2.
Figure 7g–i shows that both the internal wall surface temperature and floor surface temperature were nearly not influenced by the ceiling surface temperature in Cases 1–4 as the ceiling surface temperature increased from 17 °C to 26 °C. Moreover, the external wall surface temperatures in Cases 5–8 were significantly larger than those in Cases 1–4 and Cases 9–12, as the external cooling load increased from 41.5 W/m2 to 69.5 W/m2.
The calculation results of mean radiant temperature and air temperature are shown in Table 7.
For the CC + MV, the differences between mean radiant temperature and air temperature were 0 °C–0.5 °C in Cases 1–4 as the ceiling surface temperature increased from 17 °C to 26 °C, so the ceiling temperature nearly did not affect the difference between mean radiant temperature and air temperature. Moreover, the differences between mean radiant temperature and air temperature were 0.1 °C–0.5 °C in Cases 5–8 with increased external cooling load and increased to 0.6 °C–0.9 °C in Cases 9–12 with increased internal cooling load. Therefore, the difference between mean radiant temperature and air temperature clearly increased with the increase in the internal cooling load, while it was nearly not affected by the external cooling load in the room with CC + MV. The experiment of Wu [50] used four persons in a room with CC + MV and measured the mean radiant temperature, which was 0.8 °C higher than the air temperature, which was consistent with the result obtained in this paper.
For the CC + UFAD, the differences between mean radiant temperature and air temperature were −0.1 °C–0.8 °C in Cases 1–4 as the ceiling surface temperature increased from 17 °C to 26 °C. Furthermore, the difference between mean radiant temperature and air temperature increased to 0.6 °C–1.9 °C in Cases 5–8 with increased external cooling load and increased to 0.9 °C–2.2 °C in Cases 9–12 with increased internal cooling load. Therefore, the difference between mean radiant temperature and air temperature clearly increased with the increase in the internal or external cooling load in the room with CC + UFAD. Furthermore, the study of Wu showed that the measured difference between mean radiant temperature and air temperature was 1.2 °C in the room with CC + UFAD using persons as the internal and external cooling load was kept constant [50].
For the CC + SV, the differences between mean radiant temperature and air temperature were −0.1 °C–0.5 °C in Cases 1–4 as the ceiling surface temperature increased from 17 °C to 26 °C. Moreover, the differences between mean radiant temperature and air temperature were 0 °C –0.7 °C in Cases 5–8 with increased external cooling load and 0.2 °C–0.9 °C in Cases 9–12 with increased internal cooling load. Therefore, the differences between mean radiant temperature and air temperature were slightly affected by the ceiling surface temperature, while it was nearly not influenced by the internal or external cooling load in the room with CC + SV. This result was not consistent with the simulation results of Zhu’s study [51] and may be due to the fact that the external wall surface temperature was much higher than the indoor air temperature in this study.

4. Influence of Ventilation System Type on Indoor Air Distribution and Thermal Environment

To eliminate the effect of supply air temperature and supply CO2 concentration, vertical normalized air temperature and CO2 concentration were calculated in the room with different ventilation system types. The heat removal effectiveness (HRE) and air diffusion performance index (ADPI) were further calculated to evaluate the indoor air distribution, and the predicted mean vote of thermal sensation (PMV), predicted percentage dissatisfied (PPD) and the draught (DR) near the neck were also calculated to evaluate the indoor thermal environment.

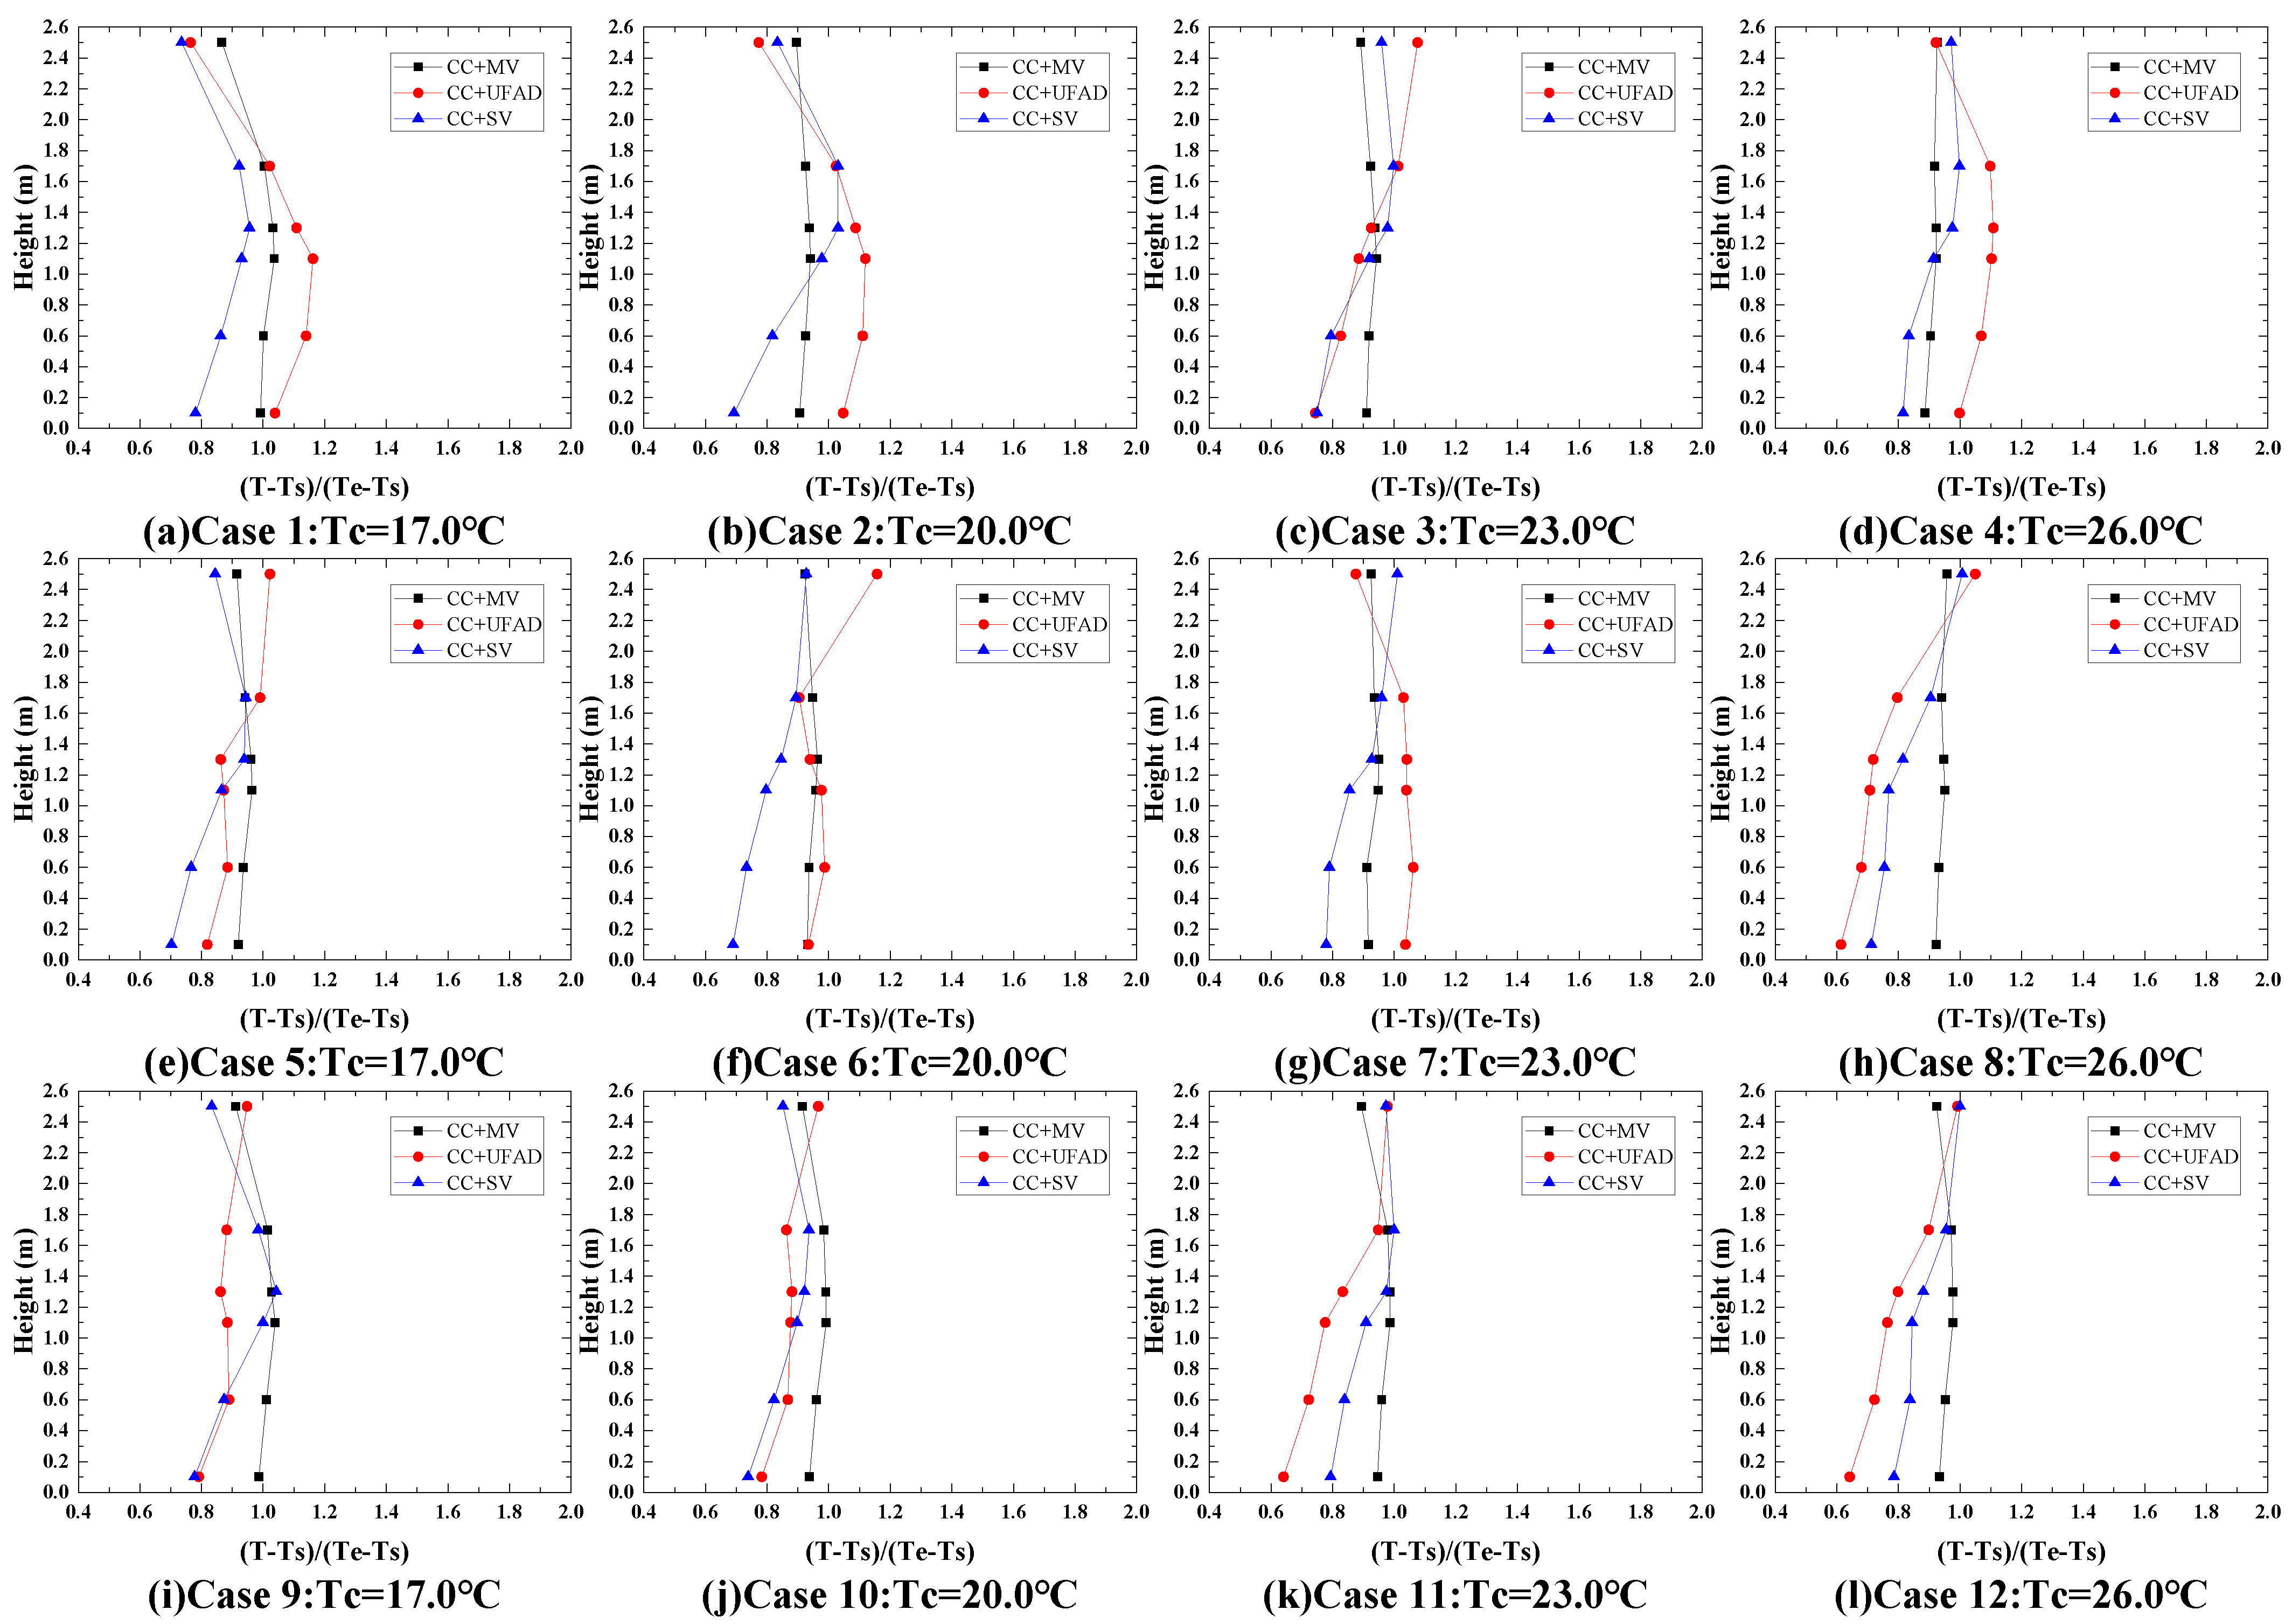
4.1. Influence of Ventilation System Type on Indoor Air Distribution

Vertical indoor air distributions with different ventilation system types can be seen in Figure 8, Figure 9 and Figure 10, where the ceiling surface temperature and the internal or external cooling load were 17 °C–26 °C and 41.5 W/m2–69.5 W/m2, respectively.
As shown in Figure 8, the vertical distribution of normalized air temperature with CC + MV was more uniform compared to the other two integrated systems in all cases, which was probably due to the fact that the supply air jet of MV could effectively mix the indoor air [61]. Moreover, the vertical distribution of normalized air temperature above 1.3 m with CC + UFAD had a larger temperature gradient than the other two integrated systems in many cases, which was due to the upper part of the room with CC + UFAD was mainly affected by the thermal plume that enhanced the thermal stratification effect and tended to form large temperature gradient [63]. The normalized air temperature gradient above 1.3 m with CC + UFAD varied greatly with the increase in the ceiling surface temperature and the internal or external cooling. Moreover, the vertical distribution of normalized air temperature below 1.3 m of CC + SV had a larger positive temperature gradient compared to the other two integrated systems in most cases, which was because the distribution of air temperature below 1.3 m with CC + SV was strongly influenced by the sinking cold air jet delivered horizontally from the sidewall air supply opening more inclined to show a positive temperature gradient [62].
Further summarizing, we could conclude that the vertical distribution of normalized air temperature with CC + MV was the most uniform, and it was the least affected by the ceiling surface temperature and the internal or external cooling load among the three integrated systems. Moreover, the results obtained by Zhang et al. [36] also showed that the introduction of MV in a CC system tended to result in a more uniform temperature field, and the cooling capacity of CC had little impact on the temperature gradient. The normalized air temperature gradient above 1.3 m with CC + UFAD was the largest, and the vertical distribution was greatly affected by the ceiling surface temperature and the internal or external cooling load. Moreover, the normalized air temperature gradient below 1.3 m with CC + SV was the largest and tended to form the positive temperature gradient that was slightly affected by the ceiling surface temperature and the internal or external cooling. The above conclusion was in agreement with Tian’s study [60]. They compared the temperature distribution of three mechanical ventilation types by experimental study and found that the MV produced more uniform temperature distribution in the vertical and horizontal directions, the DV produced obvious temperature stratification, and the SV had a lower temperature in the occupied zone than the upper part of the room. Hence, the vertical distribution of indoor air temperature was mainly affected by the ventilation system type despite the fact that the radiant cooling ceiling might induce the sinking cold airflow.
Figure 9 shows that the vertical distribution of indoor air velocity below 1.7 m with CC + MV or CC + UFAD was uniform in almost all cases, whereas the local air velocity near the ceiling was clearly greater than other measuring positions, which is probably due to the downward cold air flow caused by the radiant cooling ceiling surface. In addition, the local air velocity with CC + SV was the maximum at a height of 1.1 m in Cases 6–8 and 10–12 as the internal or external cooling load increased from 41.5 W/m2 to 69.5 W/m2, and the vertical velocity gradient below or above 1.1 m was significantly larger compared to the other two integrated systems. The reason was that the air supply jet of SV was transported horizontally from the air supply opening at the side wall (see Figure 1b), so the air velocity below or above 1.1 m was greatly affected by the air supply jet, and the supply air volume increased with the increase in the cooling load to cause this phenomenon. Huan et al. [62] measured the air velocity in a room with SV under three different cooling loads and proposed that the air volume mainly affected the delivery distance of the supply air. When the temperature of the supply air was constant, the delivery distance of the supply air became longer with the increase in the cooling load.
The vertical distribution of air velocity with CC + MV and CC + UFAD was relatively uniform, and it was nearly not affected by the ceiling surface temperature and cooling load. Loveday et al. [45] suggested that in the CC + DV system, the decreased ceiling surface temperature led to the increased local air velocity, but the increased airflow rate had little effect on the local air velocity. This phenomenon was not clearly shown in this paper, and probably due to the fact that the measured air supply rate in this paper was slightly large. Moreover, the local air velocity at a height of 1.1 m with CC + SV was the maximum, and the velocity gradient below or above 1.1 m was clearly affected by the ceiling surface temperature and cooling load. Cheng et al. [61] also found that the air velocity of MV remained almost constant through the entire occupied zone, while the highest air velocity of SV was observed at the head level, and the flow in the occupied zone was typically dominated by the momentum of the supply air jet, which corresponded exactly to the result of this paper. Moreover, Xie et al. [64] concluded a combination of experiment and simulation showing that in order to avoid a strong sense of blowing wind, it was necessary to carry out strict control of the air supply velocity of the sidewall air supply opening. Hence, the location of the supply terminal at the side wall clearly affected the vertical distribution of air velocity, whereas the location of the supply terminal at the ceiling or floor nearly did not affect the vertical distribution of air velocity.
Figure 10 shows that the local normalized CO2 concentration with CC + UFAD was smaller compared to the other two integrated systems in almost all cases. This was because the strong thermal plume effect carried a large amount of contaminations up to the height of the exhaust terminal. Furthermore, the airflow organization characteristic of the UFAD would lead to more obvious indoor thermal stratification and a better ventilation effect [63]. Furthermore, the local normalized CO2 concentration with CC + SV was higher than the other two systems in Cases 1–4 as the internal or external cooling load was equal to 41.5 W/m2, which may be due to the fact that buoyancy of SV was dominated and the ability to remove contaminant was limited at low supply air volume. Tian et al. [65] found that the toluene concentration in the breathing zone for SV was higher than DV under the same condition through numerical simulation. We observed the flow field diagrams obtained by Tian, and the dummy contaminant release port was directly opposite the air supply opening of SV and may raise the risk of contaminant brought back to the breathing zone by the air supply jet. In addition, the vertical distribution of normalized CO2 concentration with CC + MV was almost the same as the CC + SV in Cases 5–12 as the internal or external cooling load increased from 41.5 W/m2 to 69.5 W/m2, which may be due to the increased supply air volume with the increase of cooling load so that the effect of fluid inertia force to further promote the mixing of indoor air was enhanced for CC + MV or CC + SV.
The local normalized CO2 concentration with CC + UFAD was the smallest among the three integrated systems, and the local normalized CO2 concentration with CC + SV was the highest when both the internal and external cooling load were 41.5 W/m2. Behne et al. [48] and Schiavon et al. [49] obtained similar conclusions that the CC + DV could provide better indoor air quality than CC + MV so that CC + UFAD could provide better air quality due to the similar air distribution of UFAD to DV. Furthermore, Tian et al. [60] proposed that the DV was the most effective method for the overall contaminant removal effectiveness in the occupied zone, followed by SV and then MV. Therefore, the vertical distribution of indoor CO2 concentration was also mainly affected by the ventilation system type.

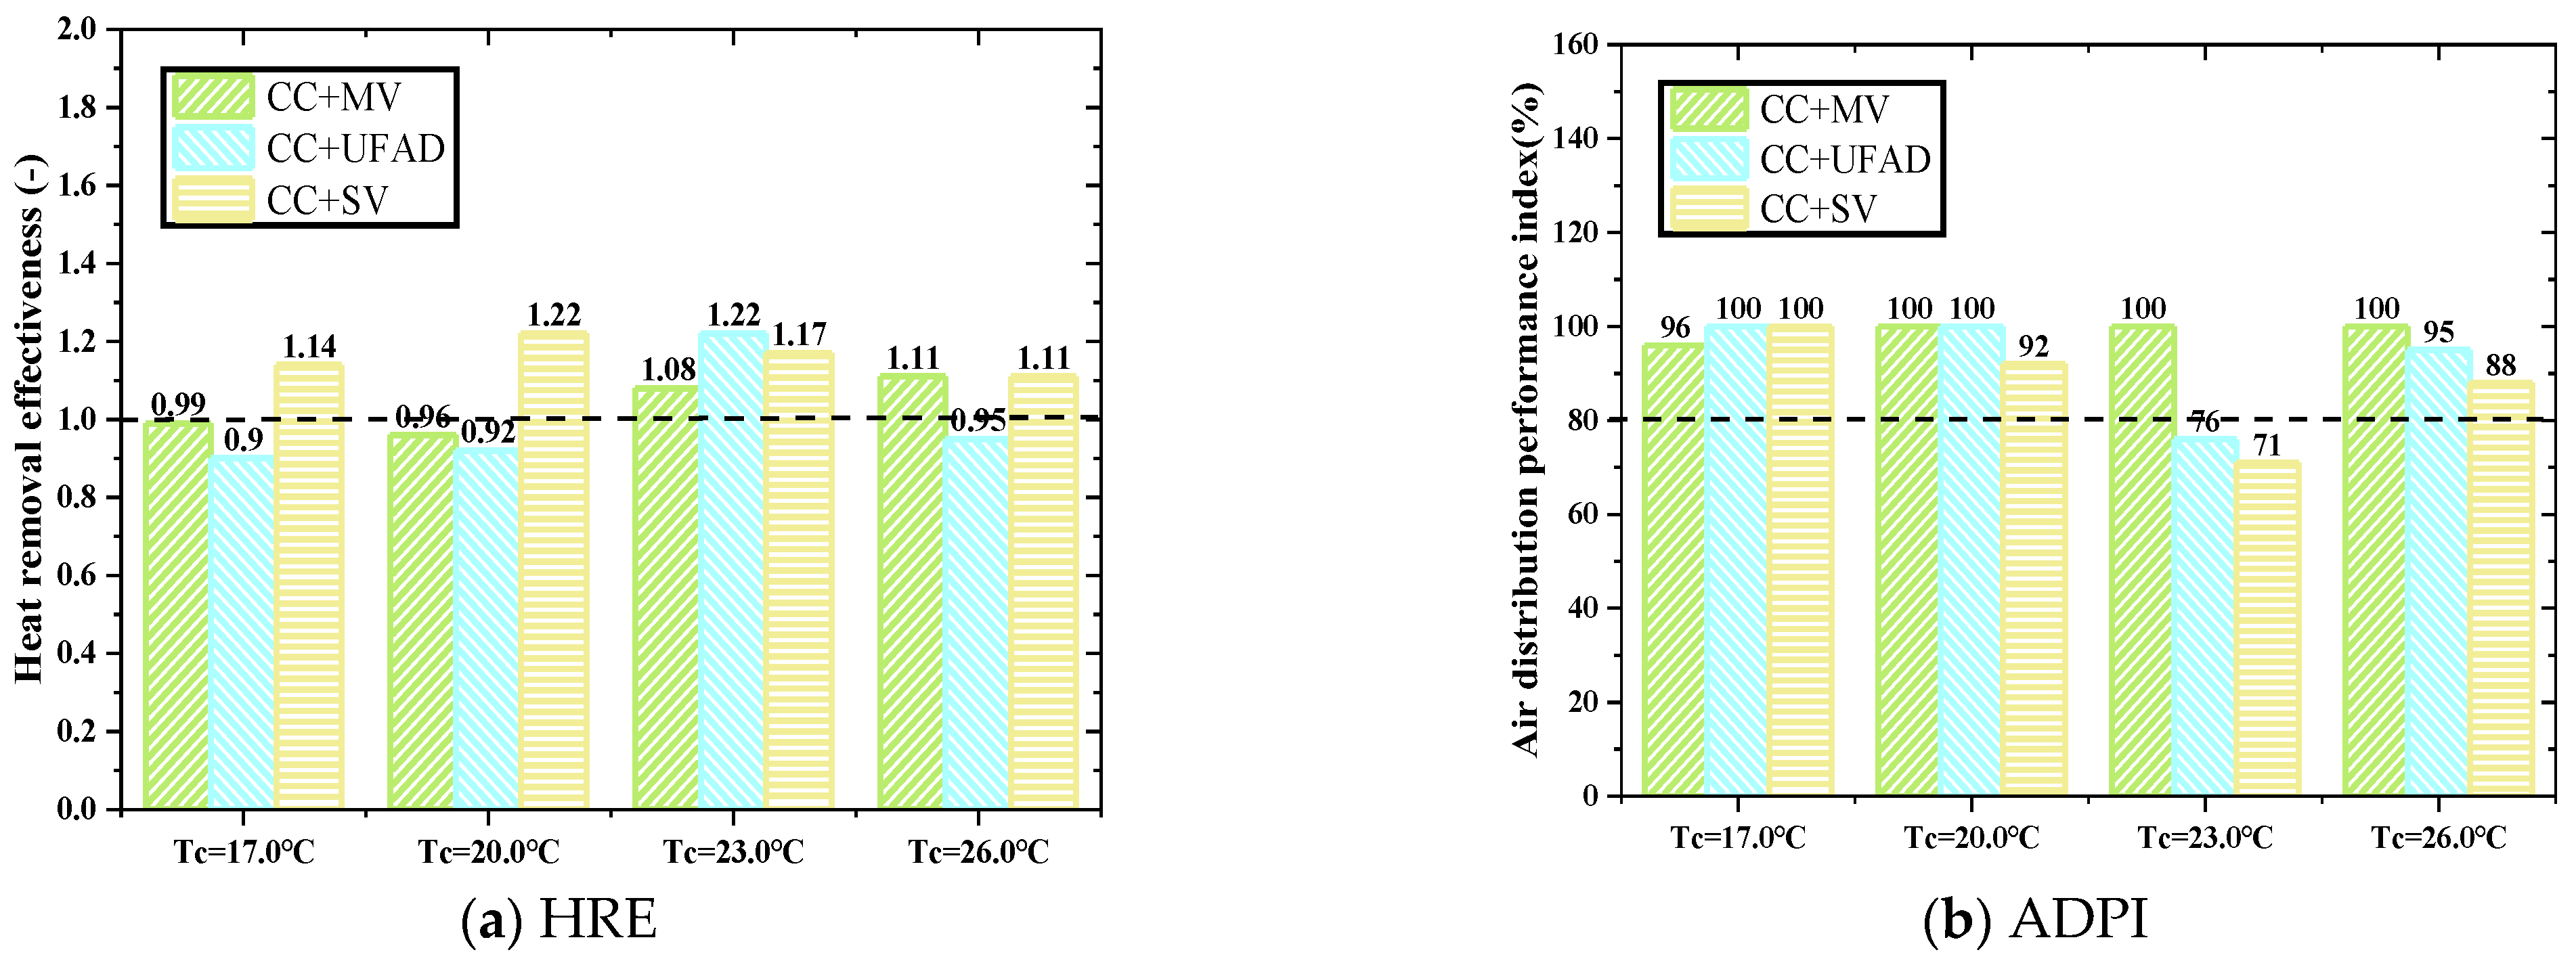
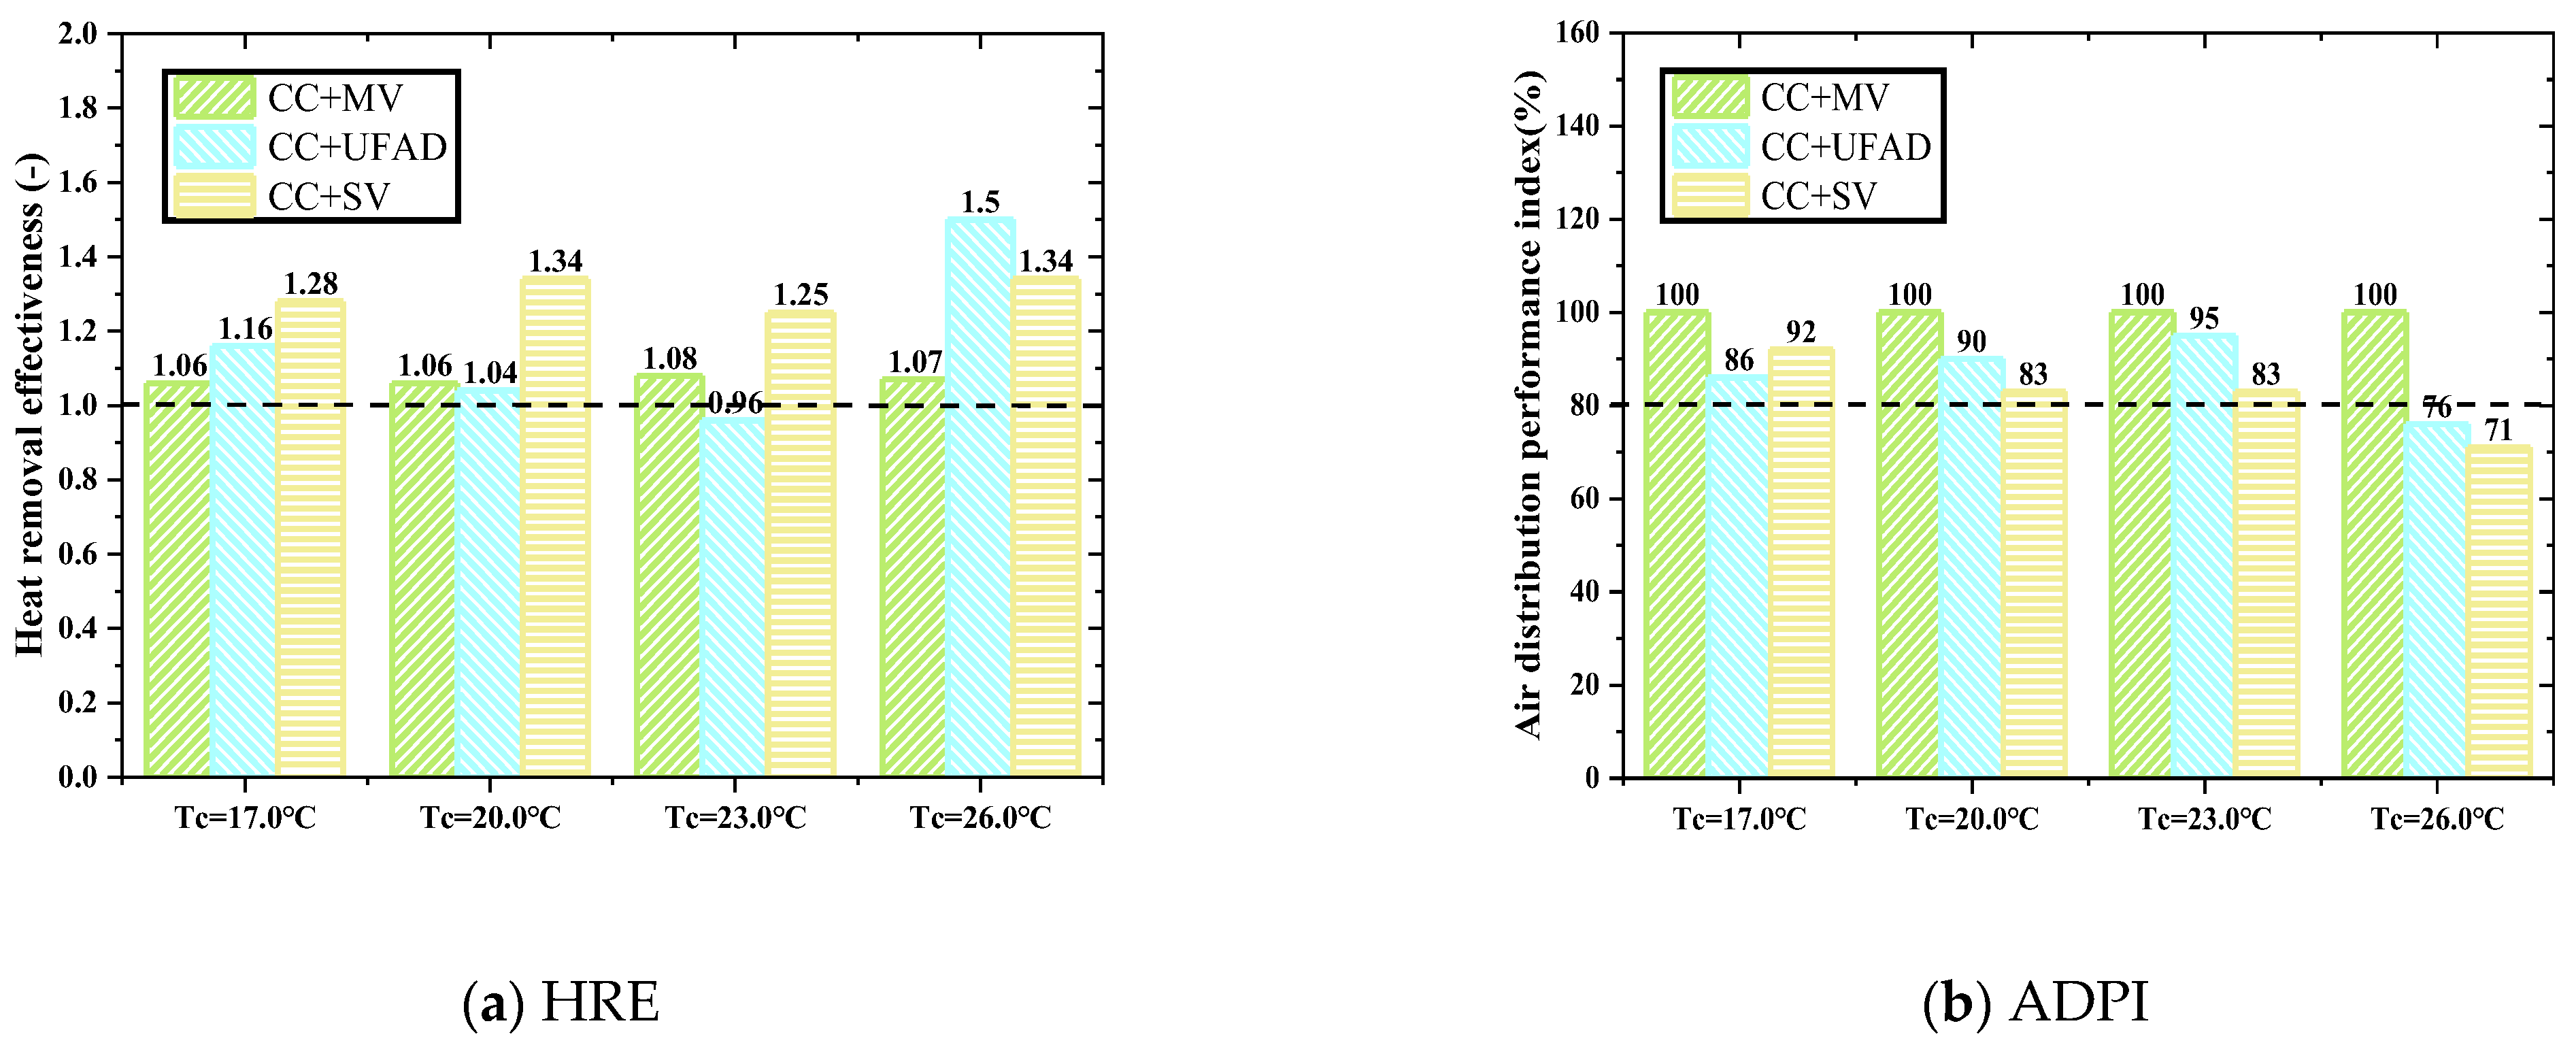
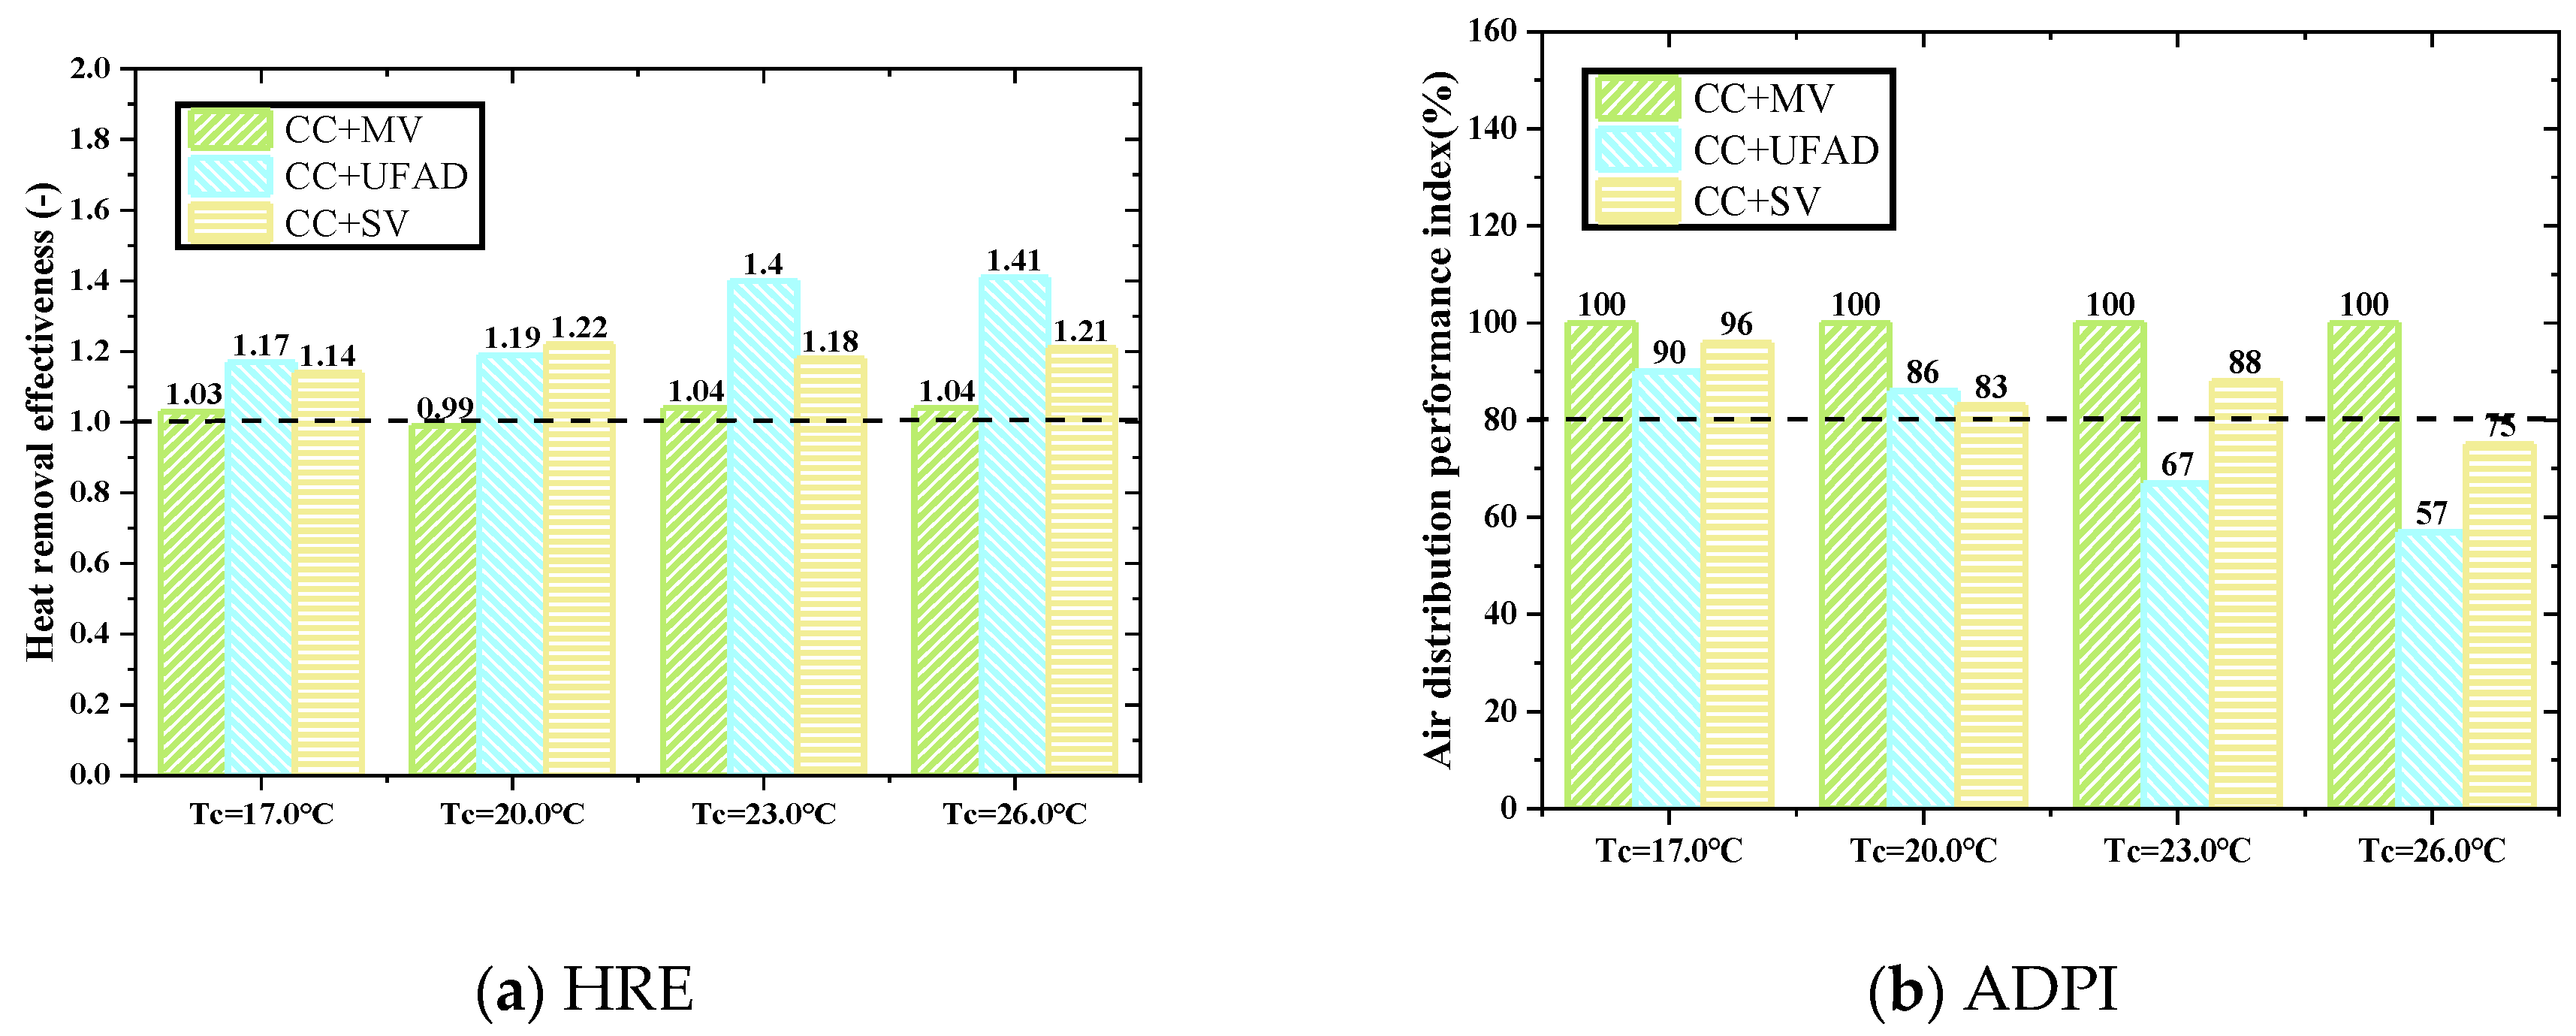
4.2. Influence of Ventilation System Type on HRE and ADPI

The calculated HRE and ADPI with different ventilation system types can be seen in Figure 11, Figure 12 and Figure 13, where the ceiling surface temperature and the internal or external cooling load were 17 °C–26 °C and 41.5 W/m2–69.5 W/m2, respectively.
As shown in Figure 11a, the calculated HREs were 0.96–1.11 with CC + MV, 0.9–1.22 with CC + UFAD and 1.11–1.22 with CC + SV as both the internal and external cooling loads were 41.5 W/m2, so only the calculated HREs with CC + SV were all higher than 1.0. This was probably because the cold air supplied by the strong horizontal air jet of SV dipped to the lower zone of the room, while the warm air gathered at the upper zone due to the thermal buoyancy, producing a better heat removal effect [62]. Figure 11b shows that the calculated ADPIs were 96–100% with CC + MV, 76–100% with CC + UFAD and 71–100% with CC + SV, so the calculated ADPIs with CC + MV were almost close to 100% and higher than the other two systems. This might be due to the fact that the top-down jet of MV allowed the supply airflow to mix well with the indoor air.
Figure 12a shows that the calculated HREs were 1.06–1.08 with CC + MV, 0.96–1.5 with CC + UFAD and 1.25–1.34 with CC + SV as the external cooling load increased from 41.5 W/m2 to 69.5 W/m2, so the CC + SV still had the highest average calculated HREs and the CC + MV had the lowest average calculated HREs among the three integrated systems. Moreover, Figure 12b shows that the calculated ADPIs were all 100% with CC + MV, 76–95% with CC + UFAD and 71–92% with CC + SV, so only the calculated ADPIs with CC + MV all reached 100% and higher than the other two systems. Moreover, the calculated ADPIs with CC + SV were almost lower compared to the other two systems, and the calculated ADPIs with CC + UFAD and CC + SV failed to meet the thermal comfort requirement of ADPI ≥ 80% when the ceiling surface temperature was equal to 26.0 °C.
Figure 13a shows that the calculated HREs were 0.99–1.04 with CC + MV, 1.17–1.41 with CC + UFAD and 1.14–1.22 with CC + SV as the internal cooling load increased from 41.5 W/m2 to 69.5 W/m2, so the CC + UFAD had the highest average calculated HREs and the CC + MV had the lowest average calculated HREs among the three integrated systems. This might be mainly because the increased internal cooling load made the effect of the thermal plume more obvious that the heat was carried to the height of the exhaust by the steady updraft and further enhanced the displacement effect of CC + UFAD [63]. Moreover, Figure 13b shows that the calculated ADPIs were all 100% with CC + MV, 57–90% with CC + UFAD and 75–96% with CC + SV, so the calculated ADPIs with CC + MV were still the highest, but the calculated ADPIs with CC + UFAD were the lowest among the three integrated systems.
Further summarizing, we could conclude that the CC + MV had the lowest HRE but the highest ADPI among the three integrated systems. Furthermore, the HRE and ADPI with CC + MV were nearly not affected by the ceiling surface temperature and the internal or external cooling load. Moreover, the CC + SV had the highest HRE but the lowest ADPI as the internal cooling load was 41.5 W/m2, and the CC + UFAD had the highest HRE but the lowest ADPI as the internal cooling load increased from 41.5 W/m2 to 69.5 W/m2. Cheng et al. [61] measured the ADPIs for MV, and they were more than 97.5% under different air supply volumes, whereas SV had a decrease in ADPIs from 90% to 72.5% due to the increased air supply flow rate, and UFAD had the lowest ADPIs under the same condition. They suggested that a too-high air supply rate may reduce the uniformity of the thermal environment with SV, and it was recommended to increase the air supply terminal to keep ADPI at a high level. Hence, the HRE and ADPI were greatly affected by the ventilation system type, and we could also find an interesting phenomenon that the low ADPI usually corresponded with high HRE, which was very consistent with the results obtained by Wu et al. [43].

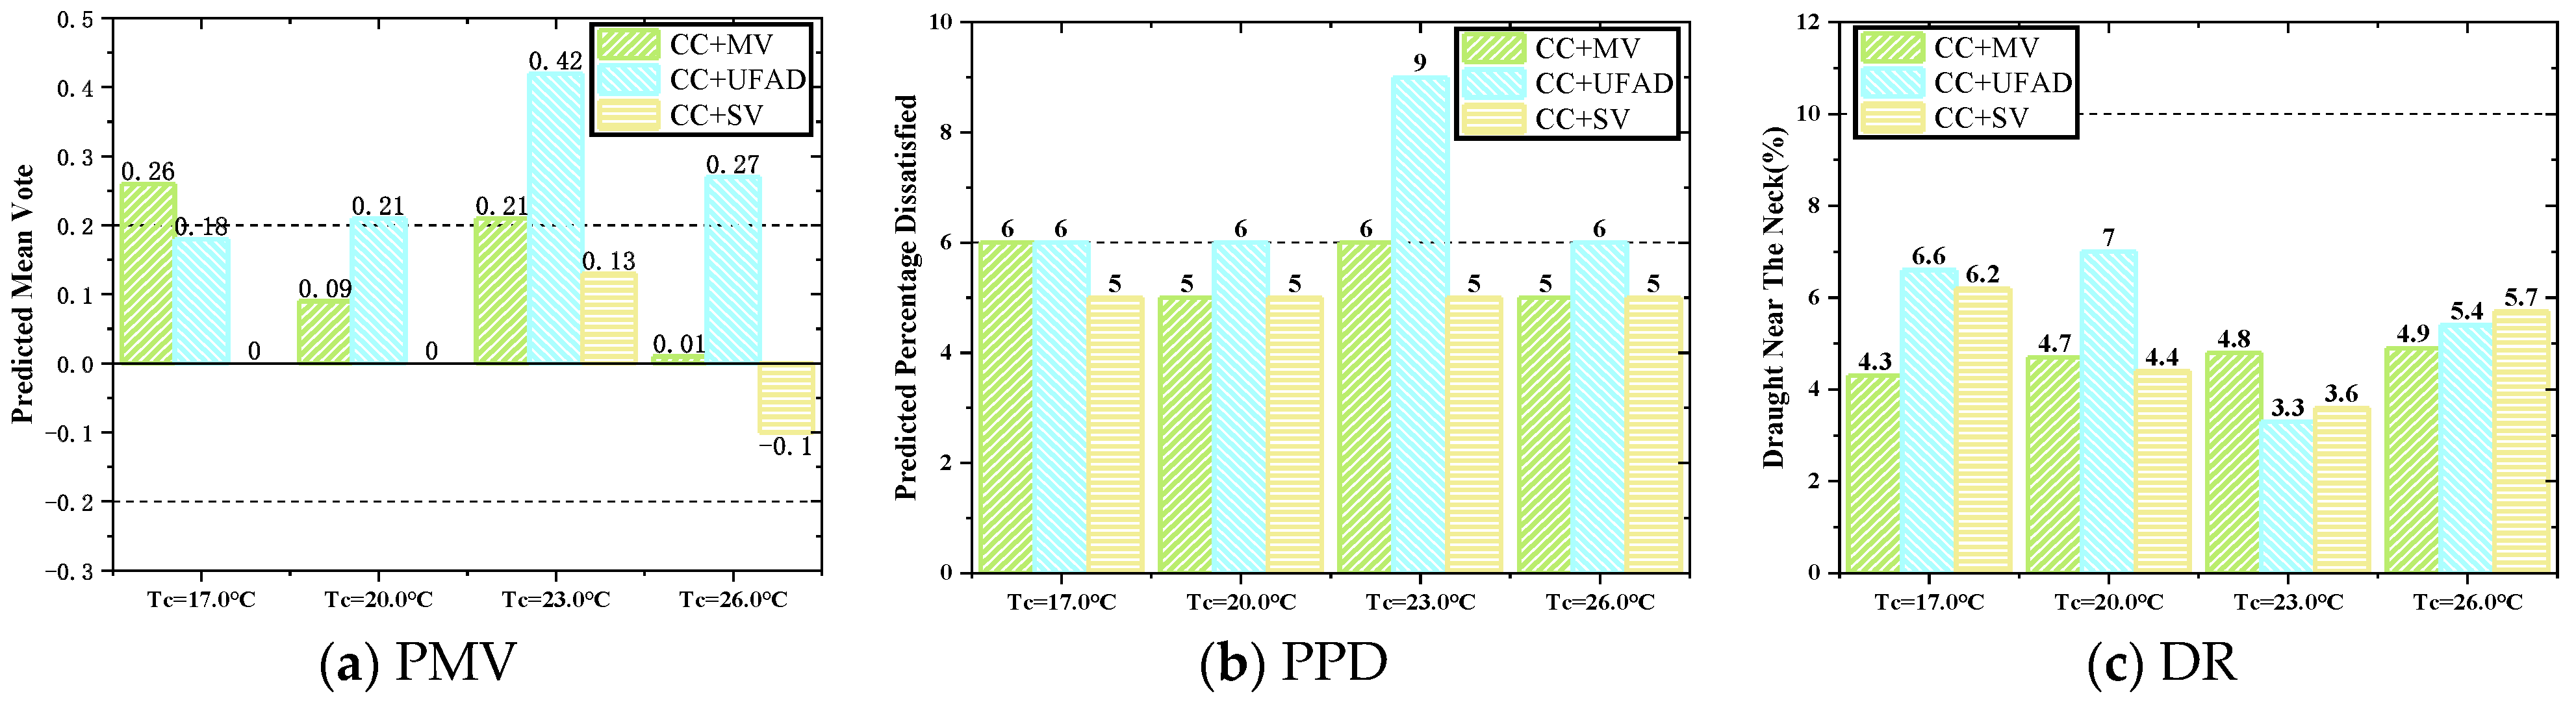
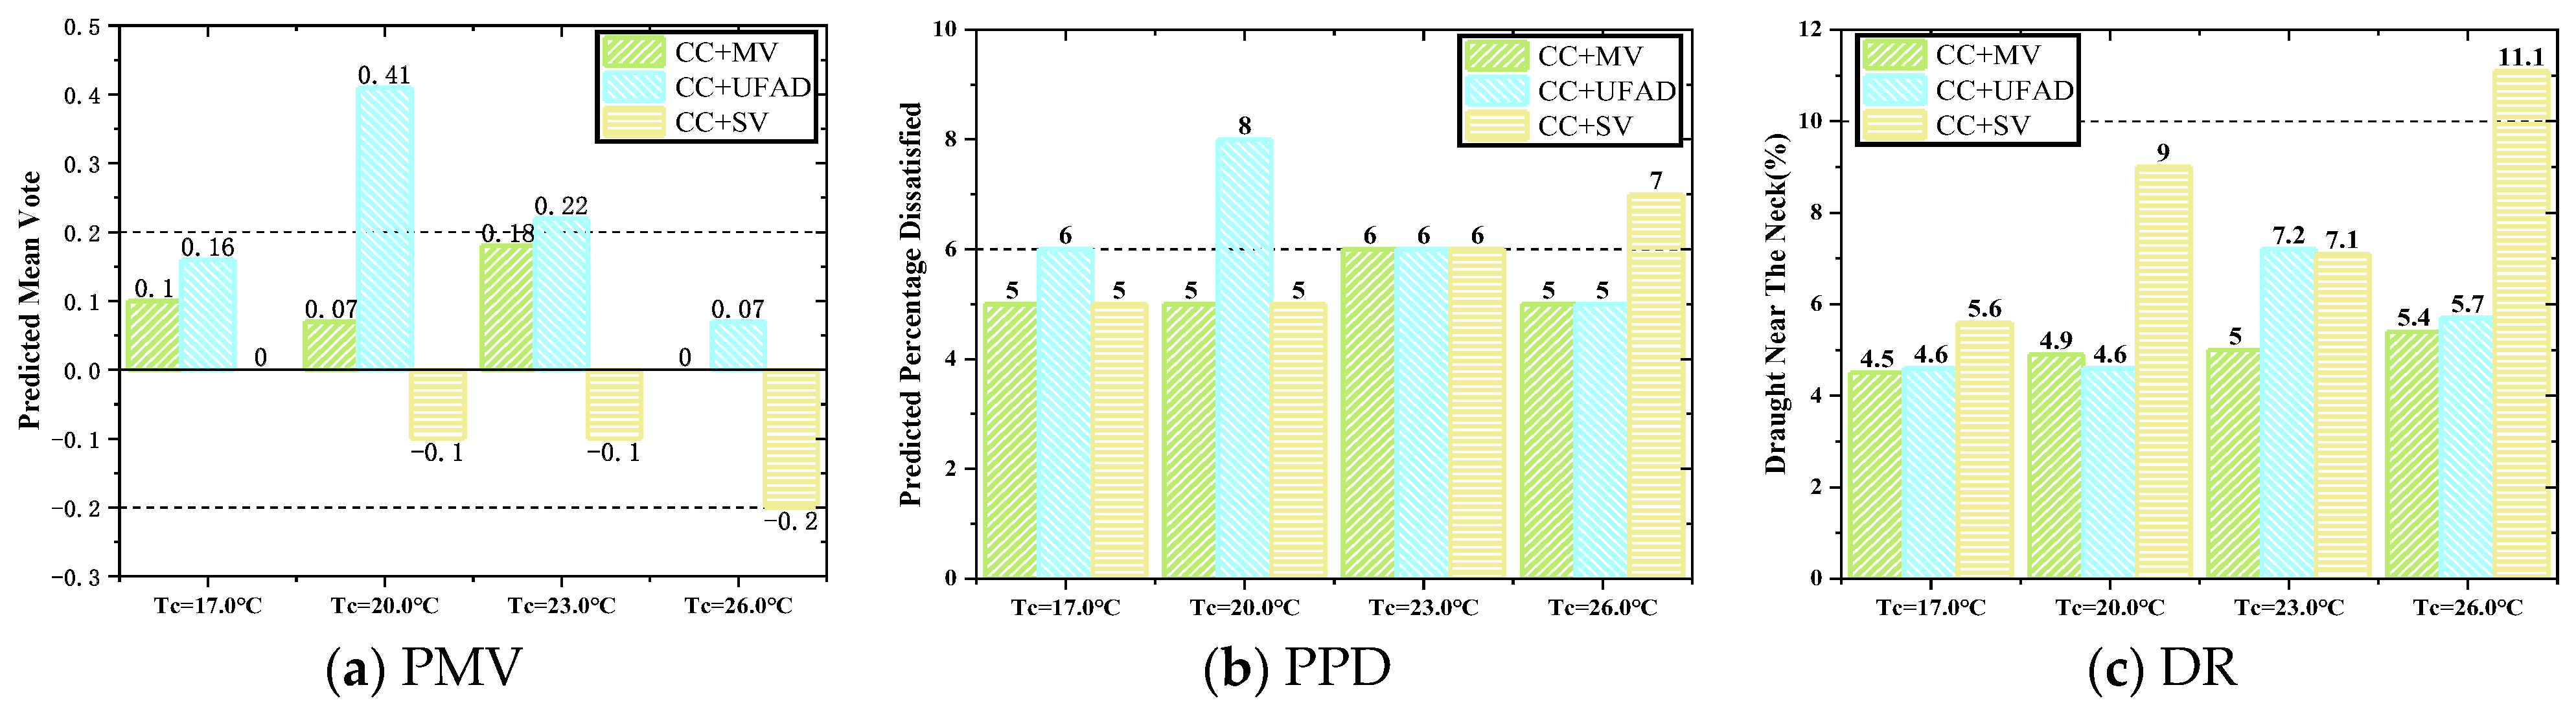
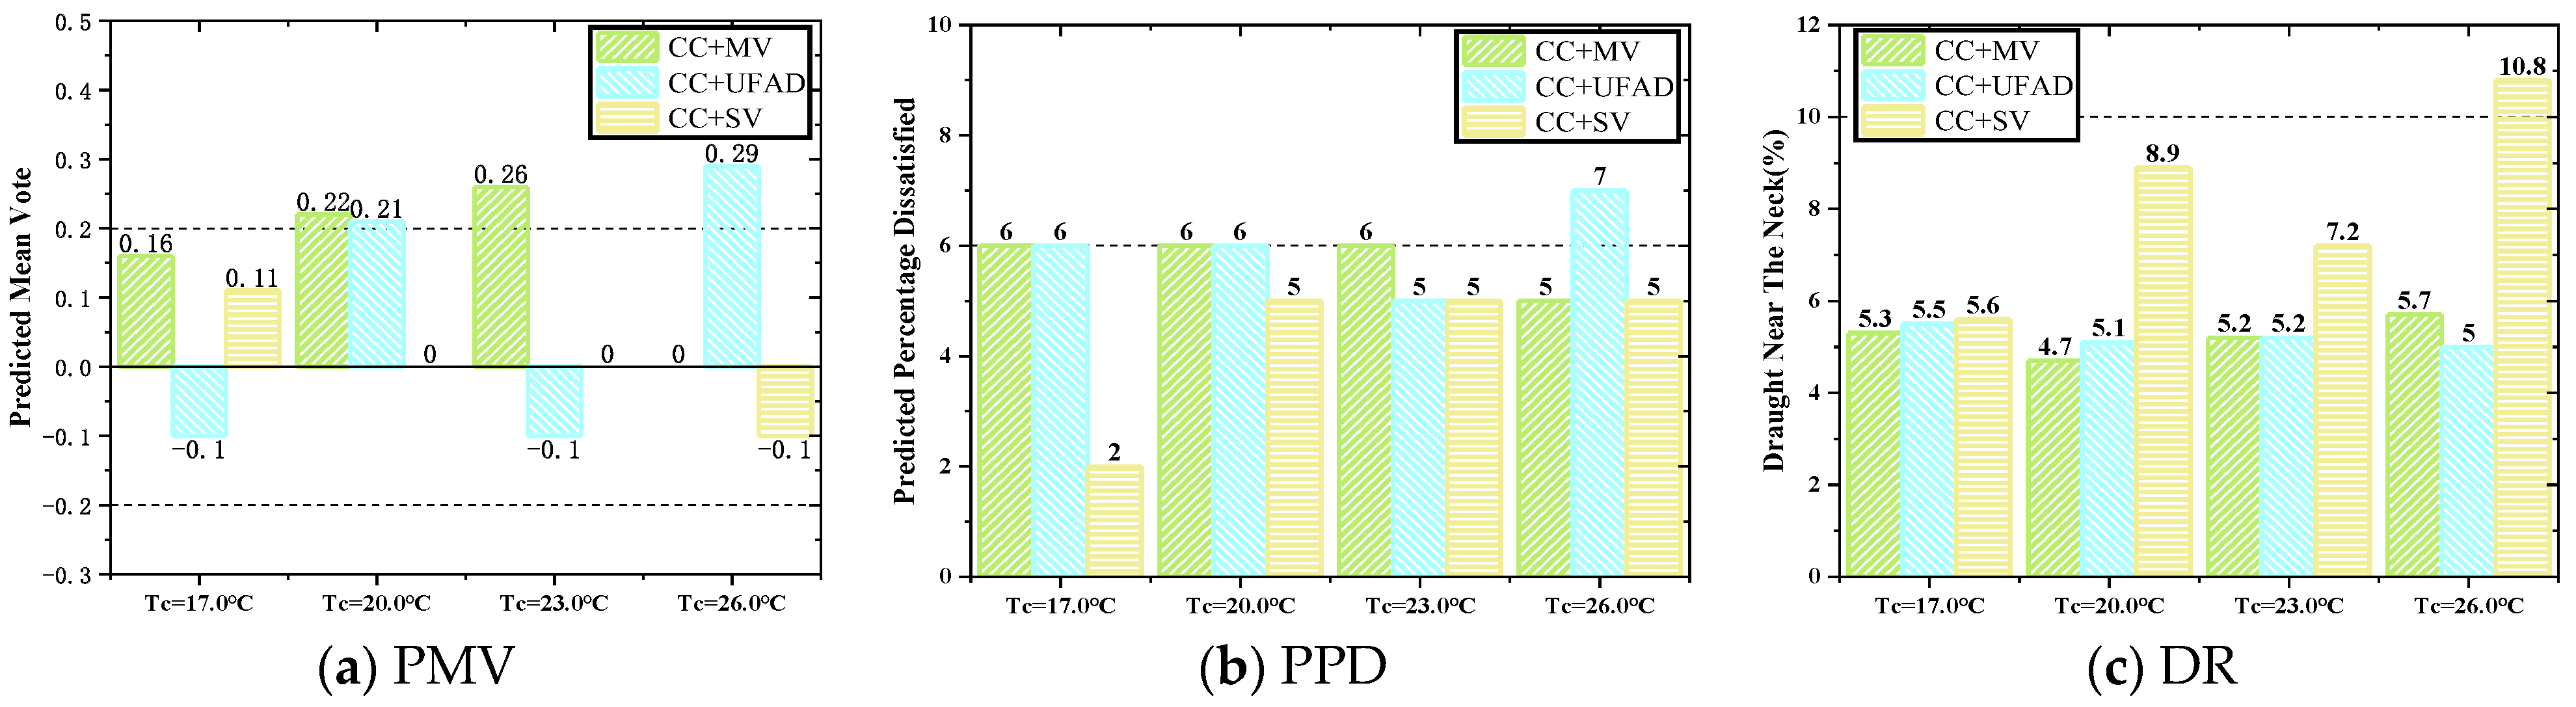
4.3. Influence of Ventilation System Type on PMV, PPD and DR

The calculated PMV, PPD and DR with different ventilation system types can be seen in Figure 14, Figure 15 and Figure 16, where the ceiling surface temperature and the internal or external cooling load were 17 °C–26 °C and 41.5 W/m2–69.5 W/m2, respectively.
As shown in Figure 14a, the calculated PMVs were 0.01–0.26 with CC + MV, 0.18–0.42 with CC + UFAD and −0.1–0.13 with CC + SV, so the CC + UFAD had the largest PMV and the CC + SV had the lowest PMV as both the internal and external cooling load were 41.5 W/m2. This may be due to the fact that the CC + UFAD had the largest differences between mean radiant temperature and air temperature among the three integrated systems, which was more inclined to cause thermal discomfort, as shown in Table 7. Moreover, the calculated PPDs and DRs with three integrated systems were almost less than 6% and 10%, respectively, which could meet the thermal environment requirement of Class A according to ISO 7730 [55].
Figure 15a shows that the calculated PMVs were between 0 and 0.18 with CC + MV, between 0.07 and 0.41 with CC + UFAD and between −0.2 and 0 with CC + SV, so the CC + UFAD still had the largest PMV and the CC + SV had the lowest PMV among the three integrated systems as the external cooling load increased from 41.5 W/m2 to 69.5 W/m2. It was still consistent with the phenomenon that high PMVs usually were accompanied by large differences between mean radiant temperature and air temperature, as seen in Table 7. Moreover, the calculated DRs with CC + SV were almost higher than the other two integrated systems and failed to meet the requirement of Class A when the ceiling surface temperature was equal to 26.0 °C.
Figure 16a shows that the calculated PMVs were from 0 to 0.26 with CC + MV, from −0.1 to 0.29 with CC + UFAD and from −0.1 to 0.11 with CC + SV, so the CC + SV had the smallest PMV among the three integrated systems as the internal cooling load increased from 41.5 W/m2 to 69.5 W/m2. Moreover, we also found that the CC + SV had the smallest differences between mean radiant temperature and air temperature when the ceiling surface temperature was 17 °C–20 °C, as seen in Table 7. The CC + UFAD had the largest difference between mean radiant temperature and air temperature as the ceiling surface temperature was 23 °C–26 °C (see Table 7), and the corresponding vertical air temperature difference was also the largest, as shown in Table 4. Furthermore, the calculated DRs with CC + SV were higher than the other two integrated systems and failed to meet the thermal environment requirement of Class A when the ceiling surface temperature was equal to 26.0 °C.
Further summarizing, we could conclude that the CC + UFAD had the largest PMV, the CC + SV had the smallest PMV, and CC + MV was in between but very close to CC + SV. This agreed with the results obtained by Wu that the thermal sensation votes with CC + UFAD were higher than those with CC + MV [50]. Moreover, the CC + SV had the highest DR as the internal or external cooling load increased from 41.5 W/m2 to 69.5 W/m2. Tian et al. [60] also proposed that the DR for SV was higher than that for MV and DV, which was mainly due to the excessive supply air momentum of SV under high air supply flow rate conditions. In addition, Corgnati et al. [46] had previously compared the DR with MV to that with CC + MV using numerical methods and found that the introduction of the CC reduced the risk of cold jets entering the occupied area, and the DR with CC + MV was lower. Moreover, the study of Lipczynska et al. [15] similarly compared the performance of DR between single MV and CC + MV and came to a similar conclusion, and further studies found that the introduction of PV in CC + MV could further reduce DR. Therefore, the PMV and DR were also clearly affected by the ventilation system type, and we found that the large PMV usually coincided with the large differences between mean radiant temperature and air temperature under the condition of a constant cooling load. It was worth mentioning additionally that Zhang et al. [47] found that after introducing DCV into the radiant ceiling system, the dissatisfied percentage was reduced from 5.86% to 0.01%, so the CC significantly reduced the thermal discomfort of the room.
In summary, we have drawn some interesting and valuable conclusions with CC + MV and CC + UFAD and also found that CC + SV conformed to the phenomenon obtained from our previous studies: that low ADPI usually corresponded with high HRE. Moreover, the other interesting new phenomenon we found was that the large PMV usually coincided with the large difference between mean radiant temperature and air temperature under the condition of a constant cooling load for the three integrated systems. Furthermore, the CC + SV had the smallest PMV among the three integrated systems, but it tended to cause higher DR due to the increased supply air flow rate. The application of the integrated CC + SV system should strictly control the supply air flow rate to avoid thermal discomfort caused by the draught. Hence, the CC + SV seems to create a more satisfactory and comfortable environment compared to CC + MV or CC + UFAD, but there is a higher draught risk.

5. Conclusions

In this paper, when the ceiling surface temperature was 17 °C–26 °C and the internal or external cooling load was 41.5 W/m2–69.5 W/m2, the full-scale experimental test was used to analyze the indoor air distribution and thermal environment characteristics in a room with CC + MV, CC + UFAD and CC + SV. Through the analysis and discussion of the experimental results, we found that the ventilation system type had a great impact on the heat removal effectiveness (HRE) and air diffusion performance index (ADPI), while it had a slight impact on the predicted mean vote of thermal sensation (PMV). The CC + MV had the lowest HRE and the highest ADPI among the three systems, and the CC + UFAD had the largest PMV, while the CC + SV had the smallest PMV. It was interestingly found that a low ADPI usually corresponded with a high HRE for different systems, and the large PMV usually coincided with a large difference between mean radiant temperature and air temperature under the condition of a constant cooling load. The indoor air distribution and thermal environment with CC + MV were stably uniform, which will be beneficial for the design and control of an HVAC system, so a ceiling cooling system integrated with a mixing ventilation system is recommended to be used in practice.

Author Contributions

Methodology, J.G., Z.T. and X.L.; Formal analysis, M.Z.; Investigation, M.Z.; Writing—original draft, H.G.; Writing—review & editing, X.W.; Supervision, J.G.; Project administration, X.W.; Funding acquisition, X.W., Z.T. and X.L. All authors have read and agreed to the published version of the manuscript.

Funding

This study was funded by the National Natural Science Foundation of China (Grant No. 52278091, 52078097 & 51978429).

Data Availability Statement

The data presented in this study are available on request from the corresponding author.

Conflicts of Interest

The authors declare no conflict of interest.

References

  1. Qian, F.; Gao, W.; Yang, Y.; Yu, D. Potential analysis of the transfer learning model in short and medium-term forecasting of building HVAC energy consumption. Energy 2020, 193, 116724. [Google Scholar] [CrossRef]
  2. Harputlugil, T.; de Wilde, P. The interaction between humans and buildings for energy efficiency: A critical review. Energy Res. Soc. Sci. 2021, 71, 101828. [Google Scholar]
  3. Schito, E.; Conti, P.; Urbanucci, L.; Testi, D. Multi-objective optimization of HVAC control in museum environment for artwork preservation, visitors’ thermal comfort and energy efficiency. Build. Environ. 2020, 180, 107018. [Google Scholar] [CrossRef]
  4. Chen, S.; Zhang, G.; Xia, X.; Setunge, S.; Shi, L. A review of internal and external influencing factors on energy efficiency design of buildings. Energy Build. 2020, 216, 109944. [Google Scholar]
  5. Franco, A.; Miserocchi, L.; Testi, D. HVAC energy saving strategies for public buildings based on heat pumps and demand controlled ventilation. Energies 2021, 14, 5541. [Google Scholar] [CrossRef]
  6. Jeong, C.H.; Yeo, M.S.; Kim, K.W. Feasibility of a radiant floor cooling system for residential buildings with massive concrete slab in a hot and humid climate. Int. J. Concr. Struct. Mater. 2018, 12, 80. [Google Scholar] [CrossRef]
  7. Zhao, K.; Liu, X.H.; Jiang, Y. On-site measured performance of a radiant floor cooling/heating system in Xi’an Xianyang International Airport. Sol. Energy 2014, 108, 274–286. [Google Scholar] [CrossRef]
  8. Wu, Y.; Sun, H.; Duan, M.; Lin, B.; Zhao, H. Dehumidification-adjustable cooling of radiant cooling terminals based on a flat heat pipe. Build. Environ. 2021, 194, 107716. [Google Scholar] [CrossRef]
  9. Yin, Y.L.; Wang, R.Z.; Zhai, X.Q.; Ishugah, T. Experimental investigation on the heat transfer performance and water condensation phenomenon of radiant cooling panels. Build. Environ. 2014, 71, 15–23. [Google Scholar] [CrossRef]
  10. Standard 55-2020; Thermal Environmental Conditions for Human Occupancy. American Society of Heating, Refrigerating and Air-Conditioning Engineers, Inc.: Atlanda, GA, USA, 2020.
  11. Rhee, K.N.; Olesen, B.W.; Kim, K.W. Ten questions about radiant heating and cooling systems. Build. Environ. 2017, 112, 367–381. [Google Scholar] [CrossRef]
  12. Karmann, C.; Schiavon, S.; Bauman, F. Thermal comfort in buildings using radiant vs. all-air systems: A critical literature review. Build. Environ. 2017, 111, 123–131. [Google Scholar] [CrossRef]
  13. Liang, Y.; Zhang, N.; Wu, H.; Xu, X.; Du, K.; Yang, J.; Sun, Q.; Dong, K.; Huang, G. Thermal environment and thermal comfort built by decoupled radiant cooling units with low radiant cooling temperature. Build. Environ. 2021, 206, 108342. [Google Scholar] [CrossRef]
  14. Tian, Z.; Yang, L.; Wu, X.; Guan, Z. A field study of occupant thermal comfort with radiant ceiling cooling and overhead air distribution system. Energy Build. 2020, 223, 109949. [Google Scholar] [CrossRef]
  15. Bayoumi, M. Method to integrate radiant cooling with hybrid ventilation to improve energy efficiency and avoid condensation in hot, humid environments. Buildings 2018, 8, 69. [Google Scholar] [CrossRef]
  16. Du, H.; Lian, Z.; Lai, D.; Duanmu, L.; Zhai, Y.; Cao, B.; Zhang, Y.; Zhou, X.; Wang, Z.; Zhang, X.; et al. Comparison of thermal comfort between radiant and convective systems using field test data from the Chinese Thermal Comfort Database. Build. Environ. 2022, 209, 108685. [Google Scholar] [CrossRef]
  17. Rhee, K.N.; Kim, K.W. A 50 year review of basic and applied research in radiant heating and cooling systems for the built environment. Build. Environ. 2015, 91, 166–190. [Google Scholar] [CrossRef]
  18. Babiak, J.; Olesen, B.W.; Petras, D. REHVA Guidebook No 7: Low Temperature Heating and High Temperature Cooling; REHVA Guidebooks; Federation of European Heating: Brussels, Belgium, 2009. [Google Scholar]
  19. Xing, D.; Li, N.; Zhang, C.; Heiselberg, P. A critical review of passive condensation prevention for radiant cooling. Build. Environ. 2021, 205, 108230. [Google Scholar] [CrossRef]
  20. Du, K.; Wu, H.; Huang, G.; Xu, X.; Liu, Y. Condensation-free radiant cooling with double-skin infrared-transparent membranes. Build. Environ. 2021, 193, 107660. [Google Scholar] [CrossRef]
  21. Koca, A.; Cetin, G. Experimental investigation on the heat transfer coefficients of radiant heating systems: Wall, ceiling and wall-ceiling integration. Energy Build. 2017, 148, 311–326. [Google Scholar] [CrossRef]
  22. Mateus, N.M.; da Graça, G.C. Simplified modeling of displacement ventilation systems with chilled ceilings. Energy Build. 2015, 108, 44–54. [Google Scholar] [CrossRef]
  23. Xie, D.; Tian, L.; Wah Yu, C.; Liao, M.; Wang, H. Indoor thermal environment due to non-steady-state radiation heat transfer of a capillary ceiling radiation cooling system. Indoor Built Environ. 2019, 28, 443–453. [Google Scholar] [CrossRef]
  24. Shin, M.S.; Rhee, K.N.; Park, S.H.; Yeo, M.S.; Kim, K.W. Enhancement of cooling capacity through open-type installation of cooling radiant ceiling panel systems. Build. Environ. 2019, 148, 417–432. [Google Scholar] [CrossRef]
  25. Cao, G.; Awbi, H.; Yao, R.; Fan, Y.; Sirén, K.; Kosonen, R.; Zhang, J. A review of the performance of different ventilation and airflow distribution systems in buildings. Build. Environ. 2014, 73, 171–186. [Google Scholar] [CrossRef]
  26. Yang, B.; Melikov, A.K.; Kabanshi, A.; Zhang, C.; Bauman, F.S.; Cao, G.; Awbi, H.; Wigö, H.; Niu, J.; Cheong, K.W.D.; et al. A review of advanced air distribution methods-theory, practice, limitations and solutions. Energy Build. 2019, 202, 109359. [Google Scholar] [CrossRef]
  27. Müller, D.; Kandzia, C.; Kosonen, R.; Melikov, A.K.; Nielsen, P.V. Mixing Ventilation Distribution Design, No. 19 REHVAC; REHVA Guidebooks; Federation of European Heating: Brussels, Belgium, 2013. [Google Scholar]
  28. Niu, B.; Shi, M.; Zhang, Z.; Li, Y.; Cao, Y.; Pan, S. Multi-objective optimization of supply air jet enhancing airflow uniformity in data center with Taguchi-based grey relational analysis. Build. Environ. 2022, 208, 108606. [Google Scholar] [CrossRef]
  29. Su, W.; Yang, B.; Melikov, A.; Liang, C.; Lu, Y.; Wang, F.; Li, A.; Lin, Z.; Li, X.; Cao, G.; et al. Infection probability under different air distribution patterns. Build. Environ. 2022, 207, 108555. [Google Scholar] [CrossRef]
  30. Lin, Z.; Chow, T.T.; Tsang, C.F.; Fong, K.; Chan, L. Stratum ventilation—A potential solution to elevated indoor temperatures. Build. Environ. 2009, 44, 2256–2269. [Google Scholar] [CrossRef]
  31. Zhang, C.; Yu, T.; Heiselberg, P.K.; Pominaowski, M.; Nielsen, P.V. Diffuse Ceiling Ventilation—Design Guide; Aalborg Universitet: Aalborg, Denmark, 2016. [Google Scholar]
  32. Bean, R.; ArchD, K.W.K. Part 1: History of radiant heating & cooling systems. ASHRAE J. 2010, 52, 40. [Google Scholar]
  33. Bean, R.; ArchD, K.W.K. Part 2: History of radiant heating & cooling systems. ASHRAE J. 2010, 52, 50. [Google Scholar]
  34. Chen, W.; Yin, Y.; Zhao, X.; Xu, G.; Cao, B.; Ji, Q. Experimental investigation on condensation characteristics of a novel radiant terminal based on sepiolite composite humidity-conditioning coating. Build. Environ. 2022, 223, 109488. [Google Scholar] [CrossRef]
  35. Zhao, W.; Kilpeläinen, S.; Kosonen, R.; Jokisalo, J.; Lestinen, S.; Mustakallio, P. Thermal environment and ventilation efficiency in a simulated office room with personalized micro-environment and fully mixed ventilation systems. Build. Environ. 2021, 188, 107445. [Google Scholar] [CrossRef]
  36. Zhang, C.; Pomianowski, M.; Heiselberg, P.K.; Yu, T. A review of integrated radiant heating/cooling with ventilation systems-Thermal comfort and indoor air quality. Energy Build. 2020, 233, 110094. [Google Scholar] [CrossRef]
  37. Mustakallio, P.; Bolashikov, Z.; Rezgals, L.; Lipczynska, A.; Melikov, A.; Kosonen, R. Thermal environment in a simulated double office room with convective and radiant cooling systems. Build. Environ. 2017, 123, 88–100. [Google Scholar] [CrossRef]
  38. Wu, X.; Gao, J.; Lv, P. Impact of chilled ceiling on indoor air distribution in a room with mixing ventilation. Sci. Technol. Built Environ. 2020, 26, 366–376. [Google Scholar] [CrossRef]
  39. Wu, X.; Wang, H.; Gao, J.; Wang, F. Influence of sensible cooling load on indoor air distribution in an office room with ceiling cooling and mixing ventilation. Indoor Built Environ. 2021, 30, 957–969. [Google Scholar] [CrossRef]
  40. Rees, S.J.; Haves, P. An experimental study of air flow and temperature distribution in a room with displacement ventilation and a chilled ceiling. Build. Environ. 2013, 59, 358–368. [Google Scholar] [CrossRef]
  41. Niu, J.; Kooi, J.V.D. Indoor climate in rooms with cooled ceiling systems. Build. Environ. 1994, 29, 283–290. [Google Scholar] [CrossRef]
  42. Gao, J.; Wang, H.; Wu, X.; Wang, F.; Tian, Z. Indoor air distribution in a room with underfloor air distribution and chilled ceiling: Effect of ceiling surface temperature and supply air velocity. Indoor Built Environ. 2020, 29, 151–162. [Google Scholar] [CrossRef]
  43. Wu, X.; Gao, J.; Wang, H.; Wang, F.; Tian, Z. Impact of Chilled Ceiling in a High Sensible Cooling Load Room with Underfloor Air Distribution. Sci. Technol. Built Environ. 2019, 25, 705–715. [Google Scholar] [CrossRef]
  44. Jeong, J.W.; Mumma, S.A. Ceiling radiant cooling panel capacity enhanced by mixed convection in mechanically ventilated spaces. Appl. Therm. Eng. 2003, 23, 2293–2306. [Google Scholar] [CrossRef]
  45. Loveday, D.L.; Parsons, K.C.; Taki, A.H. Designing for thermal comfort in combined chilled ceiling/displacement ventilation environments. ASHRAE Trans. 1998, 104, 901–910. [Google Scholar]
  46. Corgnati, S.P.; Perino, M.; Fracastoro, G.V.; Nielsen, P. Experimental and numerical analysis of air and radiant cooling systems in offices. Build. Environ. 2009, 44, 801–806. [Google Scholar] [CrossRef]
  47. Zhang, C.; Heiselberg, P.K.; Pomianowski, M.; Yu, T.; Jensen, R.L. Experimental study of diffuse ceiling ventilation coupled with a thermally activated building construction in an office room. Energy Build. 2015, 105, 60–70. [Google Scholar] [CrossRef]
  48. Behne, M. Indoor air quality in rooms with cooled ceilings: Mixing ventilation or rather displacement ventilation? Energy Build. 1999, 30, 155–166. [Google Scholar] [CrossRef]
  49. Schiavon, S.; Bauman, F.S.; Tully, B.; Rimmer, J. Chilled ceiling and displacement ventilation system: Laboratory study with high cooling load. Sci. Technol. Built Environ. 2015, 21, 944–956. [Google Scholar] [CrossRef]
  50. Wu, X.; Liu, G.; Gao, J.; Wu, S. Impact of ventilation system type on indoor thermal environment and human thermal comfort in a ceiling cooling room. Thermal Sci. 2021, 26, 3271–3284. [Google Scholar] [CrossRef]
  51. Zhu, H. Research on a New Air-Conditioning System with Dedicated Outdoor Air System and Ceiling Radiant Cooling Panels; Nanjing University of Science and Technology: Nanjing, China, 2009. [Google Scholar]
  52. Zhang, D.; Huang, X.; Gao, D.; Cui, X.; Cai, N. Experimental study on control performance comparison between model predictive control and proportion-integral-derivative control for radiant ceiling cooling integrated with underfloor ventilation system. Appl. Therm. Eng. 2018, 143, 130–136. [Google Scholar] [CrossRef]
  53. Liu, J.; Li, Z.; Kim, M.K.; Zhu, S.; Zhang, L.; Srebric, J. A comparison of the thermal comfort performances of a radiation floor cooling system when combined with a range of ventilation systems. Indoor Built Environ. 2020, 29, 527–542. [Google Scholar] [CrossRef]
  54. Novoselac, A.; Srebric, J. A critical review on the performance and design of combined cooled ceiling and displacement ventilation systems. Energy Build. 2002, 34, 497–509. [Google Scholar] [CrossRef]
  55. ISO 7730:2005; Ergonomics of the Thermal Environment—Analytical Determination and Interpretation of Thermal Comfort Using Calculation of the PMV and PPD Indices and Local Thermal Comfort Criteria. European Committee for Standardization (CEN): Brussels, Belgium, 2005.
  56. Wu, Y.; Mustakallio, P.; Kosonen, R.; Kaukola, T.; Chen, J.; Liu, H.; Li, B. Experimental study of five different VAV air terminal devices under variable heat gain conditions in simulated office and meeting rooms. Build. Environ. 2022, 209, 108641. [Google Scholar] [CrossRef]
  57. Zhang, T.; Zhang, Y.; Li, A.; Gao, Y.; Rao, Y.; Zhao, Q. Study on the kinetic characteristics of indoor air pollutants removal by ventilation. Build. Environ. 2022, 207, 108535. [Google Scholar] [CrossRef]
  58. Li, J.; Li, A.; Hou, Y.; Zhang, C.; Yang, C.; Zhang, X.; Che, J.; Guo, J. Air distribution and thermal environment optimization on subway platform using an innovative attached ventilation mode. Build. Environ. 2021, 204, 108226. [Google Scholar] [CrossRef]
  59. Zhang, S.; Niu, D.; Li, T.; Lin, Z.; Cheng, F.; Cheng, Y. Cooling effect of air movement on heating performances of advanced air distribution. Build. Environ. 2022, 226, 109775. [Google Scholar] [CrossRef]
  60. Tian, X.; Li, B.; Ma, Y.; Liu, D.; Li, Y.; Cheng, Y. Experimental study of local thermal comfort and ventilation performance for mixing, displacement and stratum ventilation in an office. Sustain. Cities Soc. 2019, 50, 101630. [Google Scholar] [CrossRef]
  61. Cheng, Y.; Lin, Z. Experimental study of airflow characteristics of stratum ventilation in a multi-occupant room with comparison to mixing ventilation and displacement ventilation. Indoor Air 2015, 25, 662–671. [Google Scholar] [CrossRef]
  62. Huan, C.; Wang, F.H.; Lin, Z.; Wu, X.; Ma, Z.; Wang, Z.; Zhang, L. An experimental investigation into stratum ventilation for the cooling of an office with asymmetrically distributed heat gains. Build. Environ. 2016, 110, 76–88. [Google Scholar] [CrossRef]
  63. Magnier, L.; Zmeureanu, R.; Derome, D. Experimental assessment of the velocity and temperature distribution in an indoor displacement ventilation jet. Build. Environ. 2012, 47, 150–160. [Google Scholar] [CrossRef]
  64. Xie, D.; Wang, C.; Yu, C.W.; Wang, Y.; Wang, H. Performance of capillary ceiling cooling panel on ceiling surface temperature and indoor thermal environment. Indoor Built Environ. 2020, 29, 881–894. [Google Scholar] [CrossRef]
  65. Tian, L.; Lin, Z.; Wang, Q. Comparison of gaseous contaminant diffusion under stratum ventilation and under displacement ventilation. Build. Environ. 2010, 45, 2035–2046. [Google Scholar] [CrossRef]
Figure 1. Test room. (a) Sketch map; (b) Real picture.
Buildings 13 02354 g001
Figure 2. Schematic diagrams of radiant panel and ventilation system terminals. (a) Radiant panel; (b) Supply and exhaust terminal.
Buildings 13 02354 g002
Figure 3. Measuring lines. (a) Plan view; (b) Isometric view.
Buildings 13 02354 g003
Figure 4. Vertical air temperature profiles.
Buildings 13 02354 g004
Figure 5. Vertical air velocity profiles.
Buildings 13 02354 g005
Figure 6. Vertical CO2 concentration profiles.
Buildings 13 02354 g006
Figure 7. The average surface temperature of building envelopes.
Buildings 13 02354 g007
Figure 8. Vertical distributions of normalized air temperature.
Buildings 13 02354 g008
Figure 9. Vertical distributions of indoor air velocity.
Buildings 13 02354 g009
Figure 10. Vertical distributions of normalized CO2 concentration.
Buildings 13 02354 g010
Figure 11. Calculated HRE and ADPI when Qin = 41.5 W/m2 and Qew = 41.5 W/m2.
Buildings 13 02354 g011
Figure 12. Calculated HRE and ADPI when Qin = 41.5 W/m2 and Qew = 69.5 W/m2.
Buildings 13 02354 g012
Figure 13. Calculated HRE and ADPI when Qin = 69.5 W/m2 and Qew = 41.5 W/m2.
Buildings 13 02354 g013
Figure 14. Calculated PMV, PPD and DR when Qin = 41.5 W/m2 and Qew = 41.5 W/m2.
Buildings 13 02354 g014
Figure 15. Calculated PMV, PPD and DR when Qin = 41.5 W/m2 and Qew = 69.5 W/m2.
Buildings 13 02354 g015
Figure 16. Calculated PMV, PPD and DR when Qin = 69.5 W/m2 and Qew = 41.5 W/m2.
Buildings 13 02354 g016
Table 1. The power of internal and external heat sources.
CasesInternal Cooling LoadExternal Cooling Load
Thermal Dummies
Q1/W/m2
Computers
Q2/W/m2
Ceiling Lamps
Q3/W/m2
Total
Qin/W/m2
Electric Heating Film
Qex/W/m2
1–415.512.513.541.541.5
5–815.512.513.541.569.5
9–1231.025.013.569.541.5
Table 2. Measuring instruments.
InstrumentParametersRangeAccuracy
Swema 03Air temperature10~40 °C±0.1 °C
Air velocity0.01~1.0 m/s±0.04 m/s
TES 1370CO2 concentration0~6000 ppm±5% ppm
AT 4320Wall surface temperature−200~1300 °C±0.1 °C
Table 3. Test conditions.
CaseNominal Reference Air
Temperature
Ta/°C
Nominal Ceiling Surface
Temperature
Tc/°C
Nominal Supply Air
Temperatures/°C
Internal Cooling Load
Qin/W/m2
External Cooling Load
Qex/W/m2
MVUFADSV
126.017.022.024.025.041.541.5
226.020.019.024.023.041.541.5
326.023.019.021.020.041.541.5
426.026.016.021.020.041.541.5
526.017.019.021.023.041.569.5
626.020.019.021.023.041.569.5
726.023.019.021.020.041.569.5
826.026.016.018.020.041.569.5
926.017.019.021.023.069.541.5
1026.020.019.021.023.069.541.5
1126.023.019.018.020.069.541.5
1226.026.016.018.020.069.541.5
Table 4. Calculation results of local vertical air temperature difference (°C).
CasesCeiling Surface
Temperature (°C)
CC + MVCC + UFADCC + SV
MeanMinMaxMeanMinMaxMeanMinMax
117.00.2−0.10.70.3−0.41.00.60.31.3
220.00.3−0.10.70.2−0.20.80.6−0.21.2
323.00.3−0.30.70.90.41.20.9−1.11.5
426.00.40.10.70.50.20.90.6−1.01.1
517.00.3−0.20.80.3−0.80.90.40.01.1
620.00.2−0.40.70.2−0.90.80.4−0.60.9
723.00.3−0.30.70.0−1.20.60.5−1.01.3
826.00.3−0.10.80.9−0.51.60.4−1.50.9
917.00.4−0.10.80.4−0.51.10.6−0.41.5
1020.00.40.00.80.5−0.51.10.5−0.51.4
1123.00.3−0.10.71.20.01.80.5−0.91.3
1226.00.4−0.10.81.2−0.31.80.3−1.21.1
Table 5. Calculation results of local turbulence intensity (%).
CasesCeiling Surface
Temperature (°C)
CC + MVCC + UFADCC + SV
MeanMinMaxMeanMinMaxMeanMinMax
117.0341849403356352649
220.0271546382746311753
323.03225373556424547
426.030185234254431648
517.0312443332246402658
620.0321944433251372550
723.0331846382761321254
826.0322149402473403353
917.034235332213837961
1020.0311747362849382770
1123.029194028546343040
1226.0331845271240342839
Table 6. Calculation results of local contaminant removal effectiveness (-).
CasesCeiling Surface
Temperature (°C)
CC + MVCC + UFADCC + SV
MeanMinMaxMeanMinMaxMeanMinMax
117.00.820.750.961.191.031.370.750.690.84
220.00.850.810.91.111.051.160.720.630.78
323.00.610.560.650.850.730.960.600.540.71
426.00.620.60.671.000.931.130.670.520.75
517.00.640.610.691.251.051.710.650.610.69
620.00.530.480.580.960.561.180.690.560.78
723.00.600.570.631.040.901.540.500.350.58
826.00.610.580.660.680.600.770.710.600.78
917.00.720.680.740.920.771.110.800.730.88
1020.00.770.740.81.000.901.150.820.600.94
1123.00.720.690.771.131.101.20.830.750.88
1226.00.730.690.780.680.640.790.670.610.75
Table 7. Calculation results of mean radiant temperature and air temperature (°C).
CasesCeiling Surface
Temperature (°C)
CC + MVCC + UFADCC + SV
trtatr-tatrtatr-tatrtatr-ta
117.026.526.5026.726.20.525.425.5−0.1
220.026.125.80.326.526.6−0.125.625.40.2
323.026.726.20.527.126.40.72625.80.2
426.02625.50.527.126.30.825.825.30.5
517.026.1260.126.325.70.625.625.60
620.026.225.90.327.326.3126.2260.2
723.026.726.20.527.126.30.82625.30.7
826.025.925.40.526.824.91.926.225.50.7
917.026.726.10.625.624.70.926.125.90.2
1020.026.926.10.826.825.71.126.526.20.3
1123.027.126.40.726.324.41.926.625.70.9
1226.026.325.40.927.625.42.226.625.80.8
Disclaimer/Publisher’s Note: The statements, opinions and data contained in all publications are solely those of the individual author(s) and contributor(s) and not of MDPI and/or the editor(s). MDPI and/or the editor(s) disclaim responsibility for any injury to people or property resulting from any ideas, methods, instructions or products referred to in the content.

