
Impacts of Rooftop Photovoltaics on the Urban Thermal Microclimate: Metrological Investigations

Chair of Building Technology and Climate Responsive Design, School of Engineering and Design, Technical University of Munich, 80333 Munich, Germany
*
Author to whom correspondence should be addressed.
Buildings 2023, 13(9), 2339; https://doi.org/10.3390/buildings13092339
Submission received: 24 August 2023
/
Revised: 8 September 2023
/
Accepted: 11 September 2023
/
Published: 14 September 2023
(This article belongs to the Special Issue Renewable Energy in Buildings)
Abstract
:Ambitious climate protection requires decentralized renewable energy production via building-related photovoltaics in cities. However, cities are also subject to the Urban Heat Island effect, which negatively impacts human health. In this context, the installation of PV modules in urban areas raises the question of how the energy-active building component affects its surrounding thermal microclimate. The topic is approached with a novel, twofold methodology: First, a horizontal ambient air temperature profile above a rooftop PV installation and the analysis of surface temperatures provide primal indications of the impacts of PV on the thermal microclimate. Secondly, establishing energy balances allows us to retrace the energy fluxes. The data required for the comparative analyses are gathered through metrological investigations of two rooftops with and without PVs in Munich, Germany. The results of the investigation show a daytime heating effect of photovoltaics on the ambient air temperature of up to +1.35 K and a nighttime cooling effect of up to −1.19 K. Cumulated daily, the daytime heating effect exceeds the impact of the nighttime cooling. The main driver of the heating and cooling is the additional convective heat transfer from the PV modules. However, the impacts of the PV modules are marginal and restricted to their direct surroundings.
1. Introduction
Climate change has led to the establishment of global, national and local climate protection goals to reduce global warming to a minimum. These goals, in particular the reduction of CO2 emissions, can only be achieved when increasing the share of renewable energies. In urban areas, solar energy is the largest renewable energy source that can flexibly be exploited by applying photovoltaic modules on building facades and rooftops. Thereby, buildings’ overall energy performance can be improved and CO2 emissions decreased [1,2]. While cities are critical contributors to climate change, they are simultaneously suffering from its consequences: enhanced anthropogenic emissions, lack of greenery, reduced wind velocities due to urban geometry, lower surface albedo and higher surface roughness as well as higher thermal storage leading to heat accumulation in cities and hence to a difference in ambient air temperature between urban and rural areas–the Urban Heat Island (UHI) effect [3,4,5,6]. Climate change as well as the increasing urban population will further foster the UHI effect, leading to intensified heat-related stress, increased mortality rates and morbidity in older people, and limited sleep recovery due to reduced night-time cooling [7]. Even though photovoltaics are generally considered a technology that increases the UHI effect, it is not fully understood whether photovoltaic modules might rather have a cooling effect on the surrounding thermal microclimate, hence contributing to climate mitigation [8,9].
The application of photovoltaic modules on building envelopes alters the thermal energy balance of the surroundings via several effects [8,10,11,12]: The lower albedo in comparison to conventional building envelopes increases the share of absorbed radiation. Part of the absorbed radiation is converted into electrical energy, hence reducing PV module temperatures and consequently upwelling longwave radiation. Moreover, due to their lower heat storage capacity, PV modules rapidly heat up and release the stored heat faster than conventional building materials. Additionally, the installation of PV arrays adds a further layer to the energy balance that dissipates heat upwards and downwards via radiation and convection. The additional layer also provides shading and lowers the sky view factor of the surface beneath them, thus reducing nighttime cooling.
The topic has only recently gained importance in urban planning practices, and the theoretical assumptions have been investigated in few simulation-based and experimental studies [8,9]. Generally, the simulation-based studies (in urban environments) have identified a cooling effect of the PV modules on their surrounding thermal microclimate [13,14,15], while metrological studies (in rural environments) have instead measured slight daytime heating effects [10,16,17,18]. In most of the studies, only surface, mean radiant and ambient air temperatures are analyzed [10,14,18,19,20,21,22]. However, the temperature differences are marginal, and the results might be blurred due to simulation simplifications and measurement inaccuracies. Hence, some studies have established energy balances to gain insights into the physical processes leading to the temperature differences and to retrace the single radiative and non-radiative energy fluxes [16,17,23,24]. Only a few of these studies, however, have recently considered the downward convective heat transfer from the PV modules [23,25], while neglecting to consider it likely leads to an underestimation of convective heat transfer processes in the majority of studies.
Until now, there is no general evaluation of the thermal impact of urban rooftop PV installations on their surroundings. This research gap leads to the question, how do photovoltaic installations on urban rooftops impact the surrounding thermal microclimate in summer?
To comprehensively answer the research question and to find differentiated results for the most relevant PV application in urban surroundings, a twofold methodology has been developed. First, ambient air and surface temperatures are analyzed. Secondly, radiation and energy balances for an extensive green roof as a reference and an extensive green roof with photovoltaic installation are established, allowing the comparison of both roofs’ radiative and non-radiative energy fluxes. The data required for the temperature analyses and energy balances are gathered via metrological investigations on two rooftops of residential buildings in Munich, Germany, during the summer and autumn of 2022, hence representing the first measurement-based study at real-world scale in an urban environment. The combination of two methodological approaches allows us to bridge the deficiencies of existing studies. As nighttime recovery is significant for human health [7], the evaluation of the measurement results also accounts for nocturnal periods. Synergies between photovoltaics and greenery, such as additional photovoltaic yield or increased plant growth, are excluded from the present research.
2. Methods
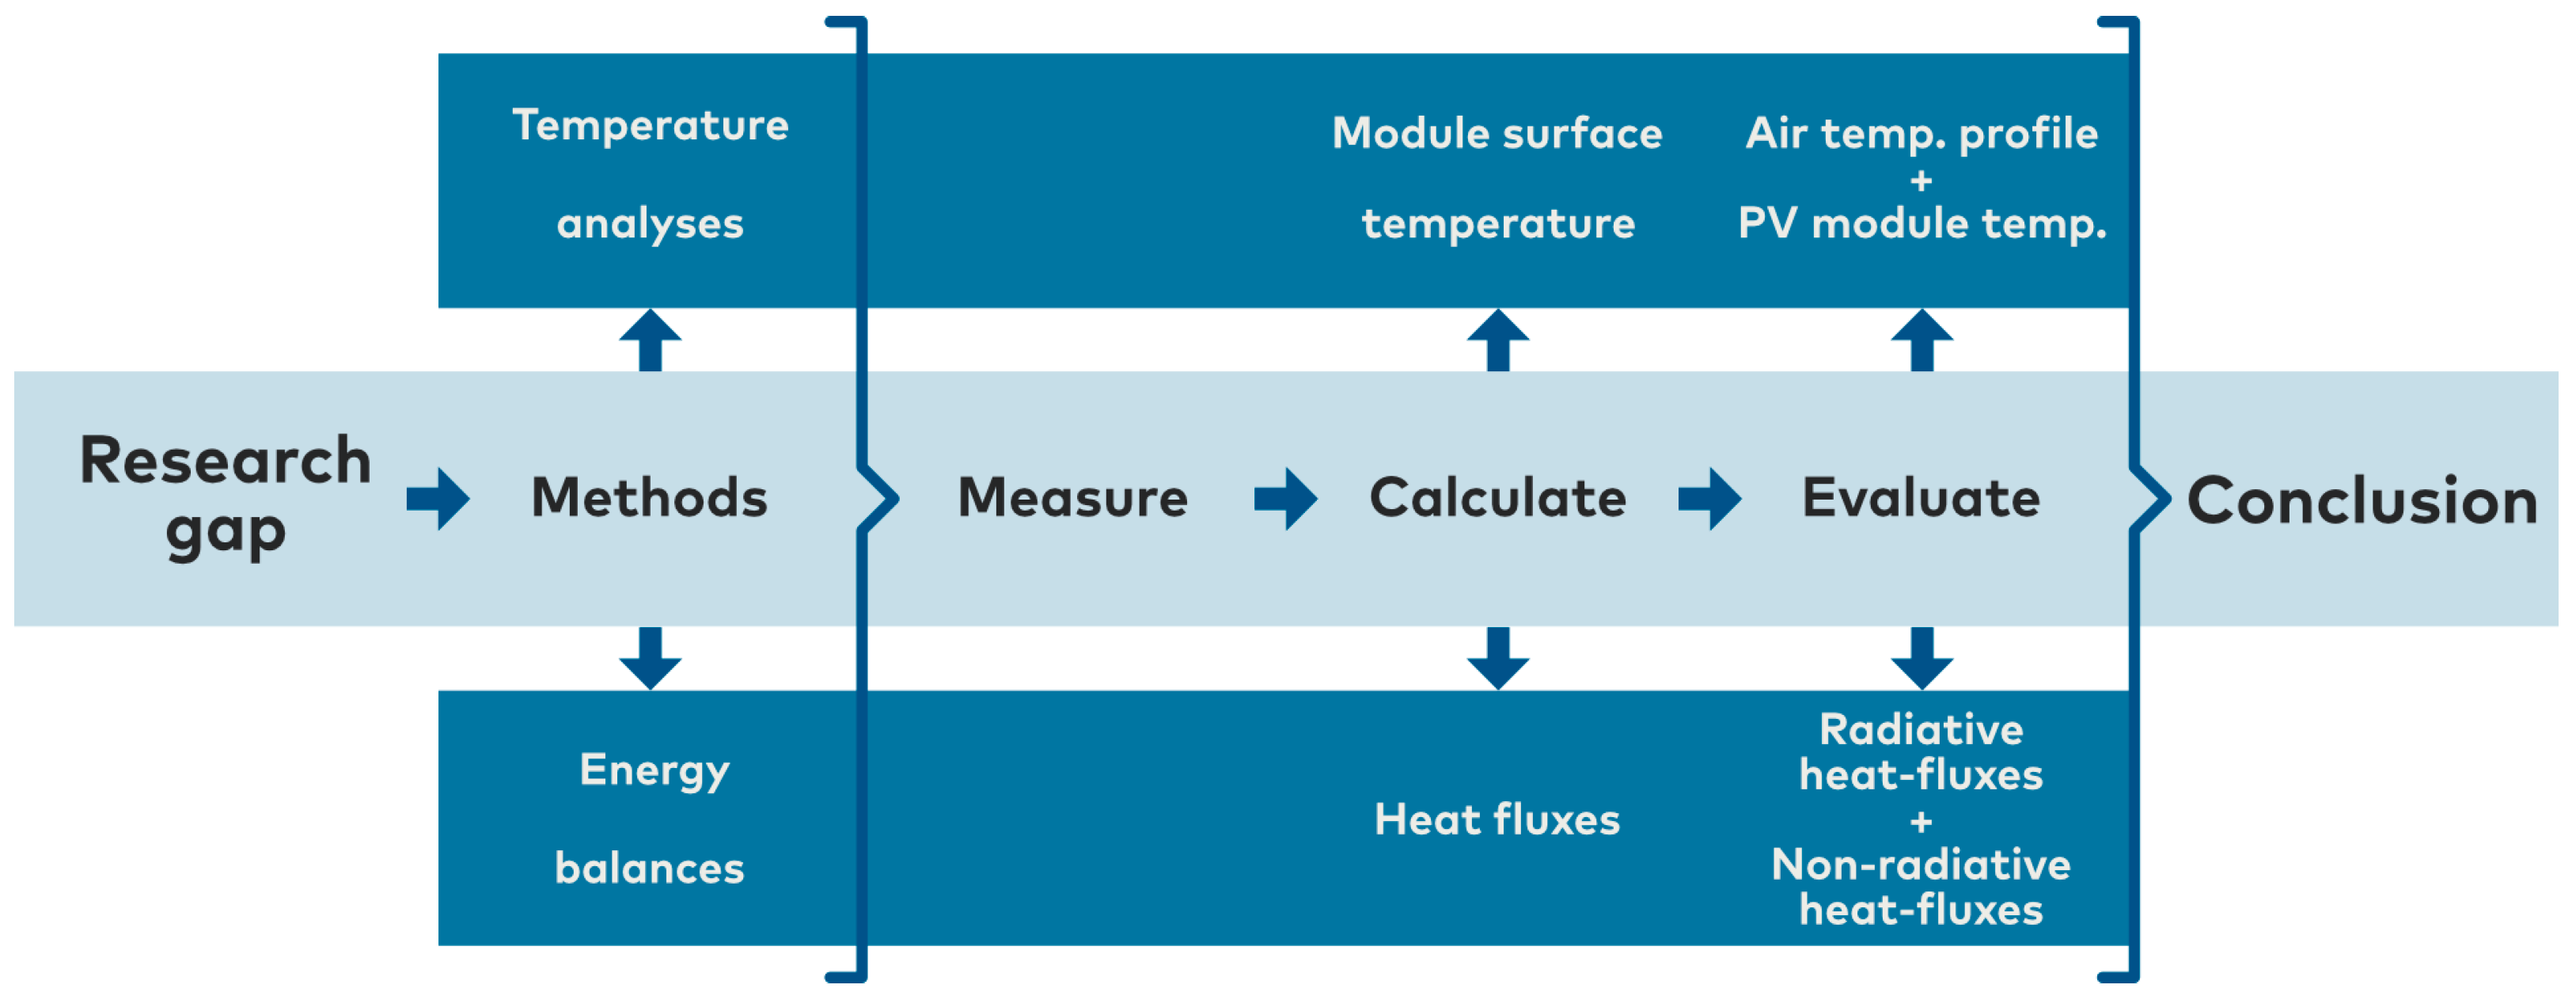
Metrological investigations (see Section 3) and subsequent calculations provide the data for evaluating the temperatures and energy fluxes (see Section 4). The measurements are complemented by characteristic values derived from the literature [26,27,28,29,30,31,32,33,34,35,36]. In conclusion, the findings of both methodological approaches provide an answer to the research question (see Section 6). The methodological approach is shown in Figure 1.
2.1. Temperature Analyses
A horizontal profile of the ambient air temperature above and next to a photovoltaic installation provides information on the impact of PV on the ambient air temperature in terms of temporal and spatial distribution compared to the ambient air temperature above a roof without PV installation. Hence, the PV modules’ diurnal heating and cooling effects and their spatial extent can be identified. The temperature sensors are installed at a height of 2 m above the rooftop and hence, 0.78 m above the PV modules. The comparison of the ambient air temperature beneath the PV installation with the temperature at the same height above a reference roof provides further insights into the microthermal impacts of PV on their rear side.
To investigate the impact of PV efficiency on module temperatures, the module temperature of a PV module producing solar energy is compared to that of a temporarily deactivated module within the same array, hence simulating a module efficiency of 0%. To further analyze the temperatures of the surfaces in direct radiation exchange with the sky, the PV cell temperature is compared to the soil surface temperature of a reference roof.
The front surface of the PV modules is in direct radiation exchange with the sky. However, without affecting the energy production due to shading effects, PV temperatures can only be measured at the rear side of the module. As the cell temperature and the temperature on the back side of the module are different, depending on the mounting situation [37], the cell temperature (Tc in °C) is deviated from the back-surface module temperature (TM in °C) by applying Equation (1) [38]. The temperature deviation between the cell and module front surface is negligible. Hence, we assume Tc = TPV,front.
where GT is the global irradiation (W/m2), and Ta is the ambient air temperature (°C).
The module efficiency (ηmodule) is calculated according to Equation (2) [39].
where qel,PV is the electricity produced by the PV module (W/m2).
The surface temperature of the reference roof surface (Tsoil,surf,REF in °C) is deviated from the upwelling longwave sky radiation (qlw↑) according to Equation (3), using the Stefan–Boltzmann law [40]:
where (W/(m2K4)) is the Stefan–Boltzmann constant.
2.2. Energy Balances
Establishing energy balances for the reference roof and the roof with photovoltaic installation allows for tracing the energy fluxes.
- Energy Balance Reference Roof
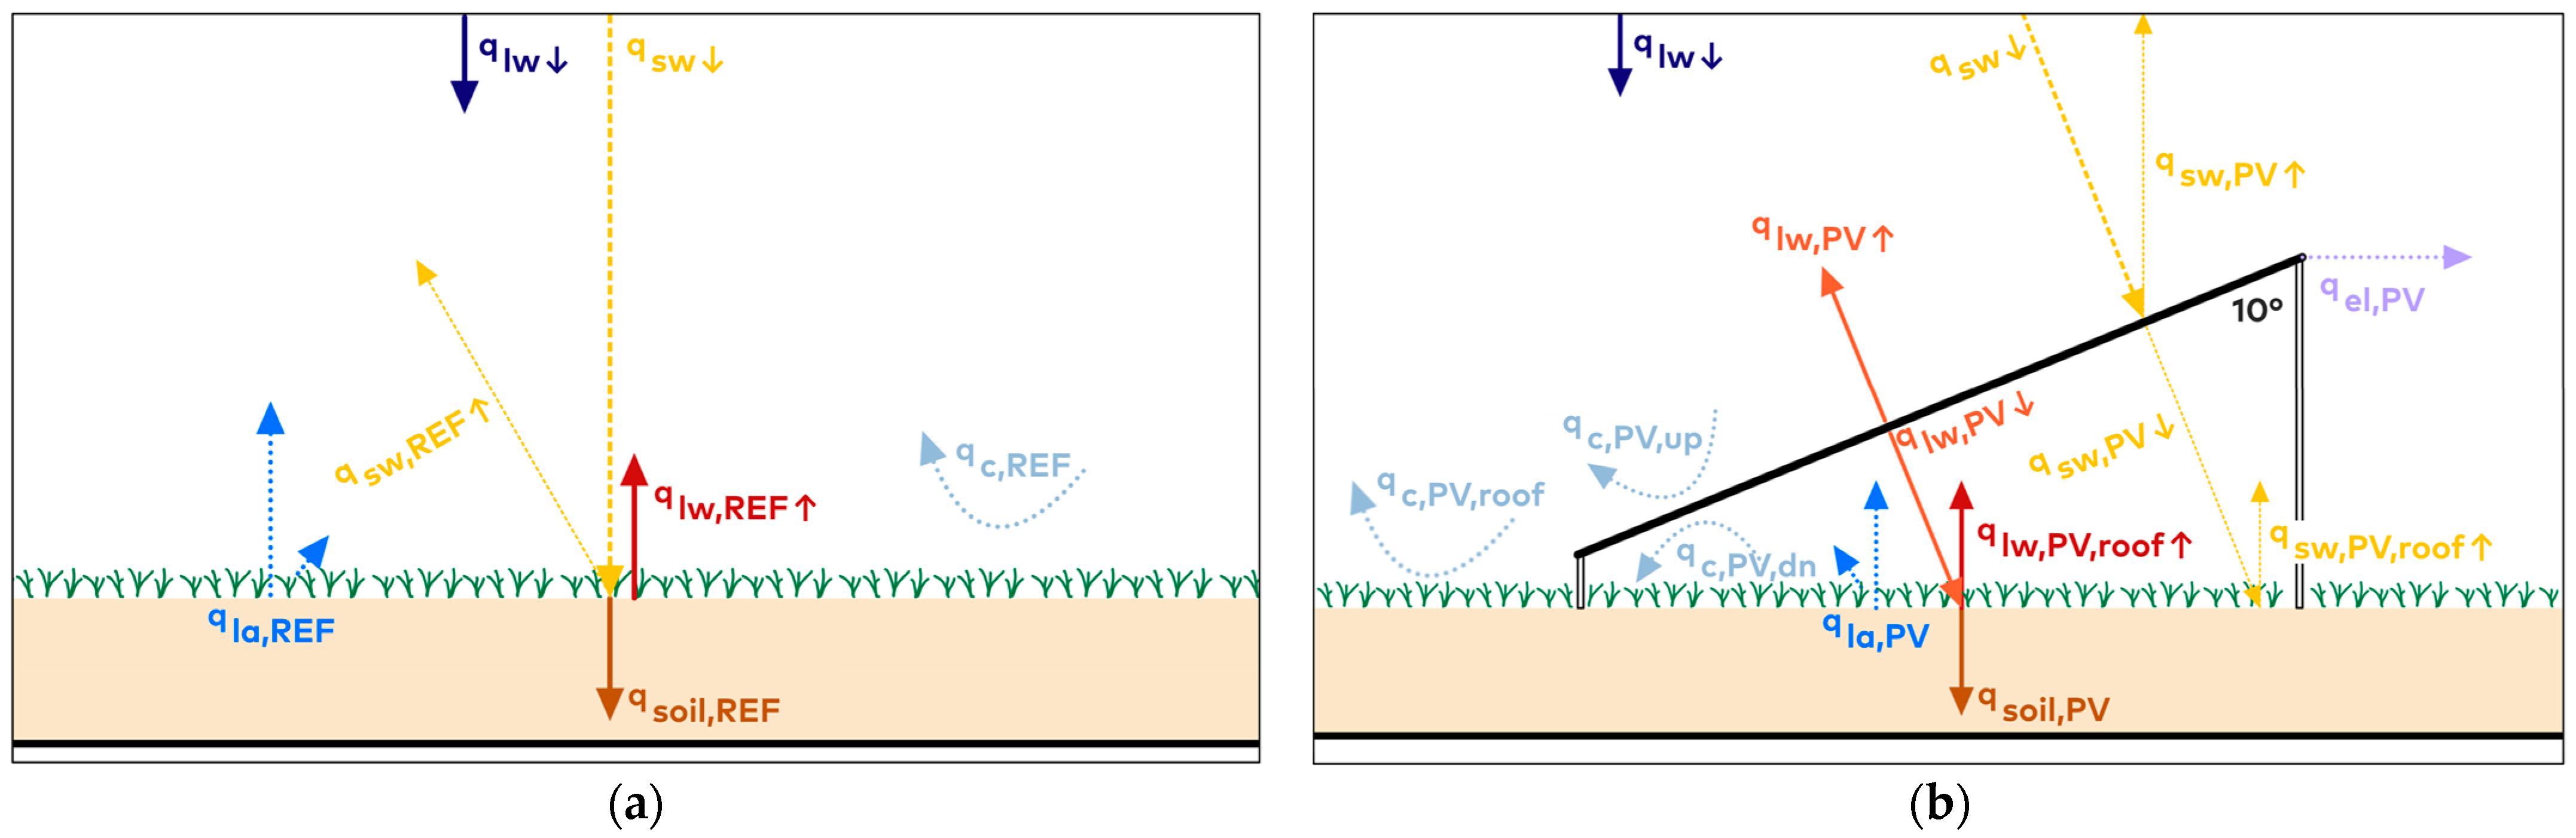
Downwelling shortwave solar radiation (qsw↓) and downwelling longwave sky radiation (qlw↓) impinge on the vegetation. The incident radiation is partly reflected into the sky (qsw,REF↑) and partly absorbed and stored as ground heat (qsoil,REF). Part of the stored energy is reemitted as longwave radiation (qlw,REF↑) into the surroundings. In addition, heat is transmitted via convective heat transfer mechanisms (qc,REF), and the evapotranspiration of water from soil and plants releases latent heat (qla,GR) (see Figure 2a) [41]. The net radiation (Q*) is the difference between incident and upwelling radiation. Hence, the energy balance for the reference roof is as follows, with the first part referring to the radiative fluxes and the second part to the non-radiative fluxes:
Energy Balance Pv Roof
Mounting photovoltaics onto the roof surface adds a further layer to the energy balance. The shortwave solar radiation (qsw↓) and longwave radiation (qlw↓) from the sky impinge onto the photovoltaic modules and are partly reflected (qsw,PV↑) and partly absorbed by the modules. In the case of semi-transparent modules, part of the solar radiation is transmitted through the module surface (qsw,PV↓). The efficiency of the modules determines the amount of absorbed short-wave radiation converted into electricity (qel,PV), thereby not contributing to a rise in sensible heat. The remaining share of the absorbed radiation is emitted as longwave radiation (qlw,PV↑) upwards into the sky and downwards towards the rooftop (qlw,PV↓) or dissipated via natural convection induced by wind above and beneath the PV modules (qc,PV,up, qc, PV,dn and qc,PV,roof). Further energy fluxes are identical to those on the reference roof (see Figure 2b) [10,11,13,42]. Hence, the energy balance for the PV roof is as follows:
Figure 2.
Energy balances (based on [43]). (a) Reference roof; (b) PV roof.
Figure 2.
Energy balances (based on [43]). (a) Reference roof; (b) PV roof.

As the energy exchanges beneath the PV modules–such as radiative trapping–are accounted for in the module temperature, and hence in the upwelling longwave emissions, only the radiative fluxes above the photovoltaic installation are considered for evaluating the radiative heat exchanges. Regarding convective processes, a consideration of only the heat transfer on the top surface of the PV module to the environment, however, would lead to an error of about two [9,23,25]. Hence, the convective heat fluxes occurring above (qc,PV,up in W/m2) and beneath qc,PV,dn in W/m2) the PV installation are added up according to Equation (6):
Albedo
A photovoltaic module is designed to absorb a maximum amount of solar energy that can be transformed into electricity. Hence, the albedo of a PV module is low, leading to an intensified absorption of solar radiation during the day. The albedo is calculated by dividing the downwelling and upwelling shortwave solar radiation according to Equation (7) [44]:
Sensible Heat Fluxes
The convective (sensible) heat fluxes of the PV modules (qc,PV,up and qc,PV,dn in W/m2) are calculated by applying the algorithm first used in the DOE-2 software (version 2.2-47h2), using measured data of module surface temperature, local air velocity and ambient air temperature above and below the PV modules [26]. First, Equations (8) and (9) provide the natural convection coefficients for the PV modules:
where ΔT (K) is the temperature difference between ambient air temperature and the module surface temperatures, and θ is the tilt angle of the PV modules.
Then, Equation (10) is used to calculate the film heat transfer coefficient (hc0) and the heat transfer coefficient (hc) is calculated by applying Equation (11):
where a, b and Rf are experimental coefficients acquired from the work of Yazdanian and Klems [27], and v (m/s) represents the local wind velocity.
Finally, Equations (12) and (13) are used to calculate the sensible heat flux (qc,PV,up in W/m2):
where Ts (°C) is the surface temperature of the PV modules, and Ta (°C) is the ambient air temperature measured above and below the PV modules.
For the reference roof, the sensible heat fluxes (qc,REF in W/m2) are calculated according to Equation (14) [28]:
where Tsoil,surf is the soil surface temperature (°C).
- Latent Heat Fluxes
Based on the measured net radiation, soil heat flux density, ambient air temperature and local wind velocity, the evapotranspiration (ET in mm/h) is calculated according to the ASCE Penman–Monteith equation (see Equation (15)) [29].
where Δ is the slope of the saturation vapor pressure curve (kPA/°C), Q* is the net radiation (MJ/m2h), G refers to the soil heat flux density (MJ/m2h), Ta is the average hourly ambient air temperature at the height of 1.5–2.5 m above the ground (°C), v represents the average hourly local wind velocity at the height of 2 m above the ground (m/s), es is the average saturation vapor pressure at a height of 1.5–2.5 m above the ground (kPa), ea is the average vapor pressure at the height of 1.5–2.5 m above the rooftop (kPa), γ is the psychrometric constant (kPa/°C) and cn, and cm are constants (−).
- Ground Heat Fluxes
In addition to the soil heat flux at a given soil depth measured via a heat flux plate (qhfp), the soil heat flux at the surface (qsoil) is calculated according to Hanks [45,46].
First, the soil heat capacity (cs in J/m3°C) is determined using Equation (16).
where ρb is the bulk density (kg/m3), cd is the heat capacity of the dry soil (J/kg°C), θ is the water content of the soil (m3), ρW is the density of water (kg/m3) and cW refers to the heat capacity of water (J/kg°C).
The average stored heat within the substrate above the heat flux plate (qsubstrate in W/m2) is calculated using Equation (17).
where Ti is the current soil temperature (°C), Ti−1 is the soil temperature of the previous time step (°C), D is the depth of the heat flux plate (m), and t is the time interval (s).
By adding up the soil heat flux (qhfp in W/m2) and the energy stored within the substrate (qSubstrate) in W/m2, the heat flux at the roof surface (qsoil in W/m2) is calculated (see Equation ()).
Material values and coefficients acquired from the literature are summarized in Table 1.
3. Measurement Concept
3.1. Measurement Site
The measurement site is located within a residential neighborhood in the northeastern part of Munich, Germany.
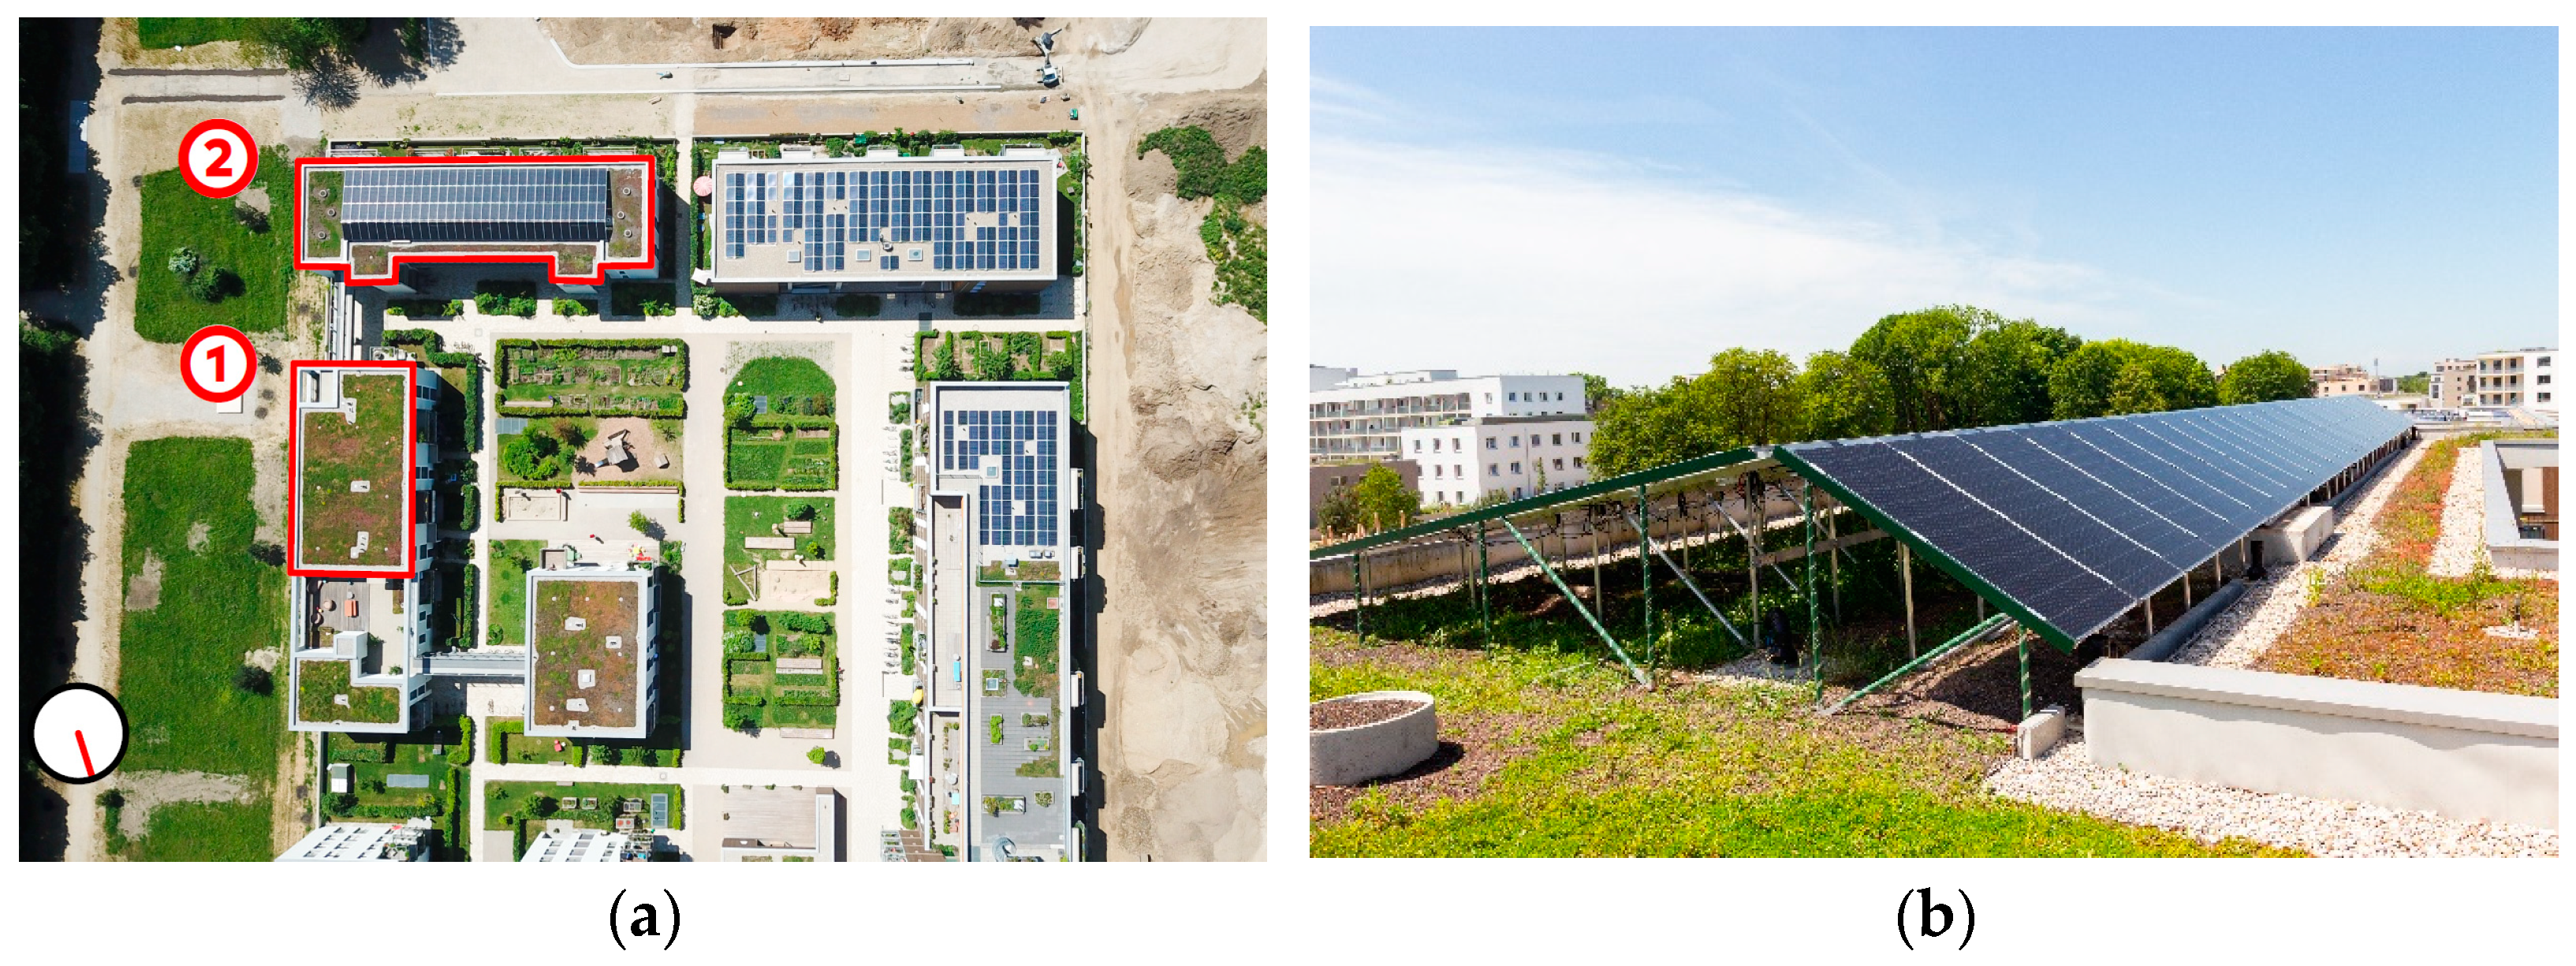
The neighborhood is a newly built settlement with densely arranged multi-story residential buildings. The measurements are conducted on the rooftops of two adjacent buildings with three stories each (see Figure 3a). The nearest trees have a distance of 17 m to the attic and thus do not immediately influence the thermal microclimate above the rooftops. Adjacent buildings are of the same height, hence not shading the measurement site. As green roofs are becoming state-of-the-art, buildings have non-irrigated extensive green rooftops with identical substrates based on mineral materials and a small share of organic substances. The seed mixture contains 2 g/m2 of flower seeds and 25 g/m2 of sedum sprouts.
Above one of the extensive green roofs, a rack-mounted PV system is installed on an aluminum sub-construction. To gain the maximum renewable energy, the PV installation has the shape of an uneven saddled roof (see Figure 3b). The PV installation consists of 120 monocrystalline modules. Ninety modules (2050 mm × 1000 mm) with a nominal power of 390 Wp and an efficiency under standard test conditions of 19.5% are south-oriented with an inclination of 10°. Thirty modules (1693 mm × 993 mm) with a nominal power of 325 Wp and an efficiency under standard test conditions of 19.3% are north-oriented with an inclination of 30°. The PV cells are covered by 2 mm solar glass on the front and rear sides. In total, the PV installation has a nominal power of 44.85 kW. The modules are semi-transparent and frameless to enable sufficient solar radiation to the vegetation beneath the PV modules.
The PV system is managed and optimized using an inverter and power optimizer. The manufacturer’s monitoring platform2 provides hourly solar yield data for every power optimizer to which two modules are connected. The data are used to calculate the current efficiency of the PV modules.
3.2. Temperature Analyses
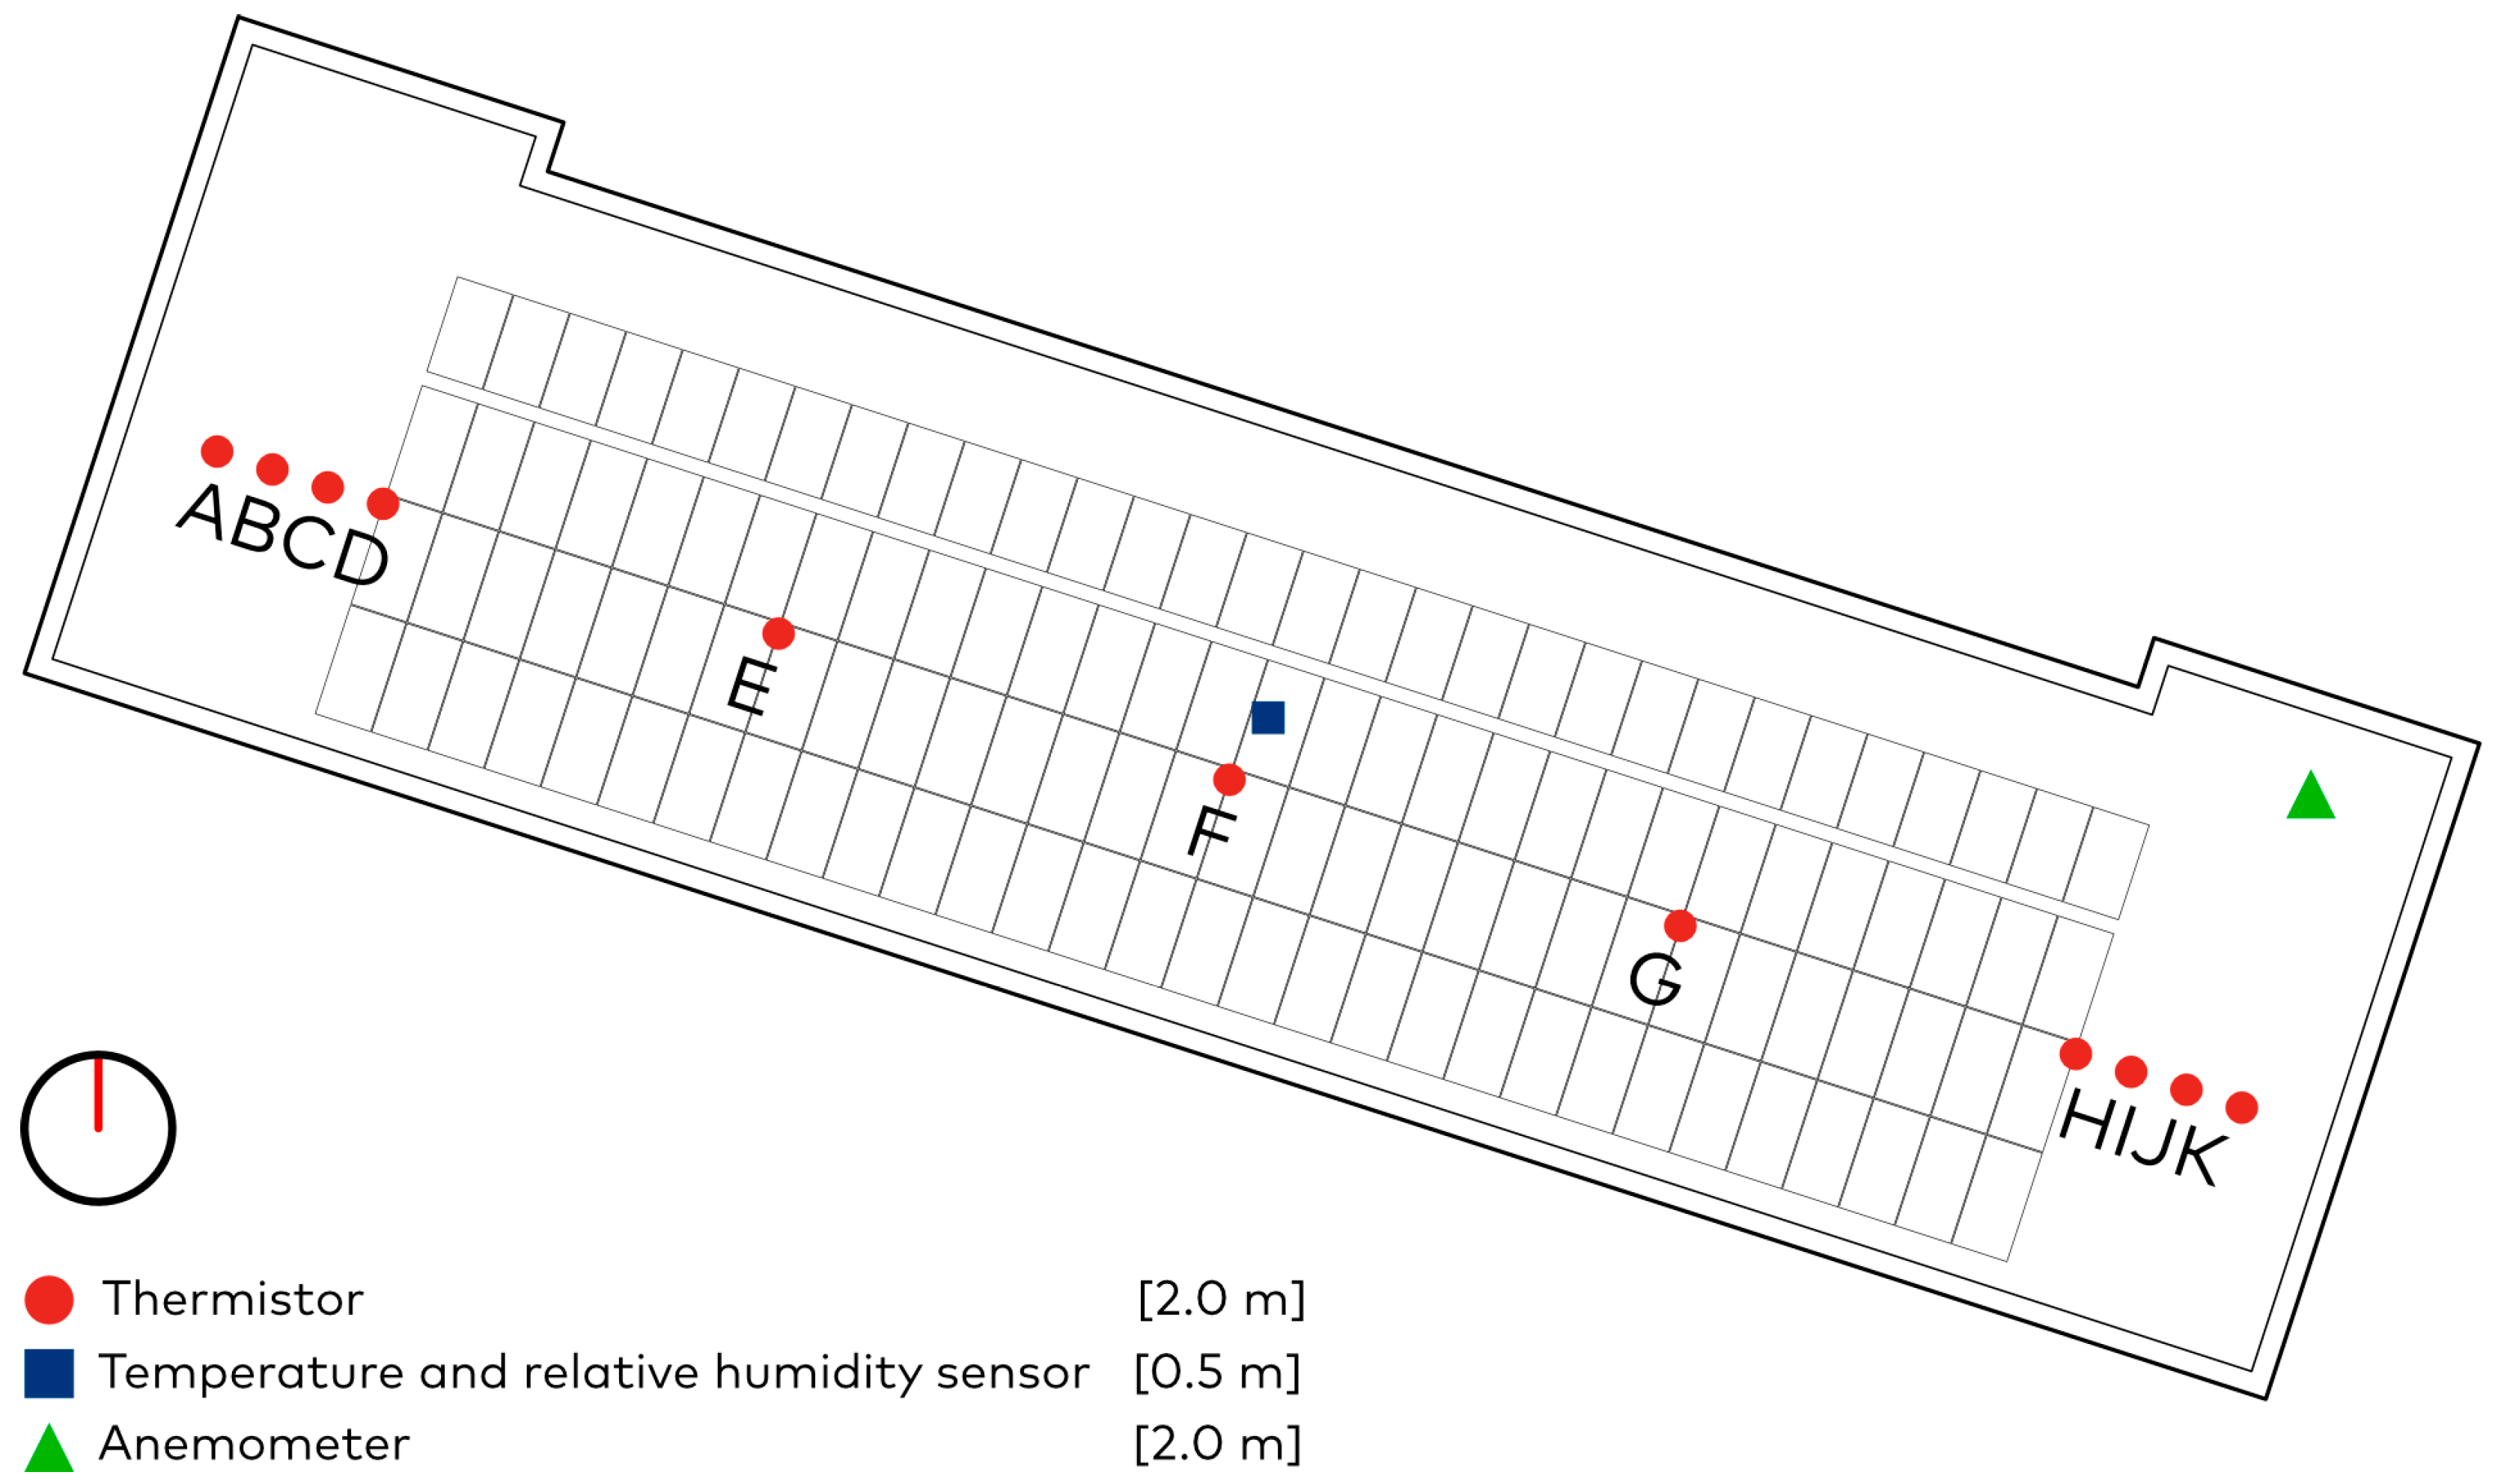
Eleven thermistors (107 Temperature probe, -1-) distributed in a row above the PV roofs’ surface provide data for the horizontal profile of the ambient air temperature above and next to the photovoltaic installation. For accurate ambient air temperature measurements, the sensors are ventilated and shaded. A 2D ultrasonic anemometer (WindSonic4, [4]) assesses the local wind conditions. The anemometer is placed in the northeastern corner of the PV rooftop for measurement results that are the least influenced by the photovoltaic installation. The positions of the sensors are shown in Figure 4. The ambient air temperature data above the PV roof are compared to the ambient air temperature values measured above the reference roof. All sensors are installed at two meters above the roof surface, representing the standard measurement height for ambient air temperature [36]. Hence, the sensors above the PV installation are mounted with a distance of 0.78 m to the PV modules. To measure ambient air temperature and relative humidity beneath the PV array, a digital temperature and relative humidity sensor (HygroVUETM5, -3-) is mounted at the height of 0.5 m centrally above the roof surface. A HygroVUETM5 sensor mounted at the same height above the reference roof provides reference data. The data are also used to establish the energy balances (see Section 3.3).
Two specific back-of-module temperature sensors, consisting of a PT1000 platinum resistance thermometer (CS241 PT-1000 Class A, -5-), measure the surface temperature centrally on the rear side of two photovoltaic modules in the center of the PV array. To quantify the effect of power production and efficiency on the module temperature, one sensor is mounted on an operating PV module. A second sensor is fixed on a PV module temporarily deactivated during the measurement period.
3.3. Energy Balances
The sensors for the temperature analyses (see Section 3.2) are complemented via additional sensors to gather all data required for establishing the energy balances. The measurement set-up also allows the study of the albedo, soil temperature and soil humidity of both roofs. Table 2 provides an overview of all sensors and measurement parameters.
- Measurement Concept Energy Balance Reference Roof
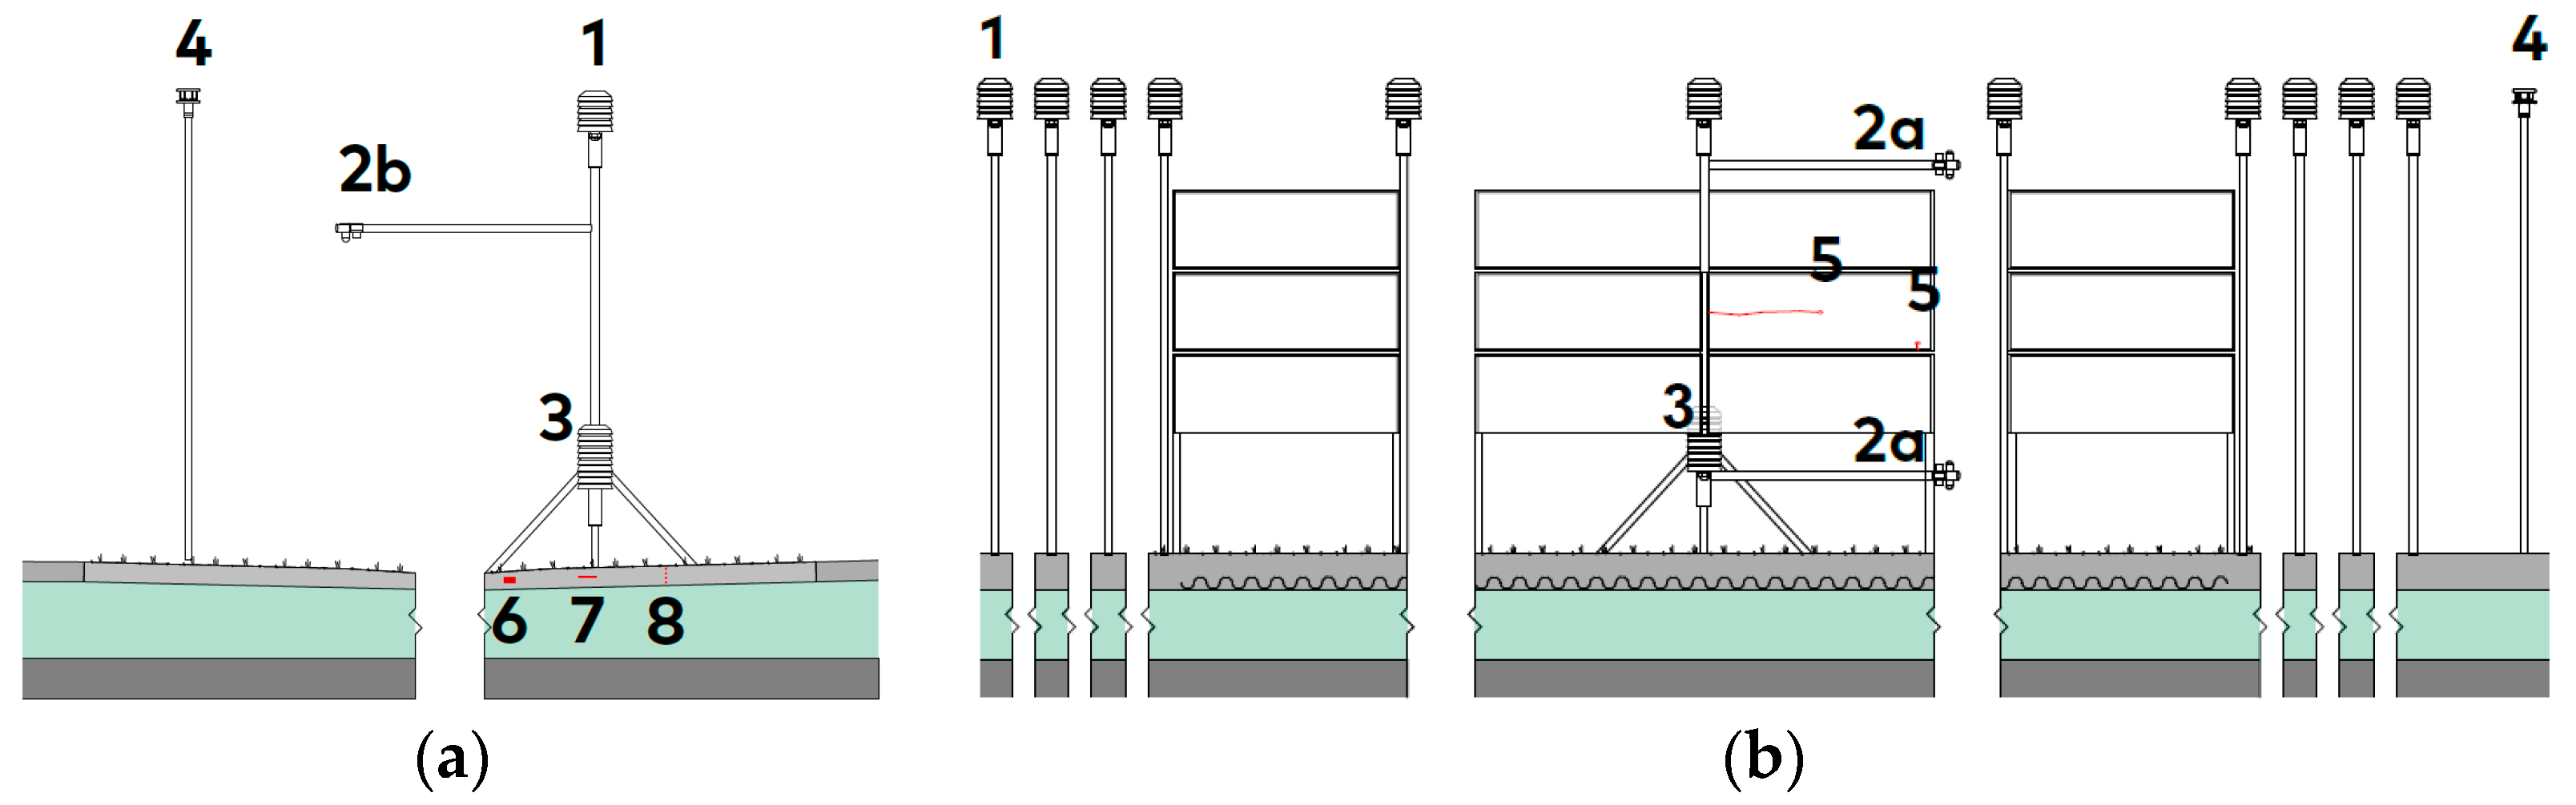
A two-component radiometer (RA01, -2b-) is placed horizontally in the middle of the reference roof to record the upwelling radiative fluxes. The radiometer consists of a pyranometer measuring the shortwave radiation and a pyrgeometer measuring the longwave radiation. The radiometer is oriented downwards–hence the upward short- and long-wave radiation from the reference roof is measured. The installation height of 1.5 m above the rooftop ensures that the pyrgeometer with a view field of 150° only measures longwave radiation from the vegetation and not from the attic or the surroundings. However, the pyranometer with a view field of 180° captures 16.6% of the shortwave radiation of the surroundings.
For assessing the non-radiative fluxes, a heat flux plate (HFP01, -7-) installed at a depth of 0.04 m within the substrate measures the soil heat flux. The average soil temperature is determined via four connected thermocouples (TCAV-L, -8-) placed in a depth of 0.065 m, 0.045 m, 0.025 m and 0.005 m within the substrate. A soil water content reflectometer (CS650, -6-) placed horizontally at a depth of 0.04 m measures the volumetric water content within the soil, the electrical conductivity and the soil temperature. Furthermore, a 2D ultrasonic anemometer (WindSonic4, -4-) installed at a height of 2 m above the rooftop registers wind velocity and direction required for determining the convective heat fluxes. The measurement set-up for the reference roof is shown in Figure 5a.
- Measurement Concept Energy Balance PV Roof
To receive comparable measurement results for both roofs, the measurement set-up for the PV roof is similar to the one on the reference roof, only enhanced by several sensors to enable accounting for the impacts of the photovoltaic installation.
Two four-component net radiometers (NR01, -2a-) are placed centrally above and beneath the photovoltaic installation to register the radiative fluxes in the horizontal plane. The net radiometers consist of two pairs of a pyrano- and a pyrgeometer, one directed upwards and one downwards. The net radiometer above the PV measures downward solar shortwave and longwave radiation from the sky as well as the upward shortwave radiation reflected from the PV modules, the upward longwave radiation from the PV and the upwelling long- and shortwave radiation from the roof surface transmitted through the semi-transparent module area. Due to the proximity of the two roofs, the measured downwelling radiation is also used for the energy balance of the reference roof. The net radiometer beneath the PV installation measures the shortwave solar radiation transmitted through and reflected by the semitransparent PV modules, the longwave radiation directed downwards from the PV modules and the short- and longwave radiation directed upwards from the roof surface. The net radiometers with a pyrgeometer view field of 150° are installed at a distance of 0.43 m above and 0.30 m below the PV modules to only account for the longwave radiative fluxes caused by the modules.
For assessing the non-radiative fluxes, a heat flux plate (HFP01, -7-) installed at a depth of 0.08 m within the substrate measures the soil heat flux. The average soil temperature is determined using four connected thermocouples (TCAV-L, -8-) placed in a depth of 0.155 m, 0.105 m, 0.055 m and 0.005 m within the substrate to represent the average substrate temperature. The diverging depths of the sensors are due to differing soil depths on the reference (0.08 m) and PV roof (0.16 m). The measurement set-up for the PV roof is shown in Figure 5b.
3.4. Measurement Period and Data Processing
To account for the hottest summer periods when local climate conditions are critical for human health, the temperature measurements were conducted from 16 July 2022 to 30 September 2022. Due to measurement setup delays, the data for establishing the energy balances are only exhaustively available from 26 August until 30 September 2022. A failure of one inverter caused an outage of 60 south-oriented PV modules from 26 August until the end of the measurement period.
The measurement data are sampled every 10 s, and the mean values of 10 min are logged with the data logger CR1000X (Campbell Scientific), extended by a multiplexer (AM 16/32, Campbell Scientific). The data are accessed via the software PC400 (version 4.7) and processed with MS Excel (Microsoft 365). The weather data of the nearby weather station of the Ludwigs Maximilian University are used to validate the measured data and to fill in data gaps due to sensor outages, as carried out in previous studies [47]. Before evaluating the measurement results, the data are checked for plausibility, outliers are identified, and data gaps of up to 60 min are interpolated. For the evaluation, the measurement data are averaged each month during the measurement period, and the minimum and maximum values are identified.
4. Results
4.1. Temperature Analyses
4.1.1. Ambient Air Temperatures
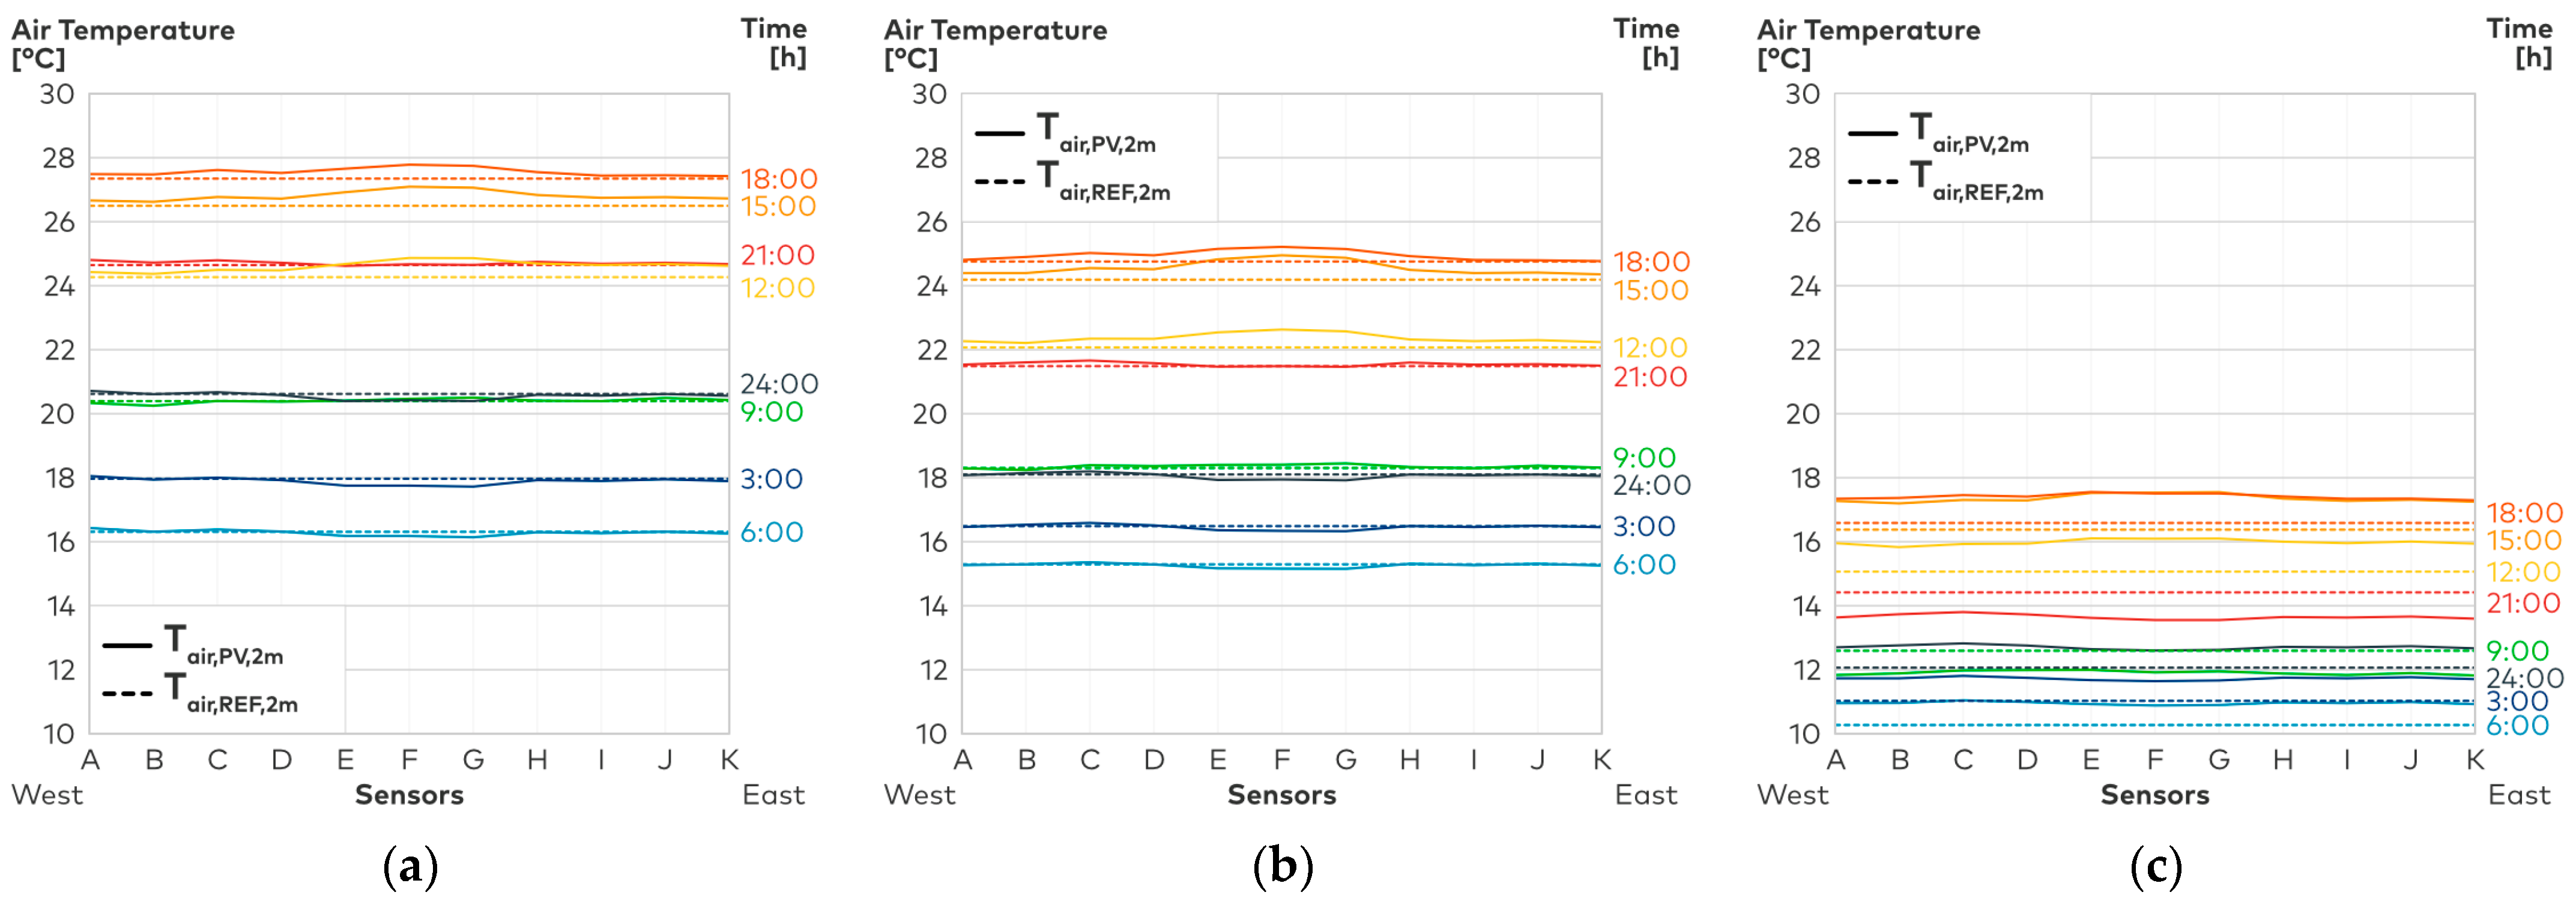
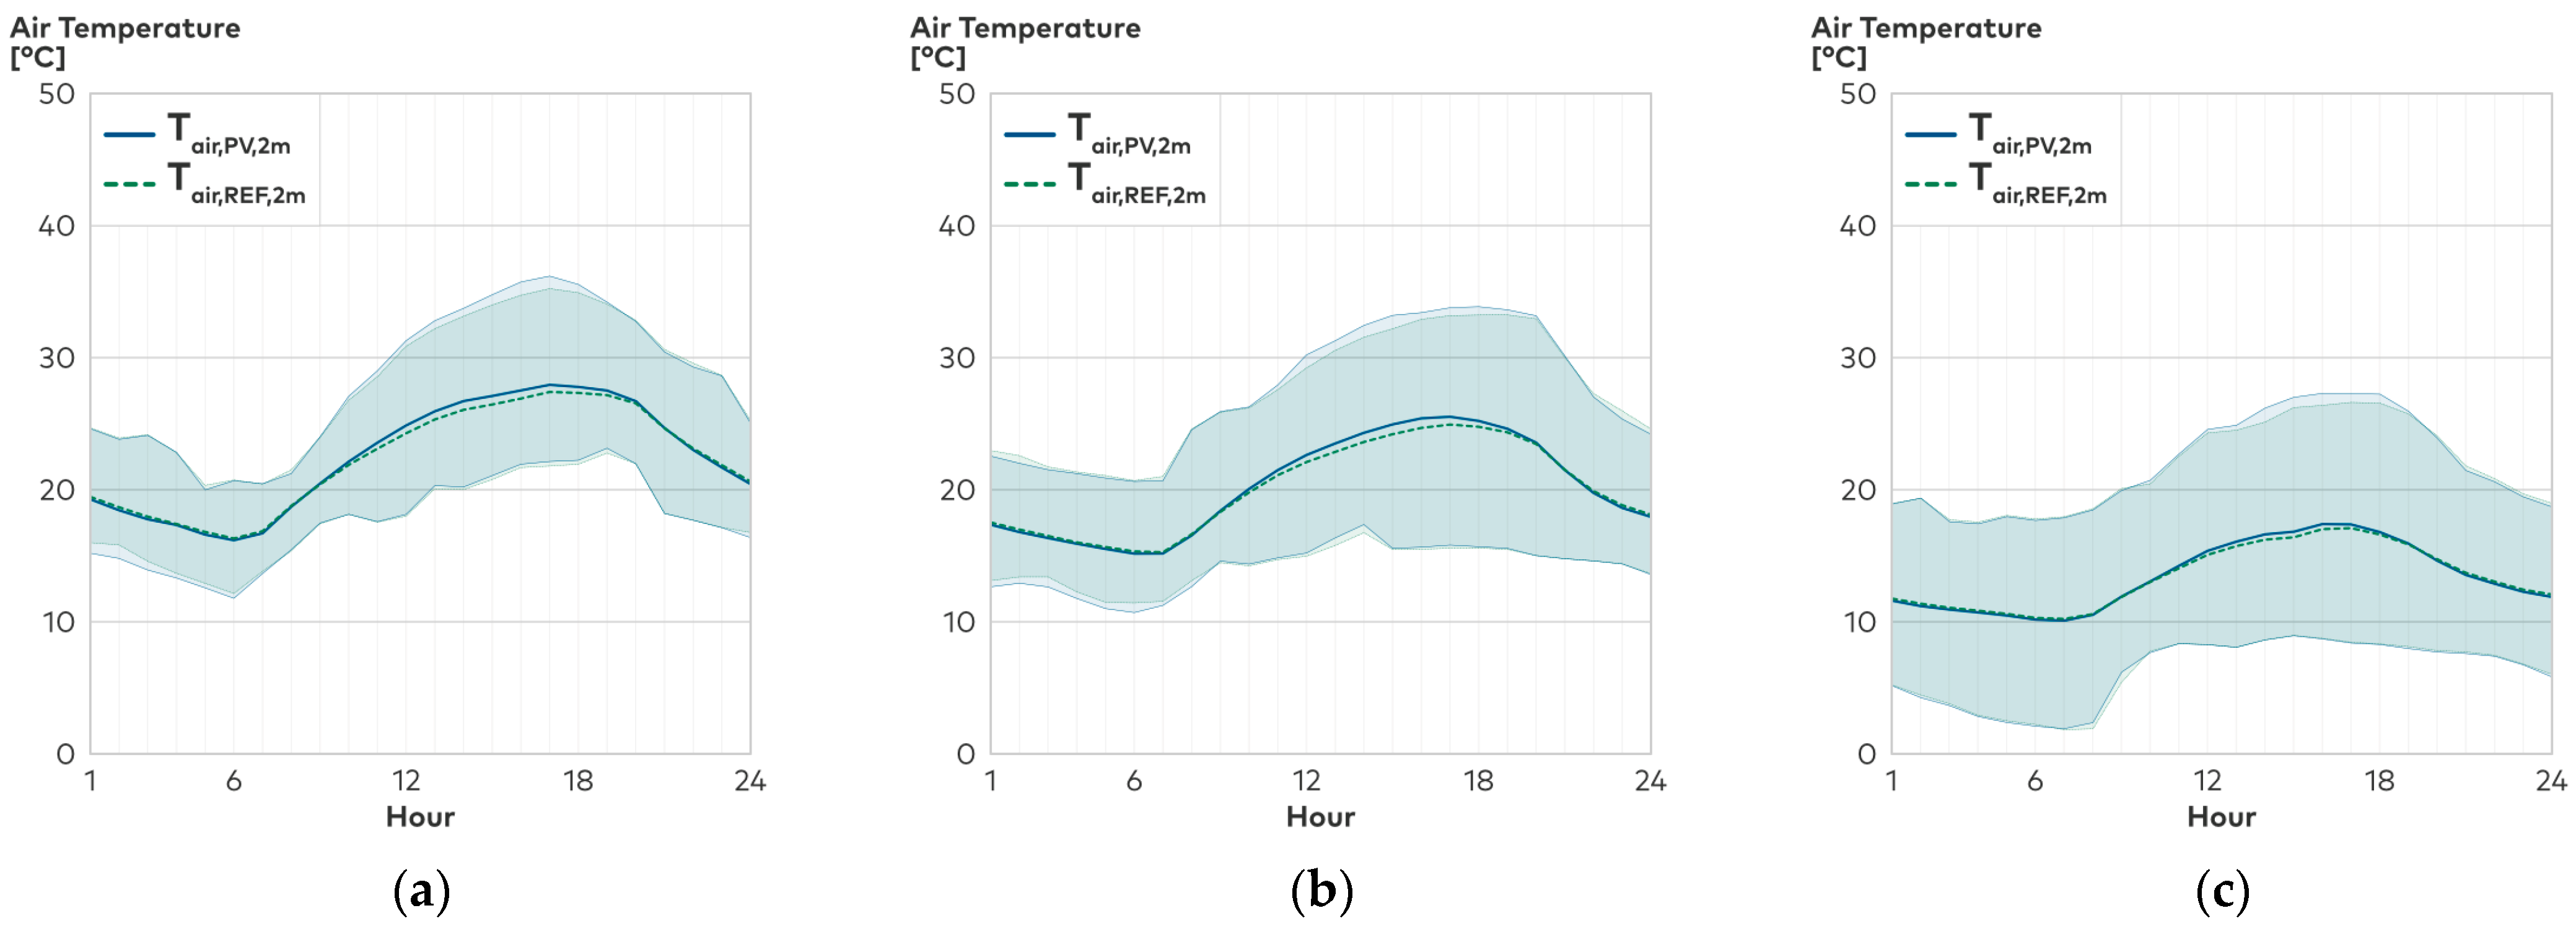
The horizontal air temperature profiles measured in July, August and September (see Figure 6) and the ambient air temperatures measured centrally above both roofs (see Figure 7) show similar trends for each month: During the day, the ambient air temperature above the photovoltaic installation (Tair,PV,2m) is higher than the ambient air temperature measured above the reference roof (Tair,REF,2m) with a maximum temperature difference (monthly averaged) of +0.75 K in August at 3 p.m. The peak difference is measured centrally above the PV installation, indicating that the PV modules generate a daytime heating effect on the near-surface ambient air temperature.
During the night, the ambient air temperature above the PV installation is lower than the temperature measured above the reference roof, with a maximum temperature difference (monthly averaged) of –0.20 K in August at 2 a.m., indicating a slight nocturnal cooling effect of the modules. The differences reached an absolute maximum of +1.35 K (daytime) and –1.19 K (nighttime) on a warm day (maximum air temperature: 28.3 °C) with a maximum downwelling shortwave radiation of 661.8 W/m2. The daytime heating effect is stronger than the nighttime cooling effect. Considered diurnally, the PV modules thus heat the surrounding ambient air temperature.
On days with low wind velocity (≤0.6 m/s), the temperature probes mounted next to the photovoltaic installation measure nearly the same ambient air temperature (+/−0.2 K) as the sensor mounted above the reference roof. Hence, on windless days, the impact of PV modules on the ambient air temperature is spatially limited to the area directly above the PV installation. On days with high wind velocity (≥0.6 m/s), no difference in ambient air temperature is identified. We deduce that the effect of PV modules on the thermal microclimate relies on convective heat transfer processes, and the wind-induced dispensation of heat leads to non-measurable temperature differences on windy days.
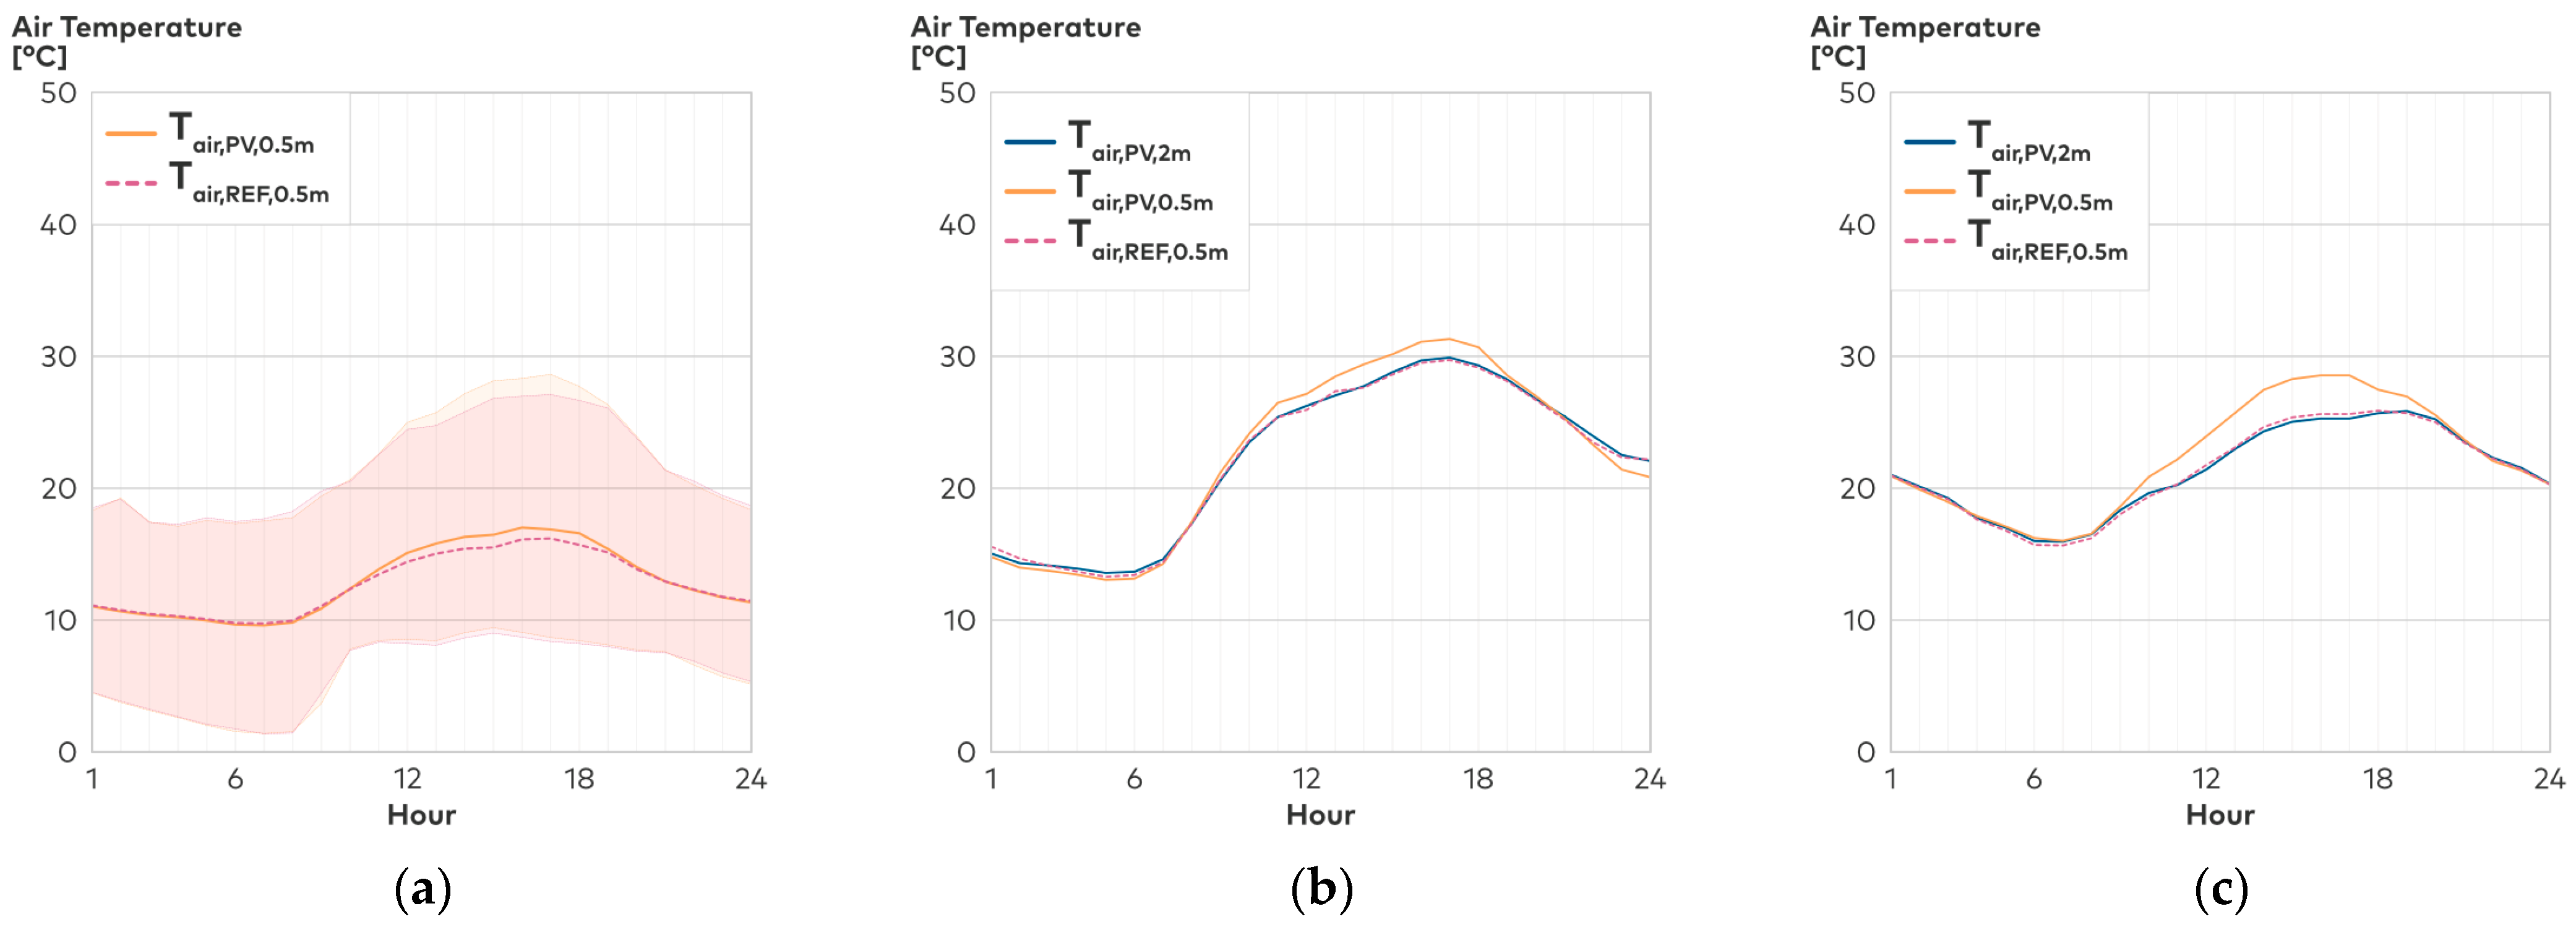
Due to sensor failure and replacement, the HygroVUETM5 mounted at the height of 0.5 m above the reference (Tair,REF,0.5m) and the PV roof (Tair,PV,0.5m)–hence beneath the PV modules sensors–stopped transmitting data on days with ambient air temperatures above 28 °C and in August. Therefore, we only have temperature data for the month of September and on some warm days in July (e.g., 13 July 2022 and 15 July 2022, as shown in Figure 8b,c).
However, we identified the same correlation as for the temperature probes at a height of two meters above the roof surface: In the afternoon, the ambient air temperature beneath the PV installation is up to +3.01 K higher due to trapping of longwave radiation and convective heat transfer from the rear side of the PV modules. During the night, the temperature drops slightly below the ambient air temperature measured above the reference roof, with a maximum temperature difference of −1.44 K. The temperature at a height of 0.5 m above the reference roof is nearly identical (+/−0.1 K) to the temperature measured at a height of two meters above the PV roof, hence above the PV installation (see Figure 8).
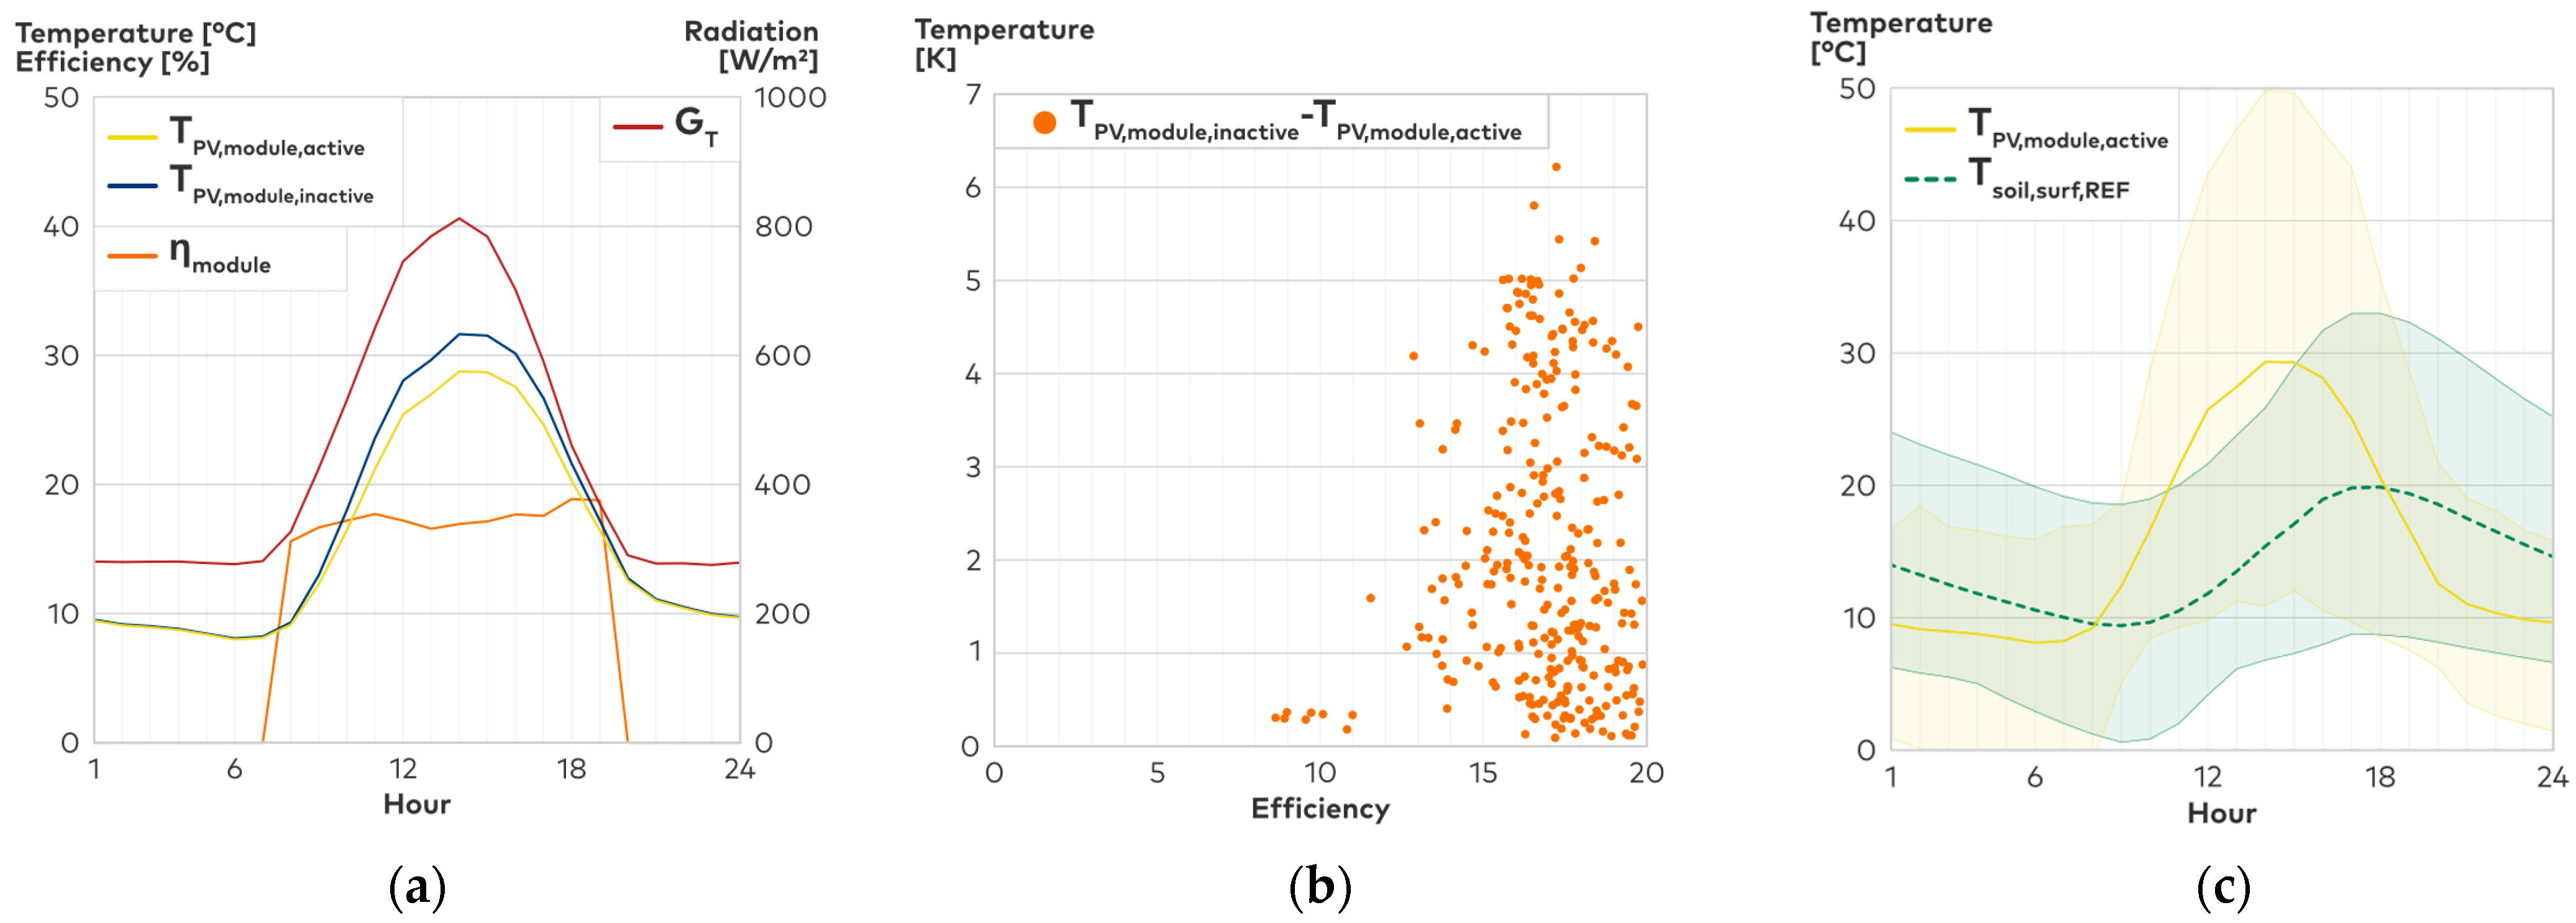
4.1.2. Photovoltaic Module Temperatures
Figure 9a shows the module temperature of a PV module producing solar energy (TPV,module,active) and the temperatures of a module currently not producing solar energy (TPV,module,inactive) measured and calculated according to Equation (1). The analysis was conducted from 26 August to 30 September. Instead of being converted into heat, the generation of solar energy transforms part of the incident radiation into electricity. Hence, this energy is removed as electricity from the system. Consequently, as soon as solar radiation impinges on the surface and electricity is produced, the module temperatures of the active PV module are lower than those of the inactive module. The peak temperature difference in September (monthly average) amounts to −2.96 K at 1 p.m. with an absolute maximum of up to −6.22 K. In the morning and evening, the temperatures of both modules are identical. With increasing global radiation and hence, with increasing solar energy production, the temperature difference increases and reaches its peak in the afternoon. In the evening, the incident radiation and hence, the absolute amount of produced solar energy, is small. Therefore, even though the module efficiency reaches its peak at 6 p.m., the temperature difference amounts to −0.2 K.
Figure 9b shows the module efficiency calculated according to Equation (2) with regard to the delta T. With typical efficiencies of 18%, the delta T ranges from 0 to 6 K. We conclude that the temperature difference instead relies on the total amount of produced energy than on the actual conversion efficiency.
Figure 9c shows the PV module temperatures (TPV,module,active) and the temperatures of the reference roof’s soil surface (Tsoil,surf,REF), calculated according to Equation (3). Hence, the temperatures of both roof surfaces in direct radiation exchange with the sky are compared. In the morning, the PV modules’ surface temperature rises above the reference roofs’ surface temperature, with a maximum temperature difference in September at 1 p.m. of +22.07 K (monthly average). During the night, the PV module temperature is lower than the soil surface temperature, with a maximum temperature difference in August at 9 p.m. of −1.47 K (monthly averaged) and an absolute maximum of +43.63 K (daytime) and −3.24 K (nighttime). The temperature difference is due to the low heat storage capacity of the PV modules combined with a high sky view factor, leading to a fast release of the stored heat during the night. The higher ambient air temperature directly above the modules–as identified in Section 4.1.1–can be explained by the higher daytime surface temperatures of the PV modules.
4.2. Energy Balances
To further investigate the findings of the temperature analysis (see Section 4.1), we established the surface energy balances for radiative and non-radiative fluxes of the reference roof and the PV roof. The analysis was conducted from 26 August to 30 September.
4.2.1. Radiative Fluxes
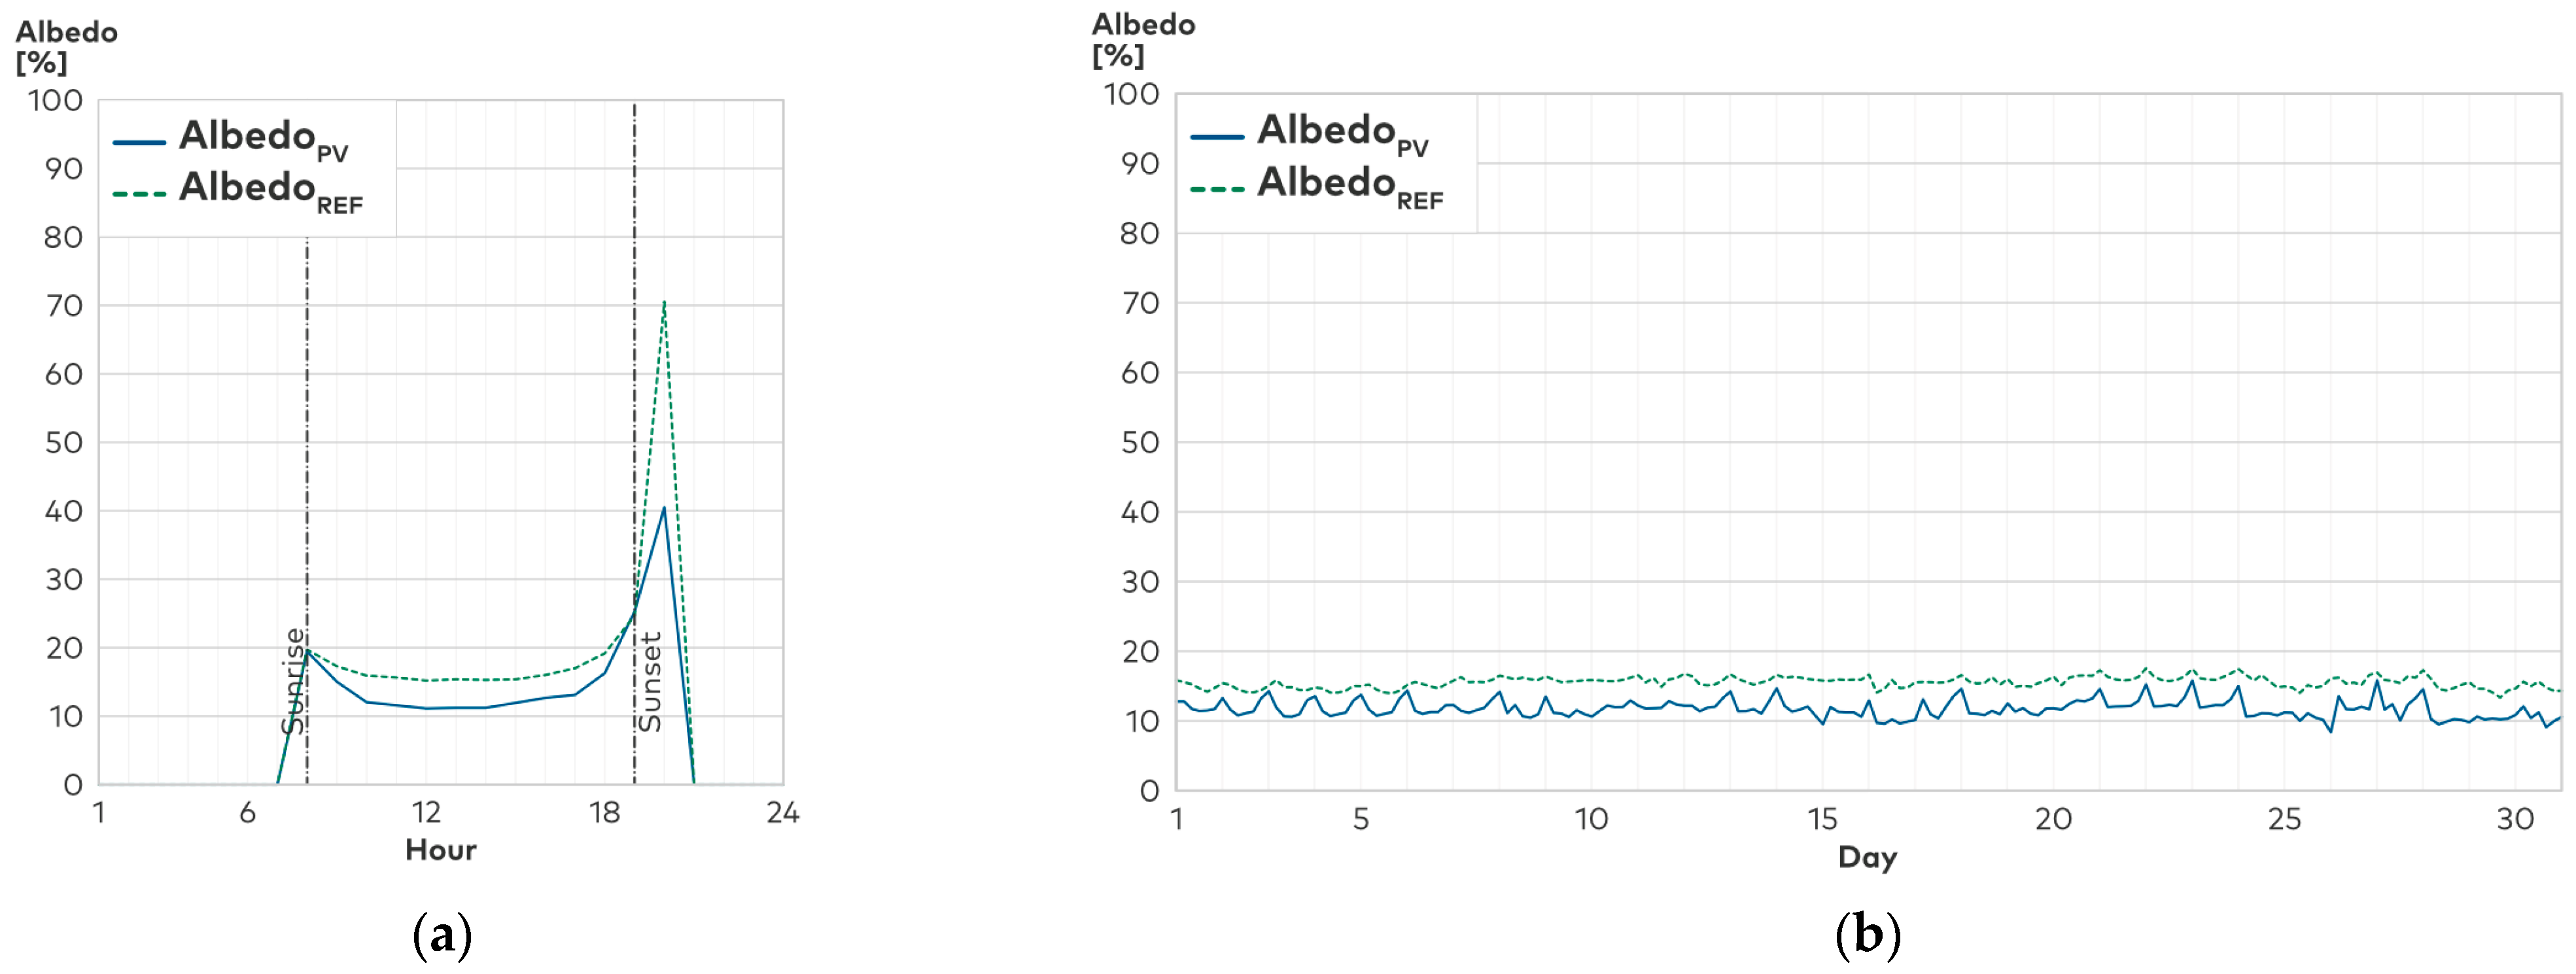
Figure 10 shows the albedo of both roofs as one of the main drivers for the radiative fluxes, calculated according to Equation (7). For September, the PV roof’s daily average albedo (data only accounted for a solar elevation angle >10° [48]) is 0.11, while the reference roof has an albedo of 0.15. During the course of the month, the albedo values remain constant.
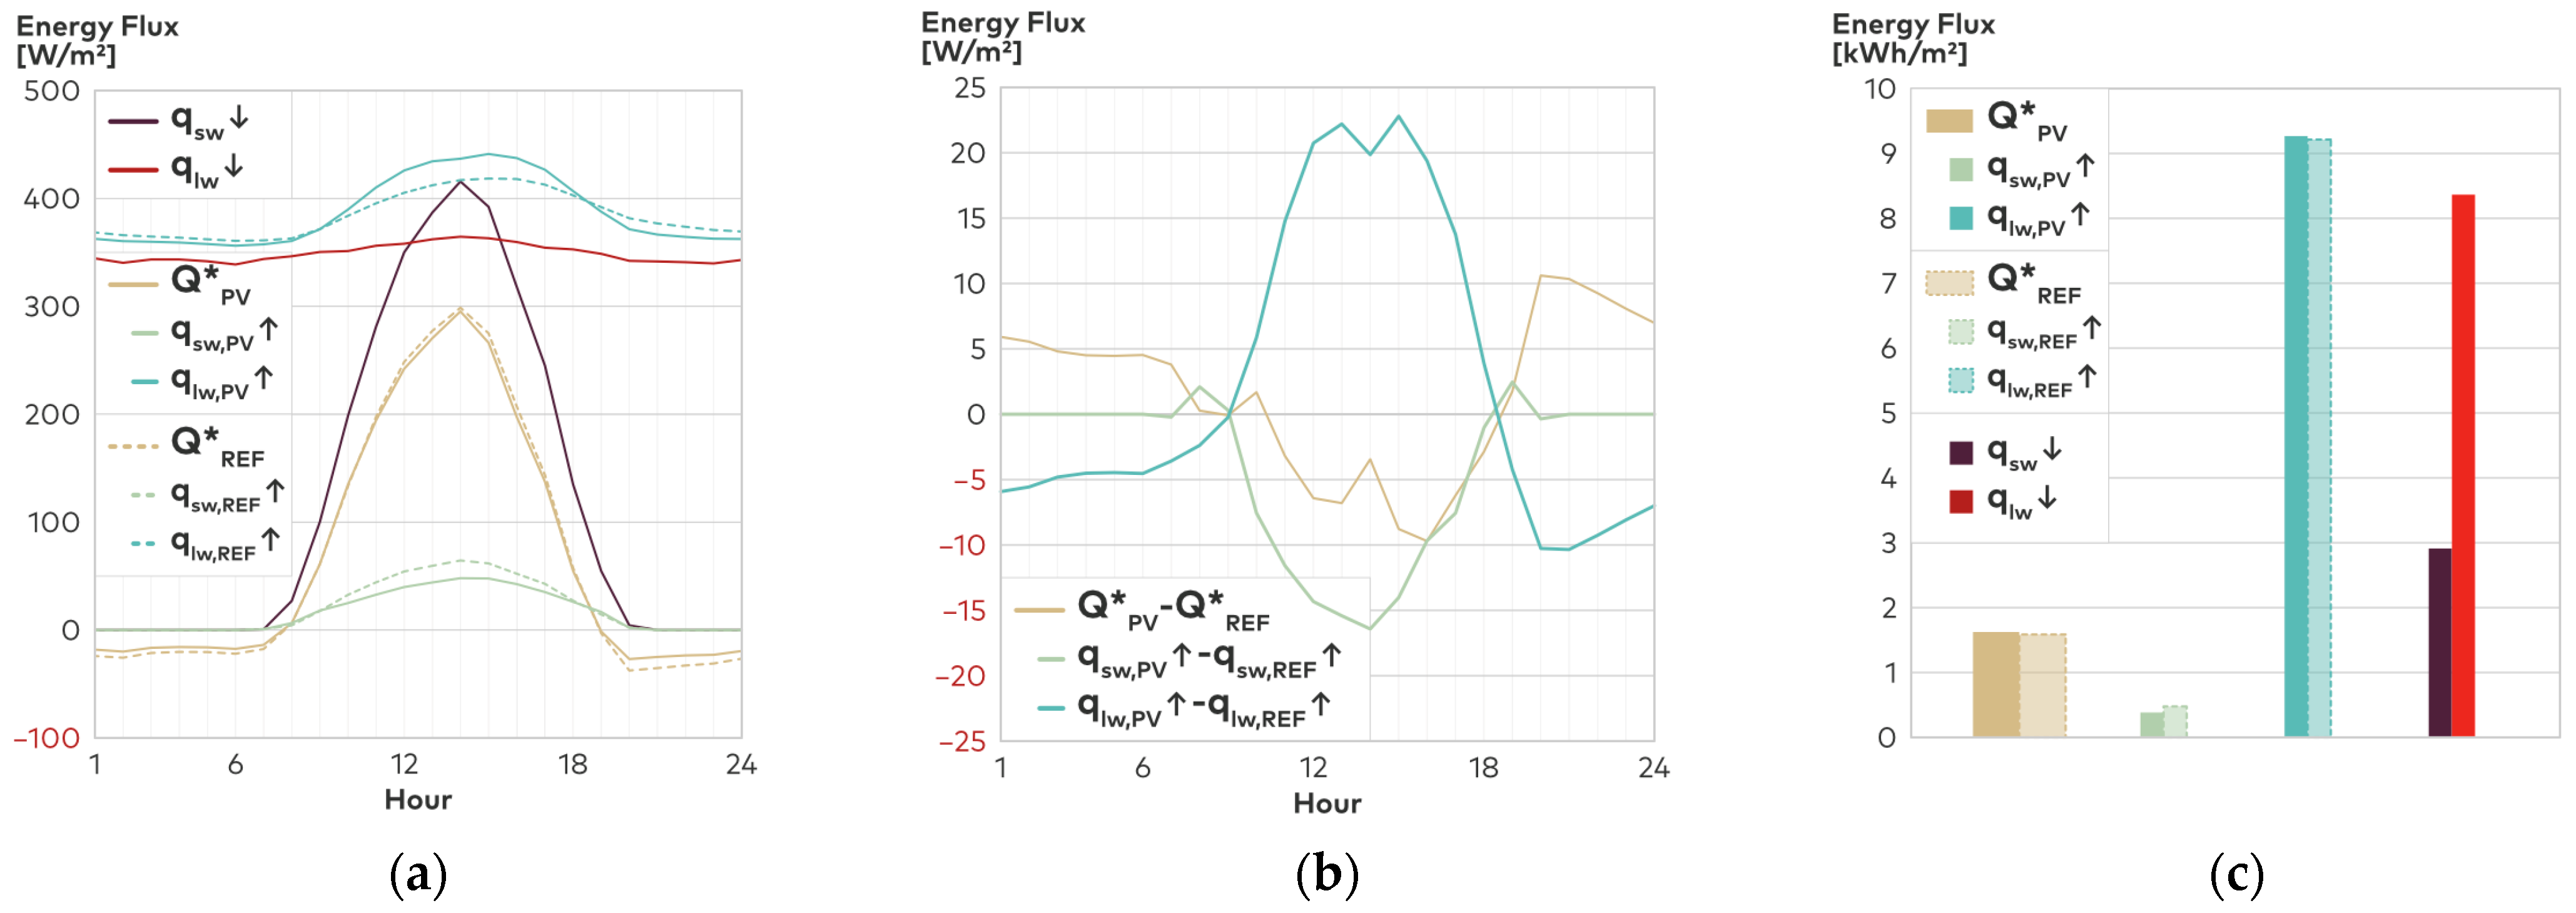
The lower albedo induces a lower upwelling shortwave radiation of the PV modules (qsw,PV↑) compared to the upwelling shortwave radiation from the reference roof (qsw,REF↑) during the day. The maximum monthly averaged difference for September is −16.41 W/m2 between 1 and 2 p.m., and the peak difference amounts to −29.61 W/m2 on 7 September 2022 at noon.
The upwelling longwave radiation fluxes qlw,PV↑ and qlw,REF↑ behave inversely: Higher daytime surface temperatures of the PV modules (see Section 4.1.2) lead to higher upwelling longwave radiation from the PV roof during the day. Monthly averaged, the maximum difference amounts to +22.20 W/m2 at 1 p.m., and the peak difference reaches up to +78.73 W/m2 (13 September 2022 at 1 p.m.). During the night, low thermal inertia leads to lower qlw,PV↑ than qlw,REF↑. Short- and longwave radiation, which combined, lead to a lower total net radiation for the PV roof (Q*PV) during the day, with a maximum difference (monthly averaged) of −6.79 W/m2 at 1 p.m. and a higher Q*PV during the night with a maximum difference (monthly averaged) of +10.62 W/m2 at 8 p.m. (see Figure 11a,b). Figure 11c shows the daily cumulated radiative fluxes averaged for September. The daily qsw,PV↑ is −93.24 Wh/m2 lower than qsw,REF↑, while qlw,PV↑ is +58.13 Wh/m2 higher than qlw,REF↑. This amounts to a higher cumulated daily net radiation Q*PV of +35.11 Wh/m2. Hence, the PV modules absorb and release heat faster, consequently immediately contributing to a heating of the ambient air temperature. The reference roof with the higher albedo absorbs less downwelling radiation, but due to higher thermal inertia, it retains the heat for a longer time and hence, releases it with delay to its surroundings.
4.2.2. Non-Radiative Fluxes
To gain detailed insights into soil heat fluxes (calculated according to Equations (16)–(18)), latent heat fluxes (calculated according to Equation (15)) and sensible (convective) heat fluxes (calculated according to Equations (8)–(14)) of both roofs, we further established the energy balances of the non-radiative heat fluxes.
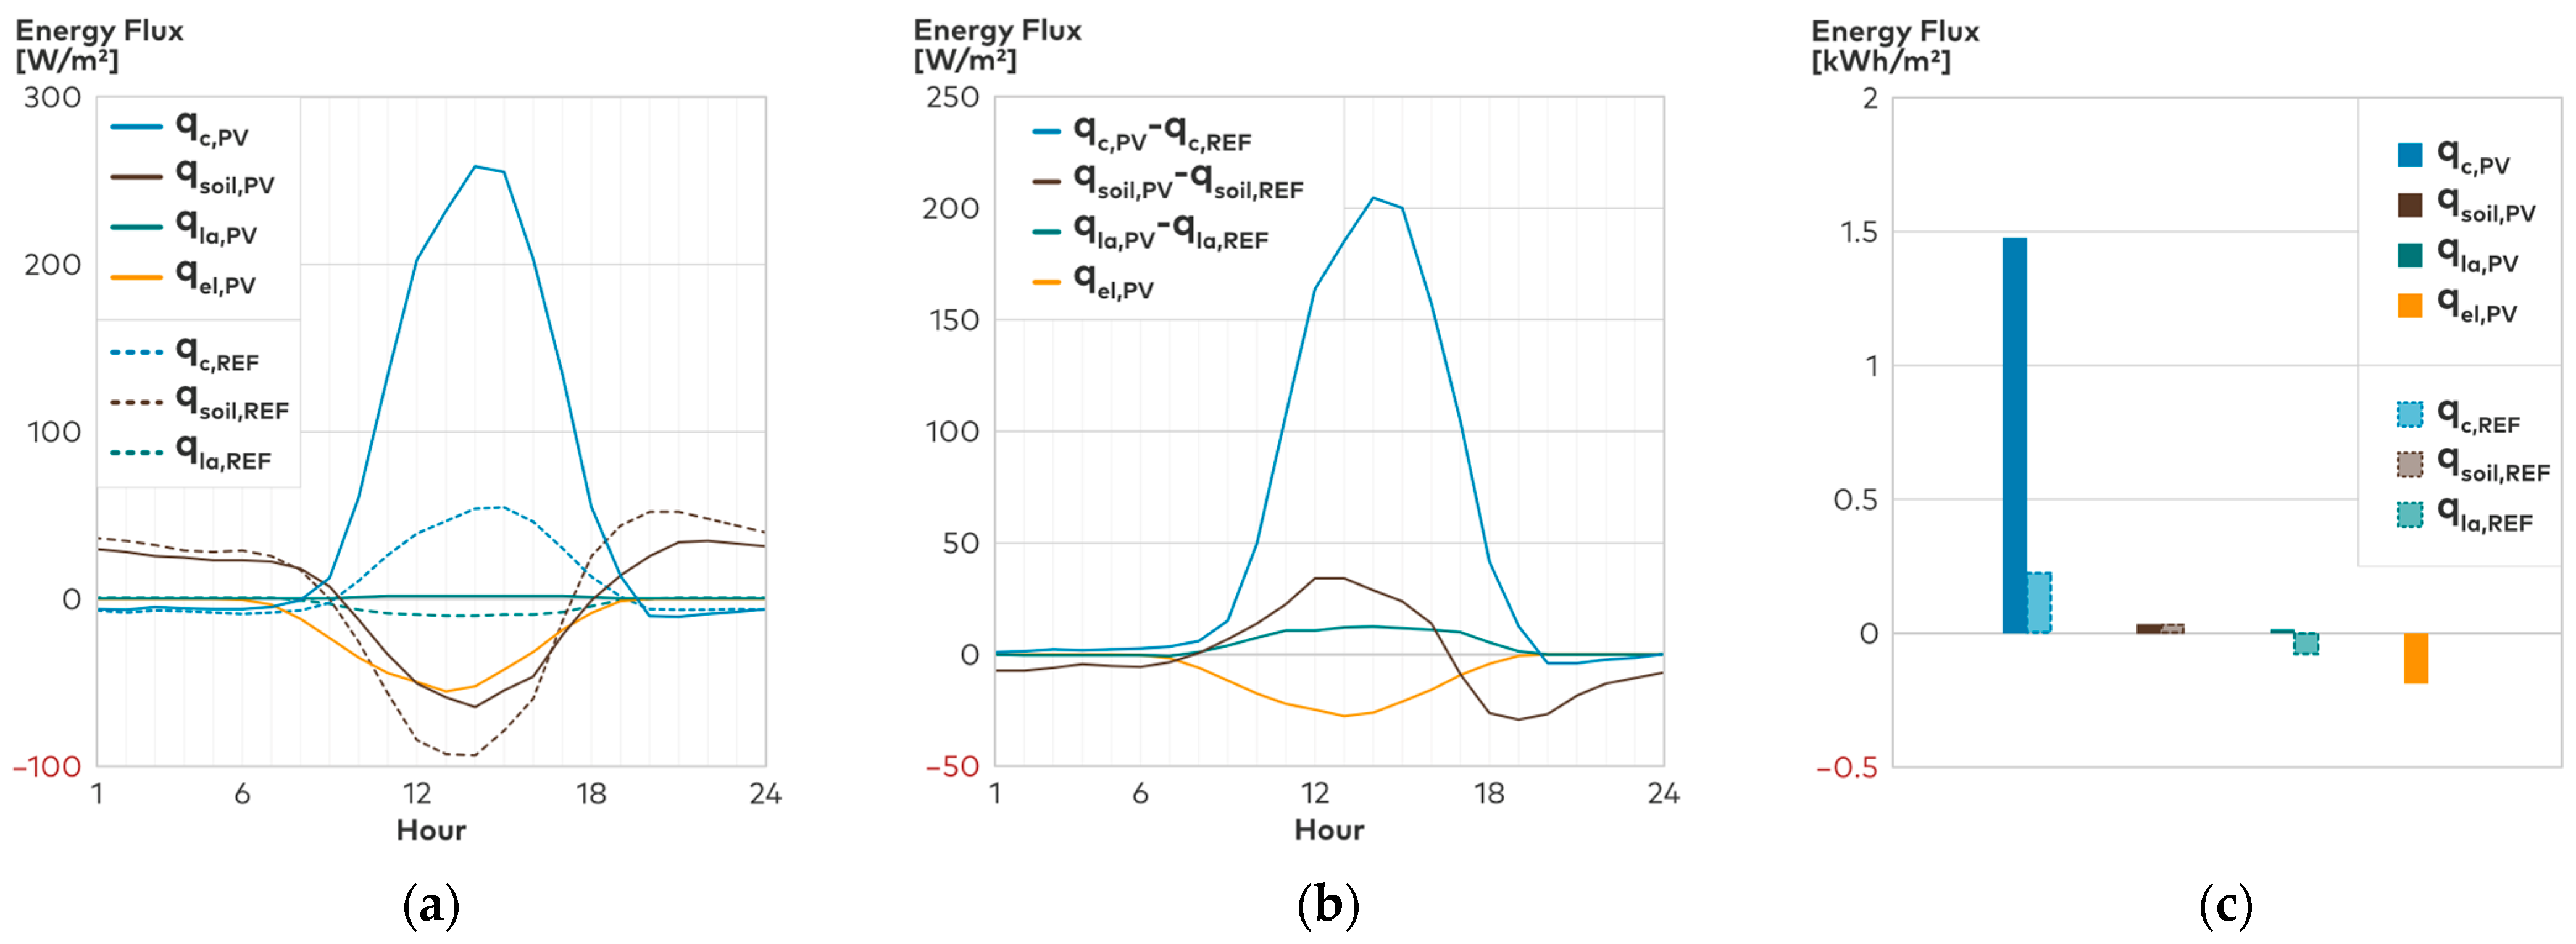
Figure 12a–c illustrates that the soil heat flux of the reference roof (qsoil,REF) reaches higher negative values during the daytime, with a minimum of −127.17 W/m2 (monthly average), while the shading induced by the PV cover leads to a lower negative daytime soil heat flux (qsoil,PV) with a minimum of −73.92 W/m2 (monthly averaged). At night, qsoil,PV is slightly lower, with a maximum of 40.07 W/m2 compared to qsoil,REF with 59.57 W/m2 (monthly average), indicating a lower nocturnal heat release due to a reduced sky view factor. Cumulated daily, the soil heat fluxes of both roofs amount to similar values of 32.34 Wh/m2 for the reference roof and 32.65 Wh/m2 for the PV roof (qsoil,PV).
The latent heat fluxes of both roofs are also in the same order of magnitude, with the reference roof (qla,REF) reaching slightly lower negative values of −77.20 Wh/m2 (daily cumulated) in comparison to the PV roof (qla,PV) with 16.16 Wh/m2.
As a particularity of the PV roof, part of the absorbed energy is converted into electricity (qel,PV) removed from the system boundary, hence not contributing to heating the surrounding thermal microclimate. Cumulated daily, this energy flux amounts to −188.03 Wh/m2 with one third of the PV installation producing energy (see Section 3.4). We expect qel,PV to be three times as high with a fully operative PV plant.
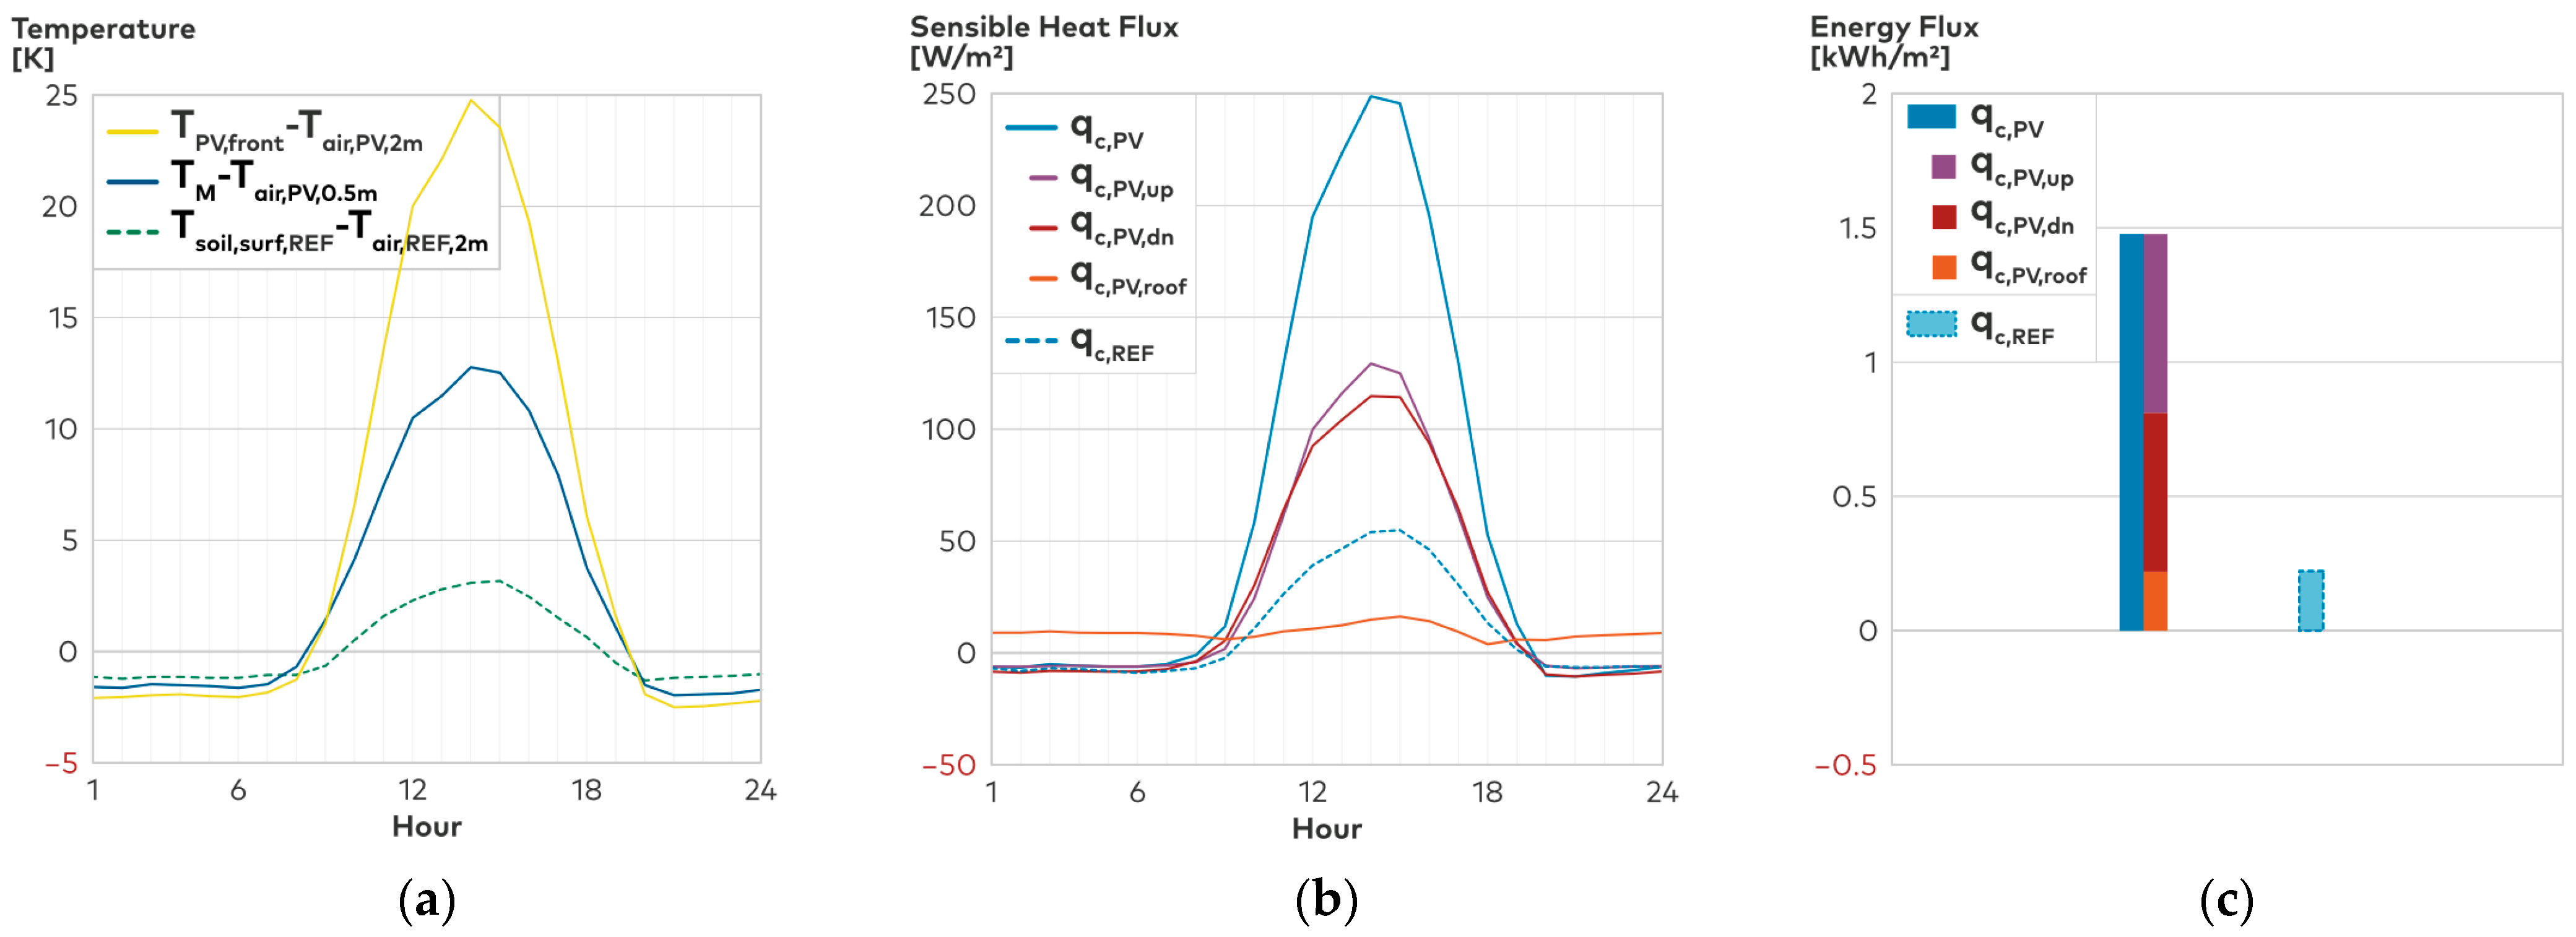
The sensible heat fluxes of the PV roof (qc,PV) are higher than those measured on the reference roof (qc,REF), reaching positive values of up to 254.91 W/m2 (monthly average) in September at 2 p.m. during the day. This leads to a maximum difference of +204.35 W/m2 (monthly average) between both roofs during daytime at 1 p.m. During the night, qc,PV is slightly lower than qc,REF, with a maximum difference of −4.17 W/m2 at 8 p.m. (monthly average). Cumulated daily, the sensible heat fluxes of the PV roof amount to 1476.57 Wh/m2 and those of the reference roof to 226.53 Wh/m2 (monthly averaged).
Figure 13b,c details the different sensible heat fluxes above and beneath the PV installation to further investigate the disparity in sensible heat fluxes. The PV modules introduce an additional element to the surface energy balance of the roof, with two additional surfaces exchanging heat primarily via convection with the surroundings. As shown in Figure 13a, the daytime temperature difference between the PV module surface and the ambient air temperature reaches up to +9.11 K (front) and 15.95 K (back), averaged for the month of September. In August, even higher temperature differences are measured, reaching up to +15.9 K (monthly average) for the front side. As the convective heat exchange is proportional to the temperature difference [9], this results in a convective heat transfer of up to 129.24 W/m2 (monthly average) from the front (qc,PV,up) and 114.17 W/m2 from the rear side (qc,PV,dn) of the PV module to its surroundings. The convective heat transfer on the modules’ back side and downwelling longwave radiation (see Section 4.2.1) increase ambient air temperatures below the PV installation, as shown in Section 4.1.1. The sensible heat fluxes from the modules’ front side result in the higher ambient air temperatures measured above the PV installation (see Section 4.1.1). The convective heat transfer from the soil of the PV roof to its surroundings (qc,PV,roof) is similar to the convective heat fluxes of the reference roof (qc,REF), reaching daily cumulated values of 218.58 Wh/m2 (qc,PV,roof) and 226.53 Wh/m2 (qc,REF).
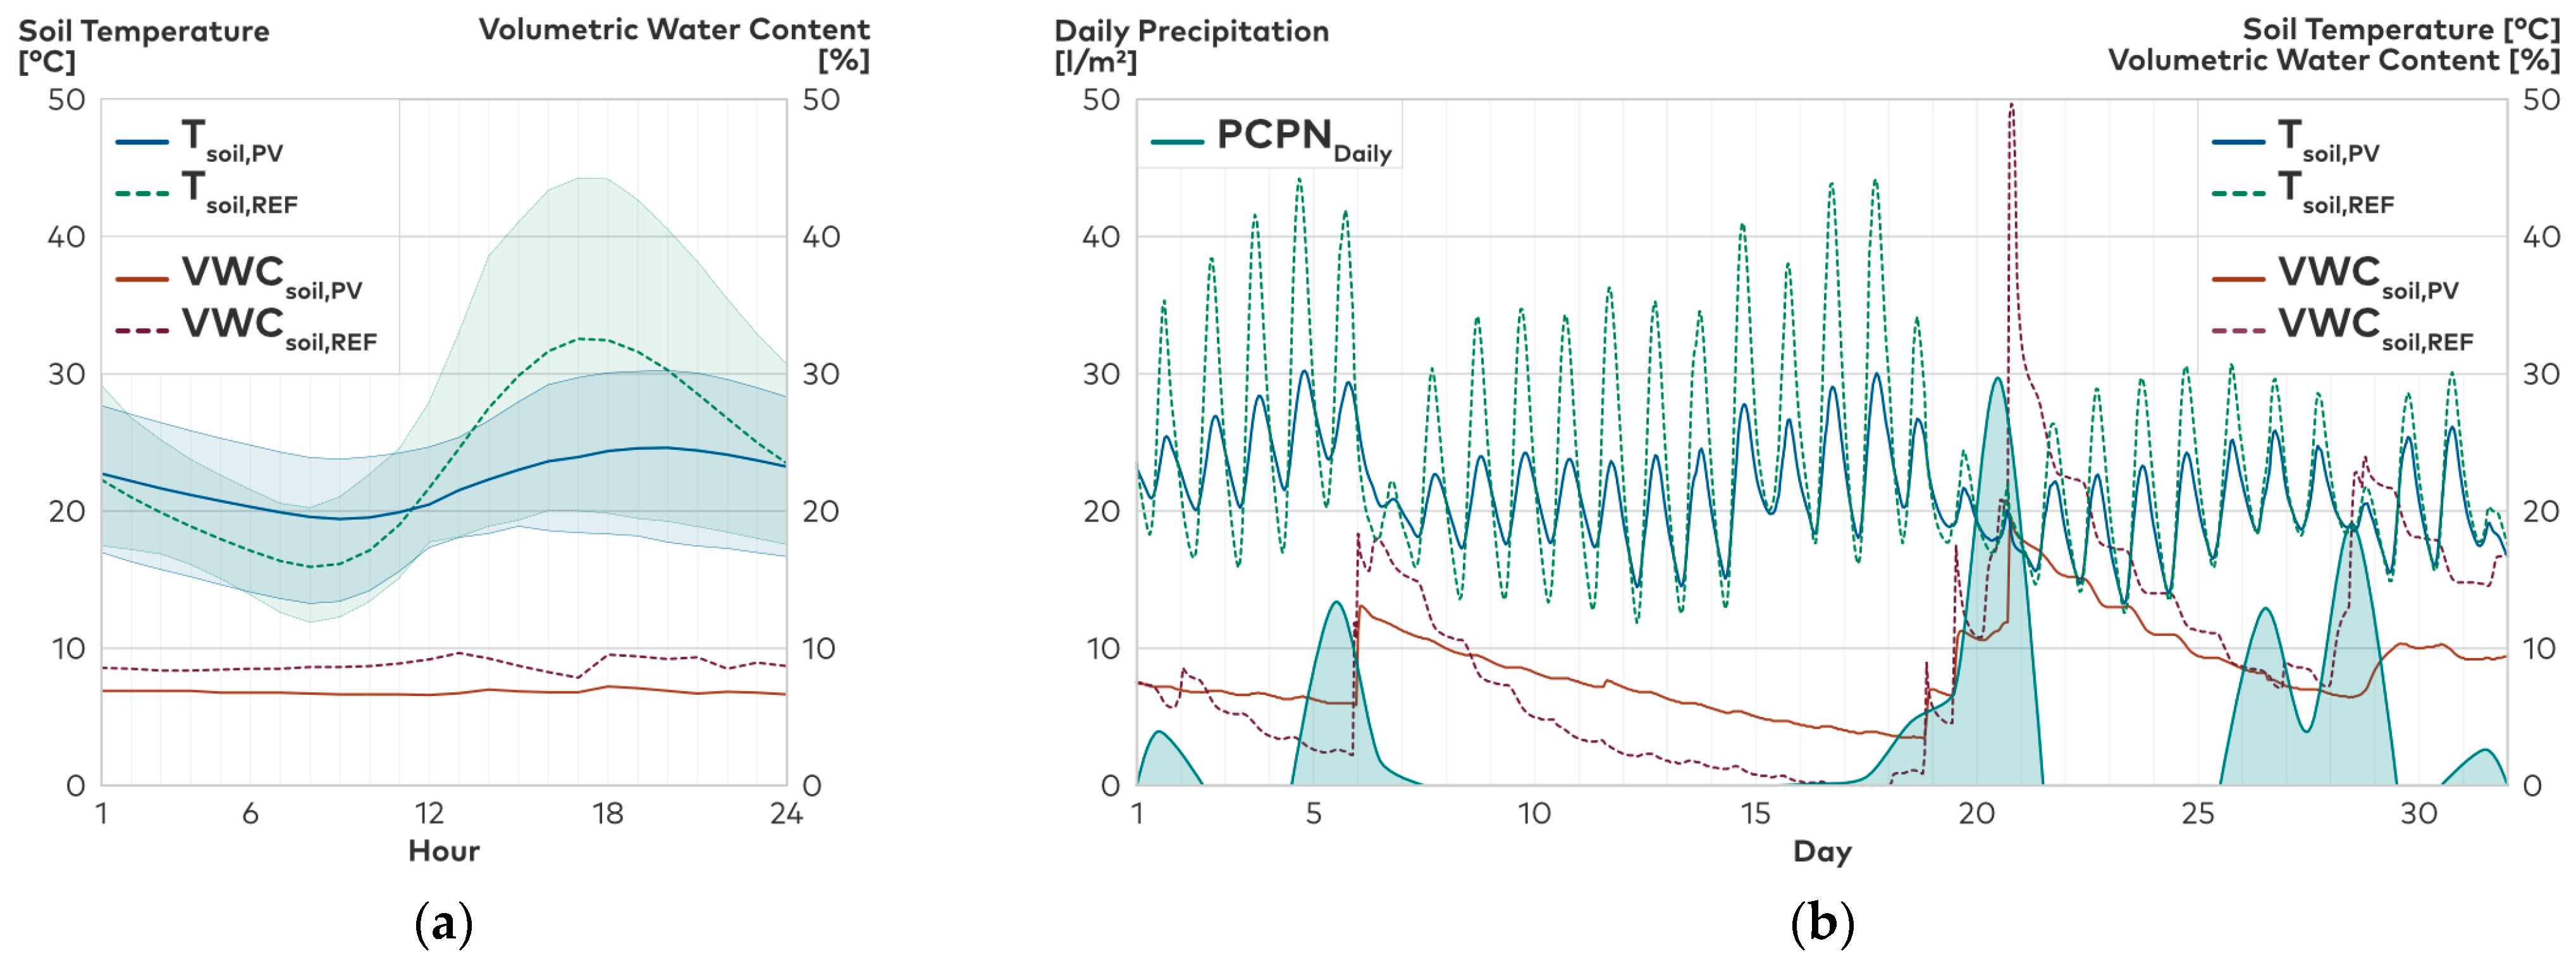
Differences in soil heat fluxes over a day (see Figure 12) originate in varying soil temperatures. The PV modules provide shading to the soil underneath during the day and prevent nighttime cooling due to a reduced sky view factor. Hence, the soil temperature of the PV roof (Tsoil,PV) is nearly constant throughout the day, with a temperature amplitude of a maximum of 4.9 K (averaged for August). In contrast, the temperature of the reference roof (Tsoil,REF) has a daily amplitude (monthly averaged for August) of 16.61 K, reaching its peak at 5 p.m. (32.53 °C) and its lowest values at 8 a.m. (15.92 °C) (see Figure 14a). Moreover, the soil temperature depends on the volumetric water content of the substrate. Figure 14b shows that the volumetric water content increases after precipitation events, decreasing the soil temperatures. The PV cover reduces the amount of rainwater absorbed by the soil beneath. It also leads to longer rainwater retention and decelerated desiccation, hence contributing to a more constant soil temperature. In August, the reference roof dried out between 18 % and 0 % volumetric water content within 10 days, while the PV roof still retained a water content of 5 %, hence contributing to rainwater management.
5. Discussion
5.1. Interpretation of the Results
This study presents the first establishment of a horizontal ambient air temperature profile and energy balance for a real-world-scale rooftop urban photovoltaic installation with the following key results:
- Temperature Analyses
Photovoltaic modules have a moderate daytime heating (maximum +1.35 K) and nighttime cooling (maximum −1.19 K) effect on the surrounding ambient air temperature due to increased convective heat transfer. Above the PV installation, the effect is only measurable on days with low wind velocity. The results correlate with existing metrological investigations in rural environments [16,17]. In contrast, Barron-Gafford et al. [10] identified a nocturnal photovoltaic heat island effect of 3–4 K. As the measurement site of Barron-Gafford et al. [10] is located in a semiarid desert in Arizona, the different surroundings and climate explain the divergent results.
Moreover, convective heat transfer and radiative trapping increase the ambient air temperature beneath the PV installation compared to the ambient air temperature measured above the PV installation. Our results contrast the study of Armstrong et al. [49], identifying lower ambient air temperatures beneath the PV installation during the day in summer. Armstrong et al. [49] explain their results with lower shortwave radiation receipts beneath the PV installation. However, they neglect longwave radiation and convection. The differing results might also be due to the extensive vegetation on the measurement site of Armstrong et al. [49] compared to the extensive green roof on our measurement site.
Due to lower thermal storage capacity, PV modules’ surface temperatures are higher during the day and lower during the night when compared to the soil surface temperatures of an extensive green roof. While Jiang et al. [17] found similar results, Broadbent et al. [16] measured nearly identical surface temperatures for the PV modules and the reference surface, presumably due to differing soil characteristics. In contrast to the higher diurnal amplitude of PV surface temperatures, the shading of the PV modules maintains steadier temperature and humidity conditions of the soil beneath them, hence contributing to rainwater management and biodiversity.
- Energy Balanc—Radiative fluxes
The PV modules’ albedo is 0.04 lower than the reference roof’s albedo, leading to a higher day upwelling longwave radiation from the PV roof. In contrast, the daytime upwelling shortwave radiation is lower. This tendency correlates with the findings of Jiang et al. [17]; however, they measured shortwave radiation fluxes of a higher order of magnitude. The lower shortwave radiation fluxes in our measurements are due to the measurement period of September–for measurements during earlier summer months, we expect to also identify more significant shortwave radiation fluxes. Contrary to Jiang et al. [17] and our findings, Broadbent et al. [16] measured a higher daytime upwelling longwave radiation from the reference site than from the PV site. This finding correlates with the higher surface temperatures of the reference surface they identified and probably relies on differing soil albedo values compared to our and Jiang’s measurement set-ups.
- Energy Balance—Non-radiative fluxes
The PV installation increases the convective heat transfer by adding an additional layer to the energy balance that upwards and downwards exchanges heat via convection. Thus, the PV roof’s convective heat transfer is significantly larger than the reference roof’s, particularly during the day. Our results correlate with the findings of Brown et al. [23], Pham et al. [25] and Scherba [50]. In contrast, Broadbent et al. [16] and Jiang et al. [17] only account for the convective heat fluxes above the PV installation; hence, they significantly underestimate heat transfer via convection on the PV sites. Moreover, the production of solar energy removes part of the energy as electricity, leading to a temperature reduction of an active PV module (with an efficiency of up to 19.5%) of up to 6.18 K compared to the temperature of an inactive module. However, the energy removal due to electricity production only partly compensates for the higher convective heat transfer due to the PV installation. Furthermore, the steadier, PV-induced soil conditions lead to lower fluctuations in soil heat flux. Similar to Broadbent et al. [16] and Jiang et al. [17], we identified less soil heat absorption during the day and less nocturnal heat release due to the reduced sky view factor. The soil heat fluxes, however, only account for an insignificant share of the total energy balances.
5.2. Methods
In the following section, the methodological approach applied in this study is discussed:
- Temperature Analyses
The temperature analysis is a robust measurement method, and the ambient air temperature is an intuitive metric to describe the impact of PV on the thermal microclimate. However, while temperature measurements provide first insights into the topic, they are unsuitable for understanding the physical processes. As a further limitation to the temperature analyses, the rooftop surface is taken as the reference height. Hence, the temperature probes are mounted at a smaller distance to the PV module surface than to the reference roofs’ surface, thus inducing some measurement issues. Moreover, the modest differences in ambient air temperature can only be recorded on days with low wind velocity.
- Energy Balances
By establishing energy balances, we aim to retrace the energy fluxes and to account for minor effects not captured by the ambient air temperature measurements. This methodological approach requires additional sensors and subsequent calculations, hence combining metrological and calculative methods, as not all required parameters could be acquired by metrological investigations.
However, the establishment of energy balances is not explicit: the PV modules add an additional layer to the PV roofs’ energy balance, and is the most suitable means of accounting for it is contentious [23,25]. As the higher temperatures beneath the PV installation indicate, solely considering the heat fluxes above the PV significantly underestimates the convective fluxes. Hence, we added the convective heat fluxes above and beneath the PV modules. However, we did not consider heat transfer via conduction by the PV sub-construction and only indirectly accounted for precipitation via soil humidity, assuming that these processes are negligible. Furthermore, comparing the upwelling fluxes from a horizontal reference roof to those of an inclined PV installation might introduce some minor divergences, particularly concerning the upwelling shortwave radiation.
In conclusion, energy fluxes are more complex to understand and interpret than temperatures as a metric and some assumptions are necessary to fully establish the energy balances. However, they allow us to retrace and evaluate the physical processes leading to the increase and decrease in ambient air temperature.
- Measurements
Even though the research design aims to find universally valid results, some limitations must be mentioned: The measurements only took place on one exemplary photovoltaic installation and one reference roof without comparative measurements on further rooftops. Here, the specific PV installation in the shape of an uneven saddled roof on the measurement site allows the maximum number of PV modules to be mounted on the rooftop, hence representing extreme circumstances. Accordingly, we expect the impacts on the thermal microclimate to be attenuated for standard configurations with fewer PV modules. Conversely, the semi-transparent PV modules are an expedient solution for resolving the competition for building envelope surfaces and balancing climate protection and climate change adaptation strategies as they grant sufficient solar radiation to the vegetation beneath them–opaque modules with lower albedo values, however, would enhance the identified impacts.
As a further limitation, the energy balances could not be established for the hottest summer periods, hence not for the time of the year when climatic conditions most intensely impact the human cardiovascular system. We expect the identified impacts on energy balance and temperature to be more pronounced in the months with higher solar radiation and ambient air temperatures. Furthermore, from August 26th on, 60 south-oriented PV modules stopped producing energy due to the failure of the solar inverter. Even though we only accounted for the active PV modules, the failure induces certain imprecisions into the energy balances. With a functional PV array, the heat removal due to electricity production would be three times as high. Moreover, while we estimated latent heat fluxes using the ASCE Penman–Monteith equation, an accurate investigation further requires eddy covariance (EC) measurement set-ups. However, as the latent heat fluxes only represent a modest share of the energy fluxes, the lack of EC measurement does not significantly impact our research results.
Altogether, metrological studies can only represent one specific situation, and the results largely depend on the reference measurements. Hence, comparing studies with different locations and measurement set-ups and identifying universally valid quantitative results is challenging. However, daily trends in temperature measurements and energy fluxes are qualitatively transferable to further sites.
6. Conclusions
The research question, ‘How do photovoltaic installations on urban rooftops impact the surrounding thermal microclimate during summertime?’ needs to be answered separately for day- and nighttime.
During the day, PV installations have a moderate warming effect on the adjacent ambient air temperature, primarily due to enhanced convective heat transfer. With current PV efficiencies, the conversion of solar radiation into electricity does not compensate for the higher convective heat transfer. However, the daytime heating effect of rooftop PV installations with temperature differences of a maximum of +1.35 K is not as pronounced as generally assumed. Hence, the conflict of interests between green roofs as a climate adaptation measure and rooftop PV as a climate protection measure is overestimated. During the night, PV modules have a slight cooling effect on the adjacent thermal microclimate due to their low heat storage capacity and the reduced heat release of the soil beneath the modules. Hence, PV modules are even slightly beneficial for nocturnal recovery as a key element for human health. Daily cumulated, the daytime heating effect exceeds the nighttime cooling impact. Concerning the radiative energy fluxes, we identified a higher daytime upwelling longwave radiation from the PV roof due to higher surface temperatures and lower daytime upwelling shortwave radiation. Among the non-radiative energy fluxes, the convective heat transfer has the highest impact on the thermal microclimate. As PV installations introduce an additional layer to the rooftop, the convective heat transfer is significantly higher than on a conventional rooftop. With proceeding technological progress and higher PV efficiencies, however, a larger share of energy will be removed from the system in the form of electricity and hence, reduce the heating effect due to high module temperatures and the resulting convective heat transfer.
The present study contributes to closing the research gap. However, some limitations such as sensor failure, inverter failure and measurements at a specific PV installation with semi-transparent PV modules raise further research topics: establishing energy balances for the hottest summer months would provide valuable information on the physical processes during weather conditions with higher solar radiation and higher ambient air temperatures that are critical for human health. Moreover, as available urban roof areas and open spaces for solar systems are limited, building facades become relevant for energy activation, raising the question of how energy-activated facades interact with the thermal microclimate. As urban building facades and their materiality and physical characteristics directly influence the thermal microclimate within street canyons and hence, human health and well-being, studies concerning the impact of facade-integrated PVs on their surroundings should also include investigations of outdoor thermal comfort and mean radiant temperature. Moreover, establishing energy balances at a larger scale would provide answers regarding how far the enhanced convective heat transfer impacts the thermal microclimate at city level.
Supplementary Materials
The following supporting information can be downloaded at https://www.mdpi.com/article/10.3390/buildings13092339/s1. Data sheets of the utilized sensors.
Author Contributions
Conceptualization, E.F.; Methodology, E.F.; Software, E.F., S.P., J.R.; Validation, E.F., S.P. and J.R.; Formal Analysis, E.F.; Investigation, E.F., S.P. and J.R.; Resources, S.P.; Data Curation, S.P.; Writing—Original Draft Preparation, E.F.; Writing—Review and Editing, E.F., C.H., S.P.; Visualization, J.R.; Supervision, C.H.; Project Administration, E.F.; Funding Acquisition, C.H. All authors have read and agreed to the published version of the manuscript.
Funding
This project was funded by the Bavarian Ministry of Science and the Arts in the context of the Bavarian Climate Research Network (bayklif).
Data Availability Statement
The data presented in this study are available on request from the corresponding author.
Acknowledgments
The authors sincerely thank Andreas Horn for his support in organizing the metrological investigations, for sharing his knowledge and reflections concerning the physical processes between PV and thermal microclimate and for numerous inspired discussions.
Conflicts of Interest
The authors declare no conflict of interest.
Nomenclature
| Variables and parameters | ||
| cn | constant | - |
| cm | constant | - |
| a | experimental coefficient | - |
| b | experimental coefficient | - |
| cd | heat capacity of the dry soil | J/kg°C |
| cs | soil heat capacity | J/m³°C |
| cW | heat capacity of water | J/kg°C |
| D | depth of the heat flux plate | m |
| ea | average vapor pressure | kPa |
| es | average saturation vapor pressure | kPa |
| G | soil heat flux density | MJ/m2h |
| GT | global irradiation | W/m2 |
| hc | heat transfer coefficient | - |
| hc0 | film heat transfer coefficient | - |
| hn | natural convection coefficient | - |
| Q* | net radiation | W/m2 |
| qc | convective heat | W/m2 |
| qc,PV,dn | convective heat beneath the PV modules | W/m2 |
| qc,PV,roof | convective heat from the roof beneath the PV modules | W/m2 |
| qc,PV,up | convective heat above the PV modules | W/m2 |
| qel,PV | electricity produced by the PV module | W/m2 |
| qhfp | soil heat flux measured by a heat flux plate | W/m2 |
| qla | latent heat | W/m2 |
| qlw↓ | downwelling longwave radiation | W/m2 |
| qlw↑ | upwelling longwave radiation | W/m2 |
| qsoil | ground heat | W/m2 |
| qsubstrate | average stored heat within the substrate above the heat flux plate | W/m2 |
| qsw↓ | downwelling shortwave radiation | W/m2 |
| qsw↑ | upwelling shortwave radiation | W/m2 |
| Rf | experimental coefficient | - |
| Ta | ambient air temperature | °C |
| Tc | cell temperature | °C |
| Tfront | front-surface module temperature | °C |
| Ti | current soil temperature | °C |
| Ti-1 | soil temperature of the previous time step | °C |
| TM | back-surface module temperature | °C |
| Tsoil,surf | temperature roof surface | °C |
| t | time interval | s |
| v | average hourly local wind velocity | m/s |
| ρb | bulk density | kg/m3 |
| θ | water content of the soil | m3 |
| ρW | density of water | kg/m3 |
| ƞmodule | module efficiency | % |
| γ | psychrometric constant | kPa/°C |
| ET | evapotranspiration | |
| PV | photovoltaic | |
| REF | reference roof | |
| UHI | urban heat island | |
References
- Hepf, C.; Bausch, K.; Lauss, L.; Koth, S.C.; Auer, T. Impact of Dynamic Emission Factors of the German Electricity Mix on the Greenhouse Gas Balance in Building Operation. Buildings 2022, 12, 2215. [Google Scholar] [CrossRef]
- Hepf, C.; Overhoff, L.; Koth, S.C.; Gabriel, M.; Briels, D.; Auer, T. Impact of a Weather Predictive Control Strategy for Inert Building Technology on Thermal Comfort and Energy Demand. Buildings 2023, 13, 996. [Google Scholar] [CrossRef]
- Deilami, K.; Kamruzzaman, M.; Liu, Y. Urban heat island effect: A systematic review of spatio-temporal factors, data, methods, and mitigation measures. Int. J. Appl. Earth Obs. Geoinf. 2018, 67, 30–42. [Google Scholar] [CrossRef]
- Yang, L.; Qian, F.; Song, D.-X.; Zheng, K.-J. Research on Urban Heat-Island Effect. Procedia Eng. 2016, 169, 11–18. [Google Scholar] [CrossRef]
- Stone, B.; Rodgers, M.O. Urban Form and Thermal Efficiency: How the Design of Cities Influences the Urban Heat Island Effect. J. Am. Plan. Assoc. 2001, 67, 186–198. [Google Scholar] [CrossRef]
- Debbage, N.; Shepherd, J.M. The urban heat island effect and city contiguity. Comput. Environ. Urban Syst. 2015, 54, 181–194. [Google Scholar] [CrossRef]
- Kuttler, W. Klimawandel im urbanen Bereich: Teil 1, Wirkungen. Environ. Sci. Eur. 2011, 23, 1–12. [Google Scholar]
- Fassbender, E.; Hemmerle, C. Interdependencies Between Photovoltaics and Thermal Microclimate. In Advanced Materials in Smart Building Skins for Sustainability; Wang, J., Shi, D., Song, Y., Eds.; Springer International Publishing: Cham, Switzerland, 2023; pp. 189–206. ISBN 978-3-031-09694-5. [Google Scholar]
- Sailor, D.J.; Anand, J.; King, R.R. Photovoltaics in the built environment: A critical review. Energy Build. 2021, 253, 111479. [Google Scholar] [CrossRef]
- Barron-Gafford, G.A.; Minor, R.L.; Allen, N.A.; Cronin, A.D.; Brooks, A.E.; Pavao-Zuckerman, M.A. The Photovoltaic Heat Island Effect: Larger solar power plants increase local temperatures. Sci. Rep. 2016, 6, 35070. [Google Scholar] [CrossRef]
- Genchi, Y.; Ishisaki, M.; Ohashi, Y.; Takahashi, H.; Inaba, A. Impacts of large-scale photovoltaic panel installation on the heat island effect in Tokyo. In Proceedings of the Fifth Conference on the Urban Climate, Łódź, Poland, 1–5 September 2003. [Google Scholar]
- Wang, Y.; Tian, W.; Zhu, L.; Ren, J.; Liu, Y.; Zhang, J.; Yuan, B. Interactions between Building Integrated Photovoltaics and Microclimate in Urban Environments. Energy Build. 2006, 128, 168–172. [Google Scholar] [CrossRef]
- Masson, V.; Bonhomme, M.; Salagnac, J.-L.; Briottet, X.; Lemonsu, A. Solar panels reduce both global warming and urban heat island. Front. Environ. Sci. 2014, 2, 14. [Google Scholar] [CrossRef]
- Salamanca, F.; Georgescu, M.; Mahalov, A.; Moustaoui, M.; Martilli, A. Citywide Impacts of Cool Roof and Rooftop Solar Photovoltaic Deployment on Near-Surface Air Temperature and Cooling Energy Demand. Bound. Layer Meteorol. 2016, 161, 203–221. [Google Scholar] [CrossRef]
- Taha, H. The potential for air-temperature impact from large-scale deployment of solar photovoltaic arrays in urban areas. Sol. Energy 2013, 91, 358–367. [Google Scholar] [CrossRef]
- Broadbent, A.M.; Krayenhoff, E.S.; Georgescu, M.; Sailor, D.J. The Observed Effects of Utility-Scale Photovoltaics on Near-Surface Air Temperature and Energy Balance. J. Appl. Meteorol. Climatol. 2019, 58, 989–1006. [Google Scholar] [CrossRef]
- Jiang, J.; Gao, X.; Lv, Q.; Li, Z.; Li, P. Observed impacts of utility-scale photovoltaic plant on local air temperature and energy partitioning in the barren areas. Renew. Energy 2021, 174, 157–169. [Google Scholar] [CrossRef]
- Wu, W.; Yue, S.; Zhou, X.; Guo, M.; Wang, J.; Ren, L.; Yuan, B. Observational Study on the Impact of Large-Scale Photovoltaic Development in Deserts on Local Air Temperature and Humidity. Sustainability 2020, 12, 3403. [Google Scholar] [CrossRef]
- Berardi, U.; Graham, J. Investigation of the impacts of microclimate on PV energy efficiency and outdoor thermal comfort. Sustain. Cities Soc. 2020, 62, 102402. [Google Scholar] [CrossRef]
- Brito, M.C. Assessing the Impact of Photovoltaics on Rooftops and Facades in the Urban Microclimate. Energies 2020, 13, 2717. [Google Scholar] [CrossRef]
- Chang, R.; Luo, Y.; Zhu, R. Simulated local climatic impacts of large-scale photovoltaics over the barren area of Qinghai, China. Renew. Energy 2020, 145, 478–489. [Google Scholar] [CrossRef]
- Cortes, A.; Murashita, Y.; Matsuo, T.; Kondo, A.; Shimadera, H.; Inoue, Y. Numerical evaluation of the effect of photovoltaic cell installation on urban thermal environment. Sustain. Cities Soc. 2015, 19, 250–258. [Google Scholar] [CrossRef]
- Brown, K.E.; Baniassadi, A.; Pham, J.V.; Sailor, D.J.; Phelan, P.E. Effects of Rooftop Photovoltaics on Building Cooling Demand and Sensible Heat Flux into the Environment for an Installation on a White Roof. J. Eng. Sustain. Build. Cities 2020, 1, 021001. [Google Scholar] [CrossRef]
- Tian, W.; Wang, Y.; Xie, Y.; Wu, D.; Zhu, L.; Ren, J. Effect of building integrated photovoltaics on microclimate of urban canopy layer. Build. Environ. 2007, 42, 1891–1901. [Google Scholar] [CrossRef]
- Pham, J.V.; Baniassadi, A.; Brown, K.E.; Heusinger, J.; Sailor, D.J. Comparing photovoltaic and reflective shade surfaces in the urban environment: Effects on surface sensible heat flux and pedestrian thermal comfort. Urban Clim. 2019, 29, 100500. [Google Scholar] [CrossRef]
- Booten, C.; Kruis, N.; Christensen, C. Identifying and Resolving Issues in EnergyPlus and DOE-2 Window Heat Transfer Calculations; National Renewable Energy Lab.: Golden, CO, USA, 2012.
- Yazdanian, M.; Klems, J.H. Measurement of the Exterior Convective Film Coefficient for Windows in Low-Rise Buildings. ASHRAE Trans. 1993, 100, 1–19. [Google Scholar]
- Del Barrio, E.P. Analysis of the green roofs cooling potential in buildings. Energy Build. 1998, 27, 179–193. [Google Scholar] [CrossRef]
- Walter, I.A.; Allen, R.G.; Elliott, R.; Jensen, M.E.; Itenfisu, D.; Mecham, B.; Howell, T.A.; Snyder, R.; Brown, P.; Echings, S.; et al. ASCE’s Standardized Reference Evapotranspiration Equation. In Watershed Management and Operations Management 2000, Proceedings of Watershed Management and Operations Management Conferences 2000, Fort Collins, CO, USA, 20–24 June 2000; Flug, M., Frevert, D., Watkins, J.W., Eds.; American Society of Civil Engineers: Reston, VA, USA, 2001; pp. 1–11. ISBN 978-0-7844-0499-7. [Google Scholar]
- Mirsadeghi, M.; Cóstola, D.; Blocken, B.; Hensen, J. Review of external convective heat transfer coefficient models in building energy simulation programs: Implementation and uncertainty. Appl. Therm. Eng. 2013, 56, 134–151. [Google Scholar] [CrossRef]
- Allen, R.G.; Walter, I.A.; Elliott, R.; Howell, T.A.; Itenfisu, D.; Jensen, M.E.; Snyder, R. ASCE Standardized Reference Evapotranspiration Equation. 2005. Available online: https://xwww.mesonet.org/images/site/ASCE_Evapotranspiration_Formula.pdf (accessed on 23 August 2023).
- Paul Bauder GmbH & Co.KG. Bauder Pflanzsubstrat BL-C03: Produktdatenblatt; Paul Bauder GmbH & Co. KG: Stuttgart, Germany, 2018. [Google Scholar]
- Sailor, D.J.; Hutchinson, D.; Bokovoy, L. Thermal property measurements for ecoroof soils common in the western U.S. Energy Build. 2008, 40, 1246–1251. [Google Scholar] [CrossRef]
- United States Geological Survey. Specific Heat Capacity and Water. Available online: https://www.usgs.gov/special-topics/water-science-school/science/specific-heat-capacity-and-water (accessed on 6 July 2023).
- United States Geological Survey. Water Density. Available online: https://www.usgs.gov/special-topics/water-science-school/science/water-density (accessed on 6 July 2023).
- Busch, J. Designing Urban Microclimates: Passive Low-Tech-Kühlung im Entwurf Städtischer Außenräume. Ph.D. Thesis, Technische Universität Braunschweig, Braunschweig, Germany, 2019. [Google Scholar]
- Misara, S. Thermal Impacts on Building Integrated Photovoltaic (BIPV) (Electrical, Thermal and Mechanical Characteristics). Ph.D. Thesis, Universität Kassel, Kassel, Germany, 2014. [Google Scholar]
- Knaupp, W. Analyse und Optimierung von Photovoltaik-Modulen. Ph.D. Thesis, Rheinisch-Westfaelische Technische Hochschule Aachen, Aachen, Germany, 1997. [Google Scholar]
- Duffie, J.A.; Beckman, W.A. Solar Engineering of Thermal Processes; John Wiley & Sons, Inc.: Hoboken, NJ, USA, 2013; ISBN 9781118671603. [Google Scholar]
- Solcerova, A.; van Emmerik, T.; van de Ven, F.; Selker, J.; van de Giesen, N. Skin Effect of Fresh Water Measured Using Distributed Temperature Sensing. Water 2018, 10, 214. [Google Scholar] [CrossRef]
- Häckel, H. Meteorologie, 9r; utb GmbH: Stuttgart, Germany, 2021; ISBN 978-3-8252-5504-6. [Google Scholar]
- Yang, L.; Gao, X.; Lv, F.; Hui, X.; Ma, L.; Hou, X. Study on the local climatic effects of large photovoltaic solar farms in desert areas. Sol. Energy 2017, 144, 244–253. [Google Scholar] [CrossRef]
- Pytlik, S. Messkonzept zur Evaluierung der Auswirkungen Urbaner Photovoltaik auf das Lokale Mikroklima. Master’s Thesis, Technische Universität München, Munich, Germany, 2022. [Google Scholar]
- Dobos, E. Albedo. In Encyclopedia of Soil Science, Second Edition; Lal, R., Ed.; CRC Press: Boca Raton, FL, USA, 2005; ISBN 978-0-8493-3830-4. [Google Scholar]
- Hanks, R.J. Soil Heat Flow and Temperature. In Applied Soil Physics; Hanks, R.J., Ed.; Springer: New York, NY, USA, 1992; pp. 139–159. ISBN 978-1-4612-7728-6. [Google Scholar]
- Campbell Scientific Ltd. Product Manual HFP01 Soil Heat Flux Plate. 2020. Available online: https://s.campbellsci.com/documents/us/manuals/hfp01.pdf (accessed on 7 July 2023).
- Hepf, C.; Schmid, T.; Brunet, F.; Auer, T. Validation of a thermodynamic building model based on weather and thermal measurement data. In Proceedings of the 9th Conference of IBPSA-Germany and Austria, Bauhaus-Universität Weimar, Weimar, Germany, 20–22 September 2022; pp. 195–200, ISBN 978-3-00-073975-0. [Google Scholar]
- Lave, M.S. Albedo and Diffuse POA Measurements to Evaluate Transposition Model Uncertainty; Sandia National Lab.: Livermore, CA, USA, 2015.
- Armstrong, A.; Ostle, N.J.; Whitaker, J. Solar park microclimate and vegetation management effects on grassland carbon cycling. Environ. Res. Lett. 2016, 11, 74016. [Google Scholar] [CrossRef]
- Scherba, A. Modeling the Impact of Roof Reflectivity, Integrated Photovoltaic Panels and Green Roof Systems on the Summertime Heat Island. Master’s Thesis, Portland State University, Portland, OR, USA, 2011. [Google Scholar]
Figure 1.
Methodological approach for analyzing the microthermal impacts of photovoltaics.

Figure 3.
(a) Aerial view of the measurement site: 1 = reference roof, 2 = PV roof; (b) PV roof.

Figure 4.
Positions of the anemometer, the temperature and relative humidity sensor and the thermistors (A–K) above and next to the photovoltaic installation (based on [43]).
Figure 4.
Positions of the anemometer, the temperature and relative humidity sensor and the thermistors (A–K) above and next to the photovoltaic installation (based on [43]).

Figure 5.
Measurement set-up (based on [43]) with 1–8 referring to the sensors listed in Table 2. (a) Reference roof; (b) PV roof (red line: the sensor mounted on the rear side of the PV module).

Figure 6.
Ambient air temperature profile (monthly averaged) measured at a height of two meters above the reference roof (Tair,REF,2m) and the PV roof (Tair,PV,2m). (a) July (16th–31st); (b) August; (c) September.
Figure 6.
Ambient air temperature profile (monthly averaged) measured at a height of two meters above the reference roof (Tair,REF,2m) and the PV roof (Tair,PV,2m). (a) July (16th–31st); (b) August; (c) September.

Figure 7.
Hourly ambient air temperatures (monthly averaged) and minimum/maximum values measured centrally at the height of two meters above the reference roof (Tair,REF,2m) and the PV roof (Tair,PV,2m). (a) July (16th–31st); (b) August; (c) September.
Figure 7.
Hourly ambient air temperatures (monthly averaged) and minimum/maximum values measured centrally at the height of two meters above the reference roof (Tair,REF,2m) and the PV roof (Tair,PV,2m). (a) July (16th–31st); (b) August; (c) September.

Figure 8.
Ambient air temperatures measured centrally at the height of 0.5 m above the reference roof (Tair,REF,0.5m) and PV roof (Tair,PV,0.5m) and 2 m above the PV roof (Tair,PV,2m). (a) Hourly ambient air temperatures (monthly averaged) and minimum/maximum values in September; (b) Hourly ambient air temperatures measured on 13 July 2022; (c) Hourly ambient air temperatures measured on 15 July 2022.

Figure 9.
(a) Hourly PV module temperature and module efficiency of an active/inactive module (monthly averaged) and global radiation in September; (b) Difference in module temperature between an active/inactive module in function of module efficiency; (c) Hourly module temperature (active module) and soil surface temperature of the reference roof (monthly average) in September.

Figure 10.
Albedo of the reference roof (AlbedoREF) compared to the albedo of the PV roof (AlbedoPV). (a) Hourly albedo (monthly averaged) measured in September with the black dashed line referring to the time of sunrise and sunset; (b) Hourly albedo measured in September.
Figure 10.
Albedo of the reference roof (AlbedoREF) compared to the albedo of the PV roof (AlbedoPV). (a) Hourly albedo (monthly averaged) measured in September with the black dashed line referring to the time of sunrise and sunset; (b) Hourly albedo measured in September.

Figure 11.
Radiative fluxes of the reference roof (REF) compared to the PV roofs’ (PV) radiative fluxes. (a) Hourly radiative fluxes (monthly averaged) in September; (b) Difference in radiative fluxes (PV roof minus reference roof) in September; (c) Daily cumulated radiative fluxes (monthly averaged) measured in September.

Figure 12.
Non-radiative fluxes of the reference roof (REF) compared to the PV roofs’ (PV) non-radiative fluxes. (a) Hourly non-radiative fluxes (monthly averaged) measured in September; (b) Difference in non-radiative fluxes (PV roof minus reference roof) in September; (c) Daily cumulated non-radiative fluxes (monthly averaged) measured in September.

Figure 13.
(a) Differences between PV module surface temperature (front and back) and ambient air temperature as well as reference roofs’ soil temperature and ambient air temperature measured in September; (b) hourly sensible heat fluxes (monthly averaged) measured in September; (c) daily cumulated sensible fluxes (monthly average) measured in September.

Figure 14.
Soil temperature (Tsoil) and volumetric water content (VWCsoil) of the reference roof compared to the PV roof. (a) Hourly soil temperatures and volumetric water content (monthly average) measured in August; (b) Hourly soil temperatures and volumetric water content measured in August.
Figure 14.
Soil temperature (Tsoil) and volumetric water content (VWCsoil) of the reference roof compared to the PV roof. (a) Hourly soil temperatures and volumetric water content (monthly average) measured in August; (b) Hourly soil temperatures and volumetric water content measured in August.


Table 1.
Material values and coefficients required for energy flux calculations.
| Parameter/Coefficient | Value | Unit | Source |
|---|---|---|---|
| a | 2.38 | - | [27] |
| b | 0.89 | - | [27] |
| Rf | 2.17 | - | [30] |
| cn | 37 | - | [31] |
| Cm | 0.24 (daytime) 0.96 (nighttime) | - | [31] |
| ρb | 905 | kg/m3 | [32] |
| cd | 1.093 | J/kg°C | [33] |
| ρW | 997.77 | kg/m3 | [34] |
| cW | 4184 | J/kg°C | [35] |
Table 2.
Overview of all sensors [Supplementary Materials] and measurement parameters.
Table 2.
Overview of all sensors [Supplementary Materials] and measurement parameters.
| Measurement Parameter | N° | Sensor Name (Manufacturer) | Height/Depth (m) | Unit | Accuracy | Temporal Resolution |
|---|---|---|---|---|---|---|
| Ambient air temperature | 1 | 107 Temperature Probe (Campbell Scientific Inc., Logan, UT, USA) | 2 | °C | +/−0.2 °C | 10 s, 10 min average |
| Shortwave radiation | 2a 2b | 4-component net radiometer NR01 2-component net radiometer RA01 (Hukseflux Thermal Sensors BV, Delft, The Netherlands) | PV: 0.31; 1.89 REF: 1.5 | W/m2 | +/−10% | 10 min |
| Longwave radiation | 10 min | |||||
| Ambient air temperature | 3 | HygroVUETM5 Temperature and Relative Humidity Sensor (Campbell Scientific Inc., Logan, UT, USA) | 0.5 | °C | +/−0.3 °C | 10 min |
| Relative humidity | % | +/−1.8% (0–80% rel.h.) +/−3.0% (80–100% rel.h.) | 10 min | |||
| Wind velocity | 4 | Windsonic4 3D Ultrasonic Anemometer (Gill Instruments Limited, Lymington, UK) | 2 | m/s | +/−2% | 10 s, 10 min average |
| Wind direction | ° | +/−3% | ||||
| PV module surface temperature | 5 | CS241 PT-1000 Class A, Back-of-Module Temperature Sensor (Campbell Scientific Inc., Logan, UT, USA) | 1.4 | °C | +/−0.3–0.4 °C | 10 min |
| Volumetric water content (substrate) | 6 | CS650 Soil Water Content Reflectometer (Campbell Scientific Inc., Logan, UT, USA) | PV: −0.08 REF: −0.04 | % | +/−3% | 10 min |
| Soil temperature | °C | +/−0.1 °C | ||||
| Soil electrical conductivity | dS/m | +/−5% | ||||
| Relative dielectric permittivity | - | +/−1.4 | ||||
| Soil heat flux | 7 | HFP01 Heat Flux Plate (Hukseflux Thermal Sensors BV, Delft, The Netherlands) | PV: −0.08 REF: −0.04 | W/m2 | −1.5–5% | 10 min |
| Soil temperature | 8 | TCAV-L Averaging Soil Thermocouple Probe (Campbell Scientific Inc., Logan, UT, USA) | PV: −0.15; −0.105; −0.55; −0.05 REF: −0.065; −0.045; −0.025; −0.005 | °C | +/−0.3 °C | 10 min |
Disclaimer/Publisher’s Note: The statements, opinions and data contained in all publications are solely those of the individual author(s) and contributor(s) and not of MDPI and/or the editor(s). MDPI and/or the editor(s) disclaim responsibility for any injury to people or property resulting from any ideas, methods, instructions or products referred to in the content. |
© 2023 by the authors. Licensee MDPI, Basel, Switzerland. This article is an open access article distributed under the terms and conditions of the Creative Commons Attribution (CC BY) license (https://creativecommons.org/licenses/by/4.0/).
Share and Cite
MDPI and ACS Style
Fassbender, E.; Pytlik, S.; Rott, J.; Hemmerle, C. Impacts of Rooftop Photovoltaics on the Urban Thermal Microclimate: Metrological Investigations. Buildings 2023, 13, 2339. https://doi.org/10.3390/buildings13092339
AMA Style
Fassbender E, Pytlik S, Rott J, Hemmerle C. Impacts of Rooftop Photovoltaics on the Urban Thermal Microclimate: Metrological Investigations. Buildings. 2023; 13(9):2339. https://doi.org/10.3390/buildings13092339
Chicago/Turabian StyleFassbender, Elisabeth, Simon Pytlik, Josef Rott, and Claudia Hemmerle. 2023. "Impacts of Rooftop Photovoltaics on the Urban Thermal Microclimate: Metrological Investigations" Buildings 13, no. 9: 2339. https://doi.org/10.3390/buildings13092339
Note that from the first issue of 2016, this journal uses article numbers instead of page numbers. See further details here.