
Research on 3D Visualization of Real Scene in Subway Engineering Based on 3D Model
1
College of Civil and Transportation Engineering, Shenzhen University, Shenzhen 518060, China
2
Sino-Australia Joint Research Center in BIM and Smart Construction, Shenzhen 518060, China
3
China Railway South Investment Group Co., Ltd., Shenzhen 518054, China
*
Author to whom correspondence should be addressed.
Buildings 2023, 13(9), 2317; https://doi.org/10.3390/buildings13092317
Submission received: 3 July 2023
/
Revised: 21 August 2023
/
Accepted: 7 September 2023
/
Published: 12 September 2023
(This article belongs to the Special Issue Towards Effective BIM/GIS Data Integration for Smart City)
Abstract
:As an urban infrastructure project, subway engineering exhibits the characteristics of large scale, trans-regional presence, and complex environmental conditions. The three-dimensional (3D) real scene of subway engineering aims to visually present the project features by creating a virtual environment in the 3D form by integrating numerous geographical scenes and entities. However, existing methods of geometric data integration and model visualization are insufficient for handling the diverse and heterogeneous data types encountered in this process. To address these challenges, this study proposes a framework for real-scene 3D visualization management in subway engineering, establishing a technical process of multi-source data integration for organizing 3D models within the scene, and developing a visualization display strategy that incorporates octree and level of detail principles for multi-scale hierarchical dynamic loading of 3D Scene. To validate the proposed method, a prototype system is developed with Geographic Information System (GIS) and Building Information Modeling (BIM) technology and applied to an actual subway project. The results demonstrate that this method ensures effective integration and management of data, enabling the display of real scenes in an integrated 3D model in a web environment.
1. Introduction
In recent years, with the rapid development of China’s economy and the advancement of urbanization, the transportation demand of urban residents, especially for subways, has been steadily increasing, making them a crucial component of urban transit. According to statistics, by the end of 2021, there were approximately 275 urban rail transit lines in operation across 45 cities on the Chinese mainland, with a total length of nearly 8736 km [1]. Usually, the subway lines traverse different districts of a city and connect with other transportation routes and important interval hubs. However, such inter-regional layouts pose challenges during the construction of subway projects [2]. In particular, when crossing and traversing diverse geographical landscapes, geological structures, pre-existing urban roads and buildings, as well as densely distributed underground pipelines, spatial conflicts and coordination issues among stakeholders may arise.
Visualization management, in terms of information communication, uses visual tools to present and analyze complex data in an intuitive way, providing effective support for project decision-making, communication, and collaboration. In actual construction, the traditional method presents the subway engineering design, construction structure, and layout planning, which primarily relies on simplified forms of two-dimensional (2D) plane drawings. However, these approaches often struggle in providing a comprehensive display and accurate depiction of the intricate details and spatial relationships of subway projects, as well as effectively portraying the geographical environment where they are situated.
With the construction of smart cities and digital twin cities, the three-dimensional (3D) real scene, as an emerging technological approach, can exhibit scenarios and landscapes in a highly realistic way and provide a more immersive visual presentation. It has gained extensive applications and significant attention and appeal in areas such as urban planning, architectural design, and infrastructure development [3,4].
Currently, there are a range of advanced techniques available for 3D data collection of real-scene, including aerial photography using Unmanned Aerial Vehicles (UAVs), Light Detection and Ranging (LiDAR), 3D laser scanning, and satellite photogrammetry, that support detailed descriptions of the actual on-site conditions during construction. The combination of these technologies allows for more efficient measurement of the geometry, appearance, and geographic spatial information of both indoor facilities and outdoor environments, while also providing a substantial amount of high-resolution data [5,6,7]. This would offer strong support for large-scale 3D scene reconstruction of areas along the subway route. Similarly, compared to traditional modeling methods such as manual modeling with CAD, which have relatively lower efficiency [8], various methods have emerged for creating 3D models in different data types, such as image-based multi-view image-matching techniques [9], scan-based constructing mesh surfaces [10], and classification based on color and texture [11]. Typically, the geometric models generated by these contain rich information reflecting the geometric shape, texture, structure, and other characteristics of real object. However, the complexity of data processing would remain in the process of real-scene generation based on 3D models.
Building Information Modeling (BIM) mostly possesses rich internal information at the microlevel, while Geographic Information Systems (GIS) focuses on integrating and managing external environmental information. The combination of them, especially in the seamless connection of various 2D and 3D model data with geographic information, provides an integrated solution for storing, managing, exchanging, and expressing multi-source data and 3D scene information [12]. Currently, at the data level, the integration of GIS and BIM technologies mainly focuses on the unification of data formats and structural transformations, such as transitioning from GIS schema to BIM schema or vice versa, as well as extending models, providing a consistent and convenient handling approach. However, there is still a limit to the completeness and accuracy of 3D models and their data properties in terms of material, texture, or color. Therefore, this study aims to enhance the integration of more data sources at the data level and apply GIS and BIM integration techniques to consolidate the real-scene 3D models of subway engineering projects.
Due to the capabilities of 3D GIS software such as ArcGIS Pro and SuperMap iDesktop, the integration of various 3D geospatial datasets into a unified platform facilitates the display of large-scale scenes within geographic space [13,14]. These software solutions provide detailed methods of scene representation in textures, materials, annotations, interactivity, and more, that play an important role in enabling data visualization across various domains. In addition, with the aid of WebGL technology, such as CesiumJS, an open-source JavaScript library, users can interactively and dynamically explore and navigate 3D scenes in real-time over the web. However, different spatial data organization methods will impact the effectiveness of 3D visualization. For instance, spatial partitioning index structures such as k-d trees, quad-trees, r-trees, oct-trees, and scene graphs [15,16,17], as well as Level of Detail (LOD)-based data hierarchical organization, play a crucial role in the efficiency and performance of spatial information retrieval and presentation. The use of LOD modeling techniques allows for dynamic loading of data at different levels of granularity, effectively enhancing the rendering quality and overall performance of 3D scenes on web platforms. Therefore, to meet the user demands for large-scale 3D scenes, it is necessary to further explore appropriate ways of three-dimensional data organization that can be applied in real-scene 3D visualization and interaction.
The objective of this study is to propose a framework for real-scene 3D visualization management to enhance the efficiency of data integration and 3D model presentation in a multi-scale 3D scene within a web-based environment. In detail, a technology workflow for integrating multi-source three-dimensional data was established, employing a scene-based hierarchical organization method and data caching to store and publish 3D model data. A visualization strategy was devised that combines octree and Level of Detail (LOD) techniques to organize data and enable dynamic loading of models, thereby enhancing data loading and rendering efficiency in the web environment. Lastly, a web platform was developed for interactive and dynamic exploration and navigation of 3D scenes in subway engineering projects. The application of the proposed framework and methods in practice demonstrated excellent performance. The challenges of integrating and dynamically displaying real-scene 3D data in subway engineering projects were effectively overcome. The utilization of GIS and BIM technologies provides comprehensive support for visualization management, enhancing the overall capabilities of the system.
The rest of this paper is structured as follows: Section 2 provides a review of related works and technologies for this study. In Section 3, the methodology introduces the solution for 3D visualization of real scenes in subway engineering. In Section 4, a case study is offered for the implementation of the proposed approach. The discussion and conclusion are given, respectively, in Section 5 and Section 6.
2. Literature Review
2.1. Related Application of Real Scene 3D
As an important technology in digital construction, real-scene 3D is mainly used for visual representation of the real environment to identify problems and develop solutions. It is widely applied in various fields, including urban planning [18], existing building management [19], landscape design [20], indoor navigation [21], digital twin [22], and other fields.
Given the widespread acceptance of 3D scene, it is supported by a range of 3D geospatial information processes, including data acquisition, modeling and analysis, storage, querying, and visualization [23,24,25]. To establish detailed and accurate 3D models that faithfully represent the physical characteristics of real environments, researchers have employed various data acquisition and processing techniques [26], which allow for the capture of comprehensive spatial data, including both geometry and texture information of the measurement object. For instance, Unmanned Aerial Vehicles (UAVs) equipped with oblique photography have been widely utilized in large-scale 3D reconstruction [4,27,28]. These UAVs enable the capture of high-resolution aerial or terrestrial imagery, which serves as the basis for establishing a 3D model using the collected data. Dense point cloud data can allow for the precise representation of the shape and structure of objects. Wang and Cho [29] proposed intelligent scanning and near-real-time 3D surface modeling of dynamic construction equipment based on point cloud. Then, in the experimental study to capture images of terrain and buildings from different angles and distances [30], high-resolution cameras or imaging devices, including drone tilt photography and 3D laser scanning, were combined to create accurate and detailed 3D models. Additionally, Wu et al. [7] optimized the geometry and texture of 3D models in urban areas by integrating aerial oblique imagery with terrestrial imagery for the 3D reconstruction of urban scenes. By correlating measurement surface data with geometric models to enhance the visual realism of 3D models, BIM plays a crucial role in accurately representing the geometric shapes. Usmani et al. [31] developed a scan to as-built BIM workflow that involves using 3D laser scanner surveying to capture precise measurements and creating as-built building information models of existing structures.
Therefore, the combination of these methods along with various data acquisition techniques allows for the rapid acquisition of large volumes of high-precision data and the accurate modeling of 3D geometric shapes and texture information, which serves as the foundation for the generation and visualization of realistic scene models in subway engineering.
2.2. Data Integration and Organization
The construction of 3D scenes relies on the integration of various data and technologies, but there are still some challenges, mainly involving the integration and exchange of 3D datasets, particularly those originating from different sources. For this, GIS and BIM technologies have been proven to be the effective way to improve data management processes, achieve multi-source data integration, and view visualization [32,33]. For example, Laat et al. [34] developed a CityGML extension called GeoBIM to obtain semantic IFC data in a GIS environment. Sani and Abdul [35] discussed data interoperability solutions in GIS and BIM data integration at the data level. Other examples include the Integrated Geospatial Information Model (IGIM) [36] and geometry from the IFC to a shapefile [37]. Due to the integration of GIS and BIM, the focus is mainly on the conversion of data formats, unified extended building models, and ontologies for data sharing and exchange. Therefore, on this basis, to integrate 3D model data on different platforms and complement each other, including Digital Elevation Model (DEM) data, remote sensing images, large-scale 2D GIS data, and 3D scene data, open 3D data standard formats such as Indexed 3D Scene Layer (I3S), 3Dtiles, and Spatial 3D Model (S3M) provide the possibility to encourage the exchange of such datasets [38,39,40,41]. For example, in ArcGlobe, raster and surface data were integrated by utilizing 3D modeling and tiled cache construction techniques, which facilitated the rapid creation of a virtual 3D scene for a high-speed railway [39]. Wang et al. [42] proposed a method to automatically generate complex and extensive 3D road networks with open-source GIS data.
Moreover, to load and display massive 3D data on the web browser, Liu et al. [43] proposed a lightweight solution based on web3D to simplify BIM models for real-time visualization in large-scale BIM scenes, which is suitable for sharing and interacting with complex scene data on websites. Miao et al. [44] presented a lightweight 3D geographic scene visualization approach based on scene parameters, geometry shapes, and spatial relationships that is suitable for sharing and interacting with complex scene data on websites. Yang et al. [45] developed a comprehensive and up-to-date web-based interactive 3D GIS visualization system. Existing different interaction methods and effects in 3D data visualization have also been explored [46,47,48].
Furthermore, well-structured data organization plays a crucial role in efficiently transmitting, loading, and displaying complex geometric data in 3D over the network. The methods for managing and organizing 3D data mainly include LOD-based and index-based approaches [49]. The LOD means a group of models at different levels that are used to describe one scene or its object [50]. By constructing corresponding hierarchical structures based on a layered hierarchical model, the data can be partitioned into different LOD levels, representing different multi-resolution levels at different scales [51,52]. The method of hierarchically subdividing the data facilitates detailed rendering and presentation of large-scale datasets. Leite et al. [53] evaluated modeling work related to generating BIM at different levels of detail to coordinate the geometric accuracy of each object. Xu et al. [54] organized four LOD models based on building types, preserving the geometric accuracy of each building entity. However, these strategies mainly focus on the organization of individual BIM models. Interactive exploration and analysis of the integrated BIM models within a 3D GIS environment require additional considerations. The index-based approach involves partitioning the space and organizing fine-grained building elements or spatial structure data. Hu et al. [55] performed parameter modeling on surveyed data of utility networks and utilized a loose quadtree data organization to establish a three-dimensional heterogeneous data structure for utility networks. Yang et al. [56] utilized a hybrid spatial indexing structure consisting of an octree and a 3D R*-tree to support spatial partitioning and querying of 3D geological models. Different from local tree indexing structures, the use of dynamic multiresolution modeling and multilevel detail processing techniques focuses on optimizing 3D geographic information, enhancing the visualization capabilities of the system in spatial data [45].
These methods employed in the aforementioned studies aim to improve the transmission and rendering efficiency of large-scale real-scene 3D data with limited network resources. However, there is currently a lack of data indexing and hierarchical organization method in data caching solutions for large-scale 3D spatial data. These strategies can effectively utilize web-based architectures for rapid rendering and real-time display of scene models, thereby reducing server network load [57].
3. Methodology
3.1. Proposed Framework
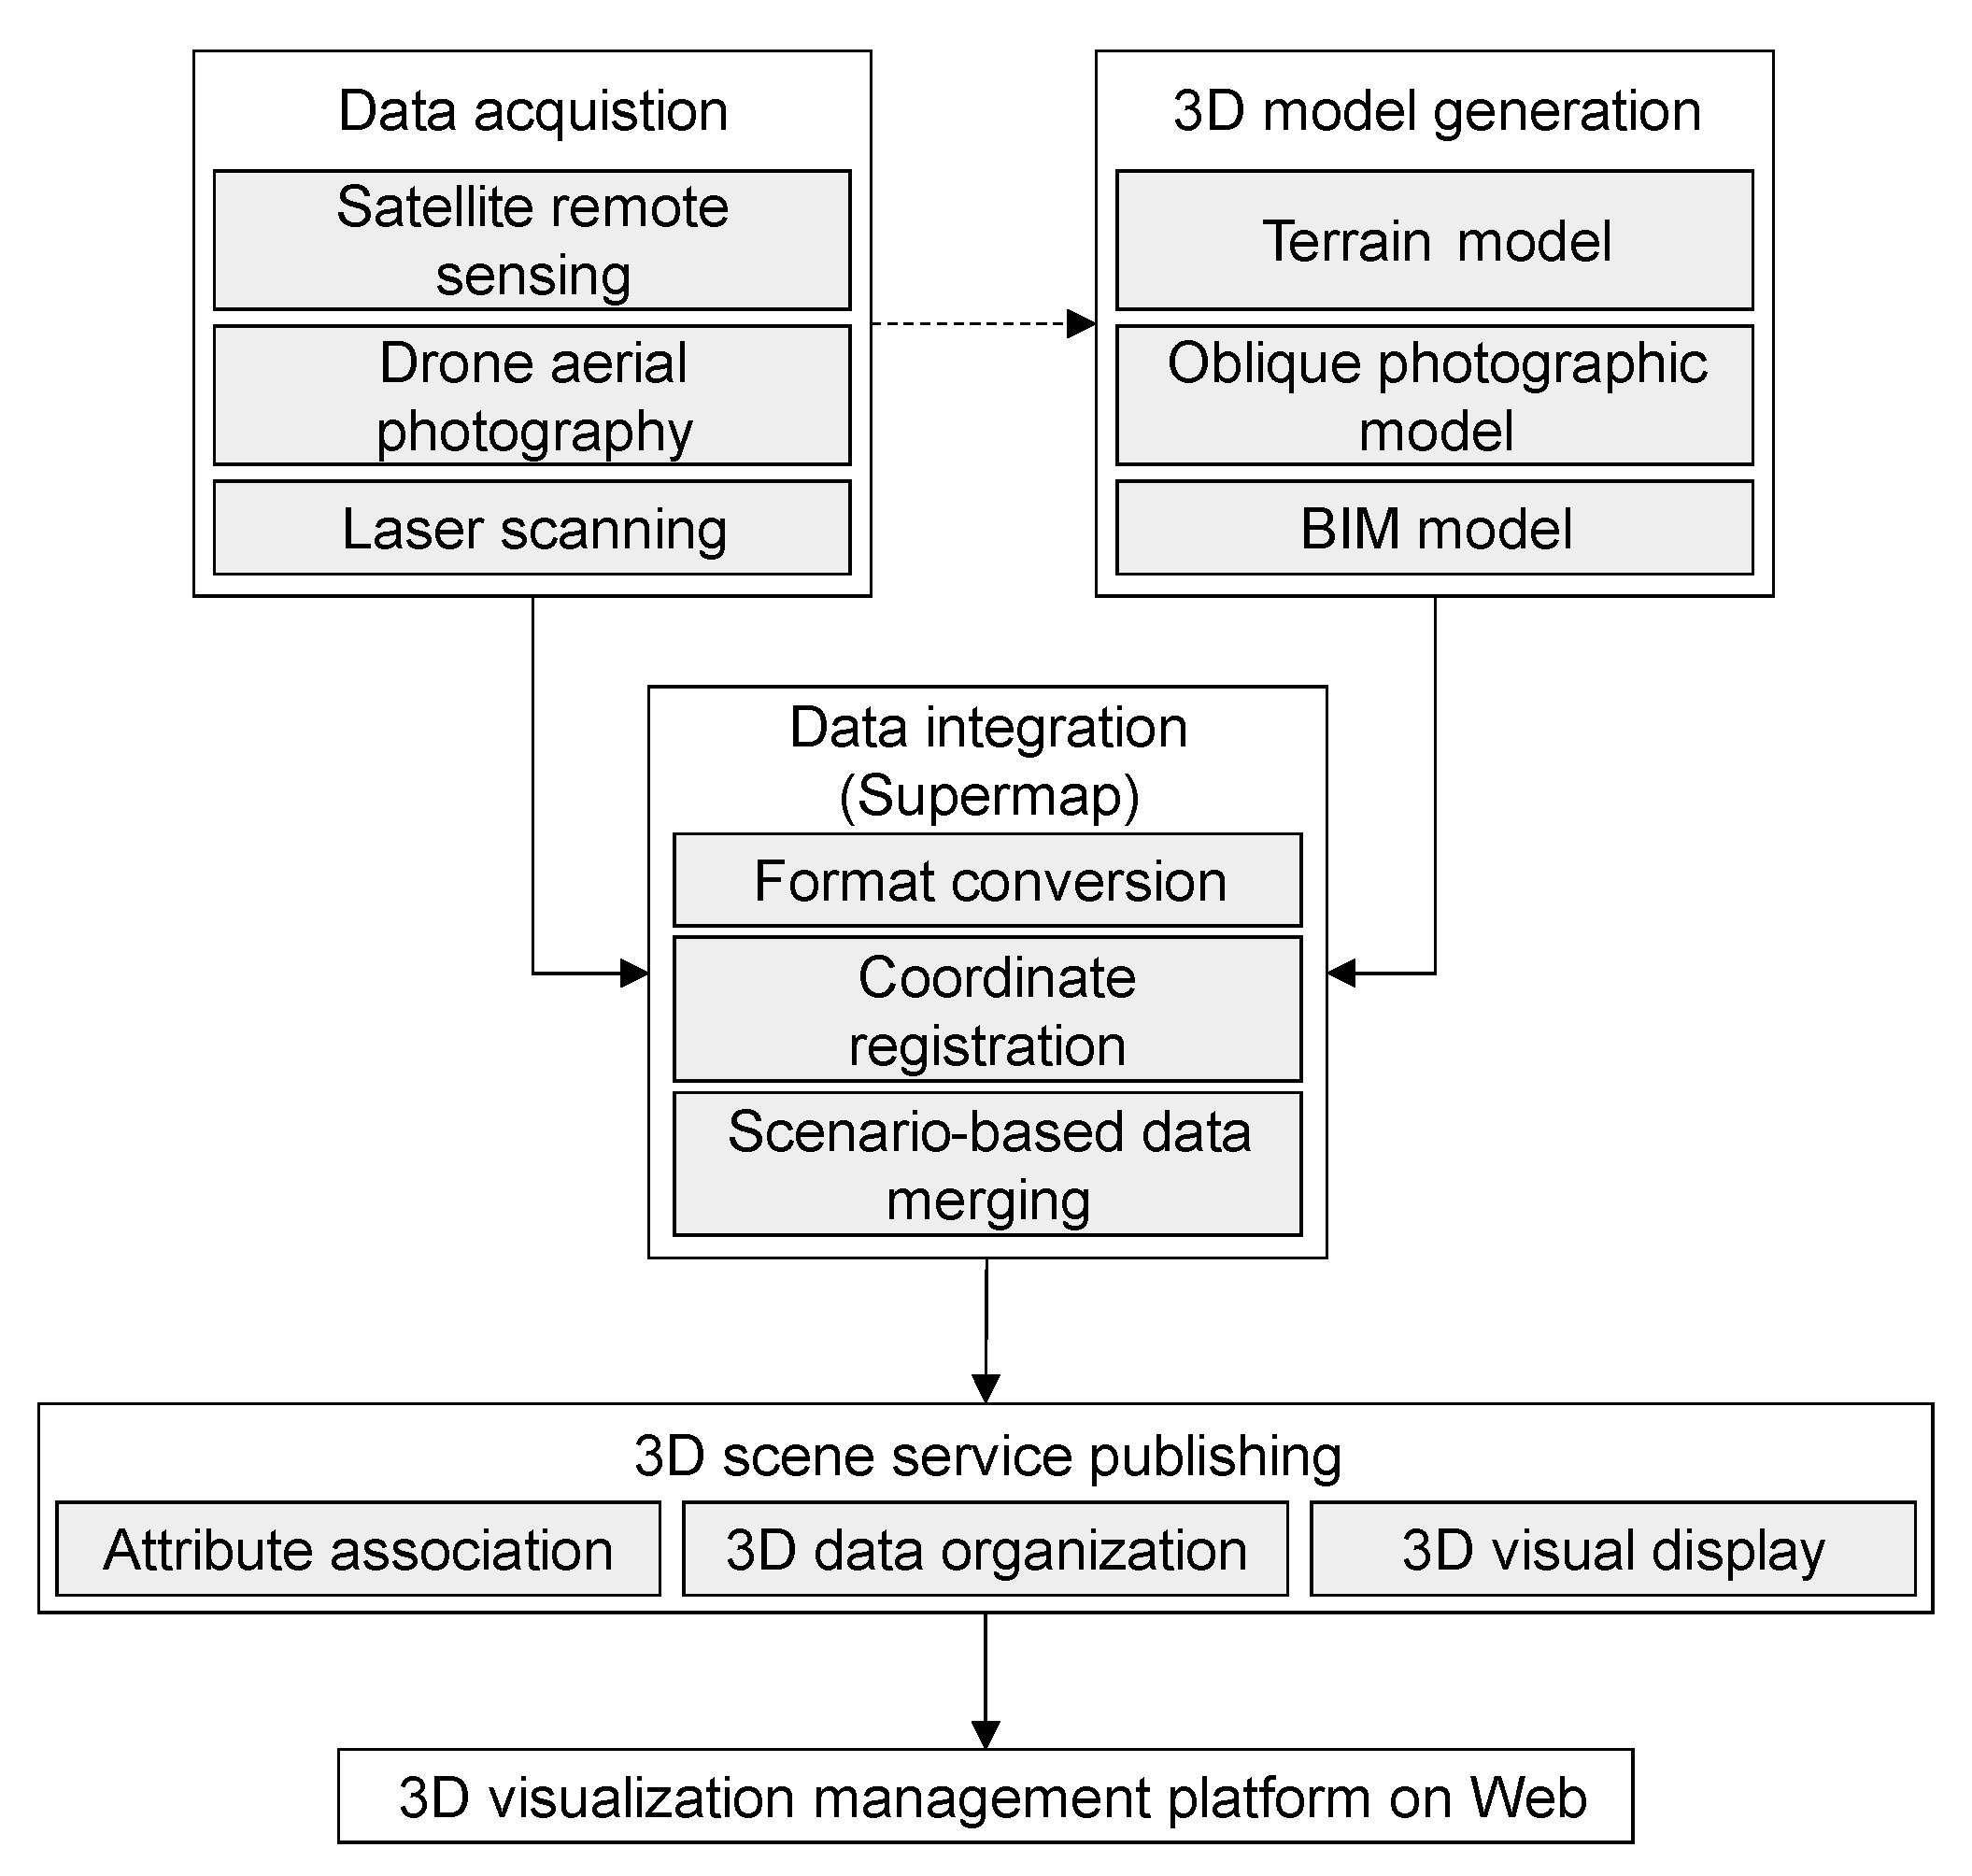
Generally, real-scene 3D visualization involves processes such as data collection, 3D modeling, integration, and management. In this study, a simple framework for real-scene 3D visualization management is proposed, as illustrated in Figure 1. The framework seamlessly integrates data from diverse sources, including 3D model data from BIM and spatial data acquired on sites. After a series of data integration steps, a unified platform supported by GIS software SuperMap iDesktopX was finally constructed. This platform enables efficient multi-source data management and facilitates real-scene 3D visualization in the subway project.
3.1.1. Requirement Identification
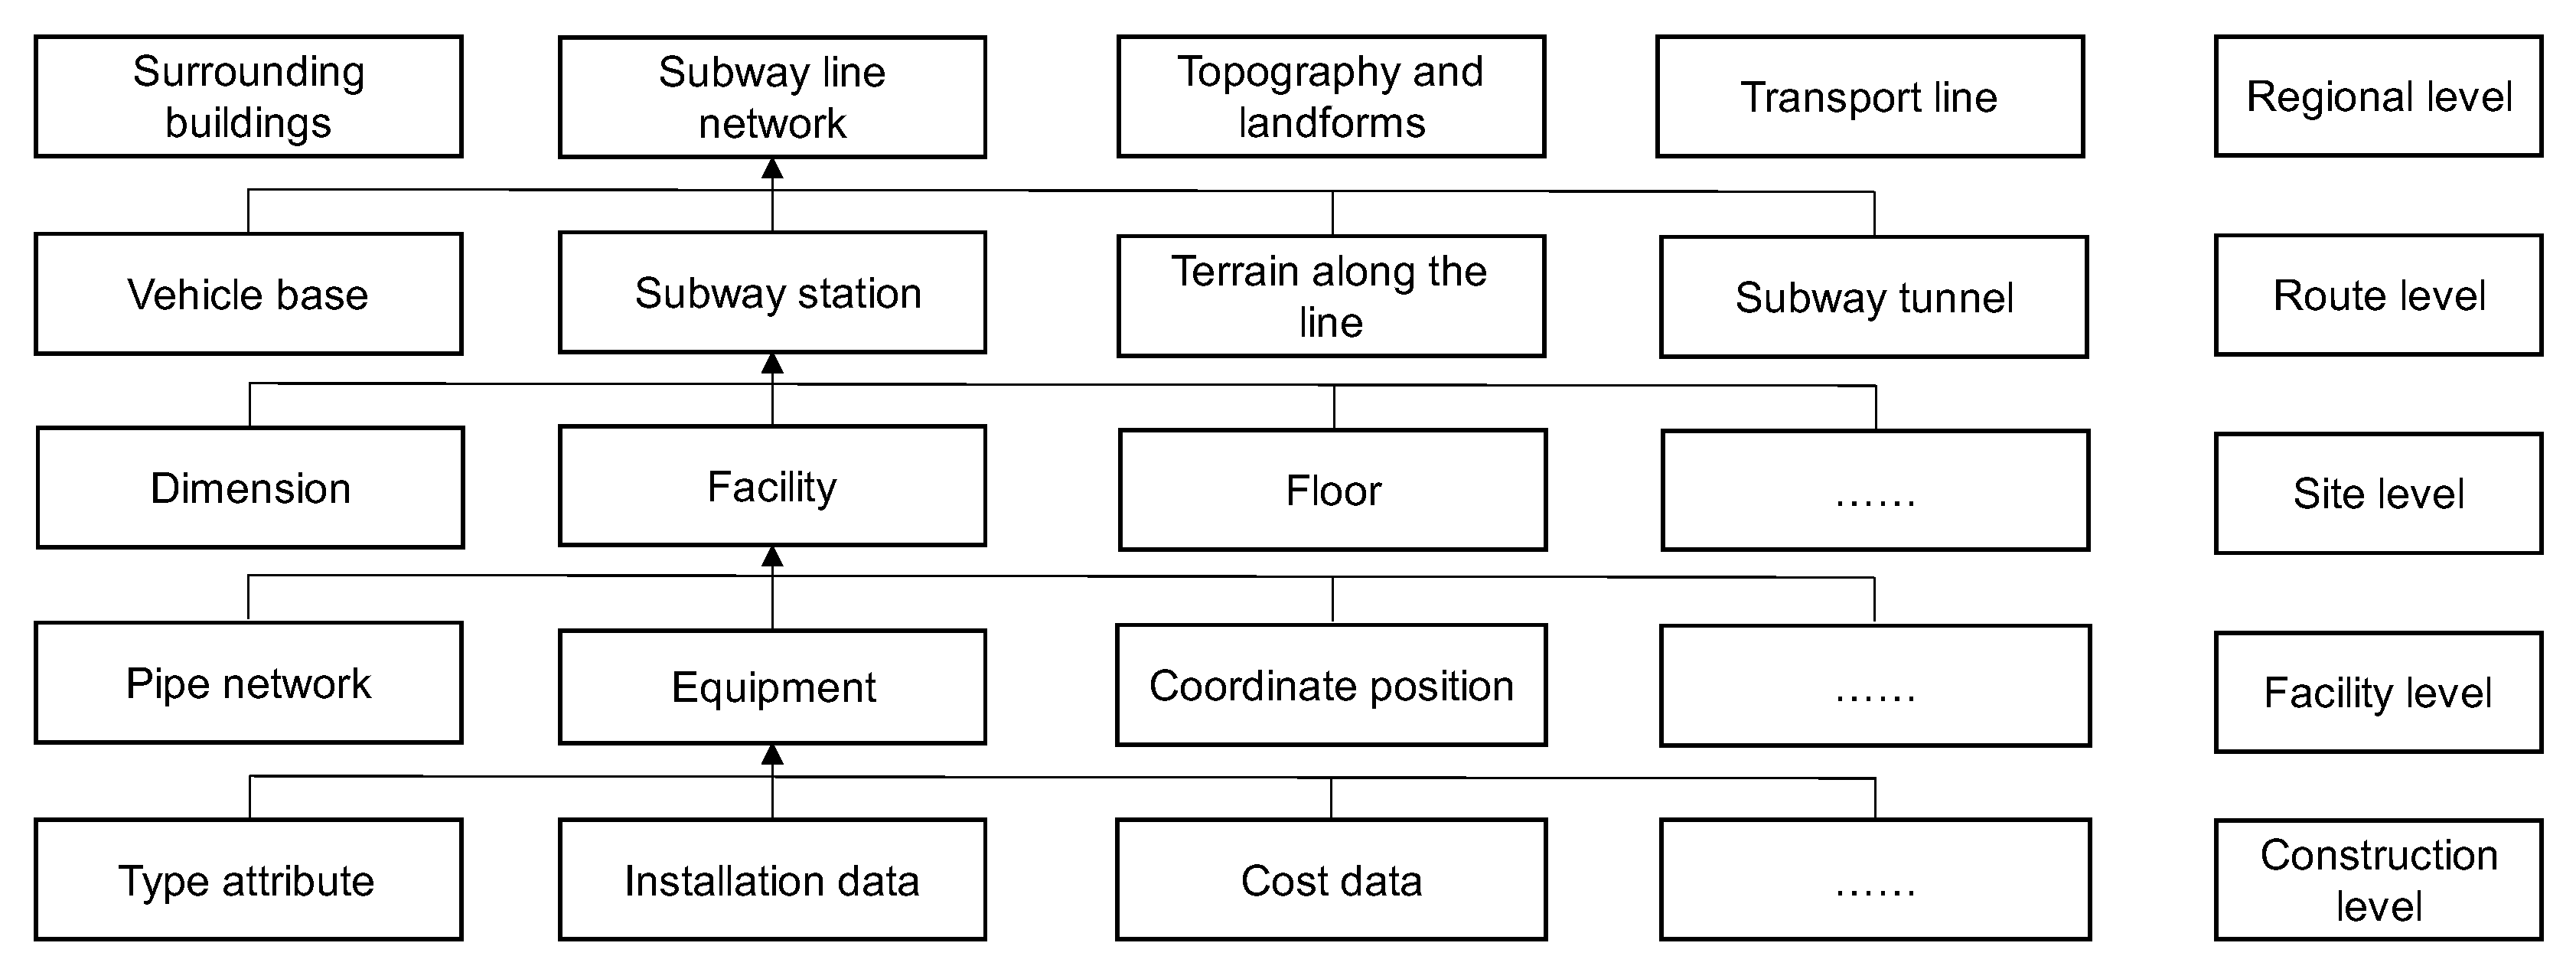
Taking into account the linear nature of subway engineering and the requirements for visual management, a multi-level information integrated management framework has been developed, as shown in Figure 2. This framework organizes information at different levels, including the regional level, route level, site level, facility level, and construction level. And it defines the information scope of geographical scene representation at each level with the following aspects: Spatial relationships of project structures, which enable the visualization of the overall layout and spatial organization of the subway project. Subway infrastructure elements, which showcase models and attribute information about subway stations, tunnels, and others. Construction management information, which incorporates construction-related data, such as construction progress and safety inspections, associated with each element.
3.1.2. Data Preparation
Based on the information requirements framework, the data acquisition process involves utilizing satellite remote sensing and aerial photography techniques to sample geographic surface features in the subway route area, with resolutions generally ranging from 1 km to 1 m. Many service providers already offer digital elevation models (DEMs) covering the entire city. UAVs equipped with cameras capture oblique photographs to acquire spatial data across the work area and sites, including surrounding buildings. Ground-based 3D laser scanning is utilized to acquire point clouds of as-built target structures such as stations and tunnels. To ensure data accuracy, oblique photography is often combined with 3D laser scanning for data patching of critical spatial segments, resulting in a comprehensive and complete set of 3D information.
For 3D model generation, existing commercial solutions such as Bentley ContextCapture [58] offer imagery-based modeling and allow the processing of oblique images of target areas, such as surrounding buildings and road networks. Through multi-view dense matching, triangulation of irregular networks, and automatic texture mapping on triangular facets, 3D models with rich textures can be produced. Moreover, the patched slice model using 3D laser scanning will have higher precision [30]. Existing digital elevation models (DEMs) are used for terrain zoning and establishing tile pyramid models with different resolutions. By overlaying satellite imagery data, pixel corrections, mosaicking, cropping, and other processes are performed to generate orthophoto images with geometric and texture features, which can serve as the basis for real-scene data to combine with multi-source spatial data. Furthermore, professional processing tools such as Leica Cyclone [59] and FARO Scene [60], which are provided by service providers and matched with 3D laser scanning equipment, ensure the quality of point cloud data and the accuracy of reconstructed models. Through point cloud registration and filtering preprocessing, as well as surface fitting, smoothing, blocking, and combinatorial optimization, polygon or mesh surfaces are automatically generated to create 3D geometric models of objects such as tunnel structures and station facilities. Typically, the initial BIM model is primarily created by manual solid modeling using software such as Autodesk Revit 2016 or 3dsMax 2018, including stations, tunnels, and underground pipelines, and then laser scanning is used to supplement the existing BIM geometric primitives to meet the model details requirements at different stages.
3.1.3. Data Integration
The multi-source data integration for 3D models is an important aspect in this study, and that is facilitated by the GIS software SuperMap iDesktopX 10i, powered by a visualization engine. It is utilized to display all the data within a 3D scene of the subway project and ensure the uniformity of spatial data, including both spatial formats and coordinates in this process. In addition, the scenario-based data merging process is further elaborated in Section 3.2.
3.1.4. Service Release and Visual Management
By leveraging 3D scene publishing services and Web API (Application Programming Interface) calls, the on-site data can be interconnected with 3D models in a digital management platform. This platform offers a unified large-scale 3D scene environment driven by the WebGL engine, providing valuable insights and support for the visualization management of subway projects.
3.2. Workflow for Multi-Source Data Integration
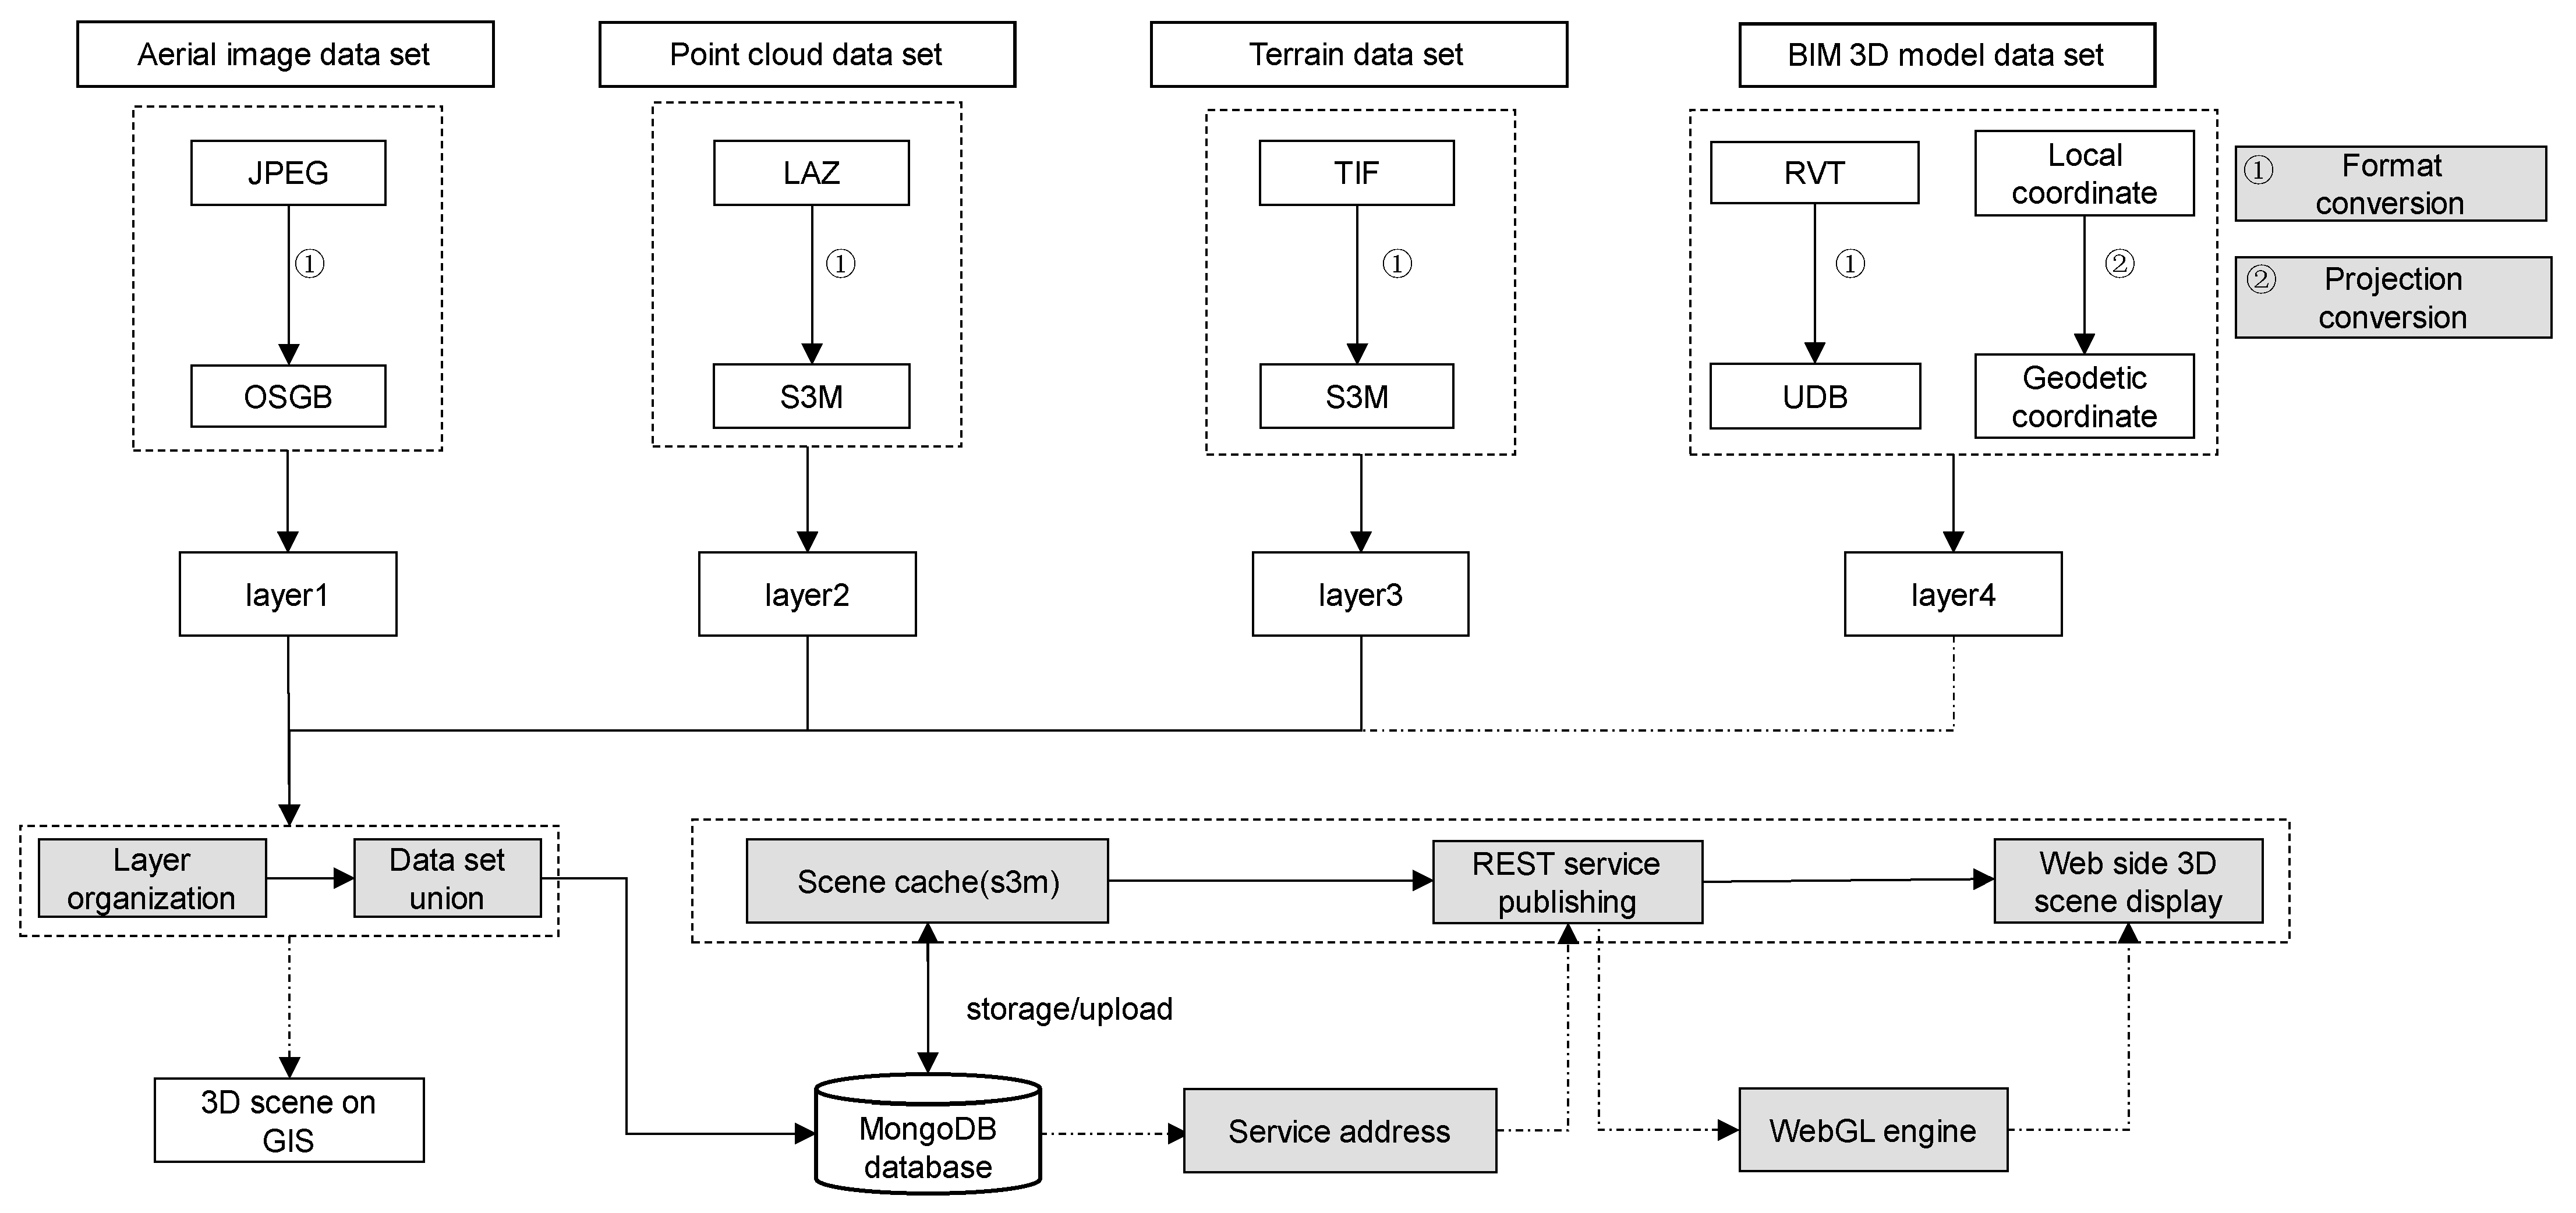
In order to integrate the collected multi-source data and establish corresponding hierarchical information models for facilitating the visualization and management of subway engineering information at different scales, this study has devised a technical processing workflow for 3D model data integration with the use of SuperMap, as illustrated in Figure 3.
3.2.1. Spatial Data Transformation
Based on the analysis of the 3D visualization requirements of real scene in subway engineering, the required dataset is prepared according to Section 3.1.2, including image data, terrain data, point cloud data, and BIM 3D model data. To handle the diverse data formats from multiple sources with appropriate tool and software, the SuperMap iDesktopX 10i was chosen to perform data transformation, including format conversion and projection conversion, to generate a unified target 3D dataset.
For format conversion, the image datasets are in JPEG formats, which are transformed into temporary 3D image slices in OSGB format. The point cloud datasets in LAZ formats are loaded through index files, and then the subset of data is cached by point cloud slice and generated into S3M file for efficient storage in SuperMap. The raster datasets for DEM typically come in TIF format, which can be converted to OSGB format and used to generate cache file of S3M with terrain slices.
Regarding the BIM 3D model dataset in RVT format, its format conversion is performed within the Revit 2016 using the RevitToolkit tool plugin. The model is exported as a temporary storage file in UDB format, which can be easily imported into the GIS environment.
During the format conversion, the local coordinate system’s Cartesian coordinates of the original BIM model are transformed into geodetic coordinates under the WGS84 reference ellipsoid. The space projection transformation method based on the seven parameters of Bursa provided by SuperMap is adopted. The transformation parameters were calculated using the following formula [61]:
In which, from coordinate system A to coordinate system B, , , are translation parameters, , , and are rotation angle parameters, and is the scale variation parameter.
3.2.2. Dataset Merging and Storing
By employing a scene-based hierarchical organization and overlay method, the corresponding datasets were merged according to different scene requirements. During the process, these models were fused based on their spatial distributions in the SuperMap, forming a 3D spatial environment of the subway project. And then, scene cache files were generated, the dataset of which was stored in the MongoDB database, along with the addition of configuration file information for visualization on the web.
3.2.3. Services Deployment for 3D Scene
All the datasets are processed into a lightweight data format, such as S3M, an open and extensible spatial 3D model data format, which are then uploaded to a web server for storage and management, and services for specific scenes are published as a requirement. On the web client side, the REST (Representational State Transfer) service interface is invoked by loading the service address. Based on predefined model loading and visualization strategies in Section 3.3, the WebGL engine is utilized for graphics rendering, enabling the interactive display of 3D scenes.
3.3. Model Loading and Visualization Strategy
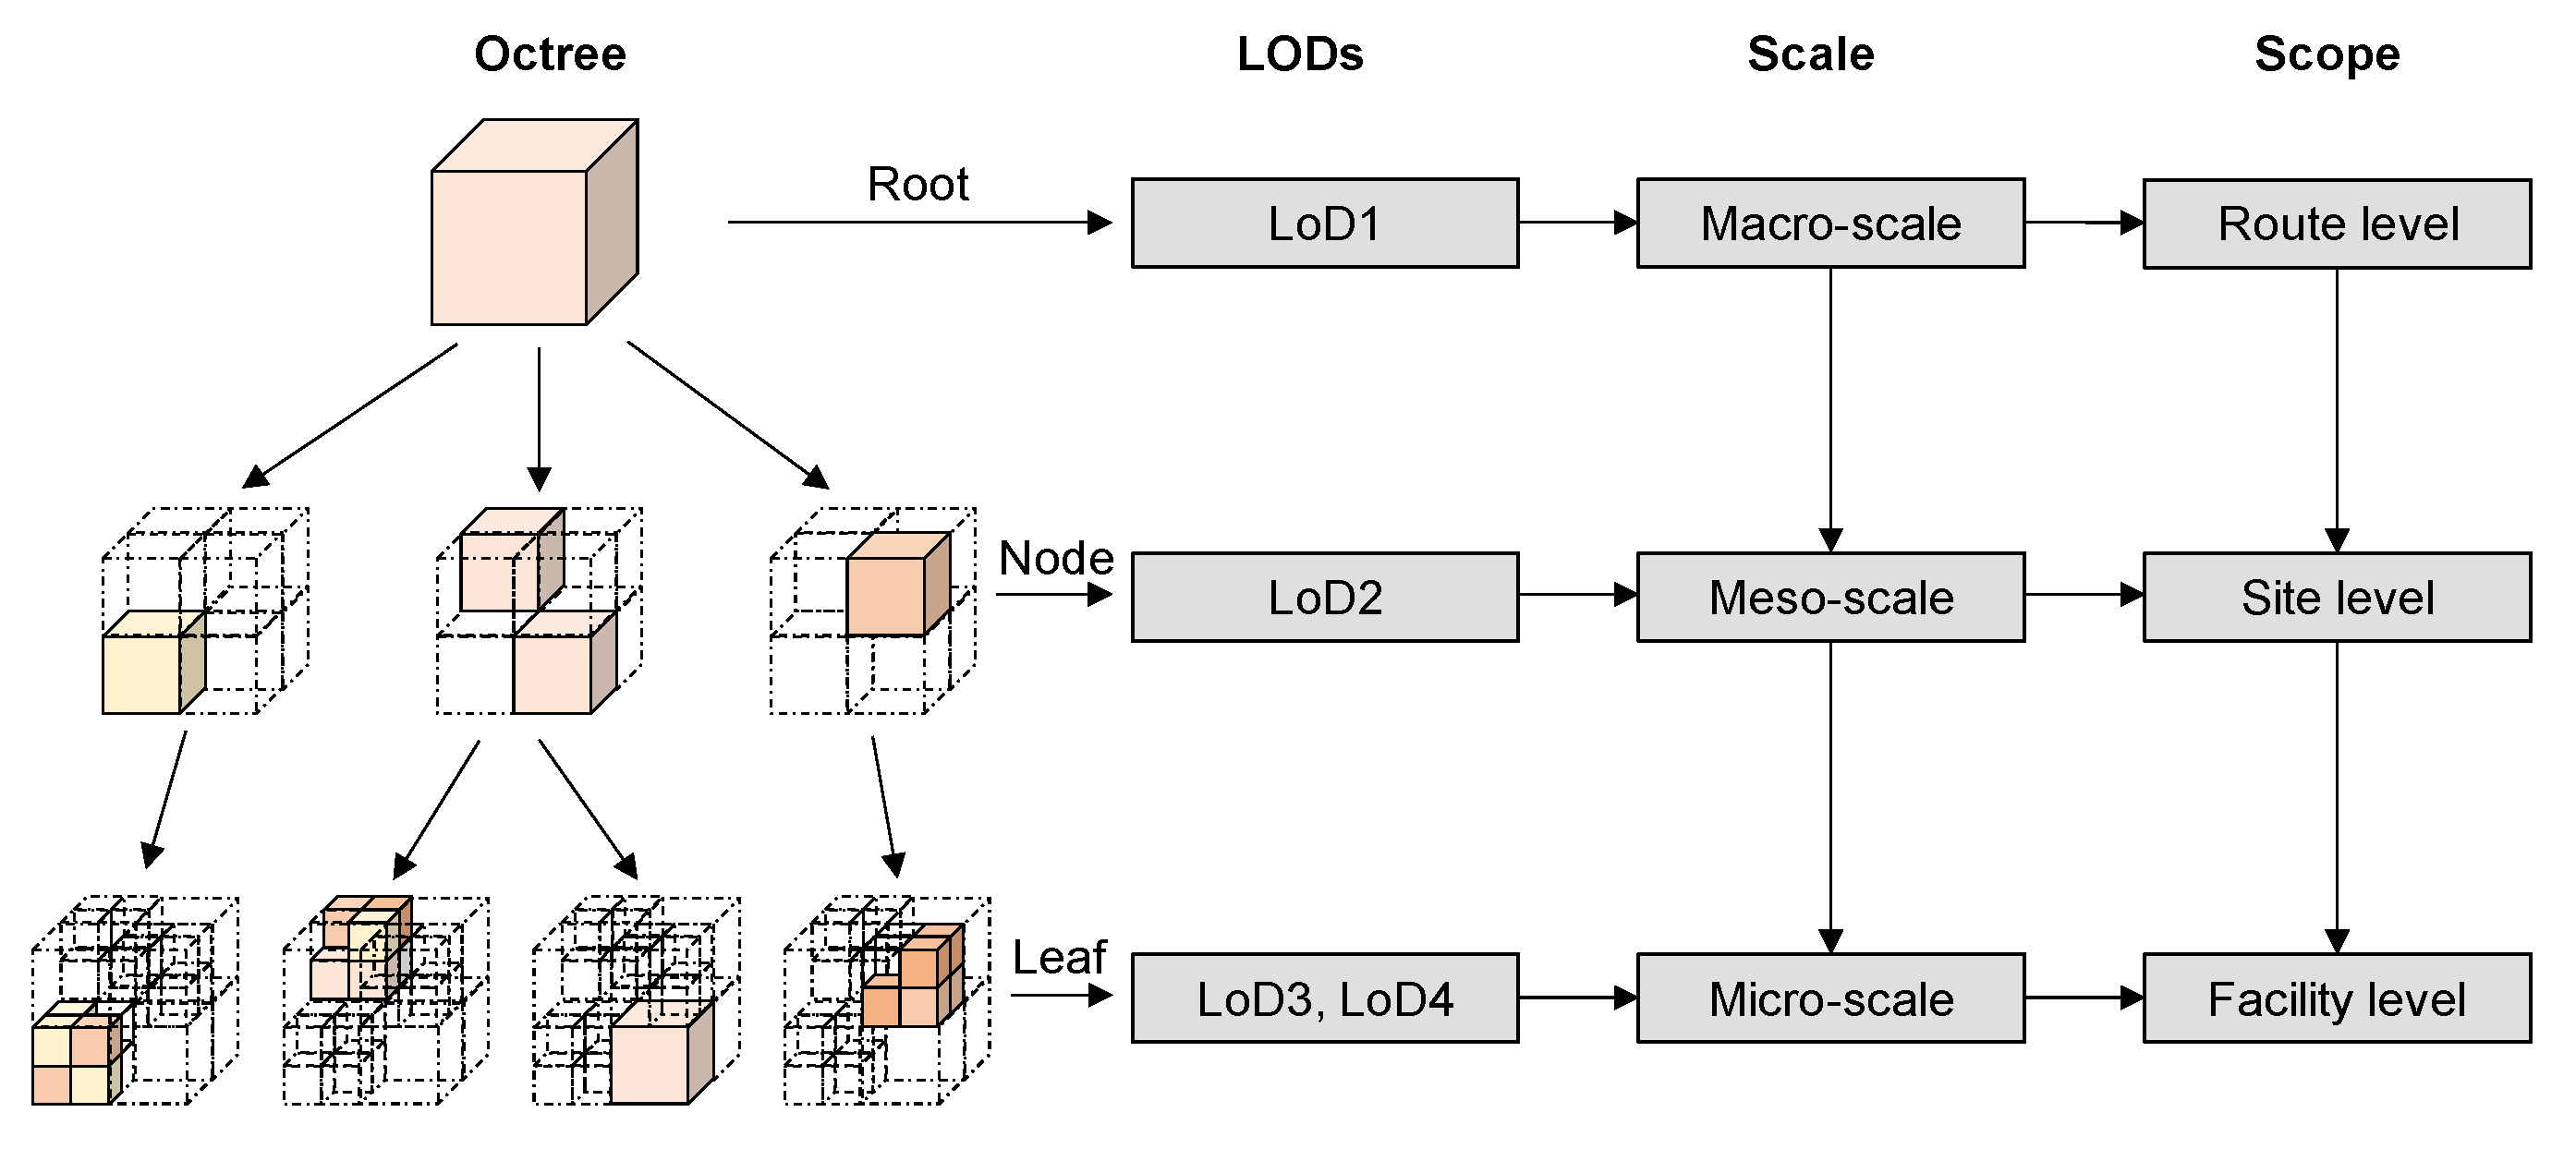
To satisfy the visualization effect of 3D model at different scales, the integrated data are organized efficiently to achieve fine control, dynamic loading, and rendering of large scene models on the browser side. Therefore, a 3D data organization approach combining octree and LOD levels is used to design and construct Hierarchical Level of Details (HLODs) for spatial structure division and detail level representation, as shown in Figure 4.
In this HLOD, distinct scales from macro-scale, meso-scale to micro-scale are used for the organization of 3D models and scene display at different hierarchical ranges, including line level, site level, and facility level. Since diverse levels of detail are realized in the model, this multi-scale model is divided by LODs, and the model fineness corresponding to each LOD level is divided as shown in Table 1.
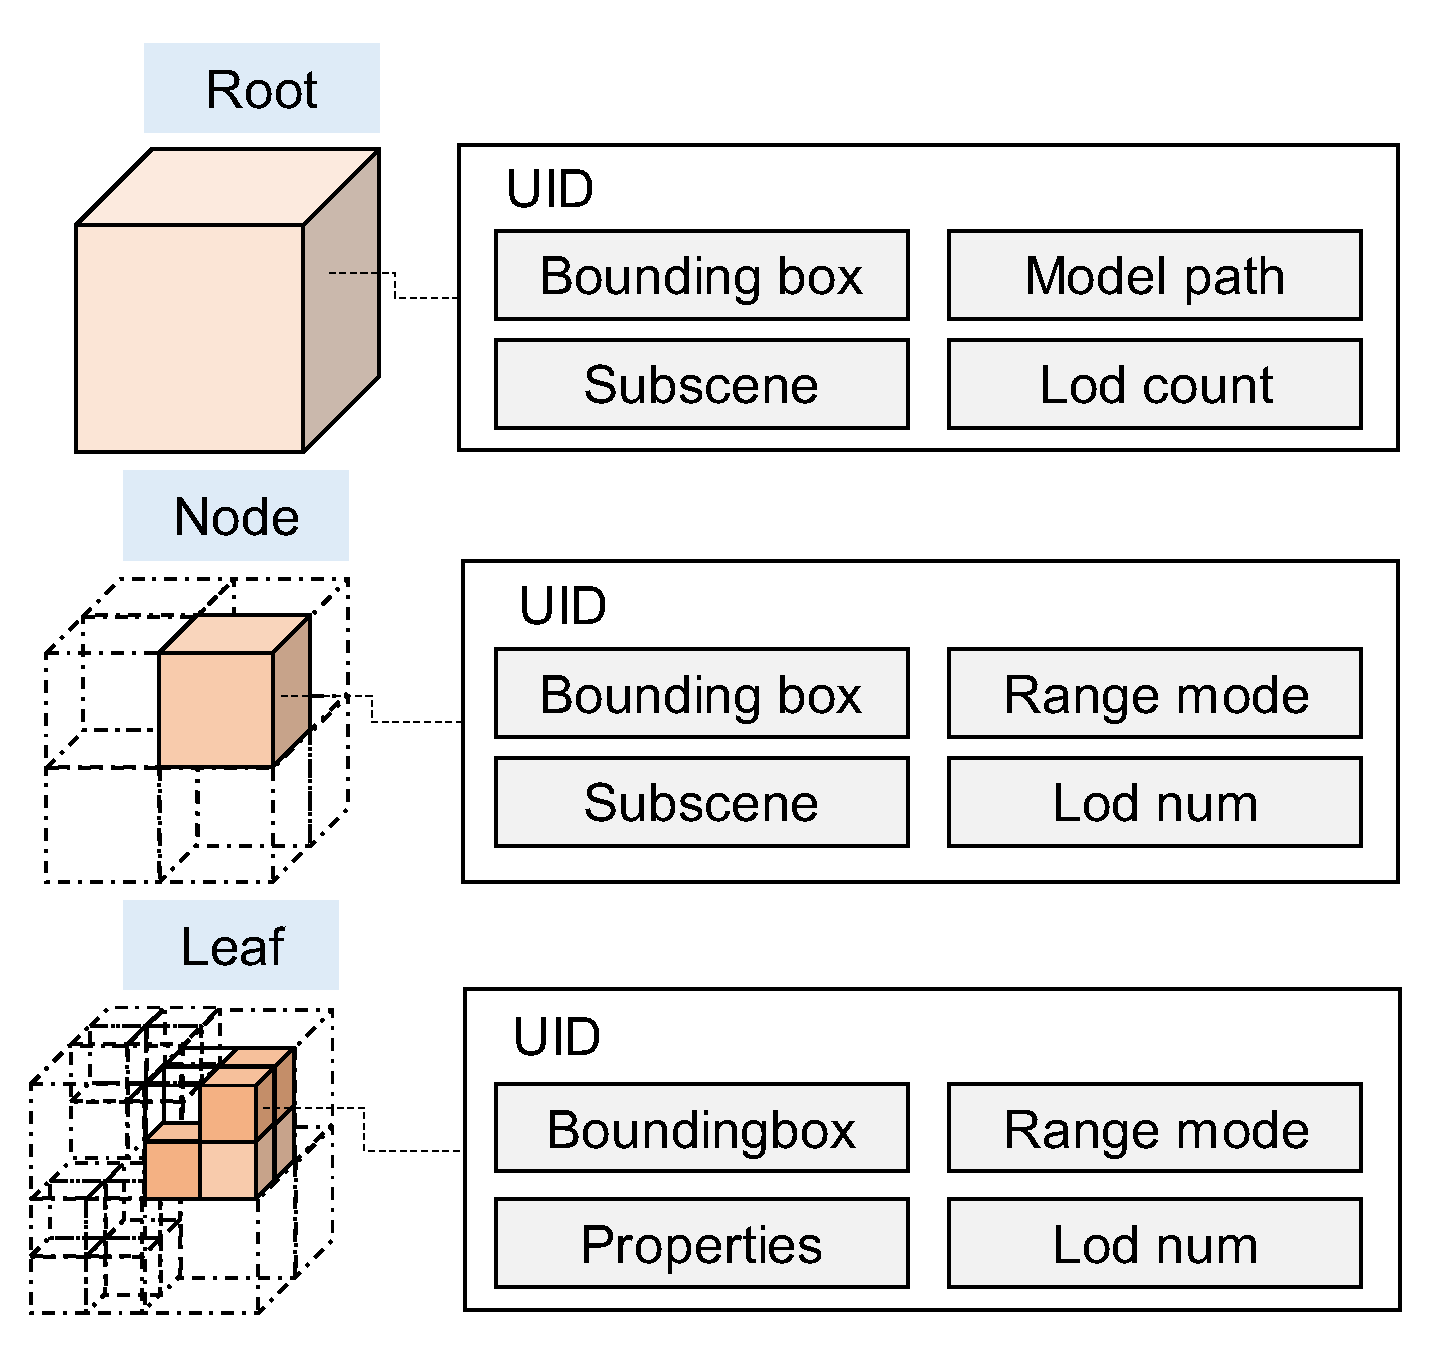
In the division of 3D space, a hierarchical organization of nodes with the octree structure is used, where each node represents a specific area and generates eight child nodes to further divide smaller areas. The boundary range of each node is represented by an axis-aligned bounding box. Each node has a unique identifier and stores scene index and model data information. The index information includes the boundary range, distance mode, and path, as shown in Figure 5, which is used to quickly access and locate nodes. According to data precision and display scale, different types of nodes, including root nodes, intermediate nodes, and leaf nodes, correspond to scene models at different levels. At macroscale, the model precision level with LOD1 is used to represent the scene of the entire line area, including surrounding terrain and buildings. At meso-scale, the intermediate node adopts the model fineness level with LOD2, which is used to represent the functional model units at the site level, such as station or tunnel structures. At microscale, the model fineness level with LOD3 is utilized to display the scene information for component model units at the facility level, including the equipment and artifacts. And the LOD4 is used for more detailed part models.
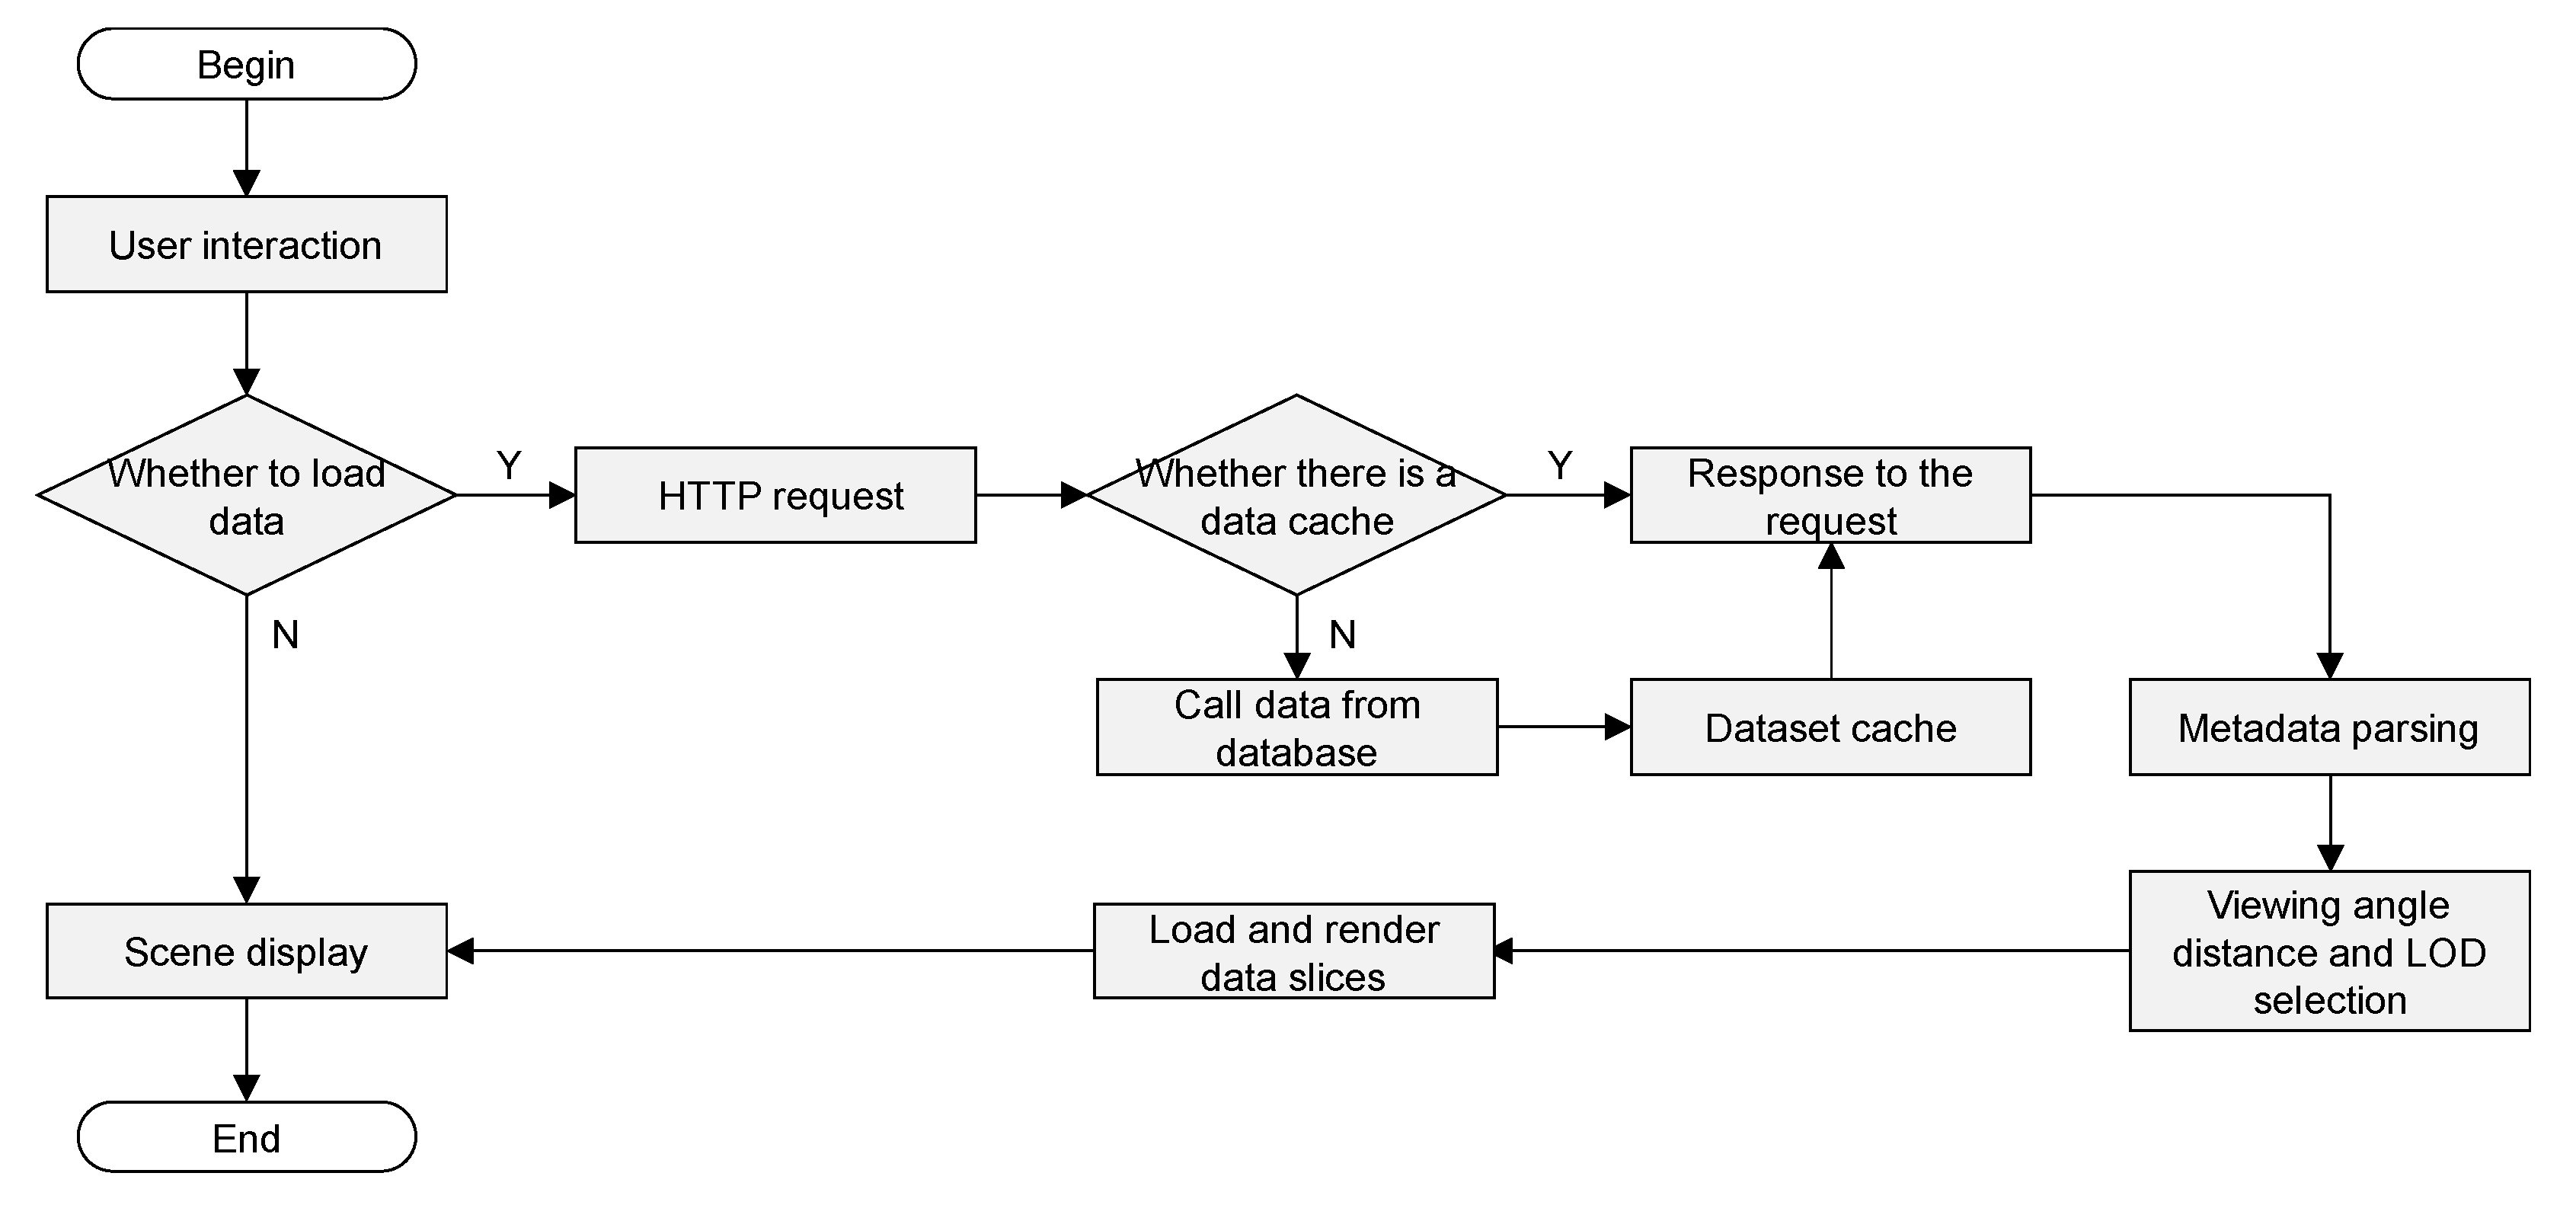
In addition, the hierarchical and dynamic loading and display process based on user interaction on the web, as shown in Figure 6, in which the user sends HTTP (Hyper Text Transfer Protocol) requests to the server through the browser, and based on the user’s actions and viewpoint position changes. The back-end web server receives the processing request and performs data caching and response. The browser loads and parses 3D data according to the pre-defined optimization rules. The 3D visualization engine based on WebGL renders the data at the appropriate level of detail and selects the appropriate resolution level and data slice for loading and rendering at different viewing distances and perspectives through the HLODs index structure. For example, the distant field of view can be represented by a lower-level model, while the closer field of view can be represented by a higher-level model, which can better control the visualization effect of the scene.
4. Case Study
4.1. Project Case
Shenzhen Metro Line 14 is a major transportation project in Shenzhen city, encompassing 17 subway stations and a total length of 50.34 km. Given the large scale, diverse regions, and complex terrain and geological conditions, it is necessary to visually manage the spatial layout, terrain features, and structural details of the project and present cross-domain data to the project team and stakeholders. However, accurate and authentic scene descriptions with 3D models require obtaining actual environmental information about the project and integrating 3D data from different sources. To address this challenge, based on the proposed approach, a unified management platform is developed by utilizing the Geographic Information System (GIS) and Building Information Modeling (BIM) technology. This platform allows for the integrated management of data from different sources and facilitates real-scene 3D visualization of the project.
4.2. Implementation of the Proposed Methodology
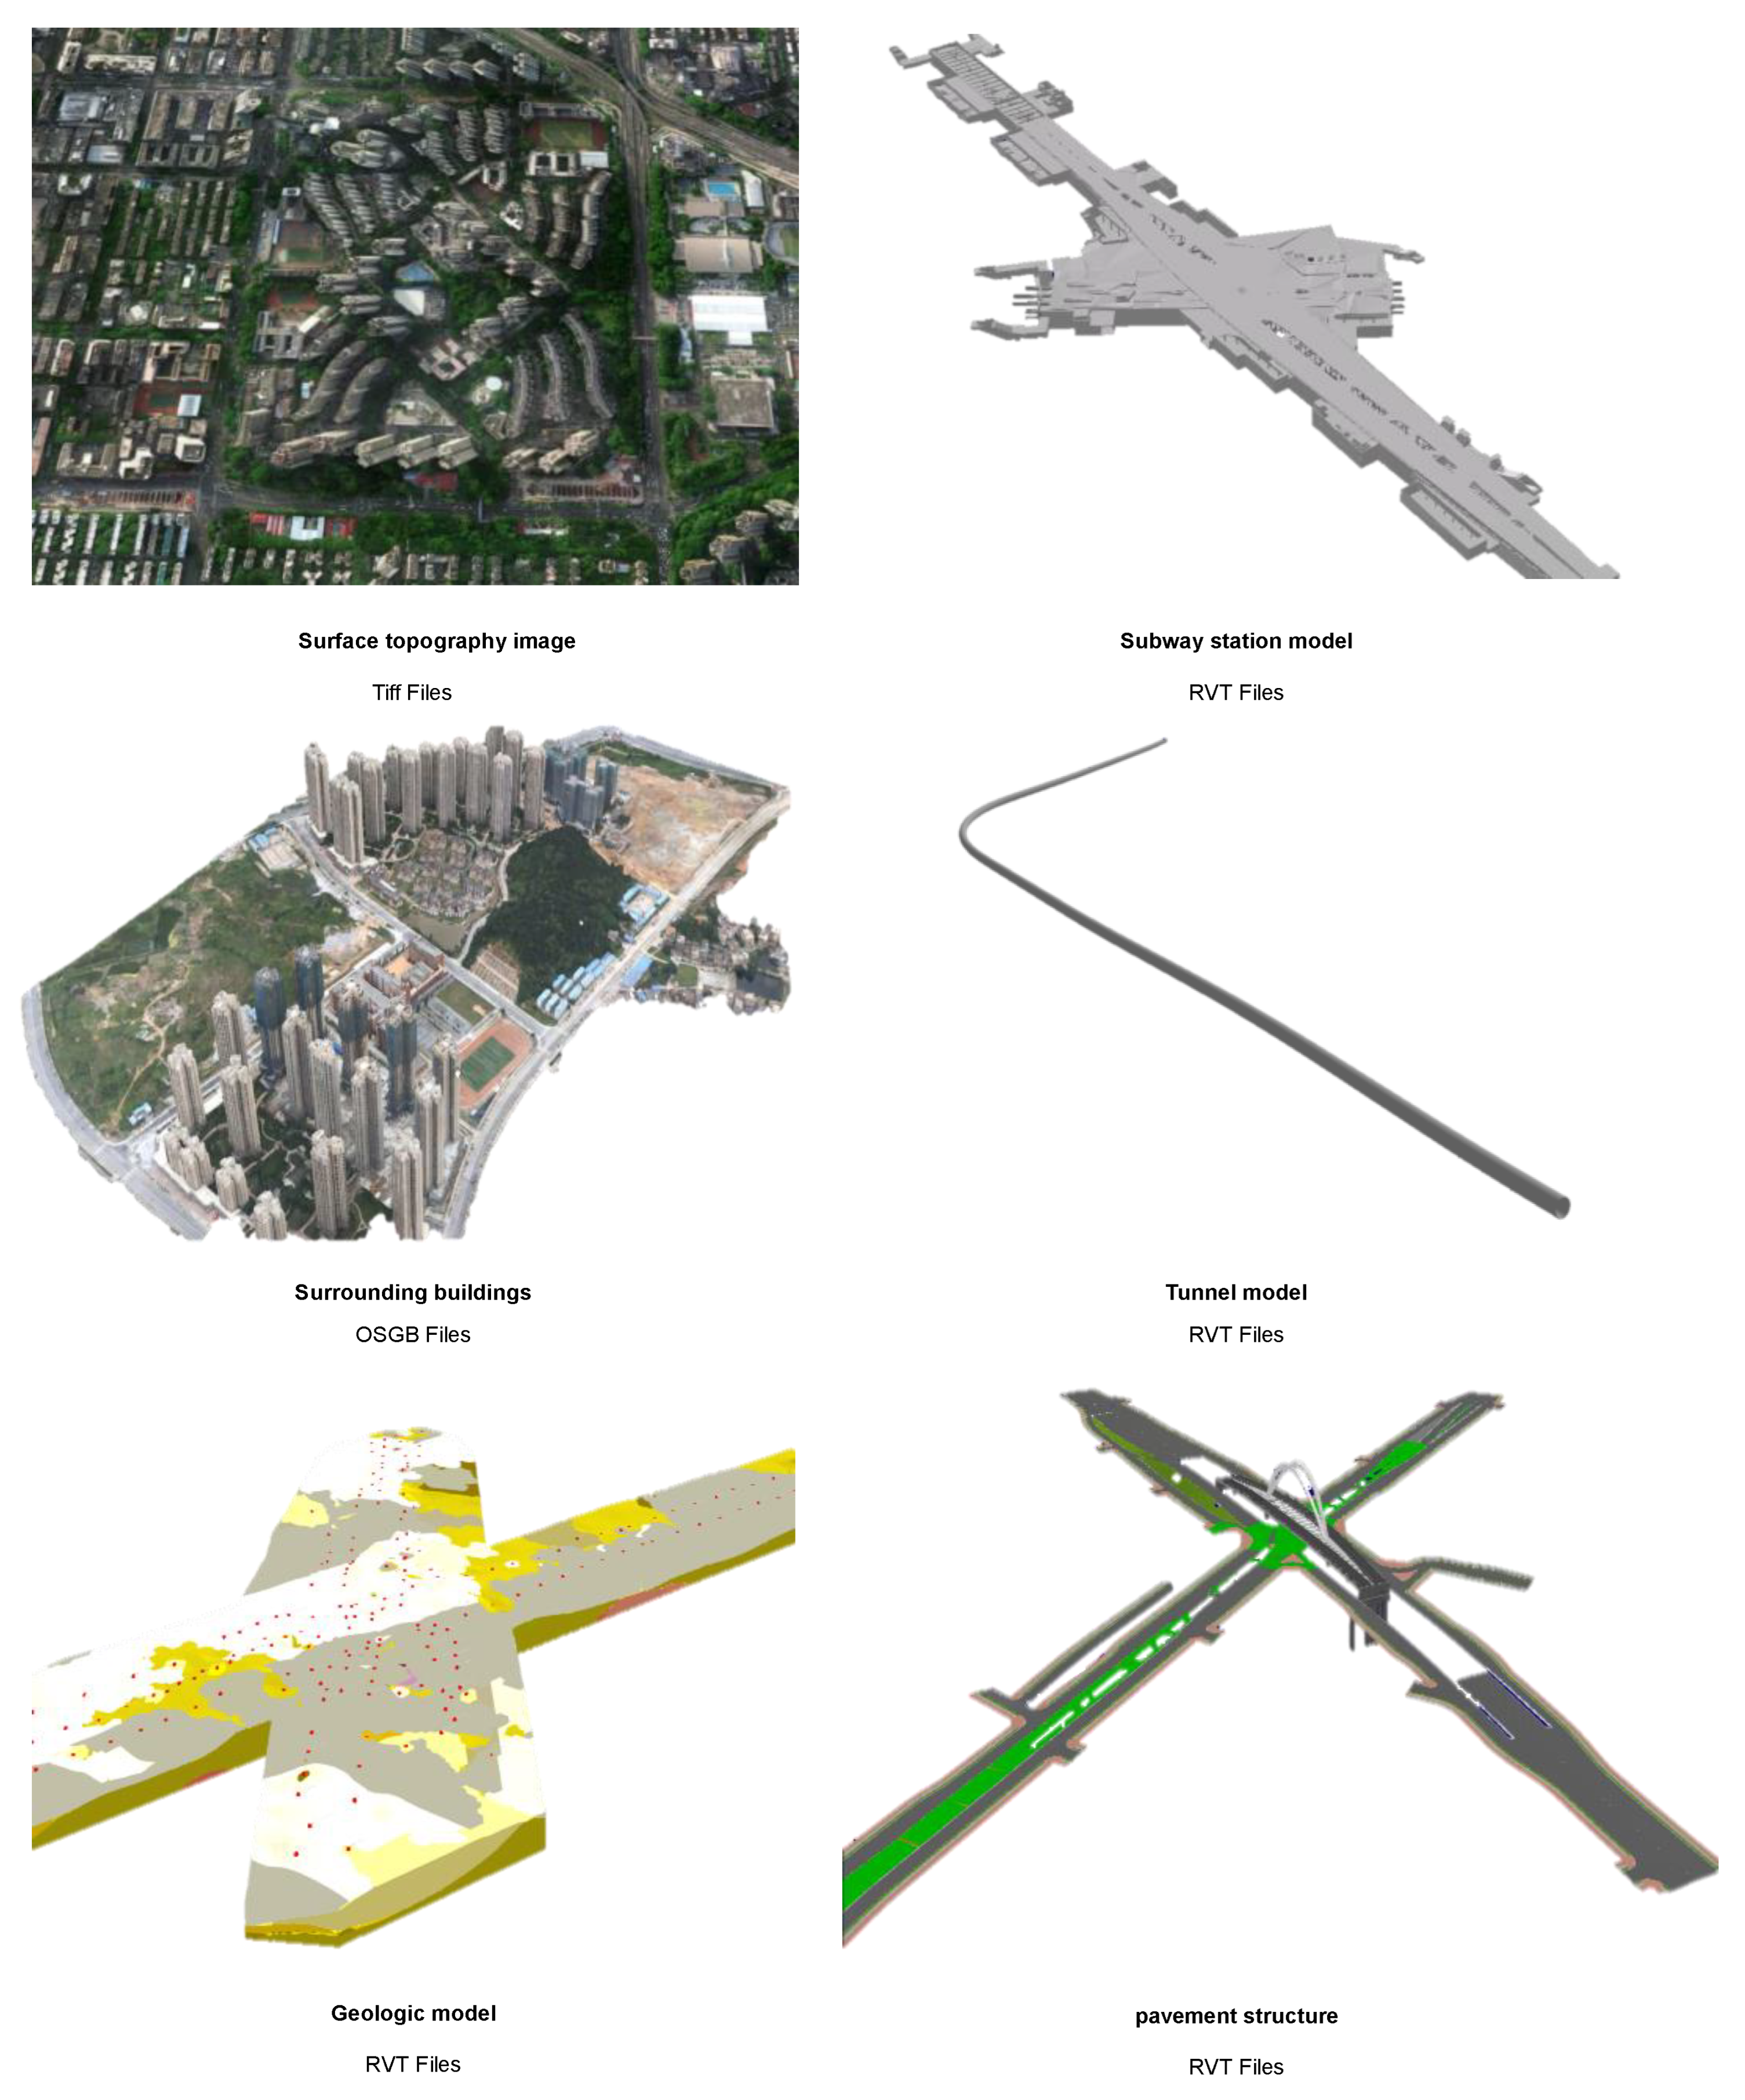
Initially, considering the information requirements in Section 3.1, the multiple 3D data involved in the real scene of a subway project include topography, landscapes, and surrounding buildings, as shown in Figure 7, to facilitate spatial analysis and construction planning.
The topography and landforms of the covered area are represented by a digital orthophoto map (DOM) with a mapping scale of 1:10,000, which is generated from satellite imagery rectified based on DEM. Ground resolution is less than 1 m, and the files are stored in the TIFF format. The quality of GIS data has been verified in practical application. The surrounding buildings are reconstructed using 3D information extracted from oblique imagery data acquired by Unmanned Aerial Vehicles (UAVs), and the Bentley software Context Capture Center v4 is used for automated reconstruction and generation of 3D models, which are exported in OSGB file format. The oblique photography technique ensures that the reconstructed models have high resolution and accuracy, which is usually about 5 cm. The detailed design includes subway stations, tunnels, pipelines, geological models, as well as other elements such as road surface structures. The design process takes into consideration the location and layout of the project objects, both above and below ground. The 3D modeling is carried out manually using the BIM software Autodesk Revit 2016. The built BIM model with LOD (Level of Development) 300 and its components contain accurate data (such as size, position, etc.), the precision of the models is refined based on construction requirements, and the accuracy of these data has been verified in practical applications. The design results are exported in RVT format. Specifically, the creation of the geological 3D model is based on the comprehensive analysis of geological survey points in the investigation report, ensuring a high level of data reliability.
Finally, the data are integrated into the GIS software SuperMap iDesktopX 10i for further processing. SuperMap and Revit are both commonly used software in the architecture industry, and their outputs ensure the integrity and accuracy of the final 3D model.
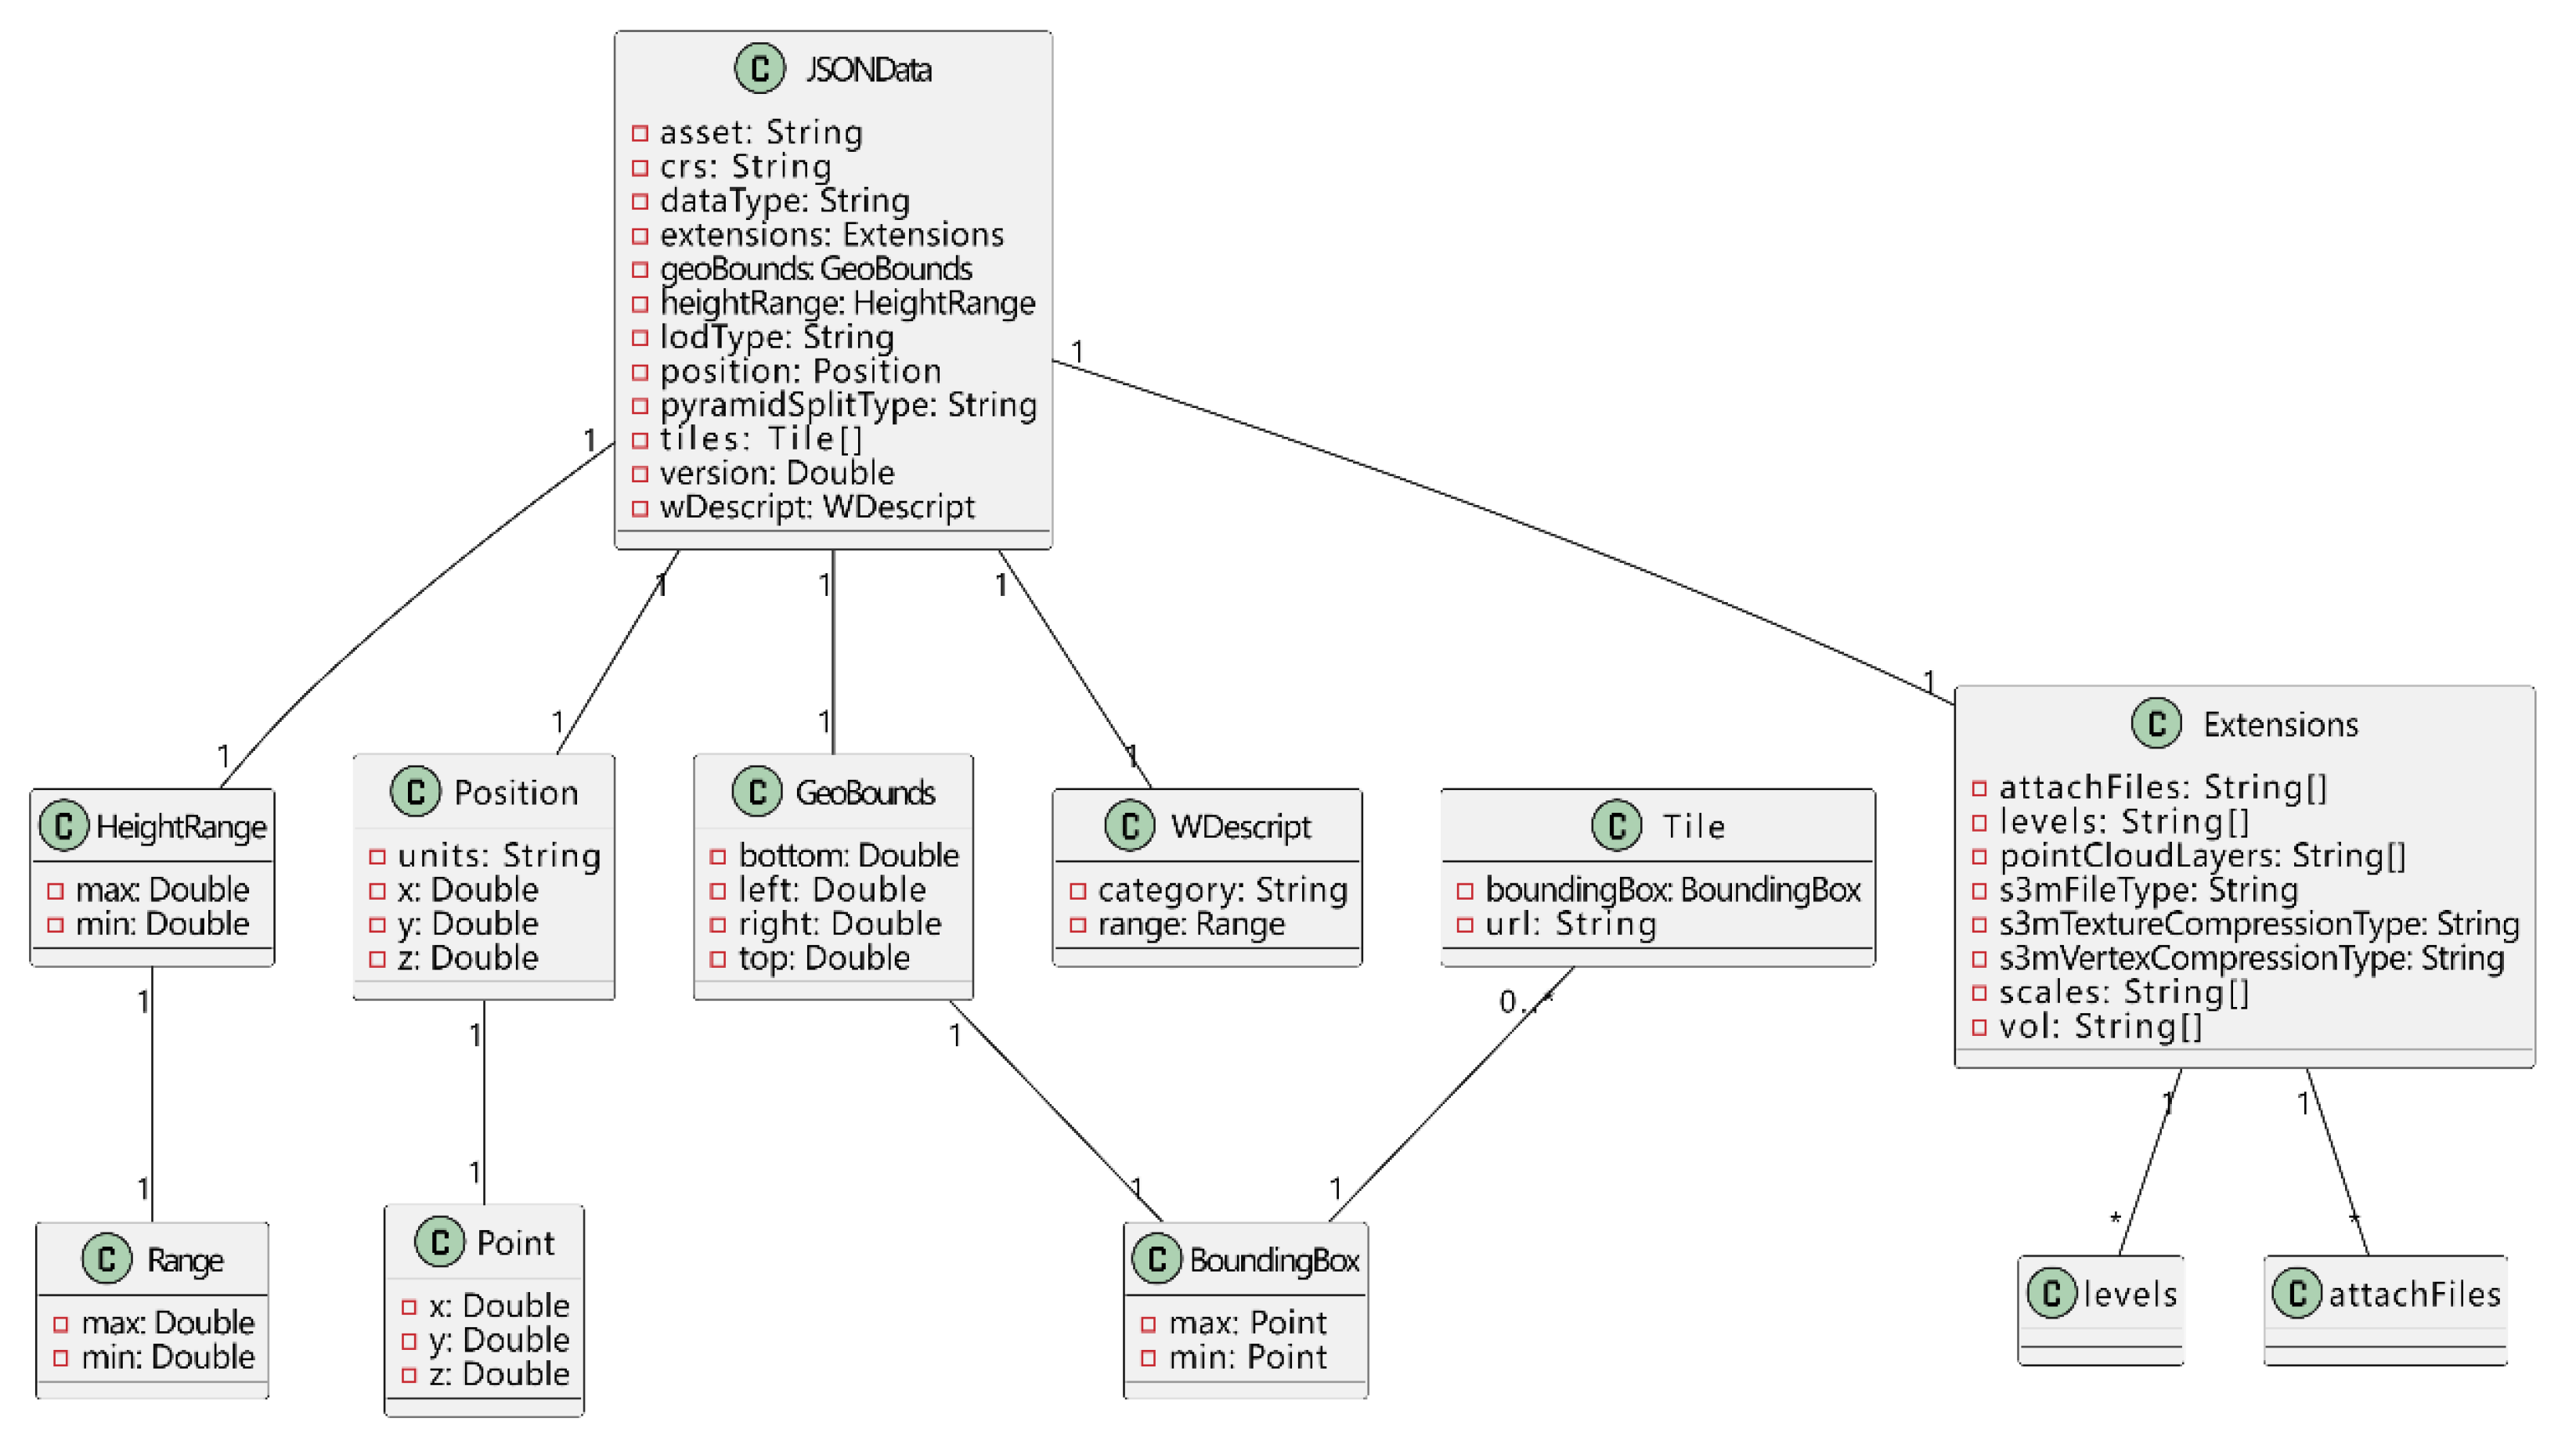
To integrate the multiple 3D models, based on the proposed workflow from Section 3.2, the spatial data transformation was carried out, and the data files were uploaded to the SuperMap. The integration of data into a unified geographic space was achieved through format and coordinate transformation, with WGS84 chosen as the reference coordinate system. Subsequently, based on the hierarchical organization of the 3D scenes, the datasets were merged and used for generating 3D sliced cache; the output results are stored in the form of S3M. In the S3M cache, metadata files were established to efficiently organize scene data. The data structure of these metadata files is depicted in Figure 8, which is formatted in JSON and contains information about the root node of the tile tree. Additionally, following the multi-level dynamic loading mechanism proposed in Section 3.3, a hierarchical spatial index for the model data based on boundary volumes was constructed. For each model, a JSON-format index file was created that contains the index information of the current node and its child nodes, including the boundary range, hierarchical structure, coordinate value, and file path of the integrated model. This facilitated rapid spatial data querying and scene rendering processes.
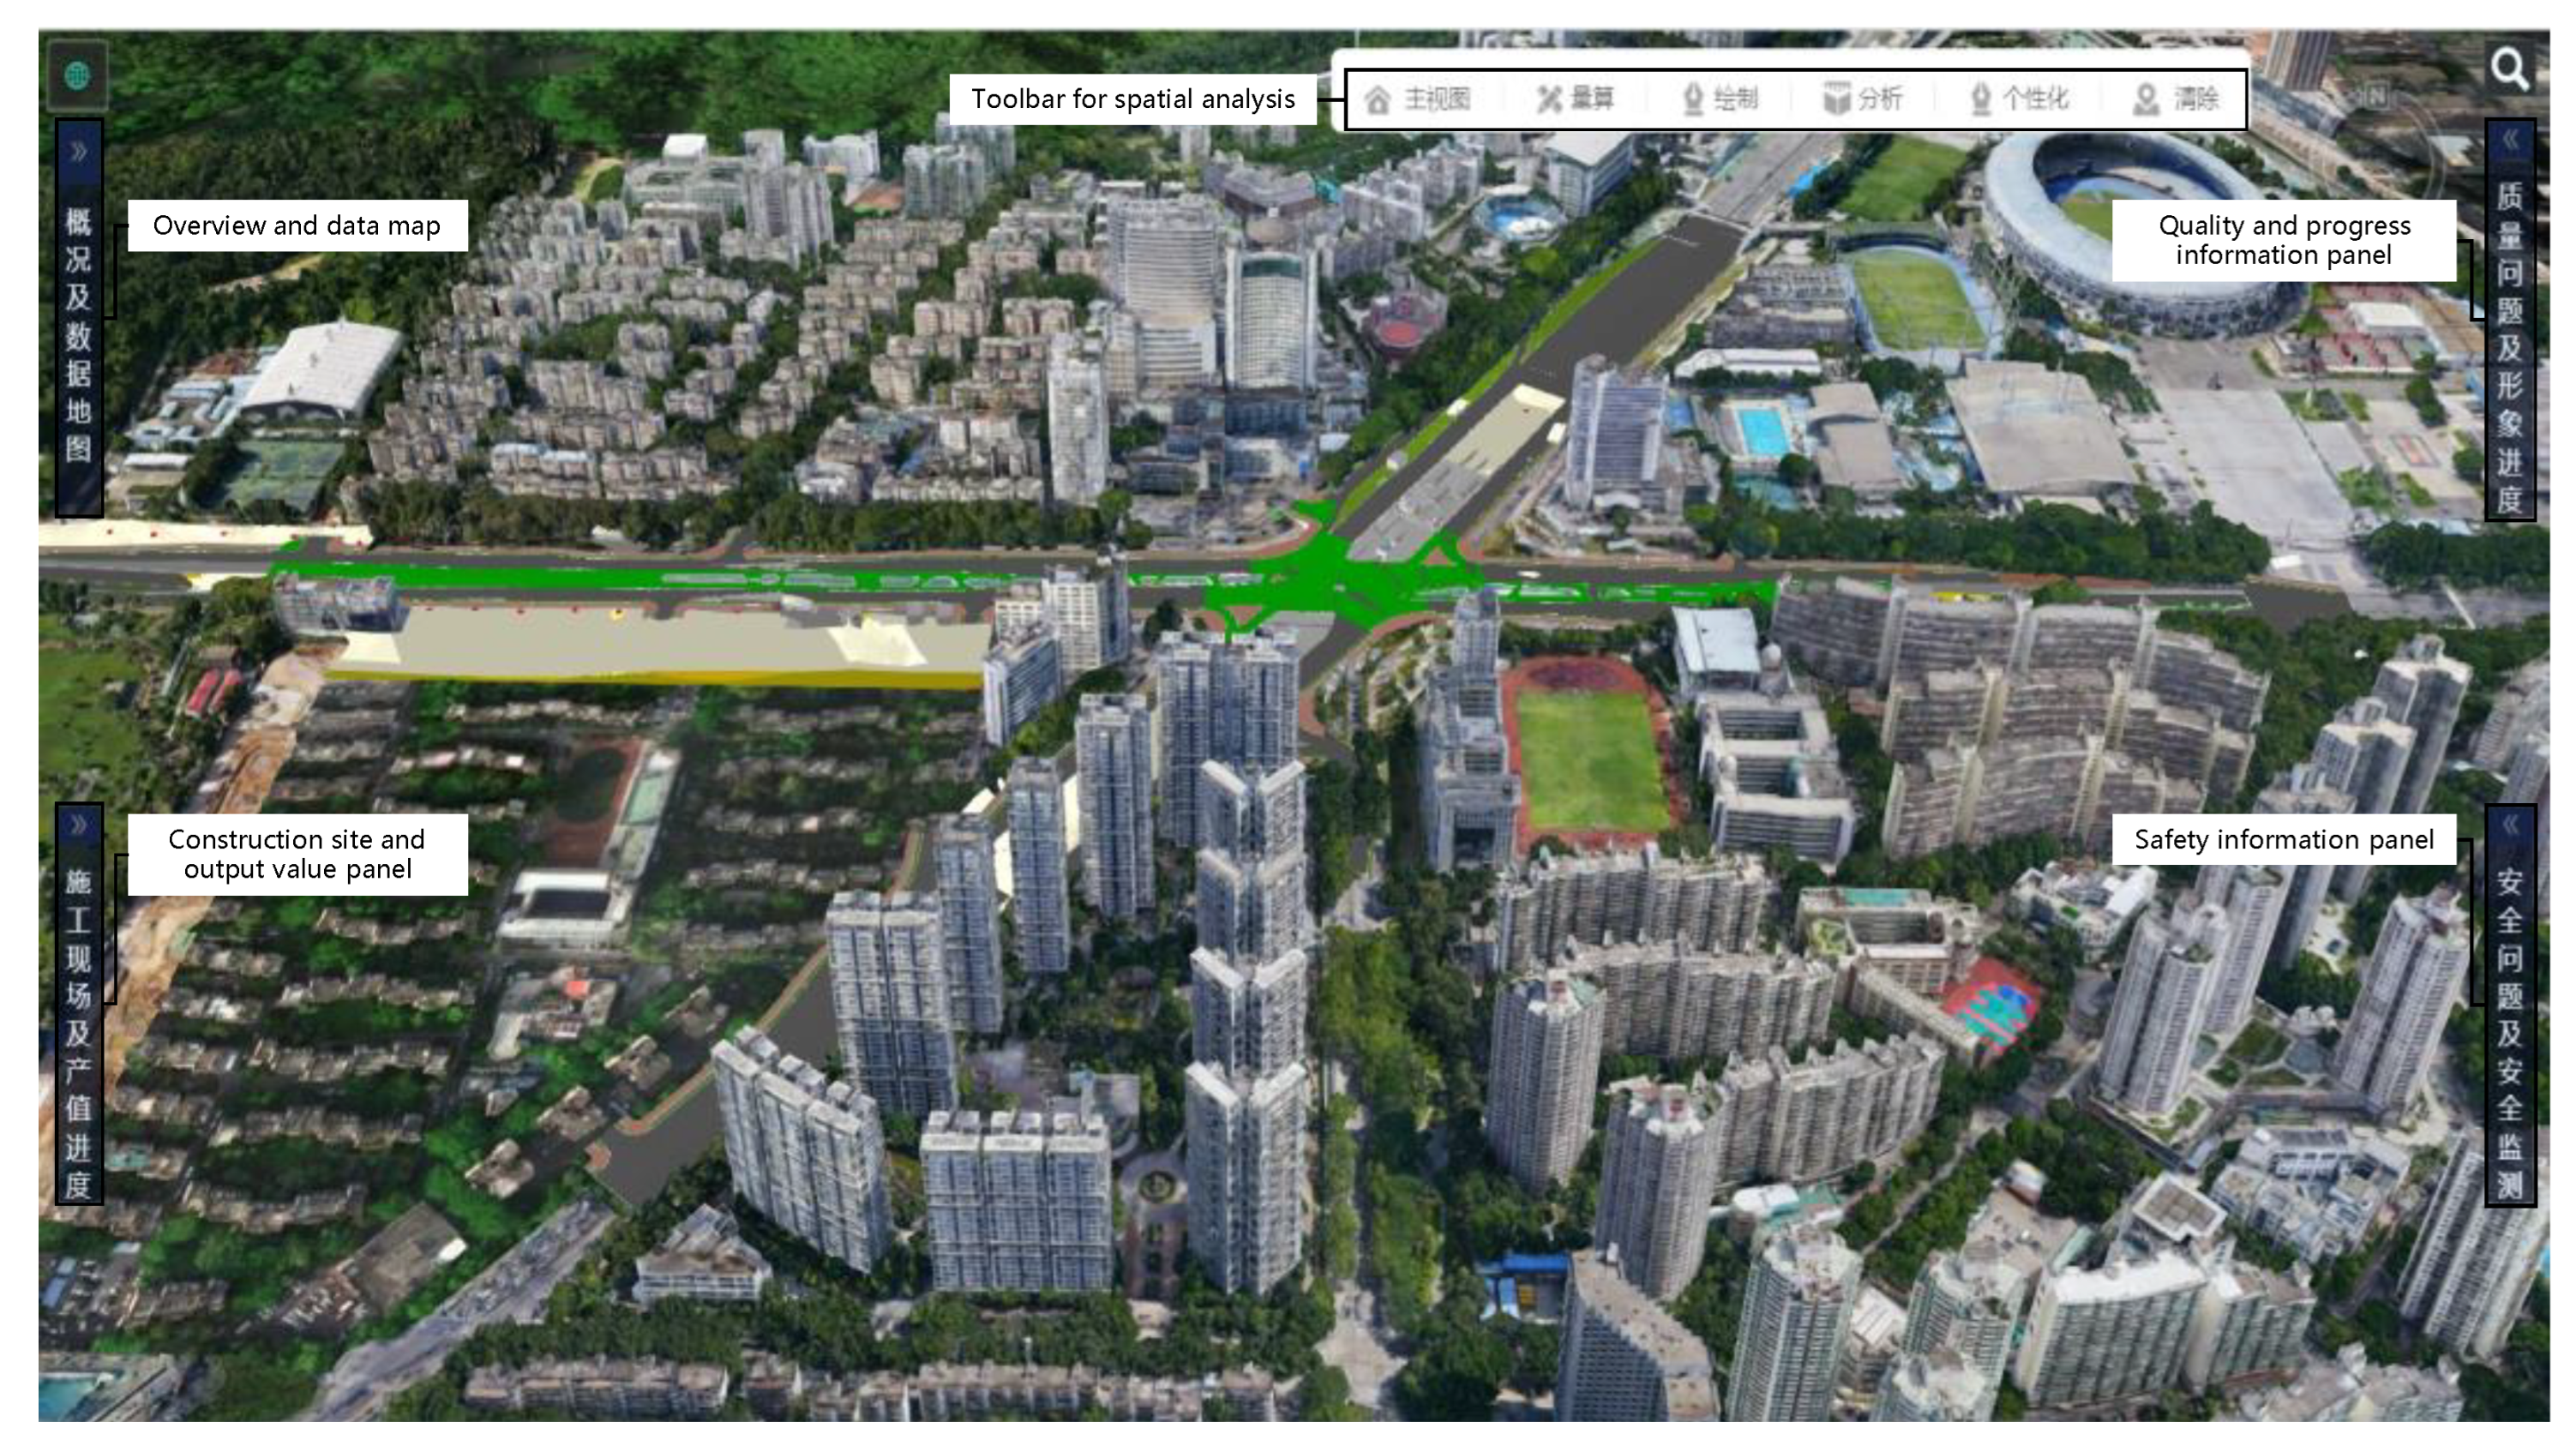
Based on the proposed method and data association, the prototype of a digital management platform was developed, creating a comprehensive GIS environment for project management, as shown in Figure 9. The platform deployed the GIS services provided by SuperMap in the Web environment, utilizing a client-server architecture with the JavaScript programming language and enabling the visualization and management of 3D data. On the backend of the platform, the spatial data are cached in a tile database, and index information and business data are stored in a MongoDB database to support efficient data access. Users can access the platform through a Web interface and invoke cached 3D scene datasets with REST data services to meet specific business data requirements in practical applications.
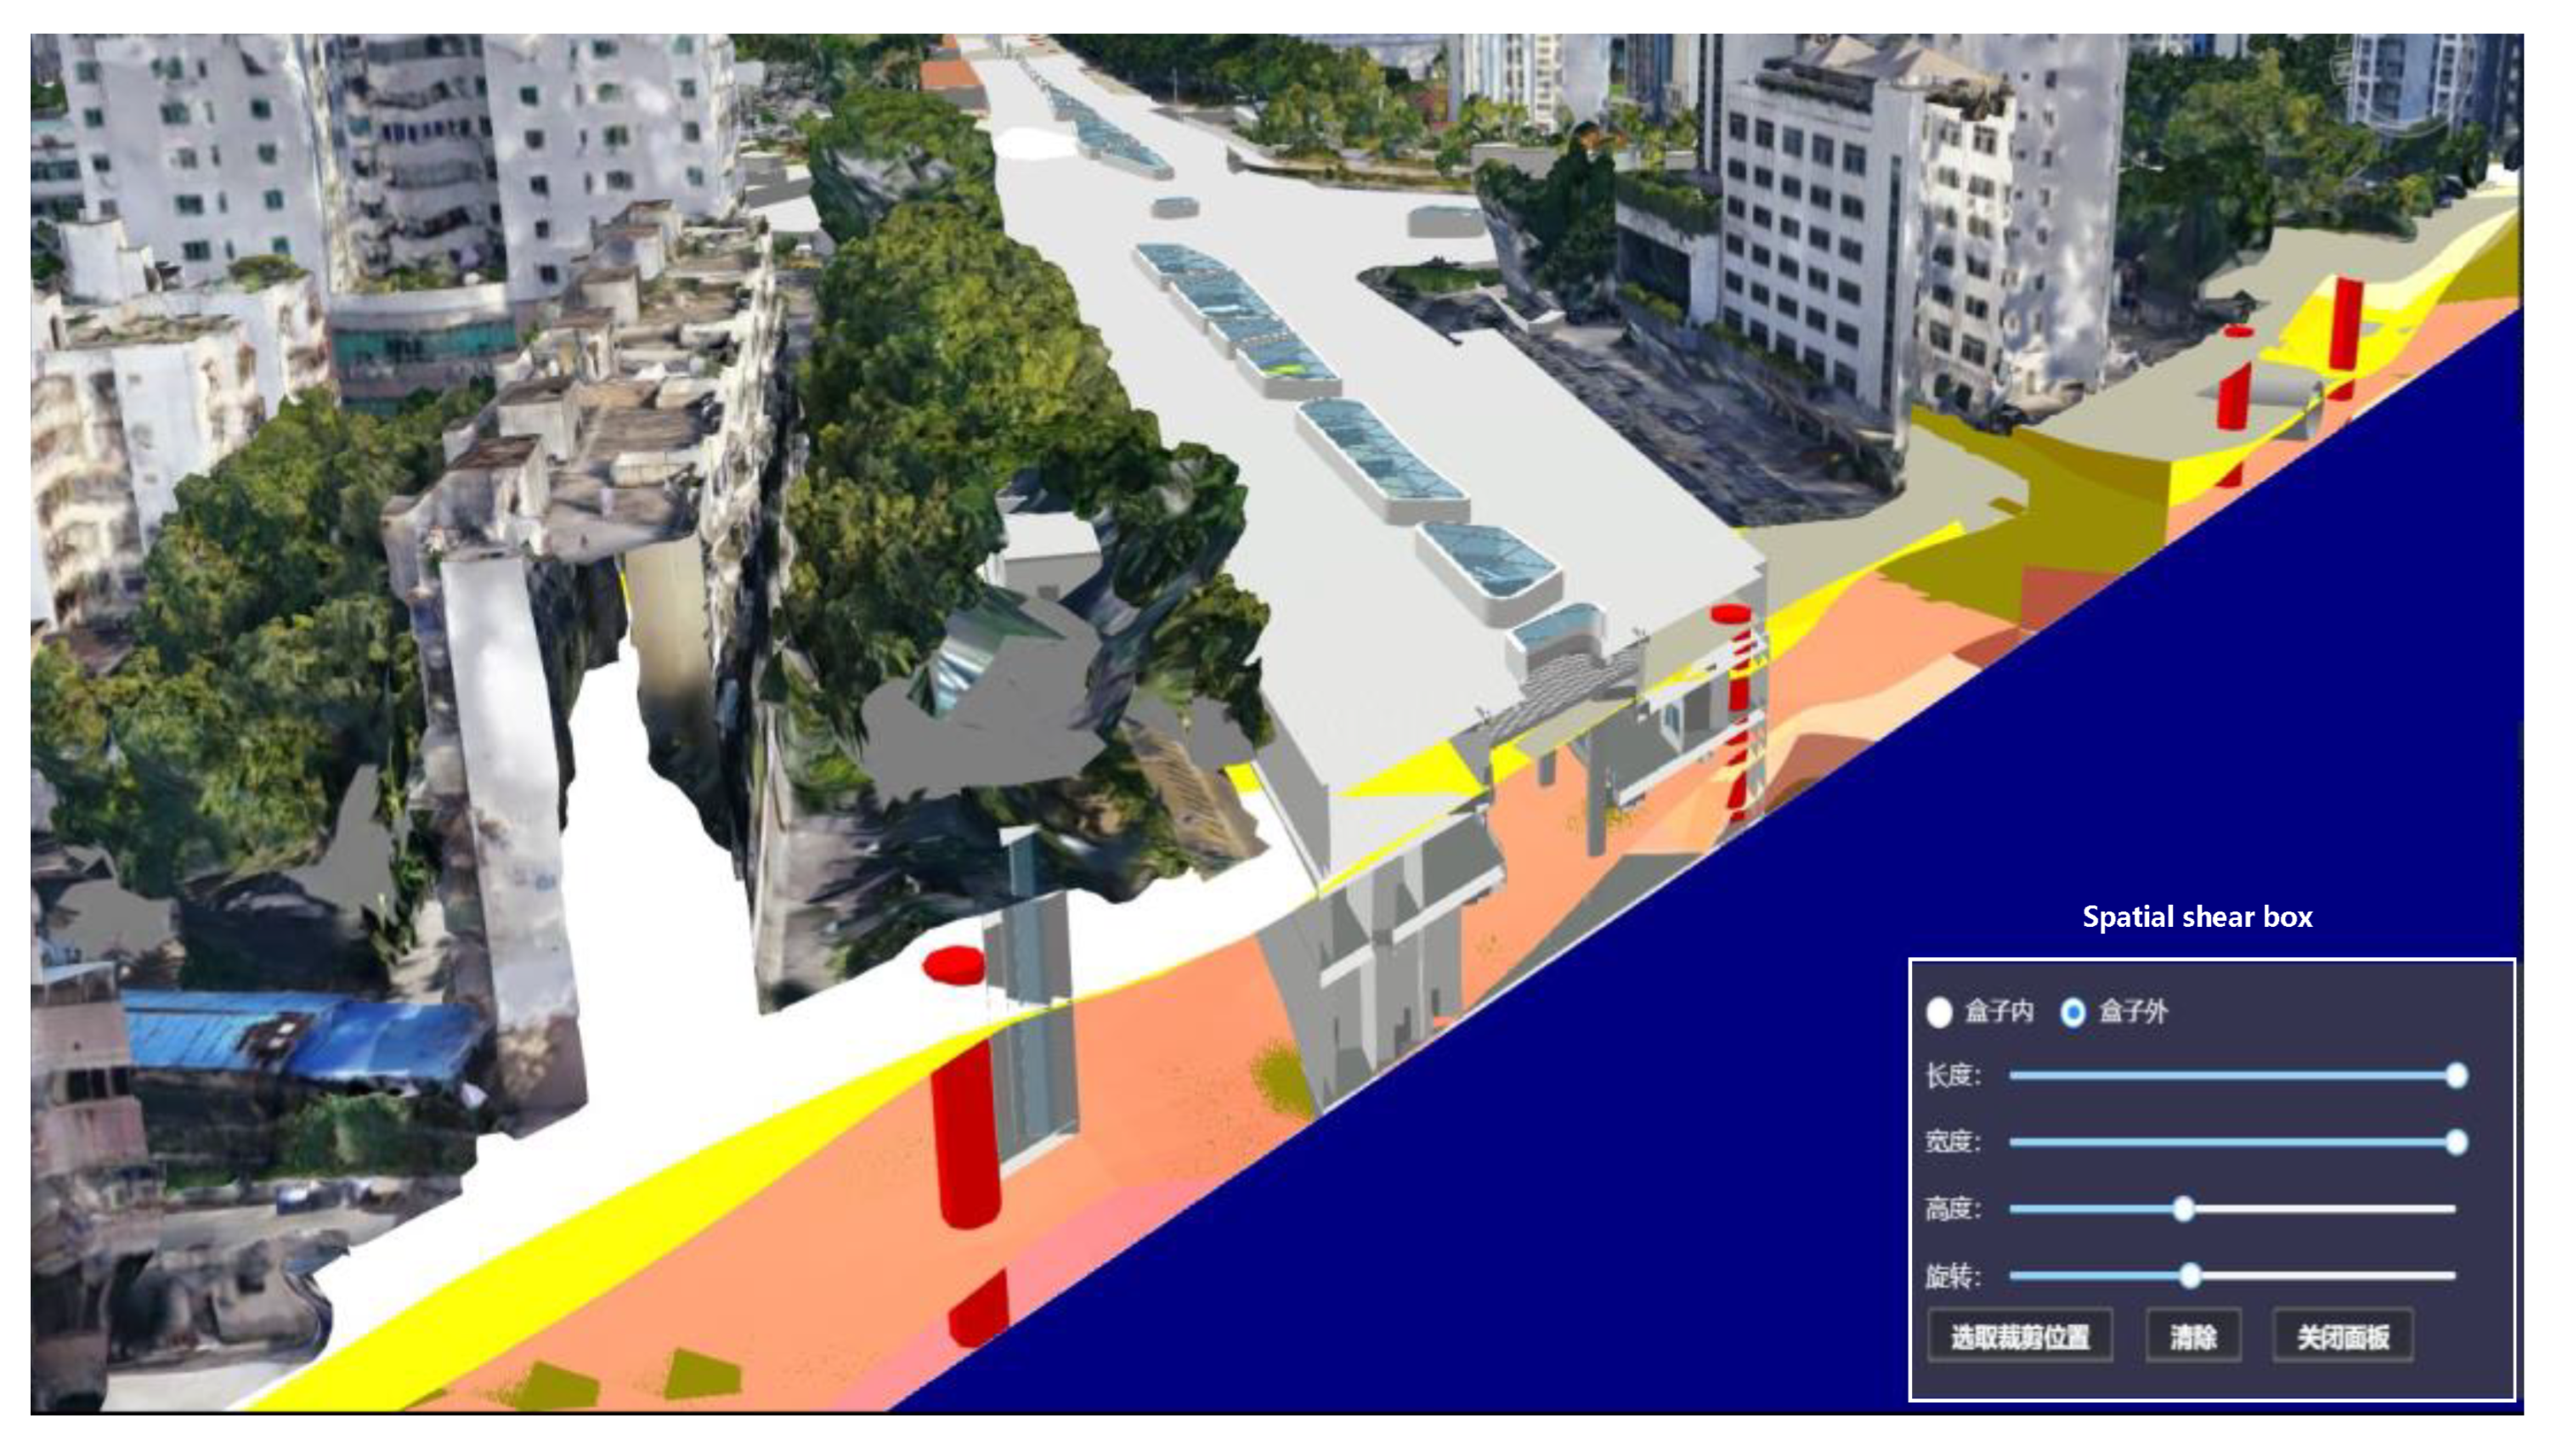
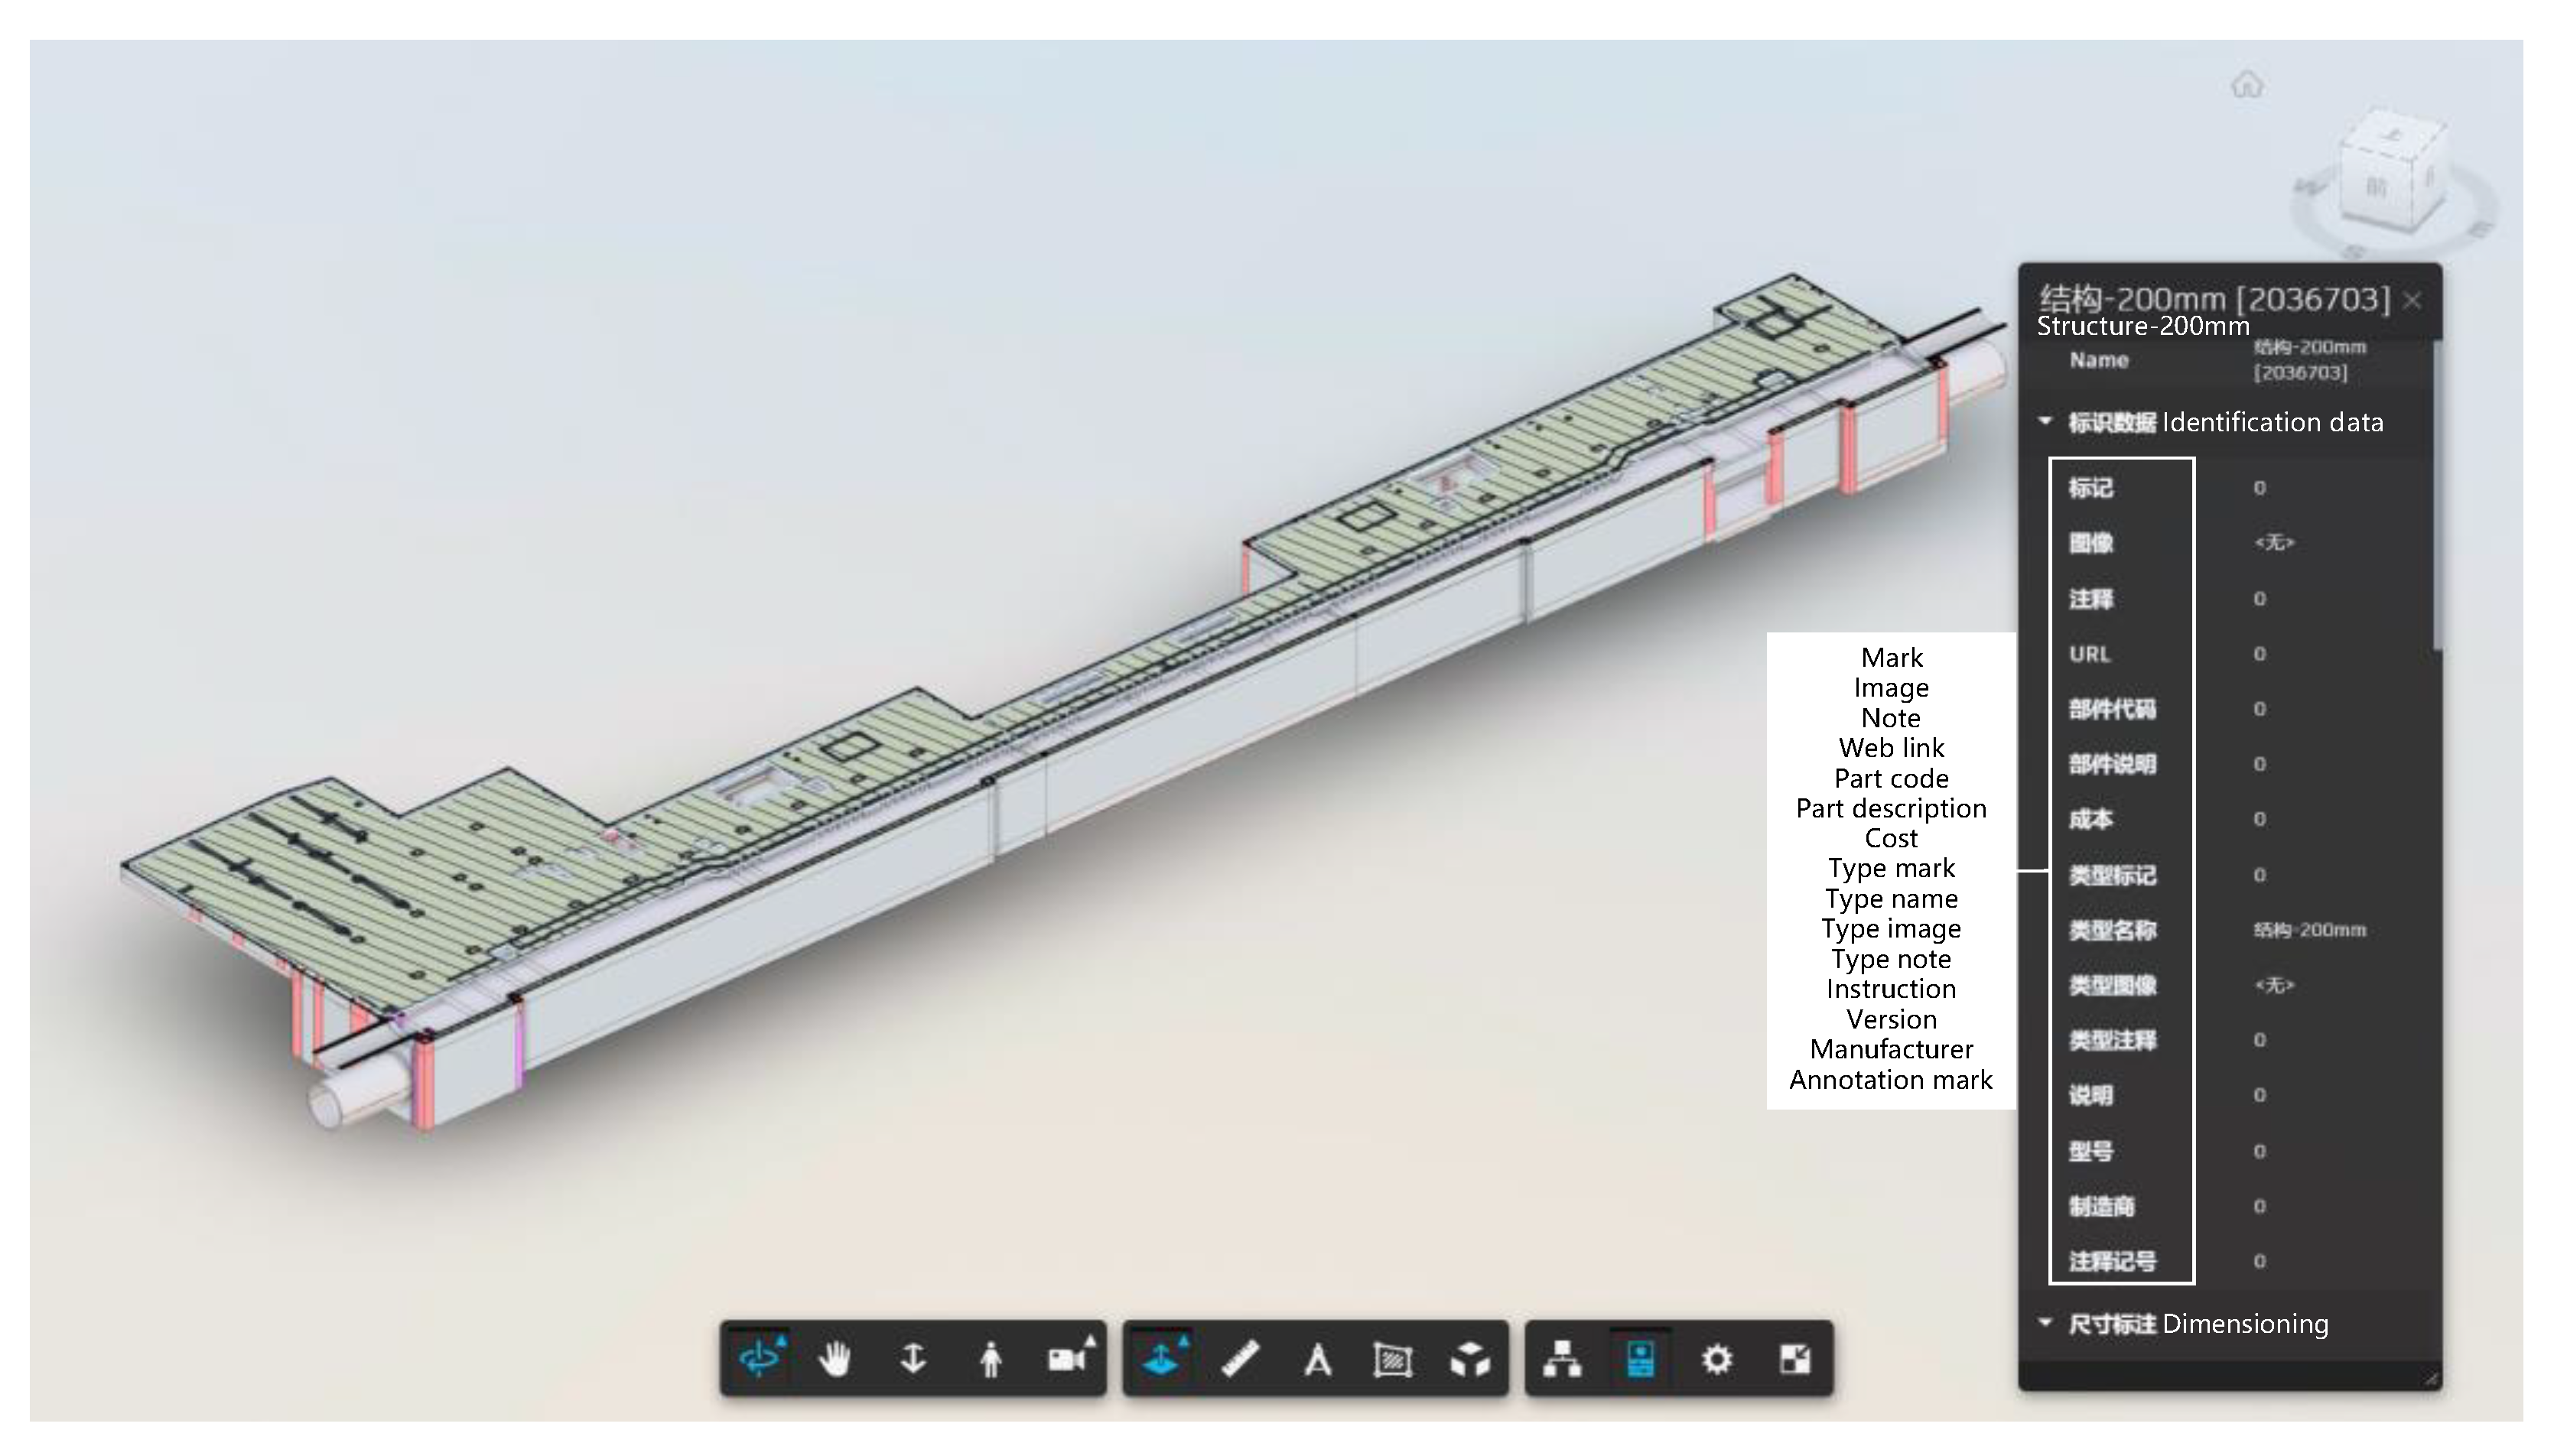
The system platform provides spatial analysis services, which are accessible for users to select relevant functions from the toolbar displayed in Figure 9. At the site level within the GIS environment, users can use these tools to perform model slicing analysis at selected spatial locations. A 3D representation of the geographic spatial relationship between the station model and its surrounding environment, both above and below ground, is shown in Figure 10, allowing users to inspect the overall structure model of the project. Moreover, users have the option to check the status of the station BIM model separately, without any occlusion by the geographical surface, as illustrated in Figure 11. Users can interactively dissect models, select specific components to access their detailed parameter properties, and conduct online queries for management purposes.
4.3. Test Results for Multi-Scale Visualization
With the visual display process described in Section 3.3, the multi-scale display of the integrated model for the subway engineering project was organized on the Web platform. The data are dynamically loaded to the appropriate level of detail (LOD) based on changes in viewpoint distance. Through user interactions, tests were conducted to record the system’s performance under different operations and viewing angles, utilizing a computer configuration equipped with a 3.6 GHz processor, 16 GB of memory, and a general-purpose graphics card.
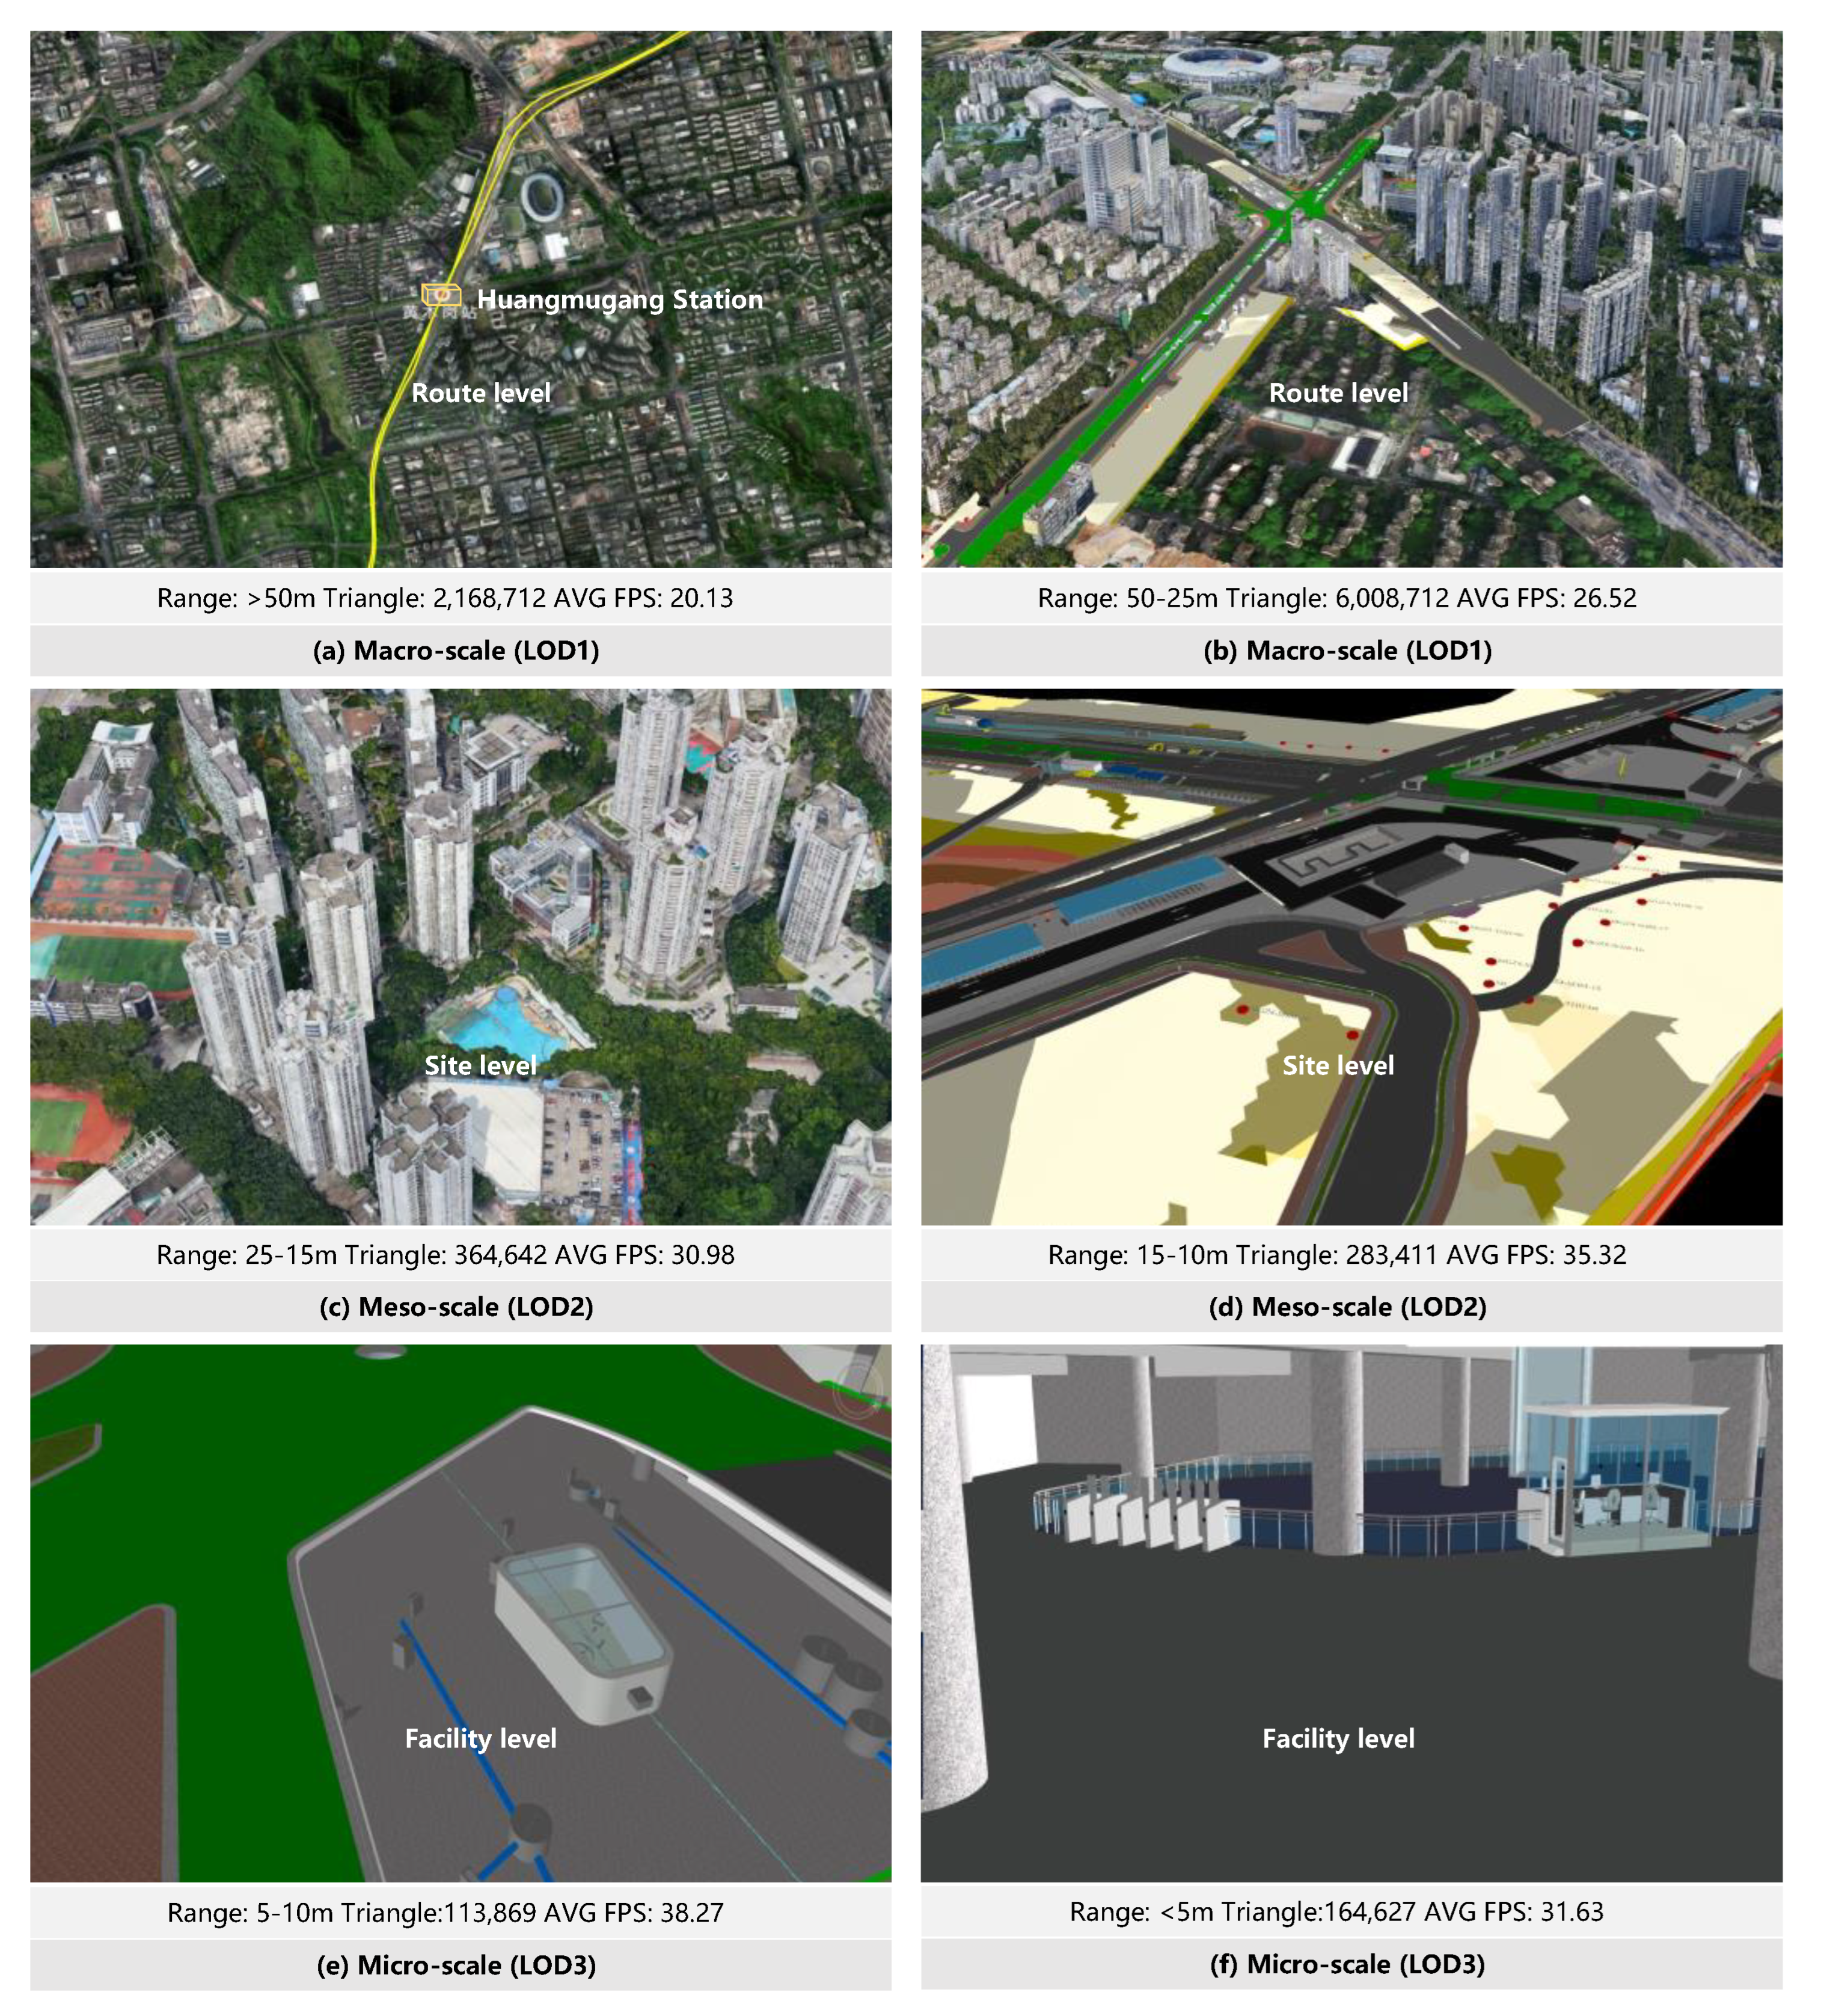
During the testing, the perspective of a follower was simulated, focusing on a specific station as the central point. The model was displayed at three scales, including macro, meso, and micro, based on the distance and field of view, which were determined by a unified proportional scale. The dynamic loading of model details was also activated according to the switching of view distance. The visual effects of the scene are shown in Figure 12. The test results reveal that the models exhibit smooth performance at all scales, with an average frame rate per second (FPS) exceeding 20. Furthermore, the models maintained a relatively low triangle count, and the loading response time met the requirements. Through observing the loading of models at different levels, when the viewing distance and field of view are wide (greater than 25 m), these models at the macroscale, which are located at the root nodes of the HLOD tree, utilize LOD1 for their level of detail. This allows users to obtain an overview of the location, alignment, and surrounding environment of the subway line, providing comprehensive visual information about its overall appearance. As the viewer gradually approaches the station, a dynamic transition to models at the mesoscale occurs within a view range of 25 to 10 m. At this scale, models at LOD2 are utilized to maintain the accuracy of their appearance. Users can observe surrounding buildings, station roads, and external features of the models within this range. At the microscale, when the viewpoint approaches and falls within a range of less than 5 m, the interior space of the station is accessed. The models at the LOD3 level are used to present detailed information, including its structure, decorations, and others. The results in Figure 12 validate the successful presentation of models by the system across all scales and various viewpoints and scenes, enabling participants to seamlessly and smoothly interact with the models.
5. Discussion
Since the challenges faced during the implementation of real-scene construction in subway projects may include data acquisition and integration complexities, dealing with diverse data sources, formats, and datasets, and large-scale visualization in 3D models.
Compared to the previous studies [12,18,42], the main contribution of this paper lies in its proposed framework, which addresses the current challenges in the field of real-scene 3D visualization. And the details of the advantages of this research can be summarized as follows:
- (i)
- In this paper, a management framework of 3D model data integration and visual dynamic display is proposed to meet the information requirements, and it is successfully applied to the real-scene 3D visualization of subway engineering projects. The results show that various users, including managers, owners, and construction teams, can access both dynamic and static data and view the results on a unified platform and shared scene. Moreover, spatial analysis can be performed to improve construction processes. The comprehensive application of this framework provides effective data support for the visualization management in subway engineering projects.
- (ii)
- Currently, compared to the traditional transformation work of geo-data and BIM data [35,37,54], data organization poses a challenge in the process of 3D model integration. In order to address this issue, this study developed a 3D model integration workflow that utilizes GIS software SuperMap to perform format and coordinate conversions. A scene-based hierarchical approach is adapted to overlay various types of 3D data, including point clouds, oblique photography, and BIM models. Subsequently, these datasets are merged into a single dataset, which serves as a data cache for the publishing of 3D scenes, thereby enhancing the efficiency of data integration.
- (iii)
- One of the challenges in web-based 3D scene visualization is effective data loading and model rendering [43,46]. This is primarily due to the increasing volume of data and the complexity and time-consuming nature of handling diverse data sources for large-scale scenes. To address this issue, this paper proposes a 3D visualization strategy that combines octree and Level of Detail (LOD) techniques. The strategy aims to achieve the desired visualization effect for the 3D model, where the scene models are designed with multiple LODs corresponding to different scales. When accessing data at specific scales, only the model that meets the required data precision and display scale is dynamically loaded and rendered, allowing for efficient and optimized visualization.
The use of octree-based index information for node organization allows for defining integrated multi-level model representations with different scene caching information, thereby effectively managing and organizing data to improve data loading speed. The web-side visual display process is designed to dynamically load and render data based on changes in the user’s viewpoint, enabling multi-level visualization and convenient 3D scene interaction on the developed web-based platform. During the case implementation process, users were able to freely roam and observe the 3D model to evaluate its visualization effectiveness. The results demonstrate that the system meets both user experience and practical application requirements. The utilization of scene texture caching effectively caters to the user’s demands for visualizing scenes at different scales, ranging from the entire subway line and stations to interior models. The multi-scale visualization of scenes significantly reduces rendering delays of large-scale 3D data on the Web, ensuring the precision and accuracy of the integrated 3D models. Moreover, it facilitates seamless and realistic scene transitions, providing users with a more immersive and authentic experience of the real scenes.
However, there are still limitations in the proposed framework and parts of these tasks. This study could benefit from exploring and integrating more diverse data sources, such as point cloud data, to enhance the comprehensiveness and accuracy of the 3D model [62]. Although the current project has not fully demonstrated the application of point cloud data, further exploration in this area may prove valuable. From the results of 3D data integration and scene visualization in practical applications, it is necessary to supplement the geometric semantics of 3D models in the integration model to provide more comprehensive information for visualization and scene understanding.
6. Conclusions
The multi-source and heterogeneous nature of data in subway engineering projects poses challenges for the implementation of real-scene 3D visualization applications.
The aim of this research is to address the challenges of data integration and dynamic visualization in real-scene 3D visualization. Firstly, we propose a comprehensive management framework that integrates data integration and dynamic visualization. This framework effectively combines GIS and BIM technologies, allowing for the integration of various 3D model data and a unified platform for data presentation and management. Furthermore, we have developed a technical processing workflow for integrating multi-source data that is based on scene-based layering of 3D model data. The generated sliced cache is used for storage and 3D scene publishing. Additionally, considering the challenges of web-based large-scale 3D model visualization, we have designed a visualization strategy based on octree and Level of Details (LODs) to organize data and enable multi-level dynamic loading for visual display. The octree structure is used to organize the three-dimensional space partition, and the data indices for each node are constructed. Finally, using the Shenzhen Metro Line 14 project as a case study, the proposed framework was applied to develop a web-based platform system. Users can access and view real-time data, enabling comprehensive visual management and real-time roaming of the 3D scenes. The visualization display process for web-based subway engineering 3D scenes was tested based on user demands and viewpoint changes. The results of scene visualization at different scales verify the effectiveness of the proposed method and maintain the realism and effects of the 3D model.
There are still aspects that need improvements in our research work. Firstly, further research is needed to assess the differences in quality and accuracy of the 3D models. Secondly, it is crucial to ensure that the bound 3D models can accurately associate each element with the semantic context of the scene to achieve precise model matching. In addition, the adoption of efficient data compression and model lightweighting techniques is necessary to reduce the data storage and network transmission load of 3D model data. Regarding the real-scene 3D visualization for subway projects, the system’s functionalities can be expanded to address specific needs. The integration and application of GIS and BIM technologies can provide more comprehensive support for visualization management.
Author Contributions
Conceptualization, X.W. and Y.Z.; methodology, software, investigation, visualization, data curation, writing—original draft preparation, X.W.; validation, formal analysis, resources, supervision, Y.Z.; writing—review and editing, project administration, funding acquisition, J.W. All authors have read and agreed to the published version of the manuscript.
Funding
This research was funded by the China Railway Group Ltd. 2020 Annual Scientific and Technology R&D Program, Approval number: 2020-Guidance-192; General Program of National Natural Science Foundation of China, Approval number: 71772125.
Data Availability Statement
The data presented in this study are available on request from the corresponding author. The data are not publicly available due to privacy or ethical restrictions.
Acknowledgments
The authors would like to thank Shenzhen Thsware Hi-Tech Co., Ltd. for providing software and technical support. The authors sincerely thank the anonymous reviewers for their useful comments and suggestions.
Conflicts of Interest
The authors declare no conflict of interest.
References
- Operating Length of Urban Rail Transit in China’s Cities 2010–2021; Statista Research Department: Hamburg, Germany, 2023.
- Qin, F.; Zhang, X.; Zhou, Q. Evaluating the Impact of Organizational Patterns on the Efficiency of Urban Rail Transit Systems in China. J. Transp. Geogr. 2014, 40, 89–99. [Google Scholar] [CrossRef]
- Buyukdemircioglu, M.; Kocaman, S.; Isikdag, U. Semi-Automatic 3D City Model Generation from Large-Format Aerial Images. ISPRS Int. J. Geo. Inf. 2018, 7, 339. [Google Scholar] [CrossRef]
- Yang, B.; Ali, F.; Zhou, B.; Li, S.; Yu, Y.; Yang, T.; Liu, X.; Liang, Z.; Zhang, K. A Novel Approach of Efficient 3D Reconstruction for Real Scene Using Unmanned Aerial Vehicle Oblique Photogrammetry with Five Cameras. Comput. Electr. Eng. 2022, 99, 107804. [Google Scholar] [CrossRef]
- Wang, C.; Cho, Y.K.; Kim, C. Automatic BIM Component Extraction from Point Clouds of Existing Buildings for Sustainability Applications. Autom. Constr. 2015, 56, 1–13. [Google Scholar] [CrossRef]
- Haala, N.; Rothermel, M.; Cavegn, S. Extracting 3D Urban Models from Oblique Aerial Images. In Proceedings of the 2015 Joint Urban Remote Sensing Event (JURSE), Lausanne, Switzerland, 30 March–1 April 2015; IEEE: Piscataway, NJ, USA, 2015; pp. 1–4. [Google Scholar]
- Wu, B.; Xie, L.; Hu, H.; Zhu, Q.; Yau, E. Integration of Aerial Oblique Imagery and Terrestrial Imagery for Optimized 3D Modeling in Urban Areas. ISPRS J. Photogramm. Remote Sens. 2018, 139, 119–132. [Google Scholar] [CrossRef]
- Volk, R.; Stengel, J.; Schultmann, F. Building Information Modeling (BIM) for Existing Buildings—Literature Review and Future Needs. Autom. Constr. 2014, 38, 109–127. [Google Scholar] [CrossRef]
- Furukawa, Y.; Curless, B.; Seitz, S.M.; Szeliski, R. Reconstructing Building Interiors from Images. In Proceedings of the 2009 IEEE 12th International Conference on Computer Vision, Kyoto, Japan, 27 September–4 October 2009; IEEE: Piscataway, NJ, USA, 2009; pp. 80–87. [Google Scholar]
- Xiong, X.; Adan, A.; Akinci, B.; Huber, D. Automatic Creation of Semantically Rich 3D Building Models from Laser Scanner Data. Autom. Constr. 2013, 31, 325–337. [Google Scholar] [CrossRef]
- Zhu, Z.; Brilakis, I. Concrete Column Recognition in Images and Videos. J. Comput. Civ. Eng. 2010, 24, 478–487. [Google Scholar] [CrossRef]
- Wan Abdul Basir, W.N.F.; Majid, Z.; Ujang, U.; Chong, A. Integration of GIS and BIM Techniques in Construction Project Management–A Review. Int. Arch. Photogramm. Remote Sens. Spat. Inf. Sci. 2018, XLII-4/W9, 307–316. [Google Scholar] [CrossRef]
- Wu, X.; Ou, J.; Wen, Y.; Liu, X.; He, J.; Zhang, J. Developing a Data-Fusing Method for Mapping Fine-Scale Urban Three-Dimensional Building Structure. Sustain. Cities Soc. 2022, 80, 103716. [Google Scholar] [CrossRef]
- Wang, S.; Zhong, Y.; Wang, E. An Integrated GIS Platform Architecture for Spatiotemporal Big Data. Future Gener. Comput. Syst. 2019, 94, 160–172. [Google Scholar] [CrossRef]
- Bereczky, N.; Duch, A.; Németh, K.; Roura, S. Quad-Kd Trees: A General Framework for Kd Trees and Quad Trees. Theor. Comput. Sci. 2016, 616, 126–140. [Google Scholar] [CrossRef]
- Rezgui, A.; Malik, Z.; Xia, J.; Liu, K.; Yang, C. Data-Intensive Spatial Indexing on the Clouds. Procedia Comput. Sci. 2013, 18, 2615–2618. [Google Scholar] [CrossRef]
- Mosa, A.S.M.; Schön, B.; Bertolotto, M.; Laefer, D.F. Evaluating the Benefits of Octree-Based Indexing for Lidar Data. Photogramm. Eng. Remote Sens. 2012, 78, 927–934. [Google Scholar] [CrossRef]
- Xu, X.W.; Ding, L.; Luo, H.; Ma, L. From Building Information Modeling to City Information Modeling. J. Inf. Technol. Constr. 2014, 19, 292–307. [Google Scholar]
- Abdul Shukor, S.A.; Wong, R.; Rushforth, E.; Basah, S.N.; Zakaria, A. 3D Terrestrial Laser Scanner for Managing Existing Building. J. Teknol. 2015, 76, 133–139. [Google Scholar] [CrossRef]
- Shan, P.; Sun, W. Research on 3D Urban Landscape Design and Evaluation Based on Geographic Information System. Environ. Earth Sci. 2021, 80, 597. [Google Scholar] [CrossRef]
- Ugwitz, P.; Juřík, V.; Herman, L.; Stachoň, Z.; Kubíček, P.; Šašinka, Č. Spatial Analysis of Navigation in Virtual Geographic Environments. Appl. Sci. 2019, 9, 1873. [Google Scholar] [CrossRef]
- Xu, J.; Shu, X.; Qiao, P.; Li, S.; Xu, J. Developing a Digital Twin Model for Monitoring Building Structural Health by Combining a Building Information Model and a Real-Scene 3D Model. Measurement 2023, 217, 112955. [Google Scholar] [CrossRef]
- Coors, V. 3D-GIS in Networking Environments. Comput. Environ. Urban Syst. 2003, 27, 345–357. [Google Scholar] [CrossRef]
- Toschi, I.; Nocerino, E.; Remondino, F.; Revolti, A.; Soria, G.; Piffer, S. Geospatial Data Processing for 3d City Model Generation, Management and Visualization. Int. Arch. Photogramm. Remote Sens. Spat. Inf. Sci. 2017, XLII-1/W1, 527–534. [Google Scholar] [CrossRef]
- Kilsedar, C.; Brovelli, M. Multidimensional Visualization and Processing of Big Open Urban Geospatial Data on the Web. ISPRS Int. J. Geo-Inf. 2020, 9, 434. [Google Scholar] [CrossRef]
- Remondino, F.; El-Hakim, S. Image-Based 3D Modelling: A Review. Photogramm. Rec. 2006, 21, 269–291. [Google Scholar] [CrossRef]
- Li, J.; Yao, Y.; Duan, P.; Chen, Y.; Li, S.; Zhang, C. Studies on Three-Dimensional (3D) Modeling of UAV Oblique Imagery with the Aid of Loop-Shooting. ISPRS Int. J. Geo-Inf. 2018, 7, 356. [Google Scholar] [CrossRef]
- Zhou, T.; Lv, L.; Liu, J.; Wan, J. Application of UAV Oblique Photography in Real Scene 3D Modeling. Int. Arch. Photogramm. Remote Sens. Spat. Inf. Sci. 2021, XLIII-B2-2021, 413–418. [Google Scholar] [CrossRef]
- Wang, C.; Cho, Y.K. Smart Scanning and near Real-Time 3D Surface Modeling of Dynamic Construction Equipment from a Point Cloud. Autom. Constr. 2015, 49, 239–249. [Google Scholar] [CrossRef]
- Yijing, W.; Yuning, C. Construction and Analysis of 3D Scene Model of Landscape Space Based on UAV Oblique Photography and 3D Laser Scanner. J. Digit. Landsc. Archit. 2018, 3, 283–290. [Google Scholar]
- Usmani, A.R.A.; Elshafey, A.; Gheisari, M.; Chai, C.; Aminudin, E.B.; Tan, C.S. A Scan to As-Built Building Information Modeling Workflow: A Case Study in Malaysia. J. Eng. Des. Technol. 2020, 18, 923–940. [Google Scholar] [CrossRef]
- Liu, X.; Wang, X.; Wright, G.; Cheng, J.; Li, X.; Liu, R. A State-of-the-Art Review on the Integration of Building Information Modeling (BIM) and Geographic Information System (GIS). ISPRS Int. J. Geo-Inf. 2017, 6, 53. [Google Scholar] [CrossRef]
- Sacks, R.; Ma, L.; Yosef, R.; Borrmann, A.; Daum, S.; Kattel, U. Semantic Enrichment for Building Information Modeling: Procedure for Compiling Inference Rules and Operators for Complex Geometry. J. Comput. Civ. Eng. 2017, 31, 04017062. [Google Scholar] [CrossRef]
- De Laat, R.; Van Berlo, L. Integration of BIM and GIS: The Development of the CityGML GeoBIM Extension. In Advances in 3D Geo-Information Sciences; Kolbe, T.H., König, G., Nagel, C., Eds.; Lecture Notes in Geoinformation and Cartography; Springer: Berlin/Heidelberg, Germany, 2011; pp. 211–225. ISBN 978-3-642-12669-7. [Google Scholar]
- Sani, M.J.; Abdul Rahman, A. GIS and BIM Integration at Data Level: A Review. Int. Arch. Photogramm. Remote Sens. Spat. Inf. Sci. 2018, XLII-4/W9, 299–306. [Google Scholar] [CrossRef]
- Hor, A.-H.; Jadidi, A.; Sohn, G. BIM-GIS Integrated Geospatial Information Model Using Semantic Web and RDF Graphs. ISPRS Ann. Photogramm. Remote Sens. Spat. Inf. Sci. 2016, III–4, 73–79. [Google Scholar] [CrossRef]
- Zhu, J.; Wang, X.; Wang, P.; Wu, Z.; Kim, M.J. Integration of BIM and GIS: Geometry from IFC to Shapefile Using Open-Source Technology. Autom. Constr. 2019, 102, 105–119. [Google Scholar] [CrossRef]
- Zhang, Y.; Zhu, Q.; Liu, G.; Zheng, W.; Li, Z.; Du, Z. GeoScope: Full 3D Geospatial Information System Case Study. Geo-Spat. Inf. Sci. 2011, 14, 150–156. [Google Scholar] [CrossRef]
- Jun, Z.; Ali, Z.; Lingzhi, Y.; Chuan, Q.; Jinhong, W.; Mingwei, L. 3D GIS Modeling of Virtual High-Speed Railway Scene Based on ArcGlobe. In Proceedings of the 2013 Seventh International Conference on Image and Graphics, Qingdao, China, 26–28 July 2013; IEEE: Piscataway, NJ, USA, 2013; pp. 811–815. [Google Scholar]
- Gan, L.; Li, J. Ning Jing Hybrid Organization and Visualization of the DSM Combined with 3D Building Model. In Proceedings of the 2017 2nd International Conference on Image, Vision and Computing (ICIVC), Chengdu, China, 2–4 June 2017; IEEE: Piscataway, NJ, USA, 2017; pp. 566–571. [Google Scholar]
- Singla, J.G.; Padia, K. A Novel Approach for Generation and Visualization of Virtual 3D City Model Using Open Source Libraries. J. Indian Soc. Remote Sens. 2021, 49, 1239–1244. [Google Scholar] [CrossRef]
- Wang, H.; Wu, Y.; Han, X.; Xu, M.; Chen, W. Automatic Generation of Large-Scale 3D Road Networks Based on GIS Data. Comput. Graph. 2021, 96, 71–81. [Google Scholar] [CrossRef]
- Liu, X.; Xie, N.; Tang, K.; Jia, J. Lightweighting for Web3D Visualization of Large-Scale BIM Scenes in Real-Time. Graph. Model. 2016, 88, 40–56. [Google Scholar] [CrossRef]
- Miao, R.; Song, J.; Zhu, Y. 3D Geographic Scenes Visualization Based on WebGL. In Proceedings of the 2017 6th International Conference on Agro-Geoinformatics, Fairfax, VA, USA, 7–10 August 2017; IEEE: Piscataway, NJ, USA, 2017; pp. 1–6. [Google Scholar]
- Yang, J.; Wu, F.; Lai, E.; Liu, M.; Liu, B.; Zhao, Y. Analysis of Visualization Technology of 3D Spatial Geographic Information System. Mob. Inf. Syst. 2021, 2021, 1–9. [Google Scholar] [CrossRef]
- Chen, J.; Li, J.; Li, M. Progressive Visualization of Complex 3D Models Over the Internet: Progressive Visualization of Complex 3D Models. Trans. GIS 2016, 20, 887–902. [Google Scholar] [CrossRef]
- Büschel, W.; Reipschläger, P.; Langner, R.; Dachselt, R. Investigating the Use of Spatial Interaction for 3D Data Visualization on Mobile Devices. In Proceedings of the 2017 ACM International Conference on Interactive Surfaces and Spaces, Brighton, UK, 17–20 October 2017; pp. 62–71. [Google Scholar]
- Laksono. Aditya Utilizing A Game Engine for Interactive 3D Topographic Data Visualization. ISPRS Int. J. Geo-Inf. 2019, 8, 361. [CrossRef]
- Chen, Q.; Chen, J.; Huang, W. Visualizing Large-Scale Building Information Modeling Models within Indoor and Outdoor Environments Using a Semantics-Based Method. ISPRS Int. J. Geo-Inf. 2021, 10, 756. [Google Scholar] [CrossRef]
- Tang, L.; Li, L.; Ying, S.; Lei, Y. A Full Level-of-Detail Specification for 3D Building Models Combining Indoor and Outdoor Scenes. ISPRS Int. J. Geo-Inf. 2018, 7, 419. [Google Scholar] [CrossRef]
- Weiler, M.; Westermann, R.; Hansen, C.; Zimmerman, K.; Ertl, T. Level-of-Detail Volume Rendering via 3D Textures. In Proceedings of the 2000 IEEE symposium on Volume visualization, Salt Lake City, UT, USA, 9–10 October 2000. [Google Scholar]
- Liu, P.; Xiao, J. An Evaluation Model of Level of Detail Consistency of Geographical Features on Digital Maps. ISPRS Int. J. Geo-Inf. 2020, 9, 410. [Google Scholar] [CrossRef]
- Leite, F.; Akcamete, A.; Akinci, B.; Atasoy, G.; Kiziltas, S. Analysis of Modeling Effort and Impact of Different Levels of Detail in Building Information Models. Autom. Constr. 2011, 20, 601–609. [Google Scholar] [CrossRef]
- Xu, Z.; Zhang, L.; Li, H.; Lin, Y.-H.; Yin, S. Combining IFC and 3D Tiles to Create 3D Visualization for Building Information Modeling. Autom. Constr. 2020, 109, 102995. [Google Scholar] [CrossRef]
- Hu, Z.; Guo, J.; Zhang, X. Three-Dimensional (3D) Parametric Modeling and Organization for Web-Based Visualization of City-Scale Pipe Network. ISPRS Int. J. Geo-Inf. 2020, 9, 623. [Google Scholar] [CrossRef]
- Wang, Y.; Lv, H.; Ma, Y. Geological Tetrahedral Model-Oriented Hybrid Spatial Indexing Structure Based on Octree and 3D R*-Tree. Arab. J. Geosci. 2020, 13, 728. [Google Scholar] [CrossRef]
- Jiang, W.; Li, Y.; Qi, Y. A Large-Scale Scene Display System Based on WebGL. In Proceedings of the 2018 International Conference on Virtual Reality and Visualization (ICVRV), Qingdao, China, 22–24 October 2018; IEEE: Piscataway, NJ, USA, 2018; pp. 15–19. [Google Scholar]
- ContextCapture 4D Digital Context for Digital Twins. Available online: https://www.Bentley.Com/Software/Contextcapture/ (accessed on 20 August 2023).
- Leica Cyclone 3DR—All-in-One Deliverable Solution. Available online: https://Leica-Geosystems.Com/Products/Laser-Scanners/Software/Leica-Cyclone/Leica-Cyclone-3dr (accessed on 20 August 2023).
- FARO® SCENE Software. Available online: https://www.Faro.Com/En/Products/Software/SCENE-Software (accessed on 20 August 2023).
- Závoti, J.; Kalmár, J. A Comparison of Different Solutions of the Bursa–Wolf Model and of the 3D, 7-Parameter Datum Transformation. Acta Geod. Geophys. 2016, 51, 245–256. [Google Scholar] [CrossRef]
- Fathi, H.; Brilakis, I. Automated Sparse 3D Point Cloud Generation of Infrastructure Using Its Distinctive Visual Features. Adv. Eng. Inform. 2011, 25, 760–770. [Google Scholar] [CrossRef]
Figure 1.
Real-scene 3D visualization management framework.

Figure 2.
Information requirements framework.

Figure 3.
The workflow of multi-source data integration in SuperMap.

Figure 4.
Multi-level dynamic loading mechanism.

Figure 5.
Index information for nodes.

Figure 6.
Dynamic loading and display process on the web.

Figure 7.
3D models in a subway station.

Figure 8.
Data structure of metadata file.

Figure 9.
The 3D scene presented by the platform on the Web interface.

Figure 10.
3D model with spatial analysis under GIS environment at site level.

Figure 11.
3D visualization and component query of subway station at construction level.

Figure 12.
Multi-scale visualization of a scene.


Table 1.
Model fineness degree division.
| Class | Code Name | The Smallest Model Unit Included |
|---|---|---|
| Level of Model Definition 1.0 | LOD1 | Project level model unit |
| Level of Model Definition 2.0 | LOD2 | Functional level model unit |
| Level of Model Definition 3.0 | LOD3 | Component level model unit |
| Level of Model Definition 4.0 | LOD4 | Part level model unit |
Disclaimer/Publisher’s Note: The statements, opinions and data contained in all publications are solely those of the individual author(s) and contributor(s) and not of MDPI and/or the editor(s). MDPI and/or the editor(s) disclaim responsibility for any injury to people or property resulting from any ideas, methods, instructions or products referred to in the content. |
© 2023 by the authors. Licensee MDPI, Basel, Switzerland. This article is an open access article distributed under the terms and conditions of the Creative Commons Attribution (CC BY) license (https://creativecommons.org/licenses/by/4.0/).
Share and Cite
MDPI and ACS Style
Wang, X.; Wang, J.; Zhang, Y. Research on 3D Visualization of Real Scene in Subway Engineering Based on 3D Model. Buildings 2023, 13, 2317. https://doi.org/10.3390/buildings13092317
AMA Style
Wang X, Wang J, Zhang Y. Research on 3D Visualization of Real Scene in Subway Engineering Based on 3D Model. Buildings. 2023; 13(9):2317. https://doi.org/10.3390/buildings13092317
Chicago/Turabian StyleWang, Xuejian, Jiayuan Wang, and Yuyu Zhang. 2023. "Research on 3D Visualization of Real Scene in Subway Engineering Based on 3D Model" Buildings 13, no. 9: 2317. https://doi.org/10.3390/buildings13092317
Note that from the first issue of 2016, this journal uses article numbers instead of page numbers. See further details here.